Submitted:
22 April 2024
Posted:
24 April 2024
Read the latest preprint version here
Abstract
As the automotive industry undergoes a transformative phase driven by technological advancements, the integration of driving simulators stands out as an important tool for research and development. These simulators offer a controlled environment for studying driver behavior; however, the alignment of data remains a complex aspect that warrants thorough investigation. This research investigates driver state classification using a dataset obtained from real-road and simulated conditions, recorded through JINS MEME ES_R smart glasses. The data set encompasses electrooculography signals, with a focus on standardizing and processing the data for subsequent analysis. For this purpose, we used a recurrent neural network model, which yielded 95.21% accuracy on testing dataset. The findings of this study indicate the plausible use of proposed methodology in practical scenarios, providing possibility for developments in intelligent transportation systems and driver monitoring technology.
Keywords:
electrooculography
; driving simulation
; real-world driving
; data distinctions
; biomedical signal processing
1. Introduction
Advancements in technology, particularly in data analysis, machine learning, and artificial intelligence are driving a significant shift in how behaviors and activities of individuals are diagnosed, leading to more accurate health assessments and anomaly detection [1,2,3]. The field of biomedical engineering is witnessing growing interest, exemplified by studies such as that of Javaid et al., which underscores the integration of Fourth Industrial Revolution techniques into Medical 4.0 for analyzing data sourced from sensors, health monitors, and similar devices [4]. These technologies aim to swiftly and objectively assess health and identify abnormal behaviors.
The Academic Pack, facilitated by JINS MEME ES_R, enables the development of algorithms supporting various applications such as road safety [5], human physical activity [6], cognitive activities [7], and emotional states [8].
As advances in technology continue to revolutionize the automotive industry, the integration of driving simulators has become an invaluable tool for research and development. These simulators provide a controlled environment for studying driver behavior, testing vehicle systems, and assessing the impact of various interventions [9,10]. However, the question of how well the data acquired in these simulated settings align with real-world driving experiences remains a critical aspect that requires thorough investigation.
This article focuses on the distinction between data recorded during actual on-road driving and simulated driving experiences, utilizing cutting-edge technology in the form of JINS MEME_R smart glasses. Equipped with an electrooculographic (EOG) sensor, as well as a 3-axis accelerometer and gyroscope, these smart glasses offer a unique opportunity to explore the intricacies of driver physiology and motion patterns [11]. The electrooculographic sensor tracks eye movement, providing insights into gaze behavior and cognitive load, while the accelerometer and gyroscope capture physical movements and orientations during driving. By scrutinizing the data obtained from JINS MEME ES_R in both real and simulated driving scenarios, we aim to uncover the nuances that differentiate these two settings. Our work focuses on the issues posed by the difference between real-world complexity and the controlled environment of simulators. Understanding these distinctions is essential to improve the reliability and applicability of simulator-based research and to ensure that the insights gained in controlled settings can be effectively translated to real-world driving conditions. Our aim is to further our understanding of the complex interactions between real and simulated driving data by providing useful information to the current discussion about the use of advanced technology in driving research. The aim of identifying differentiating components is to suggest a solution that aligns the signal from the simulator more closely with the signal obtained during actual driving.
1.1. Related Work
The proliferation of fake (generated, simulated) data has emerged as a significant impediment to technological progress, particularly in the domains of big data analysis, machine learning, and artificial intelligence. This phenomenon has precipitated a profound change in the paradigm of diagnosing individual behaviors and actions, leading to more precise health evaluations and anomaly detection [12,13,14,15,16].
In contrast to traditional information systems, the analysis of vehicle driving safety data anomalies must contend with the diversity of data anomalies as well as the randomness and subjectivity of driver behavior. How to integrate the characteristics of the Internet of Vehicles (IoV) data with driving style analysis to ensure effective real-time anomaly detection has become an important issue in IoV applications. In the work by Ding et al., the validity of data pertaining to safe driving in the IoV serves as the foundation for improving vehicle safety [17]. Their research aims to analyze critical safety data, taking into account the significant computational costs incurred by real-time anomaly detection of all data in the data package. The data is processed through a cellular automata traffic model, which has been constructed to achieve optimal anomaly detection effectiveness with limited computational resources. Based on this model, an Anomaly Detection Algorithm (ADD) has been developed, enabling real-time and online anomaly detection related to safe driving. Firstly, the article designs a driving coefficient and proposes a driving style quantization model to represent individual driving style. Then, based on the driving style and vehicle driving state information, the authors developed an algorithm for detecting data anomalies using a Gaussian Mixture Model (GMM). Finally, in conjunction with the scenarios of multi-vehicle cooperation in the IoV, this article utilizes real datasets and synthetic datasets to analyze the effectiveness of the proposed ADD algorithm. To enhance the accuracy of the real dataset, it is augmented with synthetic data.
Advancements in information processing and signal technologies have a significant impact on autonomous driving (AD), improving driving safety while minimizing the effort of human drivers through advanced artificial intelligence (AI) techniques [18]. Recently, deep learning (DL) approaches have addressed several real-world complex problems. However, their strengths in AD control processes have not been thoroughly investigated or emphasized. The review by Muhammad et al. highlights the strength of DL architectures in terms of reliability and real-time performance, along with an overview of the latest secure AD strategies, their key achievements, and limitations. Additionally, the authors discuss the main applications of DL in the AD domain, including measurement, analysis, and execution, focusing on road, lane, vehicle, pedestrian, drowsiness detection, collision avoidance, and road sign detection using DL-based vision methods. Furthermore, the performance of several established methods using various evaluation metrics is discussed along with criticism of their advantages and drawbacks. Finally, this review emphasizes current issues related to secure DL-based AD with a perspective on recommendations for future research, summarizing the reference material for newcomers and researchers wishing to join this dynamic area of Intelligent Transportation Systems. In conclusion, Muhammad et al. noted that unless these directions are actively pursued by the research community, DL will remain relegated to academic research and controlled trial environments, and vehicular safety will not harness the enormous potential of this branch of Artificial Intelligence (AI).
Moreover, the evolving interest in biomedical engineering is evidenced by research highlighting the integration of Fourth Industrial Revolution methodologies with Medical 4.0. This convergence of cutting-edge technologies has paved the way for transformative advancements in healthcare delivery and patient care [4,19,20]. Weak road transport asset management practices pose a challenge to the sustainable development of transportation systems in developing countries [21]. Previous research has primarily focused on the efficiency of road construction processes. However, few studies have assessed the impact of the Fourth Industrial Revolution (4.0IR) on road transport assets in developing countries like Nigeria [22]. The study by Gambo et al. aimed to evaluate the influence of 4.0IR on improving road transport asset management practices. Survey instruments were administered to project managers and stakeholders in the Nigerian road construction sector using a proportional random sampling technique. Structural equation modeling with partial least squares method using Warp 7.0 software for partial least squares structural equation modeling (PLS-SEM) was employed for data analysis. The software computes p-values using WarpPLS based non-parametric algorithms, resampling, or stable algorithms, thus not requiring variables to follow a normal distribution. The study found that 4.0IR drivers currently have a moderate impact on road transport asset management practice in Nigeria. The results suggest that road asset management in Nigeria will experience moderate improvement through 4.0IR technologies, translating into transportation, safety, and overall performance and efficiency of road networks in Nigeria. The study identified 4.0IR drivers, including robotics, mobility, virtual and augmented reality, Internet of Things, cloud computing, machine learning, artificial intelligence, blockchain, three-dimensional (3D) printing drones, which are drones equipped with an attached 3D printer (the drone suspends a 3D printing nozzle that dispenses plastic, concrete mix, or other material from a tube attached to the top of the drone’s printing path, which is precisely laid out by software, promising printing accuracy of 0.1 mm), and digital engineering. This study drew from government reports and prior research in the field of road transport asset management, examining key causes of poor practices and assessing the impact of 4.0IR on practice.
Due to the growing need of using sensors, health monitors, and similar devices in carious research, the market of manufacturers specializing in the production of these sensors and monitors evolves. These manufacturers are increasingly innovating their designs to enhance the accuracy and reliability of data collection, thereby facilitating more effective health monitoring and diagnosis [23,24,25,26,27]. For example in their article, Liu et al. investigated the potential of wearable devices to identify driving-related activities and unsafe driving, without relying on information or sensors within the vehicle. Specifically, the study examines how wrist-mounted inertial sensors, such as those found in smartwatches and fitness monitoring devices, can monitor steering wheel usage and input data. The identification of steering wheel usage assists mobile devices in detecting driving instances and reducing attention distractions. Tracking steering wheel turning angles may enhance the vehicle motion tracking by mobile devices and aid in identifying unsafe driving behaviors. This approach is based on motion characteristics that enable the differentiation of steering actions from other hand movements. Upon detecting steering wheel usage, it also utilizes wrist rotation measurements to infer steering wheel turning angles. Their preliminary experiments indicate that this technique achieves a 98.9% accuracy rate in detecting driving instances and can estimate turning angles with an average error within two degrees [28].
By leveraging advanced sensor technology and sophisticated data analysis techniques, healthcare professionals can gain valuable insights into patient health status and detect anomalies in a timely manner [29,30,31,32]. The primary objective of these technologies is to facilitate efficient and objective health assessments while simultaneously identifying aberrant behaviors. According to the research conducted by Tsai et al., approaches utilizing physiological features for detecting abnormal driving behaviors (ADB), including speeding, abrupt steering, sudden braking, and aggressive acceleration, are currently being developed in Taiwan. The study proposes the use of machine learning methods involving parameters of heart rate variability (HRV) to predict the occurrence of ADB. Fo four consecutive days, naturalistic driving data from 12 highway bus drivers in Taiwan were collected from their daily routes. Their driving behaviors and physiological data during the driving task were determined using a mobile navigation application and a heart rate monitor watch. Participant-reported sleep data, driving-related experiences, weather data from open sources, and traffic volume levels were obtained. The authors applied five machine learning models to predict ADB—–logistic regression, random forest, naive Bayes, support vector machine, and gated recurrent unit (GRU). The results of the study showed, that most drivers with ADB had low sleep efficiency (≤80%), with significantly higher scores in the subcategories of driver behavior questionnaire regarding breaks and errors, and on the Karolinska Sleepiness Scale compared to drivers without ADB. Furthermore, HRV parameters differed significantly between baseline measurements and measurements before ADB occurrences. Of the algorithms used, GRU exhibited the highest accuracy (81.16-84.22%). The authors concluded, that sleep deficit may be associated with increased fatigue levels and the occurrence of ADB predicted based on HRV-based models among bus drivers [33].
Driving simulators have emerged as indispensable research and development tools due to their ability to provide a safe environment for human participants. These simulators offer a controlled setting for studying driver behavior, evaluating vehicle systems, and assessing the effectiveness of various interventions [34,35,36,37,38,39,40]. In the research conducted by Amini et al., an experimental driving simulator project was presented for testing the primary risk factors defined within the i-DREAMS project framework [41]. The study objective was to provide a detailed description of risk scenarios for car drivers, which have been designed for three risk factors: tailgating, illegal overtaking, collisions with vulnerable road users (VRU), and two additional conditions: driver distraction and adverse weather conditions. The authors designed three distinct driving scenarios: 1) a monitoring scenario without intervention, 2) a scenario with intervention independent of the driver’s state, 3) a scenario with intervention dependent on the driver’s state. The proposed real-time interventions aimed to explore dynamic thresholds (thresholds with variable time), which can be adjusted based on scenario conditions (driver distraction, weather). Such studies can only be conducted on a simulator to avoid endangering the human participant involved in the experiment.
Understanding the nuances and discrepancies between simulated and real-world driving data is essential for improving the reliability and applicability of simulator-based research [42,43,44,45,46,47]. In their study, Robbins et al. investigated similarities between drivers’ visual attention at intersections with varying demands in a simulator and on the road [48]. Unlike simpler driving tasks, crossing intersections involves complex interactions with other vehicles, regulated by sequences of head and eye movements that may not be accurately captured in a simulated environment. In the study, the authors compared drivers’ visual attention in a high-fidelity driving simulator and on the road in situations with low and moderate driving demands. The study revealed, that frequency and magnitude of drivers’ head movements did not significantly differ between maneuvers performed in the simulator and those performed while driving on real roads. The differences occurred in more detailed measurements of eye movements due to lower visual engagement in the simulated environment compared to the real world. These results have important implications for driving research, suggesting that driving simulators can be valuable tools for studying drivers’ visual attention at intersections, particularly when the driving task has at least moderate demand. In conclusion, the broad search strategies employed by drivers in the simulator are representative of real-world driving. [49,50,51,52,53].
2. Materials and Methods
2.1. Dataset Description
The dataset used in this study comprises two distinct sets of data: recordings obtained in real-road conditions and in simulated environment. Data were captured using JINS MEME ES_R smart glasses (see Figure 1), which incorporate a 3-axis gyroscope, accelerometer, and a three-point electrooculography (EOG) sensor [11]. The selection of these glasses was based on the assumption that they do not distract the driver and are suitable for use in a car environment [9,54,55,56,57].
Real-road data were collected from 30 subjects, including both experienced and inexperienced drivers. Experienced drivers drove their own cars, while novice drivers operated a specially designated and labeled vehicle under the guidance of an instructor. The person in the backseat was in charge of gathering data in both situations. All drivers traveled an identical 28.7 km route, including elements evaluated in the practical driving exam in Poland. A comprehensive description of the study group and the experimental protocol is provided in the work of Doniec et al. [54,55].
Simulated data were recorded from 30 healthy volunteers aged between 21 and 51 using a driving simulator. Fifteen subjects in this group had held a driver’s license for several years, while the rest had no or limited driving experience. The components of the simulator stand included a Windows 10 computer, a steel structural framework with an adjustable chair, a set of Logitech controls (gearbox, pedals, and steering wheel), three LED 27-inch monitors designed for extended use, and dedicated software. The experimental setup for the simulation is extensively described in the work of Piaseczna et al. and Doniec et al. [9,57]. The tasks performed by the individual driving the simulator mirrored those conducted in real-road conditions. Both setups are illustrated in Figure 2.
The dataset consists of 390 recordings from driving in real road conditions and 1,976 recordings from driving on the simulator. The research adhered to the principles outlined in the Declaration of Helsinki and all participants gave their informed consent before participating in the study.
2.2. Data Processing
The smart glasses used provide two options (modes) for data recording: standard and full. In the full mode, all 10 signals were captured at a sampling frequency of 100 Hz. The standard mode excludes signals from the gyroscope, recording the EOG signals at a frequency of 200 Hz. Given the lack of significant information observed in the gyroscope and accelerometer signals during the driving of the car simulator, and considering the feasibility of classifying the data solely on the basis of EOG, this study focused exclusively on the EOG signal [9,54].
To standardize the data, signals recorded in full mode were upsampled to 200 Hz. Demonstrating the beneficial use of raw data, the only processing step involved filtering the data with a low-pass 10th-order median filter. Various activities differ in performance time, but generally take longer while driving a real car. Therefore, we decided to perform the analysis based on the signal windows. The filtered signals were segmented into 200-sample (1s) windows with a 100-sample (0.5s) stride. Subsequently labels were added to the signals: 0 for simulated driving and 1 for real-road driving, facilitating the distinction (ground truth) between the two categories in the subsequent analysis. The process resulted in a set of 92,911 4-channel signals, including 30,957 data samples collected on the driving simulator (class: 0) and 61,954 data samples collected while driving on the road (class: 1).
2.3. Data Similarities
In order to check similarities between the signals in two categories we decided to perform a cross-correlation analysis. In general, cross-correlation measures the similarity between two signals or time series data at different time lags. In other words, cross-correlation provides an intuitive way to measure similarity between signals by comparing them at different time shifts. The cross-correlation function is defined as follows:
where:
- represents the cross-correlation function,
- and are the input signals,
Taking into account that the signals are 4-channeled, the correlation between two signals was computed on corresponding channels. Comparing each signal from one category with each signal from the other category and computing cross-correlation was performed on the signal widows and resulted in four 30,957 x 61,954 matrices of correlation coefficients. To summarize the output and assess the overall similarity between the two categories, we decided to take into consideration average, maximum, and minimum cross-correlation (see Table 1), as well as the coefficients distribution in the form of a histogram (see Figure 3 and Figure 4).
Extracting the meaningful features for classification can be challenging. The analysis showed no direct correlation between two categories of signals in the time domain, therefore we can assume that the signal waveforms should be distinguishable. For this problem we decided to incorporate neural networks, that can capture complex, nonlinear relationships in the data.
2.4. Classification
The classification task was implemented using a recurrent neural network architecture using MATLAB environment. The network comprises the following layers:
- Sequence Input Layer with 4 features (channels), normalized using z-score normalization,
- Bidirectional Long Short-Term Memory Layer with 100 units, configured to output the last time step’s hidden state,
- Fully Connected Layer with 2 neurons for classification,
- Softmax Layer for probability distribution calculation,
- Classification Layer for labeling.
Bidirectional LSTM (Long Short-Term Memory) models are commonly used for data classification tasks due to their ability to capture both past and future context. The bidirectional nature of LSTM models makes them well-suited for these problems, especially when dealing with sequential data where capturing context and long-term dependencies is essential for accurate classification.
Due to the class imbalance in our dataset, we decided to initialize the class weights to give higher importance to the underrepresented class (0) during the initial training phase, which can help the model learn better representations for those classes. For this, we first calculated the class weights based on the formula:
where:
- N is the total number of samples in the dataset,
- is the number of samples in class i,
- C is the total number of classes.
Next, we normalized the class weights so that they sum up to the total number of classes. This step ensures that the weights collectively represent the importance of each class relative to the others. The normalized class weight for each class i was calculated as follows:
Finally, we initialized the weights in the classification layer of the neural network using the calculated normalized class weights [60].
The presented configuration was designed to train a robust recurrent neural network for effective classification of the provided dataset. The training parameters were chosen based on common practices and initial testing and were set as follows:
- Optimization algorithm: Adam,
- Mini-batch size: 1000,
-
Learning rate:
- −
- Initial learning rate: 0.001,
- −
- Drop period: 5 epochs,
- −
- Drop factor: 0.5,
- −
- Schedule: Piecewise,
- Data shuffling: Every epoch,
- Sequence length: 200,
- Number of epochs: 30.
To prevent overfitting to specific train-test data partition, we employed k-fold cross-validation technique. For that purpose, we split the data into ten subsets (folds) and performed ten model training iterations. In each iteration, one of the subsets was held out as test data, and the remaining data were used to train the model. Data distribution for each training iteration in the training and testing dataset is presented in Figure 5.
After training, the model was evaluated on the test set. The training process is presented in Figure 6 as averaged values of accuracy and loss among iterations. Learning curves for each training iteration can be found in the Appendix A.
All operations were executed on a PC with an Intel(R) Core(TM) i5-9300H CPU operating at 2GHz, 16GB of RAM, and a single 8GB NVIDIA GeForce GTX 1650 GPU. Pre-processing and classification tasks were conducted using MATLAB 2023b software. Each training iteration lasted 14 minutes 52 seconds on average.
3. Results
After completion of the model training, we evaluated its performance on the designated test dataset in each iteration. The evaluation results are visually depicted in the form of a confusion matrix, illustrated in Figure 7. A confusion matrix is a tabular representation that showcases the model’s classification performance by comparing predicted and actual labels. It provides information on the distribution of true positive, true negative, false positive, and false negative predictions. The matrix presents averaged values from ten training iterations ± standard deviation.
Subsequently, we derived a set of key metrics from the confusion matrix to offer a comprehensive evaluation of the model’s performance (see Table 2). The table contains values of common performance metrics for each of the training iterations as well as for the averaged results. These metrics provide a more complex picture of how well the model distinguishes between simulated and real-road driving conditions.
Accuracy, as the proportion of correctly classified instances among the total predictions, provides an overall measure of the model’s correctness. The model correctly classified instances with an accuracy of over 98.6%, demonstrating its overall effectiveness in distinguishing between real-road and simulated driving conditions. Recall is a ratio of correctly identified positive instances to the total actual positive instances, indicating the model’s ability to capture relevant cases. The high value of recall implies that the model successfully identified a substantial majority of actual positive instances, showcasing its sensitivity to relevant cases in both real-road and simulated scenarios. High specificity suggests that the model effectively recognized and classified negative instances, underscoring its ability to distinguish non-relevant cases accurately. The precision metric exceeding 90% indicates that the model’s positive predictions were highly accurate, minimizing false positives in the classification of both driving conditions, despite the imbalance in the training data. F1-Score, being the harmonic mean of precision and recall, reflects a balanced trade-off between false positives and false negatives. An over 92% F1-Score underscores the model’s robustness in achieving precision and recall simultaneously.
In summary, achieving such high metrics collectively illustrates the model’s exceptional capability to accurately differentiate between real-road and simulated driving conditions based on the electrooculography signals. These results imply a high level of confidence in the model’s reliability for practical applications in driver state monitoring and classification tasks.
4. Discussion
In this study, we investigated methodologies for assessing and detecting driver behavior, focusing on distinguishing datasets from real and simulated driving style experiments. To the best of our knowledge, there are no studies performed on similar datasets, however this problem of incorporating data acquired in simulated environment itself is covered in other research papers. The study by Yang et al. introduces DU-drive, a framework utilizing virtual data from driving simulators to enhance vision-based autonomous driving models. DU-drive demonstrates superior prediction performance and interpretive capability by unifying diverse source distributions and optimizing the information bottleneck tradeoff [61]. Such algorithms are useful for creating the most optimal simulation conditions. Data obtained using more realistic simulators will more closely resemble data collected under real conditions, enabling subsequent direct translation of results.
Karrouchi et al. highlighted the importance of assessing multiple driving-related parameters, such as engine speed, vehicle speed, and steering wheel angle, to determine driver behavior, with particular emphasis on the distinction between normal and aggressive driving patterns. The integration of facial analysis for fatigue detection achieved an impressive average accuracy of 99.1%, demonstrating the effectiveness of the proposed method in recognizing the driver’s condition [62]. Aarthi et al. proposed a real-time eye detection and tracking system based on a discrete computer vision model to solve the problem of driver drowsiness. By focusing on eye tracking as an essential technology in driver assistance systems, the study contributes to ongoing efforts to improve safety in the automotive industry. The study acknowledged the limitations of existing eye monitoring systems, in particular their sensitivity to changes in light sources, and presented a method that performs effectively in a variety of lighting conditions [63]. Additionally, Kaplan et al. presented a comprehensive study of driver behavior analysis techniques, highlighting the importance of driver inattention monitoring systems. The study emphasize the importance of inattention monitoring systems and proposing future solutions, including car-to-car communication for safer driving [64]. Similar to our work, these studies focus on driver behavior analysis and safety in the field of automotive industry. through the integration of smart technology and evidence-based research methodologies.
A study by Wallace et al. introduced an initial assessment using machine learning models to automatically evaluate driving simulation results for drivers with cognitive impairment. The results showed an 85% accuracy rate in classifying simulator drives as safe or unsafe compared to expert opinions. This suggests the potential of automated driver simulation assessments to reduce physician burden and improve the efficiency of driver safety assessments [65]. Compared to this study, our model achieves better classification results.
Taken together, the various studies discussed information about driving behavior, including factors such as cognitive status, gender, distraction detection, and sleep assessment. These insights are key to developing advanced driver assistance systems and policies to improve road safety. Future research efforts should continue to focus on innovative methodologies and interdisciplinary approaches to comprehensively address the complexity of driving behavior in diverse populations. However, the question of the research environment here remains debatable. Work should be undertaken to create suitable and safe simulation environments, as well as algorithms that enable data transformation to improve the reliability of data collected using simulators.
5. Conclusions
In this study, we investigated the classification of driver states based on electrooculography signals obtained from both real-road and simulated driving conditions, utilizing a recurrent neural network model. The robustness of the model was demonstrated through a training process and subsequent evaluation on a test dataset. The results indicate the model’s proficiency in distinguishing between real-road and simulated driving scenarios. The high accuracy, recall, specificity, precision, and F1-Score, all surpassing 90%, underscore the model’s satisfactory performance and reliability. These results imply that the designed RNN architecture can efficiently classify the data with a high degree of precision. The findings of this research extend to the realm of intelligent transportation systems, where accurate monitoring of driver states is crucial to improving safety and efficiency. The utilization of smart glasses and EOG signals, coupled with advanced machine learning techniques, presents a promising avenue for real-time driver state classification.
The study bridges the gap between biomedical engineering, data analysis, and automotive research. By incorporating principles from these diverse fields, this research offers a holistic approach to understanding and addressing challenges in driver behavior analysis and safety assessment. By elucidating the nuances between simulated and real-road driving experiences, this work can inform the development of more effective training programs, vehicle systems, and safety regulations.
However, it is important to recognize the limits of the study, including dataset size, potential biases, and the specific characteristics of the driving scenarios considered. The research also indicates that, after adequate training, the suggested neural network can differentiate between two environments. Since the simulated environment does not precisely replicate the real one, it becomes imperative to either further transform the data or adjust the relevant conditions in order to perform reliable tests using driving simulators.
Future research endeavors may focus on more extensive datasets, diverse driving environments, and additional features to further enhance the model’s robustness and applicability. We also plan to create a model that will enable the transformation (translation) of data acquired using the simulator into real data. This procedure will make it possible to acquire data in a safe and regulated environment without generating danger on the road and to better use these data in driving research.
In conclusion, this study’s results provide important new information about whether driving environment classification using RNN models and EOG signals is feasible. The achieved high performance metrics suggest the potential practicality of the proposed approach in real-world applications, opening the door for developments in intelligent transportation systems and driver monitoring technologies.
Author Contributions
Conceptualization, N.P. and R.D.; methodology, N.P.; software, N.P.; validation, N.P., R.D. and S.S.; formal analysis, N.P.; investigation, N.P.; resources, N.P., R.D. and S.S.; data curation, N.P. and R.D.; writing—original draft preparation, N.P. and R.D.; writing—review and editing, N.P., R.D., S.S., K.B., M.J. and M.G.; visualization, N.P.; supervision, R.D.; project administration, N.P. and R.D.; funding acquisition, R.D and M.G. All authors have read and agreed to the published version of the manuscript.
Funding
This research was funded by a postdoctoral grant number 07/040/RGH22/1015 under the "Excellence Initiative – Research University" pro-quality program - rectoral postdoctoral grants.
Institutional Review Board Statement
The study was conducted in accordance with the Declaration of Helsinki, and approved by the Ethics Committee of the Medical University of Silesia (protocol code KNW/0022/KB1/18, 16 October 2018).
Informed Consent Statement
Informed consent was obtained from all subjects involved in the study.
Data Availability Statement
The original data presented in the study are openly available in IEEE DataPort at: https://ieee-dataport.org/documents/real-simulated-driving
Conflicts of Interest
The authors declare no conflicts of interest.
Abbreviations
The following abbreviations are used in this manuscript:
| EOG | electrooculography, electooculographic |
| IoV | Internet of Vehicles |
| ADD | Anomaly Detection Algorithm |
| GMM | Gaussian Mixture Model |
| AD | autonomous driving |
| DL | deep learning |
| AI | Artificial Intelligence |
| 4.0IR | Fourth Industrial Revolution |
| ABD | abnormal driving behaviors |
| HRV | heart rate variability |
| GRU | gated recurrent unit |
| VRU | vulnerable road users |
| RNN | recurrent neural network |
| LSTM | Long Short-Term Memory |
Appendix A. Learning Process
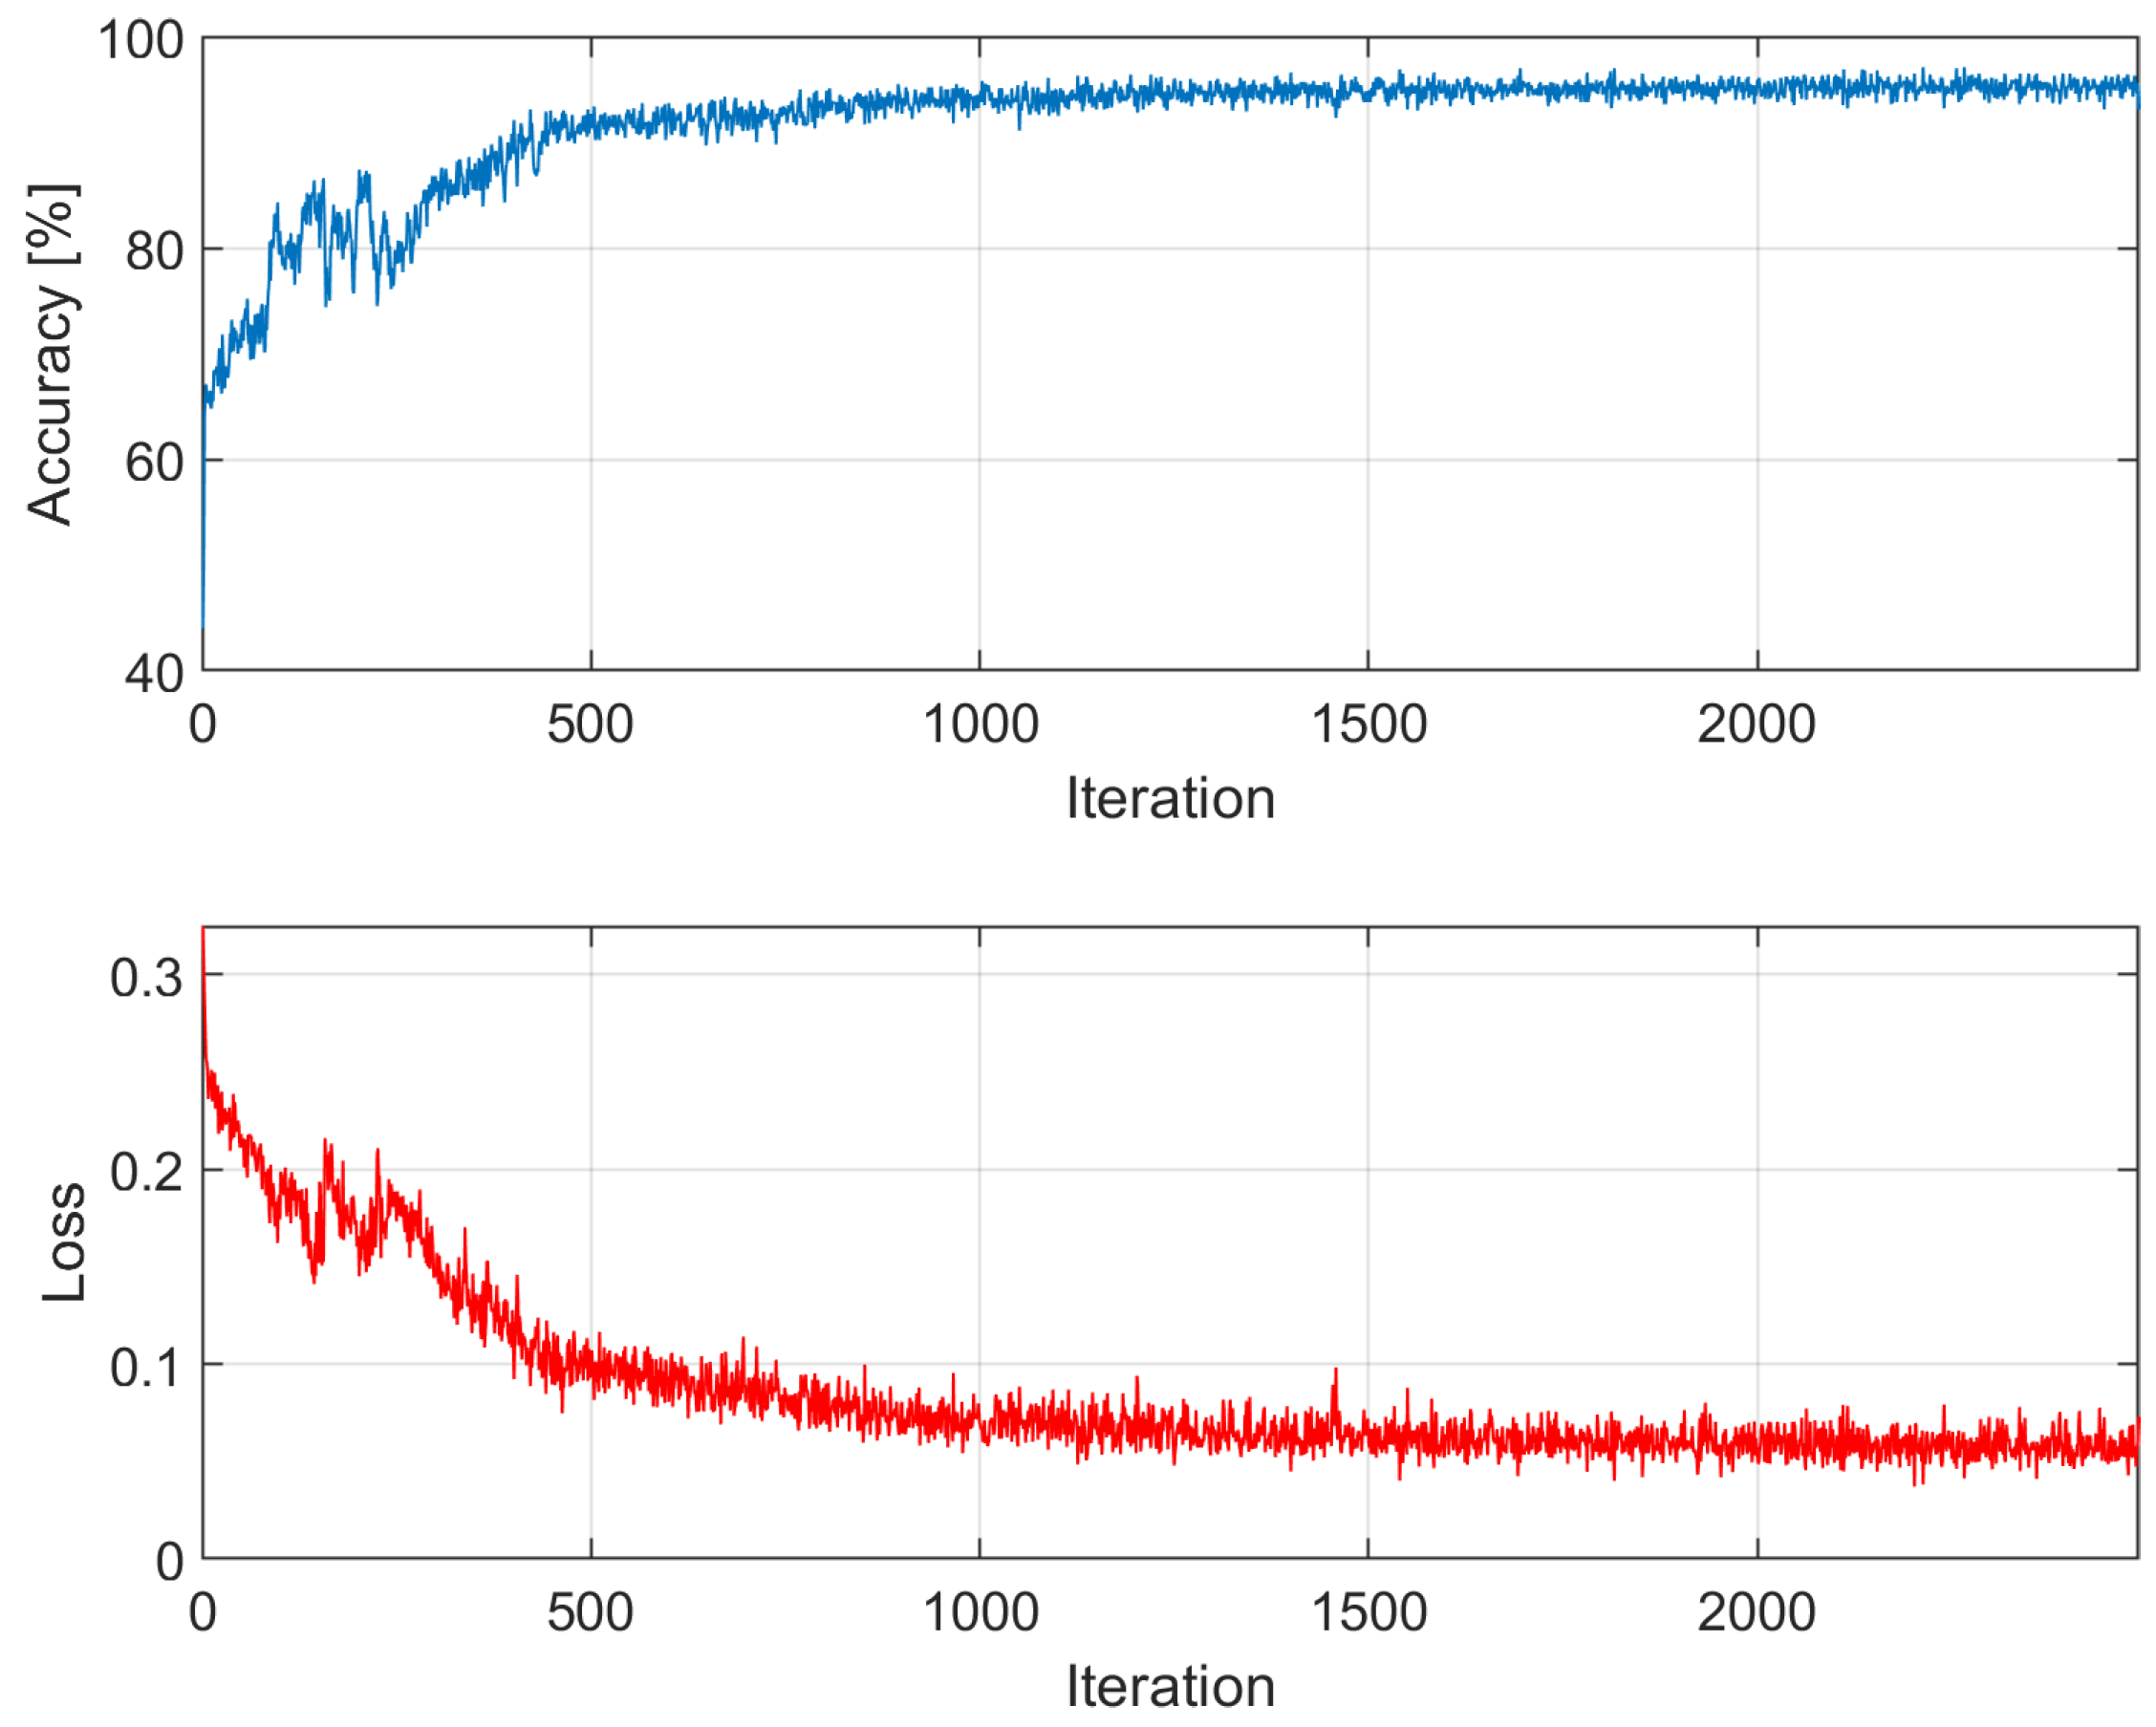
This section provides visualizations of the training process in each iteration of k-fold cross-validation technique. The learning curves (accuracy and loss) for each training iteration are depicted in Figure A1, Figure A2, Figure A3, Figure A4, Figure A5, Figure A6, Figure A7, Figure A8, Figure A9 and Figure A10. The graphs present the detailed description on the training process.
Figure A1.
Accuracy and loss among epochs – k = 1; training time: 13 min 13 sec; accuracy on validation dataset: 94.58%.
Figure A1.
Accuracy and loss among epochs – k = 1; training time: 13 min 13 sec; accuracy on validation dataset: 94.58%.
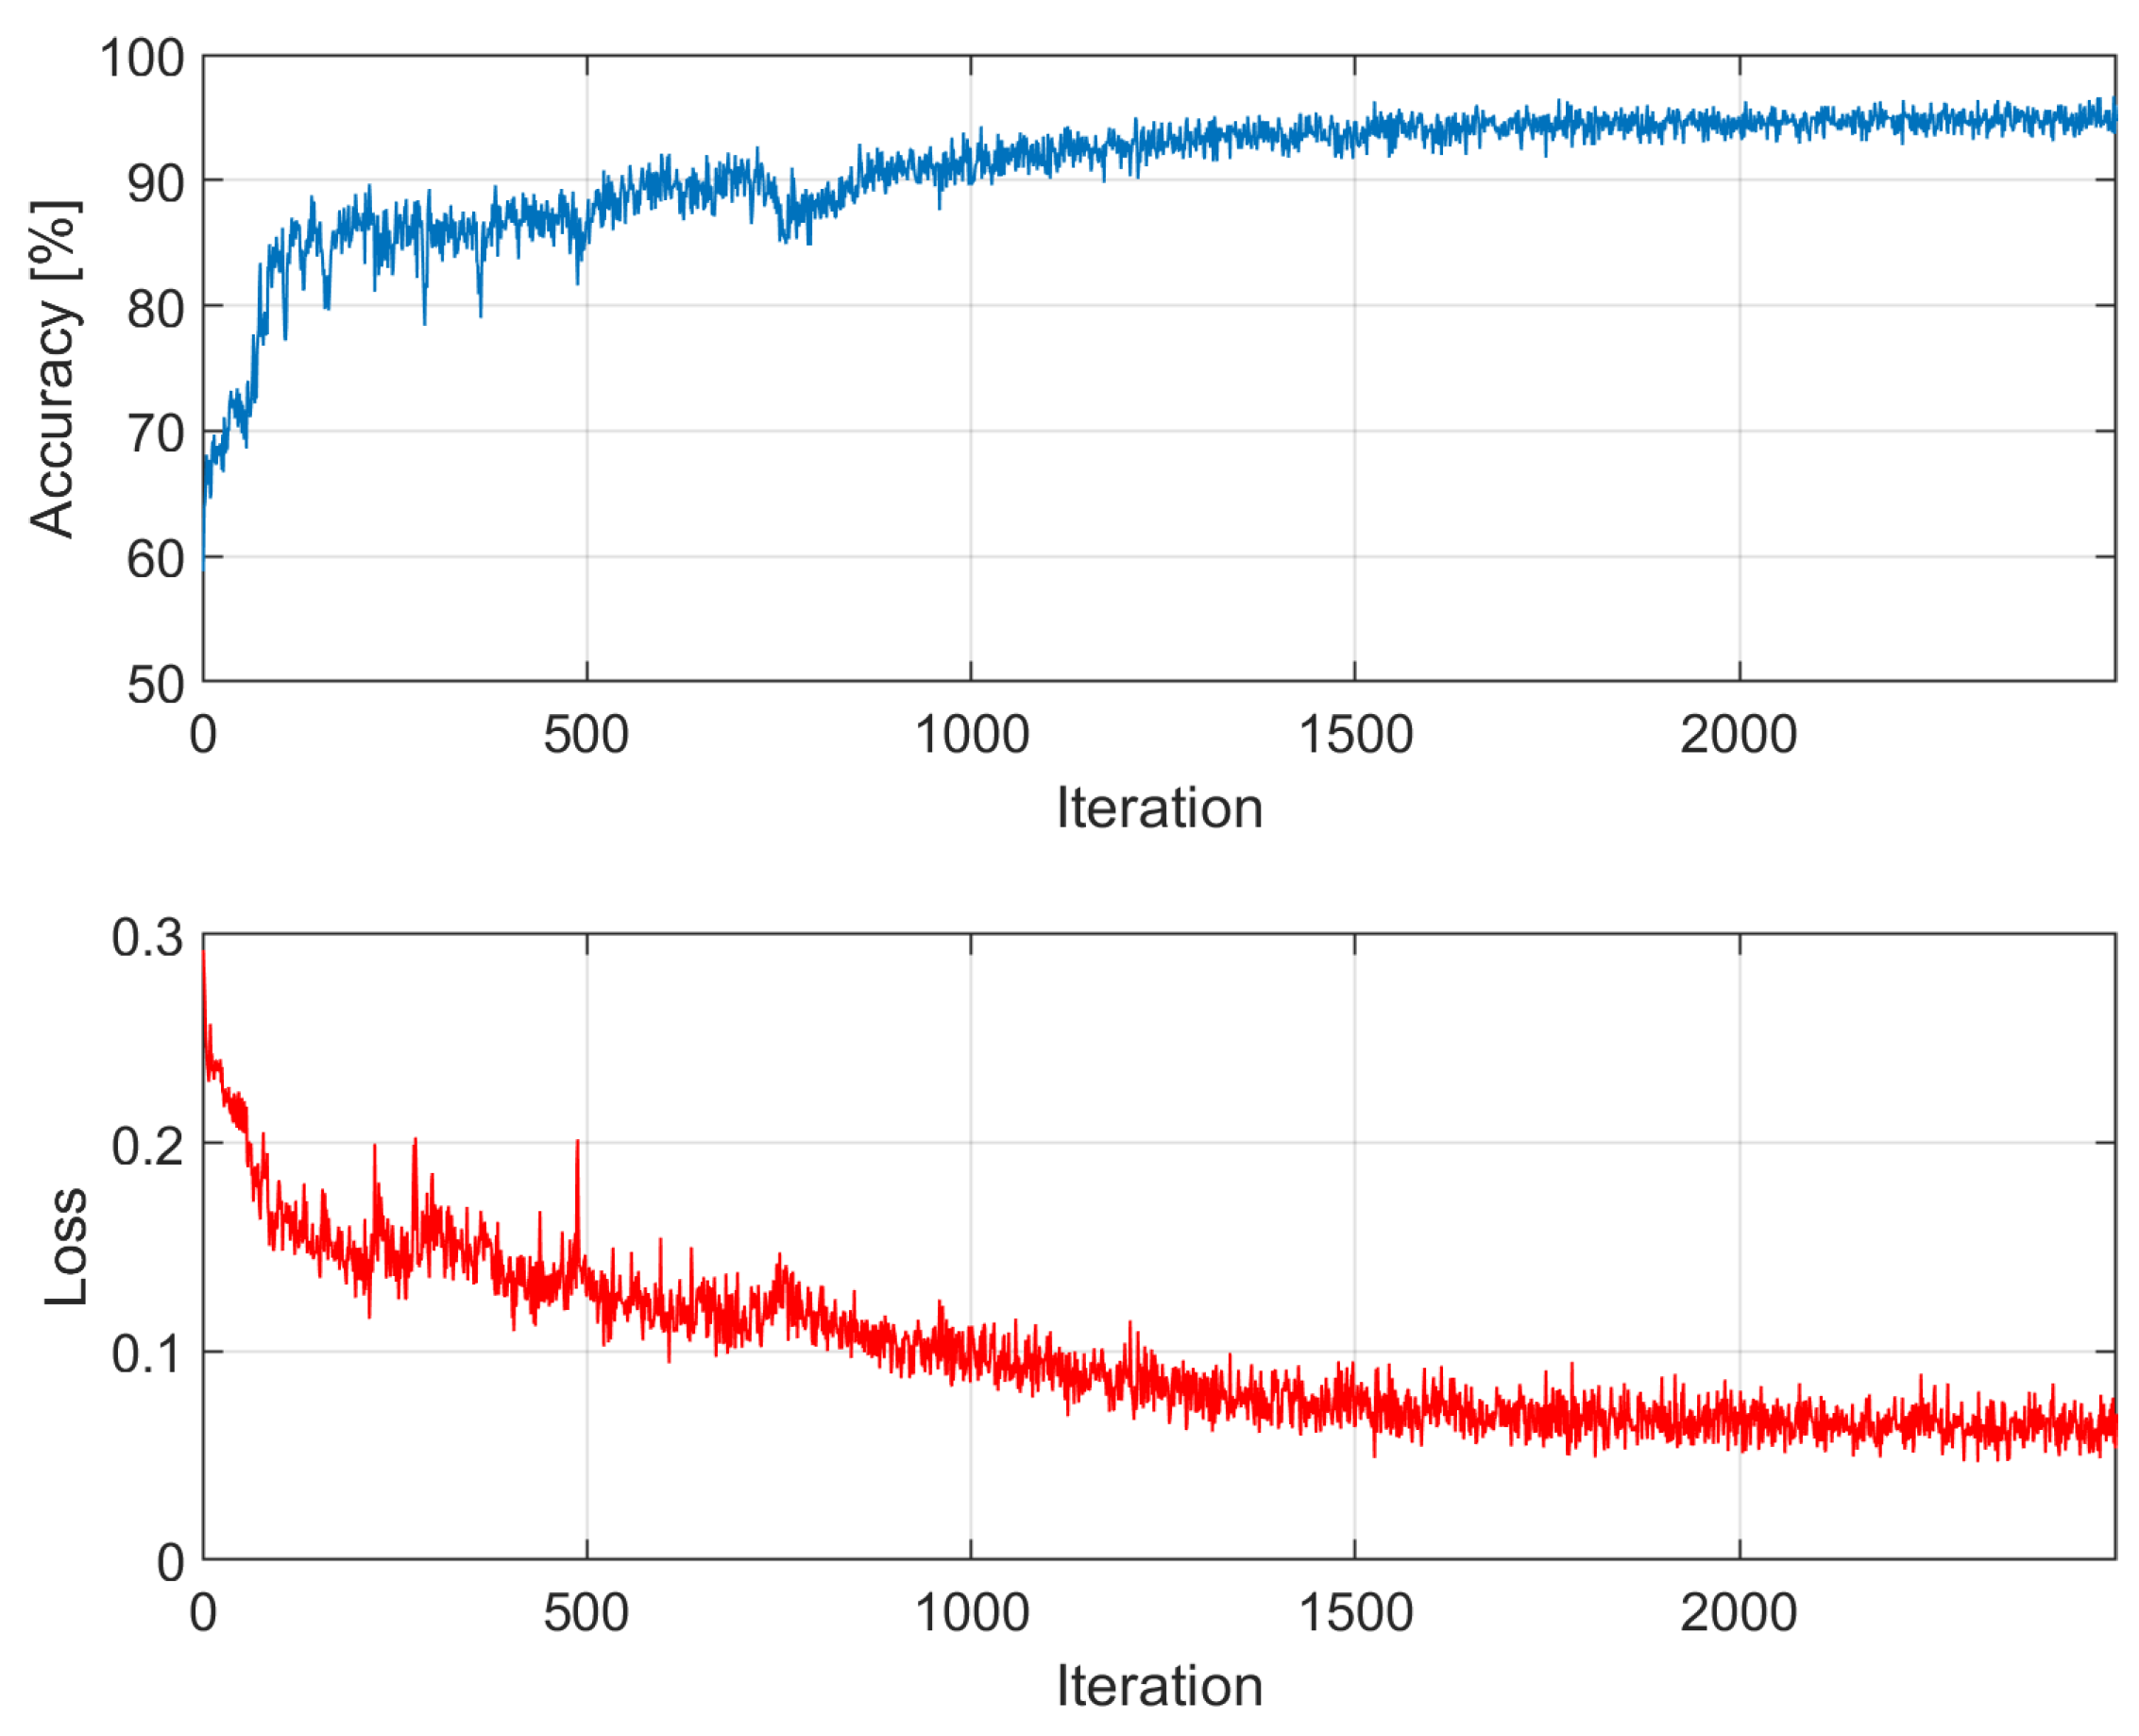
Figure A2.
Accuracy and loss among epochs – k = 2; training time: 13 min 2 sec; accuracy on validation dataset: 95.25%
Figure A2.
Accuracy and loss among epochs – k = 2; training time: 13 min 2 sec; accuracy on validation dataset: 95.25%
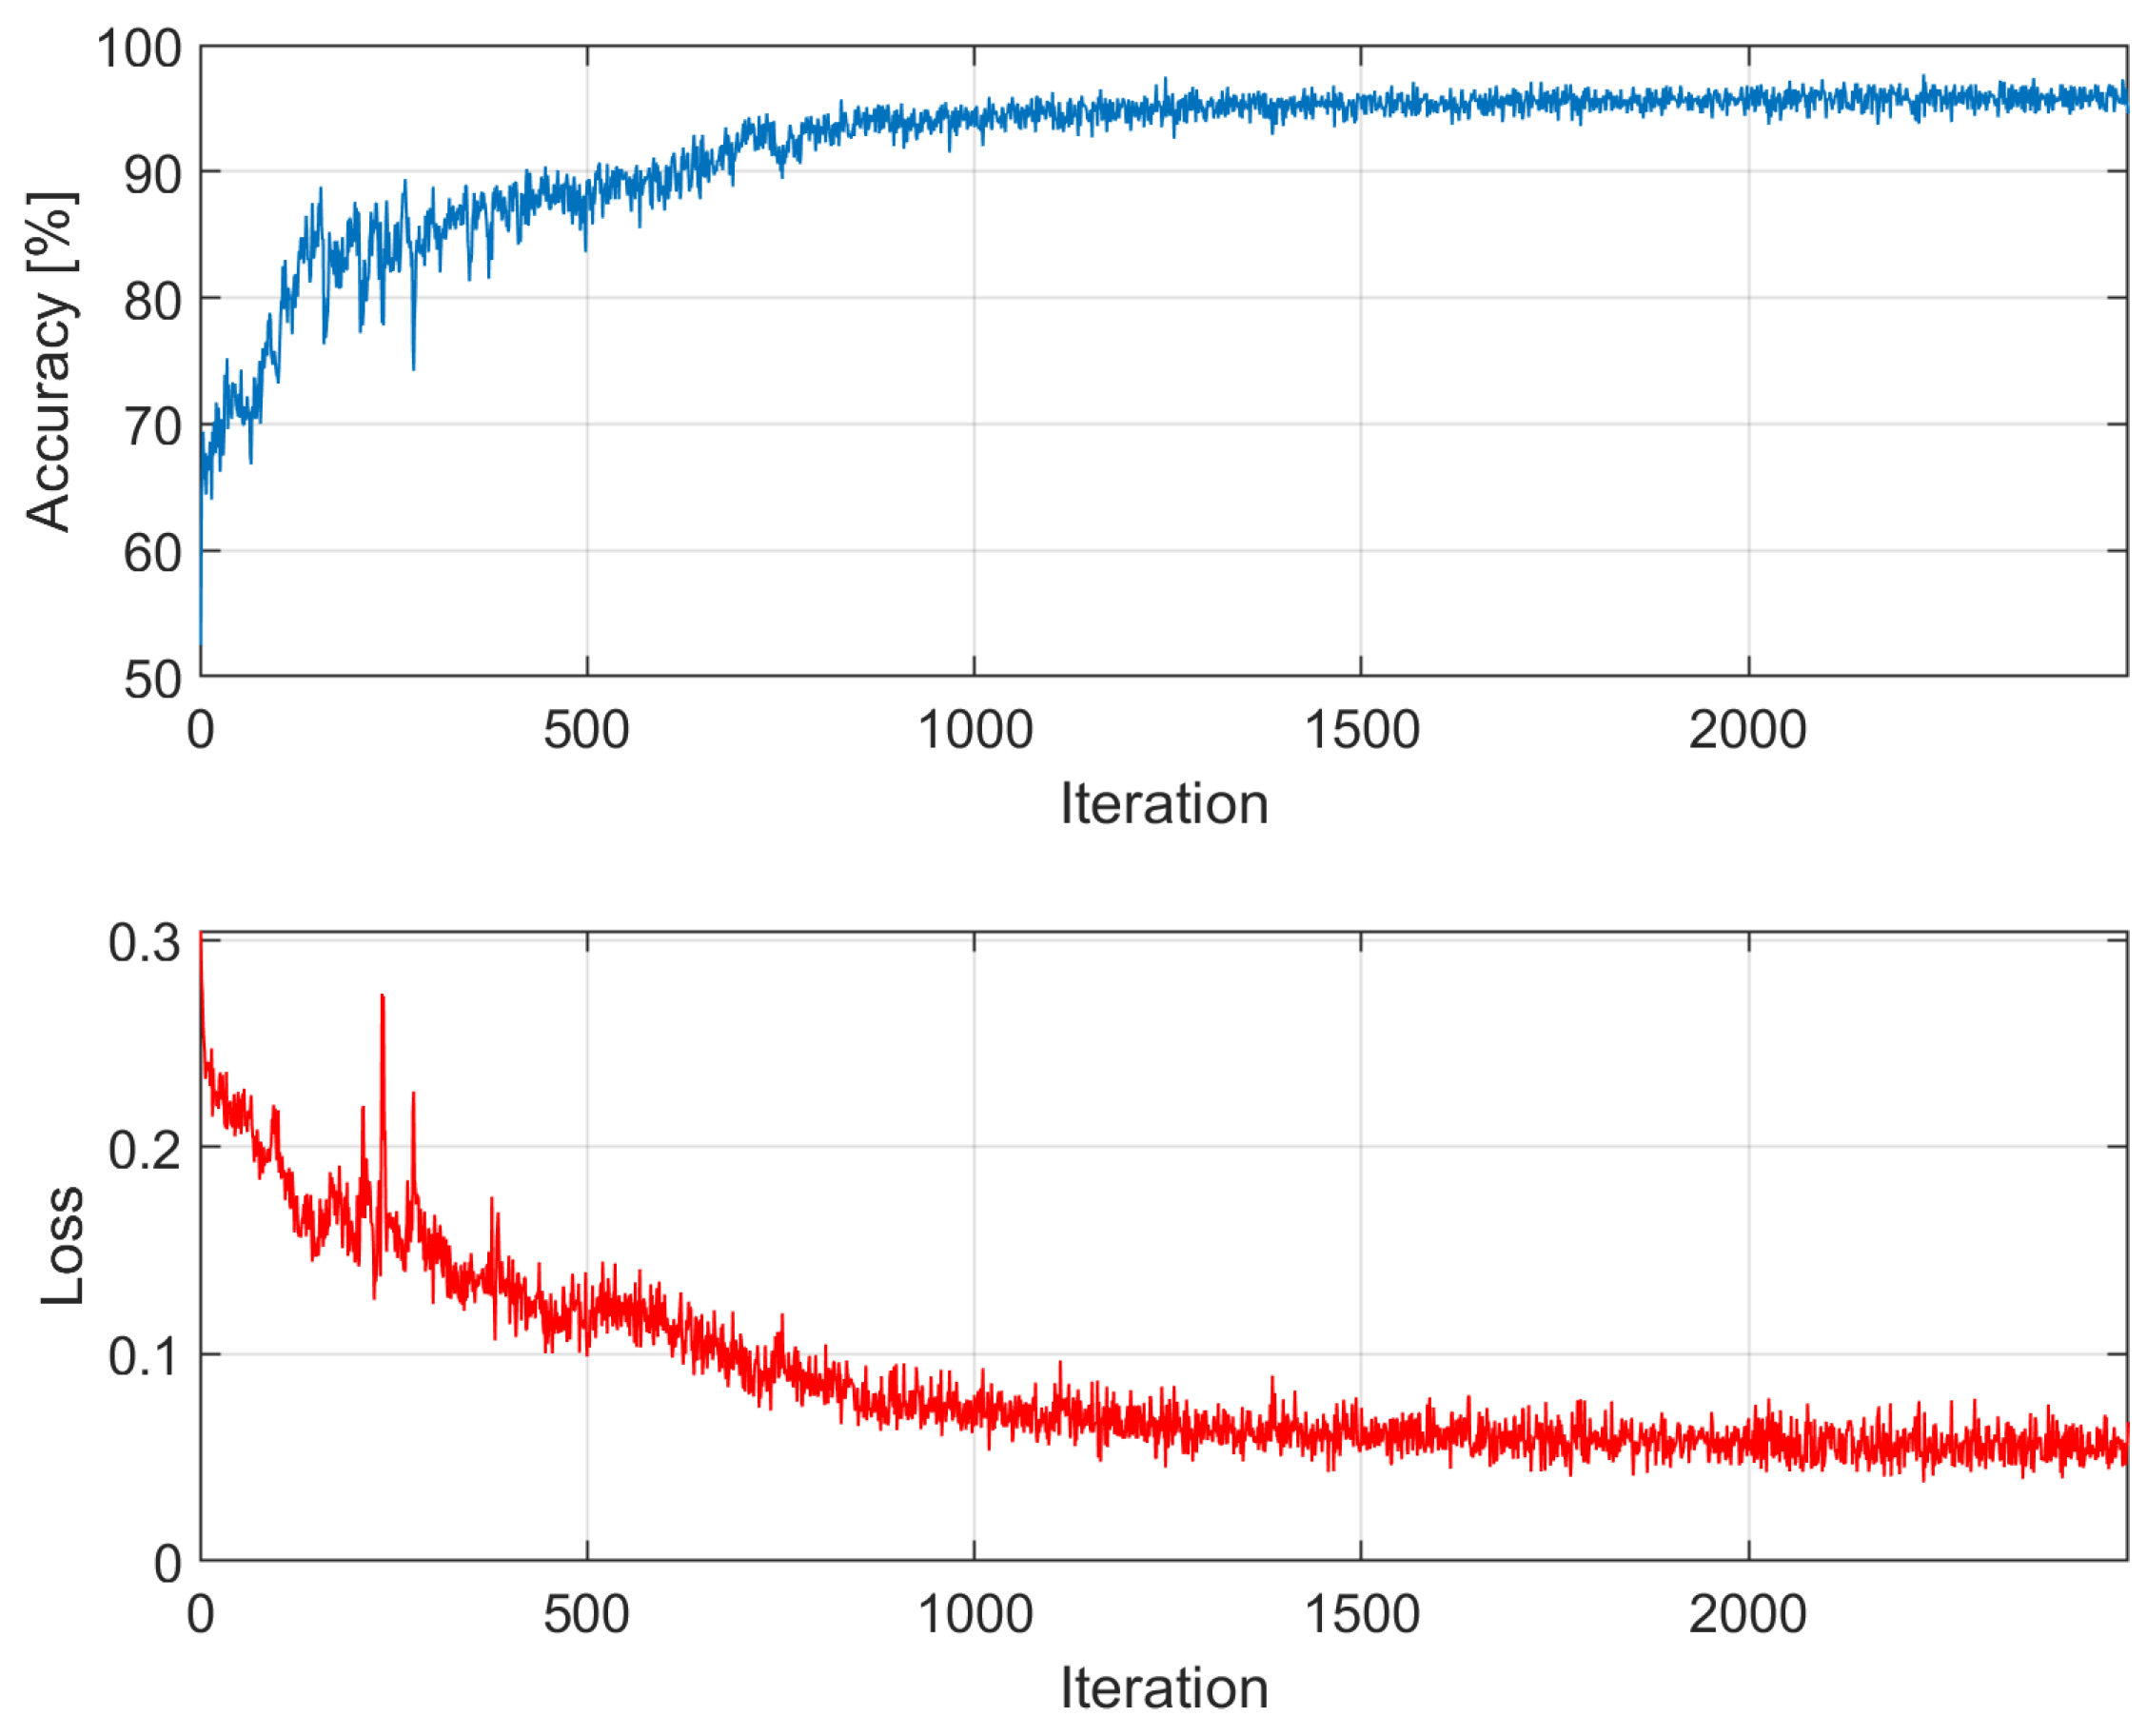
Figure A3.
Accuracy and loss among epochs – k = 3; training time: 13 min 2 sec; accuracy on validation dataset: 96.16%
Figure A3.
Accuracy and loss among epochs – k = 3; training time: 13 min 2 sec; accuracy on validation dataset: 96.16%
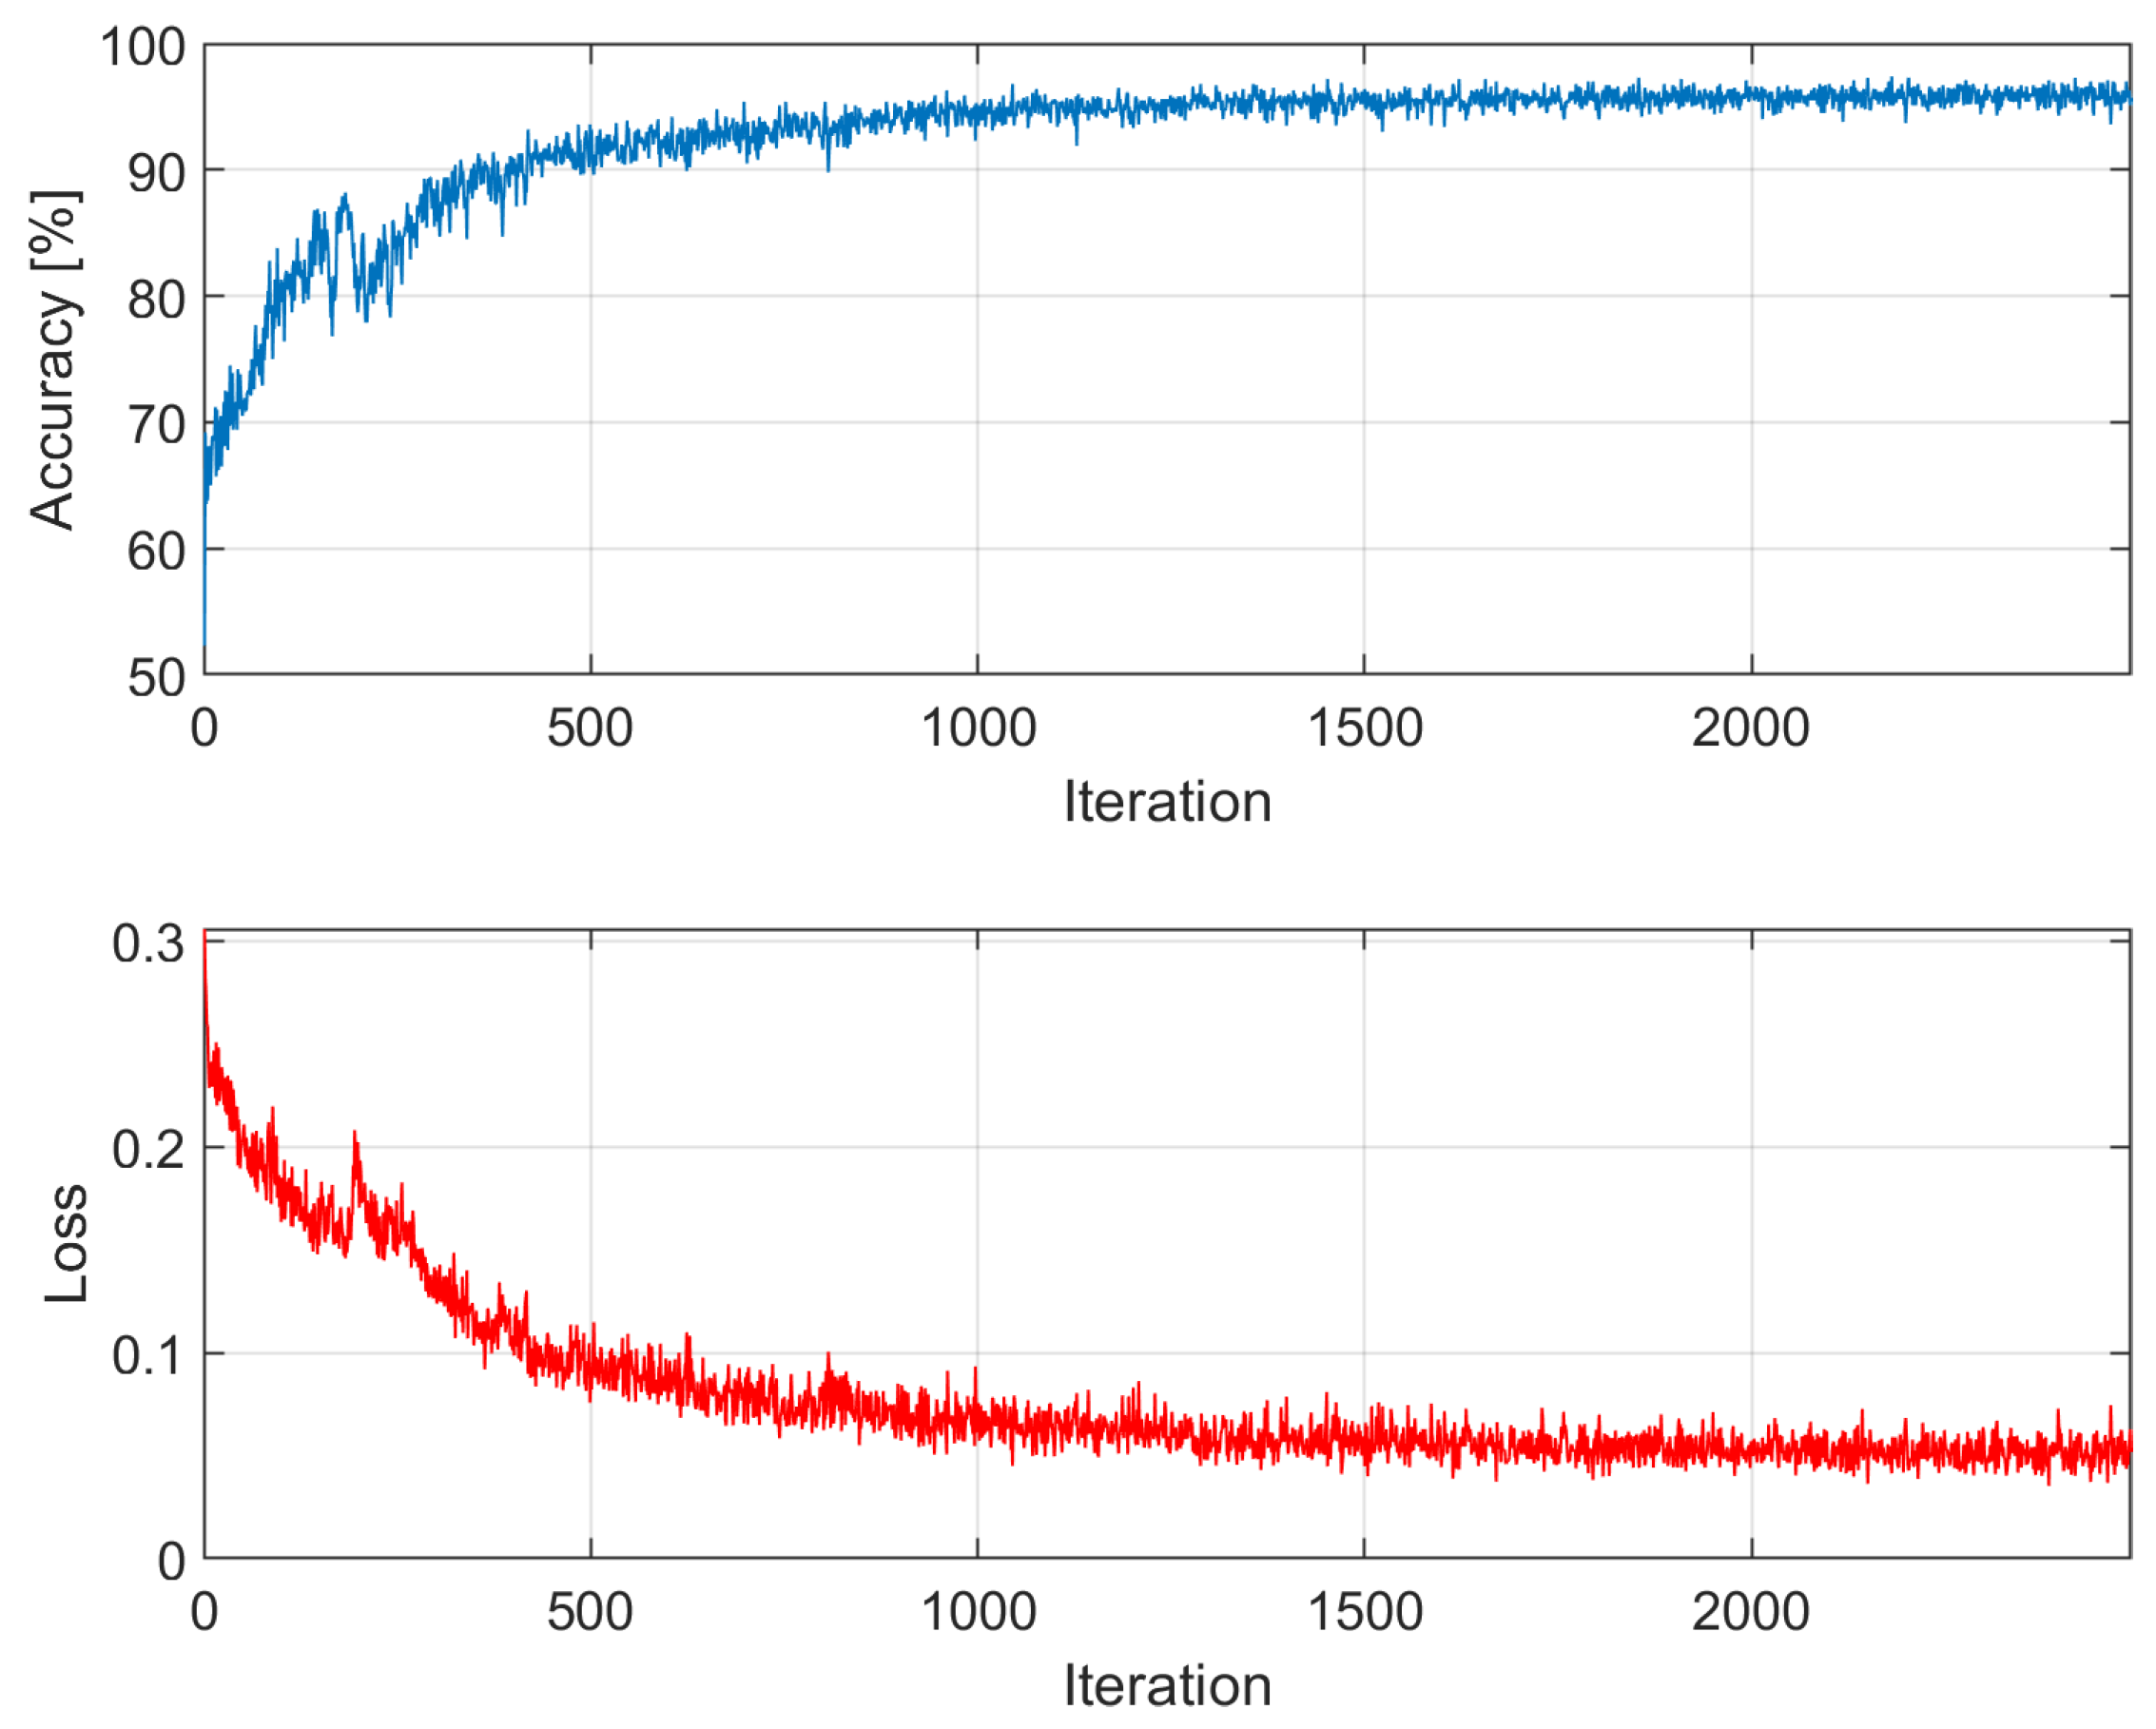
Figure A4.
Accuracy and loss among epochs – k = 4; training time: 13 min 0 sec; accuracy on validation dataset: 95.51%
Figure A4.
Accuracy and loss among epochs – k = 4; training time: 13 min 0 sec; accuracy on validation dataset: 95.51%
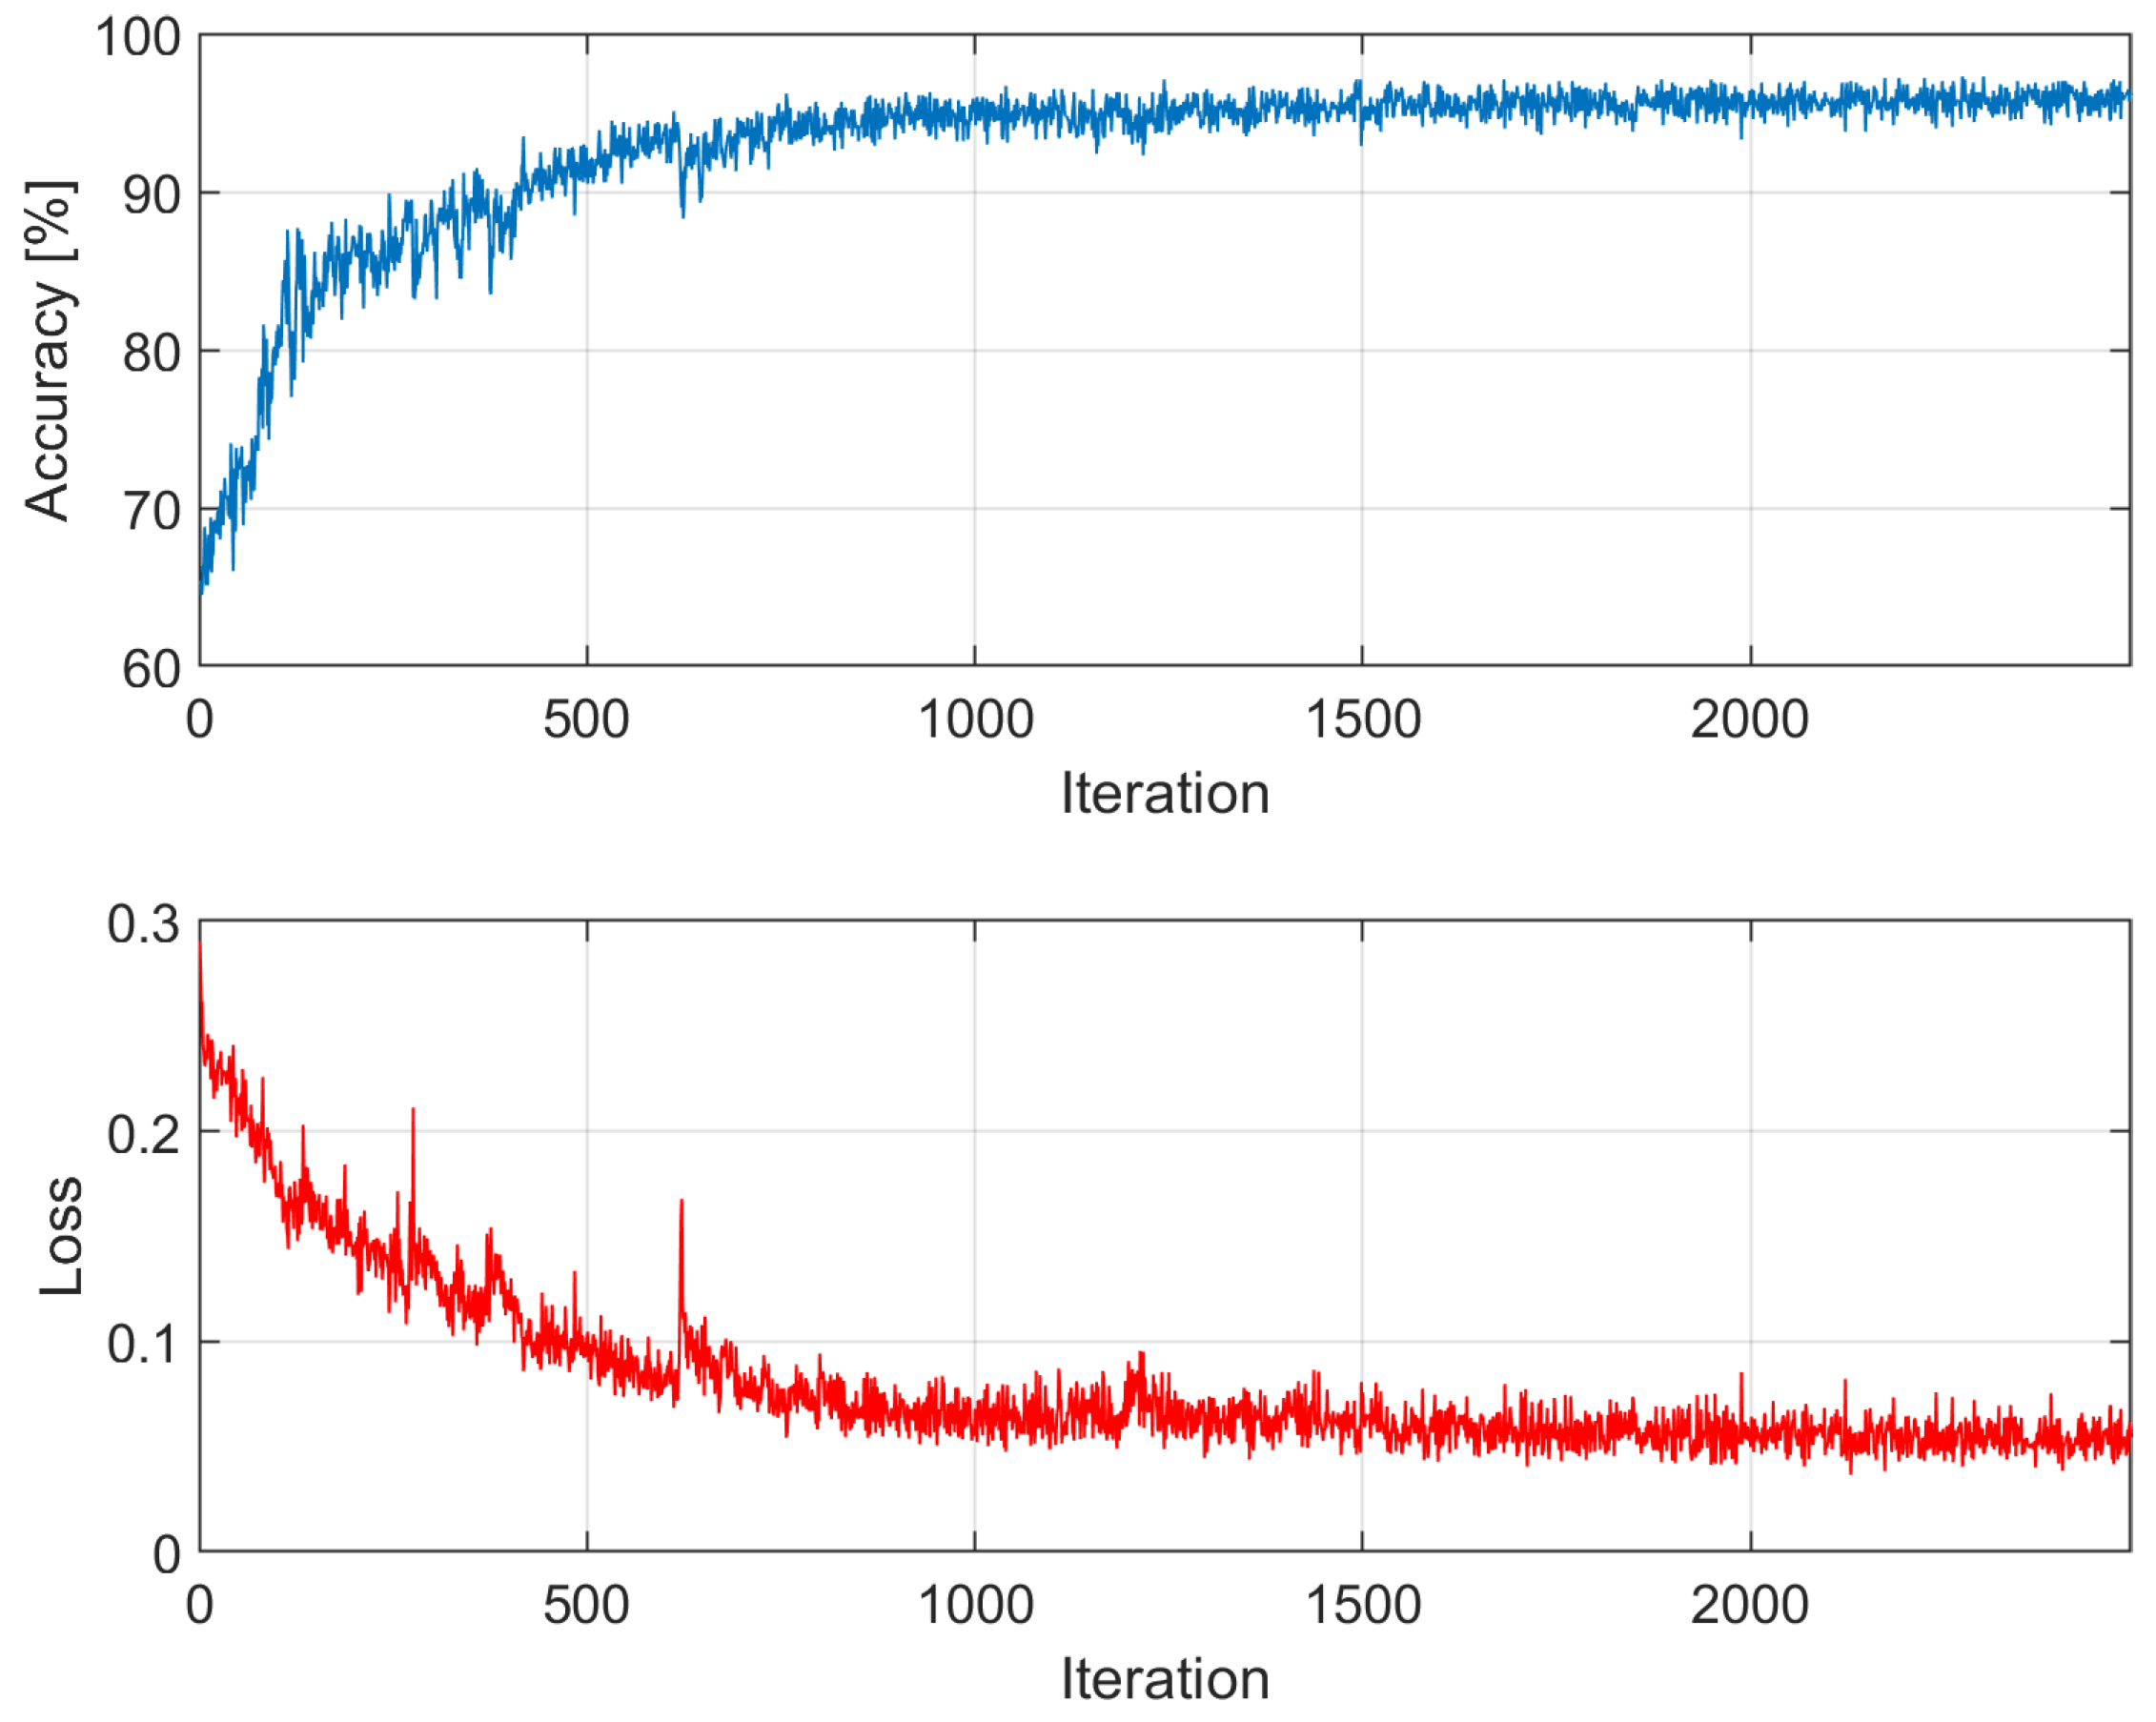
Figure A5.
Accuracy and loss among epochs – k = 5; training time: 12 min 59 sec; accuracy on validation dataset: 94.55%
Figure A5.
Accuracy and loss among epochs – k = 5; training time: 12 min 59 sec; accuracy on validation dataset: 94.55%
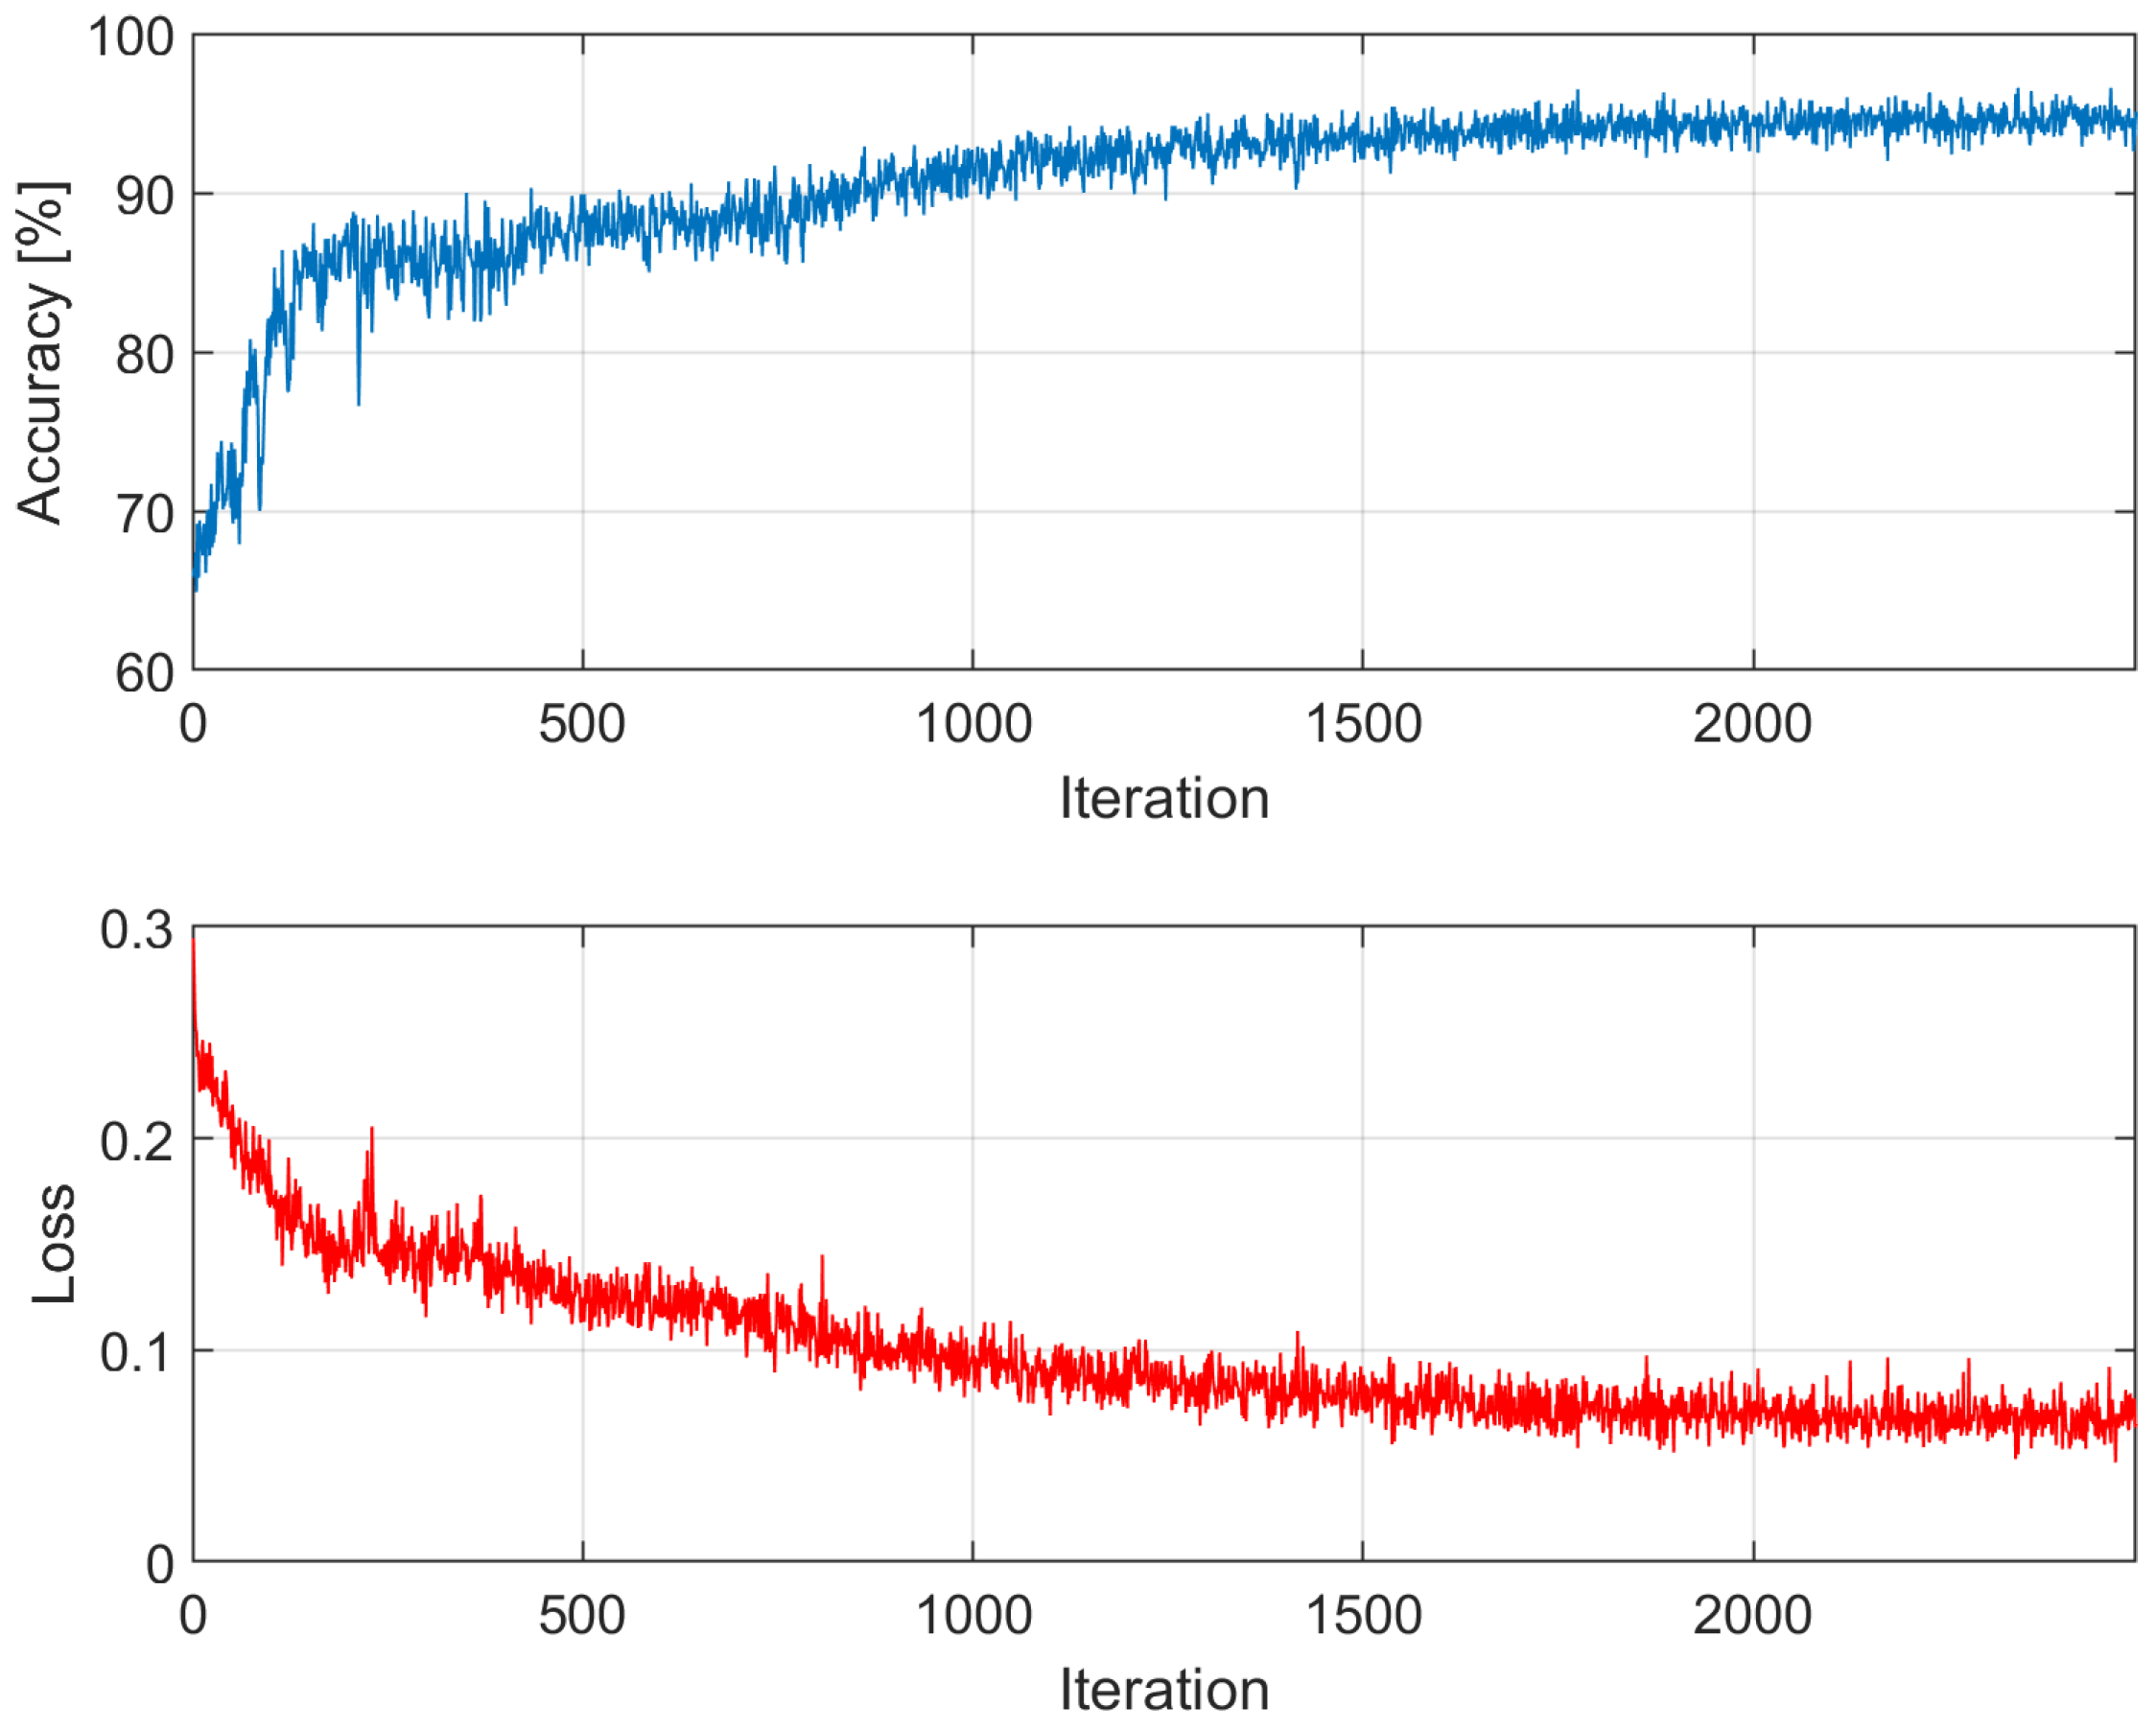
Figure A6.
Accuracy and loss among epochs – k = 6; training time: 12 min 58 sec; accuracy on validation dataset: 94.96%
Figure A6.
Accuracy and loss among epochs – k = 6; training time: 12 min 58 sec; accuracy on validation dataset: 94.96%
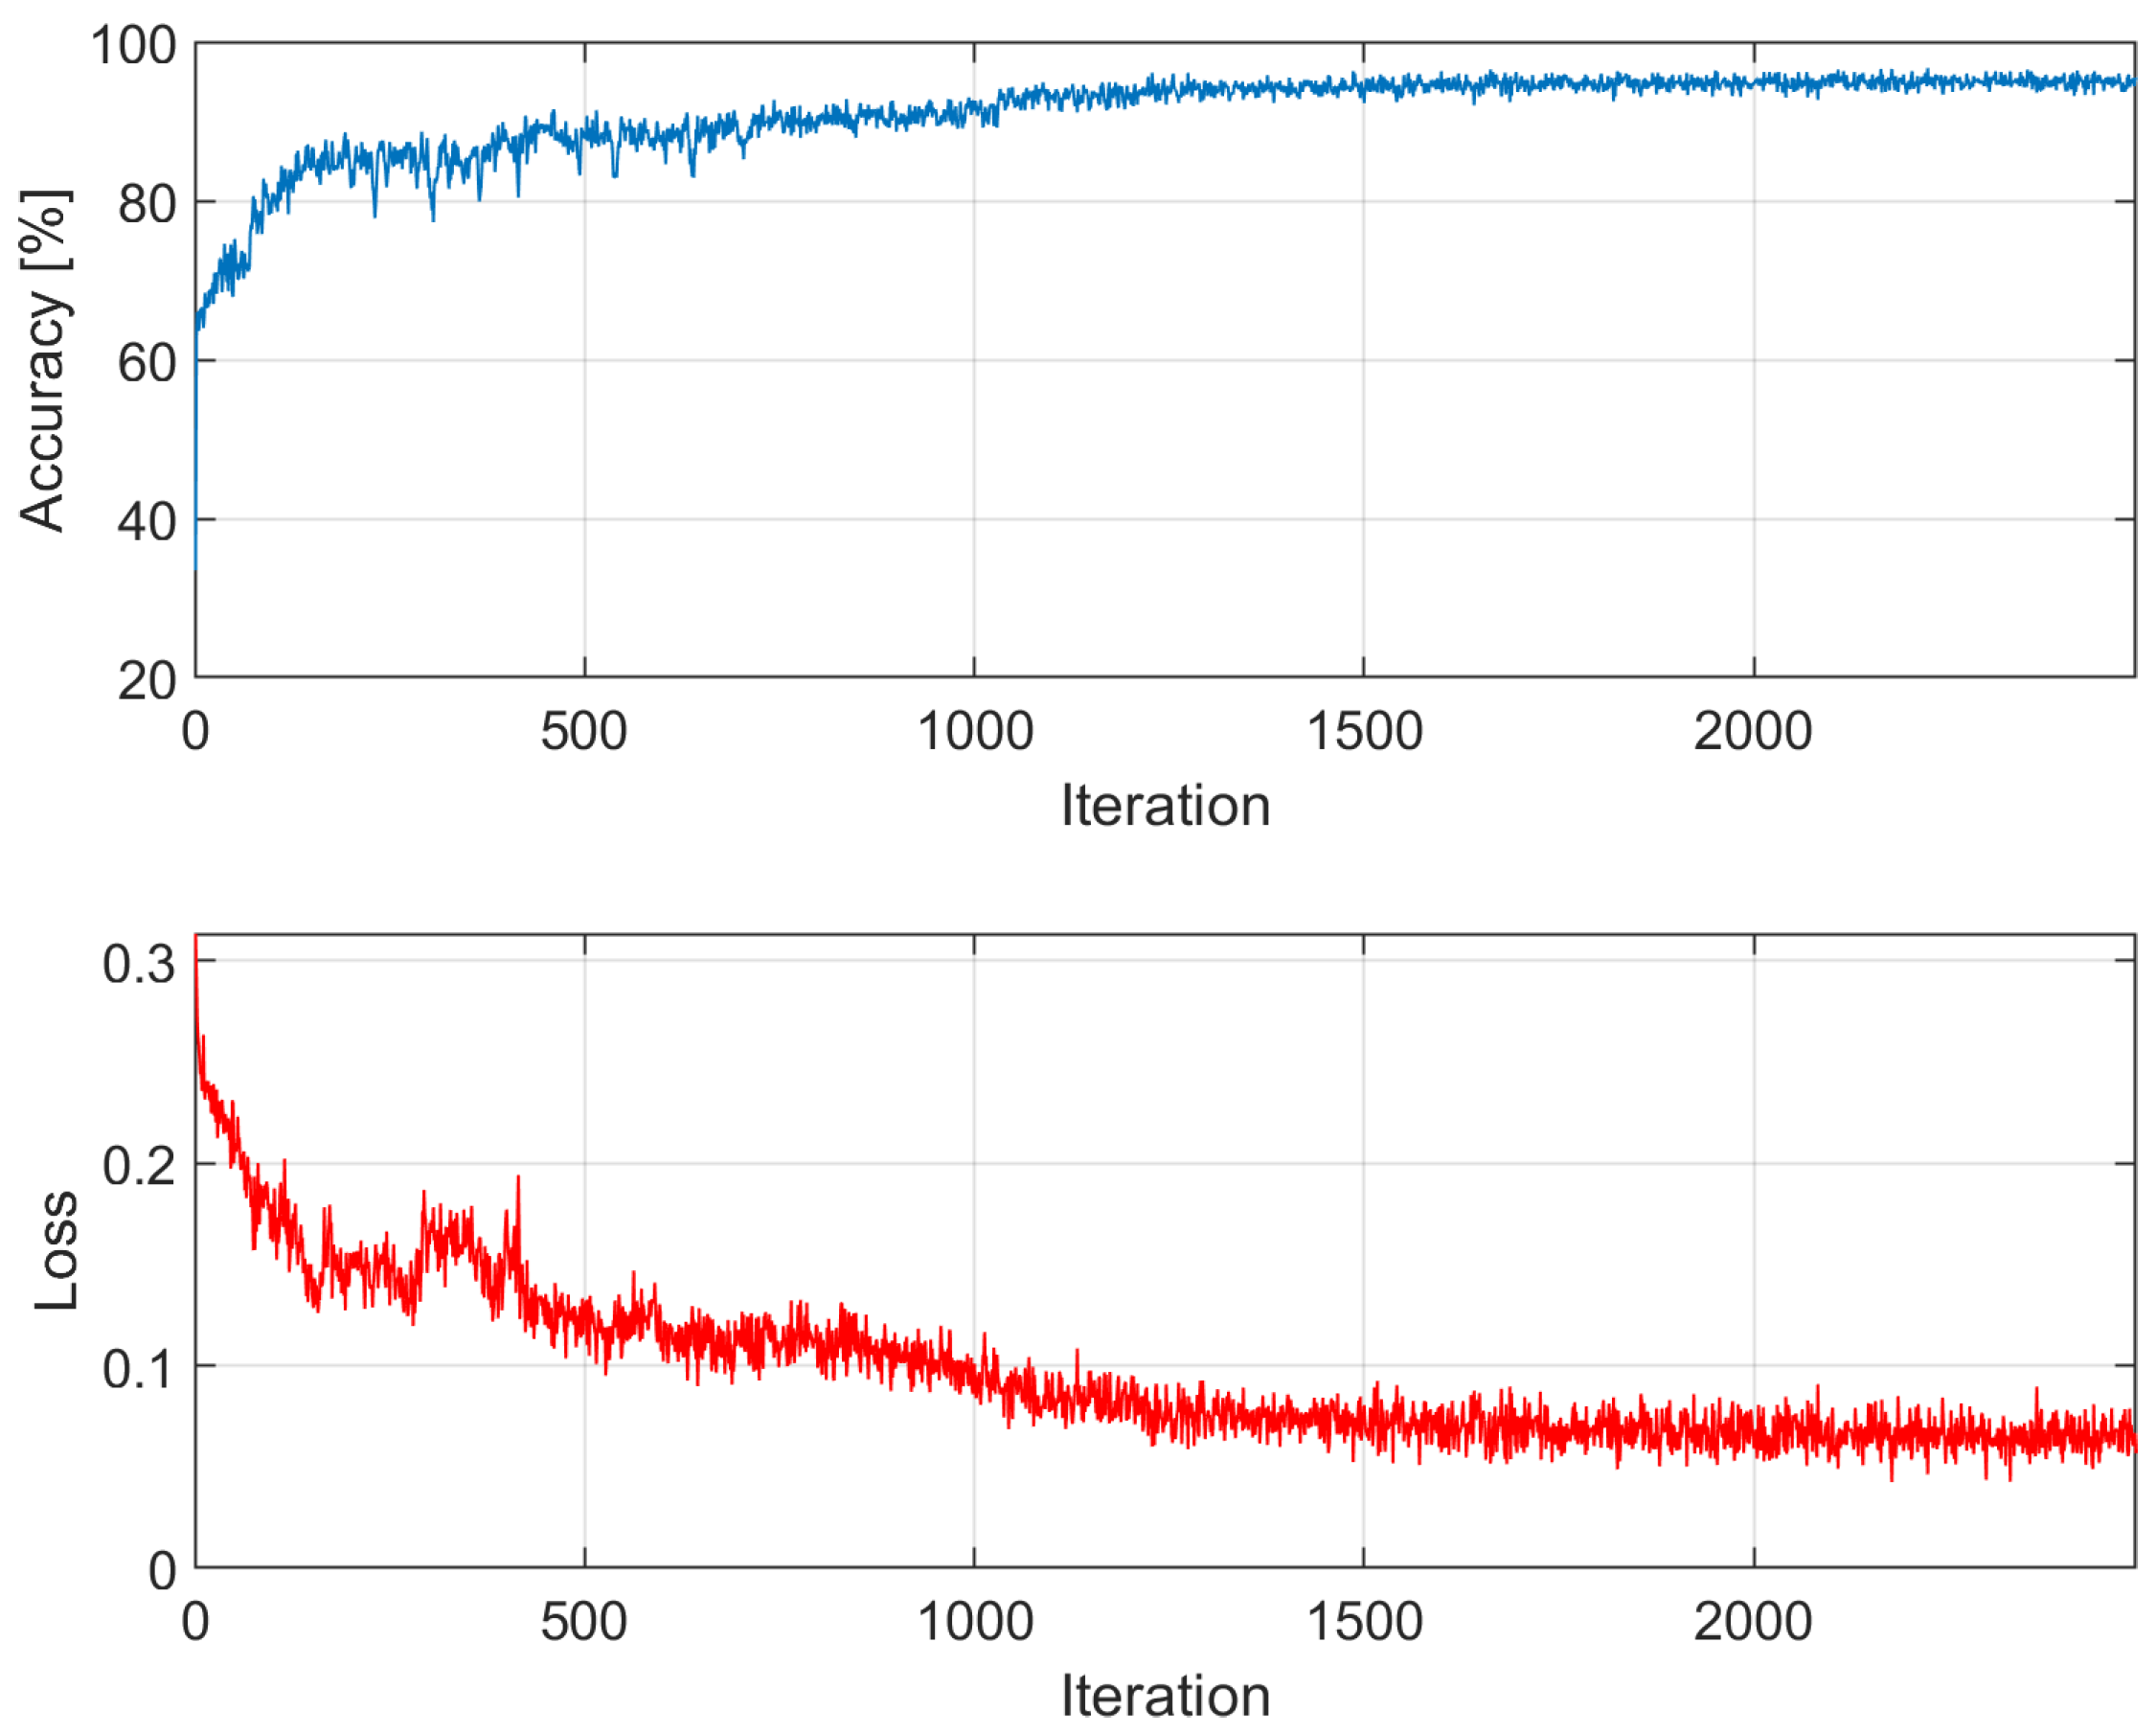
Figure A7.
Accuracy and loss among epochs – k = 7; training time: 13 min 5 sec; accuracy on validation dataset: 94.87%
Figure A7.
Accuracy and loss among epochs – k = 7; training time: 13 min 5 sec; accuracy on validation dataset: 94.87%
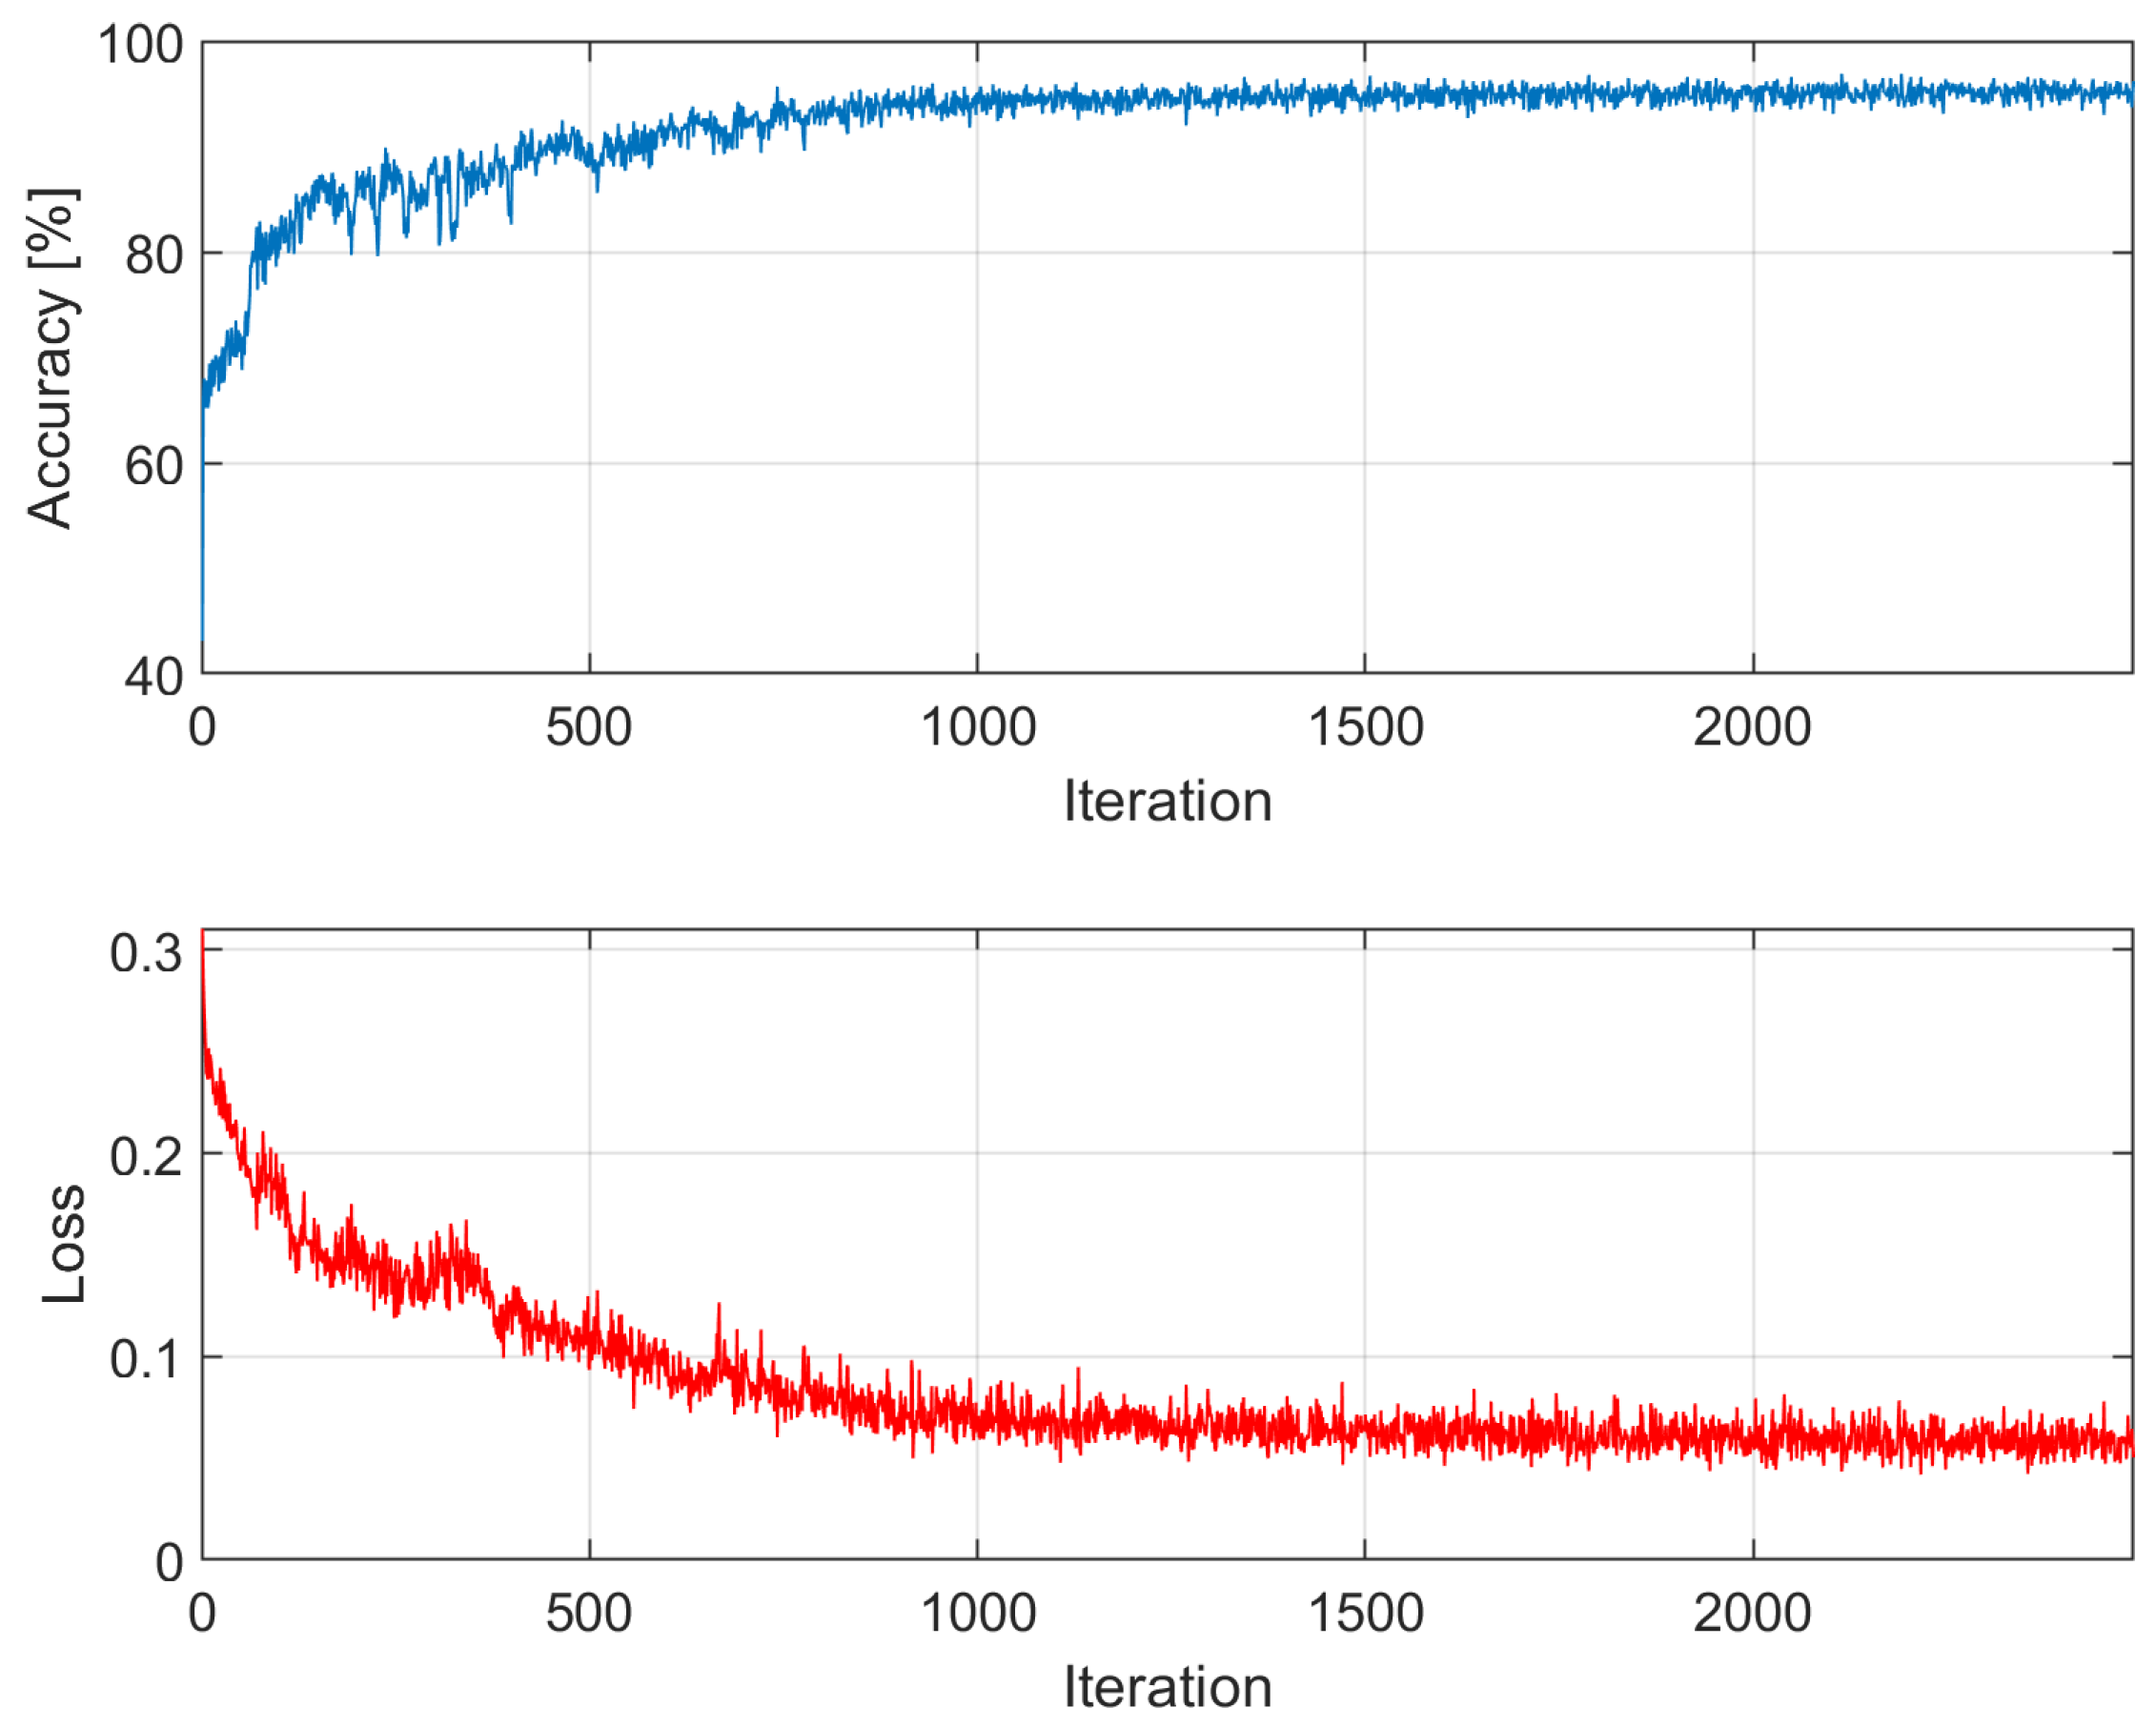
Figure A8.
Accuracy and loss among epochs – k = 8; training time: 13 min 0 sec; accuracy on validation dataset: 95.87%
Figure A8.
Accuracy and loss among epochs – k = 8; training time: 13 min 0 sec; accuracy on validation dataset: 95.87%
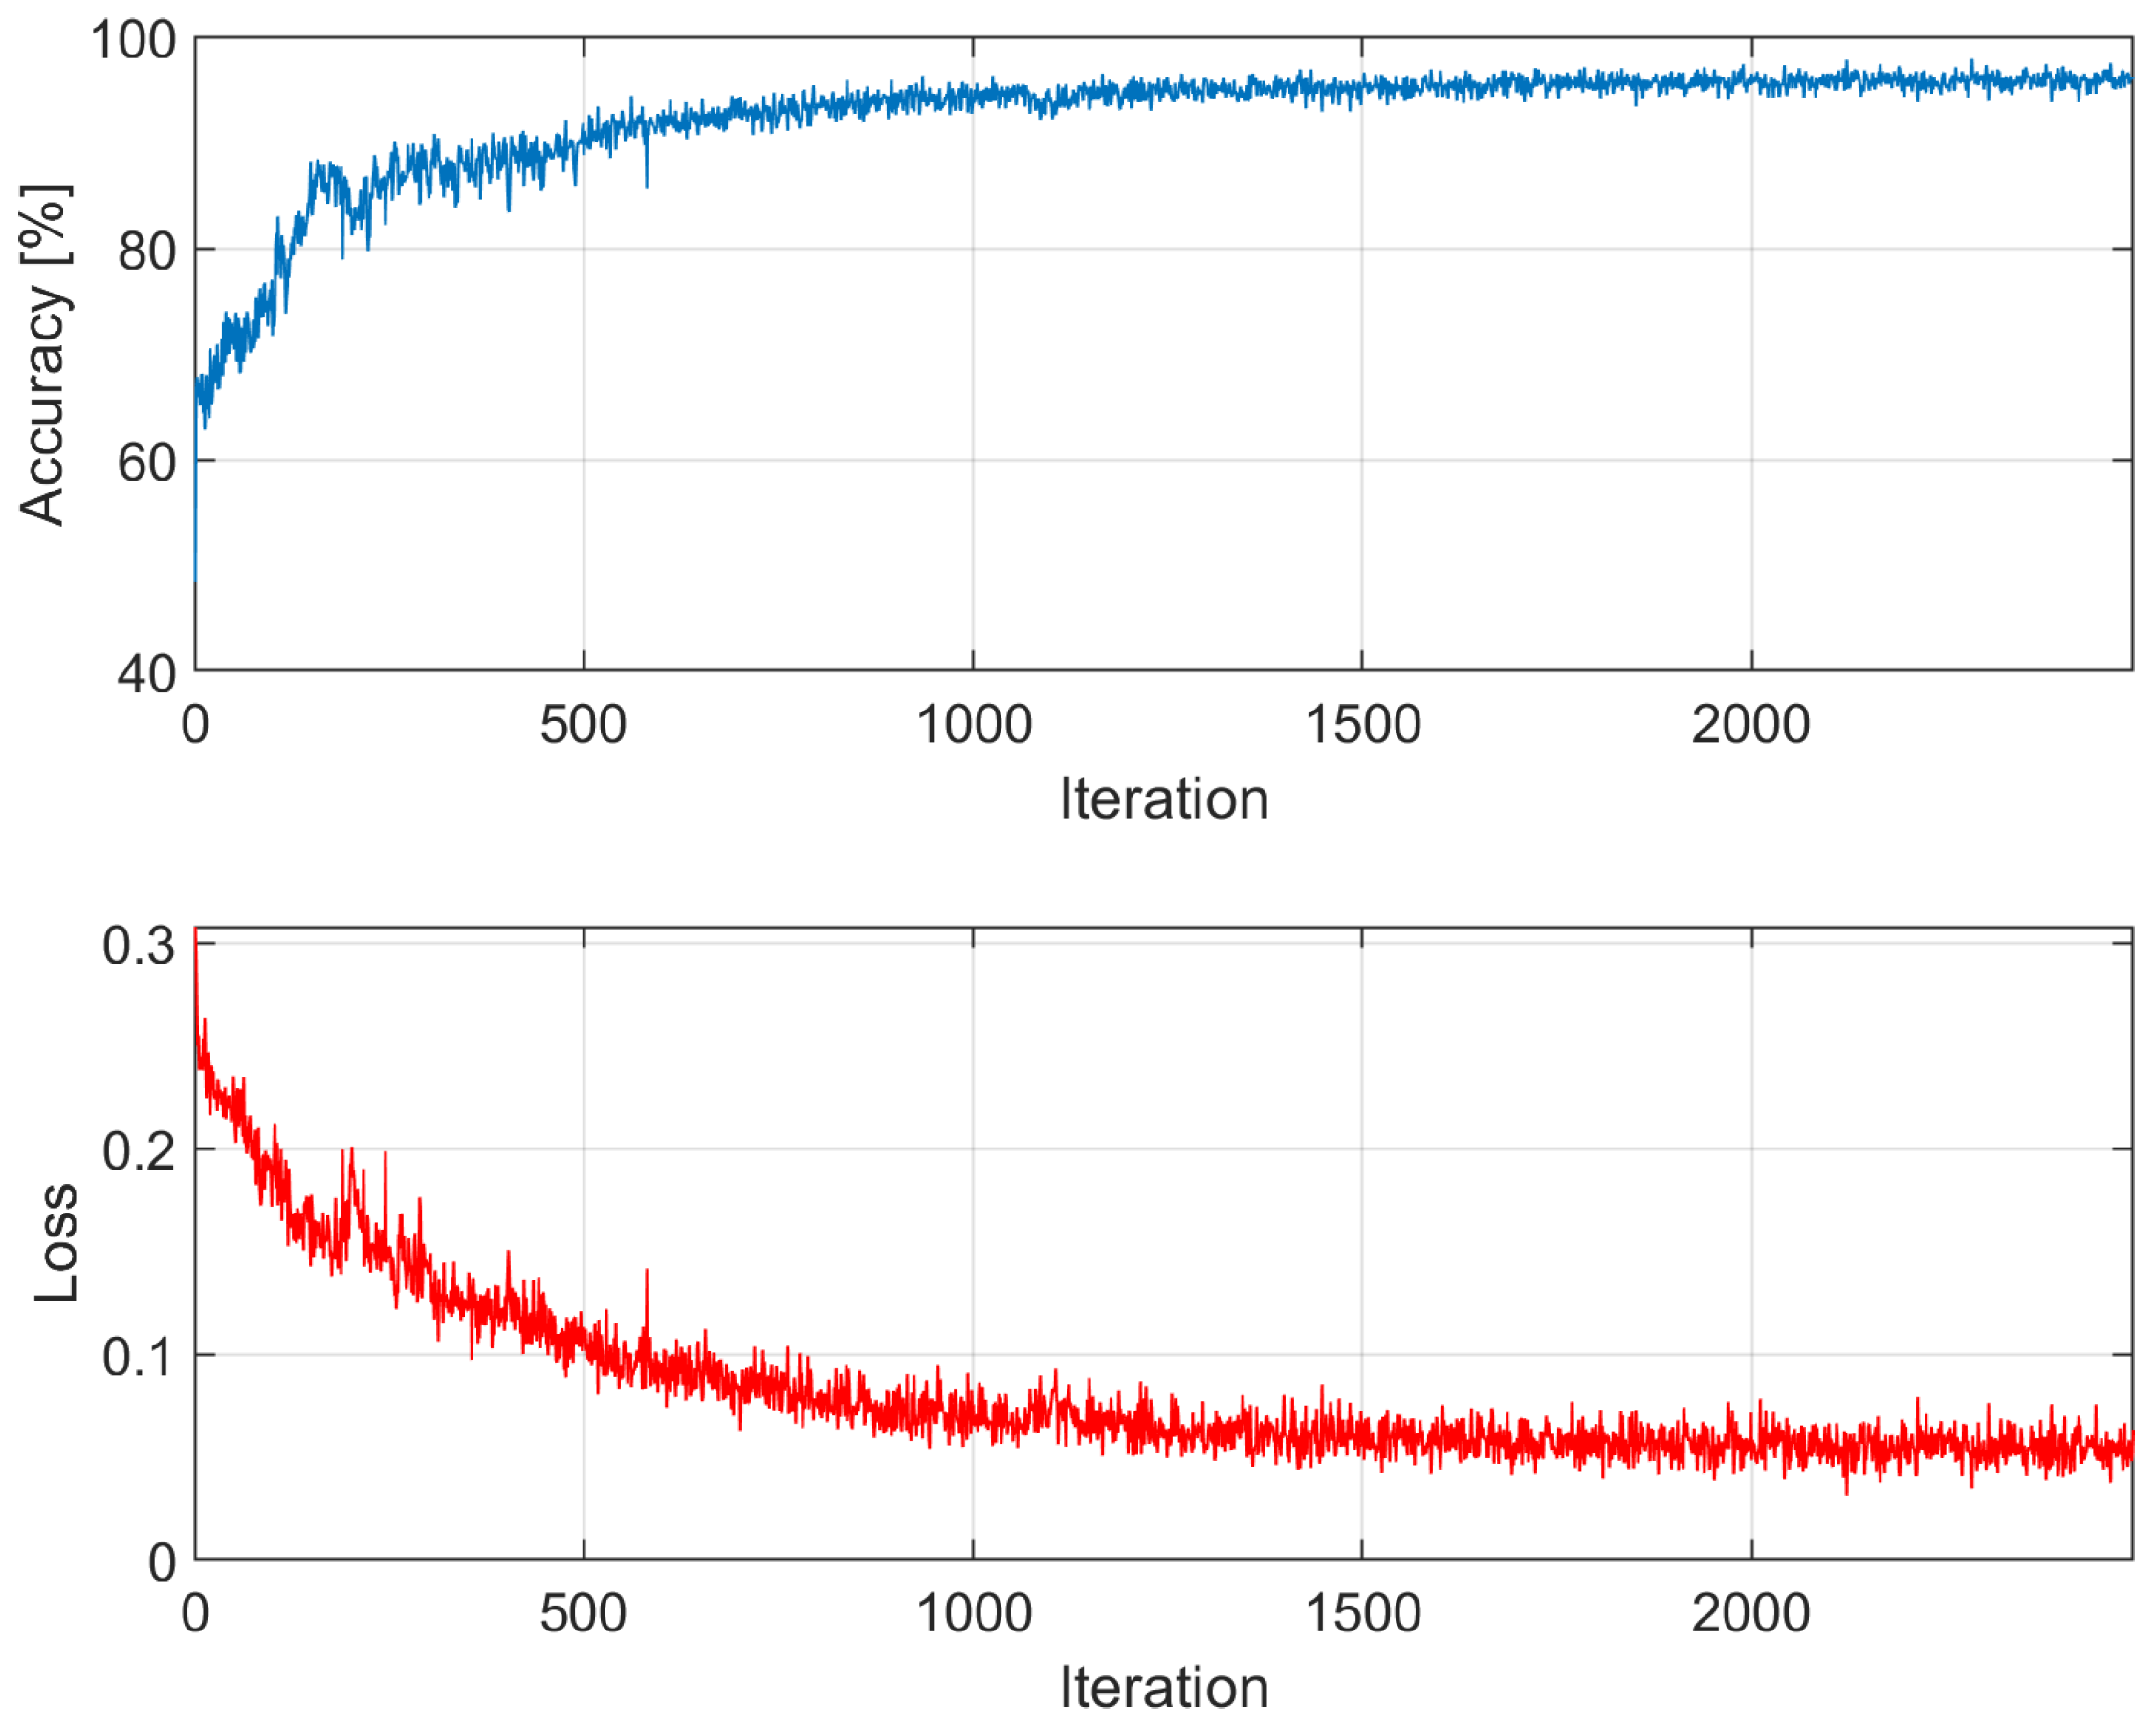
Figure A9.
Accuracy and loss among epochs – k = 9; training time: 13 min 1 sec; accuracy on validation dataset: 94.52%
Figure A9.
Accuracy and loss among epochs – k = 9; training time: 13 min 1 sec; accuracy on validation dataset: 94.52%
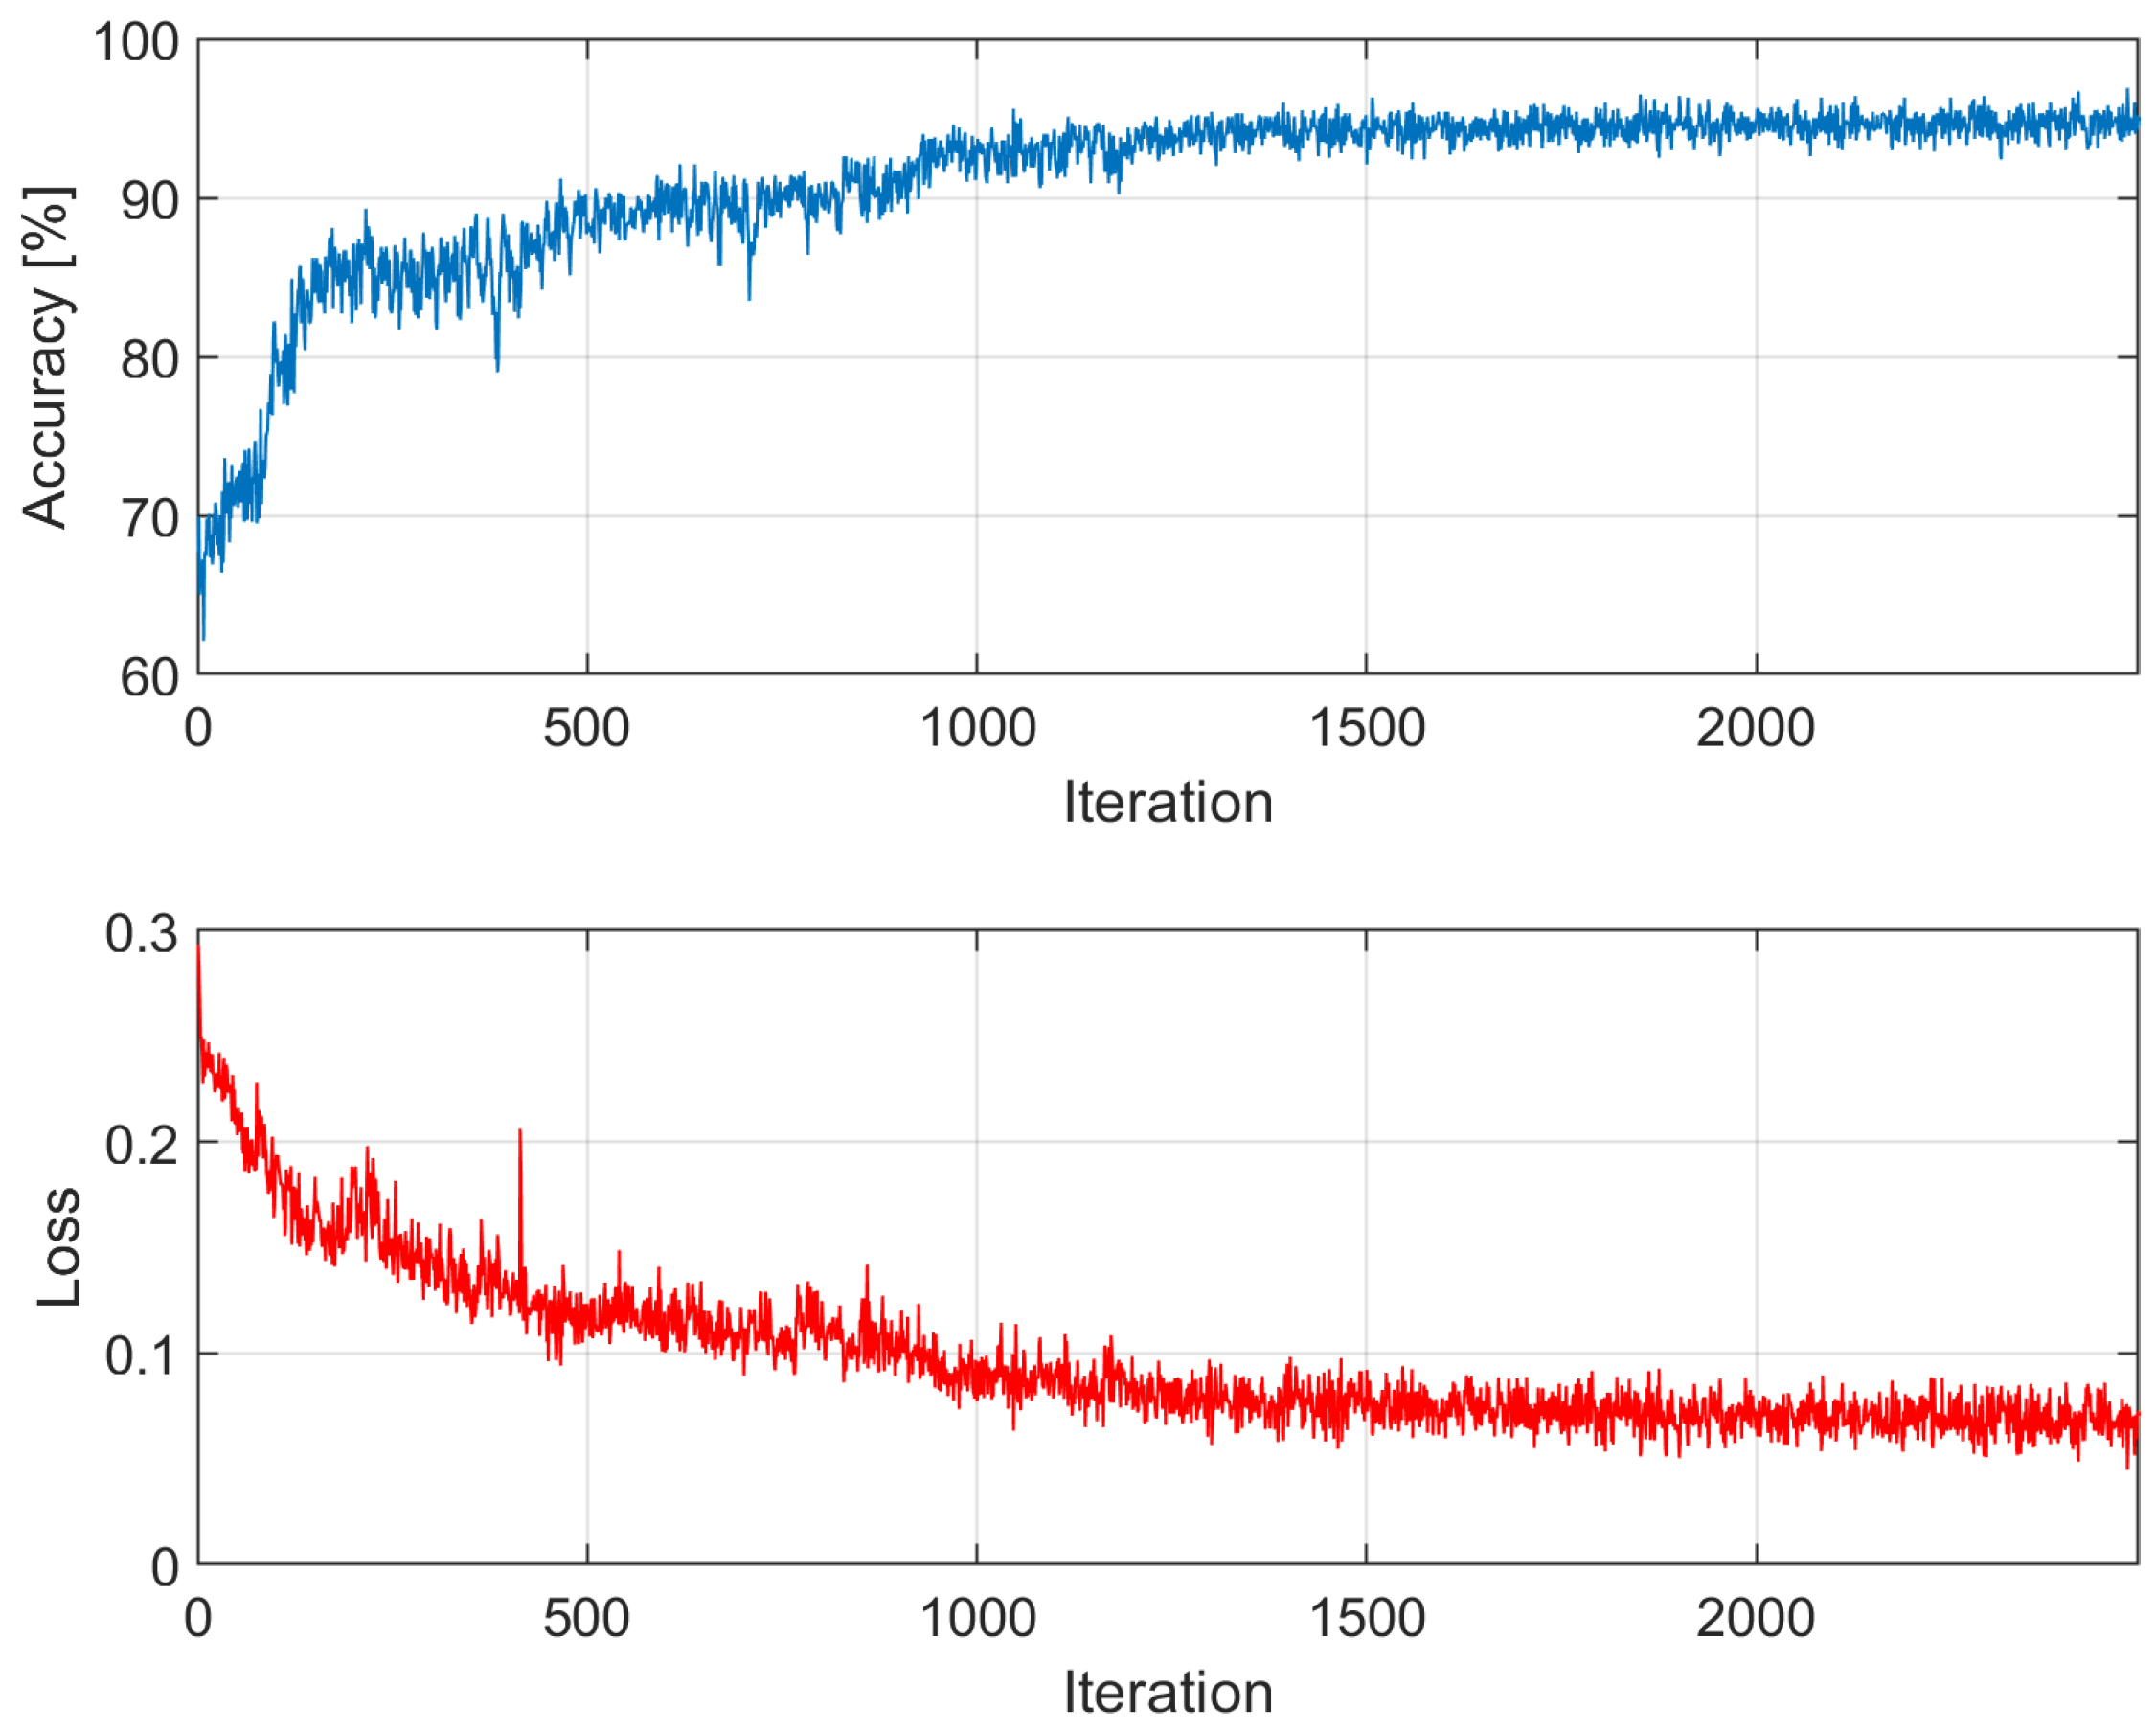
Figure A10.
Accuracy and loss among epochs – k = 10; training time: 13 min 3 sec; accuracy on validation dataset: 94.82%
Figure A10.
Accuracy and loss among epochs – k = 10; training time: 13 min 3 sec; accuracy on validation dataset: 94.82%
References
- Yu, K.; Beam, A.; Kohane, I. Artificial Intelligence in Healthcare. Artificial Intelligence and Machine Learning for Business for Non-Engineers 2019. [Google Scholar] [CrossRef]
- Ravì, D.; Wong, C.; Deligianni, F.; Berthelot, M.; Andreu-Perez, J.; Lo, B.P.L.; Yang, G.Z. Deep Learning for Health Informatics. IEEE Journal of Biomedical and Health Informatics 2017, 21, 4–21. [Google Scholar] [CrossRef] [PubMed]
- Mishra, V.; Ugemuge, S.; Tiwade, Y. Artificial intelligence changing the future of healthcare diagnostics. Journal of Cellular Biotechnology 2023. [Google Scholar] [CrossRef]
- Javaid, M.; Haleem, A.; Singh, R.P.; Suman, R.; Gonzalez, E.S. Understanding the adoption of Industry 4.0 technologies in improving environmental sustainability. Sustainable Operations and Computers 2022, 3, 203–217. [Google Scholar] [CrossRef]
- Hasan, M.A.; Mishuk, M.N. MEMS IMU Based Pedestrian Indoor Navigation for Smart Glass. Wireless Personal Communications 2018, 101, 287–303. [Google Scholar] [CrossRef]
- Uema, Y.; Inoue, K. JINS MEME algorithm for estimation and tracking of concentration of users. In Proceedings of the Proceedings of the 2017 ACM International Joint Conference on Pervasive and Ubiquitous Computing and Proceedings of the 2017 ACM International Symposium on Wearable Computers, Maui Hawaii, 2017; pp. 297–300. [Google Scholar] [CrossRef]
- Ogawa, T.; Takahashi, M.; Kawashima, R. Human Cognitive Control Mode Estimation Using JINS MEME. IFAC-PapersOnLine 2016, 49, 331–336. [Google Scholar] [CrossRef]
- Diaz-Romero, D.J.; Rincon, A.M.R.; Miguel-Cruz, A.; Yee, N.; Stroulia, E. Recognizing Emotional States With Wearables While Playing a Serious Game. IEEE Transactions on Instrumentation and Measurement 2021, 70, 1–12. [Google Scholar] [CrossRef]
- Piaseczna, N.; Duraj, K.; Doniec, R.; Tkacz, E. Evaluation of Intoxication Level with EOG Analysis and Machine Learning: A Study on Driving Simulator*. In Proceedings of the 2023 45th Annual International Conference of the IEEE Engineering in Medicine & Maui Hawaii,, July 2023; pp. 1–4. [CrossRef]
- Doniec, R.; Konior, J.; Sieciński, S.; Piet, A.; Irshad, M.T.; Piaseczna, N.; Hasan, M.A.; Li, F.; Nisar, M.A.; Grzegorzek, M. Sensor-Based Classification of Primary and Secondary Car Driver Activities Using Convolutional Neural Networks. Sensors 2023, 23. [Google Scholar] [CrossRef]
- JINS MEME. JINS MEME glasses specifications. Accessed 31 January 2024.
- Yuan, L.; Shen, H.; Shi, L.; Cheng, N.; Jiang, H. An Explainable Fake News Analysis Method with Stance Information. Electronics 2023. [Google Scholar] [CrossRef]
- Iqbal, A.; Shahzad, K.; Khan, S.A.; Chaudhry, M.S. The relationship of artificial intelligence (AI) with fake news detection (FND): a systematic literature review. Global Knowledge, Memory and Communication 2023. [Google Scholar] [CrossRef]
- Khan, S.; Yairi, T. A review on the application of deep learning in system health management. Mechanical Systems and Signal Processing 2018. [Google Scholar] [CrossRef]
- Musleh, A.S.; Chen, G.; Dong, Z. A Survey on the Detection Algorithms for False Data Injection Attacks in Smart Grids. IEEE Transactions on Smart Grid 2020, 11, 2218–2234. [Google Scholar] [CrossRef]
- Yokkampon, U.; Chumkamon, S.; Mowshowitz, A.; Fujisawa, R.; Hayashi, E. Anomaly Detection Using Support Vector Machines for Time Series Data. J. Robotics Netw. Artif. Life 2021, 8, 41–46. [Google Scholar] [CrossRef]
- Ding, N.; Ma, H.; Zhao, C.; Ma, Y.; Ge, H. Data Anomaly Detection for Internet of Vehicles Based on Traffic Cellular Automata and Driving Style. Sensors (Basel, Switzerland) 2019, 19. [Google Scholar] [CrossRef] [PubMed]
- Muhammad, K.; Ullah, A.; Lloret, J.; Ser, J.; Albuquerque, V. Deep Learning for Safe Autonomous Driving: Current Challenges and Future Directions. IEEE Transactions on Intelligent Transportation Systems 2020, 22, 4316–4336. [Google Scholar] [CrossRef]
- Lu, Y. Industry 4.0: A survey on technologies, applications and open research issues. J. Ind. Inf. Integr. 2017, 6, 1–10. [Google Scholar] [CrossRef]
- Papulová, Z.; Smolka, D.; Krcméry, S. Trends and Challenges in Healthcare in Context of Industry 4.0 and New Emerging Technologies. Human Interaction and Emerging Technologies (IHIET 2022): Artificial Intelligence and Future Applications 2022. [Google Scholar] [CrossRef]
- Xu, Y.; Zhou, Y.; Sekula, P.; Ding, L. Machine learning in construction: From shallow to deep learning. Developments in the Built Environment 2021, 6, 100045. [Google Scholar] [CrossRef]
- Gambo, N.; Musonda, I. Effect of the Fourth Industrial Revolution on Road Transport Asset Management Practice in Nigeria. Journal of Construction in Developing Countries 2021. [Google Scholar] [CrossRef]
- Khan, Y.; Ostfeld, A.; Lochner, C.M.; Pierre, A.; Arias, A. Monitoring of Vital Signs with Flexible and Wearable Medical Devices. Advanced Materials 2016, 28. [Google Scholar] [CrossRef]
- Ha, M.; Lim, S.; Ko, H. Wearable and flexible sensors for user-interactive health-monitoring devices. Journal of materials chemistry. B 2018, 6 24, 4043–4064. [Google Scholar] [CrossRef]
- Ali, F.; El-Sappagh, S.; Islam, S.; Ali, A.; Attique, M.; Imran, M.; Kwak, K. An intelligent healthcare monitoring framework using wearable sensors and social networking data. Future Gener. Comput. Syst. 2021, 114, 23–43. [Google Scholar] [CrossRef]
- Mirjalali, S.; Peng, S.; Fang, Z.; Wang, C.H.; Wu, S. Wearable Sensors for Remote Health Monitoring: Potential Applications for Early Diagnosis of Covid-19. Advanced Materials Technologies 2021, 7. [Google Scholar] [CrossRef] [PubMed]
- Chen, L.W.; Chen, H.M. Driver Behavior Monitoring and Warning With Dangerous Driving Detection Based on the Internet of Vehicles. IEEE Transactions on Intelligent Transportation Systems 2021, 22, 7232–7241. [Google Scholar] [CrossRef]
- Liu, L.; Çagdas Karatas. ; Li, H.; Tan, S.; Gruteser, M.; Yang, J.; Chen, Y.; Martin, R. Toward Detection of Unsafe Driving with Wearables. Proceedings of the 2015 workshop on Wearable Systems and Applications 2015. [Google Scholar] [CrossRef]
- Fahim, M.; Sillitti, A. Anomaly Detection, Analysis and Prediction Techniques in IoT Environment: A Systematic Literature Review. IEEE Access 2019, 7, 81664–81681. [Google Scholar] [CrossRef]
- Erhan, L.; Ndubuaku, M.; Mauro, M.; Song, W.; Chen, M.; Fortino, G.; Bagdasar, O.; Liotta, A. Smart Anomaly Detection in Sensor Systems. ArXiv 2020. abs/2010.14946. [Google Scholar] [CrossRef]
- Bijlani, N.; Nilforooshan, R.; Kouchaki, S. An Unsupervised Data-Driven Anomaly Detection Approach for Adverse Health Conditions in People Living With Dementia: Cohort Study. JMIR Aging 2022, 5. [Google Scholar] [CrossRef] [PubMed]
- Banaee, H.; Ahmed, M.U.; Loutfi, A. Data Mining for Wearable Sensors in Health Monitoring Systems: A Review of Recent Trends and Challenges. Sensors (Basel, Switzerland) 2013, 13, 17472–17500. [Google Scholar] [CrossRef] [PubMed]
- Tsai, C.Y.; Majumdar, A.; Wang, Y.; Hsu, W.H.; Kang, J.H.; Lee, K.Y.; Tseng, C.; Kuan, Y.; Lee, H.C.; Wu, C.J.; et al. Machine learning model for aberrant driving behaviour prediction using heart rate variability: a pilot study involving highway bus drivers. International Journal of Occupational Safety and Ergonomics 2022, 29, 1429–1439. [Google Scholar] [CrossRef]
- Bobermin, M.; Silva, M.M.; Ferreira, S. Driving simulators to evaluate road geometric design effects on driver behaviour: A systematic review. Accident; analysis and prevention 2020, 150, 105923. [Google Scholar] [CrossRef]
- Jia, L.; Lu, M.; Wang, J. Using real-world data to calibrate a driving simulator measuring lateral driving behaviour. Iet Intelligent Transport Systems 2011, 5, 21–31. [Google Scholar] [CrossRef]
- Jamson, S.; Jamson, A.H. The validity of a low-cost simulator for the assessment of the effects of in-vehicle information systems. Safety Science 2010, 48, 1477–1483. [Google Scholar] [CrossRef]
- Wang, Y.; Mehler, B.; Reimer, B.; Lammers, V.; D’Ambrosio, L.; Coughlin, J. The validity of driving simulation for assessing differences between in-vehicle informational interfaces: A comparison with field testing. Ergonomics 2010, 53, 404–420. [Google Scholar] [CrossRef] [PubMed]
- Markkula, G.; Romano, R.; Jamson, A.; Pariota, L.; Bean, A.; Boer, E. Using Driver Control Models to Understand and Evaluate Behavioral Validity of Driving Simulators. IEEE Transactions on Human-Machine Systems 2018, 48, 592–603. [Google Scholar] [CrossRef]
- Classen, S.; Brooks, J. Driving Simulators for Occupational Therapy Screening, Assessment, and Intervention. Occupational Therapy In Health Care 2014, 28, 154–162. [Google Scholar] [CrossRef]
- Abdullah, M.; Koetniyom, S.; Carmai, J. Development of a Mobile Driving Simulator to Eliminate False Motion Cues. Journal of the Society of Automotive Engineers Malaysia 2021. [Google Scholar] [CrossRef]
- Amini, R.; Michelaraki, E.; Katrakazas, C.; Haddad, C.A.; Vos, B.D.; Cuenen, A.; Yannis, G.; Brijs, T.; Antoniou, C. Risk scenario designs for driving simulator experiments. 2021 7th International Conference on Models and Technologies for Intelligent Transportation Systems (MT-ITS) 2021, 1–6. [Google Scholar] [CrossRef]
- Zhou, M.; yao Hou, X.; Nie, L. Study on 3D highway digital model for driving simulators. Transportation Research Part F: Traffic Psychology and Behaviour. [CrossRef]
- Cremer, J.; Kearney, J.; Papelis, Y. Driving simulation: challenges for VR technology. IEEE Computer Graphics and Applications 1996, 16, 16–20. [Google Scholar] [CrossRef]
- Xu, L.; Hu, J.; Jiang, H.; Meng, W. Establishing Style-Oriented Driver Models by Imitating Human Driving Behaviors. IEEE Transactions on Intelligent Transportation Systems 2015, 16, 2522–2530. [Google Scholar] [CrossRef]
- Miyajima, C.; Kusakawa, T.; Nishino, T.; Kitaoka, N.; Itou, K.; Takeda, K. On-Going Data Collection of Driving Behavior Signals. In In-VehicleCorpusandSignalProcessingforDriverBehavior; SpringerUS, 2009; pp. 45–54. [Google Scholar] [CrossRef]
- Morales-Alvarez, W.; Certad, N.; Roitberg, A.; Stiefelhagen, R.; Olaverri-Monreal, C. On Transferability of Driver Observation Models from Simulated to Real Environments in Autonomous Cars. ArXiv 2023. abs/2307.16543. [Google Scholar] [CrossRef]
- Kemeny, A.; Panerai, F. Evaluating perception in driving simulation experiments. Trends in Cognitive Sciences 2003, 7, 31–37. [Google Scholar] [CrossRef]
- Allen, R.; Rosenthal, T.; Cook, M. A Short History of Driving Simulation. In Proceedings of the Handbook of Driving Simulation for Engineering, Medicine, and Psychology; 2011. [Google Scholar] [CrossRef]
- Robbins, C.; Allen, H.; Chapman, P. Comparing drivers’ visual attention at Junctions in Real and Simulated Environments. Applied ergonomics 2019, 80, 89–101. [Google Scholar] [CrossRef]
- Malone, S.; Brünken, R. Hazard Perception, Presence, and Simulation Sickness—A Comparison of Desktop and Head-Mounted Display for Driving Simulation. Frontiers in Psychology 2021, 12. [Google Scholar] [CrossRef]
- Winter, J.D.; Groot, S.D.; Mulder, M.; Wieringa, P.; Dankelman, J.; Mulder, J. Relationships between driving simulator performance and driving test results. Ergonomics 2009, 52, 137–153. [Google Scholar] [CrossRef]
- Yan, X.; Abdel-Aty, M.; Radwan, E.; Wang, X.; Chilakapati, P. Validating a driving simulator using surrogate safety measures. Accident; analysis and prevention 2008, 40 1, 274–88. [Google Scholar] [CrossRef]
- Meuleners, L.; Fraser, M. A validation study of driving errors using a driving simulator. Transportation Research Part F-traffic Psychology and Behaviour 2015, 29, 14–21. [Google Scholar] [CrossRef]
- Doniec, R.J.; Sieciński, S.; Duraj, K.M.; Piaseczna, N.J.; Mocny-Pachońska, K.; Tkacz, E.J. Recognition of Drivers’ Activity Based on 1D Convolutional Neural Network. Electronics 2020, 9. [Google Scholar] [CrossRef]
- Doniec, R.; Piaseczna, N.; Li, F.; Duraj, K.; Pour, H.H.; Grzegorzek, M.; Mocny-Pachońska, K.; Tkacz, E. Classification of Roads and Types of Public Roads Using EOG Smart Glasses and an Algorithm Based on Machine Learning While Driving a Car. Electronics 2022, 11, 2960. [Google Scholar] [CrossRef]
- Piaseczna, N.; Doniec, R.; Sieciński, S.; Grzegorzek, M.; Tkacz, E. Does glucose affect our vision? A preliminary study using smart glasses. In Proceedings of the 2023 IEEE EMBS Special Topic Conference on Data Science and Engineering in Healthcare, Medicine and Biology,, Dec 2023; pp. 113–114. [Google Scholar] [CrossRef]
- Doniec, R.J.; Piaseczna, N.; Duraj, K.; Sieciński, S.; Irshad, M.T.; Karpiel, I.; Urzeniczok, M.; Huang, X.; Piet, A.; Nisar, M.A.; et al. The detection of alcohol intoxication using electrooculography signals from smart glasses and machine learning techniques. Systems and Soft Computing 2024, 6, 200078. [Google Scholar] [CrossRef]
- Buck, J.R.; Daniel, M.M.; Singer, A. Computer explorations in signals and systems using MATLAB, 2nd ed ed.; Prentice-Hall signal processing series; Prentice Hall: Upper Saddle River, N.J, 2002. [Google Scholar]
- Stoica, P.; Moses, R.L. Spectral analysis of signals; Pearson/Prentice Hall: Upper Saddle River, N.J, 2005. [Google Scholar]
- Smith, L.N. A disciplined approach to neural network hyper-parameters: Part 1 – learning rate, batch size, momentum, and weight decay, 2018. [CrossRef]
- Yang, L.; Liang, X.; Wang, T.; Xing, E. Real-to-Virtual Domain Unification for End-to-End Autonomous Driving. In Proceedings of the Proceedings of the European Conference on Computer Vision (ECCV), September 2018. [Google Scholar]
- Karrouchi, M.; Nasri, I.; Rhiat, M.; Atmane, I.; Hirech, K.; Messaoudi, A.; Melhaoui, M.; Kassmi, K. Driving behavior assessment: A practical study and technique for detecting a driver’s condition and driving style. Transportation Engineering 2023, 14, 100217. [Google Scholar] [CrossRef]
- Aarthi, M.; Mahima, R.; Sujanthi, S.; Santosh, A.M.; Sekar, S.; Matthew, J.R.R.; Rooban, C.; Ramamoorthy. Driver drowsiness detection using deep learning technique. AIP Conference Proceedings 2023, 2822, 020248. [Google Scholar] [CrossRef]
- Kaplan, S.; Guvensan, M.A.; Yavuz, A.G.; Karalurt, Y. Driver Behavior Analysis for Safe Driving: A Survey. IEEE Transactions on Intelligent Transportation Systems 2015, 16, 3017–3032, Conference Name:IEEE Transactions on Intelligent Transportation Systems. [Google Scholar] [CrossRef]
- Wallace, B.; Gagnon, S.; Stinchcombe, A.; Yamin, S.; Goubran, R.; Knoefel, F. Preliminary Results for the Automated Assessment of Driving Simulation Results for Drivers with Cognitive Decline. In Proceedings of the 2021 IEEE Sensors Applications Symposium (SAS); 2021; pp. 1–6. [Google Scholar] [CrossRef]
Figure 1.
JINS MEME ES_R smart glasses [9]
Figure 1.
JINS MEME ES_R smart glasses [9]
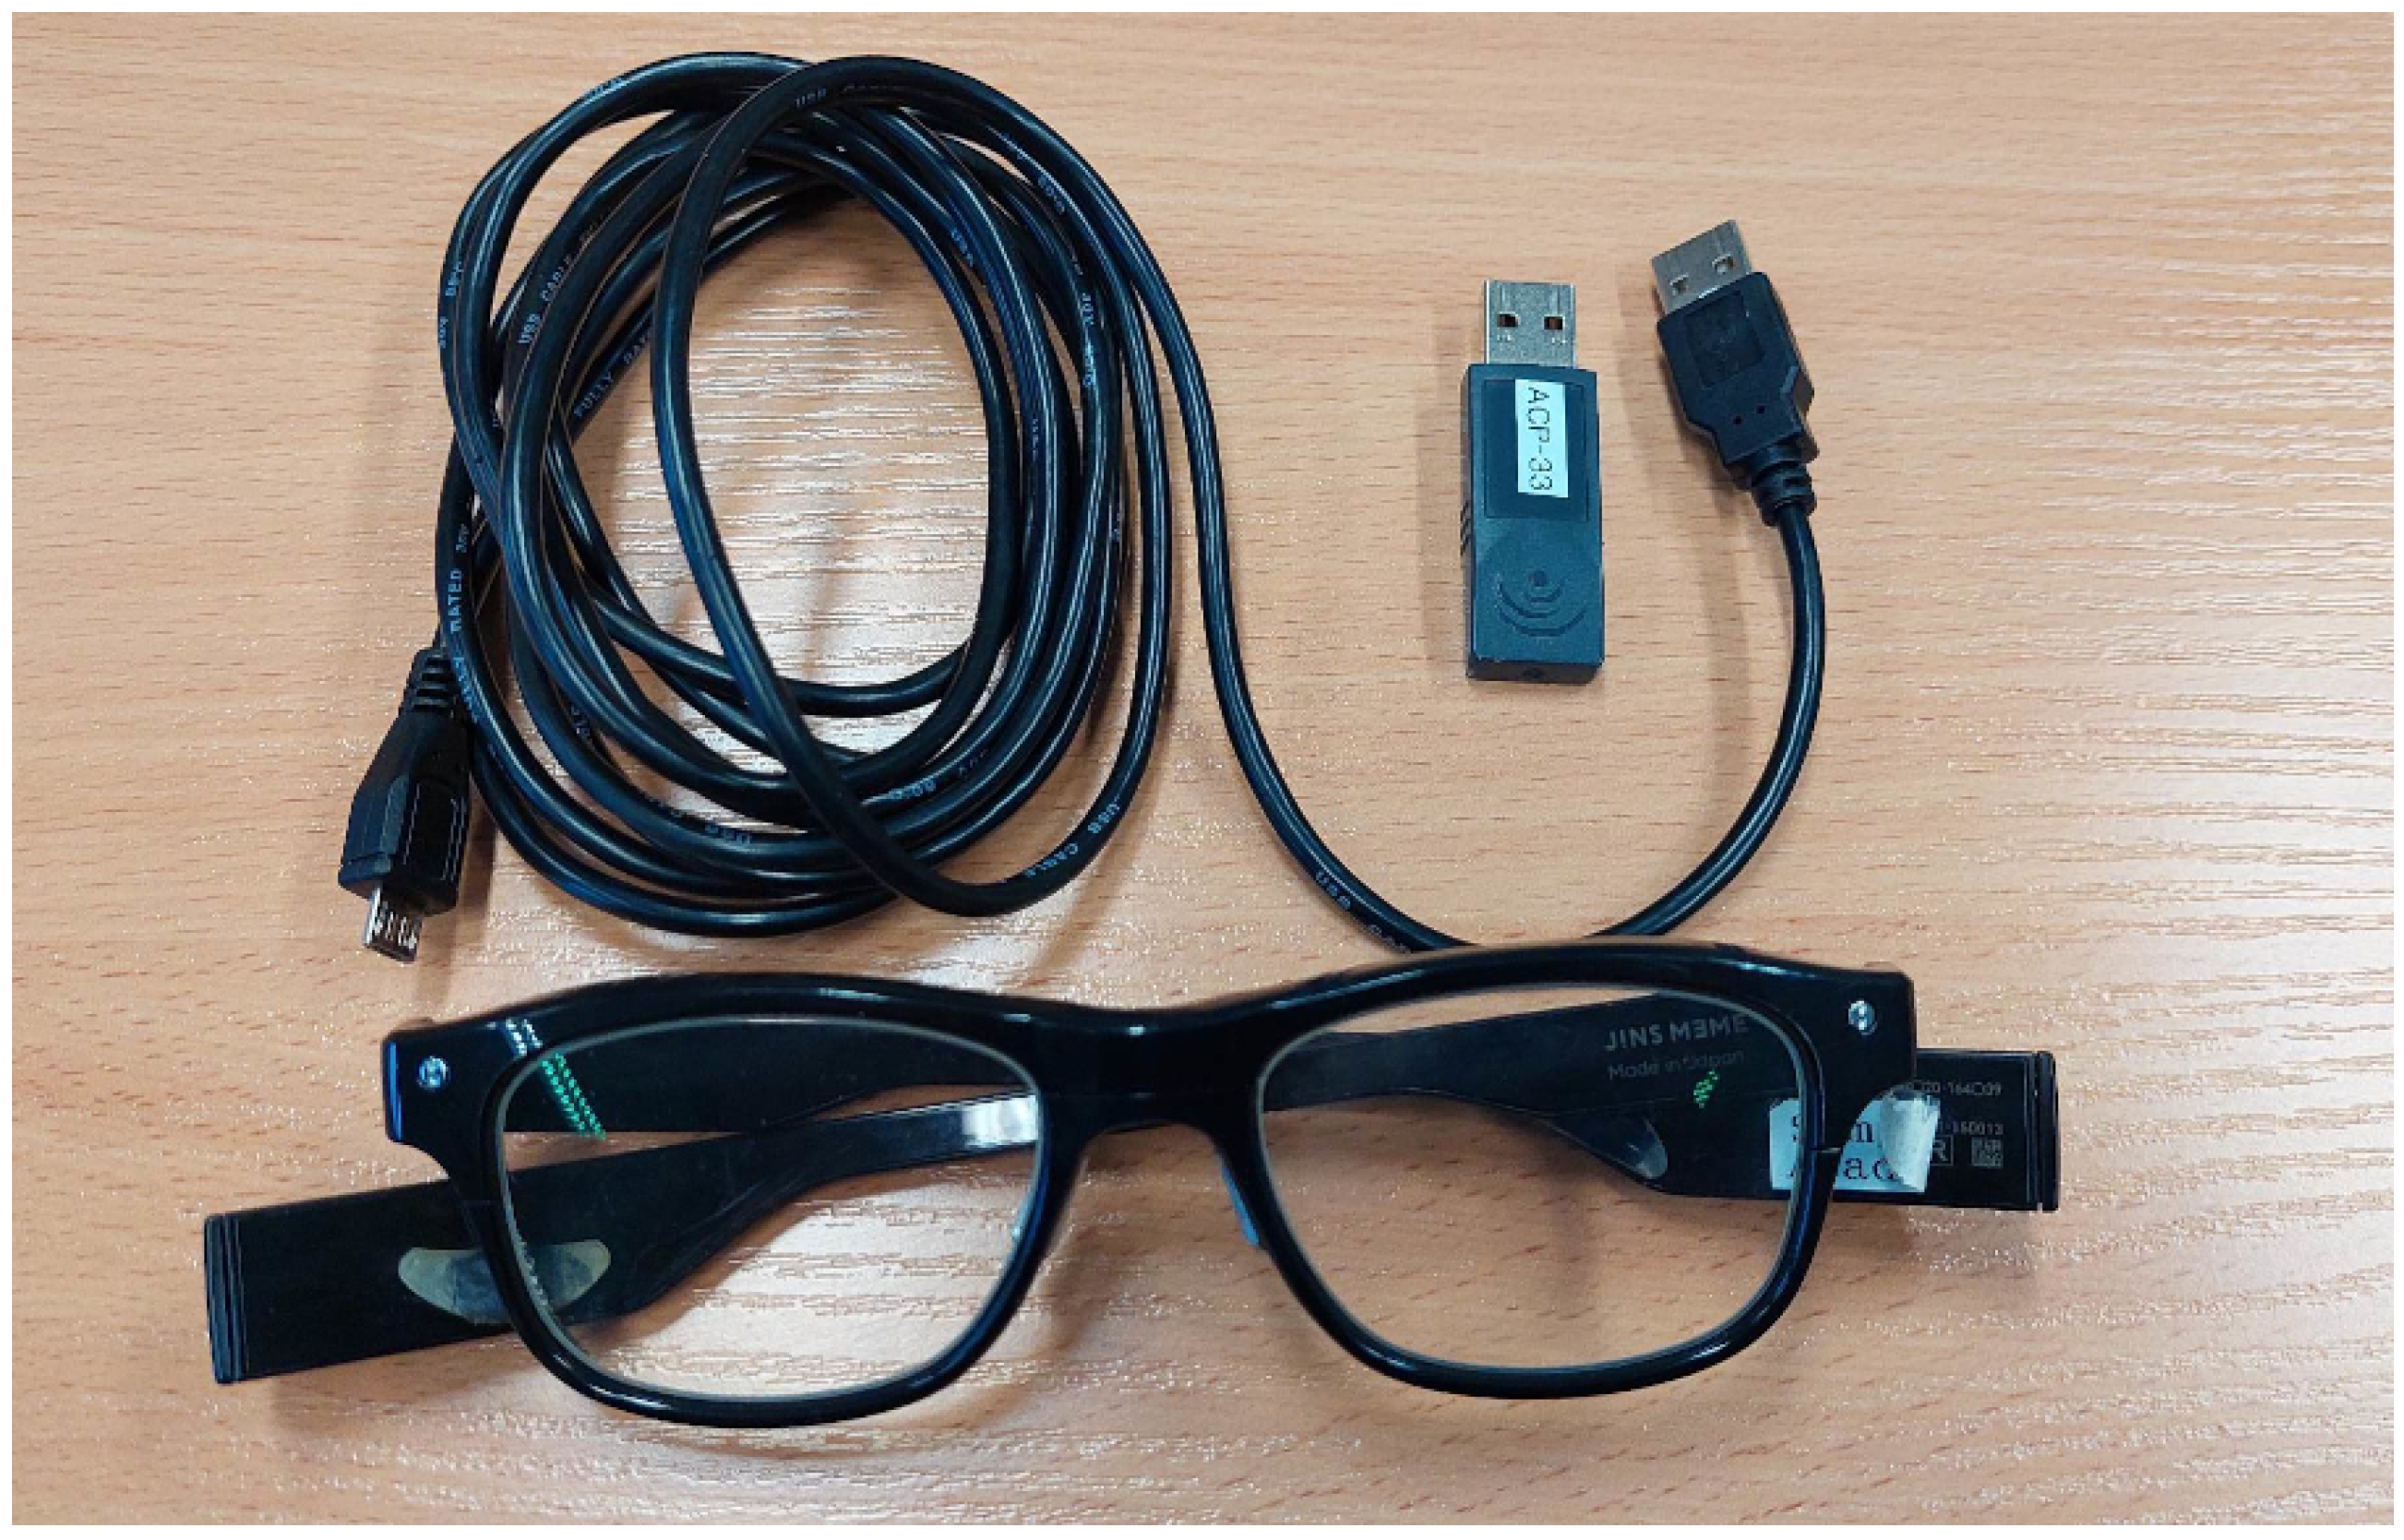
Figure 2.
Experimental setup
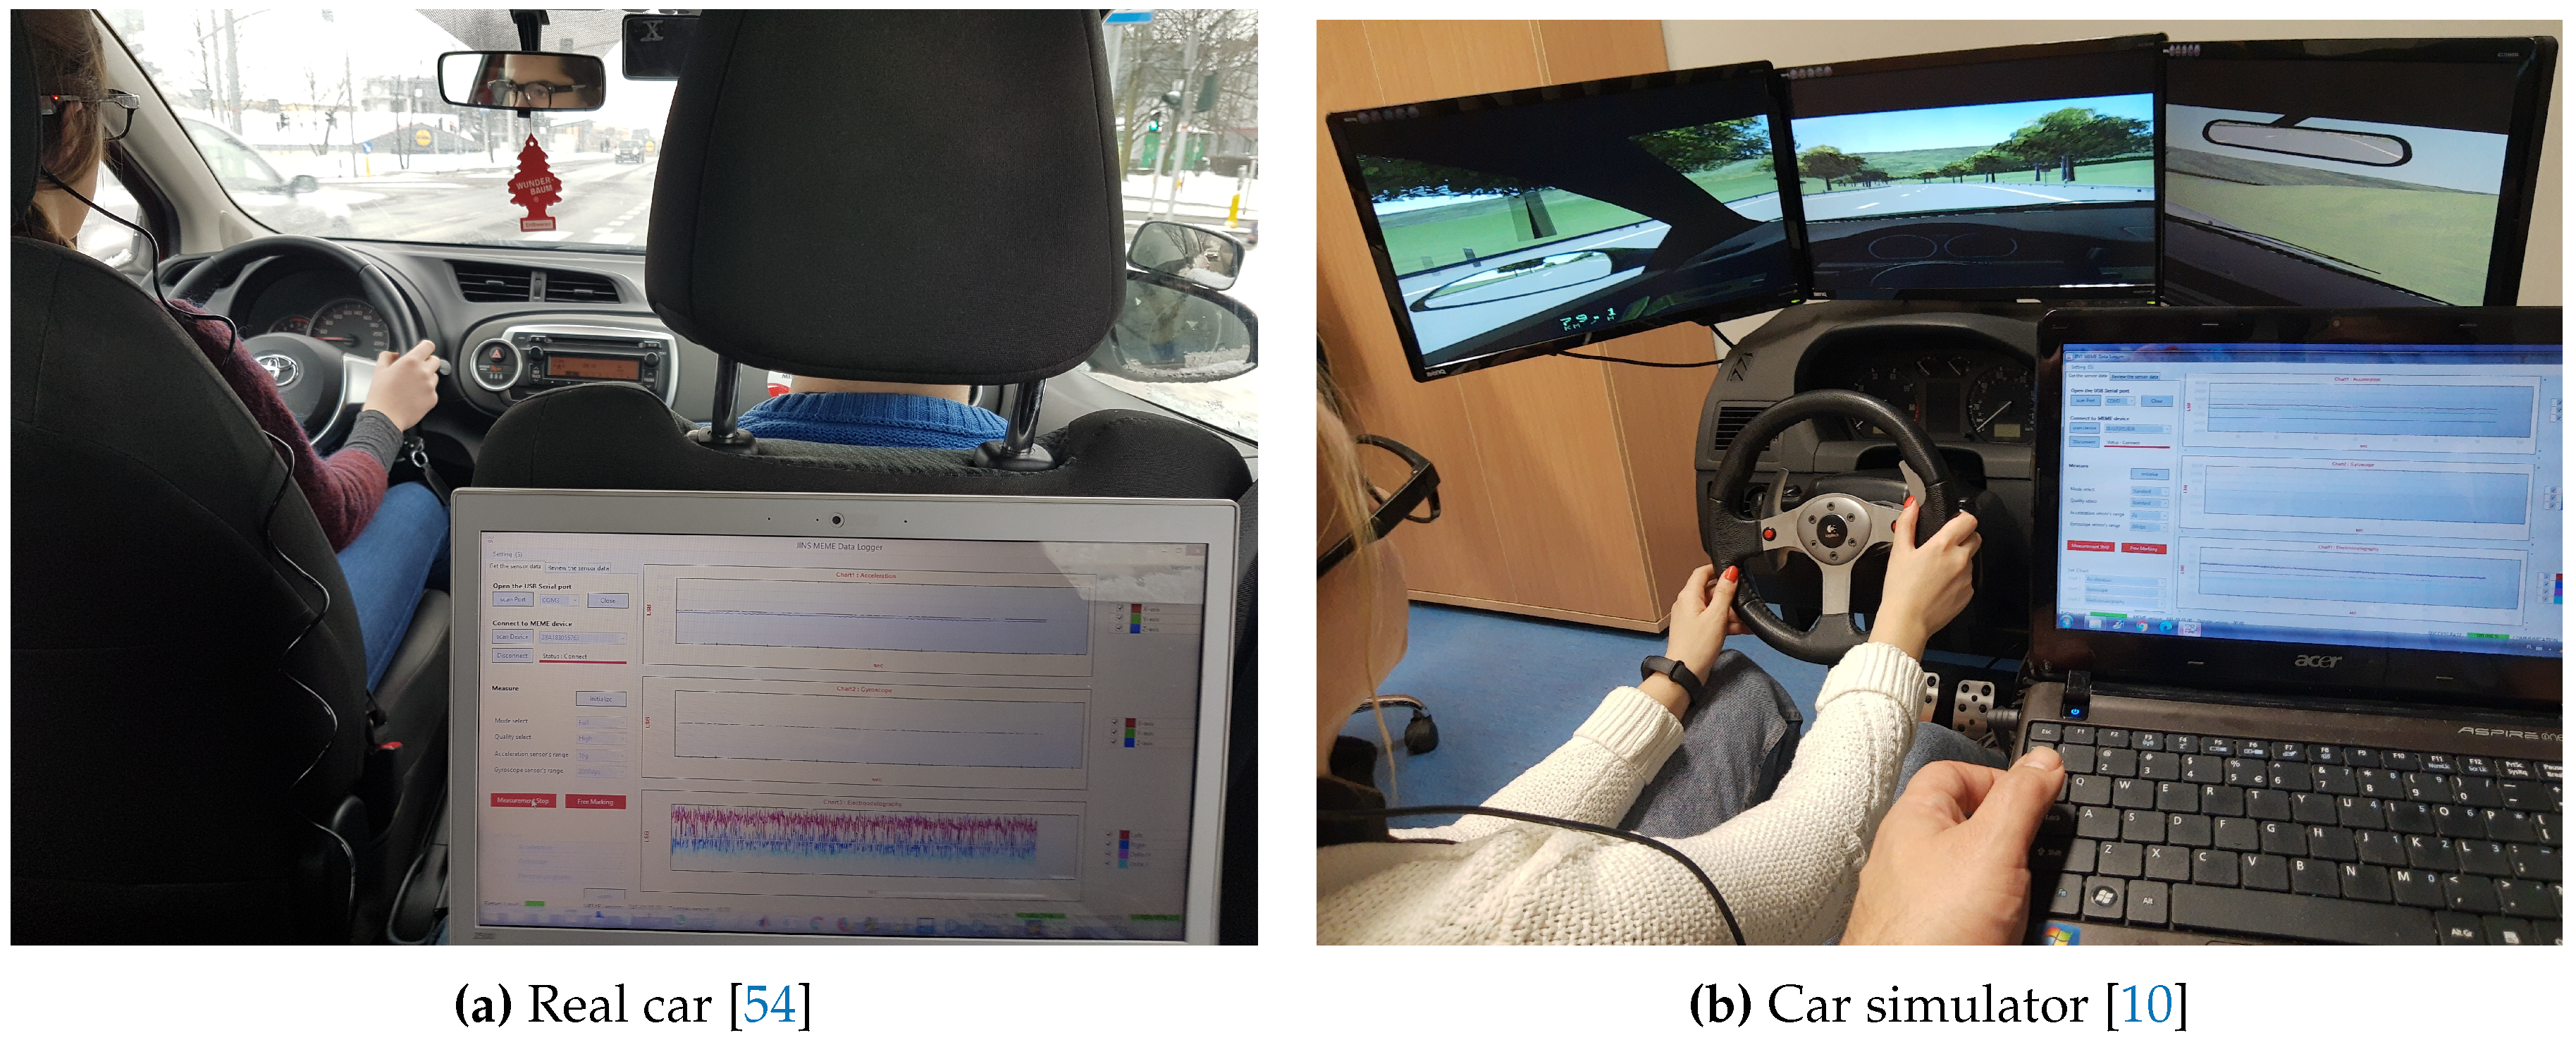
Figure 3.
Distribution of cross-correlation coefficients.
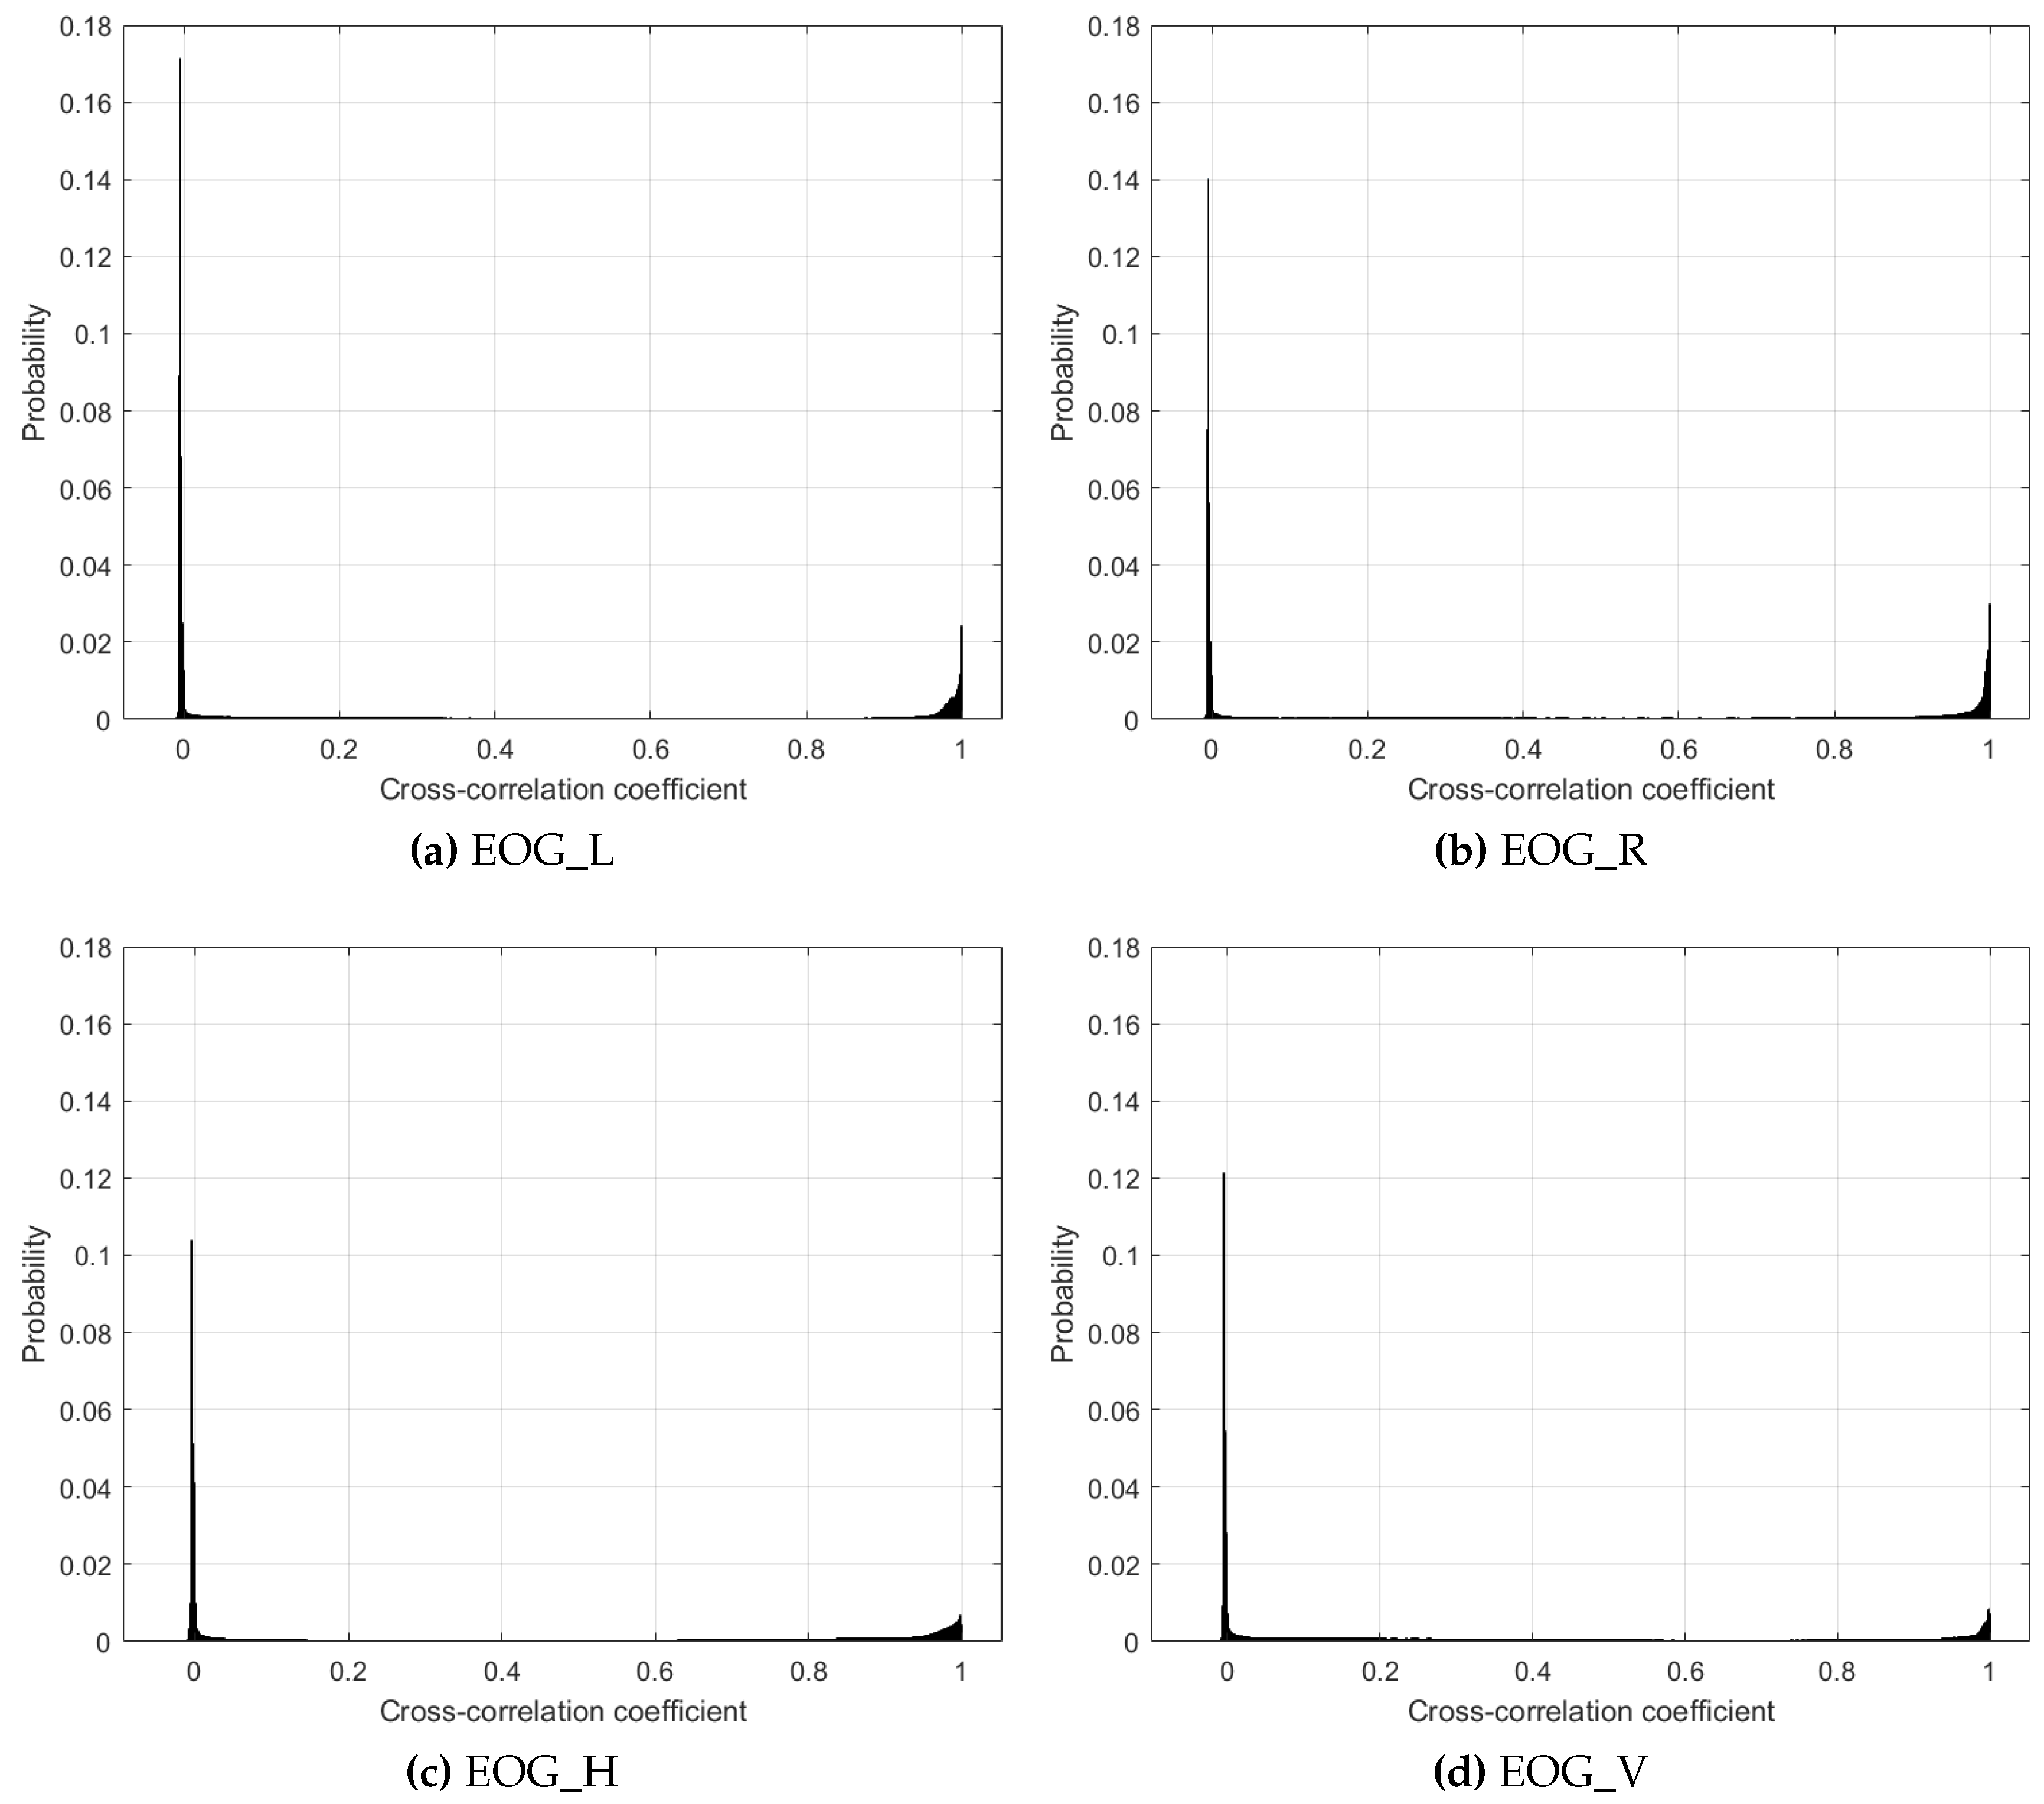
Figure 4.
Distribution of mean cross-correlation coefficients.
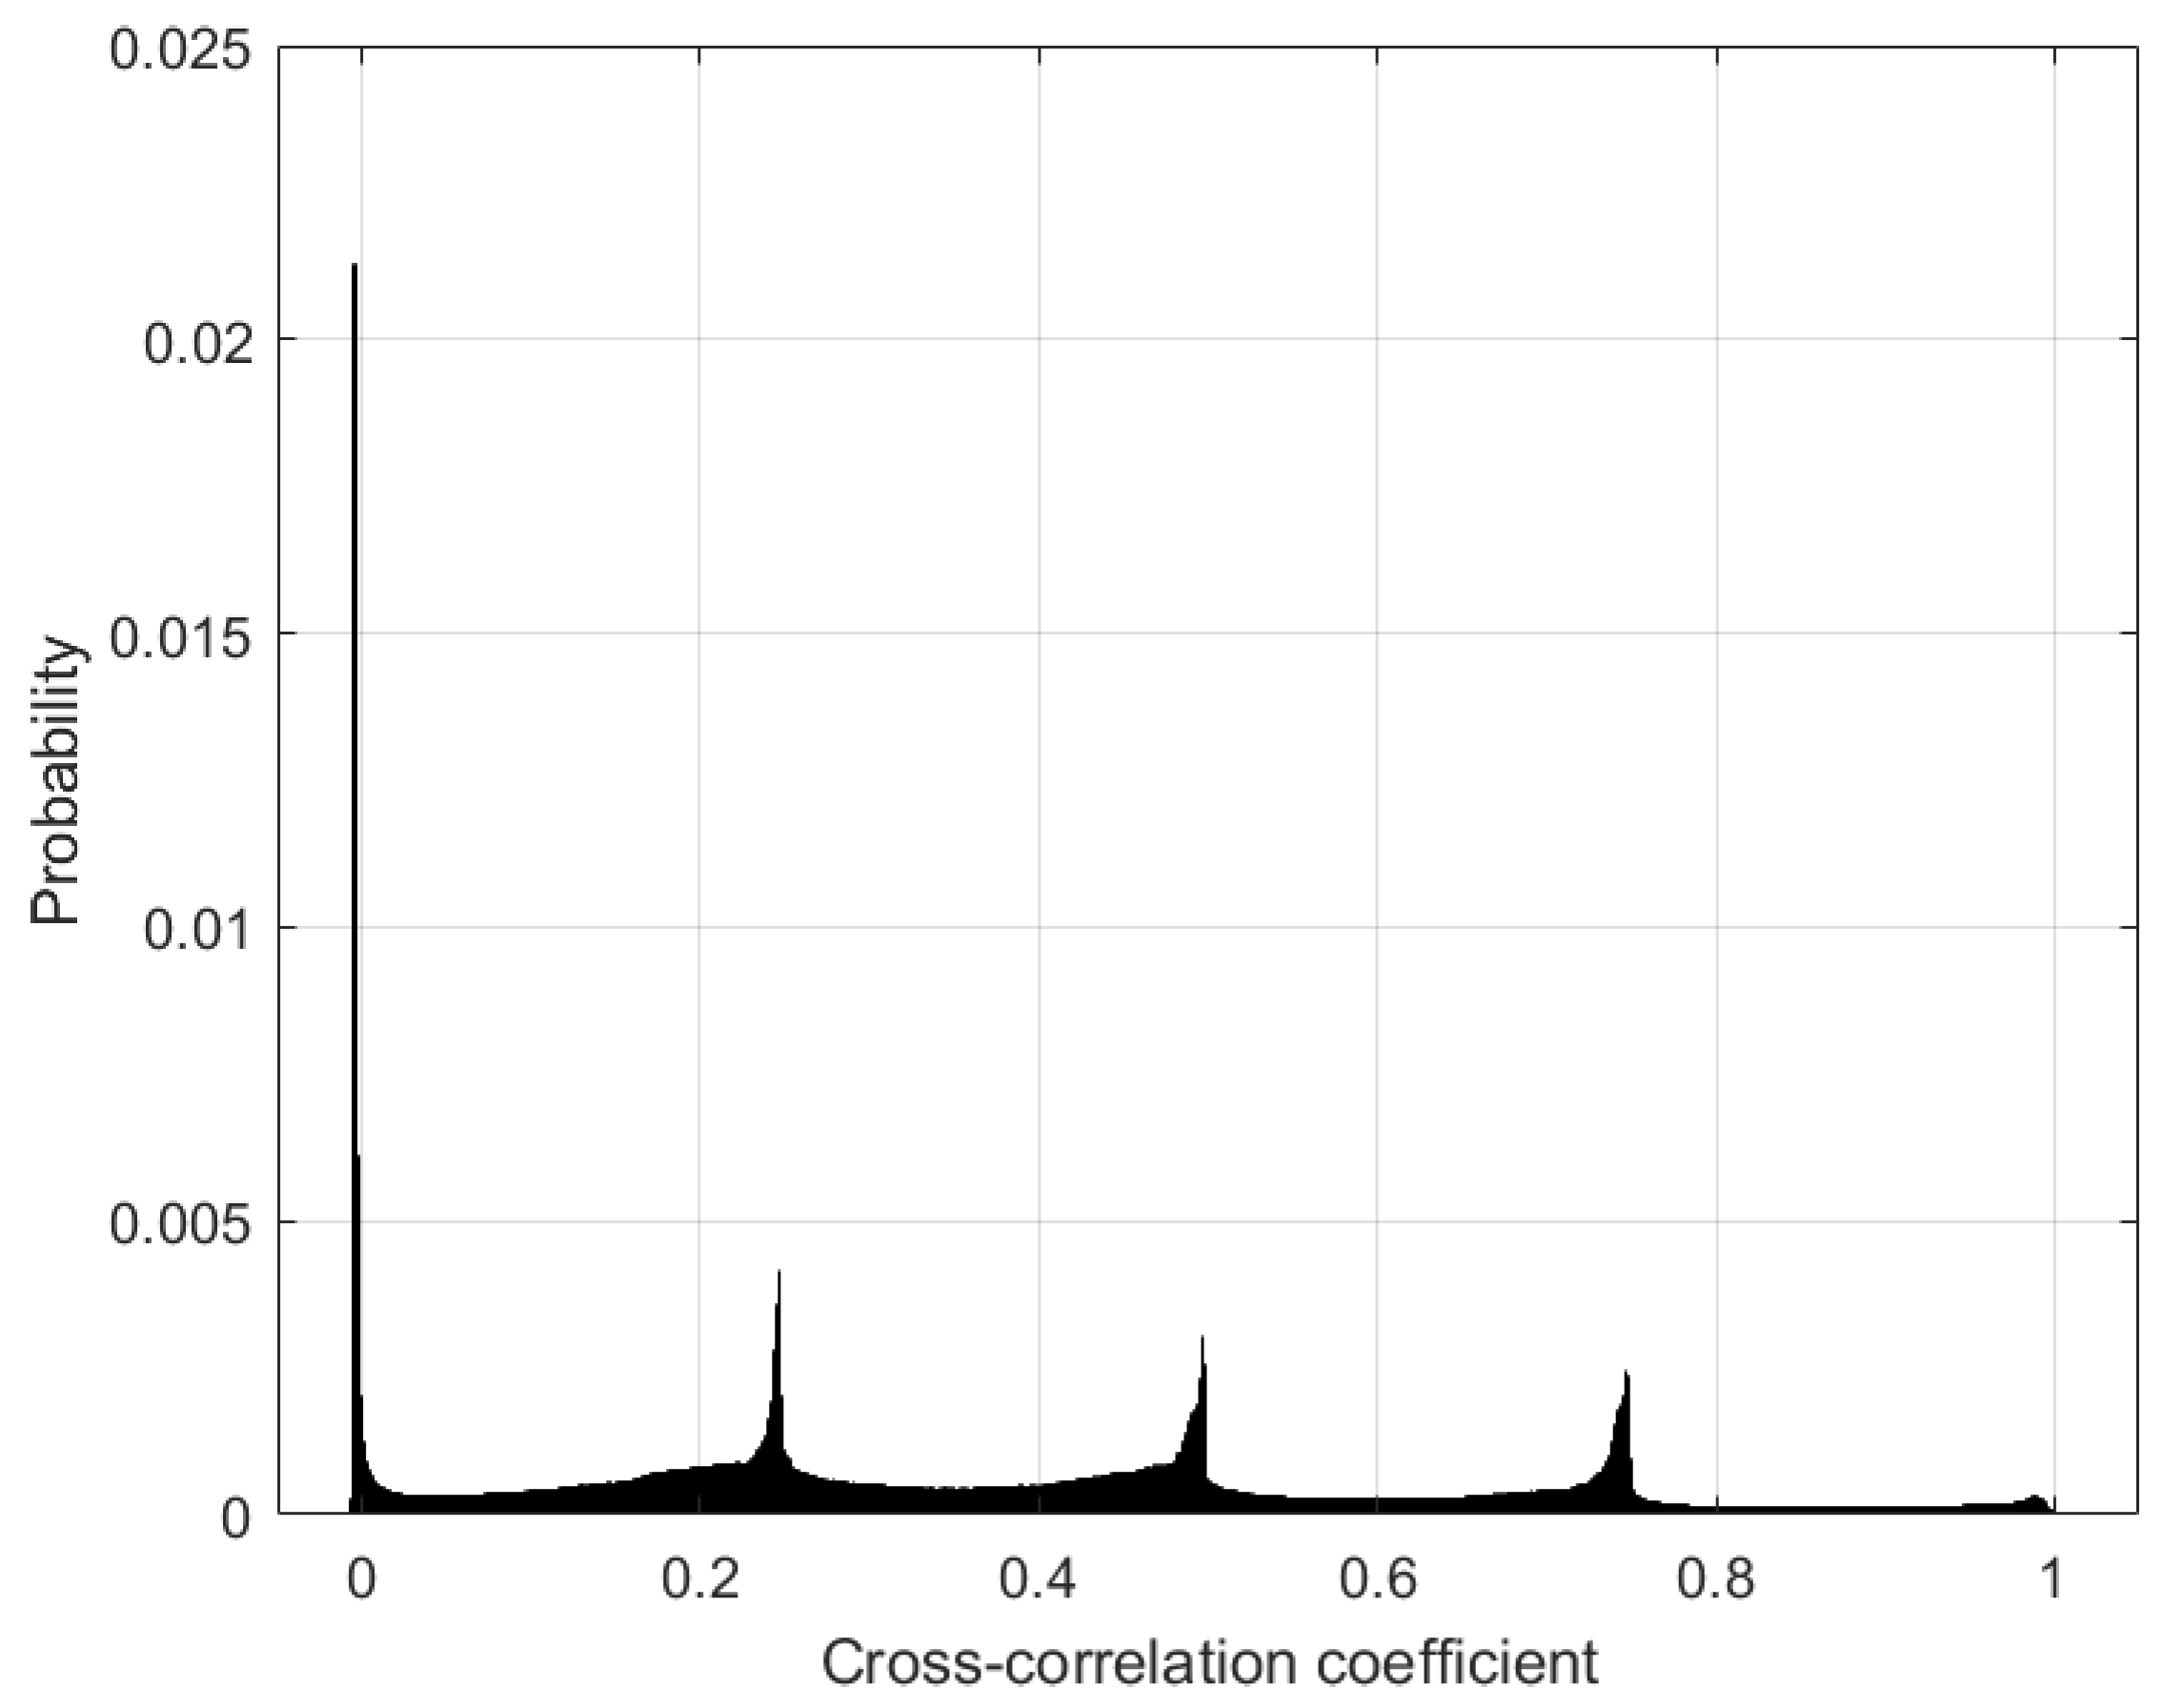
Figure 5.
Data distribution in the datasets among training iterations.
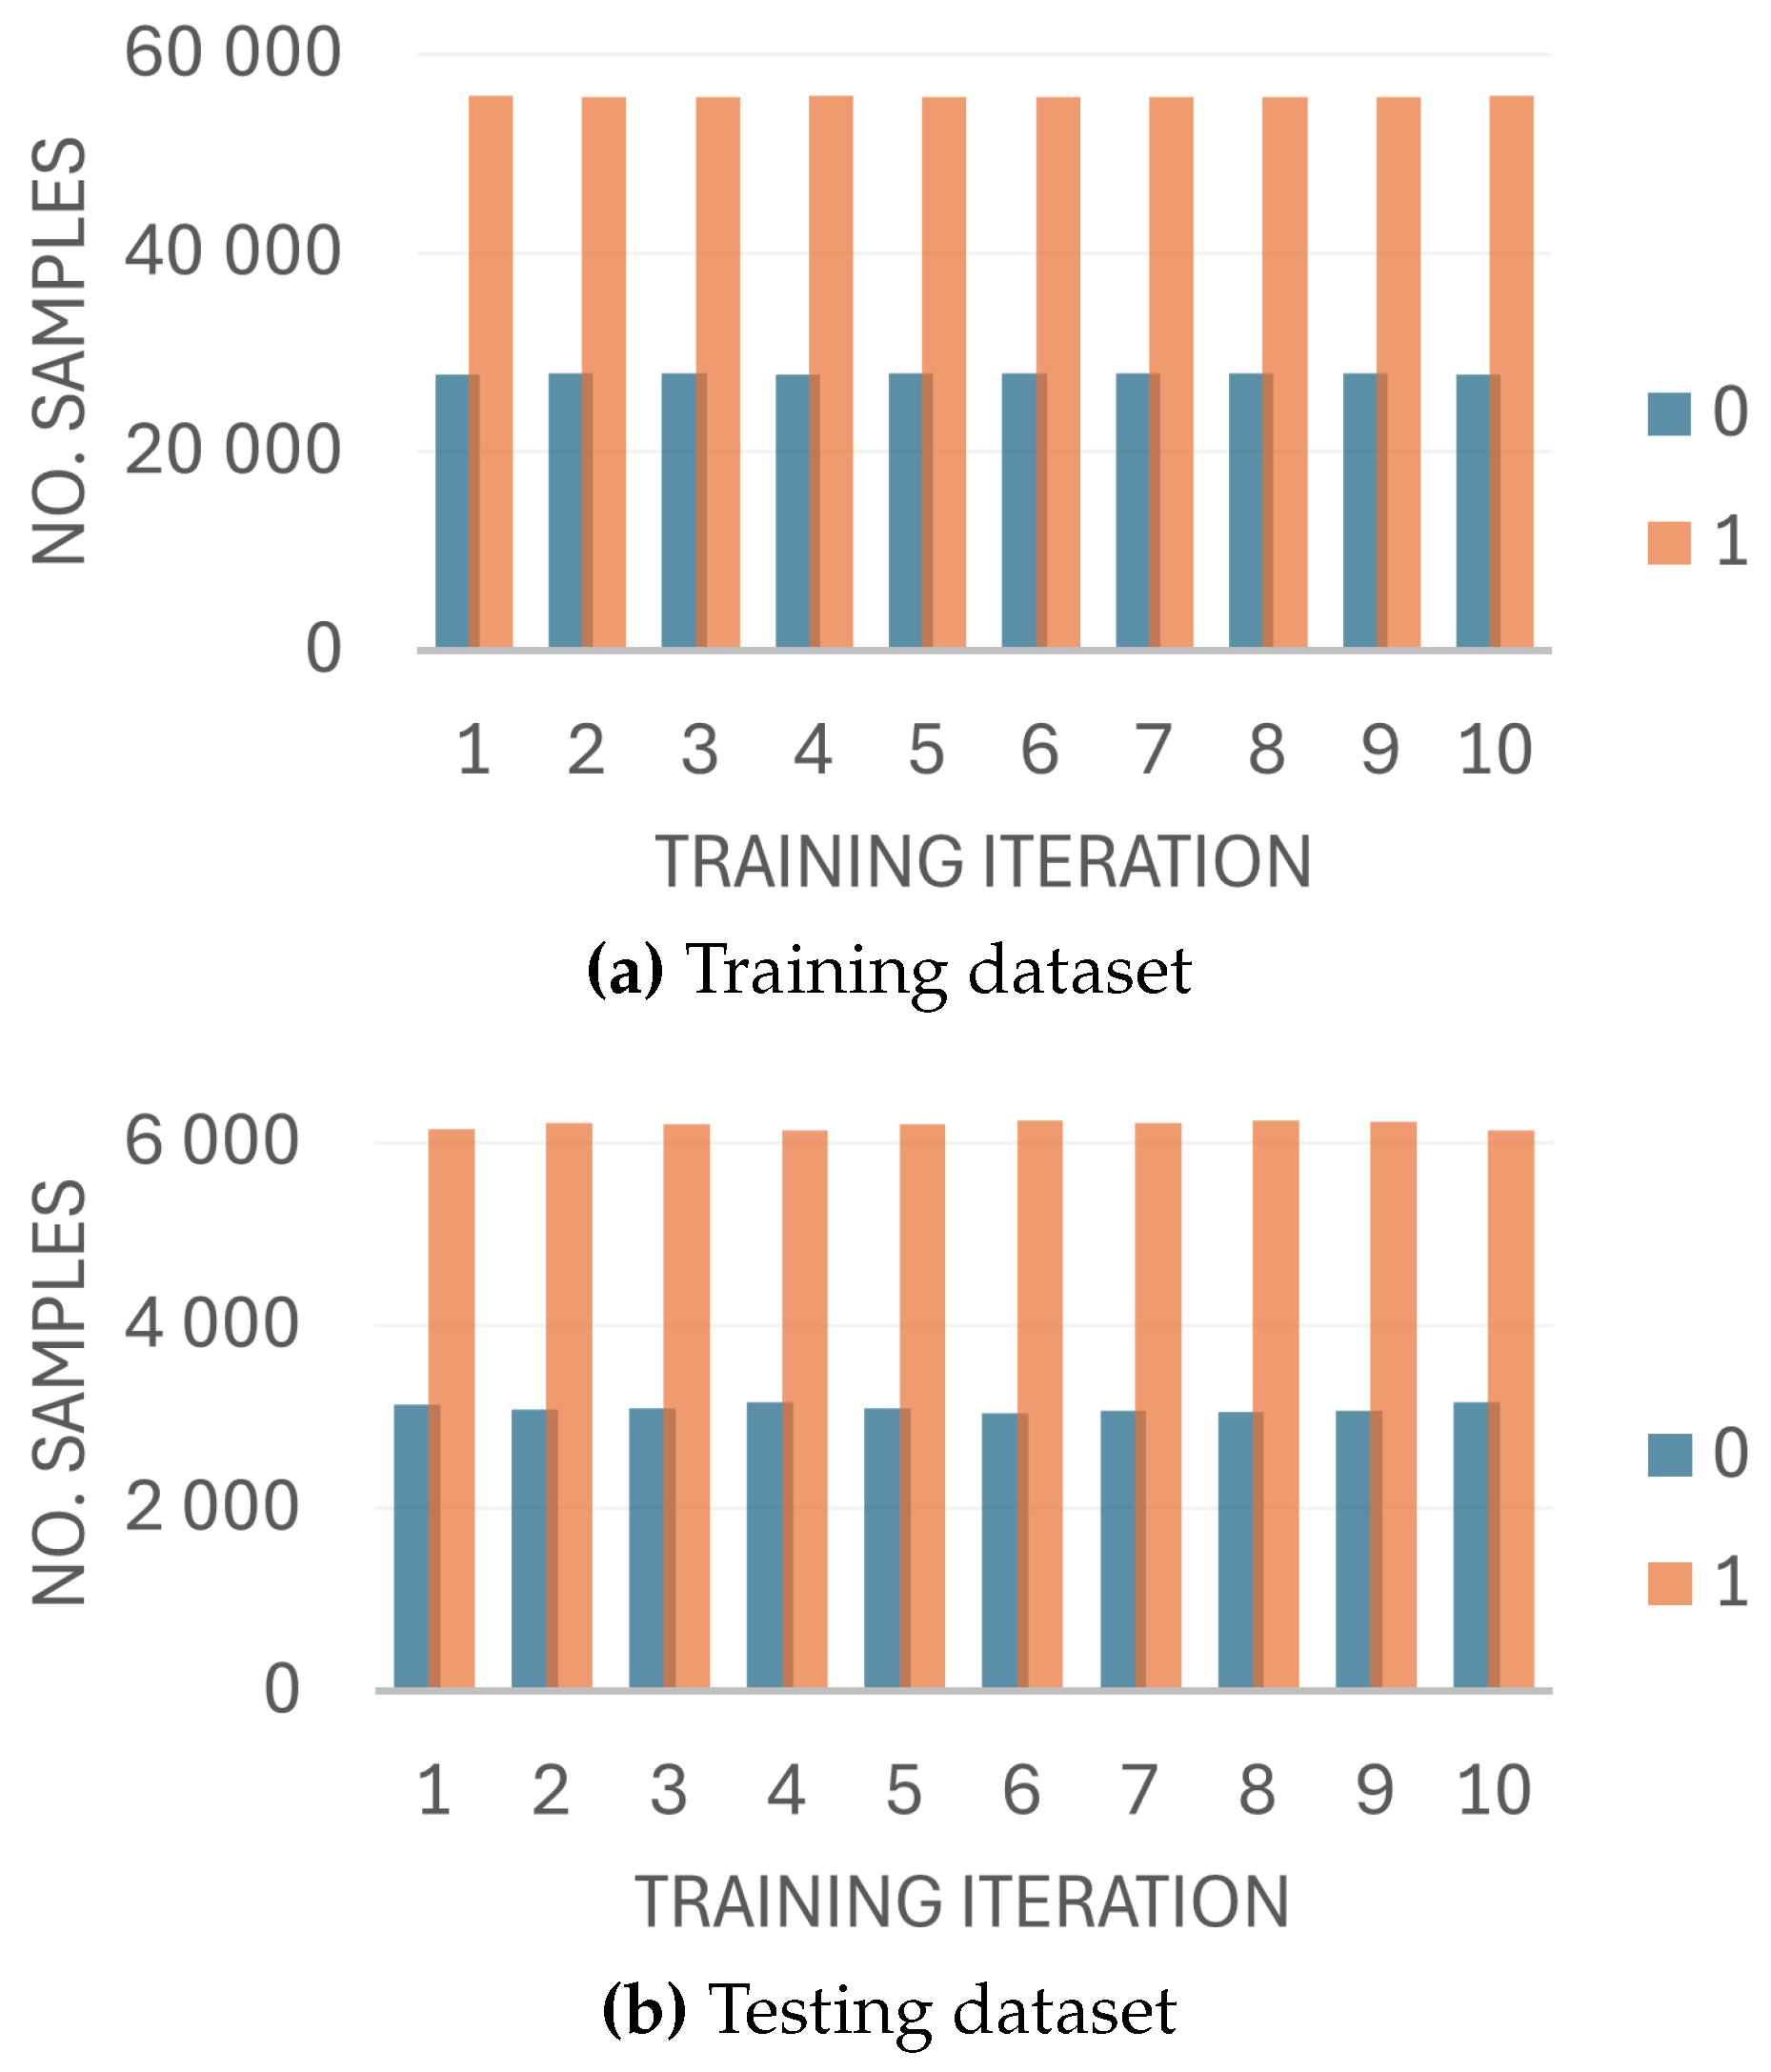
Figure 6.
Accuracy and loss among iterations – average values from ten learning iterations.
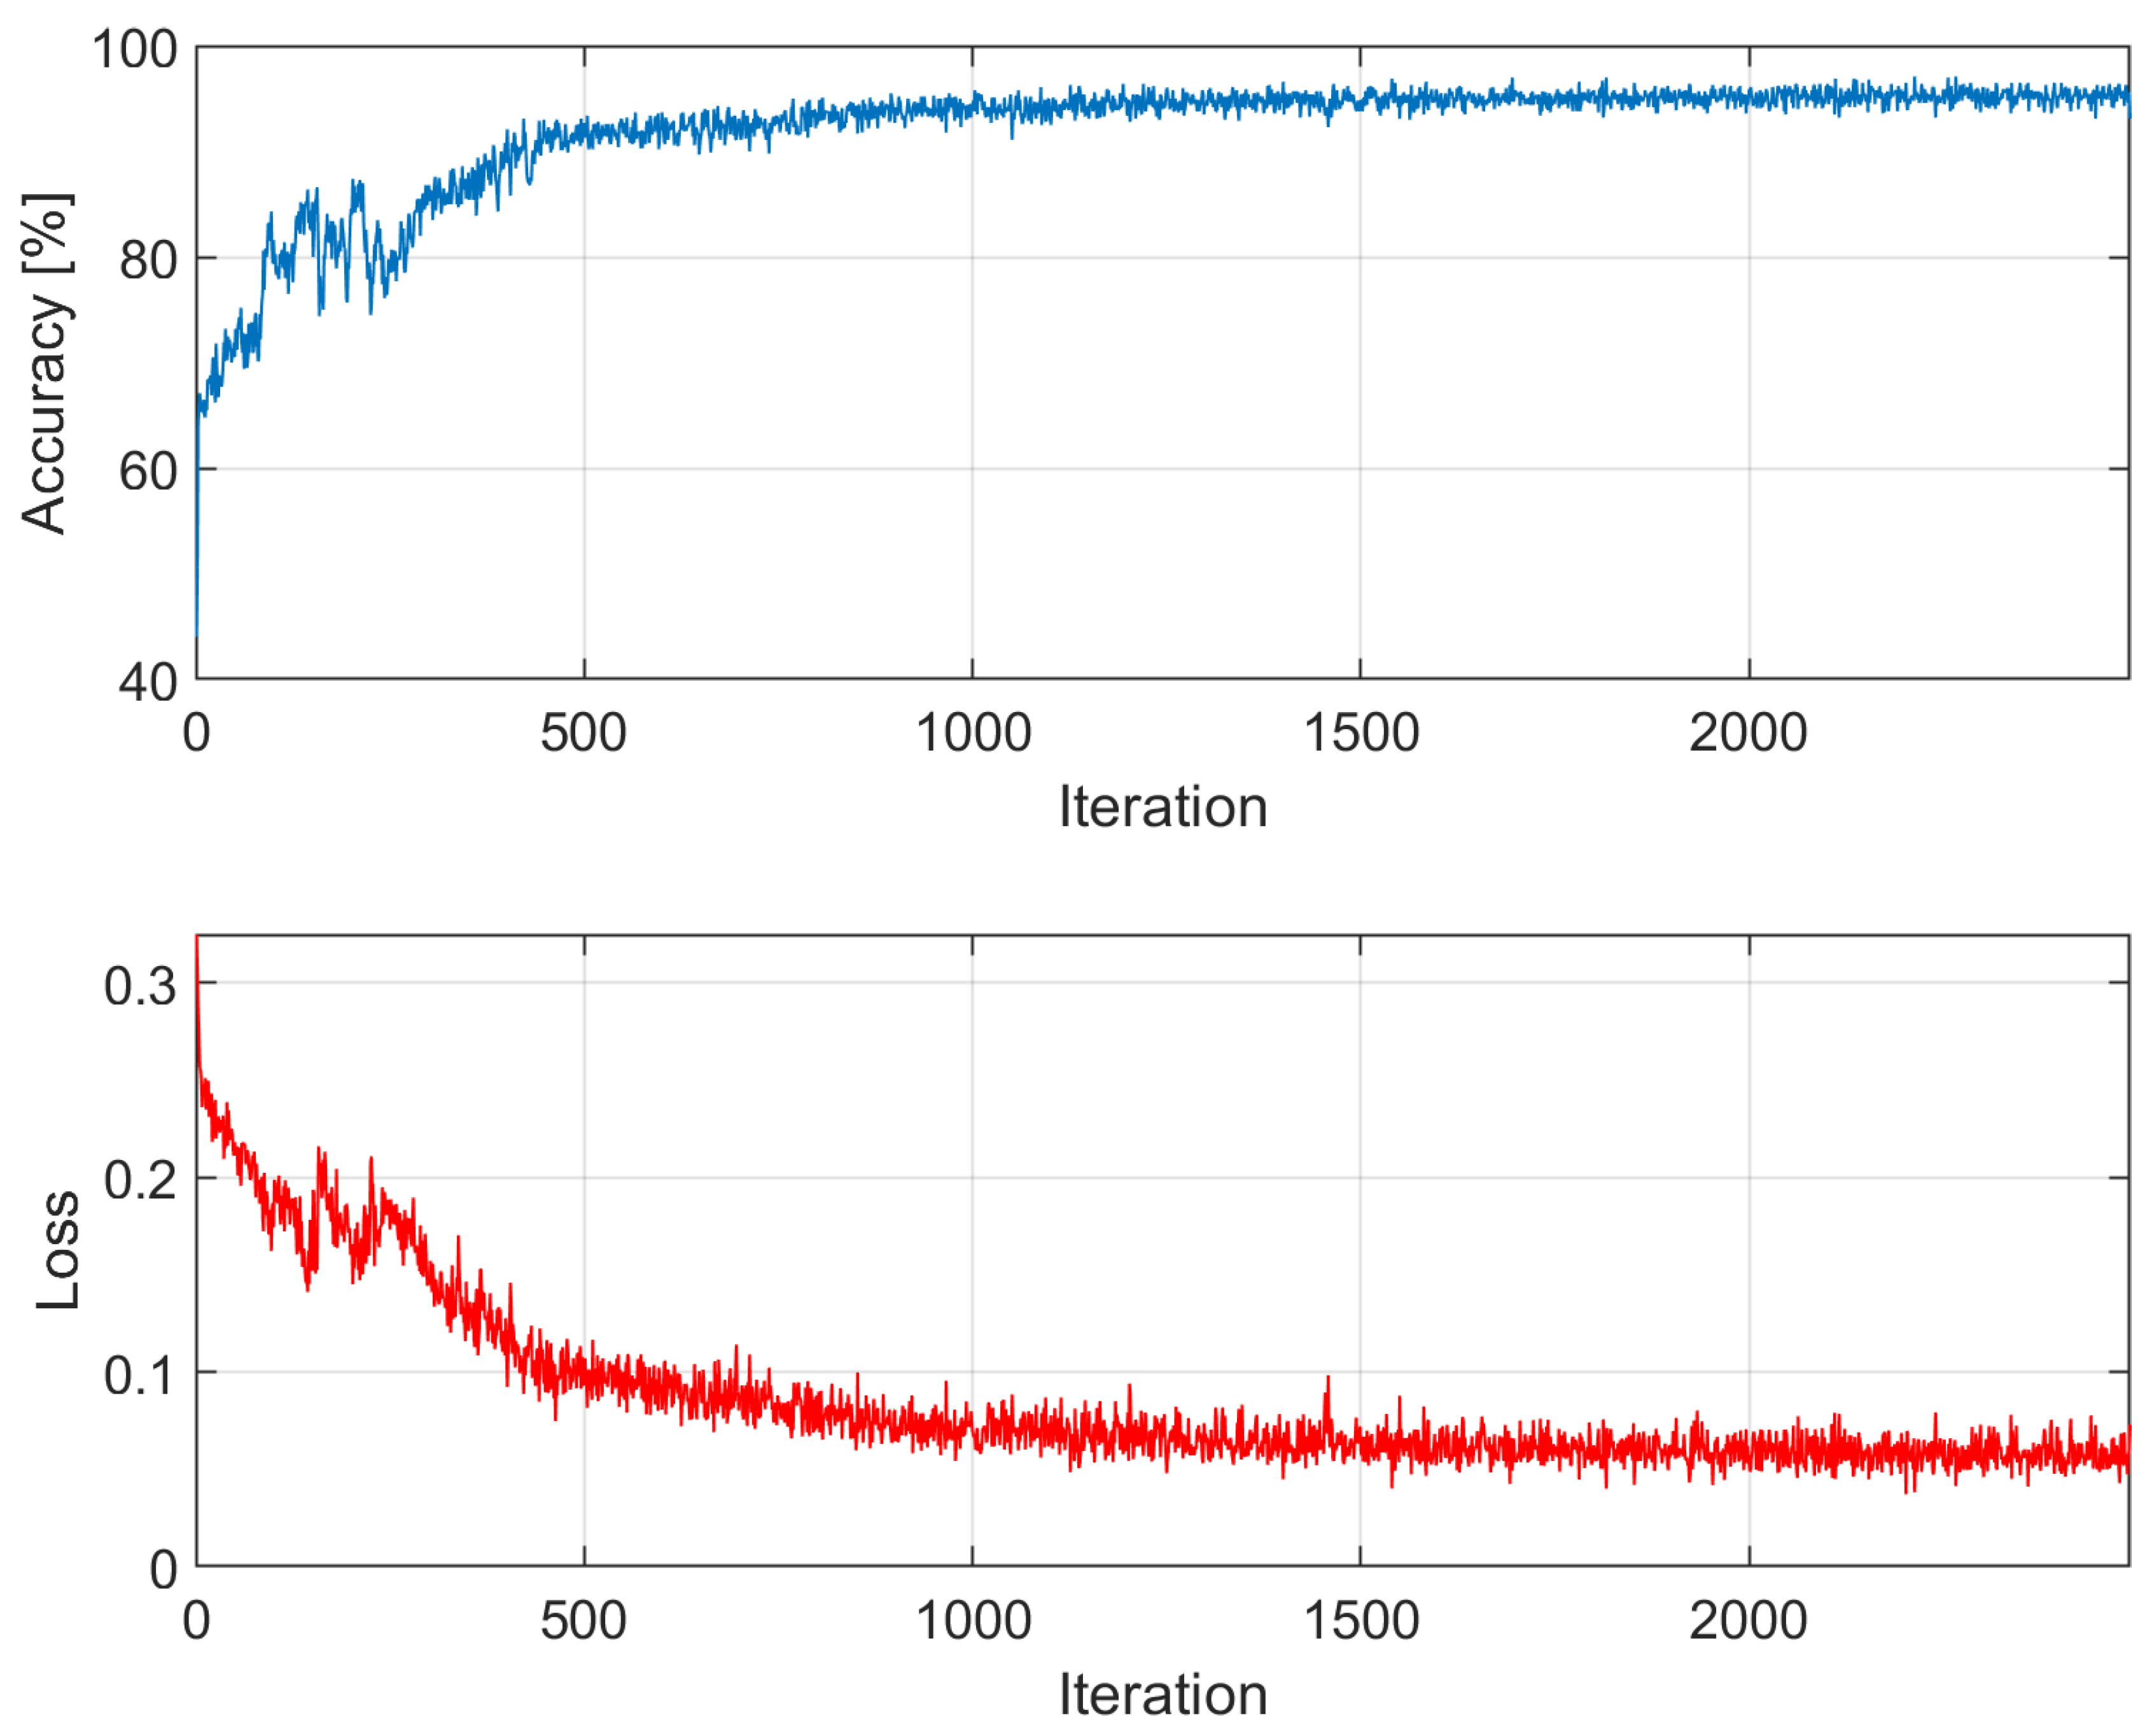
Figure 7.
Confusion matrix on test dataset (mean ± standard deviation).
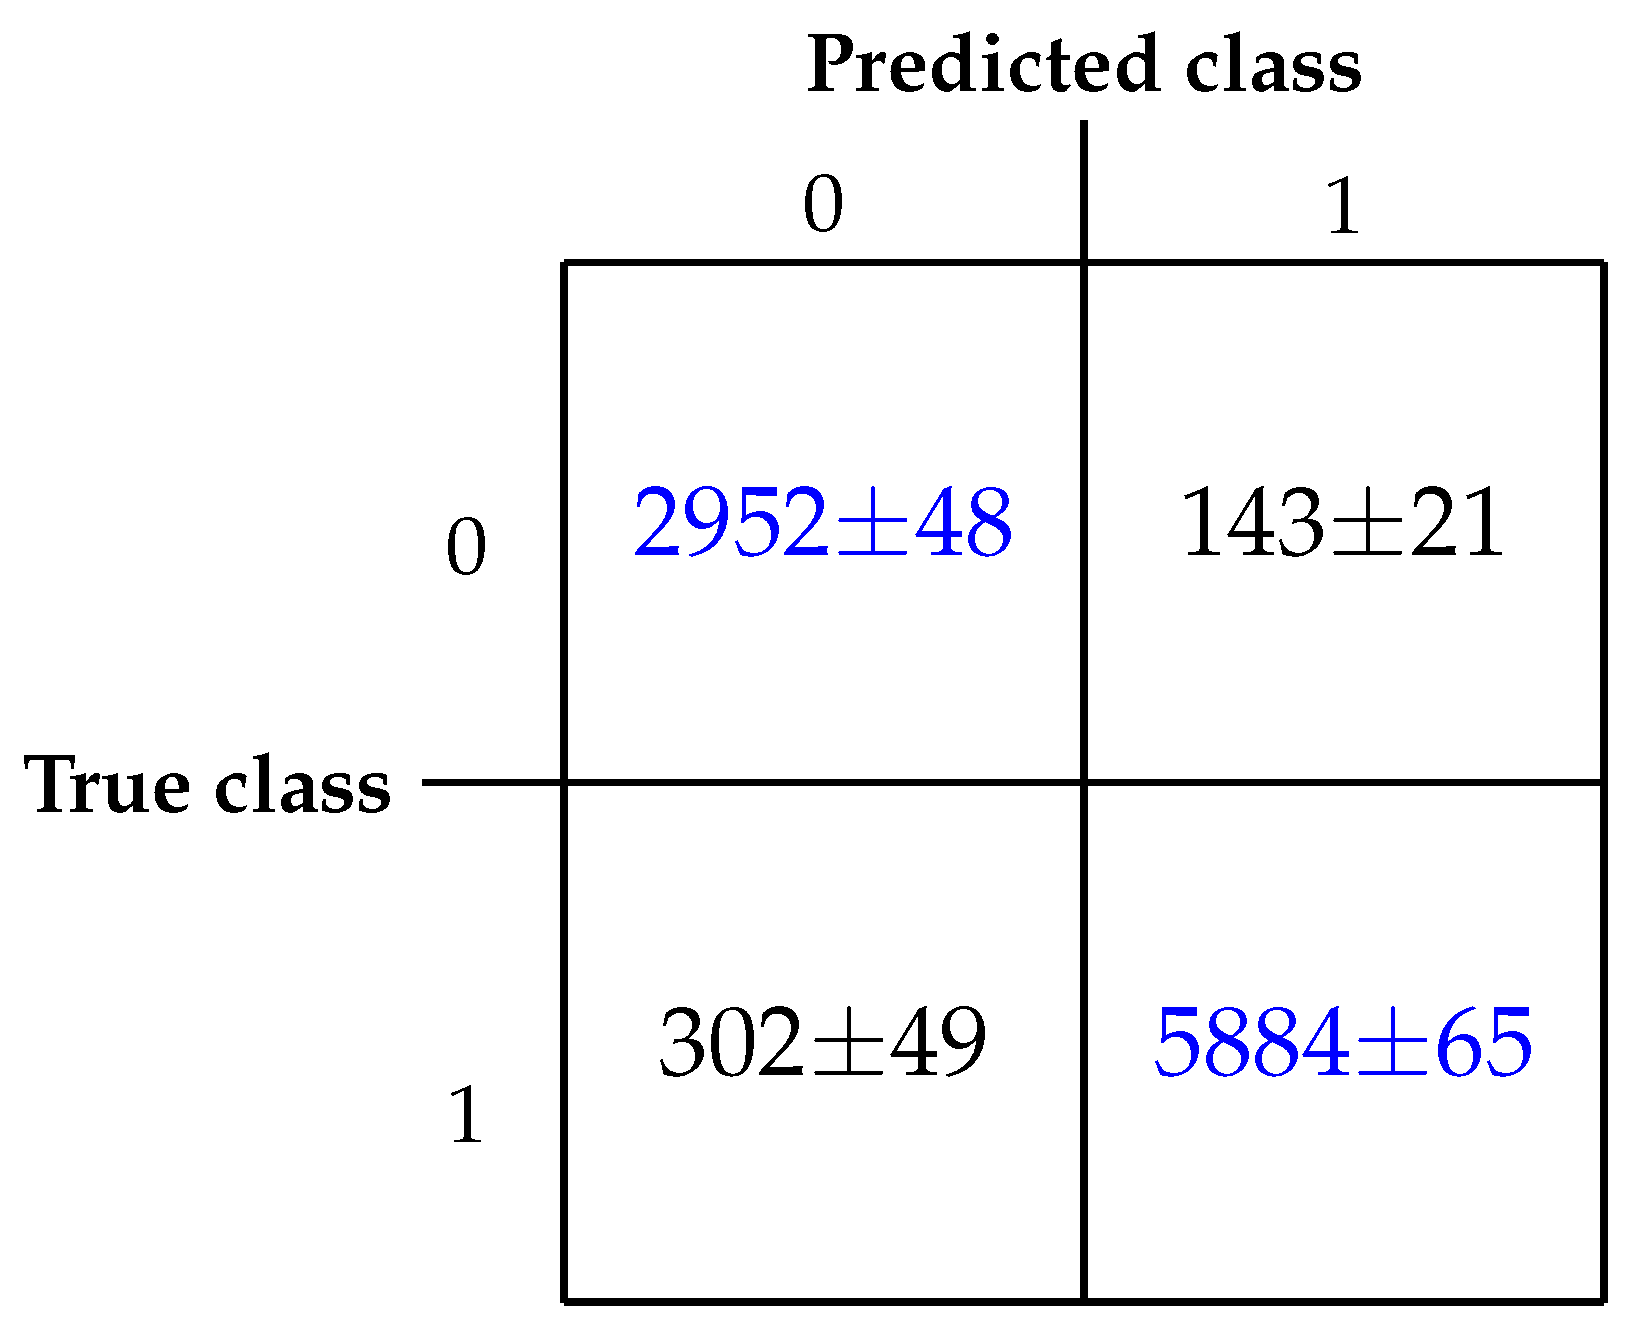

Table 1.
Cross-correlation coefficient statistics
| Channel | Minimum | Maximum | Average |
|---|---|---|---|
| EOG_L | -0.0264 | 1.0000 | 0.3460 |
| EOG_R | -0.0262 | 1.0000 | 0.4311 |
| EOG_H | -0.0420 | 1.0000 | 0.3896 |
| EOG_V | -0.0478 | 1.0000 | 0.3252 |
| Average | -0.0135 | 1.0000 | 0.3252 |
Table 2.
Classification report.
| Training iteration | Accuracy | Recall | Specificity | Precision | F1-score |
|---|---|---|---|---|---|
| 1 | 94.58% | 95.15% | 94.28% | 89.45% | 92.22% |
| 2 | 95.25% | 95.36% | 95.20% | 90.79% | 93.01% |
| 3 | 96.16% | 96.38% | 96.05% | 92.40% | 94.35% |
| 4 | 95.51% | 95.06% | 95.75% | 92.00% | 93.50% |
| 5 | 94.55% | 95.32% | 94.17% | 89.10% | 92.10% |
| 6 | 94.96% | 94.19% | 95.34% | 90.79% | 92.45% |
| 7 | 94.87% | 94.99% | 94.80% | 90.04% | 92.45% |
| 8 | 95.87% | 96.43% | 95.59% | 91.45% | 93.88% |
| 9 | 94.52% | 94.91% | 94.33% | 89.18% | 91.96% |
| 10 | 94.82% | 95.89% | 94.27% | 89.62% | 92.65% |
| Average | 95.21% | 95.38% | 95.12% | 90.72% | 92.99% |
Disclaimer/Publisher’s Note: The statements, opinions and data contained in all publications are solely those of the individual author(s) and contributor(s) and not of MDPI and/or the editor(s). MDPI and/or the editor(s) disclaim responsibility for any injury to people or property resulting from any ideas, methods, instructions or products referred to in the content. |
© 2024 by the authors. Licensee MDPI, Basel, Switzerland. This article is an open access article distributed under the terms and conditions of the Creative Commons Attribution (CC BY) license (http://creativecommons.org/licenses/by/4.0/).
Copyright: This open access article is published under a Creative Commons CC BY 4.0 license, which permit the free download, distribution, and reuse, provided that the author and preprint are cited in any reuse.


