
Submitted:
20 April 2024
Posted:
22 April 2024
You are already at the latest version
Abstract
The Urban heat island (UHI) effect has evolved into one of the key environmental problems affecting urban ecological environment and sustainable development. Based on 52 Urban Thermal Heat spots (UTHSs) with significant differences between land use structure and UGI spatial layout within the influence range of UHI in Shanghai, Landsat-8/9 satellite images were used to construct a high-dimensional data set reflecting the impact of built environment components on urban thermal environment. Descriptive statistical analysis was used to analyze the spatial difference qualitatively. Using stepwise regression model and partial least square regression (PLSR) model, the complex response relationship between UGI pattern differentiation and urban thermal environment in three spatial stratification ranges of UTHSs was quantitatively analyzed. Overall, the statistical explanatory power of the partial least square regression PLSR model is due to the stepwise regression model. The PLSR model points out that moderately increasing the average building height, CA, PLAND, LSI and LPI play a positive role in inhibiting/slowing down the growth of LST (land surface temperature), and the cooling effect of index weights decreases in order. However, the interaction effects of CA×Cohesion×AI×LPI and PLAND×CA×Cohesion×AI×LPI exert relatively small weight on the cooling effect, and according to the results, suggestions such as UGI structure and urban construction layout optimization can effectively alleviate the urban heat island effect are proposed.
Keywords:
urban heat island effect
; urban green infrastructure
; land use pattern
; climate adaptation
1. Introduction
Since the modern industrial revolution, the process of global urbanization has accelerated. Urban areas exhibit significant high-temperature characteristics compared to rural background areas, forming the urban heat island effect (UHI effect) [1,2,3]. Usually, compared to rural areas with lower land development intensity, urbanized areas have a dense population and buildings, and there is fierce competition for urban development land. A large amount of original natural and semi natural surfaces is replaced by artificial structures with hard paving materials (impervious surfaces), such as buildings, roads, squares, bridges, etc. [4]. This severely imbalanced land use structure significantly changes the thermal energy storage and re-emission process, sensible/latent heat distribution, and heat flux of the underlying surface in urban areas [5], leading to a continuous increase in heat storage within the city [4,6]. As a result, cities are exposed to the risk of frequent high temperatures, posing a huge threat to the urban ecological environment, social economy, and human health [1,7,8,9,10]. The formation of urban heat island effect is closely related to human activities and land use/cover conditions at the micro and mesoscale (spatial scope of urban built-up areas). But at the macro scale, it is mainly closely related to the background climate conditions [11,12]. In the context of global warming, the combined impact of large-scale heat waves induced by climate change and local scale heat island effects further exacerbates the vulnerability of urban ecosystems [11,12]. The UHI effect has evolved from a simple climate phenomenon to one of the key environmental issues affecting urban ecological environment and sustainable development [13,14,15].
Urban Ecological Infrastructure (UGI) is a common cost-effective and environmentally friendly regulation strategy based on ecosystem services among mitigation technologies to reduce urban heat island effect within the city [16,17,18]. These infrastructure cover three levels: natural, semi natural, and artificial, including green infrastructure, water systems, and other aspects, interacting with other components of the city [19]. Numerous studies indicate that as important components of ecological services, green spaces and water can regulate climate, purify air, and conserve soil and water, which can suppress urban warming to some extent [20,21].
As a highly urbanized area, Shanghai is significantly affected by urban heat island effect. Shanghai has implemented corresponding energy conservation and emission reduction plans, but at the local/micro scale, especially in densely populated areas such as the central city, there is no industrial layout, taking these measures is futile [22,23]. Therefore, by means of environmental remote sensing, statistical modeling and other methods, this study takes Shanghai as an example to explore the impact of the imbalance of the existing UGI spatial layout on the urban thermal environment and the response relationship. To provide referential basis and measures for improving urban thermal environment and enhancing urban resilience [24,25,26].
2. Materials and Methods
2.1. Study Area
The research area is located on the east side of the Yangtze River Delta, with a planned area of 8,368 square kilometers. As China's economic center and mega-city, the permanent population reached 24.8943 million by the end of 2021. The region belongs to the East Asian subtropical monsoon climate, four distinct seasons, the climate is mild and humid, the annual average rainfall is 1097.3 mm, the annual average temperature is 15.2~15.7℃[27].
Due to the high density of population and buildings in Shanghai, in the process of urban development, the existing UGI composed of green space and water is insufficient, and the spatial allocation is unbalanced, which is difficult to fundamentally curb the influence of UHI effect [28].
Refer to previous research papers on the intensity and scope of urban heat island impact in Shanghai [14,29,30,31], 52 Urban Thermal Heat spots (UTHSs) with significant differences in land use structure, architectural form, green space and water configuration were selected in this study (Figure 1). The relatively concentrated spatial range of UGI is taken as the core area, and according to the accessibility requirements of residents to the green space in Shanghai urban green space system planning [32] (a public green space can be reached 500 meters outside), the surrounding 500m range is taken as the buffer area, and the core area plus the buffer area is taken as the whole area.
2.2 Data Sources
In this study, high-resolution land use maps, Sentinel-2 L1C multispectral data images, Landsat-8/9 OLI/TIRS images and building contour data covering the spatial scope of 52 study areas were used as the main data sets. In addition, together with the digital city thematic products of downtown Shanghai, two online high-resolution satellite imagery platforms (91Weitu Map and Tianditu map) and in-situ field survey data are used as auxiliary data sets. Table 1 lists the descriptive information of these data sets.
2.3 Methods
2.3.1 Data Preprocessing
In this study, the GCS (Geographic coordinate System) of Landsat-8/9 OLI/TIRS images was converted to universal Mercator UTM_Zone_50N projection coordinates to ensure the same geographic coordinate system. Then, radiometric calibration is performed on the 10th band of Landsat-8/9, and the Digital Number (DN) of the image needs to be converted into absolute radiation brightness, so as to obtain the true reflectivity. Finally, the vector data of Shanghai administrative division is used as the boundary for cutting.
2.3.2. LST Remote Sensing Inversion and Generation of Sharpening Products
LST has been widely used to evaluate urban thermal environment and UHI effect [34,35], in order to obtain LST data, the radiative transfer equation (RTE) method was used in this study for surface temperature inversion.
Firstly, this paper uses random forest classifier and support vector machine classifier based on machine learning to identify and classify land use cover types in Shanghai, and finally generates high-precision LULC products in Shanghai with a resolution of 20 meters and an accuracy rate of 89.30-93.50%. Based on this high-precision product, the classification-based emissivity method (CBEM) was used to estimate the surface emissivity (LSE), while the unsharped-thermal infrared image resolution of Landsat-8/9 OLI/TIRS was 30m. Therefore, a data set of 5 million to 3 million random points with a distance of 20 meters was constructed in the study area, and the maximum atmospheric radiation (TOAR) value data of Landsat-8/9 band and 10 band were extracted, and then adopt ordinary kriging spatial interpolation analysis. The generated reconstructed data output is resampled to 30m, overlapping with the original 30m TOAR data layer. The minimum root-mean-square error (RMSE) of 100,000 randomly generated data point pairs was used to determine the optimal sampling point value, and the fitting data with a resolution of 20m was obtained.
Then, according to the known surface specific emissivity and atmospheric profile parameters such as atmospheric upwelling, downwelling radiation and transmission measured by satellite, the radiative transfer equation is used to deduce the radiation luminance of blackbody in the thermal infrared band. Based on the inverse function of Planck's law, the actual surface temperature is estimated.
2.3.3. Extraction of Main Variables/Indicators of Built Environment Affecting LST
Urban built environment is the characteristic of urban complex system, which covers many factors such as land use mode, human behavior and building form [36,37]. In this study, we constructed a high-dimensional dataset reflecting the complex influencing factors of the built environment. Due to the complexity of the built environment, two typical building indexes, the proportion of impervious surface area and the average building height, are selected. For the landscape pattern index on the UGI scale, combined with the research purpose and the accessibility, simplicity, representativeness and comparability of the measurement indicators, we selected 9 landscape pattern indicators for this study, all of which are shown in Table 2.
2.3.5. Statistical Analysis
First, in order to explore the complex relationship between predictor and response variables, exploratory data analysis (EDA) was used for predictor and response variables, including normality test, skew data transformation and correlation. Exploratory data analysis shows that the summer LST data of each year are consistent with the effective sampling of approximately normal distribution population, and the main variables of built environment may not be consistent with the normal distribution population sampling. The Box-Cox transformation was carried out on the data with skewed distribution in CA, IS, PLAND, PD, LPI, CLUMPY, COHESION, AI and Height to generate almost every transformation variable that followed the normal distribution, such as Box-IS and Box-PLAND.
Secondly, the three spatial levels of core area, buffer area and whole area are divided into five classes by systematic cluster analysis. Classes Ⅰ to Ⅴ are respectively highly urbanized areas, mediumly to highly urbanized areas, mediumly urbanized areas, slightly to mediumly urbanized areas and slightly urbanized areas. The Tukey postmortem test (HSD) is then applied to check the differences between them.
Third, in order to further quantitatively reveal the quantitative response relationship between LST and UGI under the influence of complex-built environment conditions, this study focuses on comparing and analyzing the applicability of stepwise regression and partial least squares regression (PLSR) statistical regression models in multiple regression categories. Based on the statistical regression model, the complex relationship between UGI multiple indicators, building indicators and LST was modeled, the weight of each indicator in reducing/inhibiting LST growth was quantitatively evaluated, and the response mechanism between LST and UGI was discussed under the complex characteristics of the built environment. In this study, all statistical processes were analyzed using the basic functions of R version 4.2.2 (R Core Team, 2022). PLSR analysis uses the "pls" library [39].
3. Results
3.1. The Relationship between UGI and LST under Different Spatial Stratification
Table 3 shows the overall trend of impervious area ratio, building construction area ratio and UGI area ratio of core area, buffer area and whole area. Combined with the analysis and comparison results of HSD.test, the differences in LST distribution are reflected in Figure 2. Table 3 and Figure 2 qualitatively show that the spatial distribution pattern of UGI under different regional types and spatial stratification has statistically significant differences, and has a significant impact on LST.
First, the order of impervious area ratio and building construction area ratio is buffer > whole area > core area, while the order of UGI area ratio is opposite. The average LST in core area, buffer area and whole area increased successively. The UGI pattern of the core area and the buffer area presents obvious imbalance and spatial discontinuity, and the LST of the core area is significantly lower than that of the buffer area, while the UGI distribution pattern and LST of the whole area are closer to that of the buffer area, indicating that the UGI and LST of the whole area mainly depend on the UGI spatial layout of the buffer area.
Secondly, from the perspective of different types of areas, the proportion of impervious surface (IS) area and building construction area of the core area and buffer zone from class Ⅰ to class Ⅴ generally shows a gradually decreasing trend, and the proportion of UGI area generally shows a gradually increasing trend. At the three spatial levels, the LST of the five classes decreased successively, which was consistent with the spatial distribution pattern of UGI. The error in individual years is within acceptable limits. The results show that the urban development intensity of class V is low, the ecological infrastructure is good, the UGI area ratio is high, the IS and the building area ratio is low, resulting in low LST value.
3.2. Response of LST to UGI Pattern in UTHSs Range
Figure 3 quantitatively shows the correlation of LST among the three spatial layers and the results of unitary nonlinear regression analysis. Among the three regions, the correlation between the buffer area and the whole area is the most significant, followed by the correlation between the core area and the whole area, and finally the correlation between the buffer area and the core area. This further verifies the influence of UGI spatial pattern on LST, and the spatial pattern difference between the core area and the buffer area is large, and UGI in the core area does not play a good cooling effect on the surrounding area.
In general, the three spatial layers have a high degree of consistency. However, as can be seen from the scatter distribution in Figure 3, the data in some regions deviates from the 95% confidence interval. In Figure 4, satellite image maps of 10 typical UTHSs are selected to reflect the land use in the core area and the surrounding 500m buffer zone of the 10 typical areas. In combination with the LST distribution map in Figure 5, different land development modes and their impacts on the urban thermal environment are shown. In low-temperature areas (Senlan Lake, Gucun Park, etc.), vegetation and water bodies dominate the core areas, and UGI has high continuity in the region;high-temperature areas (Poly Champagne Garden and Riverside Garden) are dominated by dense buildings with low vegetation coverage, UGI is only concentrated in small blocks, and the spatial connectivity is poor. From the perspective of spatial stratification, the vegetation coverage rate of the core area of Longhua Martyrs Cemetery is relatively high, and the surrounding green space has certain continuity with it, so LST has high consistency at the three spatial levels.
3.3. Quantitative Model Analysis of Pattern Response Relationship between LST and UGI
Table 4 shows the analysis results of the stepwise regression model as the basic model, and Table 5 to Table 7 shows the analysis results of the PLSR model of 52 regions within the whole area, core area and buffer area respectively. The stepwise regression model has a general fitting effect for different years, and can explain 53.94%~74.14% of the variance of LST. There is a gap between R-sq (pred) and R2, indicating that there may be overfitting of the model. In addition, independent variables such as CA, PD, LPI and Cohesion are not identified in the data of 2022. Other years also have the problem that the number of indicators introduced fluctuates greatly and is unstable. High VIF (VIF greater than 5) is common among several variables in the steped-regression model, indicating serious collinearity. Therefore, the statistical validity of the model is doubtful.

Table 4.
Analysis results of LST and predictor stepwise regression model.
| 2022 | 2020 | ||||||||||||||||
| Coef | SE Coef | T-Value | P-Value | VIF | Coef | SE Coef | T-Value | P-Value | VIF | ||||||||
| Constant | 49.145 | 0.443 | 110.953 | 0.000 | 45.634 | 1.364 | 33.465 | 0.000 | |||||||||
| CA | -5.452 | 0.989 | -5.515 | 0.000 | 3.152 | ||||||||||||
| IS | 0.000 | 0.000 | 12.289 | 0.000 | 1.348 | 0.000 | 0.000 | 9.747 | 0.000 | 8.184 | |||||||
| PD | 0.407 | 0.165 | 2.463 | 0.015 | 1.616 | ||||||||||||
| LPI | -0.642 | 0.217 | -2.961 | 0.004 | 16.625 | ||||||||||||
| Cohesion | 0.000 | 0.000 | 5.176 | 0.000 | 20.986 | ||||||||||||
| Height | -0.903 | 0.114 | -7.949 | 0.000 | 1.300 | -0.647 | 0.102 | -6.356 | 0.000 | 1.583 | |||||||
| SPLIT | 0.000 | 0.000 | 2.067 | 0.040 | 1.042 | ||||||||||||
| S | 1.48198 | 1.20508 | |||||||||||||||
| R-sq | 53.94% | 74.14% | |||||||||||||||
| R-sq(adj) | 53.02% | 73.08% | |||||||||||||||
| R-sq(pred) | 51.53% | 70.40% | |||||||||||||||
| 2017 | 2015 | ||||||||||||||||
| Coef | SE Coef | T-Value | P-Value | VIF | Coef | SE Coef | T-Value | P-Value | VIF | ||||||||
| Constant | 50.947 | 1.232 | 41.353 | 0.000 | 51.06 | 1.57 | 32.61 | 0.000 | |||||||||
| CA | -5.052 | 1.128 | -4.480 | 0.000 | 3.264 | -6.53 | 1.14 | -5.75 | 0.000 | 3.15 | |||||||
| IS | 0.000 | 0.000 | 8.856 | 0.000 | 7.916 | 0.000000 | 0.000000 | 9.39 | 0.000 | 8.18 | |||||||
| PD | 0.387 | 0.190 | 2.04 | 0.043 | 1.62 | ||||||||||||
| LPI | -0.428 | 0.235 | -1.822 | 0.070 | 15.508 | -0.396 | 0.249 | -1.59 | 0.114 | 16.63 | |||||||
| Cohesion | 0.000 | 0.000 | 4.584 | 0.000 | 15.968 | 0.000000 | 0.000000 | 4.15 | 0.000 | 20.99 | |||||||
| Height | -0.855 | 0.113 | -7.575 | 0.000 | 1.545 | -0.920 | 0.117 | -7.87 | 0.000 | 1.58 | |||||||
| SPLIT | 0.000 | 0.000 | 1.774 | 0.078 | 1.175 | ||||||||||||
| S | 1.35071 | 1.38388 | |||||||||||||||
| R-sq | 69.24% | 70.63% | |||||||||||||||
| R-sq(adj) | 67.98% | 69.43% | |||||||||||||||
| R-sq(pred) | 63.08% | 66.30% | |||||||||||||||
| Continued form | |||||||||||||||||
| 2013 | |||||||||||||||||
| Coef | SE Coef | T-Value | P-Value | VIF | |||||||||||||
| Constant | 49.731 | 0.788 | 63.15 | 0.000 | |||||||||||||
| CA | -1.923 | 0.674 | -2.85 | 0.005 | 2.04 | ||||||||||||
| IS | 0.000 | 0.000 | 12.36 | 0.000 | 5.27 | ||||||||||||
| PD | |||||||||||||||||
| LPI | |||||||||||||||||
| Cohesion | 0.000 | 0.000 | 3.53 | 0.001 | 7.04 | ||||||||||||
| Height | -0.4381 | 0.079 | -5.54 | 0.000 | 1.32 | ||||||||||||
| SPLIT | |||||||||||||||||
| S | 1.02291 | ||||||||||||||||
| R-sq | 72.84% | ||||||||||||||||
| R-sq(adj) | 72.11% | ||||||||||||||||
| R-sq(pred) | 70.89% | ||||||||||||||||
* In this table, Coef and SE Coef are abbreviations for stepwise regression model coefficient and standardization coefficient, respectively, and the underlined variable is transformed by Box-Cox.
Table 5.
Summary of PLSR results of LST and predictors for the whole area.
| Effect term | LST2022 | LST2020 | LST2017 | LST2015 | LST2013 | ||||||
|---|---|---|---|---|---|---|---|---|---|---|---|
| Coef | Coef-Standardized | Coef | Coef-Standardized | Coef | Coef-Standardized | Coef | Coef-Standardized | Coef | Coef-Standardized | ||
| Constant | 51.77 | 49.61 | 53.71 | 55.09 | 53.42 | ||||||
| Main effect | CA | -1.18 | -0.13 | -1.28 | -0.12 | -1.45 | -0.13 | -1.74 | -0.14 | -0.93 | -0.10 |
| IS | 0.17 | 0.16 | 0.17 | 0.18 | 0.13 | ||||||
| PD | 0.11 | 0.05 | 0.12 | 0.04 | 0.13 | 0.05 | 0.16 | 0.05 | 0.09 | 0.04 | |
| PLAND | -0.54 | -0.10 | -0.66 | -0.11 | -0.69 | -0.11 | -0.85 | -0.12 | -0.54 | -0.10 | |
| LPI | -0.05 | -0.04 | -0.09 | -0.06 | -0.08 | -0.05 | -0.10 | -0.06 | -0.09 | -0.07 | |
| Cohesion | 0.02 | -0.02 | -0.04 | ||||||||
| AI | 0.07 | 0.03 | 0.06 | 0.05 | -0.01 | ||||||
| Height | -0.57 | -0.47 | -0.49 | -0.35 | -0.65 | -0.43 | -0.74 | -0.44 | -0.25 | -0.20 | |
| LSI | -0.07 | -0.25 | -0.07 | -0.20 | -0.08 | -0.23 | -0.09 | -0.24 | -0.04 | -0.14 | |
| SPLIT | 0.04 | 0.04 | 0.04 | 0.05 | 0.04 | ||||||
| Interaction | PD×SPLIT×LSI | 0.04 | 0.05 | 0.04 | 0.05 | 0.05 | |||||
| effect | CA×Cohesion×AI×LPI | -0.11 | -0.11 | -0.11 | -0.12 | -0.10 | |||||
| IS×Height | -0.05 | -0.01 | -0.04 | -0.03 | 0.03 | ||||||
| IS×Height×PD×SPLIT×LSI | 0.03 | 0.04 | 0.04 | 0.04 | 0.04 | ||||||
| PLAND×PD×SPLIT×LSI | 0.05 | 0.05 | 0.05 | 0.06 | 0.05 | ||||||
| IS×Height×PLAND | -0.03 | 0.01 | -0.02 | -0.01 | 0.03 | ||||||
| PLAND×CA×Cohesion×AI×LPI | -0.11 | -0.11 | -0.11 | -0.12 | -0.10 | ||||||
| F | 15.77 | 19.33 | 16.67 | 23.81 | 20.72 | ||||||
| R2 | 0.673 | 0.652 | 0.670 | 0.699 | 0.749 | ||||||
* In this table, Coef and coef-standardized are abbreviations for PLSR model coefficients and Standardized coefficients, respectively. Underlined variables have been processed by Box-Cox transformations.
Table 6.
Summary of PLSR results of LST and predictors for the core area.
| Effect term | LST2022 | LST2020 | LST2017 | LST2015 | LST2013 | ||||||
|---|---|---|---|---|---|---|---|---|---|---|---|
| Coef | Coef-Standardized | Coef | Coef-Standardized | Coef | Coef-Standardized | Coef | Coef-Standardized | Coef | Coef-Standardized | ||
| Constant | 52.01 | 50.88 | 55.05 | 56.52 | 54.84 | ||||||
| CA | -0.93 | -0.10 | -0.72 | -0.07 | -0.49 | -0.04 | -0.95 | -0.07 | -0.12 | -0.01 | |
| Main effect | IS | 0.26 | 0.36 | 0.42 | 0.39 | 0.39 | |||||
| PD | -0.05 | -0.02 | -0.27 | -0.10 | -0.44 | -0.15 | -0.34 | -0.11 | -0.40 | -0.17 | |
| PLAND | -0.70 | -0.13 | -1.09 | -0.18 | -1.26 | -0.19 | -1.39 | -0.19 | -1.05 | -0.19 | |
| LPI | -0.06 | -0.05 | -0.12 | -0.08 | -0.12 | -0.07 | -0.14 | -0.08 | -0.13 | -0.10 | |
| Cohesion | 0.04 | 0.04 | 0.08 | 0.06 | 0.04 | ||||||
| AI | 0.09 | 0.09 | 0.14 | 0.12 | 0.09 | ||||||
| Height | -0.64 | -0.53 | -0.76 | -0.54 | -0.98 | -0.65 | -1.06 | -0.63 | -0.56 | -0.45 | |
| LSI | -0.07 | -0.24 | -0.08 | -0.23 | -0.09 | -0.26 | -0.11 | -0.27 | -0.05 | -0.18 | |
| SPLIT | 0.02 | 0.04 | 0.03 | 0.03 | 0.04 | ||||||
| PD×SPLIT×LSI | 0.02 | 0.04 | 0.04 | 0.04 | 0.05 | ||||||
| Interaction | CA×Cohesion×AI×LPI | -0.09 | -0.08 | -0.06 | -0.08 | -0.05 | |||||
| effect | IS×Height | -0.02 | 0.03 | 0.02 | 0.02 | 0.07 | |||||
| IS×Height×PD×SPLIT×LSI | 0.01 | 0.03 | 0.03 | 0.03 | 0.04 | ||||||
| PLAND×PD×SPLIT×LSI | 0.03 | 0.05 | 0.05 | 0.05 | 0.06 | ||||||
| IS×Height×PLAND | 0.02 | 0.09 | 0.10 | 0.08 | 0.14 | ||||||
| PLAND×CA×Cohesion×AI×LPI | -0.09 | -0.09 | -0.07 | -0.09 | -0.06 | ||||||
| F | 19.69 | 39.29 | 33.05 | 43.47 | 48.57 | ||||||
| R2 | 0.692 | 0.634 | 0.651 | 0.672 | 0.722 | ||||||
* In this table, Coef and coef-standardized are abbreviations for PLSR model coefficients and Standardized coefficients, respectively. Underlined variables have been processed by Box-Cox transformations.
Table 7.
Summary of PLSR results of LST and predictors in the buffer area.
| Effect term | LST2022 | LST2020 | LST2017 | LST2015 | LST2013 | ||||||
|---|---|---|---|---|---|---|---|---|---|---|---|
| Coef | Coef-Standardized | Coef | Coef-Standardized | Coef | Coef-Standardized | Coef | Coef-Standardized | Coef | Coef-Standardized | ||
| Constant | 52.54 | 47.90 | 52.56 | 51.97 | 51.66 | ||||||
| Main effect | CA | -0.51 | -0.04 | -1.70 | -0.13 | -1.52 | -0.11 | -2.26 | -0.16 | -0.50 | -0.05 |
| IS | 0.47 | 0.73 | 0.71 | 0.75 | 0.63 | ||||||
| PD | -0.23 | -0.08 | 0.03 | 0.01 | -0.18 | -0.06 | 0.15 | 0.05 | -0.09 | -0.04 | |
| PLAND | -0.77 | -0.14 | -0.73 | -0.12 | -0.82 | -0.14 | -0.72 | -0.11 | -0.62 | -0.13 | |
| LPI | -0.09 | -0.07 | -0.01 | -0.01 | 0.03 | 0.03 | -0.02 | -0.02 | |||
| Cohesion | 0.19 | 0.36 | 0.36 | 0.39 | 0.28 | ||||||
| AI | 0.01 | -0.01 | 0.02 | 0.01 | 0.02 | ||||||
| Height | -0.94 | -0.52 | -0.94 | -0.49 | -1.08 | -0.55 | -1.15 | -0.55 | -0.61 | -0.38 | |
| LSI | -0.03 | -0.08 | -0.03 | -0.07 | -0.05 | -0.11 | -0.05 | -0.11 | -0.02 | -0.05 | |
| SPLIT | 0.10 | 0.11 | 0.13 | 0.11 | 0.06 | ||||||
| Interaction | PD×SPLIT×LSI | 0.03 | 0.02 | 0.01 | 0.01 | ||||||
| effect | CA×Cohesion×AI×LPI | -0.11 | -0.10 | -0.09 | -0.11 | -0.10 | |||||
| IS×Height | -0.03 | -0.03 | -0.04 | -0.05 | 0.03 | ||||||
| IS×Height×PD×SPLIT×LSI | -0.01 | -0.06 | -0.04 | -0.04 | -0.02 | ||||||
| PLAND×PD×SPLIT×LSI | 0.03 | 0.02 | 0.04 | 0.04 | 0.04 | ||||||
| IS×Height×PLAND | 0.13 | 0.30 | 0.26 | 0.30 | 0.30 | ||||||
| PLAND×CA×Cohesion×AI×LPI | -0.09 | -0.05 | -0.04 | -0.06 | -0.06 | ||||||
| F | 25.95 | 54.73 | 42.29 | 46.17 | 53.60 | ||||||
| R2 | 0.576 | 0.753 | 0.727 | 0.718 | 0.751 | ||||||
* In this table, Coef and coef-standardized are abbreviations for PLSR model coefficients and Standardized coefficients, respectively. Underlined variables have been processed by Box-Cox transformations.
Compared with the stepwise regression model, PLSR model explained 56.6%~75.3% of the variance variation of LST, showing a higher statistical effect. It is worth noting that the PLSR model takes all independent variables and their interaction effects into account, and the corresponding results between each variable and LST are more reasonable than that of the stepwise regression model. This model has better robustness and prediction ability.
From the perspective of the three spatial levels, the main independent variables that play a positive role in promoting the increase of LST are, in turn, IS、AI and SPLIT. Among the main predictors and interaction effects of negative normalization coefficient, the results of the three spatial levels are also roughly the same. The cooling effects among them are ranked as Height>CA>PLAND>LSI>LPI>CA×Cohesion×AI×LPI>PLAND×CA×Cohesion×AI× LPI according to the index weights. Their mean standardized partial regression coefficients are -0.62, -0.59, -0.48, -0.12, -0.06, -0.05, and -0.04. When CA、Height、PLAND are high, it indicates that from the perspective of land use structure, the area of UGI is large, and the corresponding water bodies and vegetation are conducive to exerting the cooling effect of ecological infrastructure. From the perspective of building micro-form, the higher the floor, the larger the building shadow will be formed and the ventilation corridor will be formed to block direct sunlight. There are interaction effects among floor height, dispersion and aggregation of UGI, area size of UGI and impervious surface area. The higher the floor, the larger the proportion of UGI and the reasonable distribution, the more conducive to the formation of low temperature area and the alleviation of urban heat island effect.
4. Discussion
4.1. Using UGI Spatial Pattern to Improve Urban Thermal Environment
The structure and spatial structure difference of UGI poses impact on urban thermal environment. It has been suggested that vegetation and water play an important role in cooling and mitigating urban heat island [40,41,42]. Others argue that UGI should be used as a mainstream adaptation measure to climate change [43,44,45]. Different views hold that the influence of building form on surface temperature is much greater than that of UGI [46,47,48,49].
In this study, a 20m LST sharpening product was generated to better suppress the foreign body homospectral phenomenon and its biased value caused by mixed pixels. Different from the previous studies which only focused on the whole research area or specific typical areas, this paper focuses on the radiation effect of UGI facilities in the core area on the surrounding areas. At present, in the process of urban expansion in Shanghai, the loss of inland water is difficult to recover. Therefore, it is urgent to eliminate the imbalance of UGI ratio between the core area and the surrounding buffer area as much as possible, and improve the spatial continuity between the core area and the surrounding area[50,51]. According to impact factor weights, it is suggested to give priority to built-up areas with low UGI proportion, and implement renovation projects and structural optimization design focusing on increasing UGI area proportion. Specific methods that can be used for reference mainly include:
1) three-dimensional greening design. The vertical structure optimization and shade design of vegetation can be strengthened, and different types of small green Spaces such as lawns and plants can be set up on the roofs and exterior walls of buildings with suitable conditions. On the plane, the greenway system is introduced into urban planning, and the structures such as green belt and tree canopy are integrated into the urban landscape.
2) Optimize water layout and management [52,53,54]. The evaporative heat dissipation effect of water bodies can be made good use of by appropriately increasing small water bodies mainly composed of constructed wetlands and other water features according to local conditions. By means of permeable pavement and green lawn, the rainwater runoff rate is slowed down, and a large-scale vegetation-water Mosaic landscape is formed to enhance regional UGI connectivity and form a relatively cooler microclimate environment.
4.2. Improve Ecological Building Design to Enhance Urban Sustainability
Different from the analysis of a single factor in previous studies, this study evaluated the influence weights of each factor on LST from the perspective of multiple influencing factors. Demonstrated that improving the balanced configuration of green Spaces, buildings and impervious surfaces is one way to maximize the reduction of LST in cities in the future [55,56]. From the perspective of architecture, building height and density have a significant impact on the thermal environment. Taller buildings may result in a more significant shadow effect, affecting local heat distribution [54,57,58]. The positive correlation between building height and urban heat island effect may be related to the characteristics of heat absorption and heat release of high-rise buildings, which affect the air flow and radiant heat distribution. In view of this, ensuring moderate building density and height helps to create the right airflow and mitigate the UHI effect.
In addition, this study shows that there are synergistic effects in the built environment factors such as the area size, spatial distribution and building height of UGI in urban form. Therefore, more attention should be paid to optimizing the three-dimensional form and overall spatial layout of cities to maximize the impact of factors that inhibit/slow the growth of LST [59]. On the basis of ensuring reasonable land development intensity and enhancing ecosystem service demand, reasonable planning and design of urban high-rise buildings and block layout can create conditions for the construction of UGI with green space and small water body in the adjacent space of buildings, and it can also moderately increase the building plot ratio and increase the building spacing. This can further achieve the goal of regulating temperature in the urban thermal environment and enhancing urban sustainability [60,61].
5. Conclusions
This study divides 52 UTHSs in Shanghai into three spatial levels. It is found that the regional spatial differentiation of each spatial level is significant, and UGI pattern has a strong negative correlation with LST. Secondly, PLSR model was used for quantitative evaluation of each indicator, and it was found that the independent variables and their interaction effects were roughly the same on the three spatial levels. Weight indicators Height、CA、PLAND、LSI、LPI、CA×Cohesion×AI×LPI、PLAND×CA×Cohesion×AI× LPI cooling weights are ranked from high to low. The results show that when the UGI area is relatively large and the building floor is high, it is beneficial to realize the cooling effect. However, when the patch density is small and the degree of spatial fragmentation is high, the cooling effect of UGI will be affected. It is necessary to make good use of the synergistic effect between these parameters to maximize the cooling effect of each landscape pattern element. In view of this, it is proposed to make good use of UGI spatial pattern and improve ecological architectural design. Specifically, the UGI area ratio can be improved by strengthening the construction of three-dimensional greening and optimizing the layout and management of water bodies. In addition, reasonable planning and design are adopted to match the layout of urban high-rise buildings and blocks, improve urban air flow and radiant heat distribution, and create space for UGI distribution to solve the UGI imbalance problem.
However, this study still has some limitations. First, the spatial resolution of the image in this study is still difficult to completely suppress the bias caused by the mixed pixel effect. Secondly, in terms of time scale, the paper lacks a comprehensive grasp of the long-term trend. In terms of LST influencing factors, the influence of human activities is not taken into account, which may cause slight deviations in the data in this study. In future studies, it is necessary to adopt longer time scale data, conduct quality control of data sets through reasonable cross-validation means, continuously expand the scope of factor analysis, determine more reasonable quantitative evaluation models, and apply the research results in actual urban planning and governance.
Author Contributions
Conceptualization, Zhenru Guan and Hao Zhang; Methodology, Zhenru Guan and Hao Zhang; Software, Zhenru Guan; Data curation, Zhenru Guan; Formal analysis, Zhenru Guan; Resources, Zhenru Guan and Hao Zhang; Supervision, Hao Zhang; Validation, Zhenru Guan; Visualization, Zhenru Guan and Hao Zhang; Writing – original draft, Zhenru Guan; Writing – review & editing, Hao Zhang. All authors have read and agreed to the published version of the manuscript.
Funding
This research received no external funding.
Conflicts of Interest
The authors declare no conflicts of interest.
References
- Santamouris, M., Recent progress on urban overheating and heat island research. Integrated assessment of the energy, environmental, vulnerability and health impact. Synergies with the global climate change. Energy and Buildings 2020, 207. [CrossRef]
- Voogt, J. A., Urban heat island. 2000.
- Oke, T. R., Boundary layer climates. 2002.
- Arnfield, A. J., Two decades of urban climate research: a review of turbulence, exchanges of energy and water, and the urban heat island. International Journal of Climatology 2003, 23, (1), 1-26. [CrossRef]
- Zhao, Z.-Q.; He, B.-J.; Li, L.-G.; Wang, H.-B.; Darko, A., Profile and concentric zonal analysis of relationships between land use/land cover and land surface temperature: Case study of Shenyang, China. Energy and Buildings 2017, 155, 282-295. [CrossRef]
- UN-Habitat, World Cities Report 2022: Envisaging the Future of Cities. World City Report 2022.
- Singh, N., Singh, S., & Mall, R. K, Urban ecology and human health: implications of urban heat island, air pollution and climate change nexus. Urban ecology.Elsevier 2020, 317-334.
- Patz, J. A.; Campbell-Lendrum, D.; Holloway, T.; Foley, J. A., Impact of regional climate change on human health. Nature 2005, 438, (7066), 310-7. [CrossRef]
- Gasparrini, A.; Guo, Y.; Sera, F.; Vicedo-Cabrera, A. M.; Huber, V.; Tong, S.; de Sousa Zanotti Stagliorio Coelho, M.; Nascimento Saldiva, P. H.; Lavigne, E.; Matus Correa, P.; Valdes Ortega, N.; Kan, H.; Osorio, S.; Kysely, J.; Urban, A.; Jaakkola, J. J. K.; Ryti, N. R. I.; Pascal, M.; Goodman, P. G.; Zeka, A.; Michelozzi, P.; Scortichini, M.; Hashizume, M.; Honda, Y.; Hurtado-Diaz, M.; Cesar Cruz, J.; Seposo, X.; Kim, H.; Tobias, A.; Iniguez, C.; Forsberg, B.; Astrom, D. O.; Ragettli, M. S.; Guo, Y. L.; Wu, C. F.; Zanobetti, A.; Schwartz, J.; Bell, M. L.; Dang, T. N.; Van, D. D.; Heaviside, C.; Vardoulakis, S.; Hajat, S.; Haines, A.; Armstrong, B., Projections of temperature-related excess mortality under climate change scenarios. Lancet Planet Health 2017, 1, (9), e360-e367. [CrossRef]
- Balling, R. C.; Gober, P.; Jones, N., Sensitivity of residential water consumption to variations in climate: An intraurban analysis of Phoenix, Arizona. Water Resources Research 2008, 44, (10). [CrossRef]
- Zhao, L.; Lee, X.; Smith, R. B.; Oleson, K., Strong contributions of local background climate to urban heat islands. Nature 2014, 511, (7508), 216-9. [CrossRef]
- Leal Filho, W.; Echevarria Icaza, L.; Neht, A.; Klavins, M.; Morgan, E. A., Coping with the impacts of urban heat islands. A literature based study on understanding urban heat vulnerability and the need for resilience in cities in a global climate change context. Journal of Cleaner Production 2018, 171, 1140-1149.
- Buchin, O.; Hoelscher, M.-T.; Meier, F.; Nehls, T.; Ziegler, F., Evaluation of the health-risk reduction potential of countermeasures to urban heat islands. Energy and Buildings 2016, 114, 27-37. [CrossRef]
- Tan, J.; Zheng, Y.; Tang, X.; Guo, C.; Li, L.; Song, G.; Zhen, X.; Yuan, D.; Kalkstein, A. J.; Li, F., The urban heat island and its impact on heat waves and human health in Shanghai. Int J Biometeorol 2010, 54, (1), 75-84. [CrossRef]
- Memon, R. A.; Leung, D. Y.; Chunho, L., A review on the generation, determination and mitigation of urban heat island. J Environ Sci (China) 2008, 20, (1), 120-8.
- Xu, C.; Chen, G.; Huang, Q.; Su, M.; Rong, Q.; Yue, W.; Haase, D., Can improving the spatial equity of urban green space mitigate the effect of urban heat islands? An empirical study. Sci Total Environ 2022, 841, 156687. [CrossRef]
- Wang, Y.; Bakker, F.; de Groot, R.; Wörtche, H., Effect of ecosystem services provided by urban green infrastructure on indoor environment: A literature review. Building and Environment 2014, 77, 88-100. [CrossRef]
- Sun, R.; Xie, W.; Chen, L., A landscape connectivity model to quantify contributions of heat sources and sinks in urban regions. Landscape and Urban Planning 2018, 178, 43-50. [CrossRef]
- Young, R.; Zanders, J.; Lieberknecht, K.; Fassman-Beck, E., A comprehensive typology for mainstreaming urban green infrastructure. Journal of Hydrology 2014, 519, 2571-2583. [CrossRef]
- Cameron, R. W. F.; Blanuša, T.; Taylor, J. E.; Salisbury, A.; Halstead, A. J.; Henricot, B.; Thompson, K., The domestic garden – Its contribution to urban green infrastructure. Urban Forestry & Urban Greening 2012, 11, (2), 129-137. [CrossRef]
- Liu, O. Y.; Russo, A., Assessing the contribution of urban green spaces in green infrastructure strategy planning for urban ecosystem conditions and services. Sustainable Cities and Society 2021, 68. [CrossRef]
- Milard, D., Urban energy and environmental policy: the case of Shanghai since the 2000’s. 2017.
- Gielen, D. a. C., C., The CO2 emission reduction benefits of Chinese energy policies and environmental policies:A case study for Shanghai, period 1995–2020. Ecological Economics 2001, 39(2),257-270.
- Harlan, S. L.; Ruddell, D. M., Climate change and health in cities: impacts of heat and air pollution and potential co-benefits from mitigation and adaptation. Current Opinion in Environmental Sustainability 2011, 3, (3), 126-134. [CrossRef]
- Shi, C.; Guo, N.; Gao, X.; Wu, F., How carbon emission reduction is going to affect urban resilience. Journal of Cleaner Production 2022, 372. [CrossRef]
- Gómez-Baggethun, E.; Barton, D. N., Classifying and valuing ecosystem services for urban planning. Ecological Economics 2013, 86, 235-245. [CrossRef]
- Han, J.; Zhao, X.; Zhang, H.; Liu, Y., Analyzing the Spatial Heterogeneity of the Built Environment and Its Impact on the Urban Thermal Environment—Case Study of Downtown Shanghai. Sustainability 2021, 13, (20). [CrossRef]
- Du, N.; Ottens, H.; Sliuzas, R., Spatial impact of urban expansion on surface water bodies—A case study of Wuhan, China. Landscape and Urban Planning 2010, 94, (3-4), 175-185. [CrossRef]
- Zhao, M.; Cai, H.; Qiao, Z.; Xu, X., Influence of urban expansion on the urban heat island effect in Shanghai. International Journal of Geographical Information Science 2016, 30, (12), 2421-2441. [CrossRef]
- Li, J.-j.; Wang, X.-r.; Wang, X.-j.; Ma, W.-c.; Zhang, H., Remote sensing evaluation of urban heat island and its spatial pattern of the Shanghai metropolitan area, China. Ecological Complexity 2009, 6, (4), 413-420. [CrossRef]
- Li, J.; Song, C.; Cao, L.; Zhu, F.; Meng, X.; Wu, J., Impacts of landscape structure on surface urban heat islands: A case study of Shanghai, China. Remote Sensing of Environment 2011, 115, (12), 3249-3263. [CrossRef]
- Design, S. I. o. P. a., Shanghai Greening System Plan. In 2020.
- Zhang, H.; Li, T. t.; Liu, Y.; Han, J. j.; Guo, Y. j., Understanding the contributions of land parcel features to intra-surface urban heat island intensity and magnitude: A study of downtown Shanghai, China. Land Degradation & Development 2020, 32, (3), 1353-1367. [CrossRef]
- Feng, L.; Zhao, M.; Zhou, Y.; Zhu, L.; Tian, H., The seasonal and annual impacts of landscape patterns on the urban thermal comfort using Landsat. Ecological Indicators 2020, 110. [CrossRef]
- Yue, W.; Qiu, S.; Xu, H.; Xu, L.; Zhang, L., Polycentric urban development and urban thermal environment: A case of Hangzhou, China. Landscape and Urban Planning 2019, 189, 58-70. [CrossRef]
- Santamouris, M., Afroditi Synnefa, and Theoni Karlessi, Using advanced cool materials in the urban built environment to mitigate heat islands and improve thermal comfort conditions. Solar energy 2011, 85(12):3085-102. [CrossRef]
- Næss, P., Built environment, causality and urban planning. Planning Theory & Practice 2016, 17(1), 52-71.
- McGarigal, K., Cushman, S.A., Ene, E., FRAGSTATS v4: Spatial Pattern Analysis Pro gram for Categorical and Continuous Maps. Computer Software Program Produced.
- by the Authors at the University of Massachusetts Amherst. 2012, accessed 26 July 2018.
- Wehrens, R., and B-H. Mevik, The pls package: principal component and partial least squares regression in R. 2007.
- Wu, C.; Li, J.; Wang, C.; Song, C.; Haase, D.; Breuste, J.; Finka, M., Estimating the Cooling Effect of Pocket Green Space in High Density Urban Areas in Shanghai, China. Frontiers in Environmental Science 2021, 9. [CrossRef]
- Liu, J.; Zhang, L.; Zhang, Q.; Zhang, G.; Teng, J., Predicting the surface urban heat island intensity of future urban green space development using a multi-scenario simulation. Sustainable Cities and Society 2021, 66. [CrossRef]
- Jones, L.; Anderson, S.; Læssøe, J.; Banzhaf, E.; Jensen, A.; Bird, D. N.; Miller, J.; Hutchins, M. G.; Yang, J.; Garrett, J.; Taylor, T.; Wheeler, B. W.; Lovell, R.; Fletcher, D.; Qu, Y.; Vieno, M.; Zandersen, M., A typology for urban Green Infrastructure to guide multifunctional planning of nature-based solutions. Nature-Based Solutions 2022, 2. [CrossRef]
- Adegun, O. B.; Ikudayisi, A. E.; Morakinyo, T. E.; Olusoga, O. O., Urban green infrastructure in Nigeria: A review. Scientific African 2021, 14. [CrossRef]
- Sodoudi, S.; Zhang, H.; Chi, X.; Müller, F.; Li, H., The influence of spatial configuration of green areas on microclimate and thermal comfort. Urban Forestry & Urban Greening 2018, 34, 85-96. [CrossRef]
- Lai, D.; Liu, Y.; Liao, M.; Yu, B., Effects of different tree layouts on outdoor thermal comfort of green space in summer Shanghai. Urban Climate 2023, 47. [CrossRef]
- Yu, K.; Chen, Y.; Wang, D.; Chen, Z.; Gong, A.; Li, J., Study of the Seasonal Effect of Building Shadows on Urban Land Surface Temperatures Based on Remote Sensing Data. Remote Sensing 2019, 11, (5). [CrossRef]
- Han, Y.; Taylor, J. E.; Pisello, A. L., Toward mitigating urban heat island effects: Investigating the thermal-energy impact of bio-inspired retro-reflective building envelopes in dense urban settings. Energy and Buildings 2015, 102, 380-389. [CrossRef]
- He, B.-J.; Zhao, Z.-Q.; Shen, L.-D.; Wang, H.-B.; Li, L.-G., An approach to examining performances of cool/hot sources in mitigating/enhancing land surface temperature under different temperature backgrounds based on landsat 8 image. Sustainable Cities and Society 2019, 44, 416-427. [CrossRef]
- He, B.-J., Towards the next generation of green building for urban heat island mitigation: Zero UHI impact building. Sustainable Cities and Society 2019, 50. [CrossRef]
- Cui, Y.-q.; Zheng, H.-C., Impact of Three-Dimensional Greening of Buildings in Cold Regions in China on Urban Cooling Effect. Procedia Engineering 2016, 169, 297-302. [CrossRef]
- Shi, D.; Song, J.; Huang, J.; Zhuang, C.; Guo, R.; Gao, Y., Synergistic cooling effects (SCEs) of urban green-blue spaces on local thermal environment: A case study in Chongqing, China. Sustainable Cities and Society 2020, 55. [CrossRef]
- Völker, S.; Baumeister, H.; Claßen, T.; Hornberg, C.; Kistemann, T., Evidence for the temperature-mitigating capacity of urban blue space – a health geographic perspective. Erdkunde 2013, 67, (04), 355-371. [CrossRef]
- Georgescu, M.; Morefield, P. E.; Bierwagen, B. G.; Weaver, C. P., Urban adaptation can roll back warming of emerging megapolitan regions. Proc Natl Acad Sci U S A 2014, 111, (8), 2909-14. [CrossRef]
- Tian, Y., Zhou, W., The effect of urban 2D and 3D morphology on air temperature in residential neighborhoods. Landscape Ecology. 34 2019, 1161-1178. [CrossRef]
- Javadi, R.; Nasrollahi, N., Urban green space and health: The role of thermal comfort on the health benefits from the urban green space; a review study. Building and Environment 2021, 202. [CrossRef]
- Oliveira, S.; Andrade, H.; Vaz, T., The cooling effect of green spaces as a contribution to the mitigation of urban heat: A case study in Lisbon. Building and Environment 2011, 46, (11), 2186-2194.
- Theeuwes, N. E.; Steeneveld, G. J.; Ronda, R. J.; Heusinkveld, B. G.; van Hove, L. W. A.; Holtslag, A. A. M., Seasonal dependence of the urban heat island on the street canyon aspect ratio. Quarterly Journal of the Royal Meteorological Society 2014, 140, (684), 2197-2210. [CrossRef]
- Park, Y.; Guldmann, J.-M.; Liu, D., Impacts of tree and building shades on the urban heat island: Combining remote sensing, 3D digital city and spatial regression approaches. Computers, Environment and Urban Systems 2021, 88. [CrossRef]
- Cao, Q.; Liu, Y.; Georgescu, M.; Wu, J., Impacts of landscape changes on local and regional climate: a systematic review. Landscape Ecology 2020, 35, (6), 1269-1290. [CrossRef]
- Yang, J.; Yang, Y.; Sun, D.; Jin, C.; Xiao, X., Influence of urban morphological characteristics on thermal environment. Sustainable Cities and Society 2021, 72. [CrossRef]
- Shashua-Bar, L.; Tzamir, Y.; Hoffman, M. E., Thermal effects of building geometry and spacing on the urban canopy layer microclimate in a hot-humid climate in summer. International Journal of Climatology 2004, 24, (13), 1729-1742. [CrossRef]
Figure 1.
Distribution of 52 UTHSs in the study area.
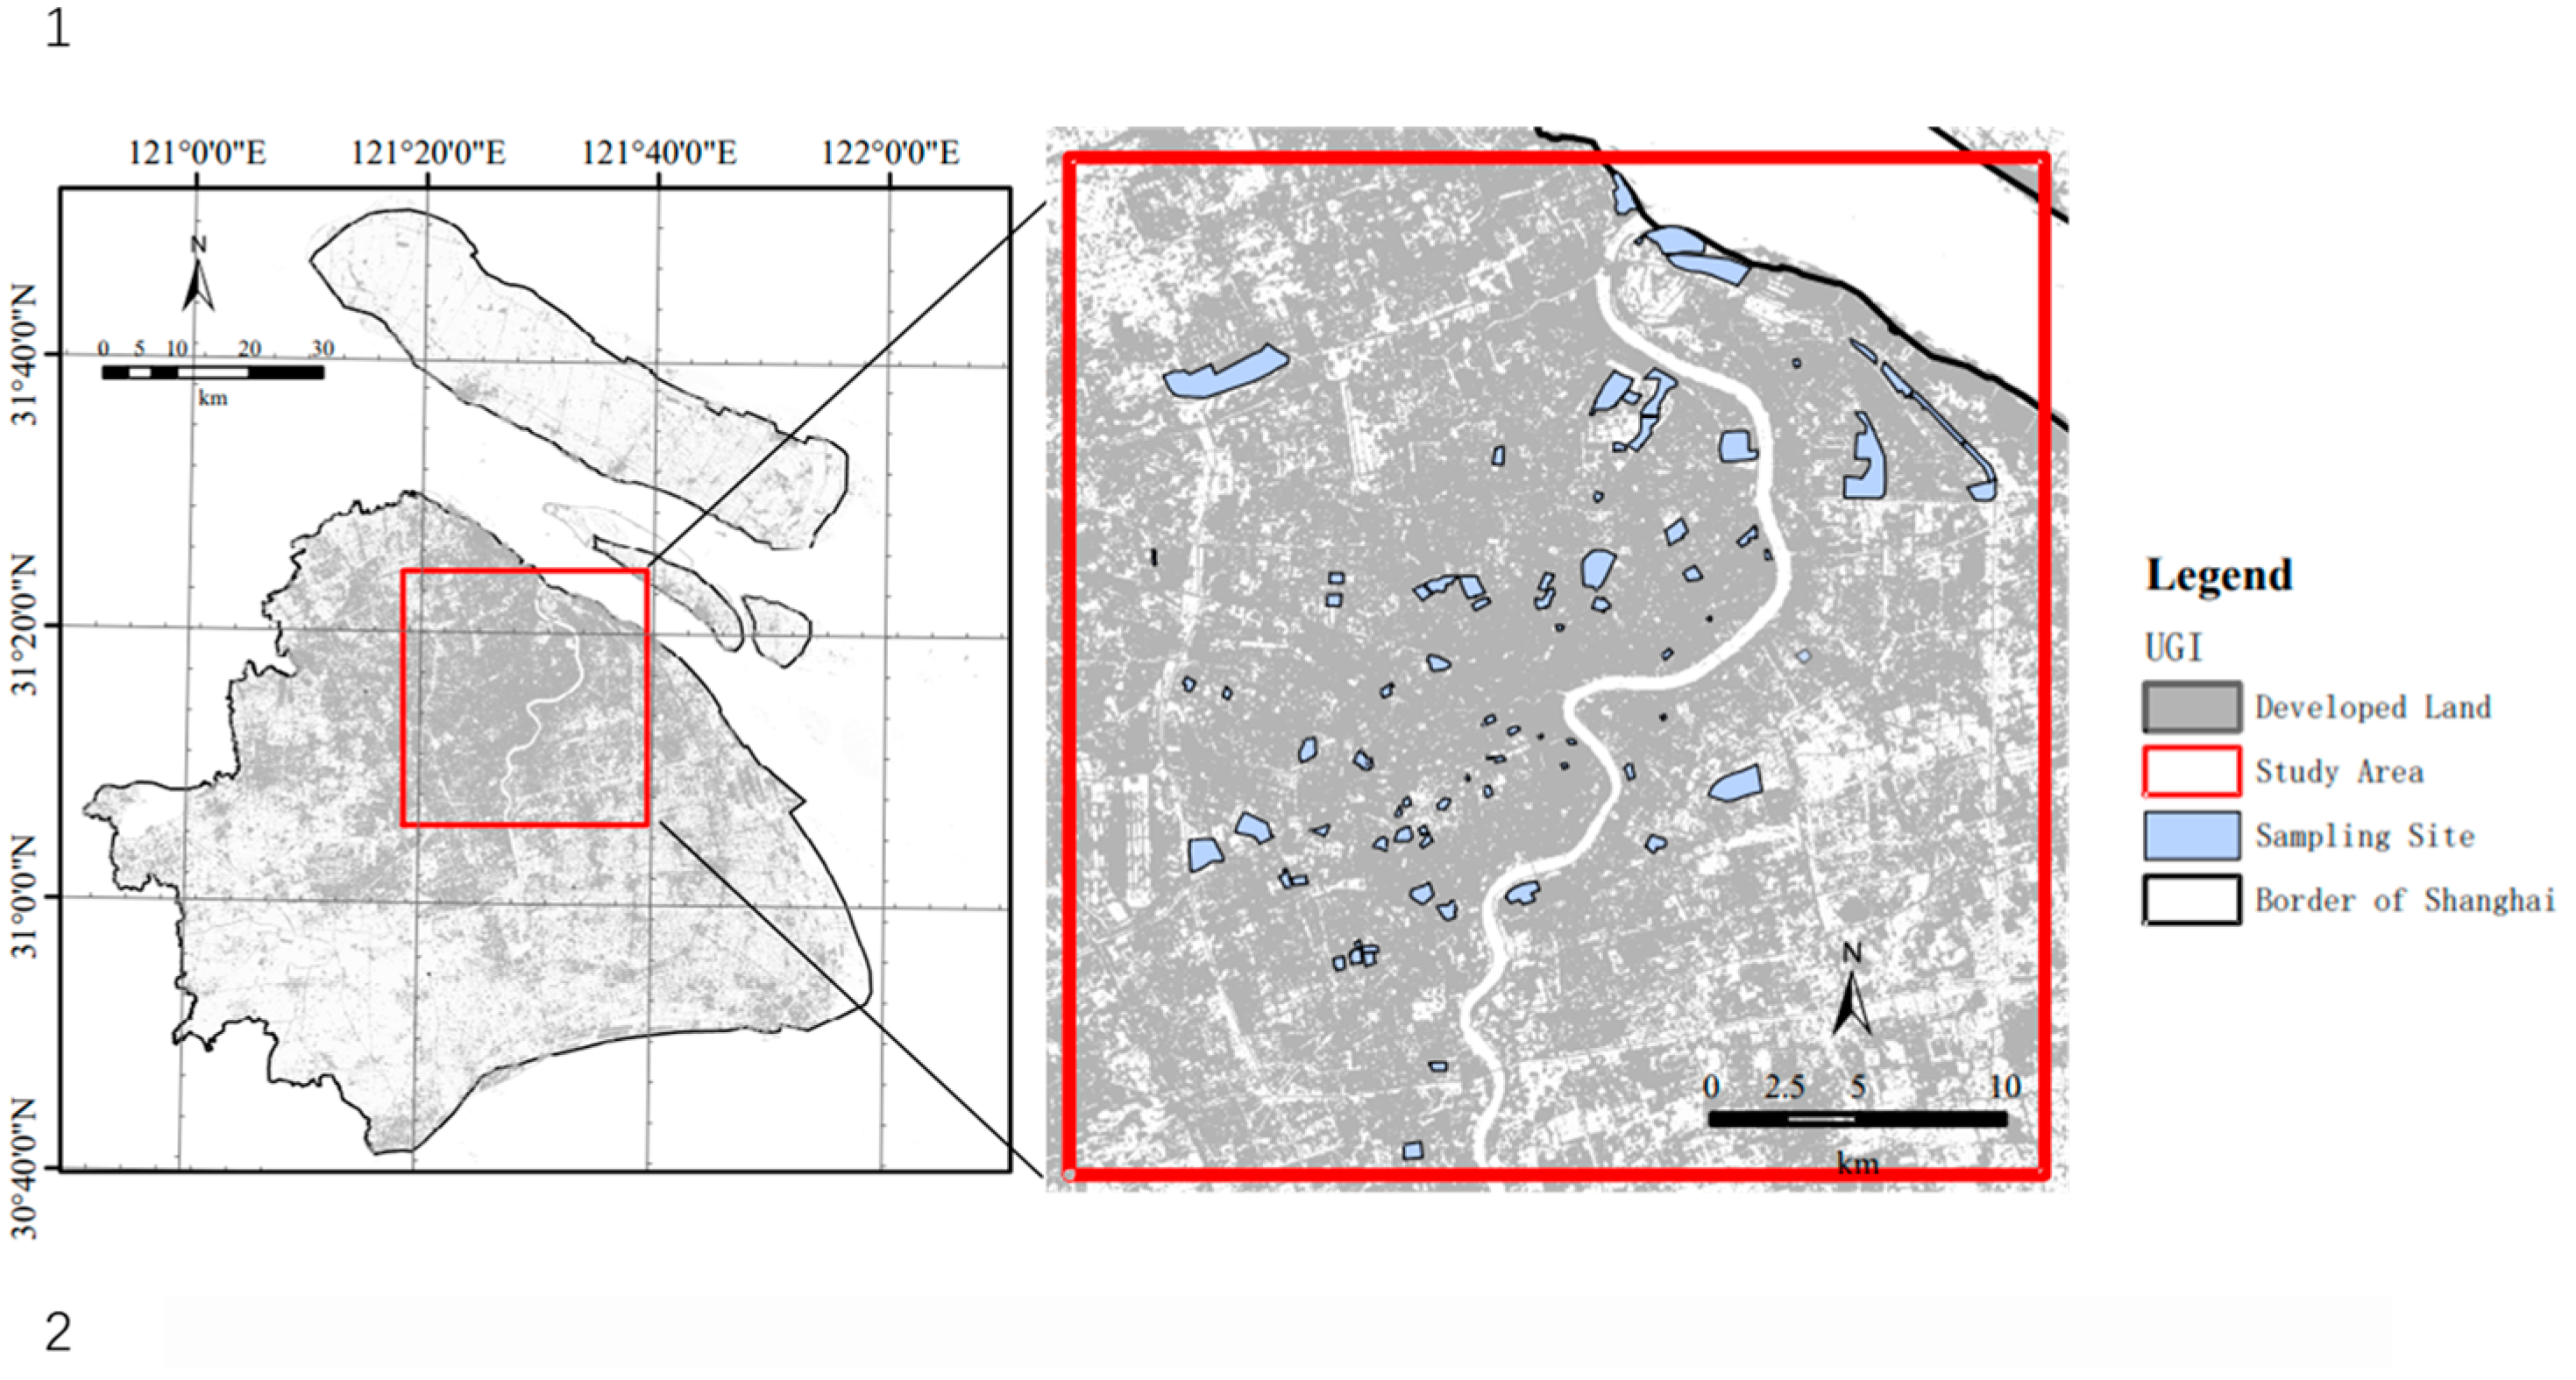
Figure 2.
LST chart of the five levels of UTHSs from 2013 to 2022 and mean value under three spatial levels.
Figure 2.
LST chart of the five levels of UTHSs from 2013 to 2022 and mean value under three spatial levels.
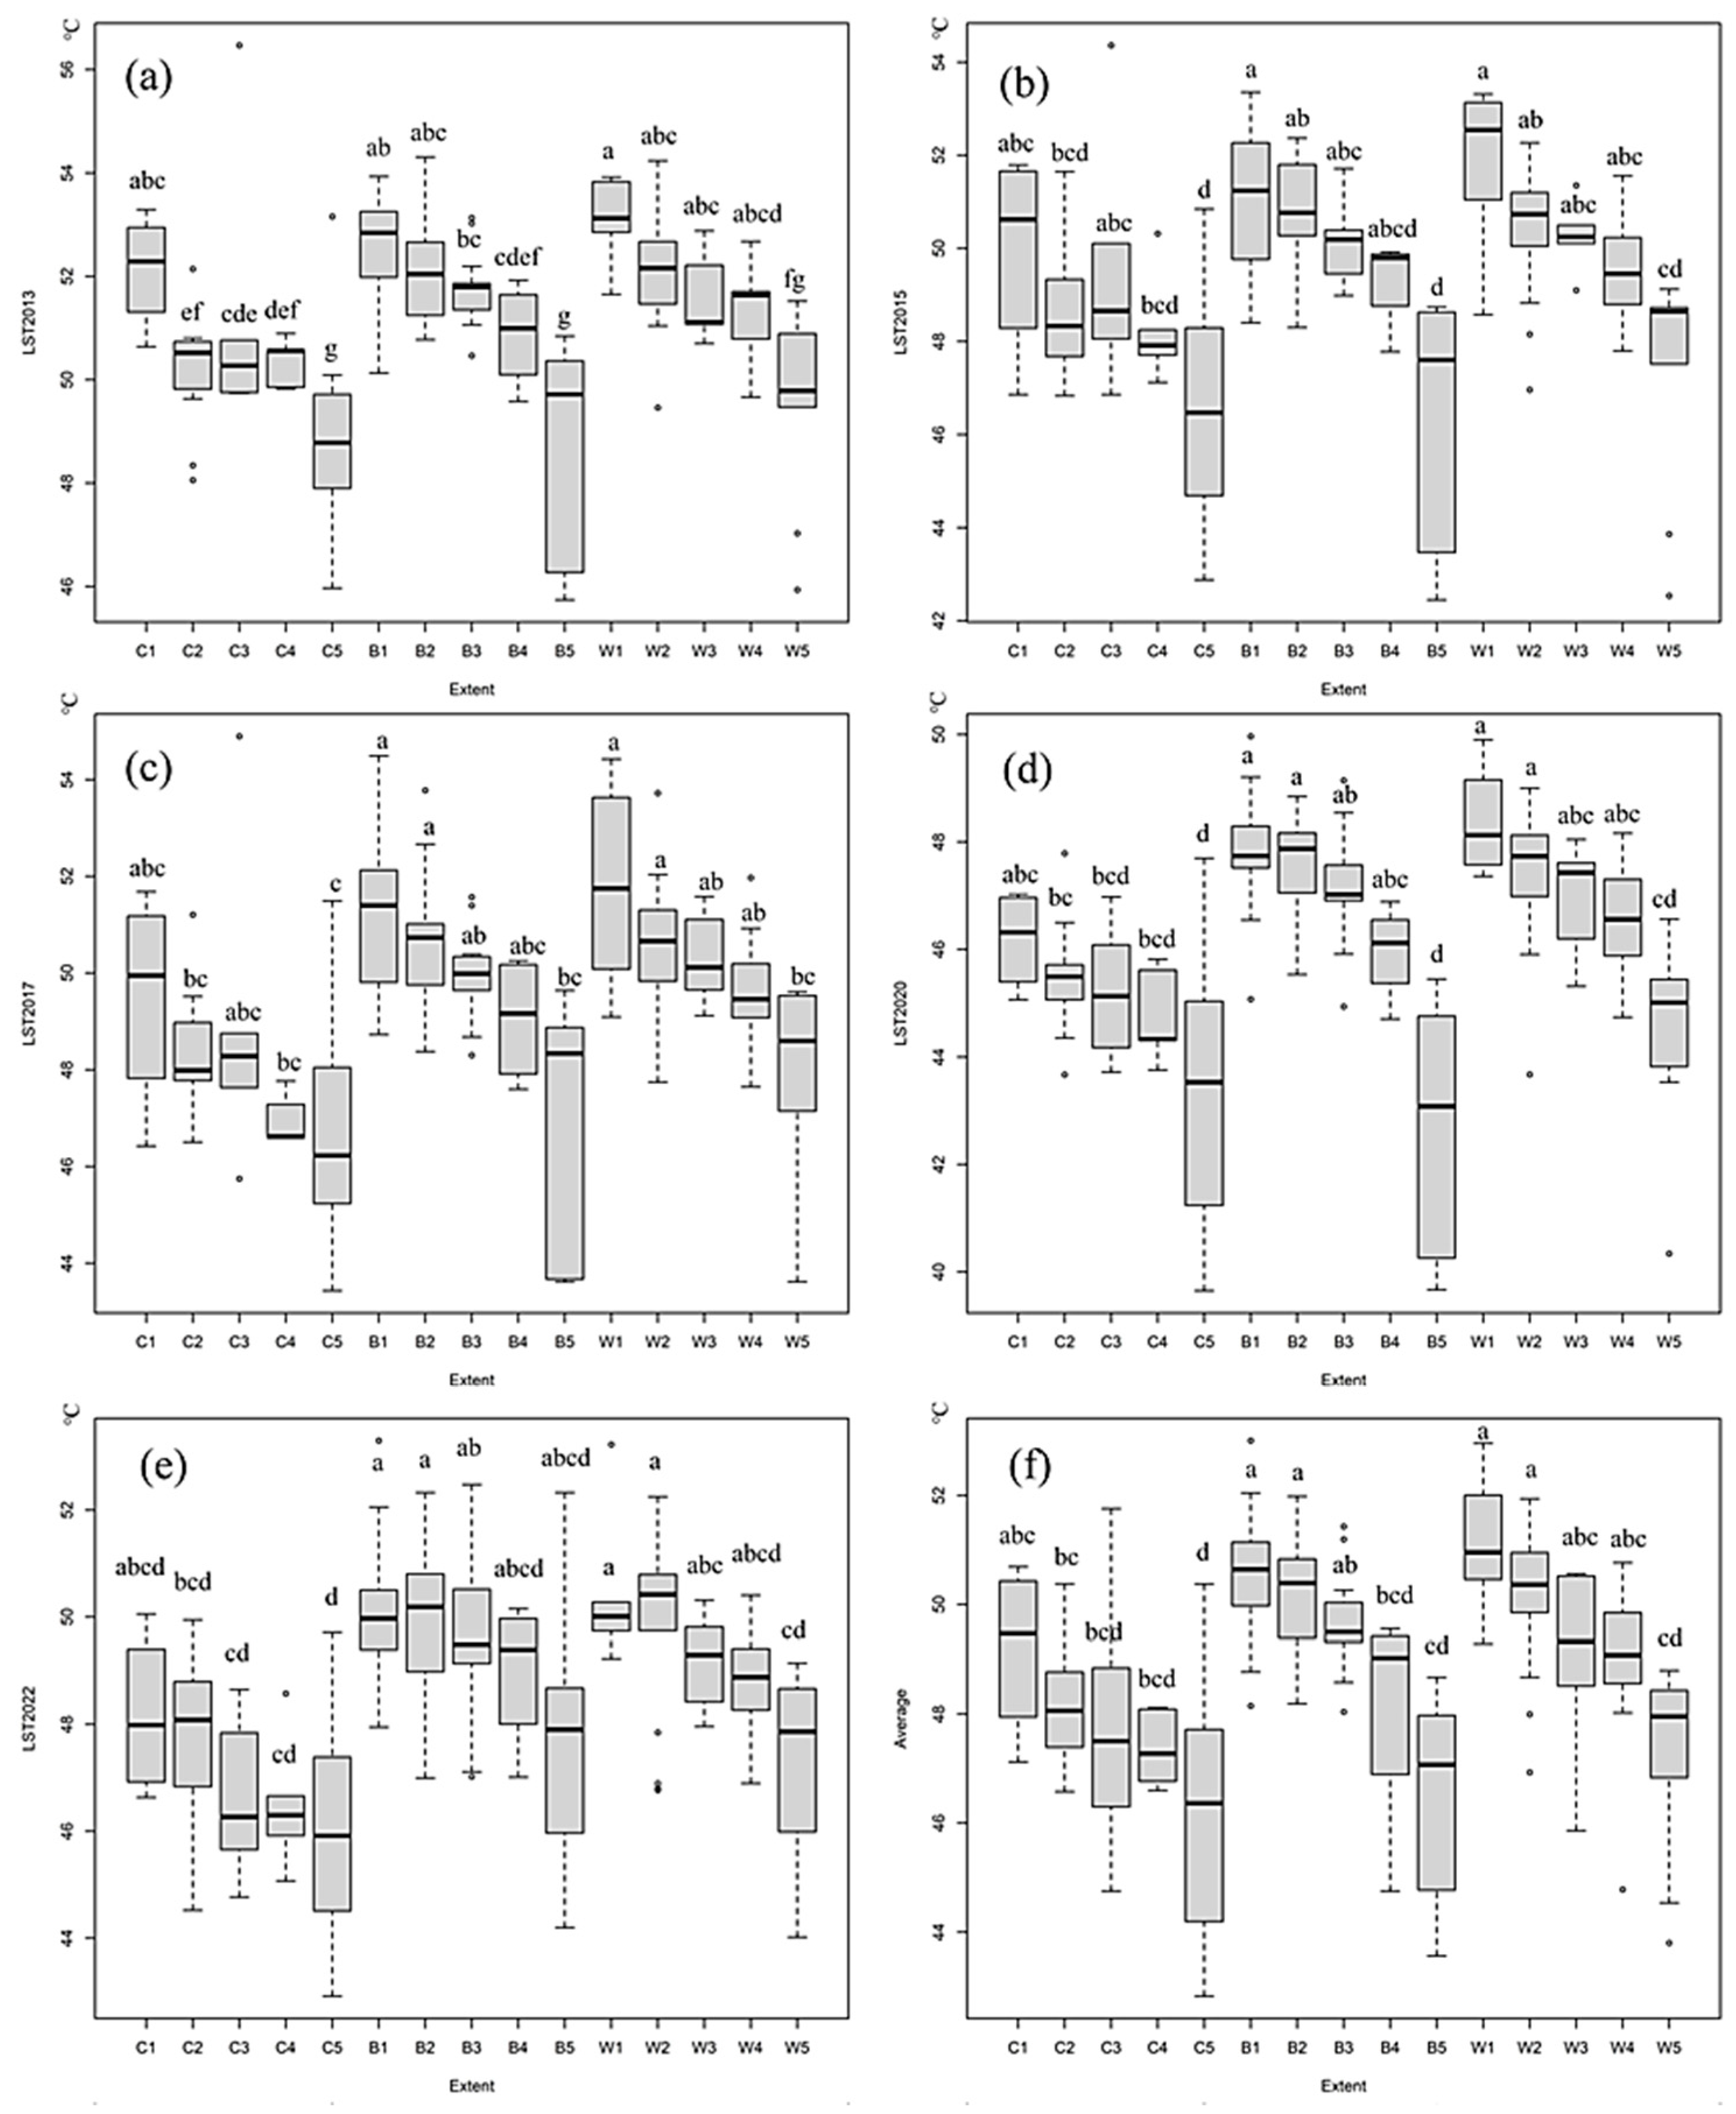
Figure 3.
Nonlinear fitting diagram of LST correlation among three spatial stratification areas. *C, B and W in the figure represent core area, buffer area and whole area respectively; CLST, BLST and WLST represent the LST of the core area, buffer area and whole area respectively.
Figure 3.
Nonlinear fitting diagram of LST correlation among three spatial stratification areas. *C, B and W in the figure represent core area, buffer area and whole area respectively; CLST, BLST and WLST represent the LST of the core area, buffer area and whole area respectively.
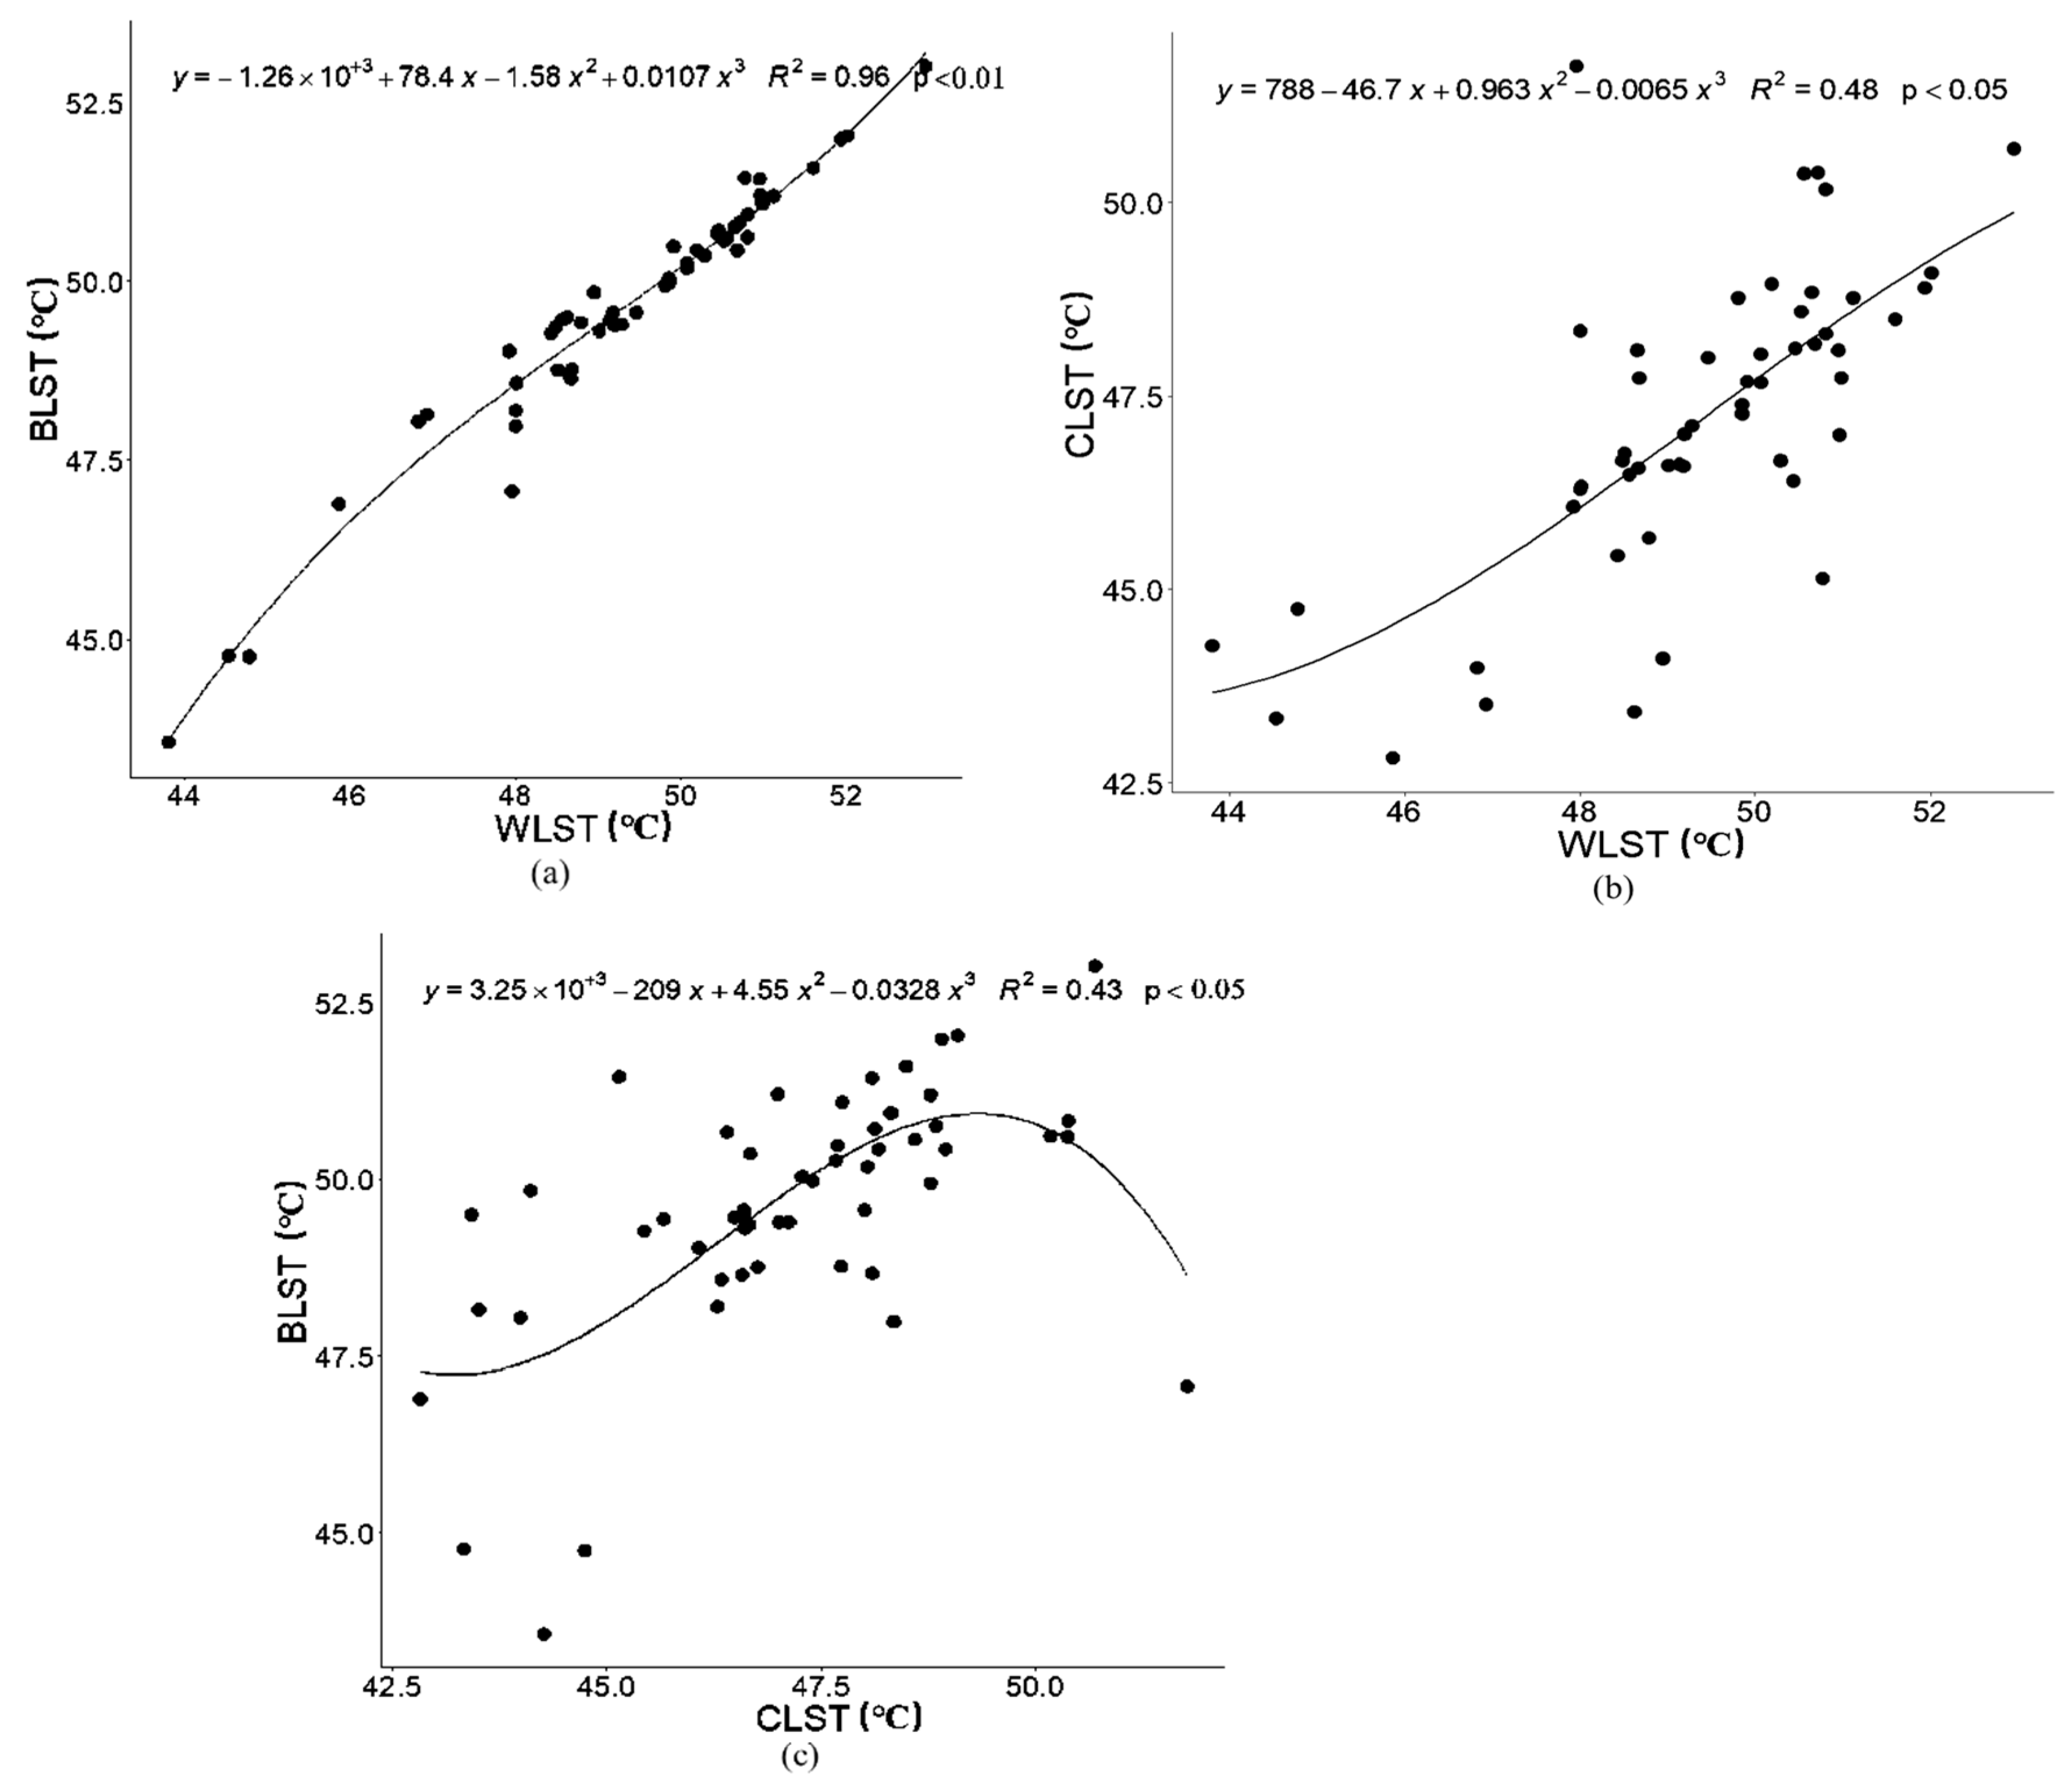
Figure 4.
Map of land use at typical UTHSs. * In the figure, the inner frame line is the core area, the outer frame line is the overall area boundary, and the inner and outer frame line range is 500m buffer.
Figure 4.
Map of land use at typical UTHSs. * In the figure, the inner frame line is the core area, the outer frame line is the overall area boundary, and the inner and outer frame line range is 500m buffer.
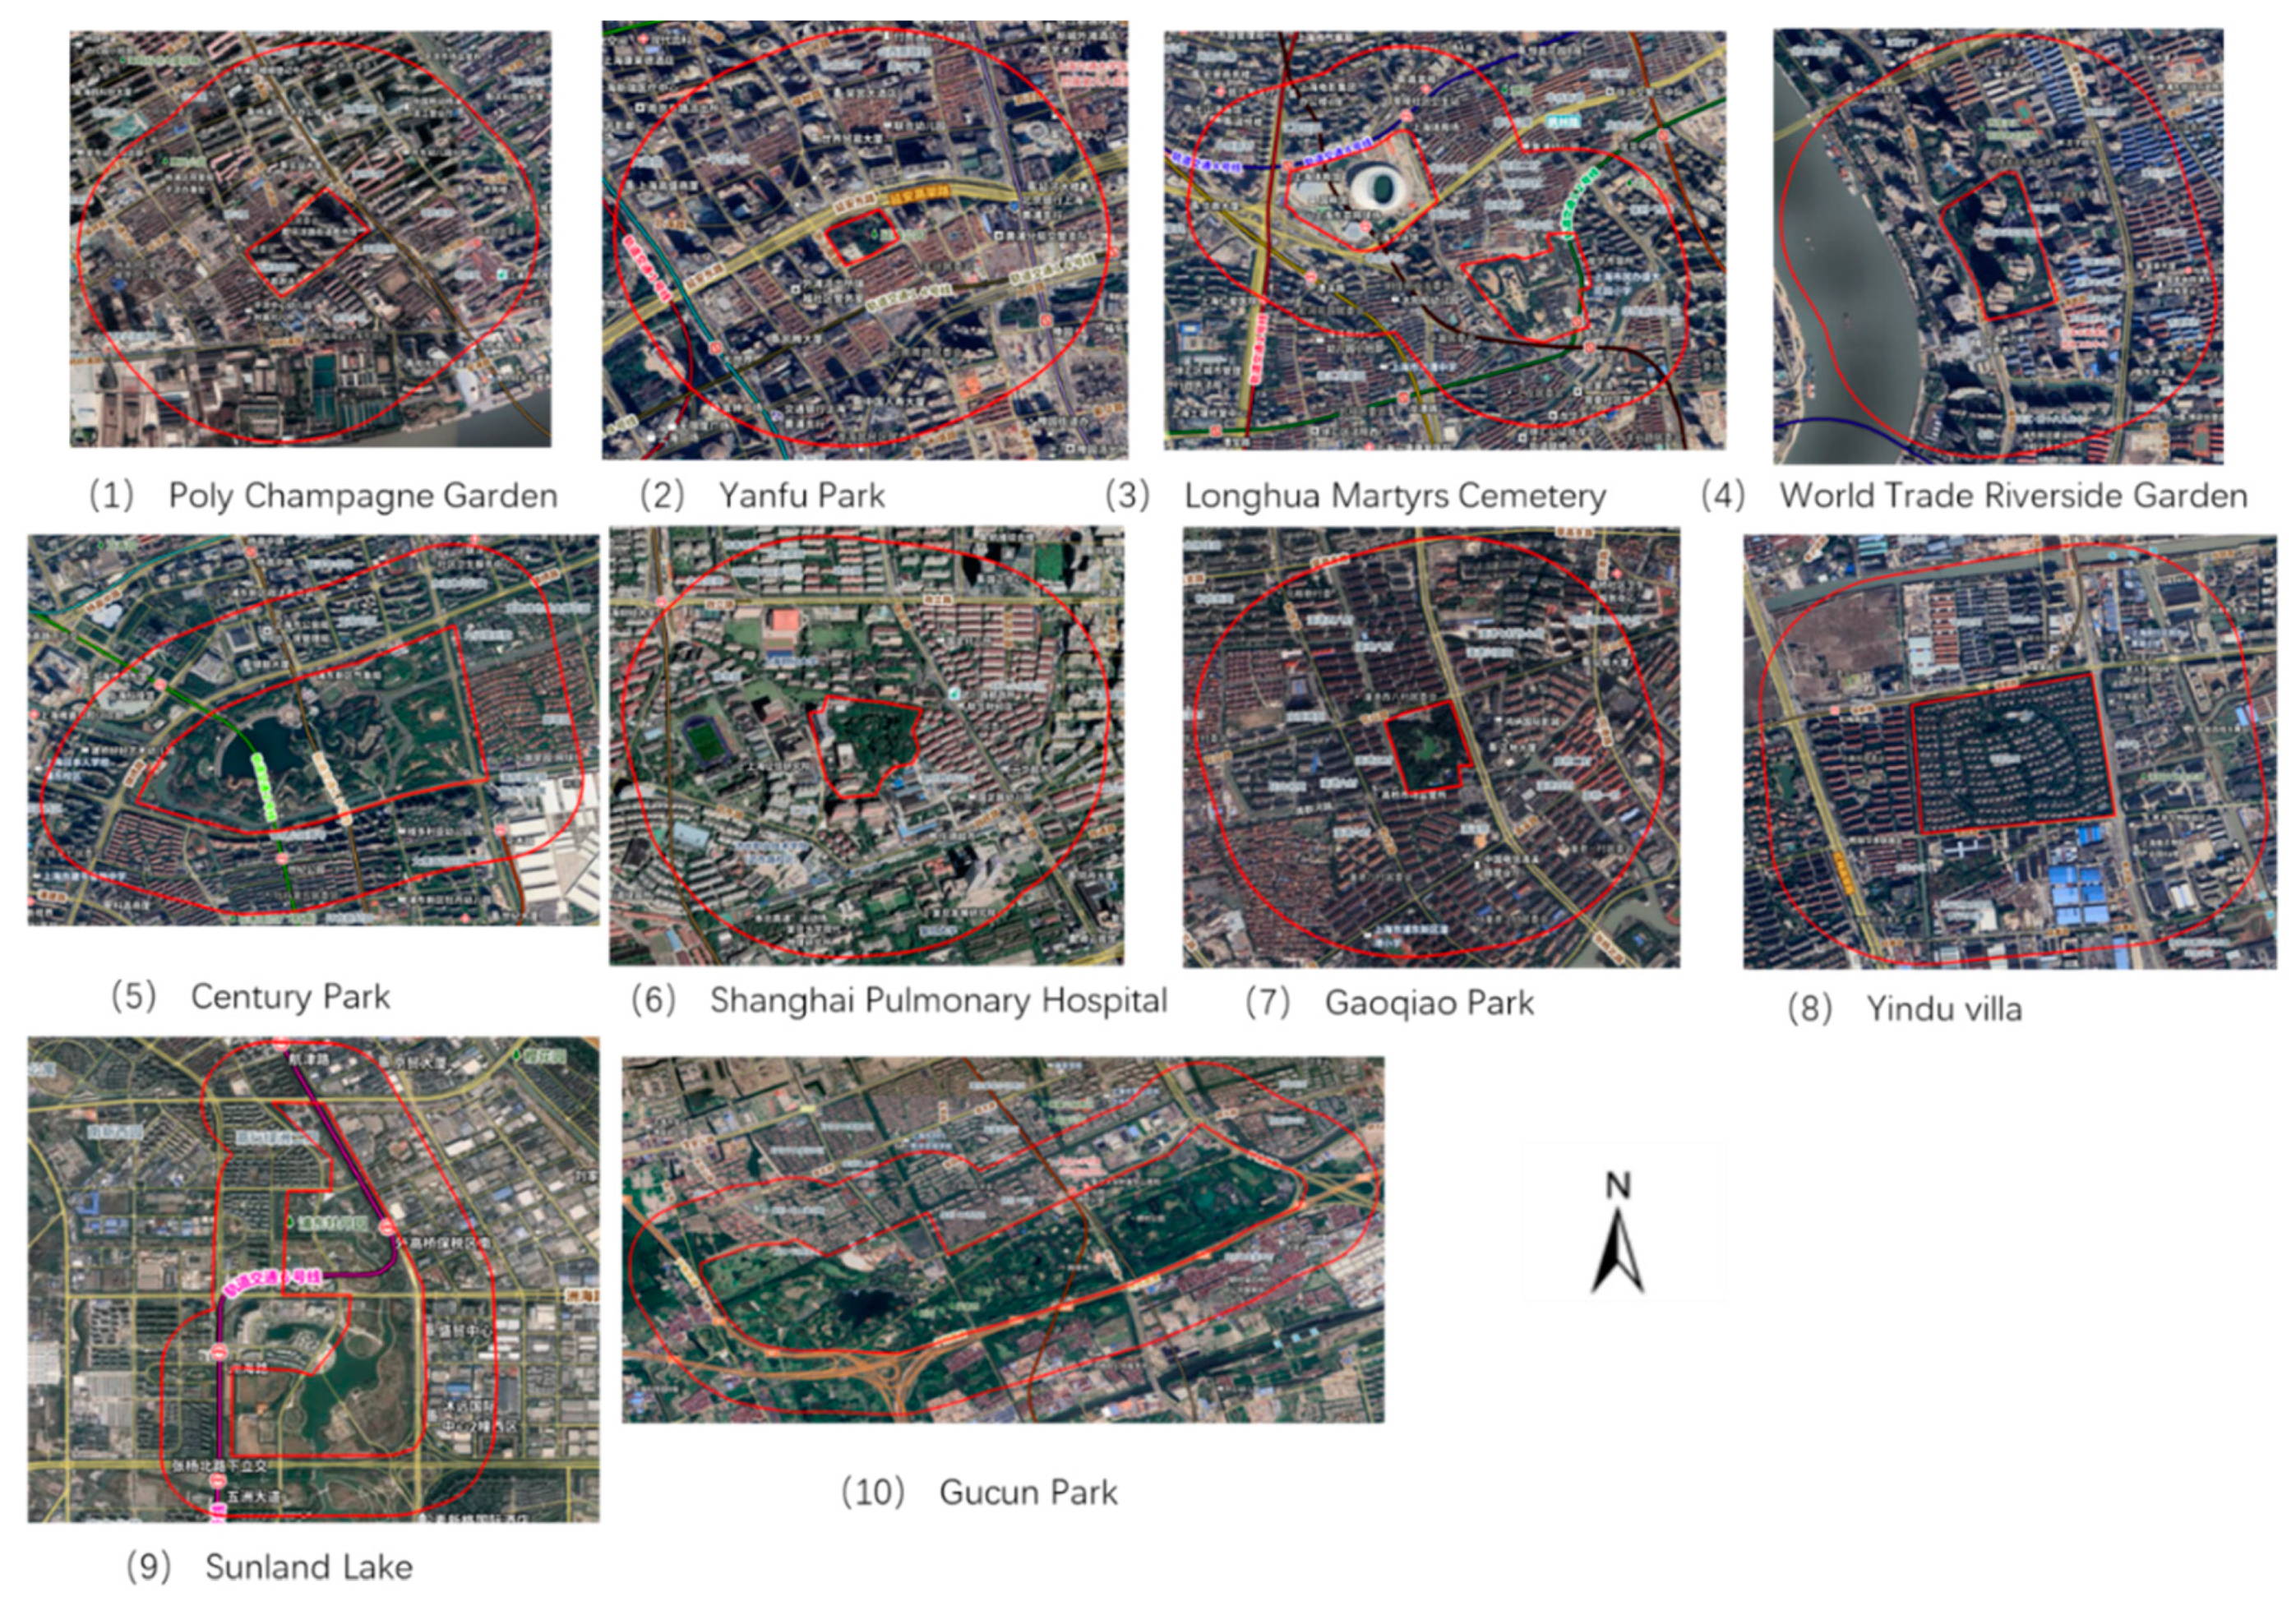
Figure 5.
Divergent LST patterns at typical UTHSs.
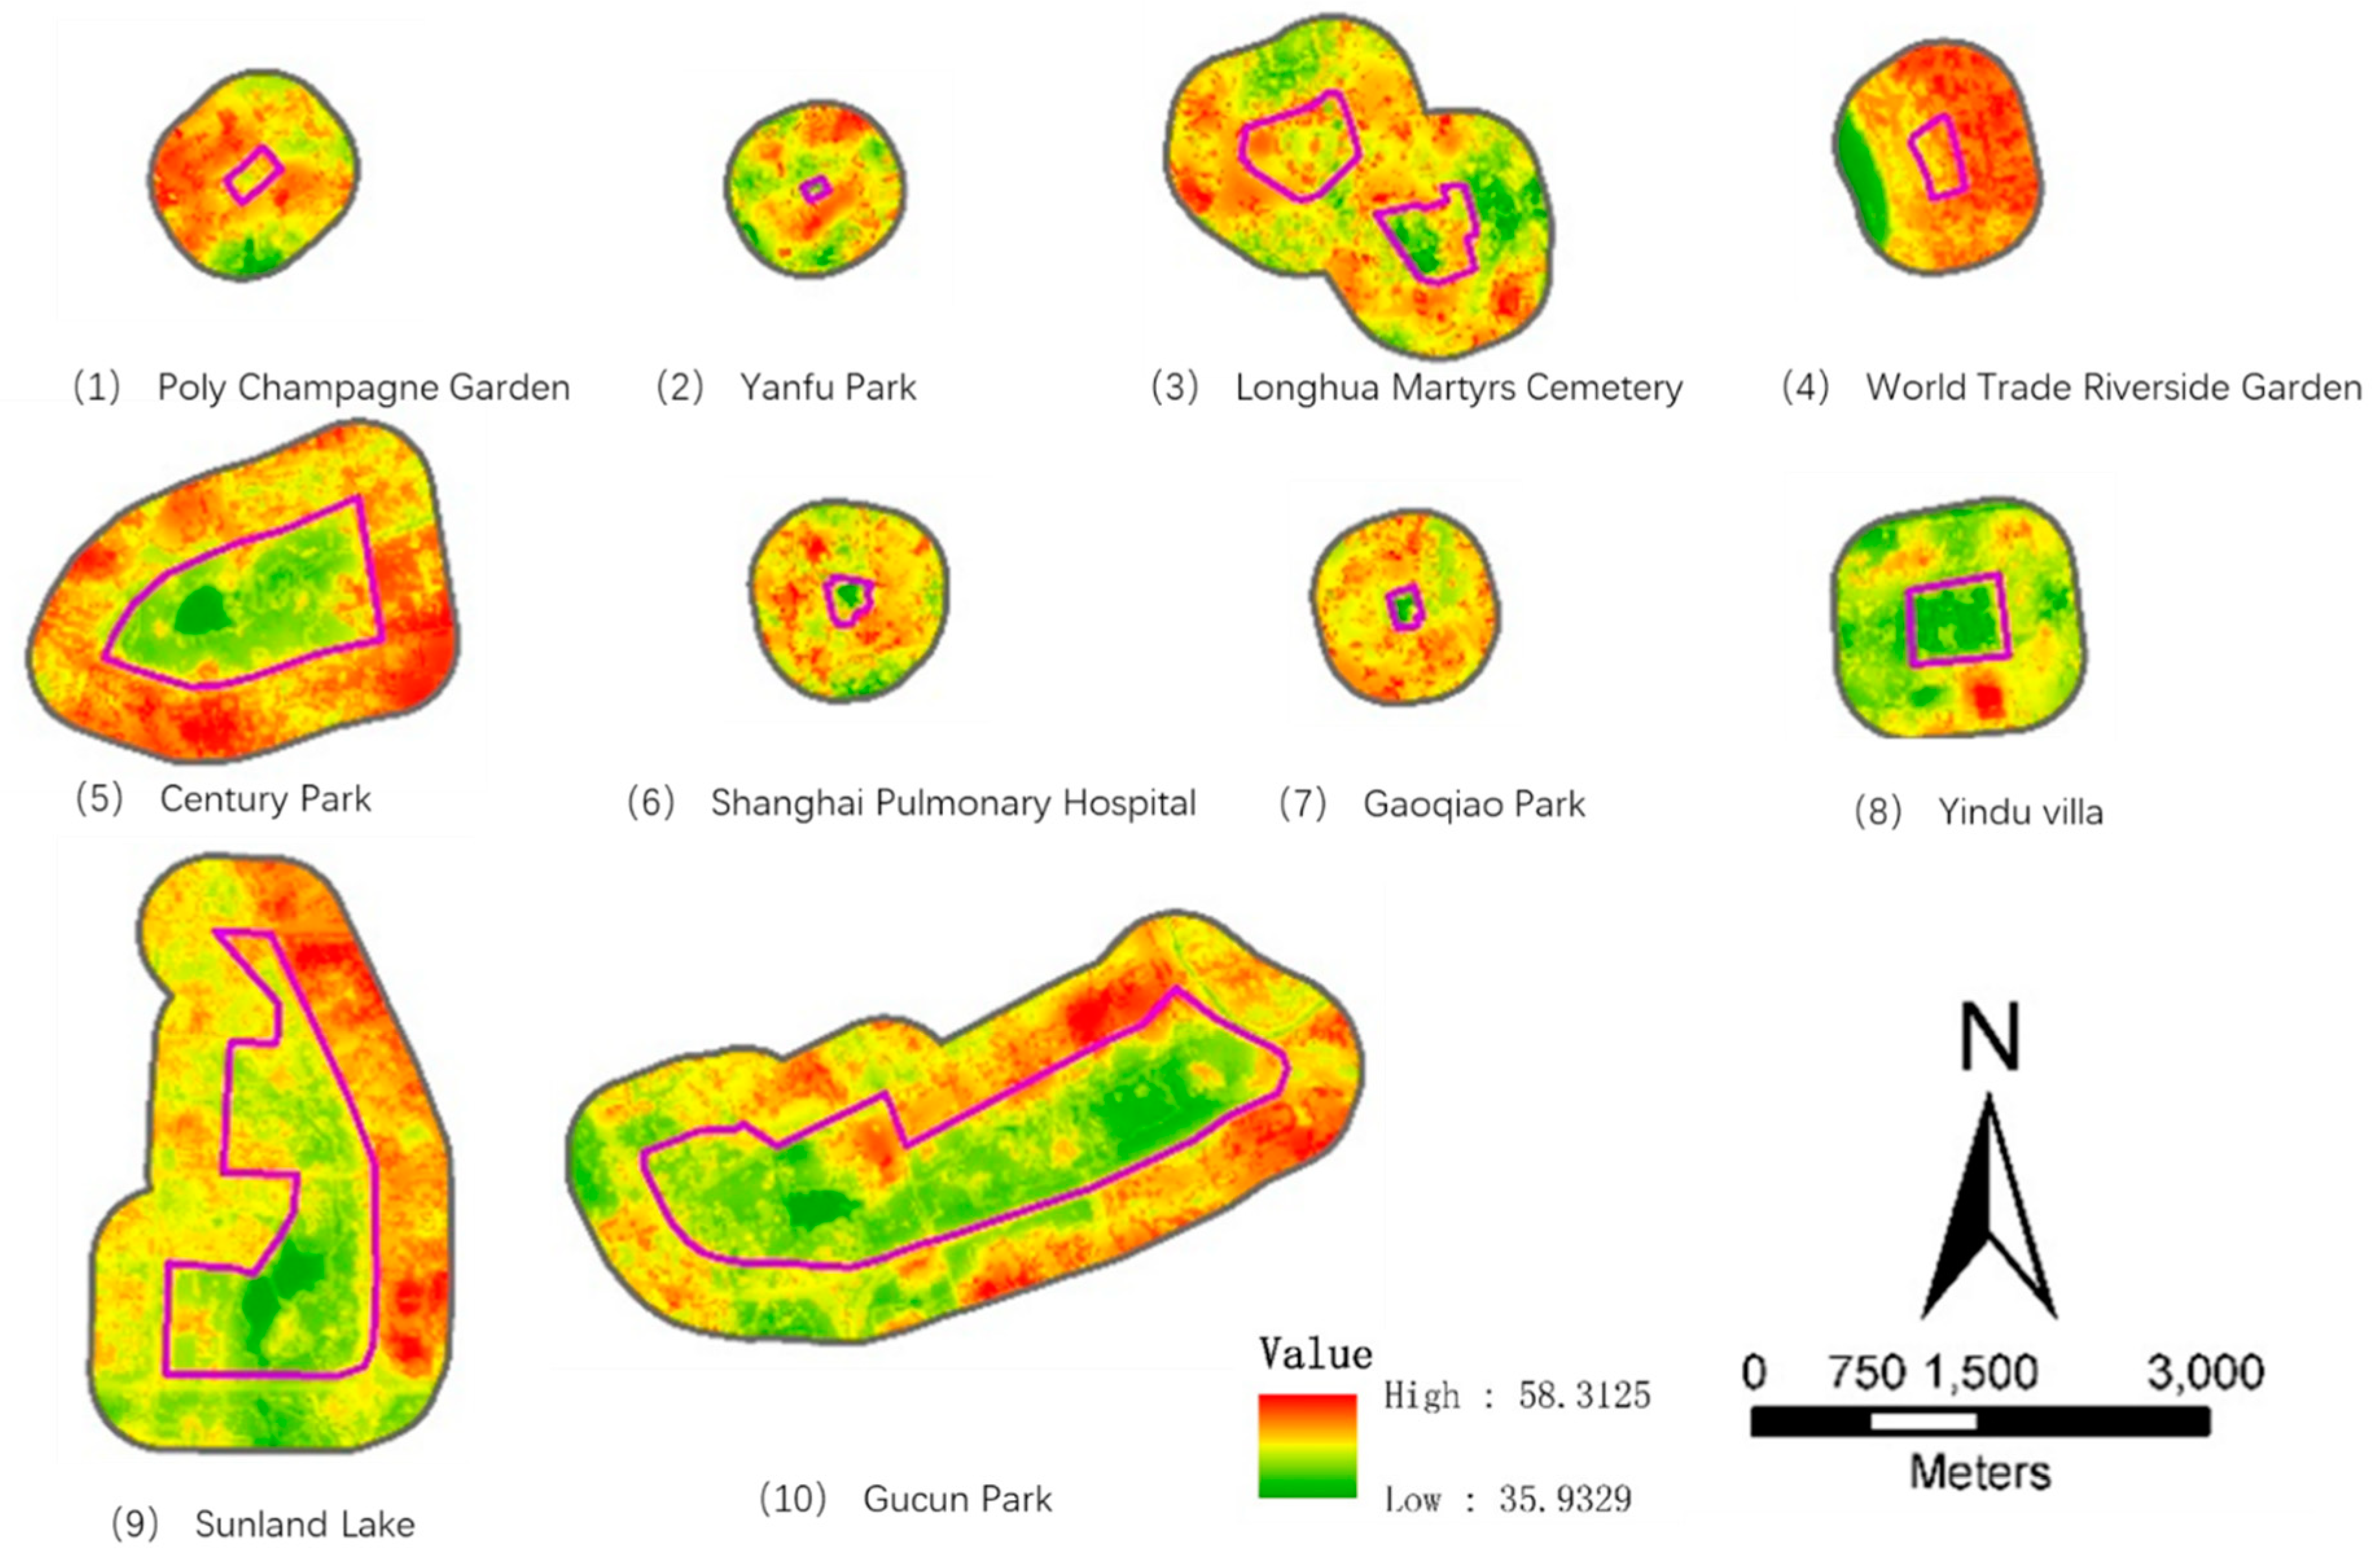
Table 1.
Data sources and description
| Data | Description |
|---|---|
| Landsat-8/9 OLI/TIRS images | By the U.S. Geological Survey (United States Geological Survey, the USGS, http://earthexplorer.usgs.gov/) provided by the Earth Explorer data download sites. Among the available high-quality cloud-free images collected in the summer of 2013-2022, considering the time span and interval of the whole study period, five phases of images were selected in this study: August 29, 2013, August 3, 2015, August 24, 2017, August 16, 2020, and August 14, 2010. |
| Sentinel-1/2 images | Sentinel is a series of Earth observation satellites launched by the Copernicus Program of the European Space Agency (ESA). The image was downloaded from the Open port provided by the European Space Agency(https://dataspace.copernicus.eu/browser/?zoom=3&lat=26&lng=0&visualizationUrl=https%3A%2F%2Fsh.dataspace.copernicus.eu%2Fogc%2Fwms%2Fa91f72b5-f393-4320-bc0f-990129bd9e63&datasetId=S2_L2A_CDAS&demSource3D=%22MAPZEN%22&cloudCoverage=30) |
| Land use map | This map of land use cover in 2013 was originally generated using an object-oriented classification method based on orthophose-corrected high-resolution Quickbird satellite imagery. Based on the field investigation data, the classified products were further manually corrected and verified, and re-sampled to TIF grid (1m resolution), with an overall correction accuracy of 91.1%[33]. |
| Building profile data | The building outline is a high-resolution Quickbird satellite image using orthographic correction, and outside the range is manually drawn using the 91-image assistant. |
| Digital city thematic products | Commercial thematic layers contain specific land use covers, such as buildings, warehouses, industrial parks, transportation lines, vegetated areas, and bodies of water. (Beijing Digital Space Technology Co., LTD.) |
| Baidu map | Baidu Maps Baidu web products, including high-resolution satellite images (still/no historical review), thematic features (such as buildings, roads, traffic lines, etc.), and street views with retrospective photos. |
| 91Weitu Map | The online high resolution satellite image and city digital thematic service layer products operated by Beijing Qianfan World View Company.((https://www.91weitu.com)) |
| Tianditu map | operated by the National Platform for Common Geospatial Information Services (https://vgimap.tianditu.gov.cn/) |
| Ground truth data | Collected in 8 annual field surveys conducted between 2013 and 2020, with intervals of 3-6 months, focusing on the land use type and development pattern of each typical sample area, building height was measured on-site using the Edkors™ model AS1000H handheld height finder. |
Table 2.
Main influencing variables of built environment impact LST in the study area.
| Dimension | Indicator name | Formula | Meaning |
|---|---|---|---|
| Building index | Proportion of impervious surface area | The proportion of surfaces in a given area that are artificially constructed or artificially enclosed by buildings, roads, sidewalks, etc. | |
| Building height(BH) | / | The vertical height of a building, usually indicates the distance from the outdoor floor to the roof of the building | |
| UGI index | Class area(CA) | It can directly reflect the size of different landscape element types | |
| percentage of landscape(PLAND) | The relative percentage of a certain patch type in the total landscape area can be used to judge the landscape dominance | ||
| largest patch index(LPI) | The maximum continuous patch area as a percentage of the entire landscape area | ||
| patch density(PD) | It reflects the degree of fragmentation and spatial heterogeneity of landscape segmentation | ||
| CLUMPY |
|
It reflects the aggregation and dispersion of patches in the landscape, and the value is between -1 and 1 | |
| COHESION | Represents the distance and arrangement pattern of patches in the landscape, reflecting continuity | ||
| Aggregation Index (Al) | AI∈ (0,100). AI examined the connectivity between patches of each landscape type. | ||
| Splitting Index(SPLIT) | SPLIT is the sum of the square of the total landscape area divided by the square of the patch area | ||
| Landscape Shape Index (LSI) | Reflects the complexity of landscape structure, that is, the larger the value, the more complex the shape |
* The class-level metrics of UGI are calculated using Fragstats 4.2. The definition and calculation of adoption indicators are detailed in the User Guide[38].
Table 3.
Table of the area proportion of five types of UTHSs regions under three spatial layers.
| Type | Whole area=Core area+Buffer zone | Core area | Buffer area | ||||||
| Proportion of impervious surface area (%) | Proportion of building area (%) | Proportion of UGI area (%) | Proportion of impervious surface area (%) | Proportion of building area (%) | Proportion of UGI area (%) | Proportion of impervious surface area (%) | Proportion of building area (%) | Proportion of UGI area (%) | |
| C1 | 98.95 ±0.91 |
34.62 ±10.97 |
1.05 ±0.91 |
98.28 ±1.18 |
21.2 ±5.39 |
1.72 ±1.18 |
98.98 ±0.89 |
35.05 ±11.03 |
1.02±0.89 |
| C2 | 93.20 ±4.58 |
24.86 ±9.60 |
6.80 ±4.58 |
72.03 ±13.52 |
12.8 ±8.38 |
25.82 ±15.16 |
94.62 ±4.91 |
27.72 ±7.43 |
5.38±4.91 |
| C3 | 89.83 ±8.29 |
23.22 ±8.22 |
10.17 ±8.29 |
85.73 ±7.58 |
16.1 ±4.78 |
14.27 ±7.58 |
89.63 ±10.48 |
23.38 ±9.15 |
10.37±10.48 |
| C4 | 93.75 ±3.29 |
21.30 ±3.23 |
6.25 ±3.29 |
91.84 ±3.59 |
16.6 ±4.55 |
8.16 ±3.59 |
93.98 ±3.26 |
21.73 ±3.18 |
6.02±3.26 |
| C5 | 83.78 ±15.02 |
19.27 ±8.15 |
15.54 ±14.93 |
53.88 ±14.60 |
6.22 ±6.48 |
52.27 ±13.85 |
88.27 ±15.01 |
21.28 ±7.75 |
11.20±14.93 |
| Entire-ty | 89.14 ±11.73 |
22.61 ±9.20 |
10.56 ±11.54 |
69.51 ±20.05 |
11.3 ±8.20 |
32.64 ±8.20 |
91.51 ±11.30 |
24.36 ±8.56 |
8.26±11.19 |
* UGI area ratio is equivalent to PLAND index. The proportion of building construction area is included in the proportion of impervious surface area.
Disclaimer/Publisher’s Note: The statements, opinions and data contained in all publications are solely those of the individual author(s) and contributor(s) and not of MDPI and/or the editor(s). MDPI and/or the editor(s) disclaim responsibility for any injury to people or property resulting from any ideas, methods, instructions or products referred to in the content. |
© 2024 by the authors. Licensee MDPI, Basel, Switzerland. This article is an open access article distributed under the terms and conditions of the Creative Commons Attribution (CC BY) license (http://creativecommons.org/licenses/by/4.0/).
Copyright: This open access article is published under a Creative Commons CC BY 4.0 license, which permit the free download, distribution, and reuse, provided that the author and preprint are cited in any reuse.


