Submitted:
18 April 2024
Posted:
19 April 2024
You are already at the latest version
Abstract
This research focusing on the environmental impact of tire and brake pad wear constitutes a significant area of transport-related studies. These two key vehicle components are not only the most frequently worn, but also generate micro and nano pollutants (i.e., rubber, metal oxides) that potentially harm the environment. Over half of the globally produced natural and synthetic rubbers, which amounted to about 30 million tons in 2022, are used for tire production. According to Wagner et al.'s research, over 1.3 million tons of such particles are released due to wear and tear in the European Union alone. This work focuses on examining snow deposits from various locations in an urban agglomeration (Poznan, Poland) in the winter season. FT-IR and NMR spectroscopic studies, optical and electron scanning microscopy SEM-EDS, and particle size studies using the DLS technique were conducted for a detailed characterization of pollutants in the environment. The conducted particle separation methods allowed for the extraction of a fraction mainly containing gum residues with particle sizes less than 2 µm. The results of these studies are crucial for understanding the impact of vehicle part exploitation on the environment.
Keywords:
tire
; rubber
; metal oxides
; environmental pollution
; nanoparticles
; microparticles
1. Introduction
Tire abrasion occurs during the power transfer where the tire makes contact with the road, engaging with diverse elements such as leftover leaves, soil fragments, sand, and water. Consequently, the abrasion isn't solely attributed to tire degradation but rather to a combination of various substances. In literature, the term "tire road and wear particle" (TRWP) is often used, even when referring to a mixture of particles originating from tire wear and road surfaces. In addition to larger particles that settle on the road or are transported to roadside soils or surface waters, there is also a fraction of smaller particles that can be carried by the air. This fraction plays a significant role in public health hazards and accounts for a maximum of 10% of the total mass emission associated with tire wear [1]. Non-exhaust particle emissions arise from abrasion of the brakes and tires and wear of the road surface, as well as from resuspension of road dust. These particles exhibit a diverse morphology, manifesting in various shapes. They are characterized by significant porosity, which contributes to their unique physical properties [2]. Furthermore, their qualitative composition may differ from the original material, indicating a chemical transformation during the formation process [3].
The tire manufacturing industry utilizes approximately 60% of produced natural and synthetic rubbers. Tires have varying compositions depending on their intended application, but most commonly consist of natural rubber, styrene-butadiene, and butadiene. During wear, they undergo abrasion, leading to the formation of so-called Tire Wear Particles, which contaminate the environment along with concurrently abraded road materials (i.e., bitumen, aggregate) [4]. In the research conducted by Stalnaker et al., it was demonstrated that the degree of tire wear, which is associated with the release of a larger amount of pollutants, is several times higher in urban agglomerations than during highway driving [5]. This is related to more dynamic driving, frequent braking, and maneuvering. This phenomenon can be attributed to the complex driving conditions in urban areas, characterized by frequent starts and stops, as well as the need for constant maneuvering due to traffic congestion. These factors contribute to accelerated tire wear and subsequently, an increased release of pollutants [6].
The emissions of these particles can be categorized into airborne, which constitute over 90% of total emissions, and non-airborne [7]. It is assumed that the primary source of metals released into the environment are particles resulting from tire friction and brake pad wear [8], such as iron, lead, chromium, copper, titanium, and many others [9-13]. Additionally, it is estimated that as a result of the abrasion of these materials, up to 1,327,000 tons of tearwear particles are produced annually within the European Union alone [8]. Reports are available presenting various tire brands with the amount of worn material during driving.

Table 1.
The mass of particles resulting from the abrasion of a winter tire while driving for selected tire models. Data based on the ADAC report of December 2021, München [14].
Table 1.
The mass of particles resulting from the abrasion of a winter tire while driving for selected tire models. Data based on the ADAC report of December 2021, München [14].
| Trade name of the type of winter tire tested | Mass of tires wearing out while driving [g/ 1000 km] |
Trade name of the type of winter tire tested | Mass of tires wearing out while driving [g/ 1000 km] |
|---|---|---|---|
| BF Goodrich G-Force Winter 2 | 100 | Barum Polaris 5 | 143 |
| Michelin Alpin 6 | 105 | Continental Winter Contact TS860 | 145 |
| Vredestein Wintrac | 109 | GT Radial Winter Pro 2 | 149 |
| General Tire Altimax Winter 3 | 124 | Laufenn i Fit+ LW31 | 159 |
| Nokian WR Snowproof | 127 | Yokohama Bluearth*Winter V906 | 163 |
| Dunlop Winter Response-2 | 132 | Falken Eurowinter HS01 | 164 |
| Goodyear Ultra Grip 9+ | 134 | Maxxis Premitra Snow WP6 | 167 |
| Kumho Wintercraft WP51 | 137 | Bridgestone Blizzak LM005 | 171 |
These particles are one of the main sources of microplastic pollution in both aquatic and terrestrial environments [6,15-17]. It's important to note that the majority of pollutant emissions come from tires more than brakes. In combustion engine vehicles, over 45% of emissions stem from tire wear, while only 25% are derived from brakes. Furthermore, conducted studies have revealed that due to the increased weight of electric motor vehicles, this emission escalates to 61%. This highlights the significant role of tire wear in vehicular pollution, a factor that warrants further investigation, particularly in the context of the growing prevalence of electric vehicles [18-20].
In the scientific literature, there are known examples of studies aimed at detecting and quantifying particulate matter resulting from tire and road wear. These particles have been identified in various environments, including soil, road tunnels, snow deposits, and aquatic ecosystems [8,21-26]. Simulative studies were also conducted under laboratory conditions to determine the content of tire wear particles. It was observed that the emission of particles varies depending on changes in driving conditions. Physicochemical analyses of these pollutants revealed a high content of carbon and silicon, heavy metals, sulfur, and mineral substances [27-29]. Research conducted by Tonegawa & Sasaki demonstrated that under such conditions, the release coefficient of airborne particles (PM10, PM2.5) is merely about 4% of the mass. Consequently, the majority of pollutants from tire residues remain on road surfaces [29-30]. The methodologies presented in these studies are comprehensive, encompassing sample preparation procedures for subsequent analysis. However, these studies underscore the absence of standardized methods, which impedes the uniformity of the results presented across different research efforts. Furthermore, scientists Mennekes and Nowack in their article highlight the fact that a significant majority of studies are based on the collection of already available data and the estimation of Tear Wear Particle quantities, rather than on actual determination and conducting of investigation [31].
There are many studies on the impact of these particles on the aquatic environment [32-38]. Research on the toxicity of these pollutants indicates that they have a detrimental effect on the photosynthesis of aquatic plants and exert toxic effects on certain filter-feeding species, such as Daphnia magna [15,39]. Given the potential environmental impact of these particles, it is crucial to determine local emissions in various environments. This will allow for more extensive data collection and enable a more accurate estimation of the pollution level in different regions.
Further research is needed to develop standardized methods for the detection and quantification of these particles. This will not only improve the consistency of the results across different studies but also contribute to a better understanding of the environmental impact of tire and road wear particles. Moreover, the development of mitigation strategies to reduce the emission of these particles and their subsequent environmental impact should be a priority for future research [4,40-41].
This study presents the characteristics of micro and nano pollutants obtained from snow deposits, roadside sand and water from various locations in an urban agglomeration (Poznań, Poland). From the obtained sediments, fractions mainly containing tire particles were extracted using a washing method with organic solvents such as isopropanol and dichloromethane. Subsequently, to identify and characterize the obtained materials, spectroscopic studies (XRD, FT-IR, and NMR), particle size measurement (DLS), optical and electron scanning microscopy (SEM-EDS), and thermogravimetric analysis (TGA) were conducted.
2. Materials and Methods
2.1. Materials
The chemicals were purchased from the following sources:
Dichloromethane and isopropanol Chempur, Piekary Slaskie, Poland; chloroform-d from Deutero, Gdansk, Poland.
2.2. Preparation of Samples for Testing
Samples for analysis were collected during the winter from various points located in Poznań, Poland, as indicated on the map (Figure 1, Table 2). The samples were in the form of snow, precipitation water, or sand. This city is situated in the western region of Poland, on the Greater Poland Lake District, along the Warta River, and has a population of over 540,000 (as of 2023).
Snow, along with contaminants, was dissolved on a filter, and the remaining sediment was rinsed with isopropyl alcohol (extract 1); additionally, a portion of the sediment was washed with dichloromethane (extract 2). The obtained fractions were concentrated and the concentration of dissolved particles in them was determined (Figure 2.).
For each extract, spectroscopic characterization (FT-IR and NMR) and microscopic analysis (SEM-EDS) were conducted, particle sizes were determined (DLS), and thermogravimetric analysis (TGA) was performed under nitrogen and air atmospheres.
The residue remaining after extraction was sieved using a vibratory sieve, separating fractions > 1mm, 250 um - 1 mm, 100-250 um, 40-100 um, 25-40 um, and <25 um, which were then characterized using spectroscopic methods (FT-IR), microscopic techniques (optical, SEM-EDS), and thermogravimetric analysis (TGA). Particle size measurement was conducted for selected fractions, namely 40-100 um, 25-40 um, and <25 um (DLS).
2.3. Determining the Concentrations of Tire Wear Particles
Samples of snow and street sediments, collected from various locations, underwent a multi-step extraction process using isopropanol and dichloromethane. This multi-stage procedure aimed to effectively remove contaminants and concentrate the particles present in the samples (Table 3). Subsequently, the solvents were evaporated using a laboratory evaporator, and the particle content was determined. Depending on the sampling location, such as roadside or parking areas, the concentration of extracted particles varied. The multi-step washing process and subsequent particle content analysis allowed for the determination of the chemical composition and morphology of particles from different locations.
2.4. Methods
Thermogravimetry (TGA) was performed using a NETZSCH 209 F1 Libra gravimetric analyzer (Selb, Germany). Samples of 5 ± 0.2 mg were placed in Al2O3 crucibles. Measurements were conducted under nitrogen and air (flow of 20 mL/min) in the range of 30–800°C and 10°C/min heating rate.
1H and 29Si nuclear magnetic resonance (NMR) spectra were recorded at 25 °C on Bruker Ascend 400 and Ultra Shield 300 spectrometers using CDCl3 as a solvent. Chemical shifts are reported in ppm regarding the residual solvent (CHCl3) peak for 1H and 13C.
Fourier transform-infrared (FT-IR) spectra were recorded on a Nicolet iS50Fourier transform spectrophotometer (Thermo Fisher Scientific, Waltham, MA, USA) equipped with a diamond ATR unit with a resolution of 0.09 cm−1.
Particle size distribution of pollution particles was determined by a Mastersizer 3000 (Malvern Instruments Co. Ltd., Malvern, UK) using the laser diffraction method for powder substances using the Aero-S dry dispersion system, for liquids Hydro-UV wet dispersion. The analyses were conducted in isopropyl alcohol at room temperature. Five independent measurements in three series were taken for each sample.
A digital light microscope Keyence VHX 7000 (Keyence International, Mechelen, Belgium) with 100- x1000 VH-Z100T lens was used to examine the obtained material. All images were recorded with a VHX 7020 camera.
Sample surface morphology (SEM) and chemical composition (SEM-EDS) were analyzed using a Phenom XL scanning electron microscope.
X-ray diffraction studies were carried out on a Bruker D8 Eco Advance X-ray (Germany) diffractometer to determine the phase structure of the samples. The diffractometer works in geometry θ–2θ with a Cu-Kα lamp (λ = 0.15406 nm). The following parameters were used for measurements: radiation 40 kV and 25 mA, angular range 2θ 15-70°, step width 0.01°, and step time 3 s.
3. Results
3.1. Microscopic Analysis
3.1.1. Optical Microscopic Analysis
To preliminarily ascertain the composition of individual fractions post-extraction, microscopic images of the acquired sediments were captured using an optical microscope (Figure 3). The analysis revealed that sand was predominant in all fractions. Fractions containing particles within the range > 40 μm (Figure 3, C-E) exhibited the presence of organic matter (such as plant fragments, etc.). Additionally, dark artifacts observed in the microscopic images were identified as iron particles.
This hypothesis was experimentally validated through Scanning Electron Microscopy-Energy Dispersive Spectroscopy (SEM-EDS). Leveraging the magnetic properties of iron, its particles were isolated from the systems using a magnet. The presence of iron in the samples is most likely associated with the abrasion of brake pads during their usage (Figure 4).
3.1.2. SEM/EDS Analysis
Figure 5 and Figure 6 illustrate the morphology of fractionated sediment samples and products of extraction with organic solvents. These samples exhibit irregular geometry and shape, with their dimensions aligning with the conducted fractionation process. Powders with a fraction <25 μm have a flake shape, and particles larger than 20 μm are angular. Smaller particles also have an acicular shape. It is worth noting that the particles in the <25μm fraction are of various sizes. There are very small (<10 μm) and larger (>10 μm) particles. With larger fractions, the particles have more similar sizes and homogeneous shapes. Mainly, the particles have a rounded and angular shape. Additionally, Energy-Dispersive Spectroscopy (EDS) spectroscopy was performed, and the results were compiled in Table 4. Depending on the sample's origin, they display diverse chemical compositions.
Samples collected from roadside sand contained a higher concentration of mineral components, such as calcium, aluminum, sodium, and metals like iron, likely originating from the wear and tear of brake pads. Furthermore, tellurium was detected in these samples. The sources and confirmation of its presence in the surface layer of soil at the sampling site have been extensively described in the work by Filella et al. [42].
EDS analysis of materials obtained from melted snow did not reveal the presence of calcium, which is consistent with the information provided in the section discussing thermogravimetric analysis (Section 3.3).
Figure 6 depicts images of particles obtained from extraction according to the described procedure (Section 2.2.) using a scanning electron microscope (SEM). These particles exhibit a spherical shape and tend to agglomerate, leading to the formation of larger clusters with sizes smaller than 2 µm. The precise sizes of these particles were further examined using the Dynamic Light Scattering (DLS) technique, which is described in Section 3.2.
The EDS analysis of all samples (Figure 5. A-F) revealed only the presence of carbon. This further confirms that the organic fractions extracted contain rubber particles originating from car tires.
3.2. Determination of Particle Distribution
For samples post-extraction, containing significant amounts of dry sediment, Dynamic Light Scattering (DLS) particle size studies were conducted (Table 5). The homogeneity of the distribution, the surface area of the particles, and the Dx (10, 50, 90) values were established. These studies, like sieve size measurements from optical microscopy and SEM, confirmed the effective separation of the material into individual fractions. Depending on the source of the samples, there are differences in their specific surface area and homogeneity, for example, the CZT2 sample from snow deposits is characterized by less homogeneity and also the largest specific surface area of the 25-40 μm fraction.
Figure 7 illustrates the measurement of particle sizes obtained through extraction with isopropanol and dichloromethane. The size of the majority of samples falls within the range of 0.01-0.5 µm for the isopropanol fraction and 0.01-0.3 µm for the dichloromethane fraction. Depending on the source of the material, particles of varying sizes are washed out. The extraction of sands with isopropanol (SZY, UMU, BIS) resulted in the acquisition of particles with sizes predominantly between 0.04-0.05 µm. However, when the starting material was snow, the sizes were CZT2 0.055 µm, CZT1 1.0 µm, and DK11 0.1 µm respectively. Subsequent washing with dichloromethane leads to the extraction of smaller particles, with their sizes being more similar to each other.
3.3. Thermogravimetric Analysis (TGA)
Thermogravimetric analysis of the dry extracts (DCM, iPr) was performed to analyze the content of the components of the nano rubber particles. Furthermore, experiments were performed for selected sediments with fractions < 25 µm, 25 – 40 µm, 40 – 100 µm, 100 – 250 µm, and 250 µm – 1 mm to ascertain the presence of organic and other compounds, which were washed with both dichloromethane and isopropanol. The analysis was conducted under inert gas and air atmospheres. From the TGA data, the residue mass and temperatures corresponding to the maximum decomposition rates (Tmax) were determined.
In Figure 8, thermograms of dry extracts for analysis conducted in the nitrogen atmosphere (Figure 8A) and air atmosphere (Figure 8B) are presented. In the nitrogen atmosphere, a one-step decomposition of the dichloromethane extract is observed with a Tmax = 445.8°C, corresponding to the thermal degradation of polymers (nano rubber). Thermal analysis results indicate that washing with dichloromethane effectively enabled the extraction of nanoparticles. Based on literature analysis, it was determined that Tmax for SBR rubbers is approximately 449°C [43], and for EPDM rubbers Tmax= 409°C [44]. In the conducted analyses in this article, it is not possible to unequivocally determine the qualitative composition of the rubber due to the diverse composition of the collected samples. The residual residue mainly consists of black carbon and other fillers. A multi-step curve profile is observed for the isopropanol extract, resulting from the extraction of a wide range of compounds. In the initial stage, the elimination of volatile substances such as organic solvents is observed. In the temperature range of 200-500°C, the greatest mass loss exceeding 55% is observed, which is attributed to the overlapping thermal processes occurring in the tested samples. Degradation of polymers and medium-volatile materials such as elastomers and curing agents is observed within this temperature range [45]. Additives present in the tire composition, such as oils (including naphthenic oil, paraffinic oil, and highly aromatic oil), plasticizers, low molecular weight oligomers, emulsifiers, waxes, and antioxidants, undergo a process of evaporation due to the elevated temperature. Above the temperature of 550°C, decomposition of remaining inorganic compounds (non-volatile materials, metal oxides, etc.) occurs. In the range of 720-820°C (Tmax=769.6°C), a peak is observed, likely originating from the decomposition of calcium carbonate to calcium oxide, indicating the presence of carbonate material [46]. In some cases, calcium carbonate is used as an additive in rubber mixtures. During thermal analysis in an oxidizing atmosphere for chloromethane extract, initially, desorption of volatile compounds is observed. Subsequently, similar to what occurred in an inert atmosphere, polymer degradation is observed. Additionally, in the air atmosphere, an additional peak was observed on the DTG curve at Tmax = 538.8°C originating from the combustion of carbon black, extracted solely using DCM [47]. It has been observed that in the case of extracts obtained using dichloromethane, a high content of carbon black is observed, whereas in the case of extracts obtained solely using isopropanol, lighter molecules present in the rubber composition, such as plasticizers, oils, etc., are washed away.
Figure 9 and Figure 10 present thermogravimetric curves for the SZY, UMU, BIS, CZT2 sediments. A multi-stage decomposition is observed, which is a result of the complex nature of the samples, in terms of their varied compositions, types, and collection locations. The analysis of SZY and UMU samples, collected as sand from areas near busy streets, shows similar degradation mechanisms (five-stage sample decomposition). The first stage of decomposition, in the temperature range of 30-150°C, corresponds to the phase of dehydration and desorption of volatile substances. The next stage, occurring in the temperature range of 190-540°C, is characterized by the presence of two peaks and is associated with the decomposition of organic matter, as well as remaining rubber particles that were not extracted due to their larger particle sizes. Samples with the largest grain fraction (250 µm – 1 mm) show the highest percentage content of organic matter among the studied sediments. Above a temperature of 600°C, the thermal decomposition of carbonates begins. The residual mass consists of inorganic residues, which occur in soils and car pollutants.
The BIS and CZT2 samples, collected respectively as sand and snow, differ slightly in the range of higher temperatures from samples collected as sand occurring near busy streets. The first stage of decomposition, in the temperature range of 30-150°C, is analogous to the SZY and UMU samples and corresponds to the phase of dehydration and desorption of volatile substances. The second stage (190-540°C) is associated with the decomposition of organic matter, as well as remaining rubber particles that were not extracted due to their larger particle sizes. Above a temperature of 600°C, one peak is observed, not two as in the case of UMU and SZY, which indicates a less diversified occurrence of inorganic compounds.
Table 7.
Thermogravimetric analysis data for the CZT2 and BIS samples.
| CZT2 | Tmax1 [°C] | Tmax2 [°C] | Tmax3 [°C] | Tmax4 [°C] | |
|---|---|---|---|---|---|
| < 25 μm | 67.9 | 316.3 | 435.0 | 700.3 | |
| 25 -40 μm | 69.8 | 319.1 | 438.2 | 703.2 | |
| 40 - 100 μm | 72.6 | 326.3 | 442.3 | 680.0 | |
| 100 - 250 μm | 66.5 | 336.0 | 448.0 | 691.3 | |
| 250 μm - 1 mm | 66.2 | 335.9 | 449.4 | 686.4 | |
| BIS | Tmax1 [°C] | Tmax2 [°C] | Tmax3 [°C] | Tmax4 [°C] | |
| < 25 μm | 71.9 | 310.6 | 428.6 | 670.6 | |
| 25 -40 μm | 70.5 | 317.0 | 433.0 | 668.4 | |
| 40 - 100 μm | 71.5 | 323.0 | 437.0 | 669.5 | |
| 100 - 250 μm | 70.6 | 327.3 | 431.7 | 669.7 | |
| 250 μm - 1 mm | 69.3 | 324.4 | 433.7 | 678.0 | |
3.4. Spectroscopic Analysis
3.4.1. NMR Spectroscopy
Proton nuclear magnetic resonance (1H NMR) spectroscopy was employed to determine the qualitative composition of a mixture of substances contained in extracts obtained after washing with dichloromethane (DCM) and isopropanol (iPrOH) (Figure 11). The spectra showed significant similarities, but with differences in their intensity. All the spectra obtained exhibited intense signals from aliphatic chains in the range of 0-3 ppm.
Furthermore, the region from 3-8 ppm can be divided into distinct signal groups: a) 3.4-4.4 ppm from oxygenated groups and oil components; b) 4.6-5.6 ppm from butadiene derivatives; c) 6.4-7.8 ppm from aromatic groups.
The qualitative composition indicates the presence of organic residues that contain substances that are part of the composition of tires. The data presented here are consistent with those available in the literature, suggesting a commonality in the composition of such extracts [24].
3.4.2. FT-IR Spectroscopy
The FT-IR spectra of TRWP obtained through iPr and DCM extraction are presented in Figure 12. Similar to the observations made in NMR spectroscopy, no significant differences in the qualitative composition of both samples are discernible. The spectra exhibit signals from aliphatic hydrocarbons at 2921cm-1, 2852cm-1 (C-H stretching), and 1456cm-1 (C-H bending). Above 3000 cm-1, a weakly intense band from aromatic bonds can be observed. Unsaturated bonds (C=C) also appear in the band below 1600cm-1. The band around 1700cm-1 corresponds to carbonyl groups. These signals align with the anticipated content, primarily composed of residues of micro- and nanoparticles generated due to tire wear (i.g. polymers such as the previously discussed butadiene, and process oils) [48].
3.4.3. XRD Analysis
Figure 13 shows the XRD analysis of selected samples. The XRD results of UMU and CZT2 samples are similar. There are peaks from the same phases: Si2O, Fe2O3, CaSi2O6. They differ only in the intensity of the peaks. In the sample taken from Szymanowskiego Street, in addition to peaks from Si2O, CaSi2O6, and Fe2O3, there is also a reflection from SiC. Similar results were presented in the work of Guleria et al. [49], which analyzed tire chips with other additives. The XRD analysis presented in the work of Guleria et al. shows that the tires contain the same compounds as in the results presented in this paper. Moreover, in the work of Amir et al. [50] XRD of rubber from recycled tires was also examined. Moreover, in the work of Amir et al. XRD of rubber from recycled tires was also examined. In the results of Amir et al. the occurrence of CaCO3 and CaSi2O6 compounds in the tested tires was shown, these compounds also appear in XRD reflections in this work.
5. Conclusions
This research paper provides a comprehensive investigation into the characteristics of micro- and nano-pollutants, focusing on those originating from the degradation of tires and roads in winter season. The study was conducted in Poznań, Poland, characterized by transitional and temperate climatic conditions.
During this period, the streets are typically treated with salt to mitigate ice formation, and the majority of private vehicle users transition to softer tires. These factors contribute to an accelerated rate of tire degradation, leading to an increased generation of the pollutants under investigation.
The initial phase of the study involved the extraction of micro- and nano-pollutants from collected sediments, including snow, sand, and standing water, using organic solvents. The resulting solutions were then analyzed to determine their concentration, particle size, and qualitative composition, utilizing spectroscopic techniques for a comprehensive characterization. The residue, primarily composed of sand and residual organic matter, was left after the extraction process. This residue underwent extensive analysis to identify its composition.
The pollutants characterized in this study exhibited a diverse chemical composition and a broad size range, spanning from 1mm to as small as 1nm. An intriguing observation made during the study was the role of snow in the collection of these pollutants. It was noted that the presence of snow near roads appeared to inhibit the migration of pollutants, thereby acting as a filter and capturing/agglomerating a larger quantity of particles.
A particularly surprising finding of the study was the primary source of the pollutants found in the accumulated snow sediment, as depicted in Figure 14. Contrary to initial expectations, the majority of these pollutants were traced back to worn tires and asphalt, rather than from exhaust gases and oils produced during driving. This finding underscores the significant environmental impact of tire and road wear, highlighting an area that warrants further investigation and action.
In conclusion, this study provides valuable insights into the nature and sources of micro- and nano-pollutants and underscores the need for more sustainable practices in road maintenance and vehicle usage. It is anticipated that these findings will stimulate further research in this field and inform decisions aimed at mitigating environmental pollution.
Author Contributions
Conceptualization, R.E.P.; methodology, R.E.P and M.F. software, M.F., D.P, E.R.R.; validation, R.E.P., M.F., B.S.; formal analysis, M.F., D.P., B.S., E.R.R., R.E.P.; investigation, M.F., D.P., E.R.R.; resources, R.E.P. data curation, R.E.P., M.F.; writing—original draft preparation, M.F., D.P., B.S., E.R.R.; writing—review and editing, R.E.P., visualization, M.F., R.K.; supervision, R.E.P.; funding acquisition, R.E.P. All authors have read and agreed to the published version of the manuscript.” Please turn to the CRediT taxonomy for the term explanation. Authorship must be limited to those who have contributed substantially to the work reported.
Funding
This work was funded by the Smart Growth Operational Programme, project no. POIR.04.02.00-00-D003/20-00; European Funds, project no. RPWP.01.01.00-30-0004/18; and Ministry of Science and Higher Education, project no. 21/529535/SPUB/SP/2022.
Data Availability Statement
Data are contained within the article.
Conflicts of Interest
The authors declare no conflicts of interest.
References
- Baensch-Baltruschat, B.; Kocher, B.; Stock, F.; Reifferscheid, G. Tyre and Road Wear Particles (TRWP) - A Review of Generation, Properties, Emissions, Human Health Risk, Ecotoxicity, and Fate in the Environment. Science of the Total Environment 2020, 733, 137823. [Google Scholar] [CrossRef] [PubMed]
- Milani, M.; Pucillo, F.P.; Ballerini, M.; Camatini, M.; Gualtieri, M.; Di Martino, S.F. First Evidence of Tyre Debris Characterization at the Nanoscale by Focused Ion Beam. Materials Characterization 2004, 52, 283–288. [Google Scholar] [CrossRef]
- Sarkissian, G. The Analysis of Tire Rubber Traces Collected After Braking Incidents Using Pyrolysis-Gas Chromatography/Mass Spectrometry. Journal of Forensic Sciences 2007, 52, 1050–1056. [Google Scholar] [CrossRef] [PubMed]
- De Oliveira, T.; Muresan, B.; Ricordel, S.; Lumière, L.; Truong, X.-T.; Poirier, L.; Gaspéri, J. Realistic Assessment of Tire and Road Wear Particle Emissions and Their Influencing Factors on Different Types of Roads. Journal of Hazardous Materials 2024, 465, 133301. [Google Scholar] [CrossRef] [PubMed]
- Stalnaker, D.O.; Turner, J.L.; Parekh, D.; Whittle, B.; Norton, R. Indoor Simulation of Tire Wear: Some Case Studies. Tire Science & Technology 1996, 24, 94–118. [Google Scholar] [CrossRef]
- Wik, A.; Dave, G. Occurrence and Effects of Tire Wear Particles in the Environment – A Critical Review and an Initial Risk Assessment. Environmental Pollution (1987) 2009, 157, 1–11. [Google Scholar] [CrossRef]
- Panko, J.M.; Chu, J.; Kreider, M.L.; Unice, K.M. Measurement of Airborne Concentrations of Tire and Road Wear Particles in Urban and Rural Areas of France, Japan, and the United States. Atmospheric Environment 2013, 72, 192–199. [Google Scholar] [CrossRef]
- Wagner, S.; Hüffer, T.; Klöckner, P.; Wehrhahn, M.; Hofmann, T.; Reemtsma, T. Tire Wear Particles in the Aquatic Environment - A Review on Generation, Analysis, Occurrence, Fate and Effects. Water Research 2018, 139, 83–100. [Google Scholar] [CrossRef]
- Hays, M.D.; Cho, S.-H.; Baldauf, R.; Schauer, J.J.; Shafer, M.M. Particle Size Distributions of Metal and Non-Metal Elements in an Urban near-Highway Environment. Atmospheric Environment 2011, 45, 925–934. [Google Scholar] [CrossRef]
- Wi, E.; Park, E.; Shin, H.; Hong, J.; Jeong, S.; Kwon, J.-T.; Lee, H.-J.; Lee, J.; Kim, Y. Overall Distribution of Tire-Wear Particles, Nano-carbon Black, and Heavy Metals in Size-Fractionated Road Dust Collected from Steel Industrial Complexes. Science of the Total Environment 2023, 884, 163878. [Google Scholar] [CrossRef]
- Harrison, R.M.; Jones, A.M.; Gietl, J.K.; Yin, J.; Green, D.C. Estimation of the Contributions of Brake Dust, Tire Wear, and Resuspension to Nonexhaust Traffic Particles Derived from Atmospheric Measurements. Environmental Science & Technology 2012, 46, 6523–6529. [Google Scholar] [CrossRef] [PubMed]
- Councell, T.B.; Duckenfield, K.U.; Landa, E.R.; Callender, E. Tire-Wear Particles as a Source of Zinc to the Environment. Environmental Science & Technology 2004, 38, 4206–4214. [Google Scholar] [CrossRef] [PubMed]
- Adachi, K.; Tainosho, Y. Characterization of Heavy Metal Particles Embedded in Tire Dust. Environment International 2004, 30, 1009–1017. [Google Scholar] [CrossRef] [PubMed]
- ADAC, Tyre wear particles in the environment, Created: 12/2021, Updated: 03/2022 https://assets.adac.de/image/upload/v1639663105/ADAC-eV/KOR/Text/PDF/Tyre_wear_particles_in_the_environment_zkmd3a.
- Dumont, E.R.; Gao, X.; Zheng, J.; Macairan, J.; Hernandez, L.M.; Baesu, A.; Bayen, S.; Robinson, S.A.; Ghoshal, S.; Tufenkji, N. Unraveling the Toxicity of Tire Wear Contamination in Three Freshwater Species: From Chemical Mixture to Nanoparticles. Journal of Hazardous Materials 2023, 453, 131402. [Google Scholar] [CrossRef] [PubMed]
- Knight, L.J.; Parker-Jurd, F.N.F.; Al-Sid-Cheikh, M.; Thompson, R.C. Tyre Wear Particles: An Abundant yet Widely Unreported Microplastic? Environmental Science and Pollution Research International 2020, 27, 18345–18354. [Google Scholar] [CrossRef]
- Järlskog, I.; Jaramillo-Vogel, D.; Rausch, J.; Gustafsson, M.; Strömvall, A.-M.H.; Andersson-Sköld, Y. Concentrations of Tire Wear Microplastics and Other Traffic-Derived Non-Exhaust Particles in the Road Environment. Environment International 2022, 170, 107618. [Google Scholar] [CrossRef]
- Bouredji, A.; Pourchez, J.; Forest, V. Biological Effects of Tire and Road Wear Particles (TRWP) Assessed by in Vitro and in Vivo Studies – A Systematic Review. Science of the Total Environment 2023, 894, 164989. [Google Scholar] [CrossRef]
- Liu, Y.; Chen, H.; Gao, J.; Liu, Y.; Dave, K.; Chen, J.; Federici, M.; Perricone, G. Comparative Analysis of Non-Exhaust Airborne Particles from Electric and Internal Combustion Engine Vehicles. Journal of Hazardous Materials 2021, 420, 126626. [Google Scholar] [CrossRef] [PubMed]
- Obereigner, G.; Shorten, R.; Meier, F.; Jones, S.; Wikström, N.; Del Re, L. Active Limitation of Tire Wear and Emissions for Electrified Vehicles. SAE Technical Paper Series 2021. [Google Scholar] [CrossRef]
- Rødland, E.S.; Lind, O.C.; Reid, M.J.; Heier, L.S.; Okoffo, E.D.; Rauert, C.; Thomas, K.V.; Meland, S. Occurrence of Tire and Road Wear Particles in Urban and Peri-Urban Snowbanks, and Their Potential Environmental Implications. Science of the Total Environment 2022, 824, 153785. [Google Scholar] [CrossRef]
- Vijayan, A.; Österlund, H.; Magnusson, K.; Maršálek, J.; Viklander, M. Microplastics (MPs) in Urban Roadside Snowbanks: Quantities, Size Fractions and Dynamics of Release. Science of the Total Environment 2022, 851, 158306. [Google Scholar] [CrossRef] [PubMed]
- Dumont, E.R.; Gao, X.; Zheng, J.; Macairan, J.; Hernandez, L.M.; Baesu, A.; Bayen, S.; Robinson, S.A.; Ghoshal, S.; Tufenkji, N. Unraveling the Toxicity of Tire Wear Contamination in Three Freshwater Species: From Chemical Mixture to Nanoparticles. Journal of Hazardous Materials 2023, 453, 131402. [Google Scholar] [CrossRef] [PubMed]
- Calarnou, L.; Traı̈Kia, M.; Leremboure, M.; Malosse, L.; Dronet, S.; Delort, A.-M.; Besse-Hoggan, P.; Eyheraguibel, B. Assessing Biodegradation of Roadway Particles via Complementary Mass Spectrometry and NMR Analyses. Science of the Total Environment 2023, 900, 165698. [Google Scholar] [CrossRef] [PubMed]
- Thomas, J.; Moosavian, S.K.; Cutright, T.J.; Pugh, C.; Soucek, M.D. Method Development for Separation and Analysis of Tire and Road Wear Particles from Roadside Soil Samples. Environmental Science & Technology 2022, 56, 11910–11921. [Google Scholar] [CrossRef]
- Rødland, E.S.; Lind, O.C.; Reid, M.J.; Heier, L.S.; Skogsberg, E.; Snilsberg, B.; Gryteselv, D.; Meland, S. Characterization of Tire and Road Wear Microplastic Particle Contamination in a Road Tunnel: From Surface to Release. Journal of Hazardous Materials (Print) 2022, 435, 129032. [Google Scholar] [CrossRef]
- Kim, G.; Lee, S.-H. Characteristics of Tire Wear Particles Generated by a Tire Simulator under Various Driving Conditions. Environmental Science & Technology 2018, 52, 12153–12161. [Google Scholar] [CrossRef]
- Park, I.-Y.; Kim, H.; Lee, S.-H. Characteristics of Tire Wear Particles Generated in a Laboratory Simulation of Tire/Road Contact Conditions. Journal of Aerosol Science 2018, 124, 30–40. [Google Scholar] [CrossRef]
- Tonegawa, Y.; Sasaki, S. Development of Tire-Wear Particle Emission Measurements for Passenger Vehicles. Emission Control Science and Technology 2021, 7, 56–62. [Google Scholar] [CrossRef]
- Klöckner, P.; Seiwert, B.; Eisentraut, P.; Braun, U.; Reemtsma, T.; Wagner, S. Characterization of Tire and Road Wear Particles from Road Runoff Indicates Highly Dynamic Particle Properties. Water Research 2020, 185, 116262. [Google Scholar] [CrossRef]
- Mennekes, D.; Nowack, B. Tire Wear Particle Emissions: Measurement Data Where Are You? Science of the Total Environment 2022, 830, 154655. [Google Scholar] [CrossRef]
- Marwood, C.A.; McAtee, B.L.; Kreider, M.L.; Ogle, R.S.; Finley, B.L.; Sweet, L.; Panko, J.M. Acute Aquatic Toxicity of Tire and Road Wear Particles to Alga, Daphnid, and Fish. Ecotoxicology 2011, 20. [Google Scholar] [CrossRef] [PubMed]
- Yang, K.; Jing, S.; Liu, Y.; Yan, M.; Yi, X.; Liu, L. Acute Toxicity of Tire Wear Particles, Leachates and Toxicity Identification Evaluation of Leachates to the Marine Copepod, Tigriopus Japonicus. Chemosphere 2022, 297, 134099. [Google Scholar] [CrossRef] [PubMed]
- Halle, L.L.; Palmqvist, A.; Kampmann, K.; Jensen, A.A.; Hansen, T.; Khan, F.R. Tire Wear Particle and Leachate Exposures from a Pristine and Road-Worn Tire to Hyalella Azteca: Comparison of Chemical Content and Biological Effects. Aquatic Toxicology 2021, 232, 105769. [Google Scholar] [CrossRef] [PubMed]
- Panko, J.M.; Kreider, M.L.; McAtee, B.L.; Marwood, C.A. Chronic Toxicity of Tire and Road Wear Particles to Water- and Sediment-Dwelling Organisms. Ecotoxicology 2012, 22, 13–21. [Google Scholar] [CrossRef] [PubMed]
- Cunningham, B.; Harper, B.; Brander, S.M.; Harper, S.L. Toxicity of Micro and Nano Tire Particles and Leachate for Model Freshwater Organisms. Journal of Hazardous Materials 2022, 429, 128319. [Google Scholar] [CrossRef] [PubMed]
- Day, K.E.; Holtze, K.E.; Metcalfe-Smith, J.L.; Bishop, C.; Dutka, B.J. Toxicity of Leachate from Automobile Tires to Aquatic Biota. Chemosphere 1993, 27, 665–675. [Google Scholar] [CrossRef]
- Khan, F.R.; Halle, L.L.; Palmqvist, A. Acute and Long-Term Toxicity of Micronized Car Tire Wear Particles to Hyalella Azteca. Aquatic Toxicology 2019, 213, 105216. [Google Scholar] [CrossRef] [PubMed]
- Gualtieri, M.; Andrioletti, M.; Vismara, C.; Milani, M.; Camatini, M. Toxicity of Tire Debris Leachates. Environment International 2005, 31, 723–730. [Google Scholar] [CrossRef]
- Wik, A.; Dave, G. Occurrence and Effects of Tire Wear Particles in the Environment – A Critical Review and an Initial Risk Assessment. Environmental Pollution (1987) 2009, 157, 1–11. [Google Scholar] [CrossRef]
- Mian, H.R.; Chippi-Shreshta, G.; McCarty, K.; Hewage, K.; Sadiq, R. An Estimation of Tire and Road Wear Particles Emissions in Surface Water Based on a Conceptual Framework. Science of the Total Environment 2022, 848, 157760. [Google Scholar] [CrossRef]
- Filella, M.; Reimann, C.; Biver, M.; Rodushkin, I.; Rodushkina, K. Tellurium in the Environment: Current Knowledge and Identification of Gaps. Environmental Chemistry (Collingwood, Vic. Print) 2019, 16, 215. [Google Scholar] [CrossRef]
- Yin, B.; Wang, J.; Jia, H.; He, J.; Zhang, X.; Xu, Z. Enhanced Mechanical Properties and Thermal Conductivity of Styrene–Butadiene Rubber Reinforced with Polyvinylpyrrolidone-Modified Graphene Oxide. Journal of Materials Science 2016, 51, 5724–5737. [Google Scholar] [CrossRef]
- Yan, C.; Chen, B.; Li, X.; He, J.; Zhao, X.; Zhu, Y.; Yang, R. Silicon Hybrid EPDM Composite with High Thermal Protection Performance. Polymers 2024, 16, 695. [Google Scholar] [CrossRef] [PubMed]
- Mis-Fernández, R.; Azamar-Barrios, J.A.; Ríos-Soberanis, C.R. Characterization of the Powder Obtained from Wasted Tires Reduced by Pyrolysis and Thermal Shock Process. Journal of Applied Research and Technology 2008, 6. [Google Scholar] [CrossRef]
- Characterization of EPDM Rubber by TGA and Hi-Res‘ TGA Available online: https://www.tainstruments.com/pdf/literature/TS-79.pdf.
- Cataldo, F. On the Characterisation of Carbon Black from Tire Pyrolysis. Fullerenes, Nanotubes, and Carbon Nanostructures/Fullerenes, Nanotubes and Carbon Nanostructures 2019, 28, 368–376. [Google Scholar] [CrossRef]
- Kyari, M.Z.; Cunliffe, A.A.; Williams, P.T. Characterization of Oils, Gases, and Char in Relation to the Pyrolysis of Different Brands of Scrap Automotive Tires. Energy & Fuels 2005, 19, 1165–1173. [Google Scholar] [CrossRef]
- Guleria, S.P.; Dutta, R. K. ; Unconfined Compressive Strength of Fly Ash–Lime–Gypsum Composite Mixed with Treated Tire Chips, Journal of Materials in Civil Engineering 2011, 23, 1255-1263. 23,. [CrossRef]
- Amir, A.; Saad, N. H.; Ramli, A. S.; Abd Rashid, A.; Yusoff, N.; Abdullah, N. R.; Kasolang, S.; Jaffar, A. Thermal and rheological behavior of recycled rubber/natural rubber blends in recycle tire process, Jurnal Teknologi, 2015, 76, 89-94. [CrossRef]
Figure 1.
Map with marked locations where samples were collected for research (map data from © OpenStreetMap).
Figure 1.
Map with marked locations where samples were collected for research (map data from © OpenStreetMap).
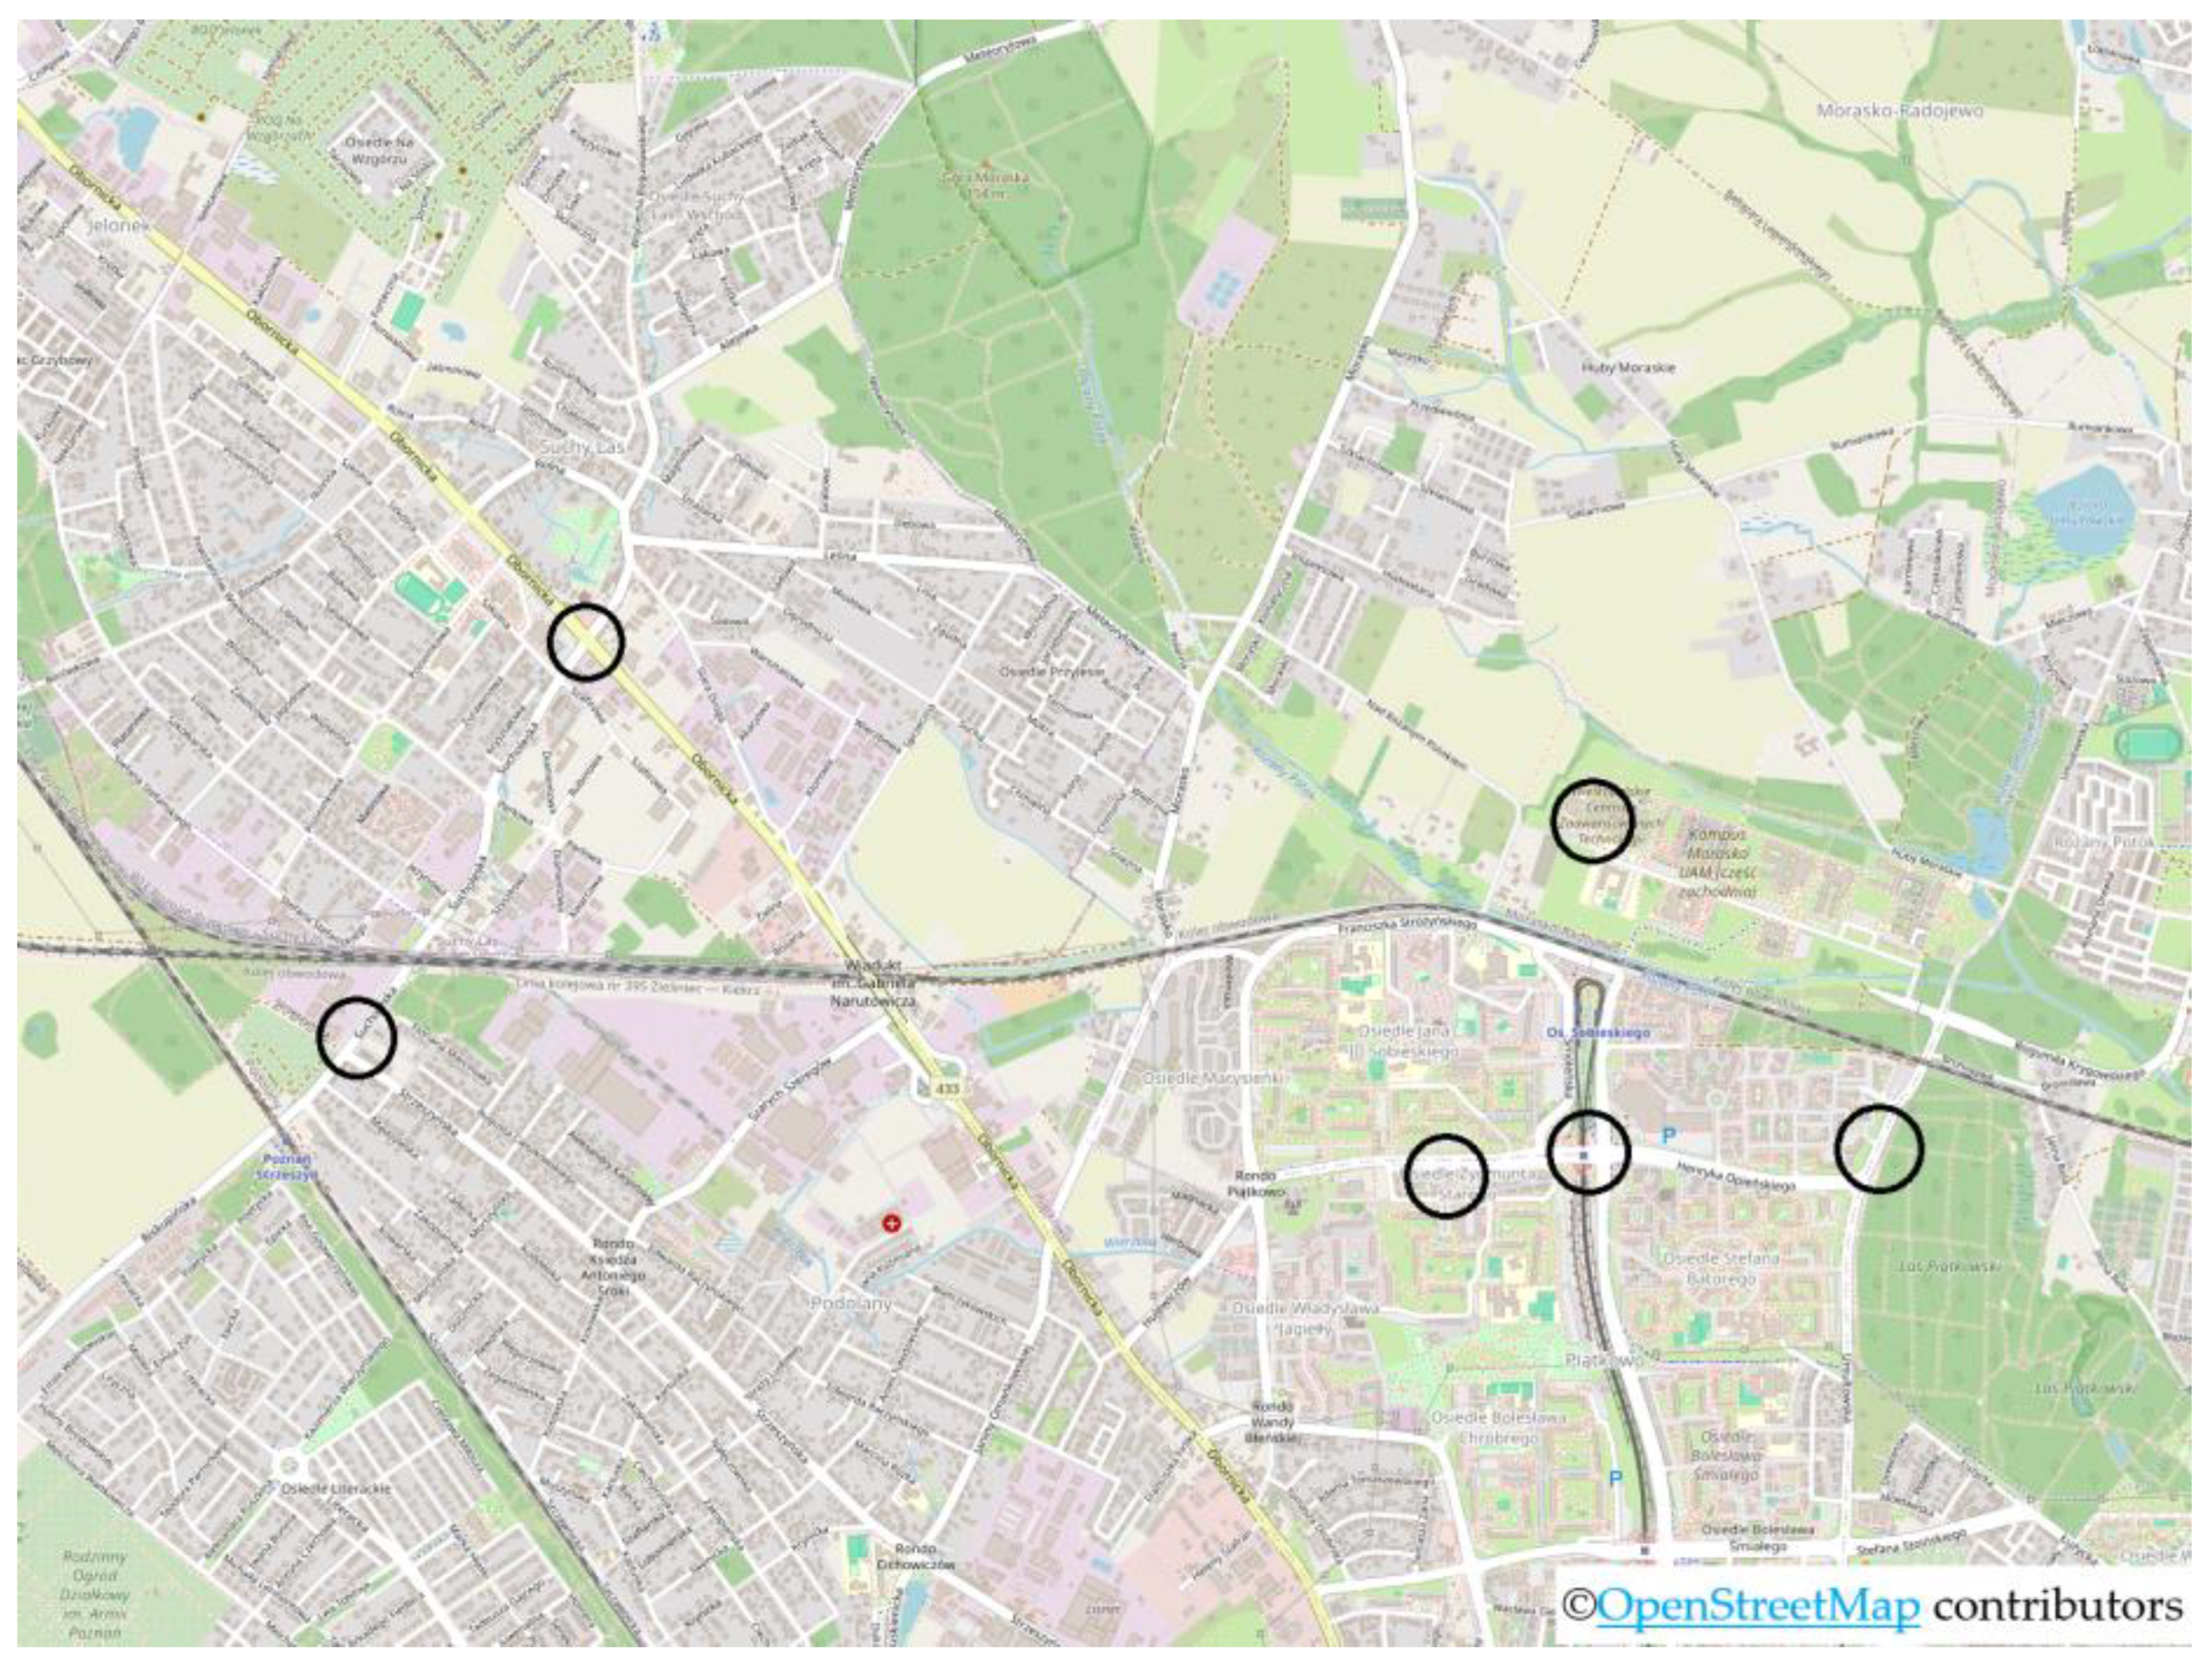
Figure 2.
Photo of standard solutions of particle fractions made in isopropanol and dichloromethane.
Figure 2.
Photo of standard solutions of particle fractions made in isopropanol and dichloromethane.
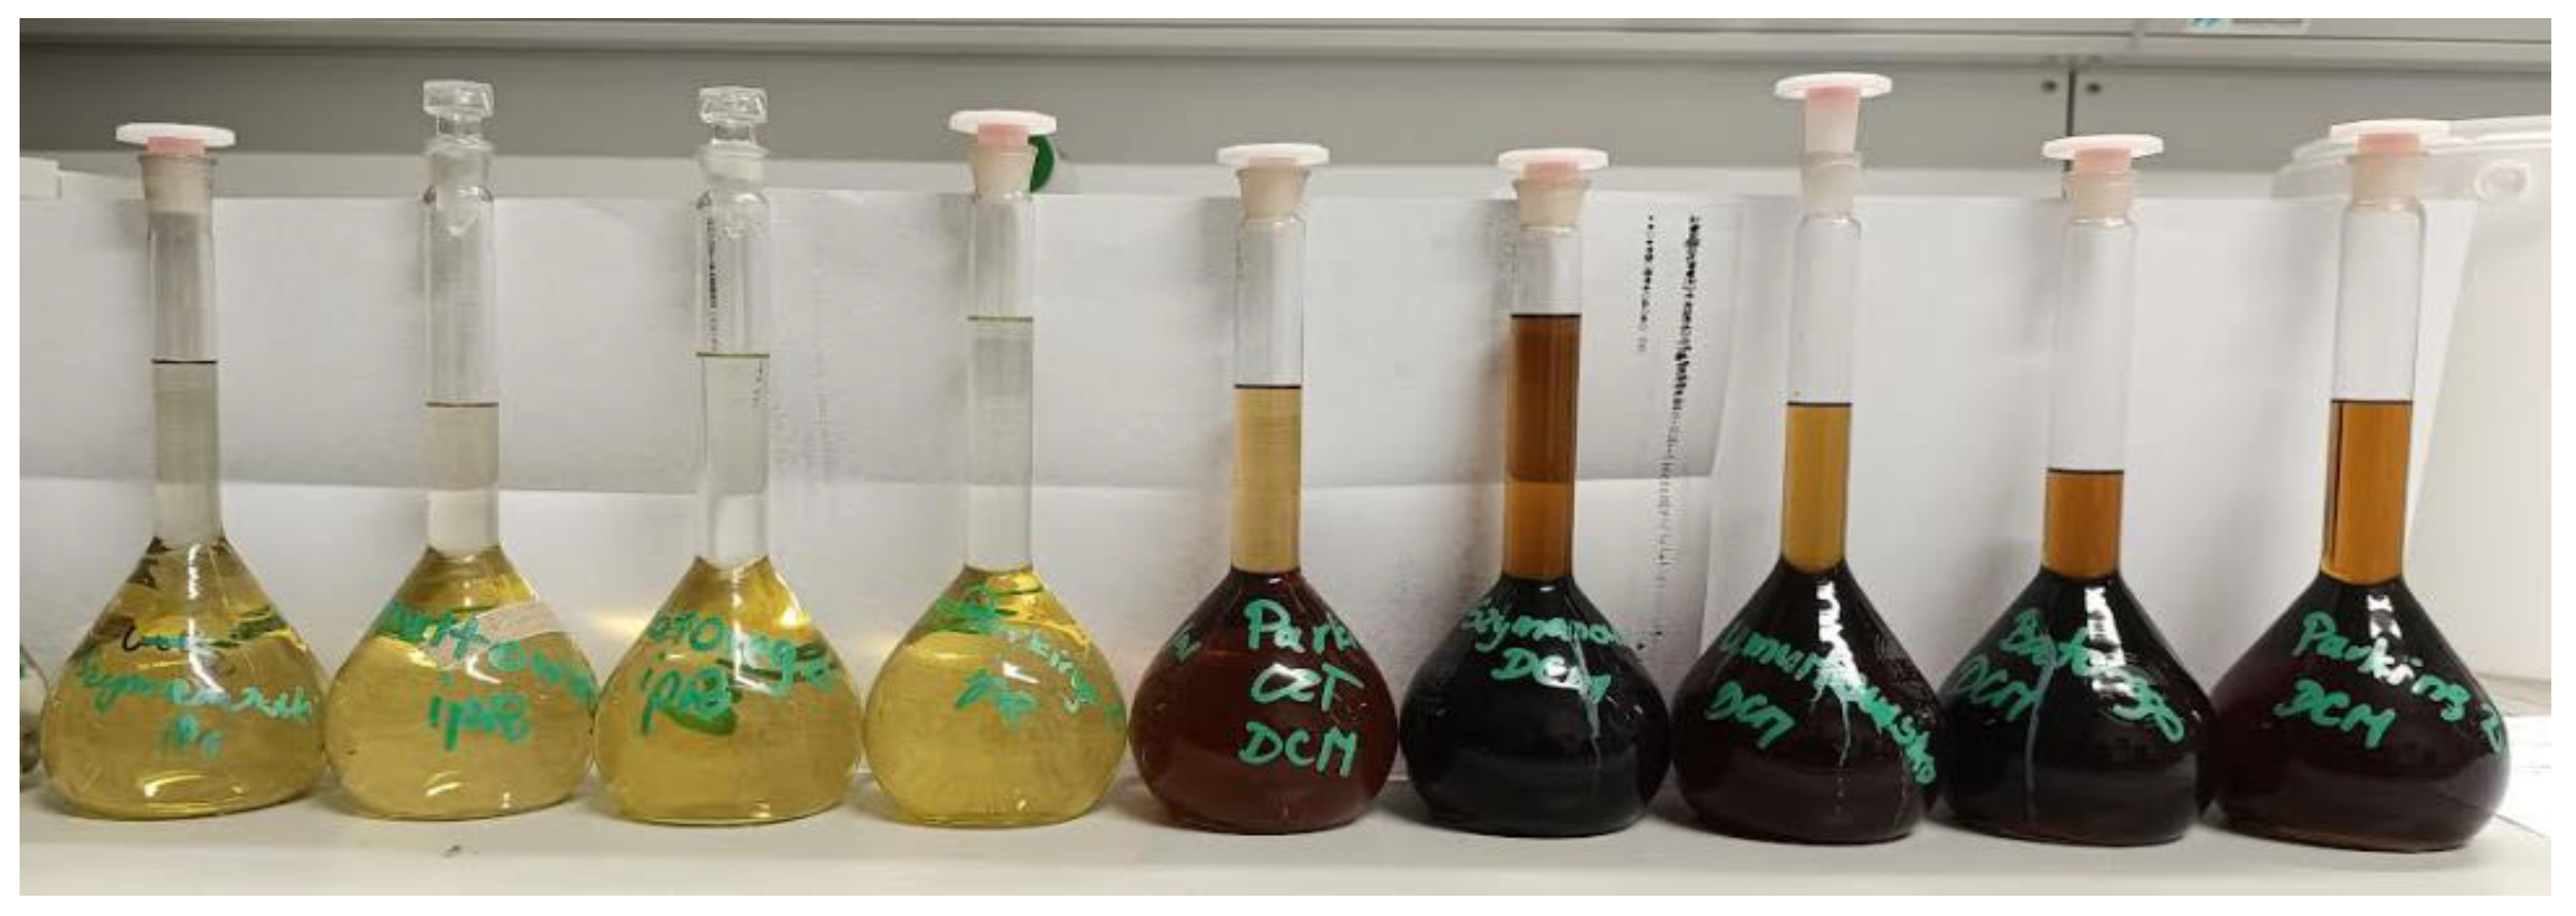
Figure 3.
Microscopic photos of all isolated sediment fractions obtained from BIS DCM.
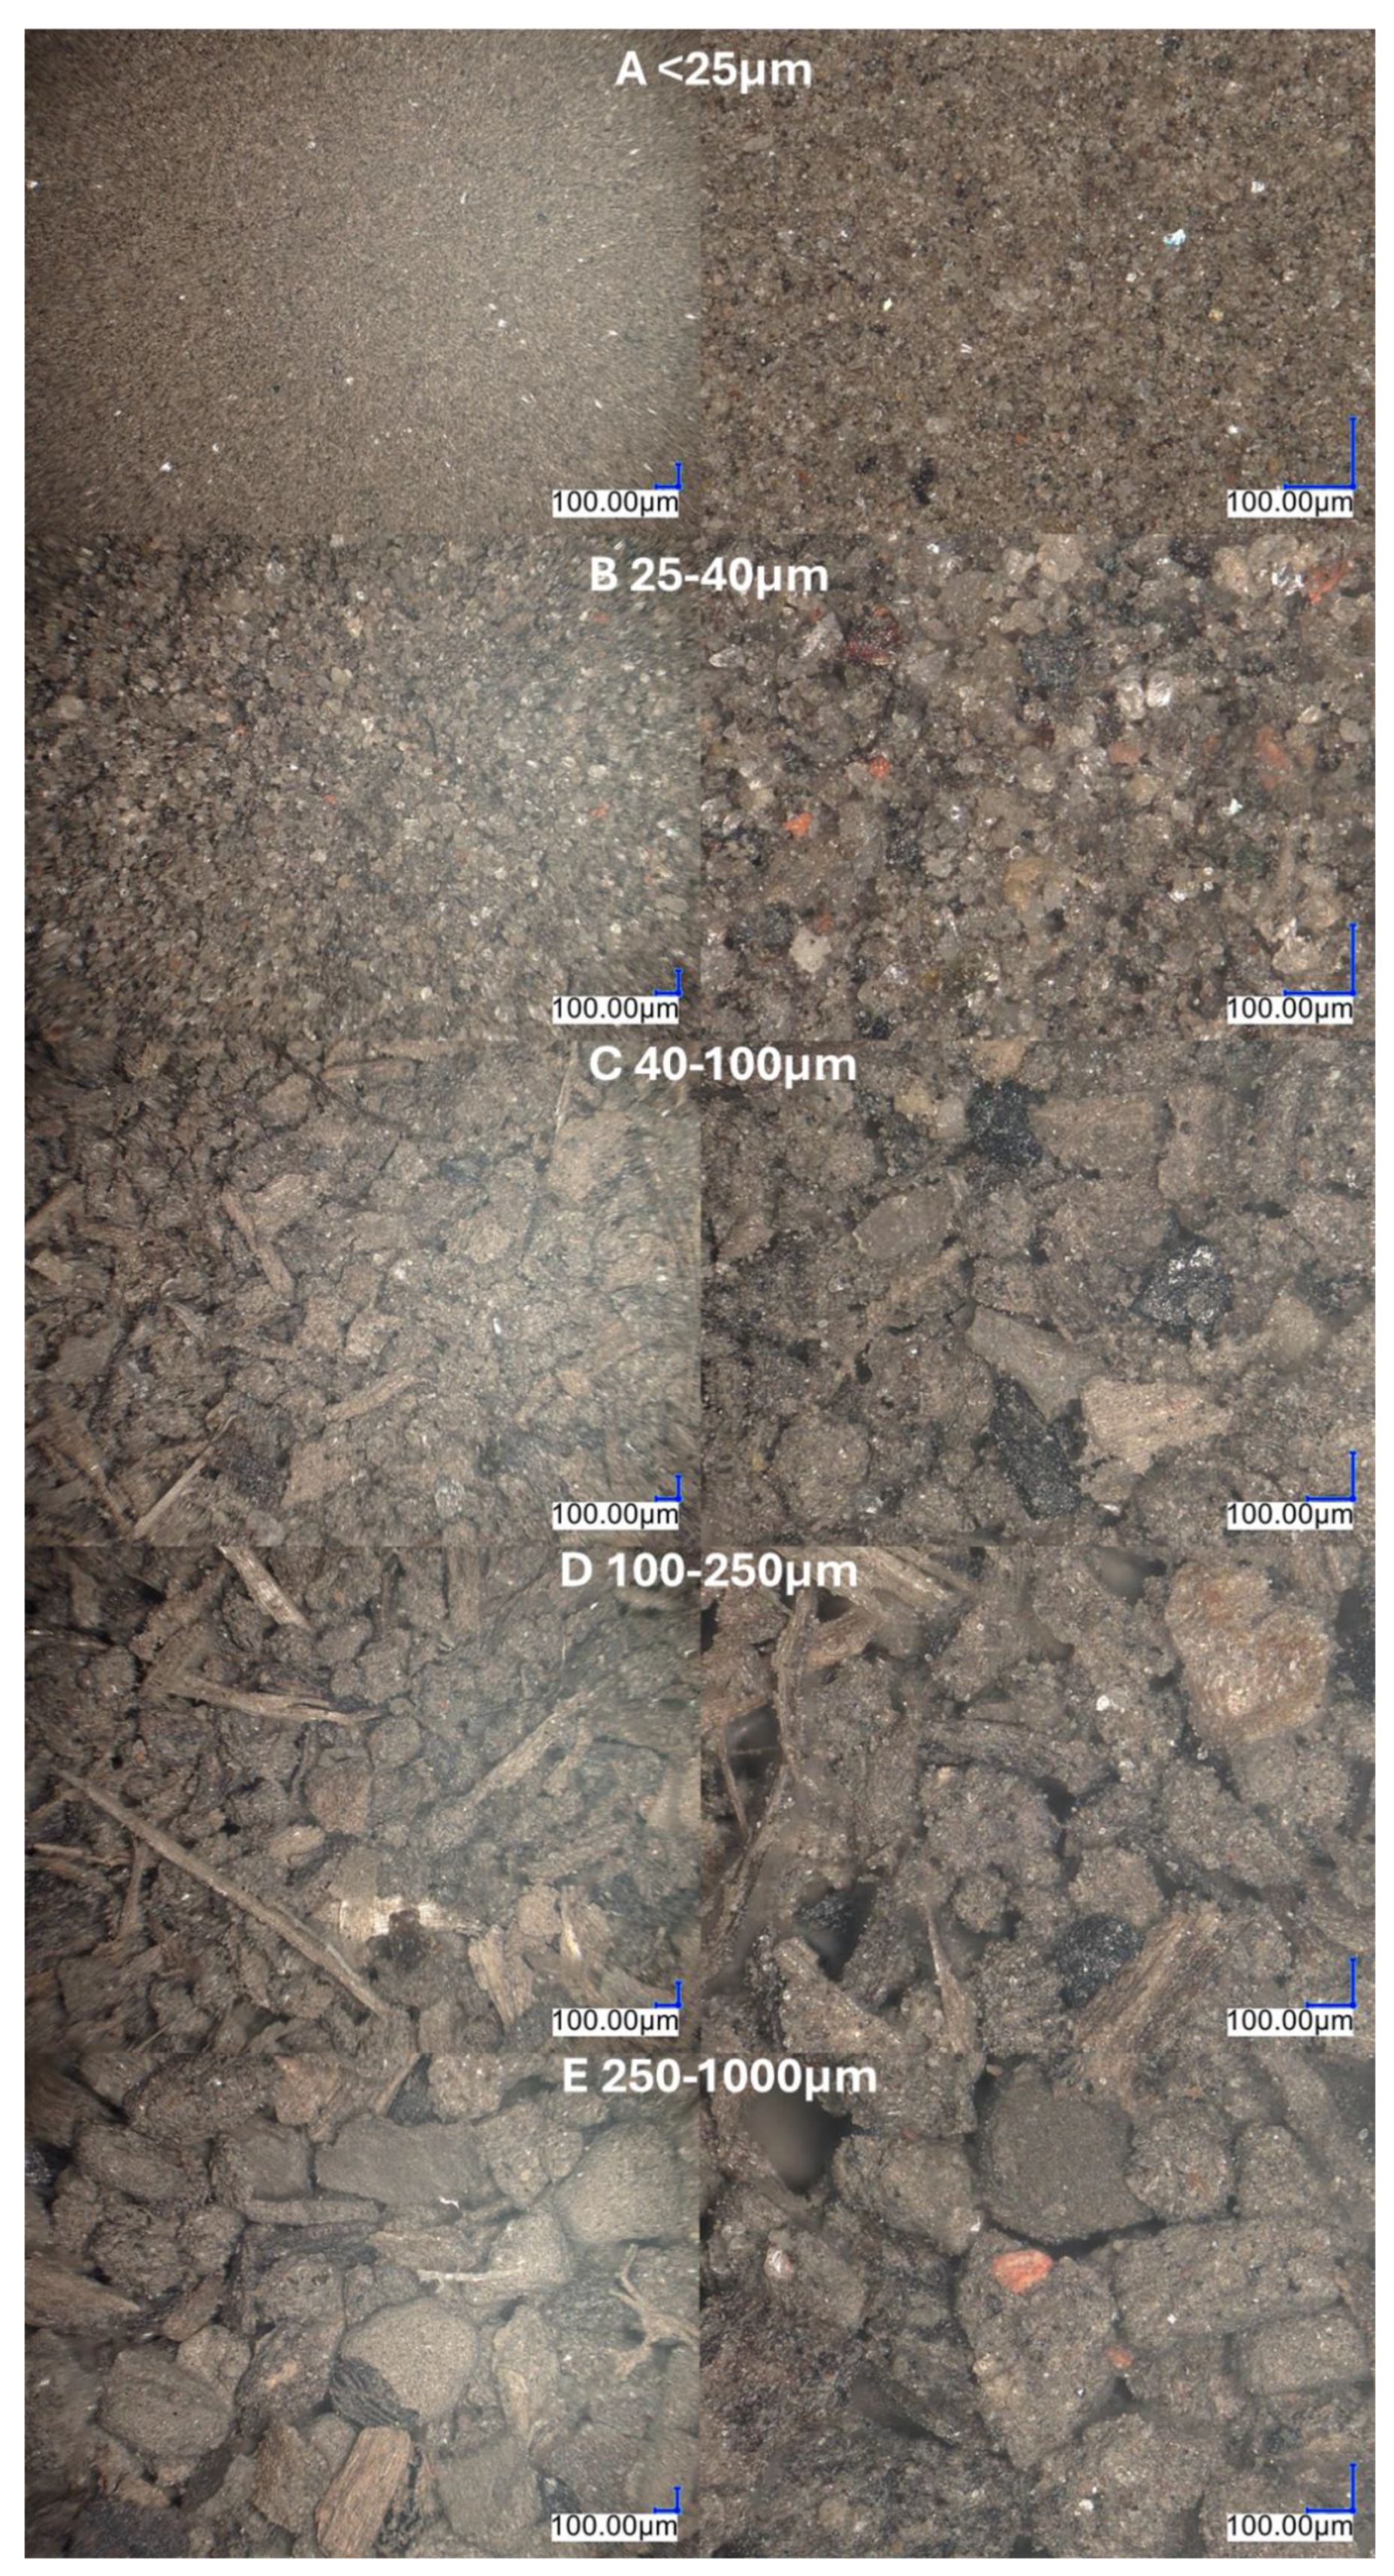
Figure 4.
Microscopic photos of sediment samples of fractions below 25 μm and particles separated using a magnet.
Figure 4.
Microscopic photos of sediment samples of fractions below 25 μm and particles separated using a magnet.
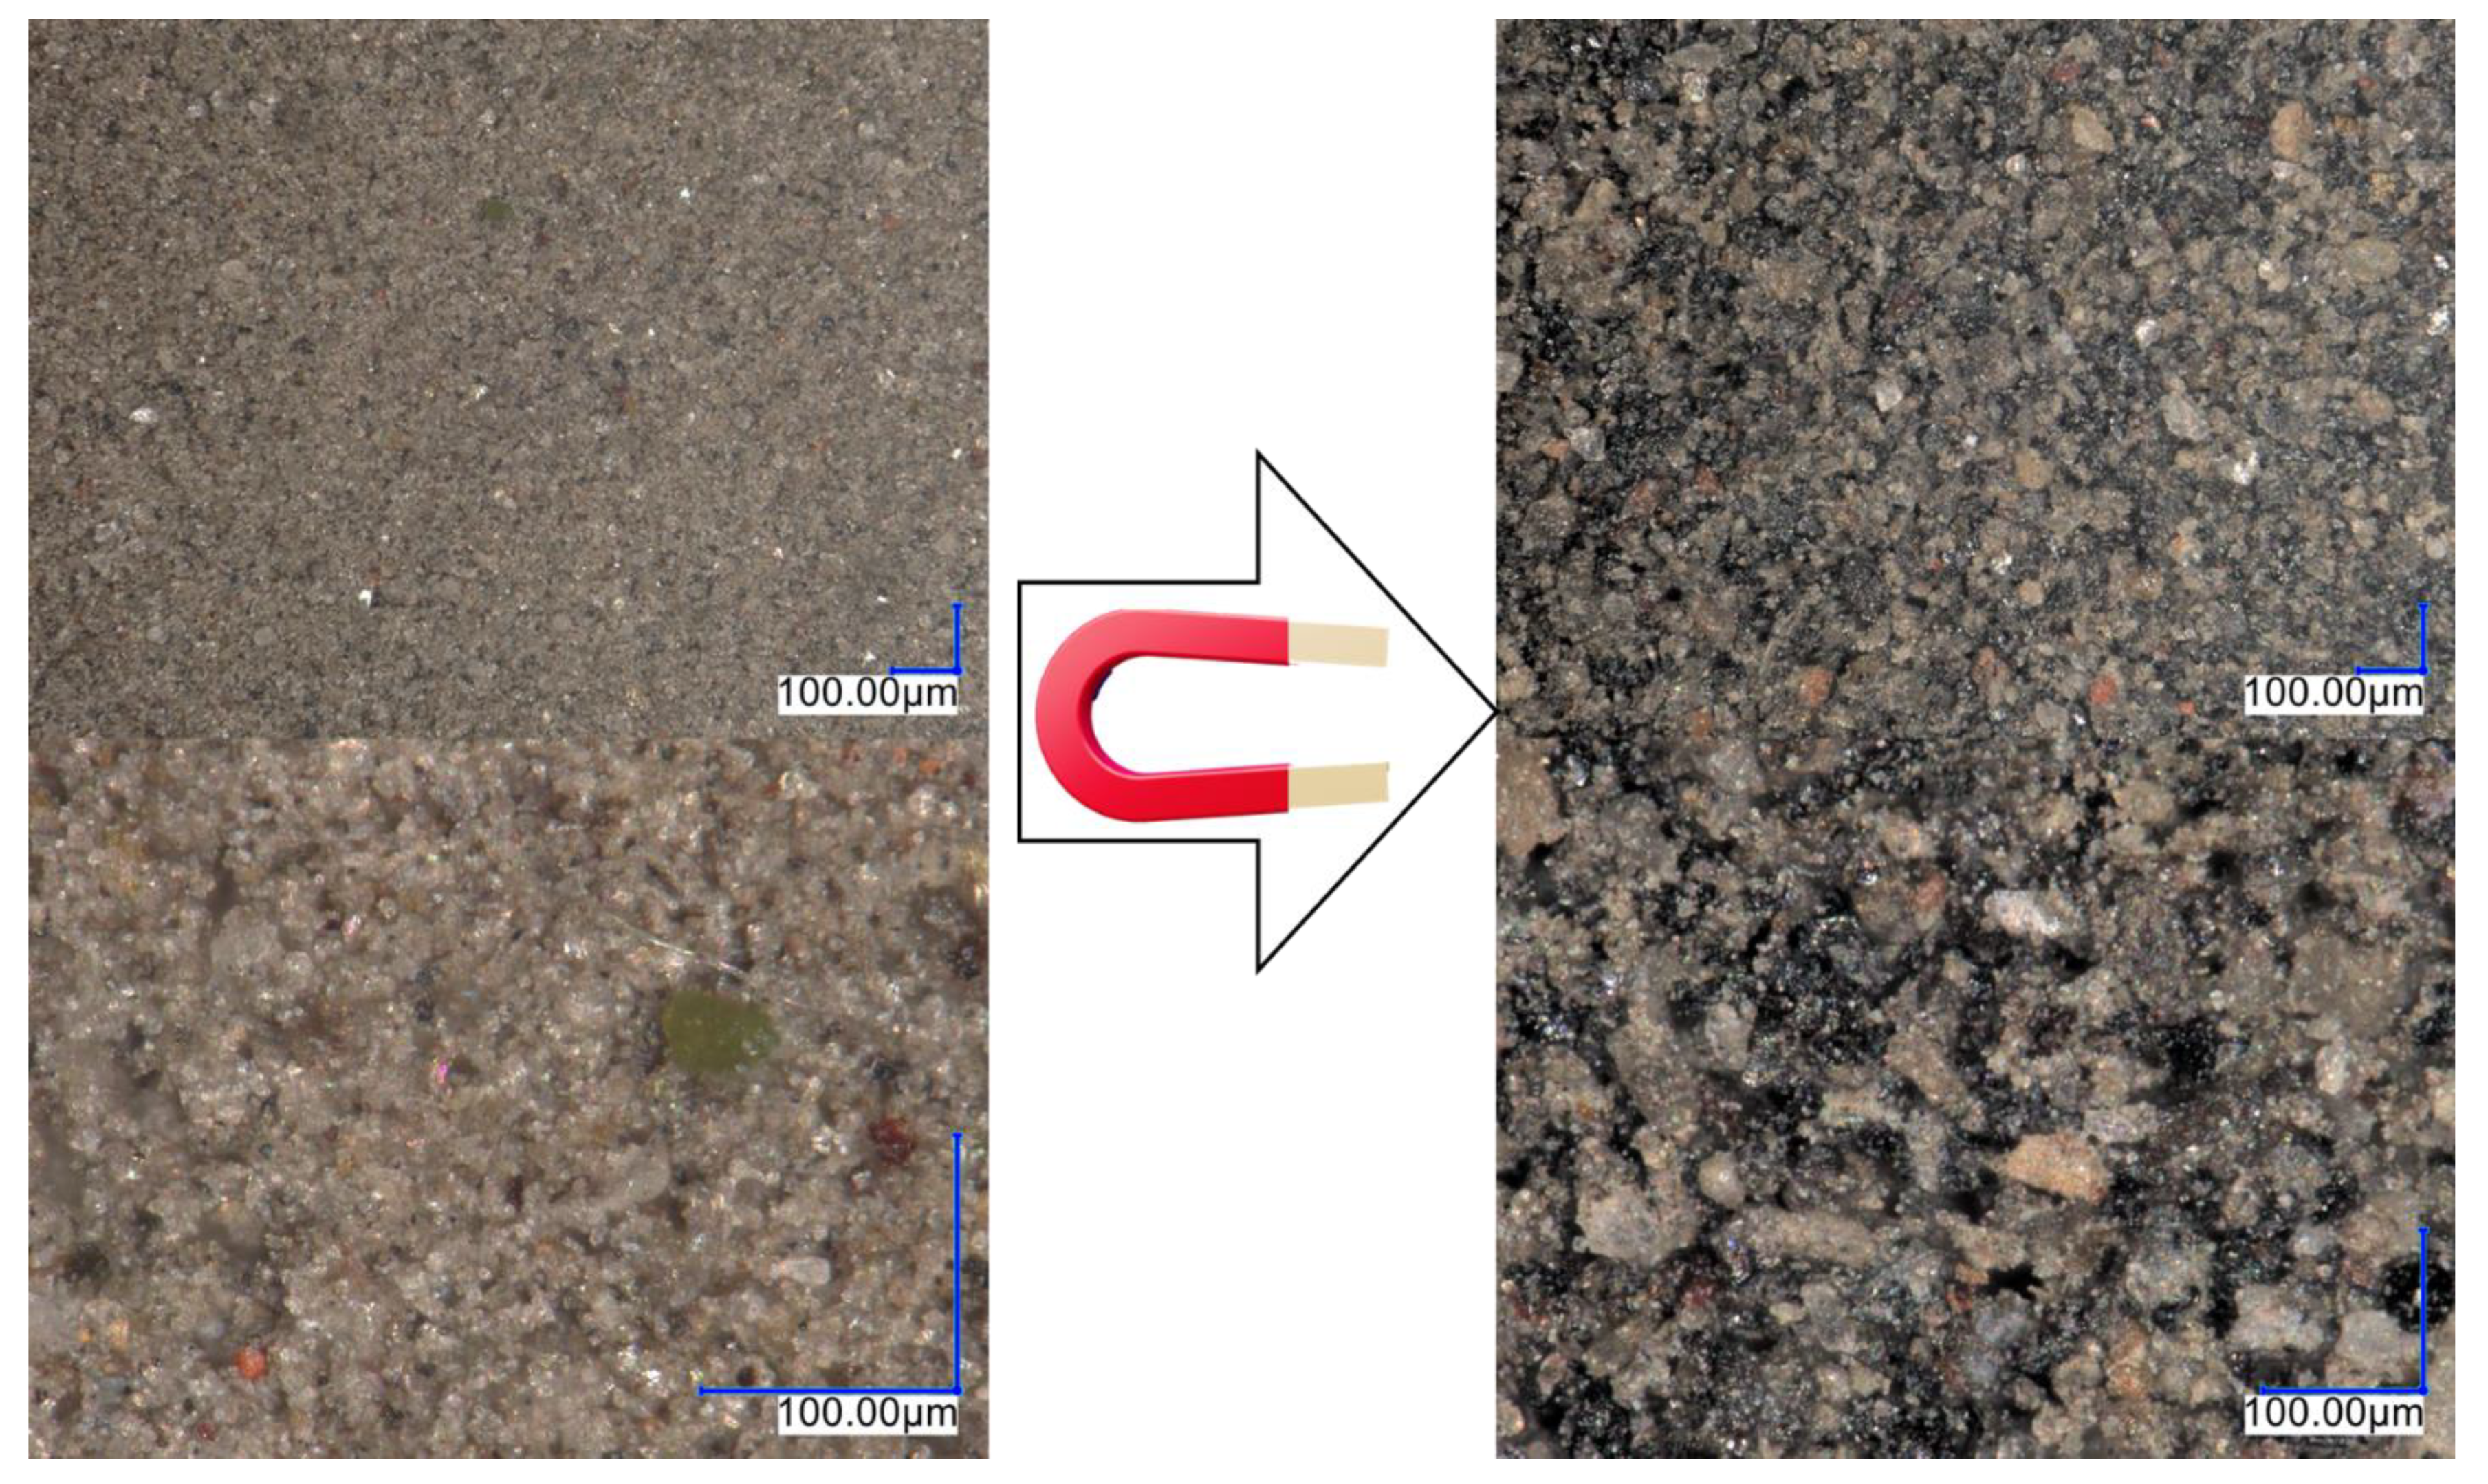
Figure 5.
SEM photos of all isolated sediment fractions obtained from BIS DCM.
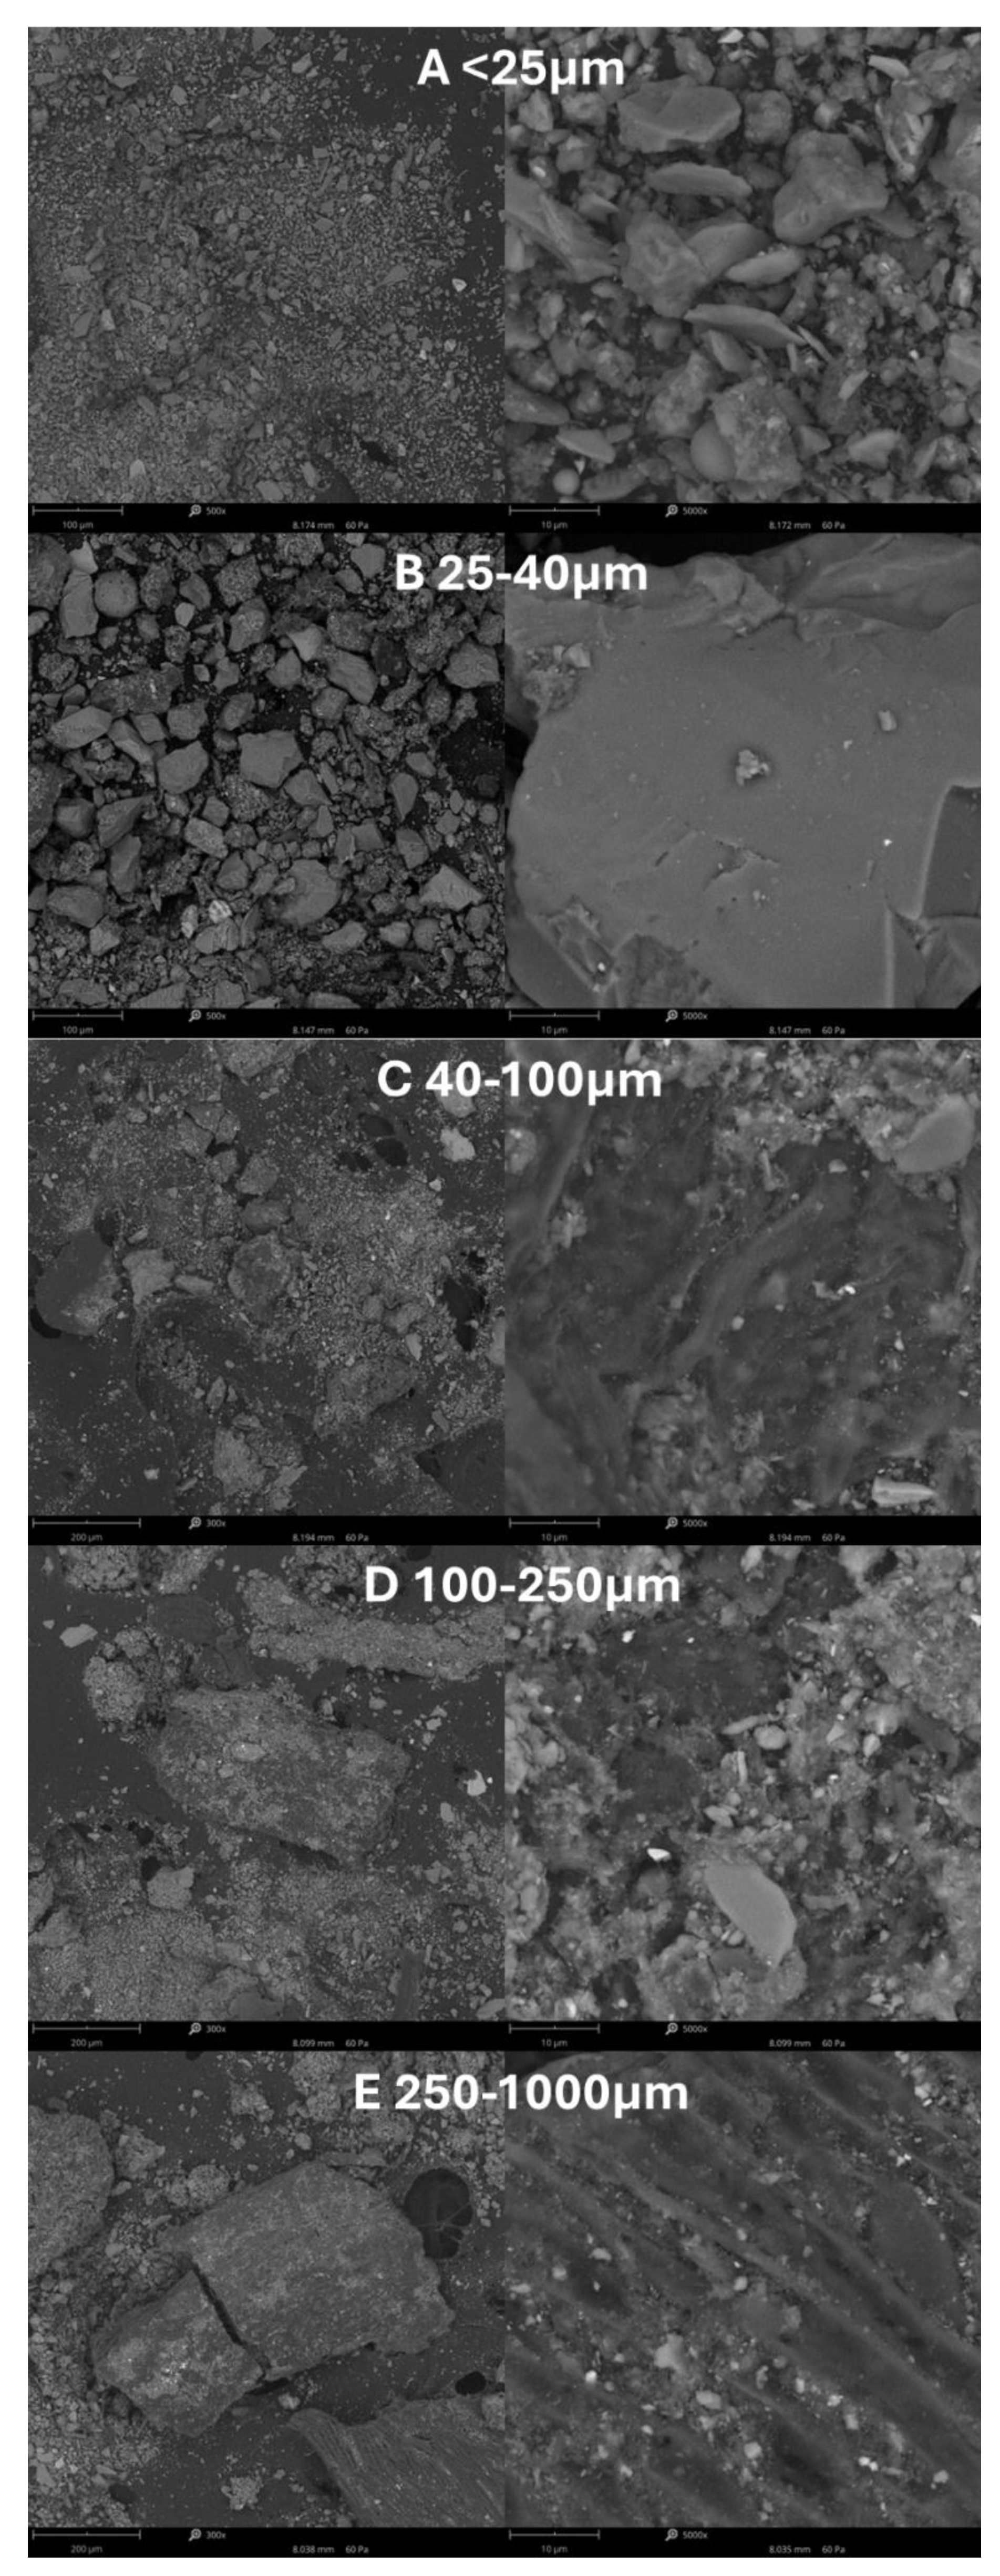
Figure 6.
SEM photos taken for extracts after washing with organic solvents: A-UMU, B-BIS C-BAT D- SZY, E-CZT1, F-DK11.
Figure 6.
SEM photos taken for extracts after washing with organic solvents: A-UMU, B-BIS C-BAT D- SZY, E-CZT1, F-DK11.
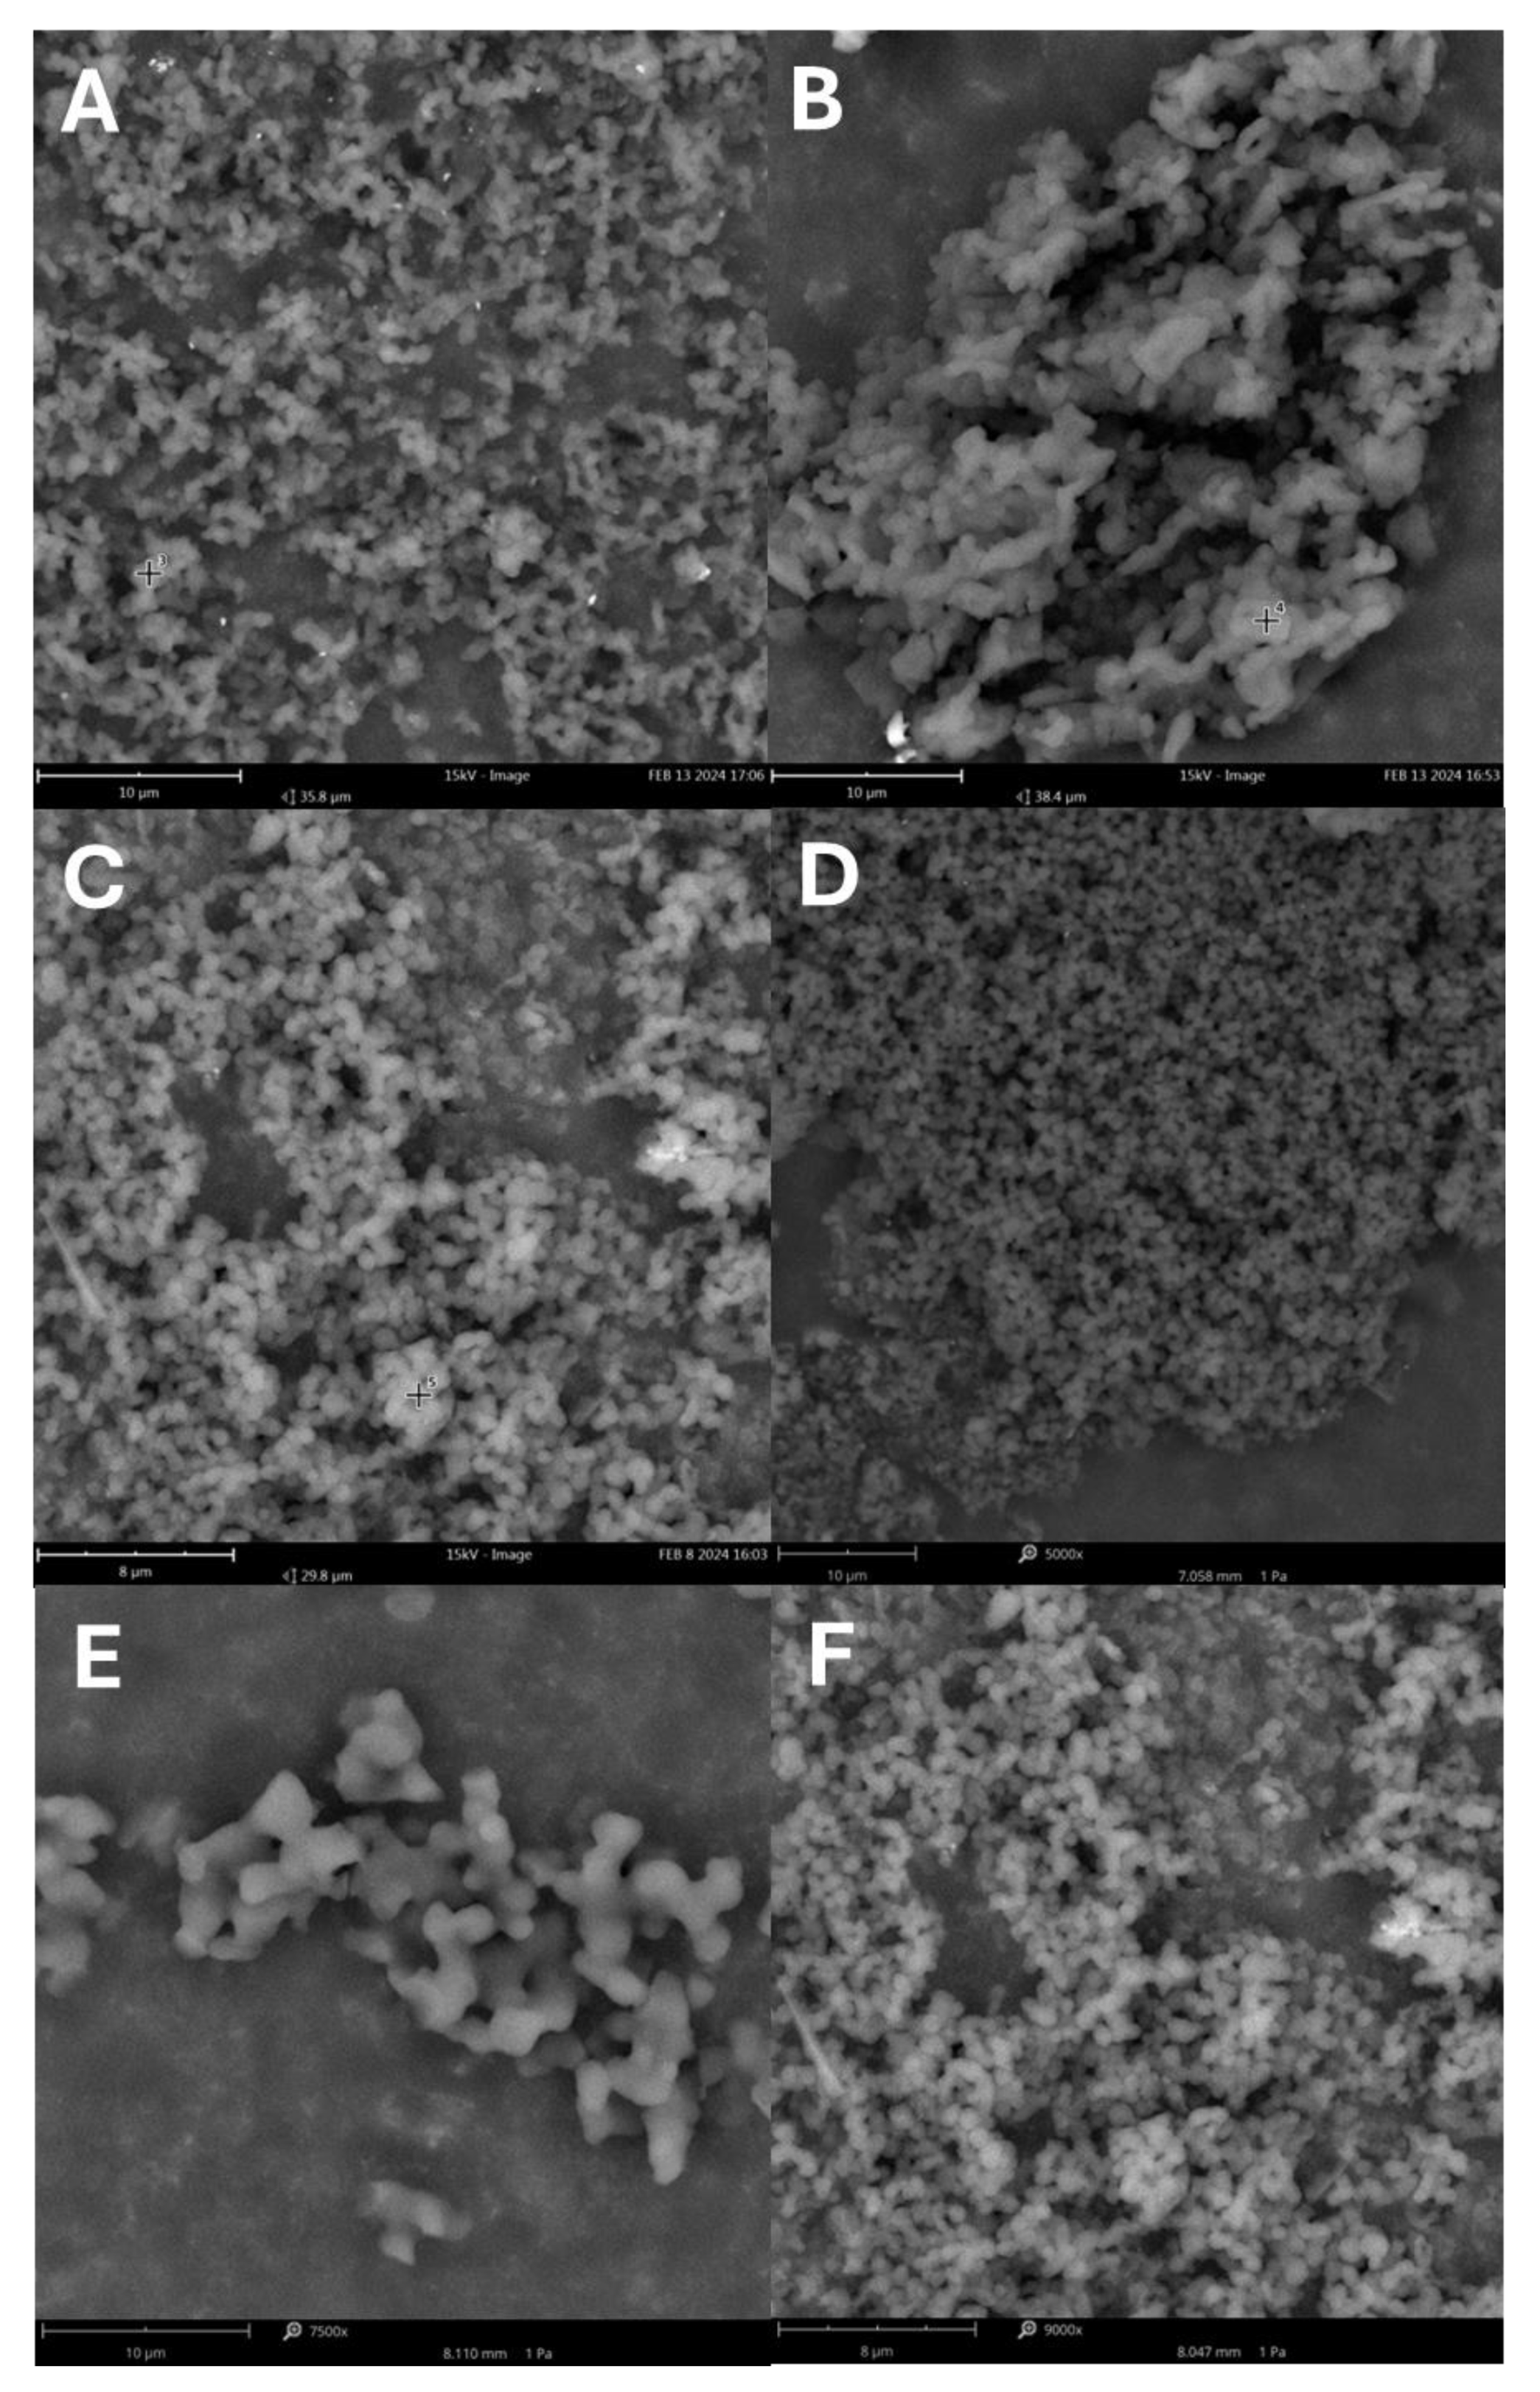
Figure 7.
Particle size distribution in solutions after extraction with isopropanol and dichloromethane.
Figure 7.
Particle size distribution in solutions after extraction with isopropanol and dichloromethane.
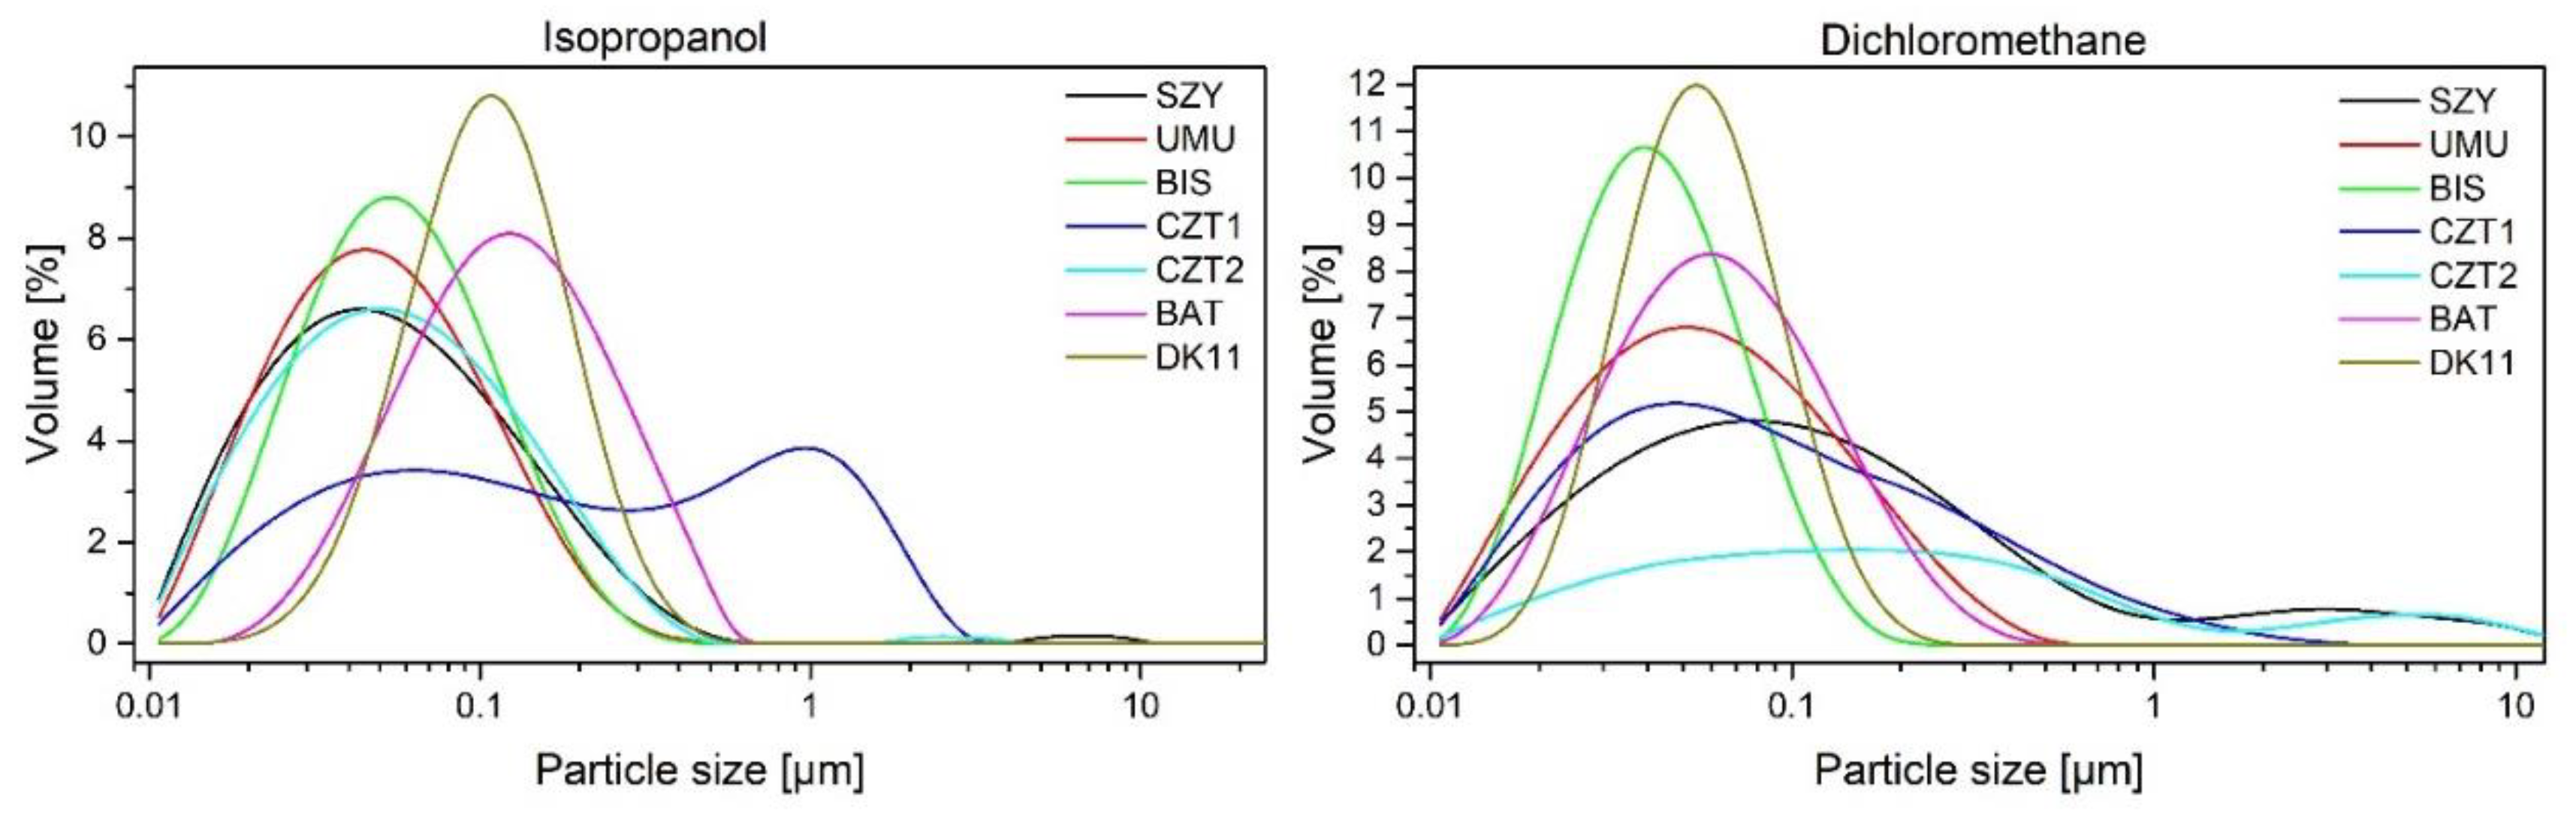
Figure 8.
Thermogravimetric analysis of extracts A) in a nitrogen atmosphere, B) in an air atmosphere.
Figure 8.
Thermogravimetric analysis of extracts A) in a nitrogen atmosphere, B) in an air atmosphere.
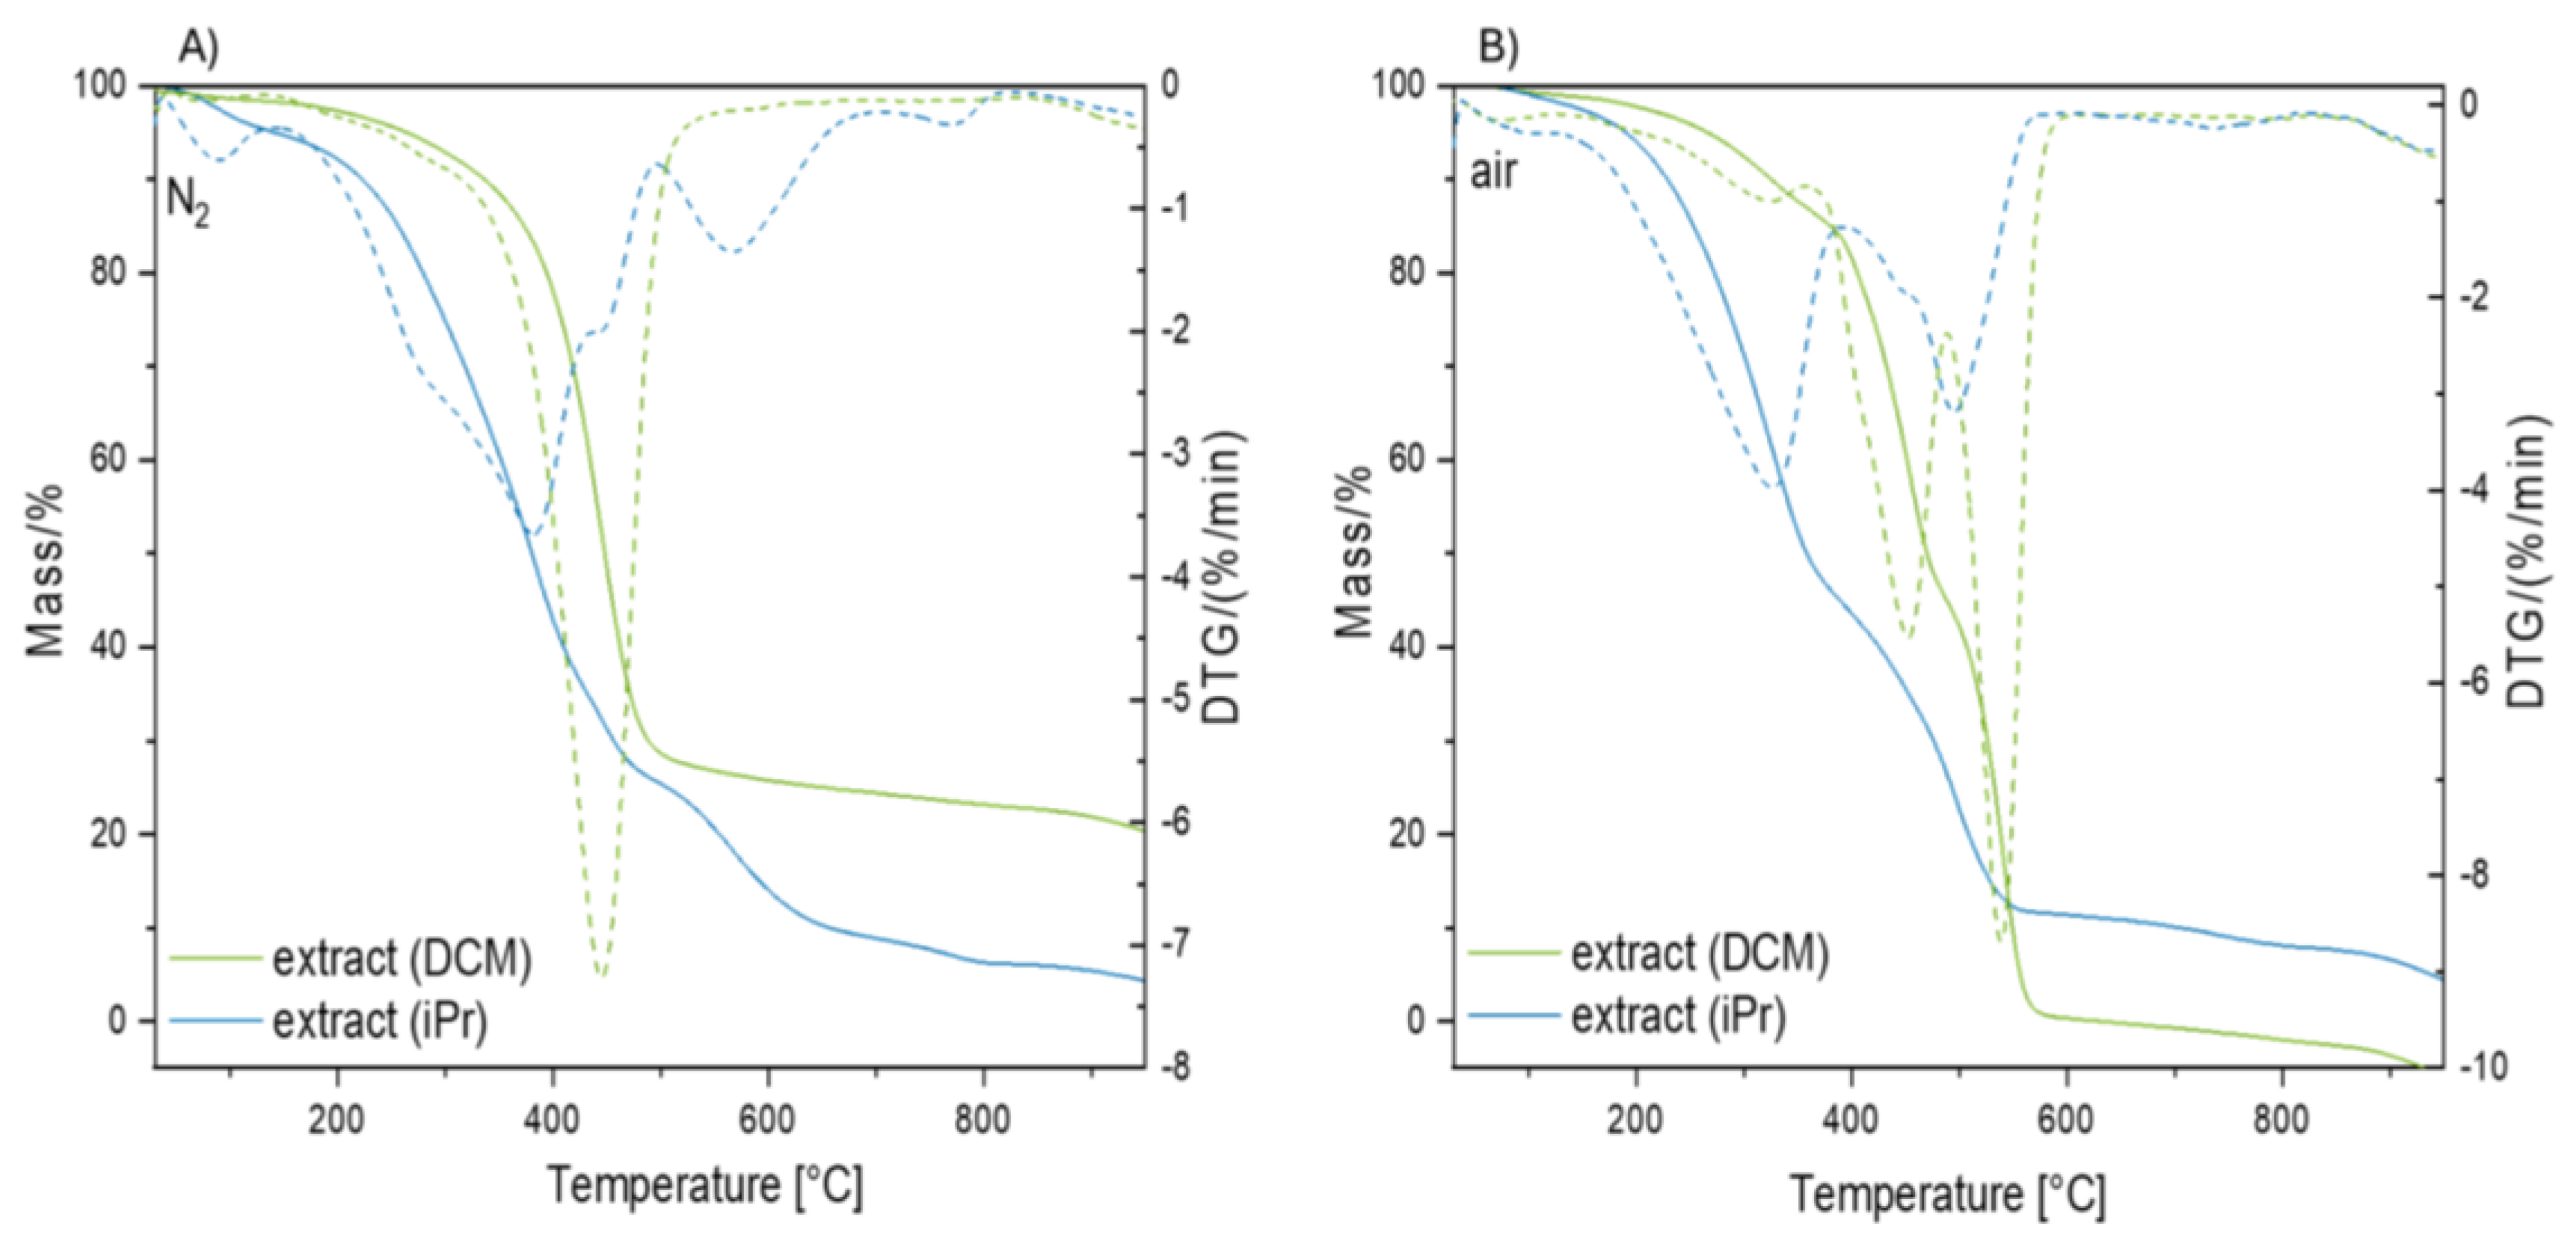
Figure 9.
Thermogravimetric analysis in a nitrogen atmosphere for the SZY sample A) Mass change B) DTG curve; for UMU sample C) Mass change D) DTG curve.
Figure 9.
Thermogravimetric analysis in a nitrogen atmosphere for the SZY sample A) Mass change B) DTG curve; for UMU sample C) Mass change D) DTG curve.
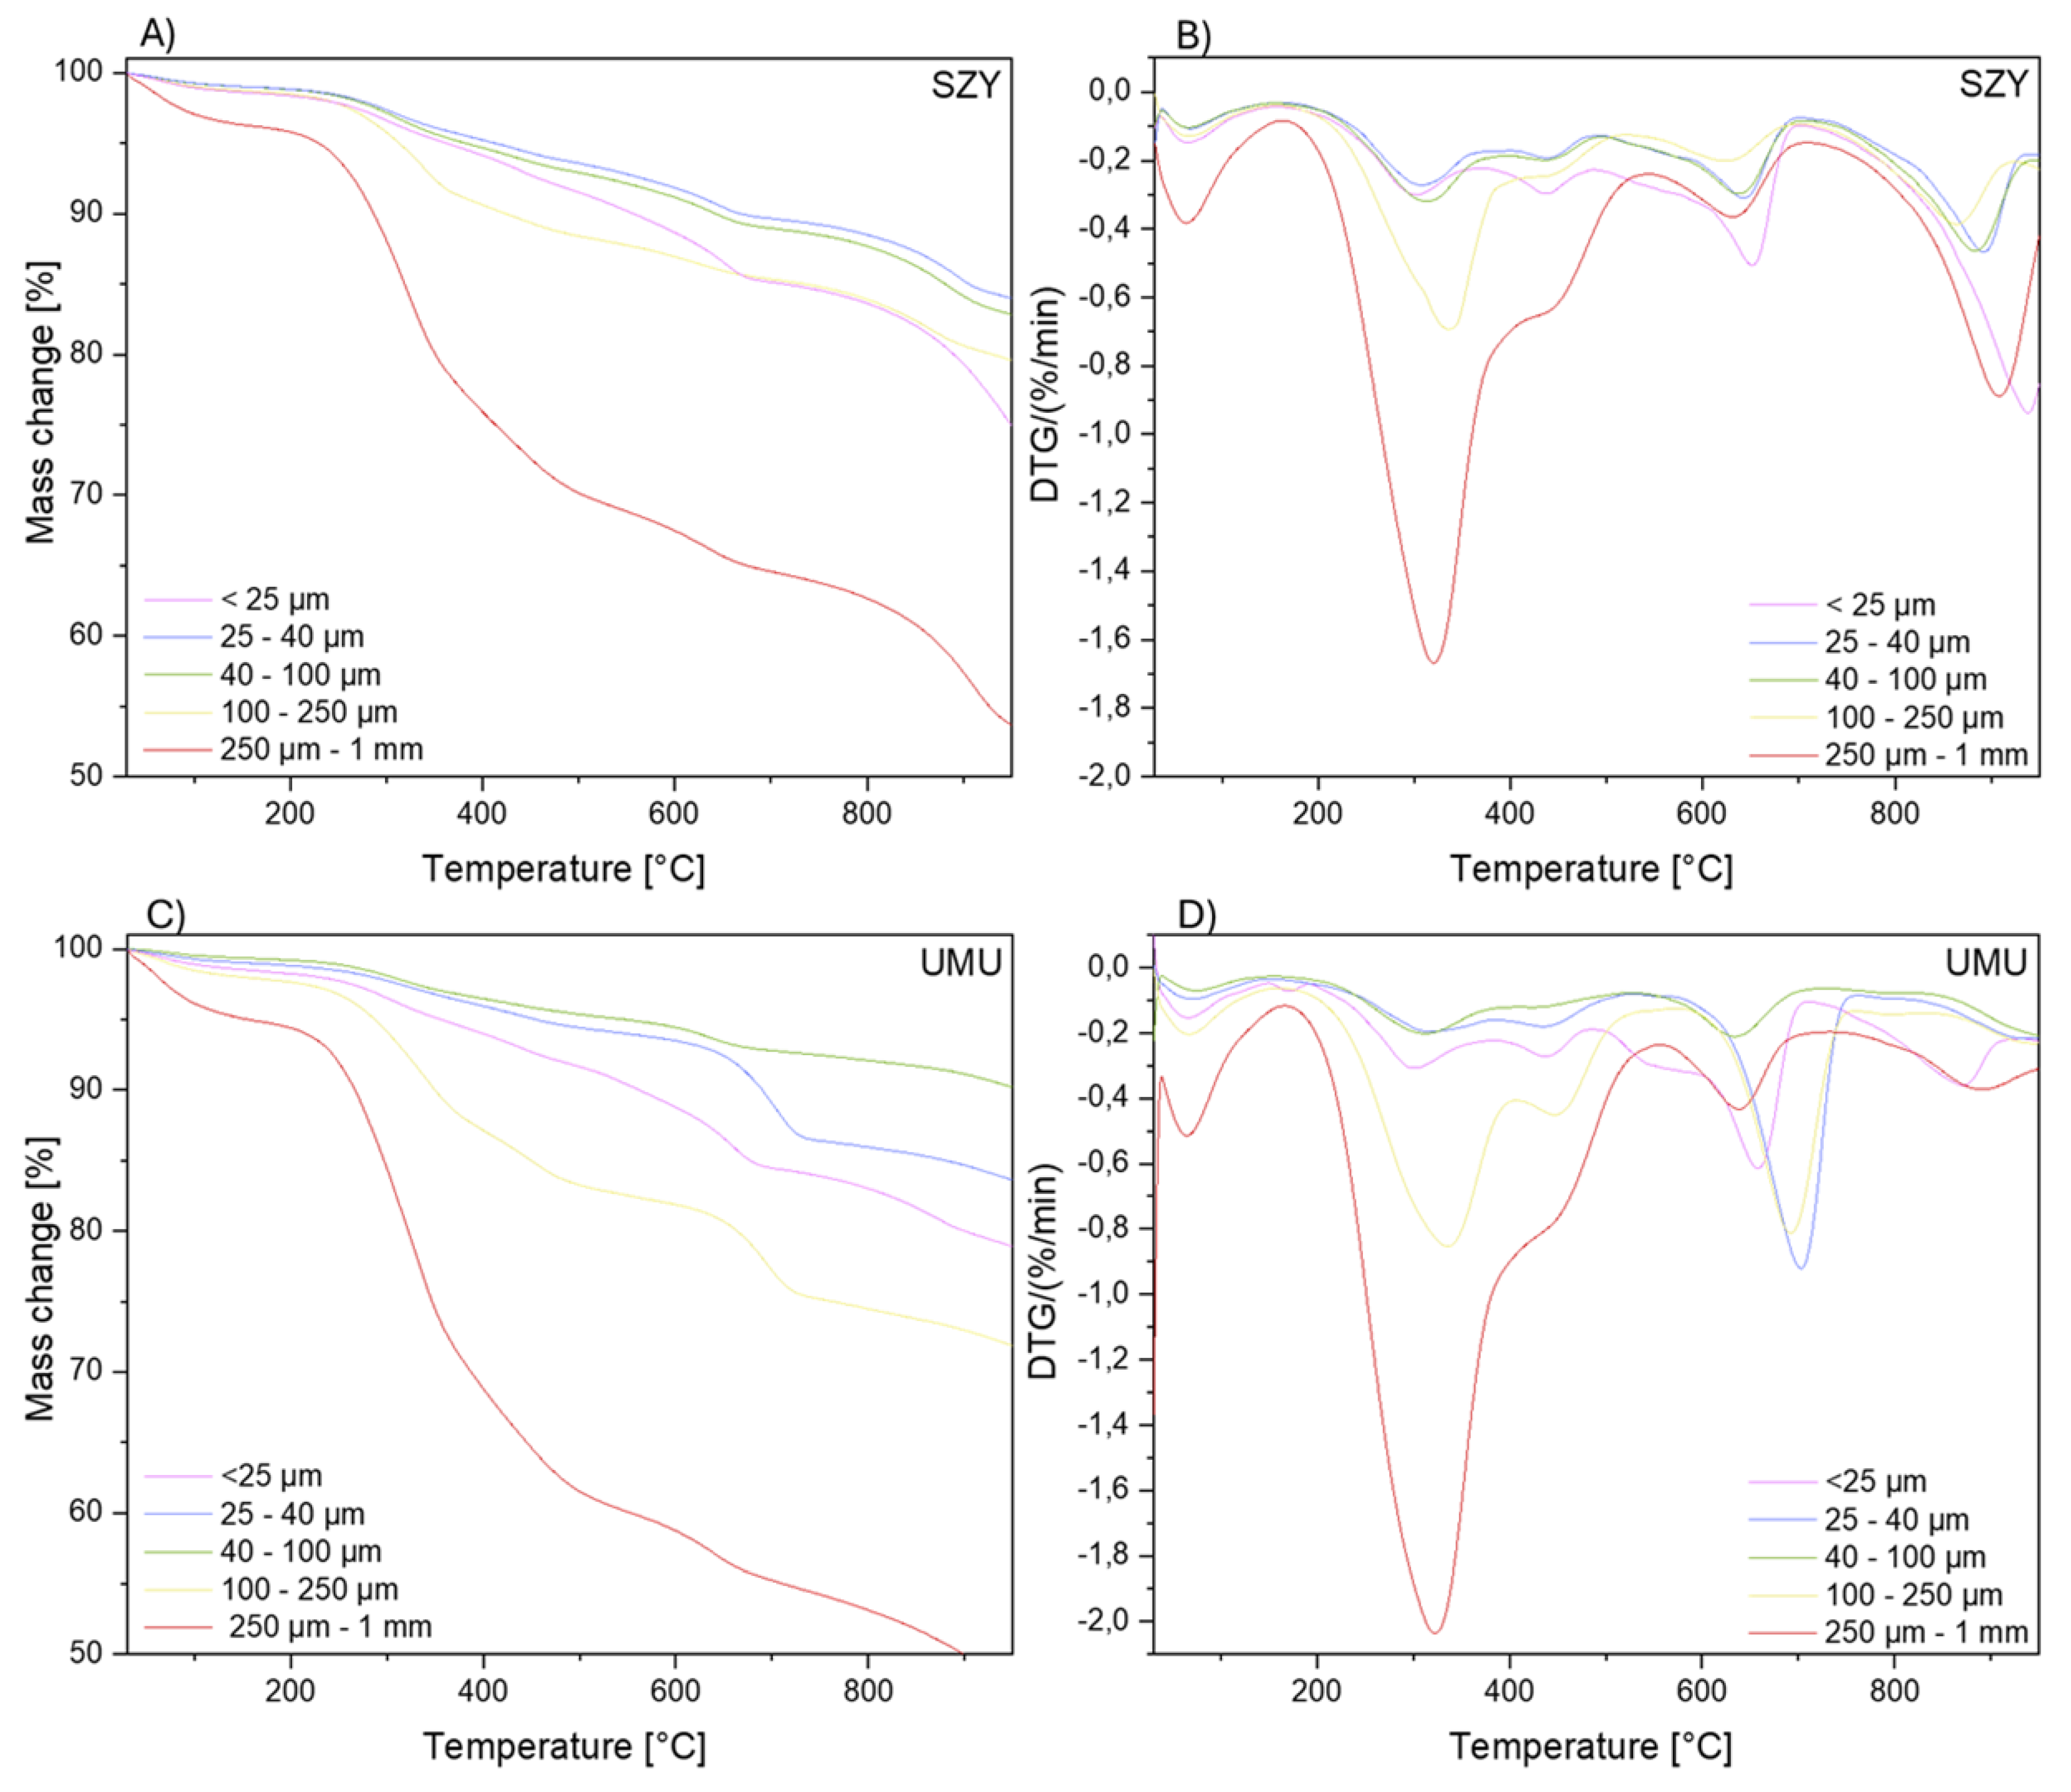
Figure 10.
Thermogravimetric analysis in a nitrogen atmosphere for the BIS sample A) Mass change B) DTG curve; CZT2 sample C) Mass change D) DTG curve.
Figure 10.
Thermogravimetric analysis in a nitrogen atmosphere for the BIS sample A) Mass change B) DTG curve; CZT2 sample C) Mass change D) DTG curve.
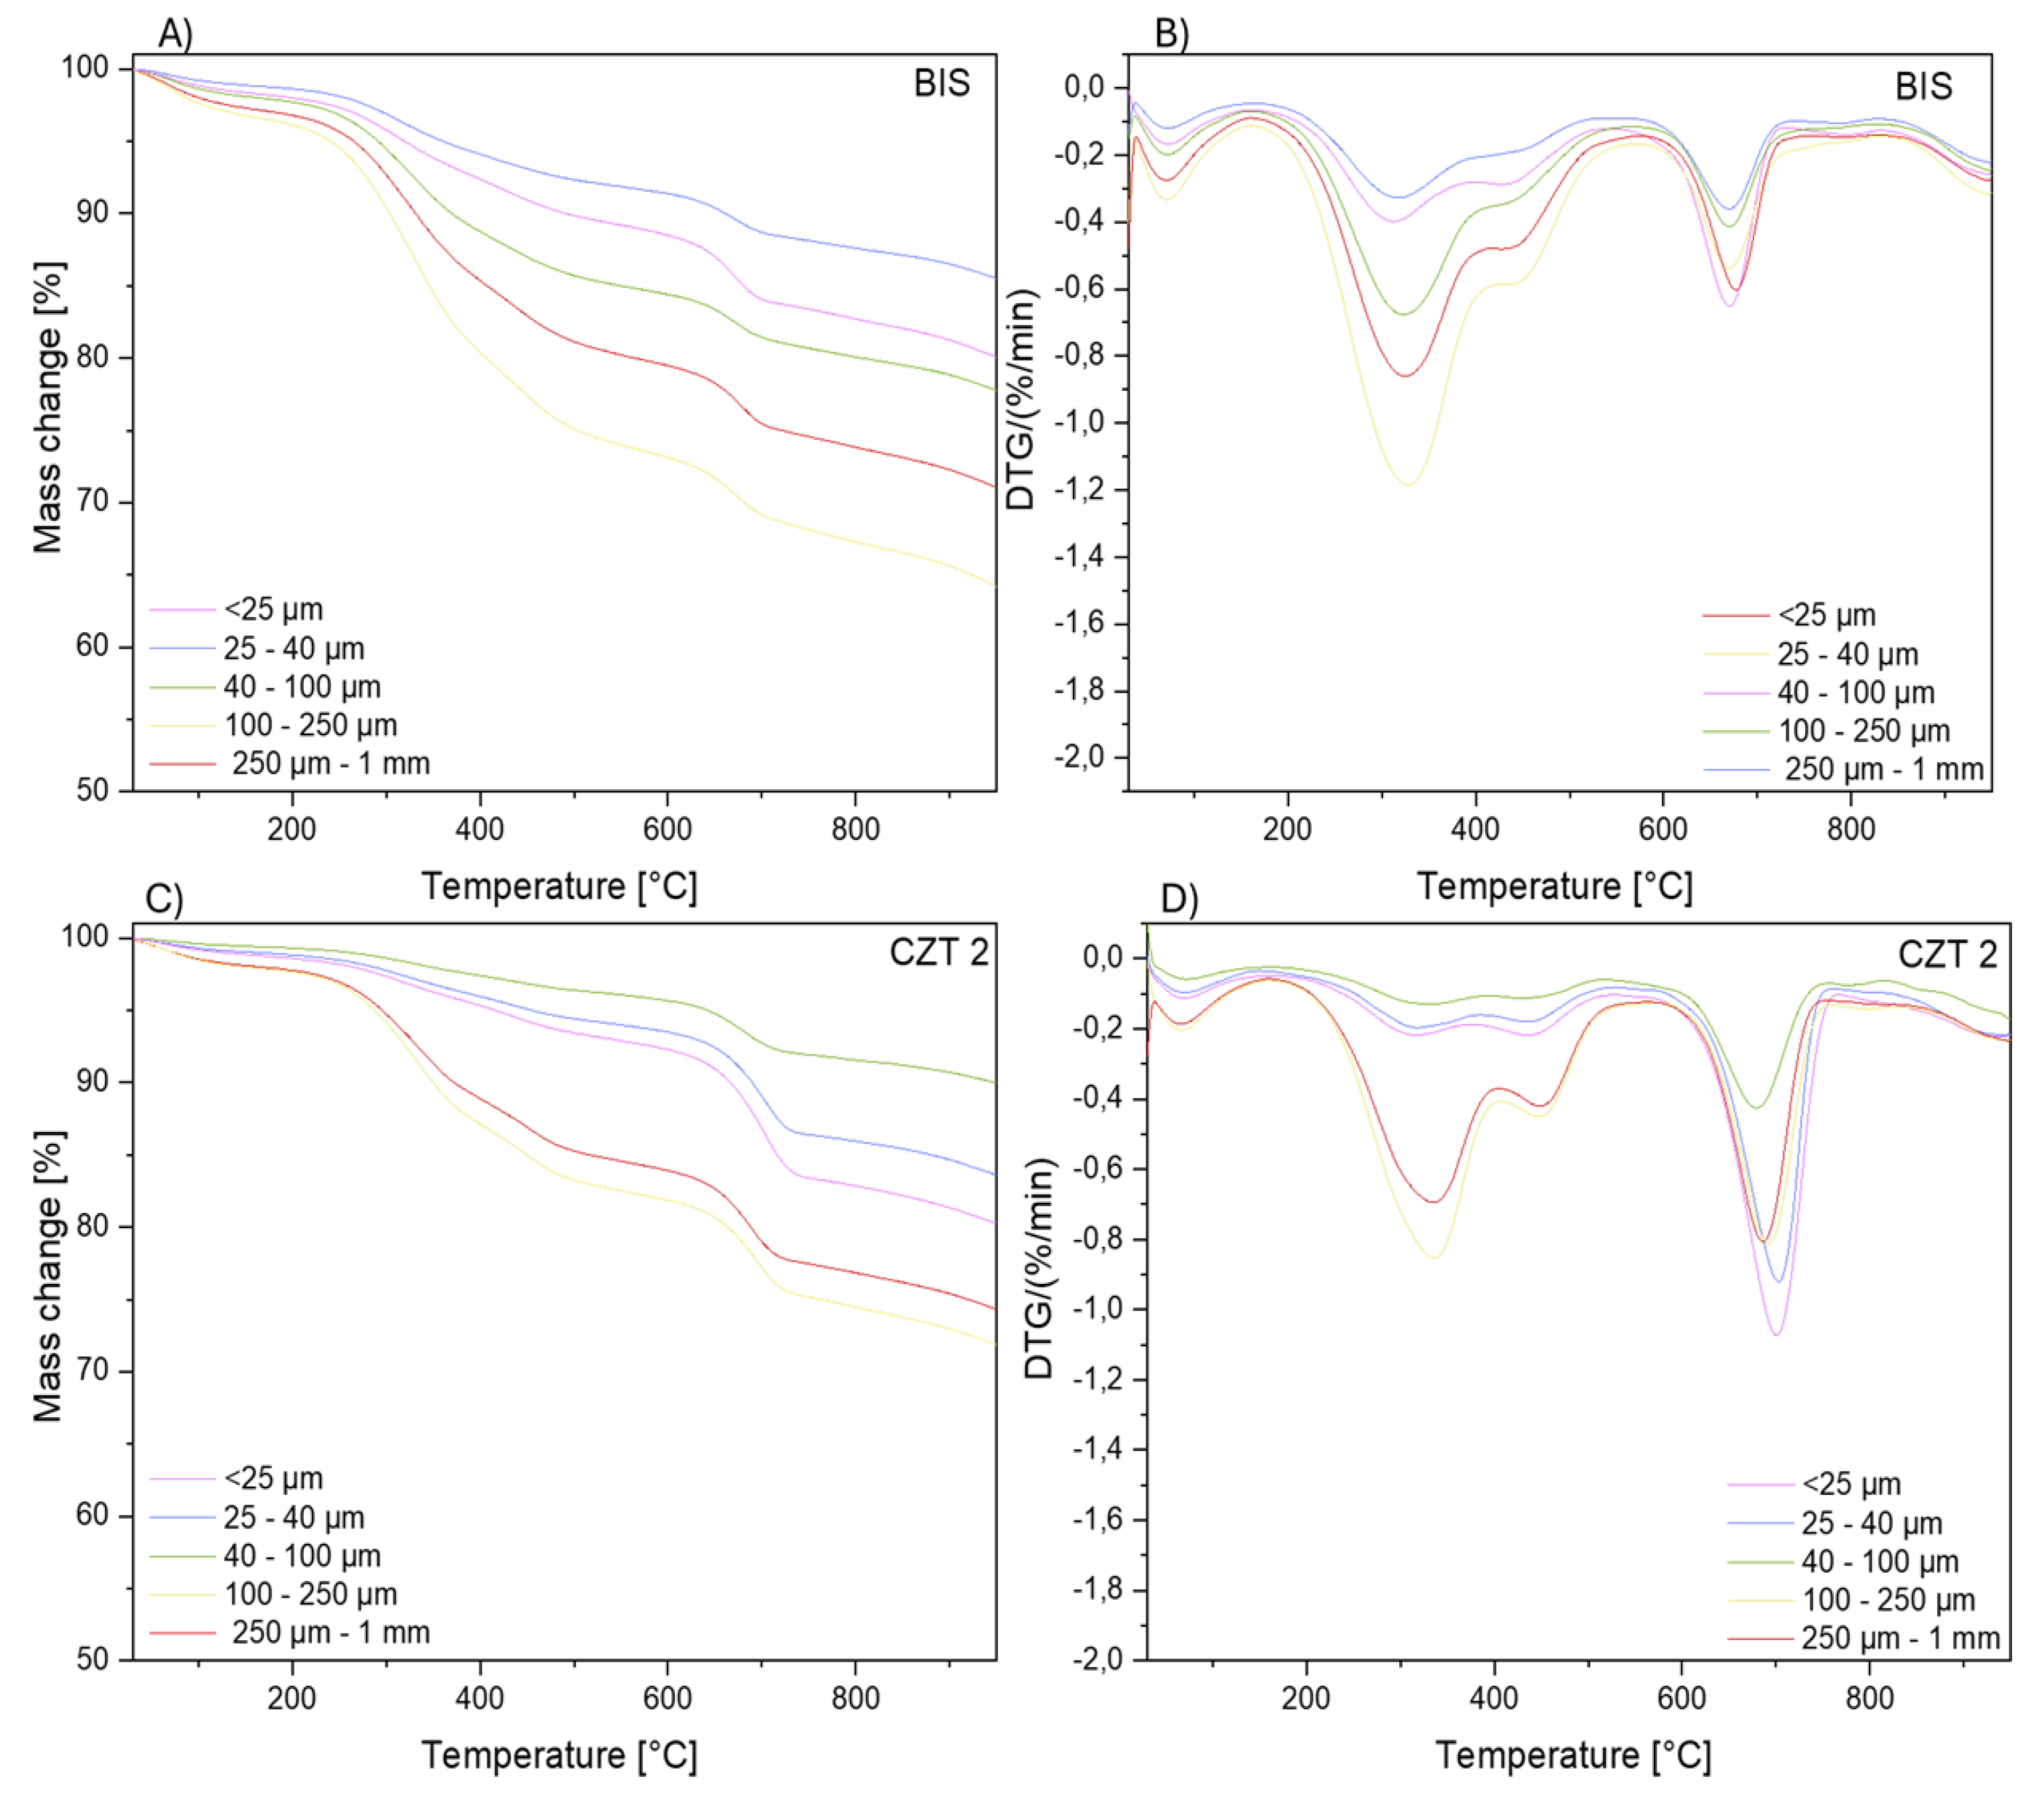
Figure 11.
NMR spectroscopy of extracts obtained from fractions extracted with DCM (red) and iPrOH (blue).
Figure 11.
NMR spectroscopy of extracts obtained from fractions extracted with DCM (red) and iPrOH (blue).
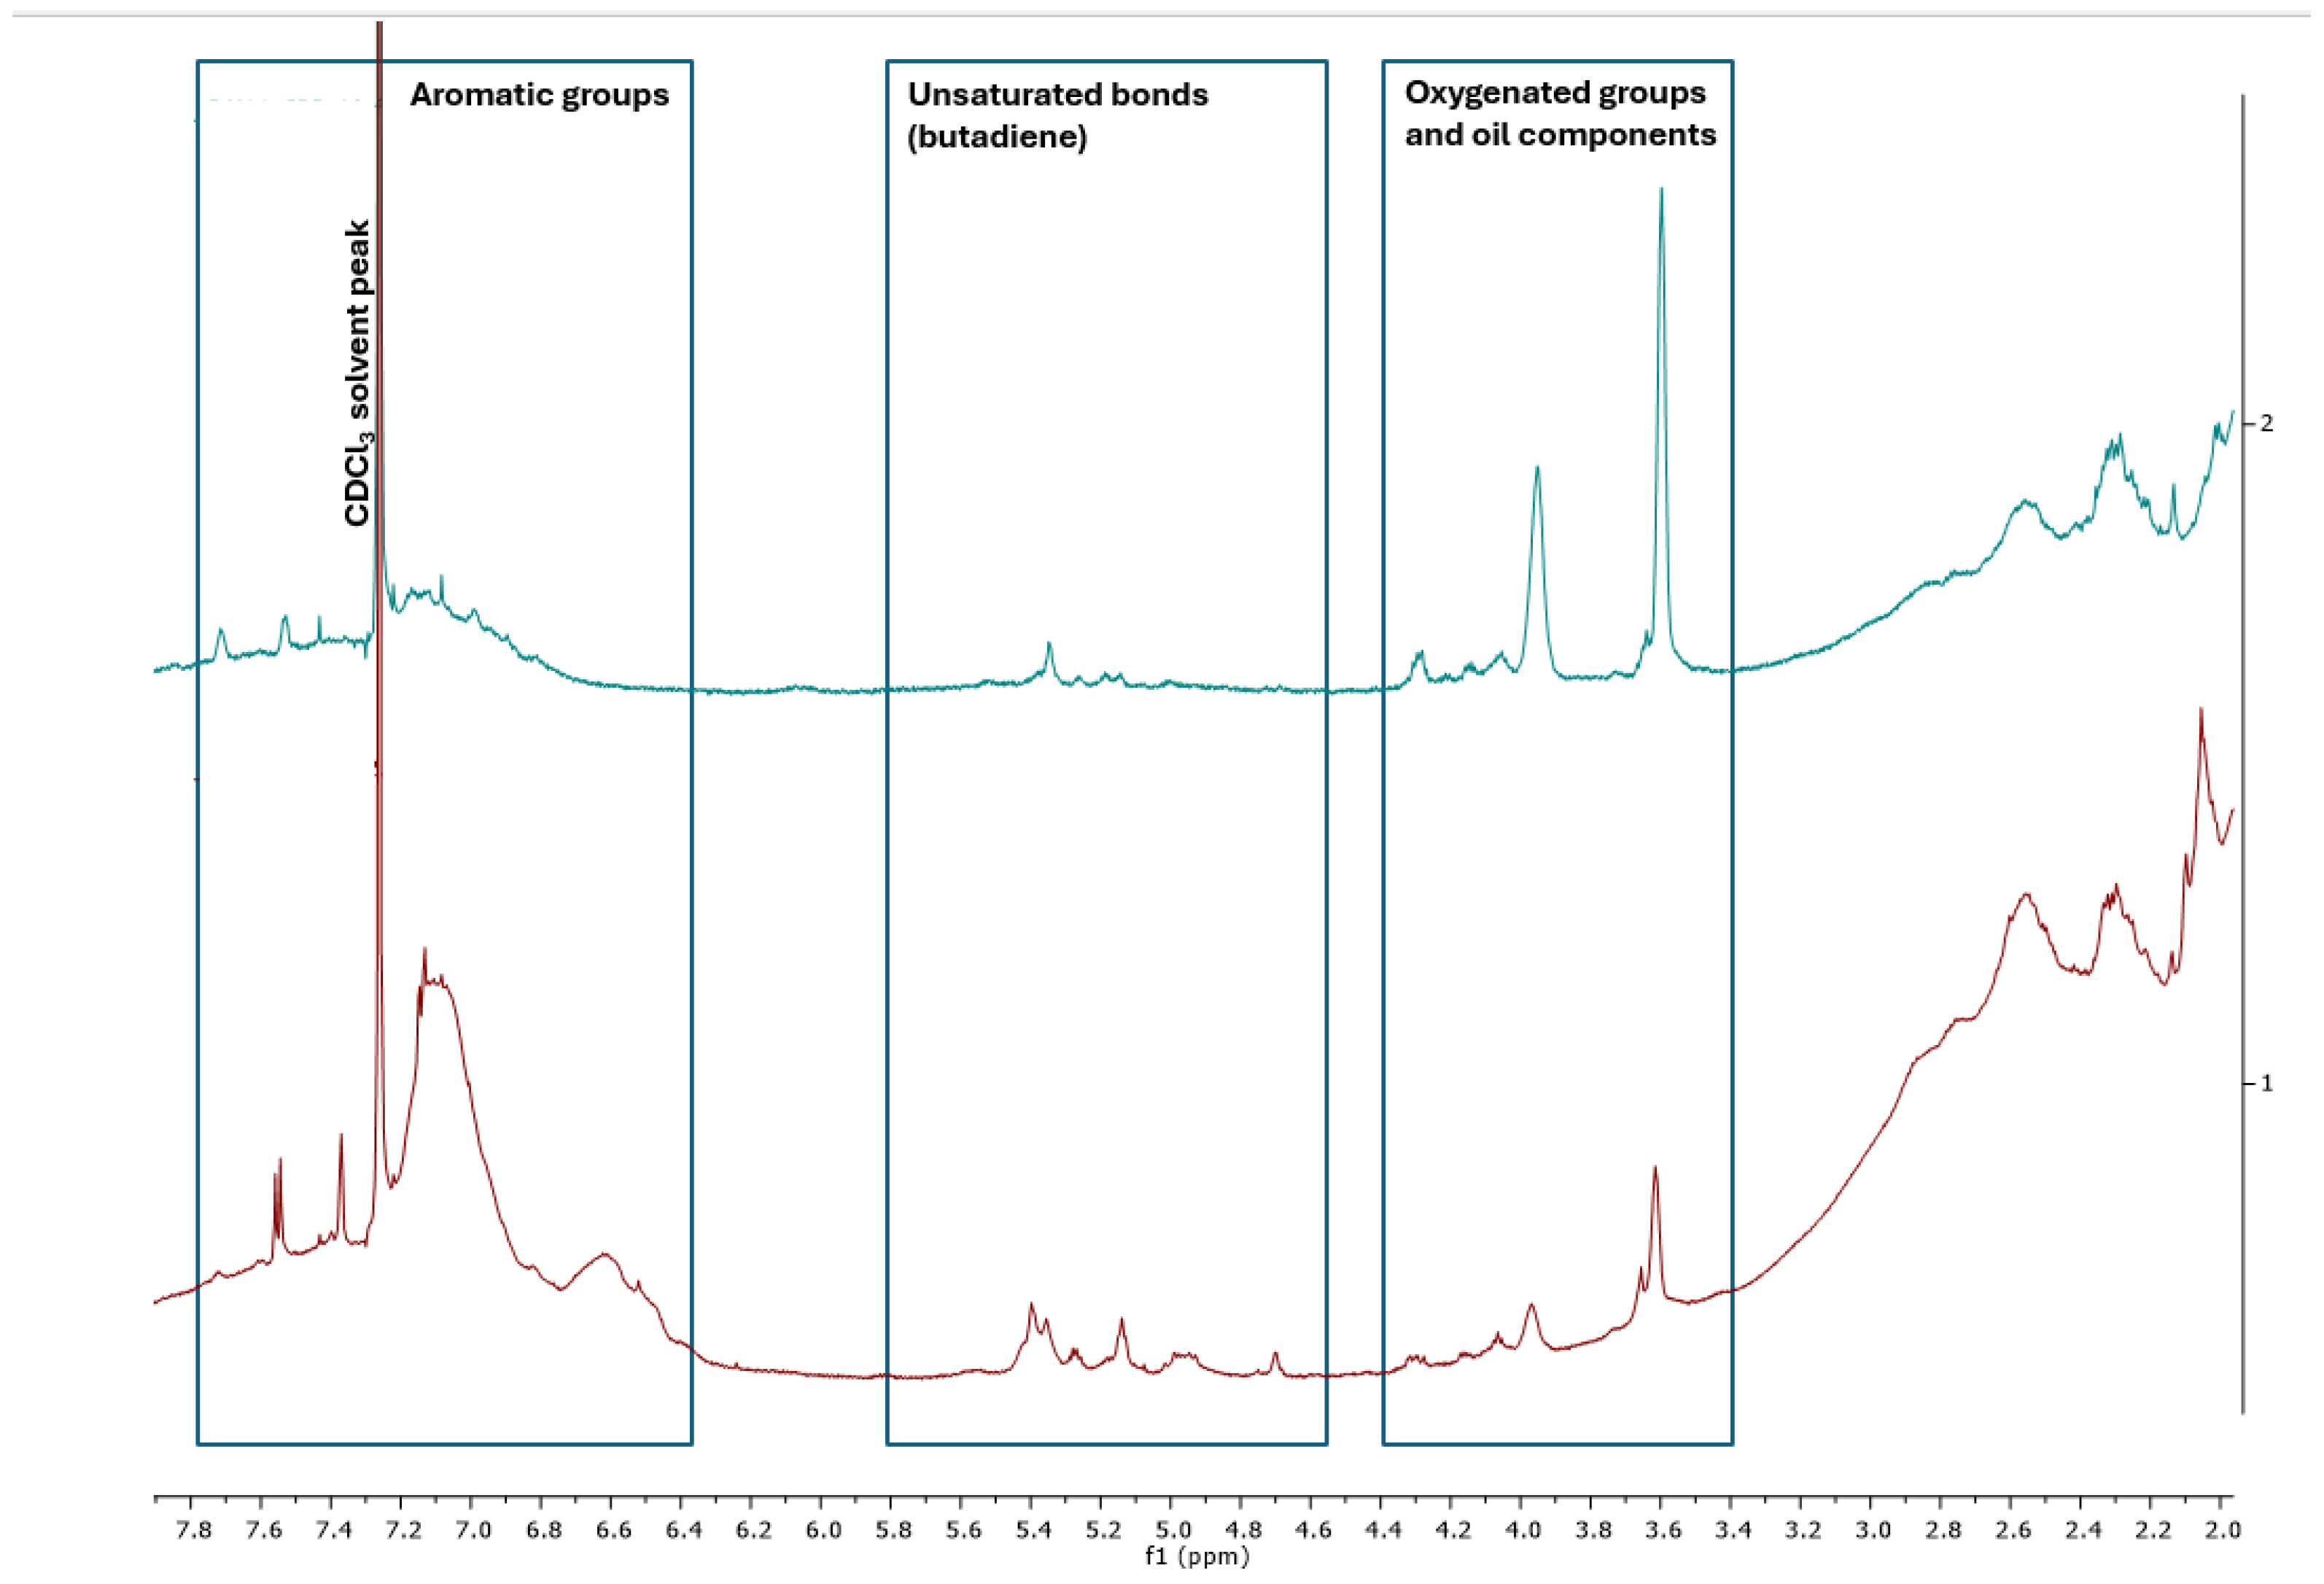
Figure 12.
FT-IR spectroscopy of extracts obtained from fractions extracted with DCM and iPrOH.
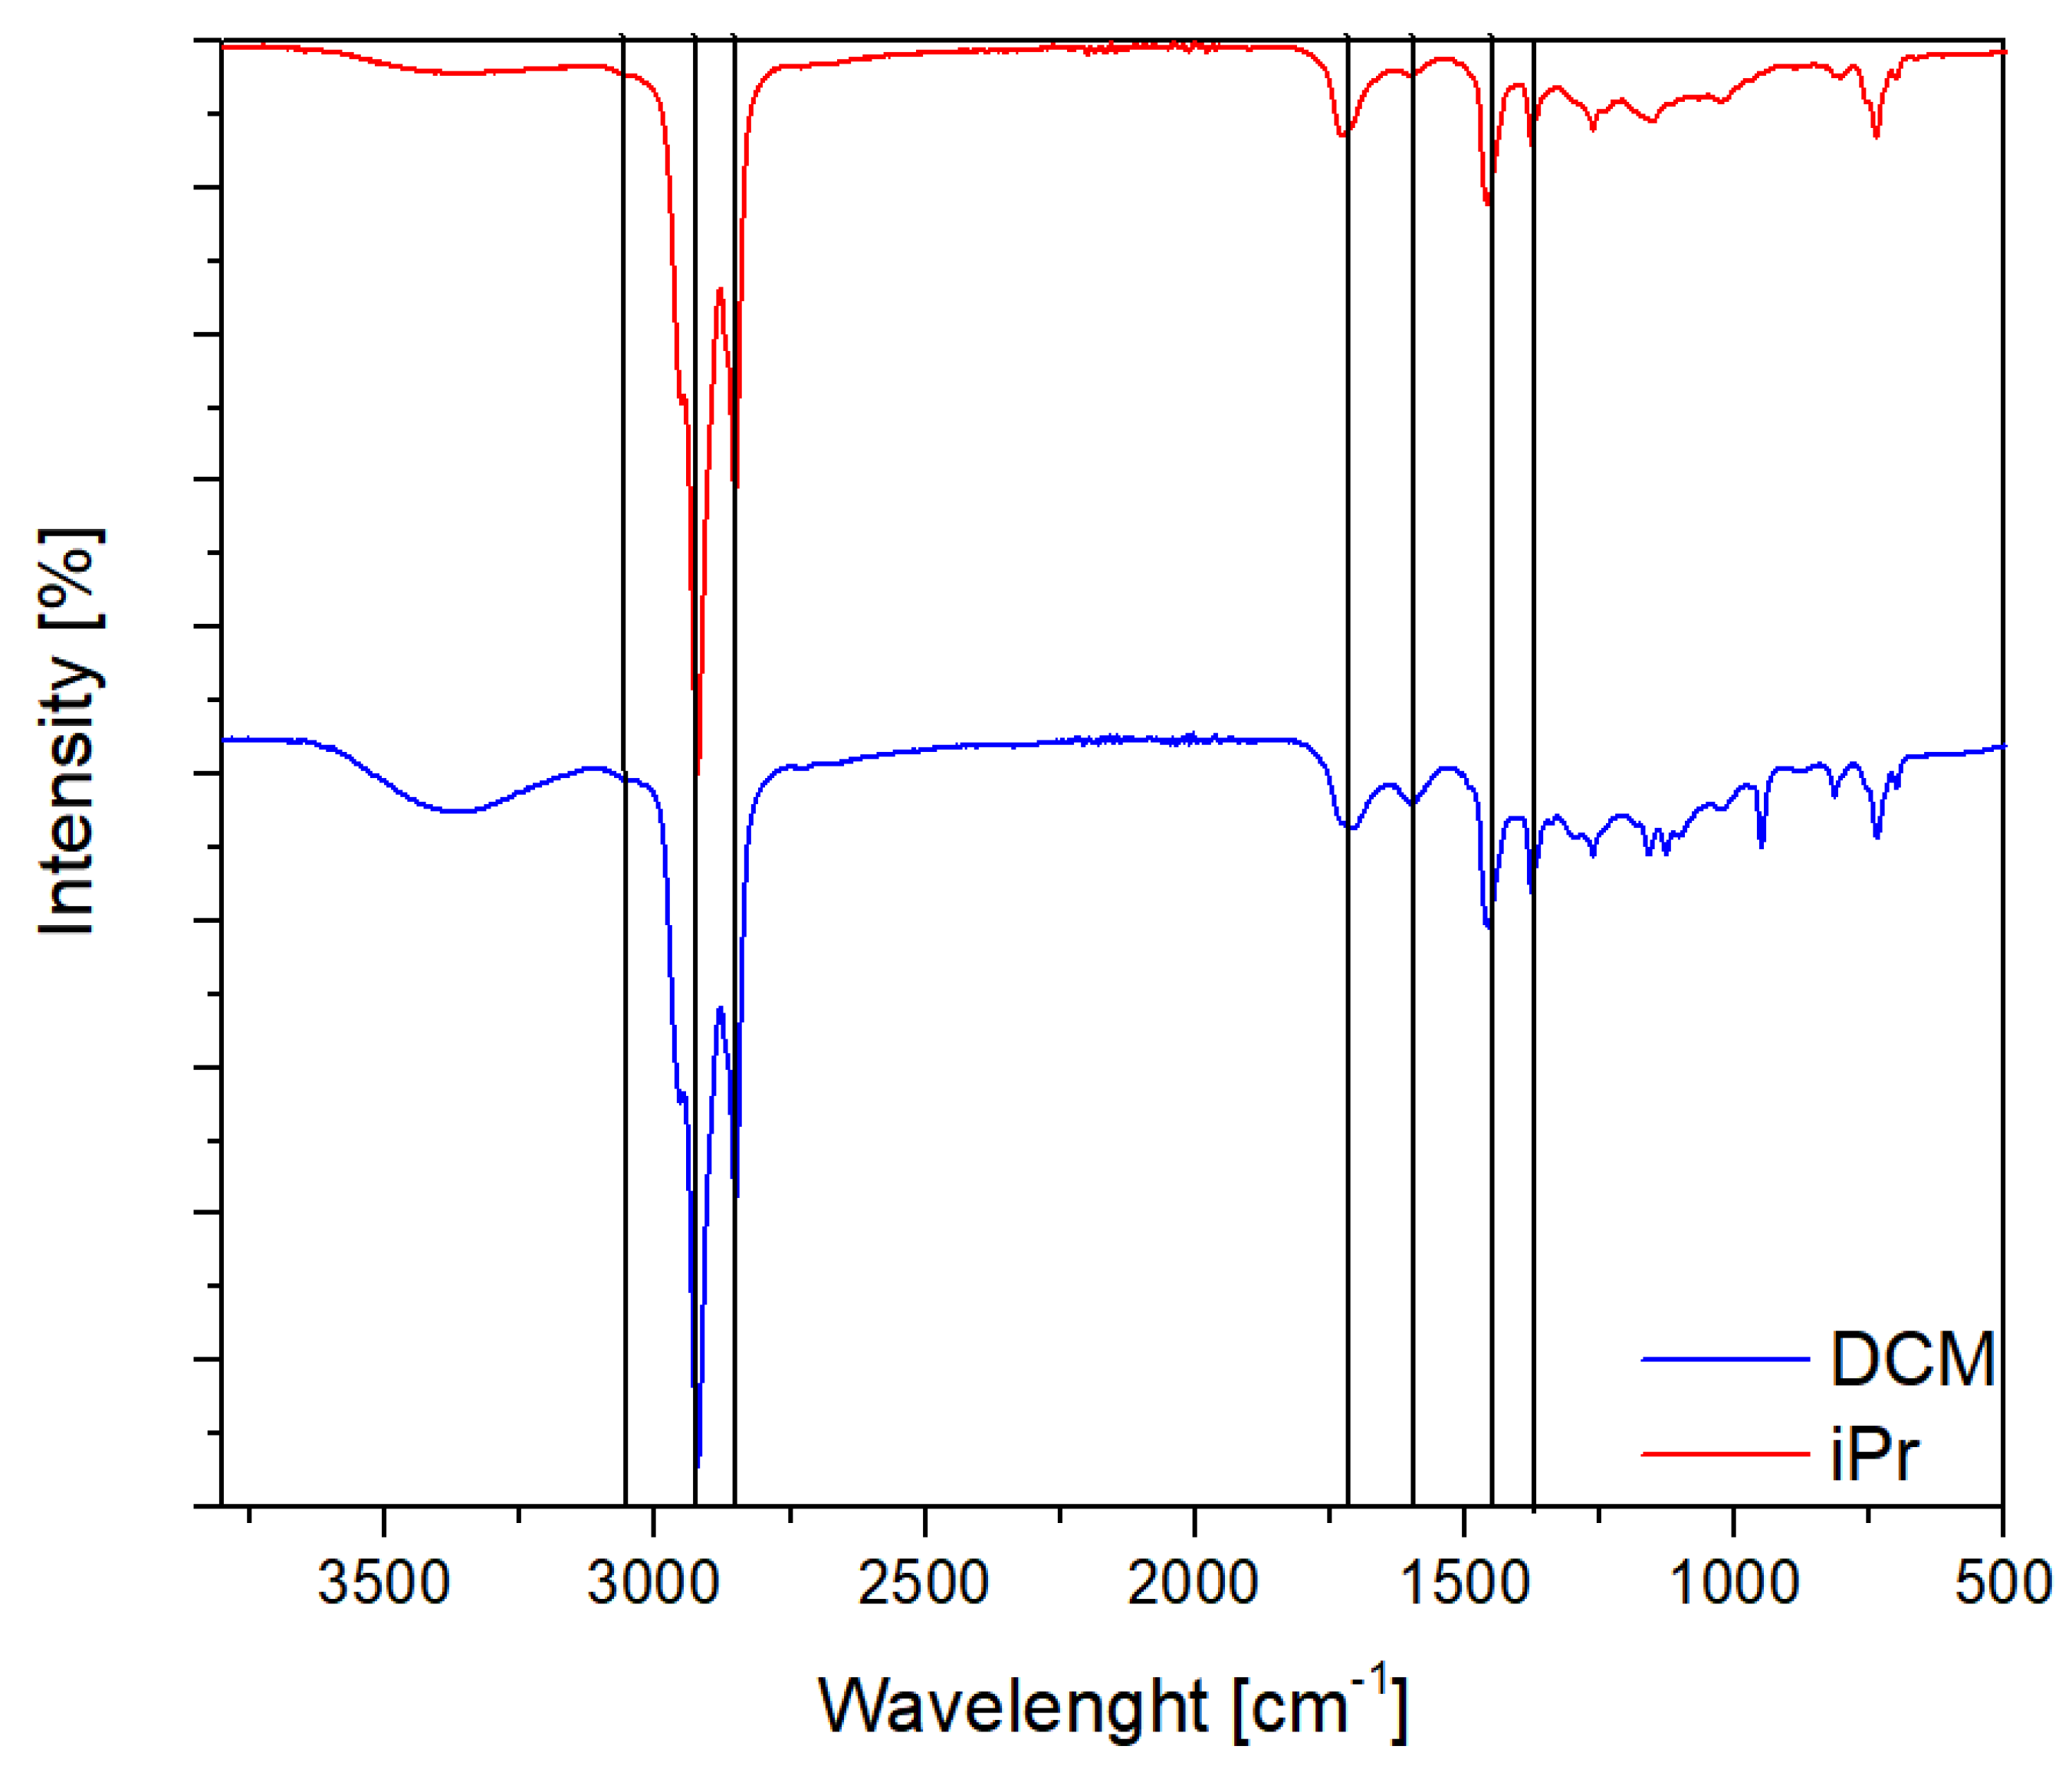
Figure 13.
X-ray diffraction of the analyzed samples.
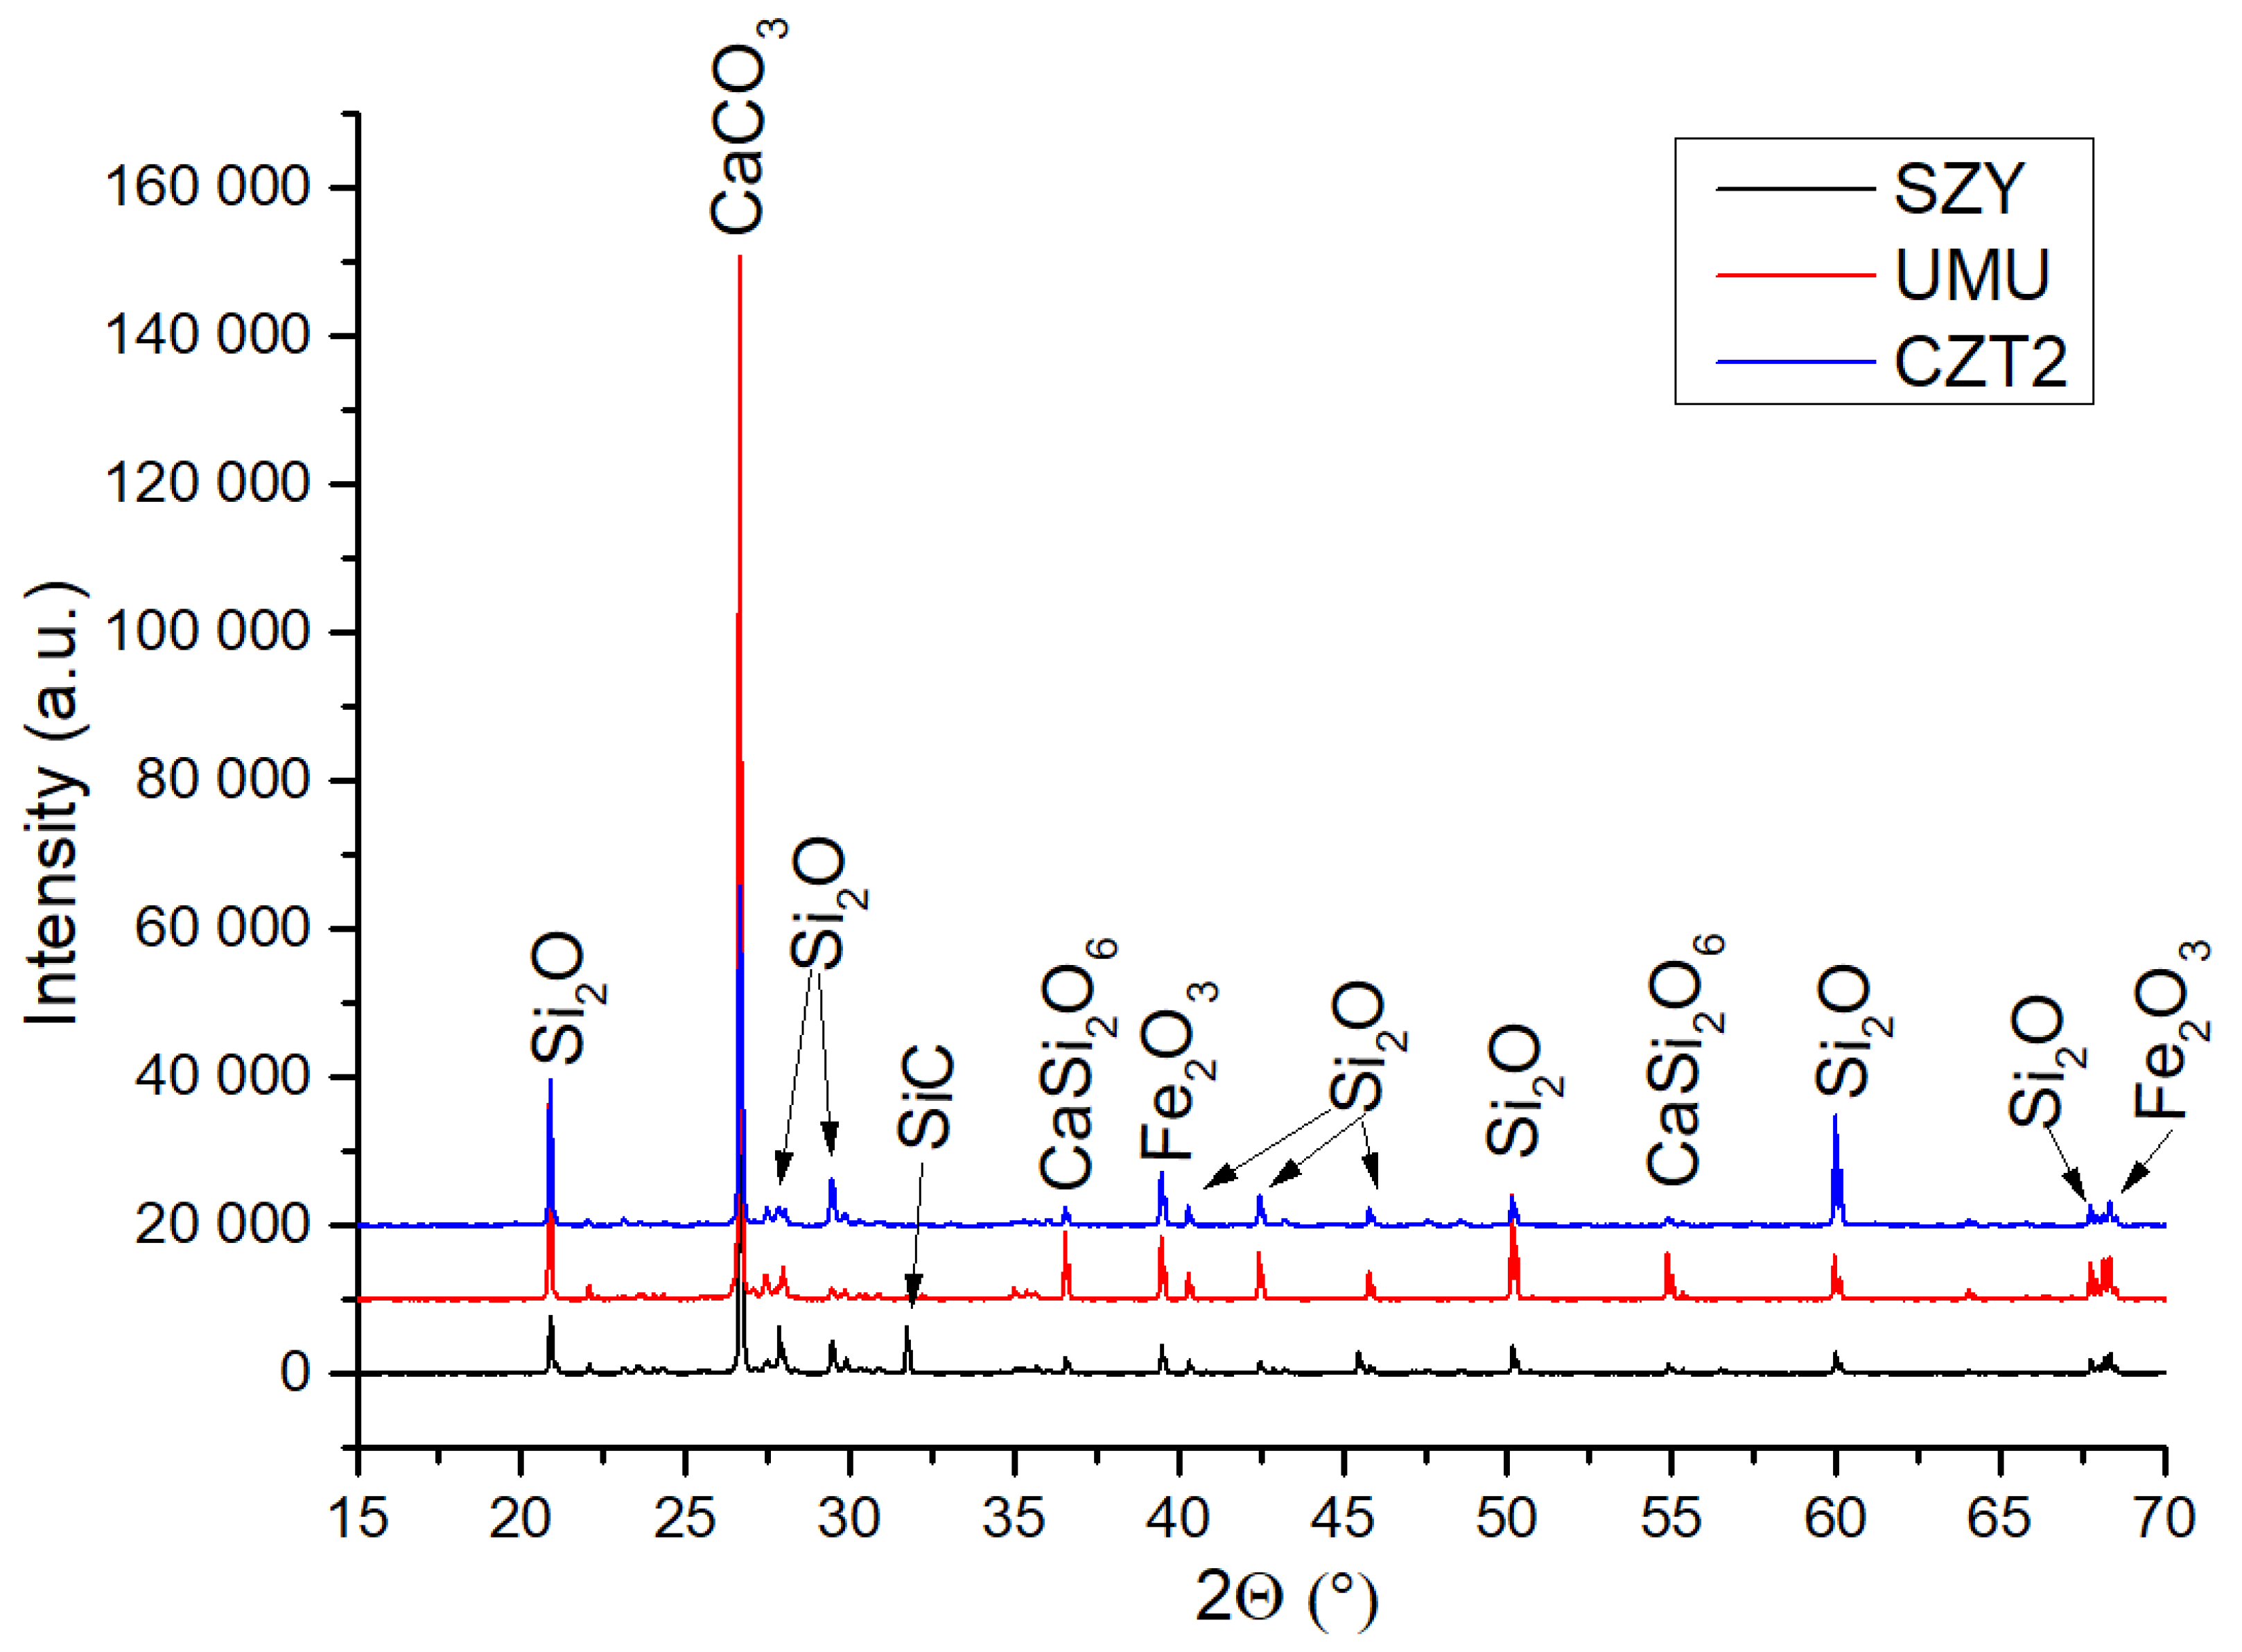
Figure 14.
Snow deposits accumulate while driving on road vehicles.
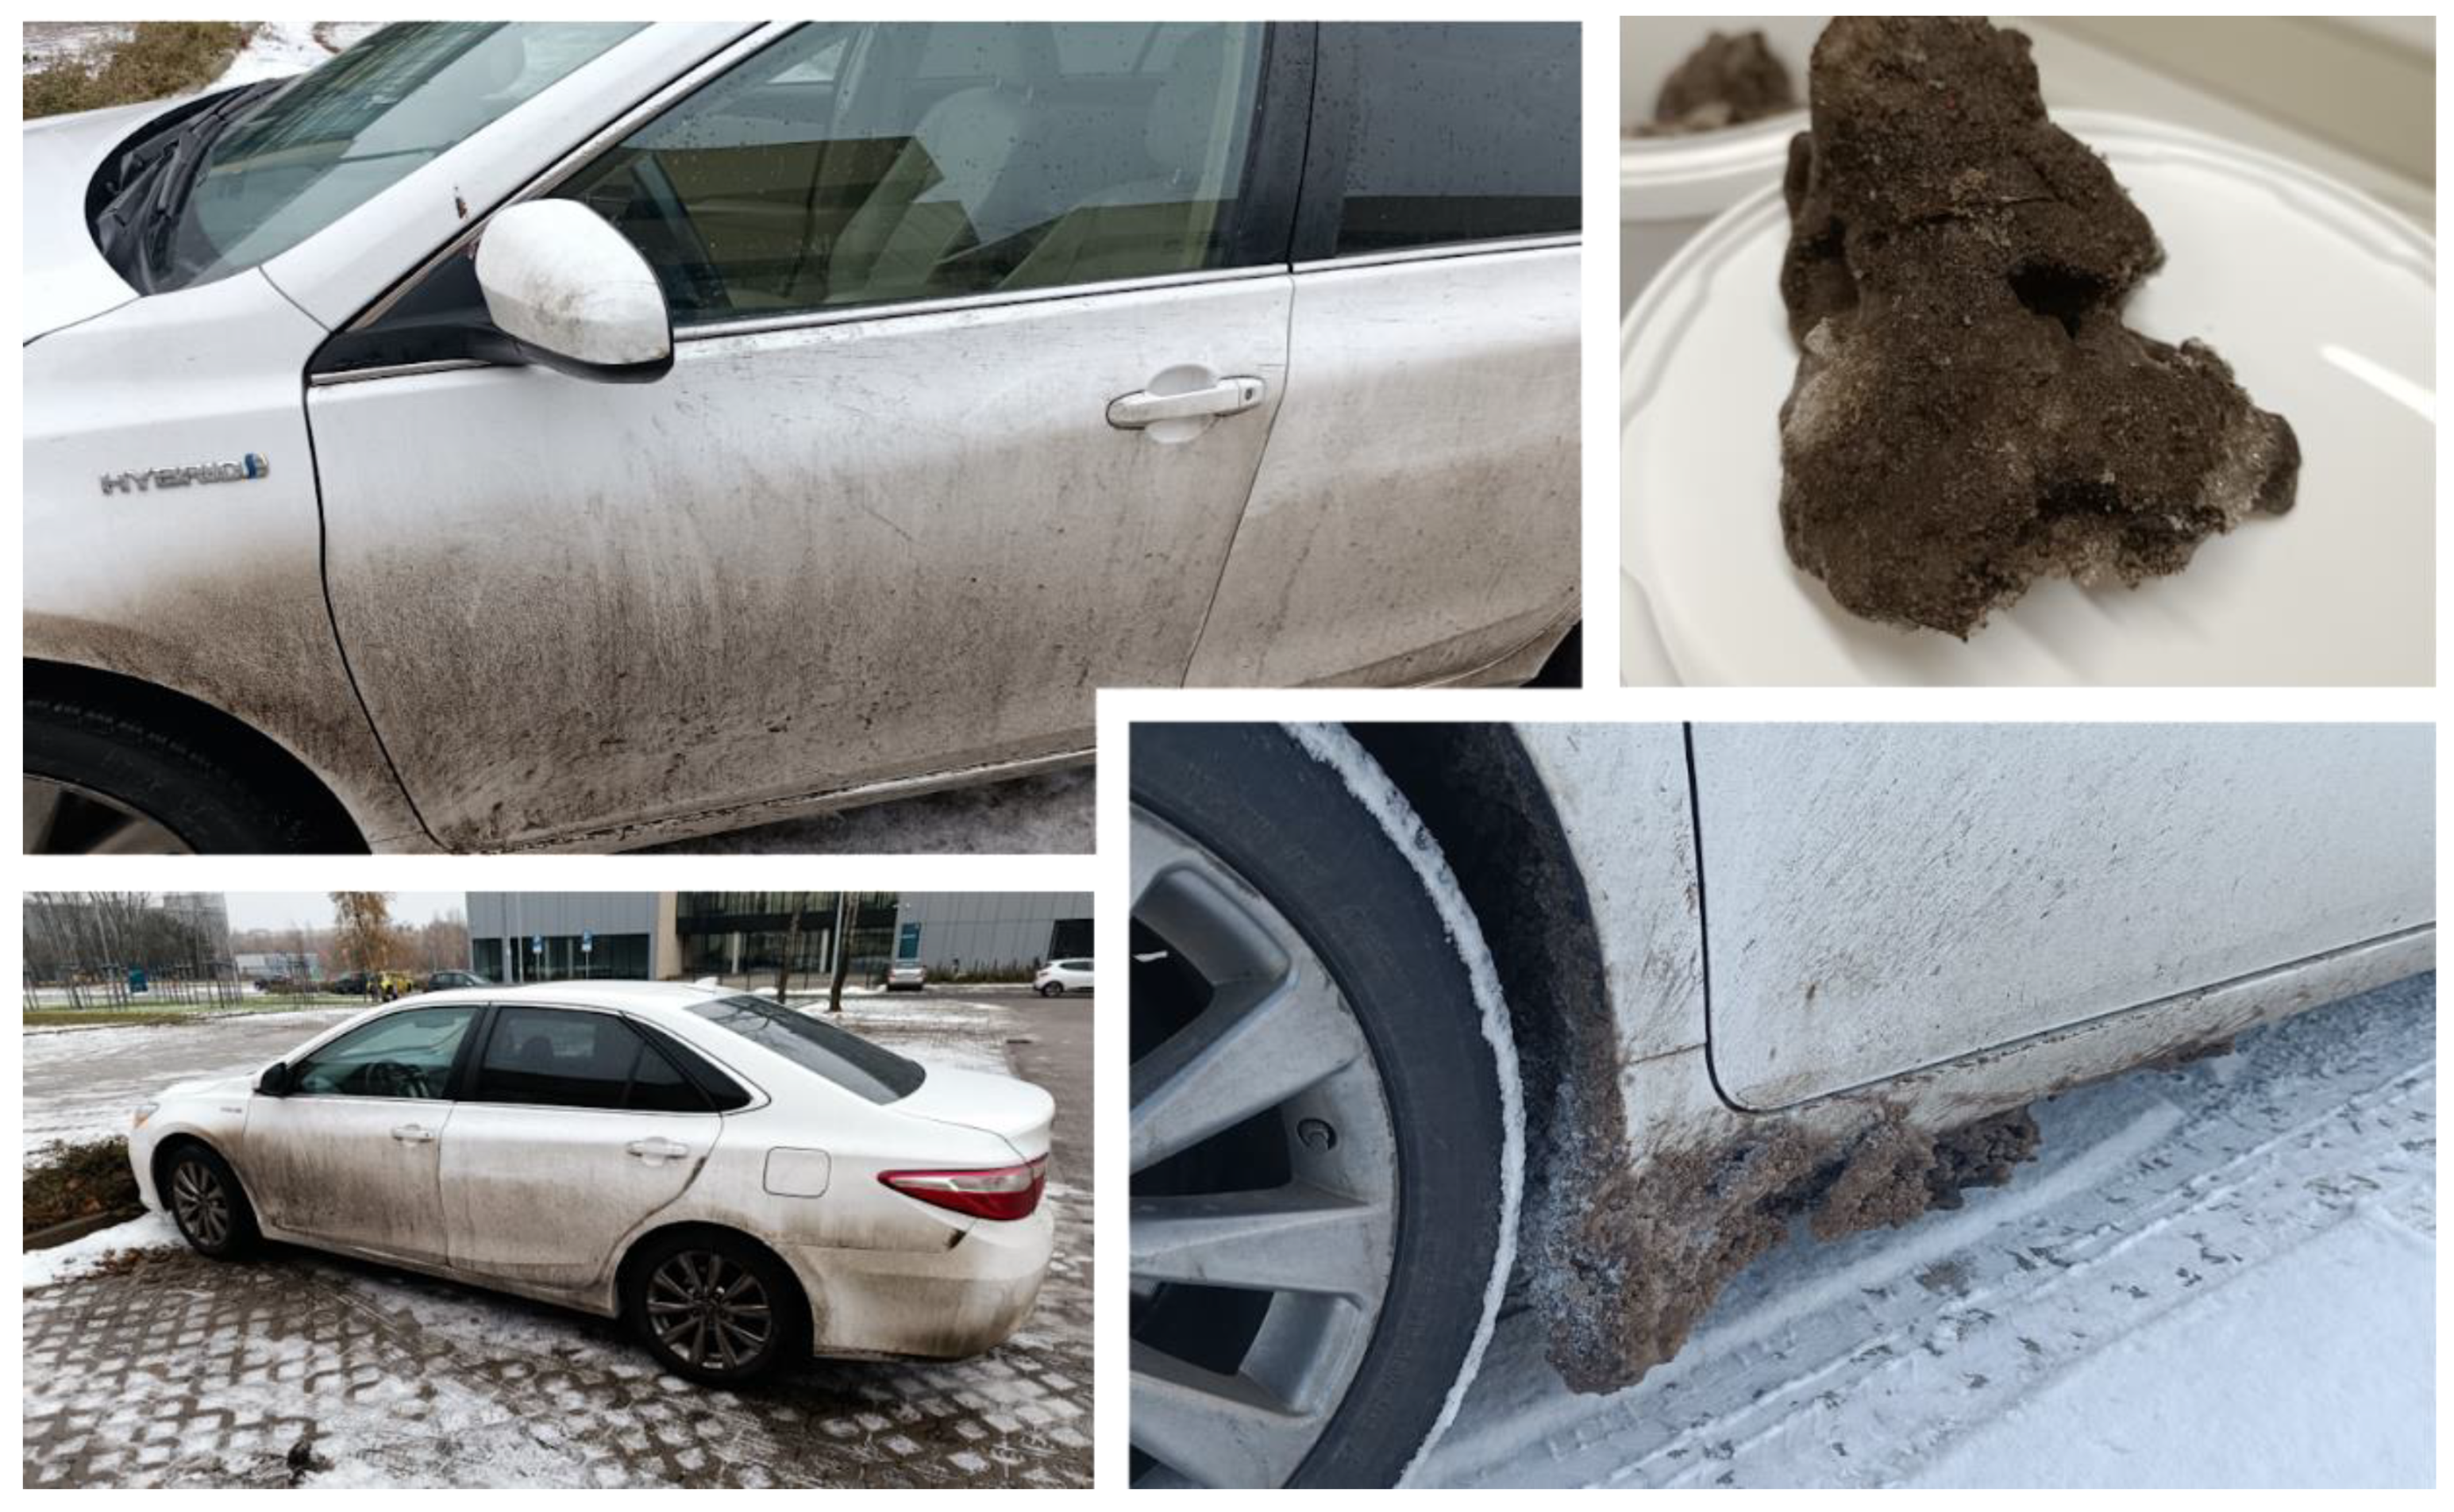
Table 2.
List of collected samples along with their abbreviations and type.
| No. | Place of sample collection | Abbreviation | Sample type |
|---|---|---|---|
| 1 | Szymanowskiego street | SZY | Roadside sand |
| 2 | Umultowska street | UMU | Roadside sand |
| 3 | Biskupińska street | BIS | Roadside sand |
| 4 | Parking on the Morasko campus | CZT1 | Snow deposit |
| 5 | Parking on the Morasko campus | CZT2 | Snow deposit |
| 6 | Parking lot at the Stefan Batory estate | BAT | Standing water |
| 7 | DK11 steet | DK11 | Snow deposit |
Table 3.
Summary table regarding the concentration of micro- and nano-pollutants after the solvent-washing process.
Table 3.
Summary table regarding the concentration of micro- and nano-pollutants after the solvent-washing process.
| Sample | Solvent | Concentration [mg/ml] |
|---|---|---|
| SZY | DCM[a] | 0,903 |
| iPrOH[b] | 1,024 | |
| UMU | DCM | 2,451 |
| iPrOH | 1,460 | |
| BAT | DCM | 0,334 |
| iPrOH | 0,523 | |
| CZT1 | DCM | 0,495 |
| iPrOH | 1,645 | |
| BIS | DCM | 1,334 |
| iPrOH | 2,095 | |
| DK11 | DCM | 0,667 |
| iPrOH | 3,110 | |
| CZT2 | DCM | 2,656 |
| iPrOH | 2,617 |
[a] dichloromethane. [b] isopropanol.
Table 4.
Elemental composition of selected materials obtained by EDS analysis.
| Sample Name | Element symbol | Atomic concentration [%] | |||||||||||||||
|---|---|---|---|---|---|---|---|---|---|---|---|---|---|---|---|---|
| BAT sediment | O | 57.05 | Ca | 12.49 | C | 21.09 | N | 9.37 | ||||||||
| BAT sediment | O | 59.77 | Si | 10.00 | Al | 10.04 | Na | 8.51 | C | 11.35 | ||||||
| SZY sediment | O | 57.17 | Si | 14.06 | C | 17.41 | Al | 5.47 | Na | 5.69 | Te | 0.16 | ||||
| SZY sediment | O | 57.36 | C | 29.75 | Ca | 8.21 | Na | 1.85 | Cl | 1.04 | Si | 1.19 | Al | 0.51 | ||
| BIS sediment | O | 65.97 | Si | 12.39 | Fe | 5.12 | Al | 9.88 | Mg | 4.20 | K | 1.77 | ||||
| CZT2 sediment | O | 65.84 | Si | 12.69 | Al | 8.84 | C | 12.63 | ||||||||
| UMU sediment | O | 60.98 | Si | 9.67 | Al | 8.95 | Fe | 3.13 | C | 13.86 | Na | 1.39 | Te | 0.24 | Cl | 0.52 |
| DCM extracts* | C | 100 | ||||||||||||||
* In EDS observations it was noticed that all samples of DCM extracts contained only carbon.
Table 5.
Sediment particle size distribution based on DLS.
| Sample | Fraction | Homogenity | Surface area [m2/kg] | Dx (10) [μm] |
Dx (50) [μm] |
Dx (90) [μm] |
|---|---|---|---|---|---|---|
| SZY | < 25 μm | 0.901 | 1329 | 1.93 | 7.73 | 24.0 |
| 25 – 40 μm | 0.765 | 553.2 | 4.01 | 42.3 | 109 | |
| 40 – 100 μm | 0.925 | 511.7 | 4.15 | 58.2 | 165 | |
| CZT2 | < 25 μm | 0.871 | 1409 | 1.91 | 6.93 | 20.4 |
| 25 – 40 μm | 1.569 | 909.4 | 2.60 | 15.54 | 83.5 | |
| 40 – 100 μm | 3.007 | 144.1 | 62.4 | 229 | 2230 | |
| UMU | < 25 μm | 0.733 | 1031 | 2.54 | 10.8 | 27.9 |
| 25 – 40 μm | 0.567 | 321.6 | 10.6 | 48.4 | 105 | |
| 40 – 100 μm | 0.957 | 489.8 | 3.77 | 59 | 168 | |
| BIS | < 25 μm | 0.676 | 998 | 2.68 | 10.9 | 26.4 |
| 25 – 40 μm | 0.702 | 367.8 | 8.4 | 46.3 | 113 | |
| 40 – 100 μm | 0.554 | 182.6 | 22.6 | 120 | 251 |
Table 6.
Thermogravimetric analysis data for the SZY and UMU samples.
| SZY | Tmax1 [°C] | Tmax2 [°C] | Tmax3 [°C] | Tmax4 [°C] | Tmax5 [°C] |
|---|---|---|---|---|---|
| < 25 μm | 64.7 | 302.7 | 437.9 | 652.3 | 939.1 |
| 25 -40 μm | 65.3 | 308.6 | 438.4 | 642.2 | 893.1 |
| 40 - 100 μm | 65.9 | 312.8 | 435.3 | 636.9 | 883.8 |
| 100 - 250 μm | 63.6 | 335.7 | 438.4 | 624.3 | 866.4 |
| 250 μm - 1 mm | 62.5 | 319.9 | 440.2 | 630.1 | 908.7 |
| UMU | Tmax1 [°C] | Tmax2 [°C] | Tmax3 [°C] | Tmax4 [°C] | Tmax5 [°C] |
| < 25 μm | 64.7 | 299.8 | 437.7 | 657.5 | 871.6 |
| 25 -40 μm | 67.9 | 308.5 | 432.3 | 646.5 | 925.3 |
| 40 - 100 μm | 74.8 | 311.2 | 430.8 | 633.8 | - |
| 100 - 250 μm | 70.1 | 316.9 | 431.9 | 641.9 | 858.2 |
| 250 μm - 1 mm | 65.2 | 322.7 | 442.2 | 639.1 |
Disclaimer/Publisher’s Note: The statements, opinions and data contained in all publications are solely those of the individual author(s) and contributor(s) and not of MDPI and/or the editor(s). MDPI and/or the editor(s) disclaim responsibility for any injury to people or property resulting from any ideas, methods, instructions or products referred to in the content. |
© 2024 by the authors. Licensee MDPI, Basel, Switzerland. This article is an open access article distributed under the terms and conditions of the Creative Commons Attribution (CC BY) license (http://creativecommons.org/licenses/by/4.0/).
Copyright: This open access article is published under a Creative Commons CC BY 4.0 license, which permit the free download, distribution, and reuse, provided that the author and preprint are cited in any reuse.


