

Submitted:
17 April 2024
Posted:
22 April 2024
You are already at the latest version
Abstract
The Ghana Venture Capital Trust Fund (VCTF), a government-sponsored initiative, plays a pivotal role in providing patient capital to foster entrepreneurship and spur economic development, particularly in emerging markets where traditional funding avenues may be limited. This study aims to conduct a comprehensive assessment of the VCTF's financial robustness, growth trajectory, and sustainability over a seven-year period from 2016 to 2022. Through an examination of critical financial metrics, growth indicators, and sustainability benchmarks, we scrutinize the fund's financial health, investment strategies, and capacity to bolster the Ghanaian entrepreneurial ecosystem.The analysis reveals nuanced insights into the VCTF's financial performance over the study period. Despite encountering challenges such as negative net profit margins and subdued asset turnover ratios in previous years, the fund showcases resilience and sustainability, particularly as evidenced by notable improvements in 2022. These findings carry implications for management, policymakers, and various stakeholders within the Ghanaian venture capital landscape, offering valuable insights to inform strategic decision-making and policy formulation.
Keywords:
Venture Capital Fund
; Financial Viability
; Sustainability
; Investment
; Economic Development
Introduction
Venture capital funds(VCF) are one of the main development finance tools pivotal in providing patient capital, fostering entrepreneurship and economic development, particularly in emerging markets where traditional financing may be scarce. The Venture Capital Trust Fund (VCTF) in Ghana represents a critical case for examining the financial viability and sustainability of such government-backed funds within a developing country context. This introduction sets the stage for a comprehensive analysis of VCTF’s performance, drawing on various research findings to understand its impact, challenges, and prospects. The importance of evaluating the financial performance and sustainability of venture capital funds is also highlighted in the existing literature(Gatsi & Osie Nsenkyire, 2010).
The role of venture capital funds in supporting entrepreneurship and innovation has been well-documented in previous research. Researchers on VCF indicate that it plays a significant role in providing capital and support to small and medium-scale enterprises (SMEs) in Ghana, contributing to job creation, revenue generation, business creation, and business growth (Boadu et al., 2014; Samila & Sorenson, 2011). Venture capital investments have a significant positive impact on innovation, as measured by patent counts (Kortum & Lerner, 2001). However, the venture capital industry in Ghana faces limitations, including a reliance on the VCTF, a focus on later-stage investments, and a lack of angel investors, which could impede the growth of entrepreneurship (Gatsi & Osie Nsenkyire, 2010). The effectiveness of venture capital instruments and control mechanisms has been shown to significantly influence the growth of VC funds in Ghana(Sulemana & Chen, 2018), while entrepreneurs perceive access to venture capital as challenging, despite acknowledging its potential benefits(Adusei & Isaac, 2017). Moreover, the social impacts of venture capital investments, often underrepresented by traditional metrics, suggest a need for a more nuanced understanding of their broader effects (Barnett et al., 2018).
Primarily, the existing academic literature on venture capital in Ghana has focused on the appraisal of the genral landscape of VCF in Ghana (Gatsi & Osie Nsenkyire, 2010), performance and sustainability of entities that have benefited from financing by venture capital funds (Boadu et al., 2014) and the perpectives of SME towards VCF(Adusei & Isaac, 2017). In other jurisdictions, Bertoni et al. (2011) examined the impact of venture capital investments on the growth and profitability of Italian high-tech startups, while Rosenbusch et al. (2013) conducted a meta-analysis on the relationship between venture capital investment and funded firm financial performance. This body of research provides valuable insights into the role of venture capital in supporting entrepreneurial growth and innovation. Limited research has been done on the performance and sustainability of the venture capital funds themselves, especially government-backed venture capital funds. Other researchers have explored the return persistence and capital flows in the private equity industry, noting the challenges the various funds face in maintaining consistent performance over time, while (Gompers & Lerner, 1999) has investigated the factors that contribute to the success and sustainability of venture capital firms which are mostly privately managed venture capital funds( Kaplan & Schoar, 2005a Gompers et al., 2016; Kaplan & Schoar, 2005b).
The analysis of the sustainability and growth of government-backed venture capital funds is crucial due to their evolving role in bridging funding gaps for high-growth potential firms and fostering innovation and entrepreneurship. (Owen et al., 2019) highlights the positive impacts of GVCs in the UK, such as increased turnover and employment, but also points out significant issues like the lack of liquidity for follow-on funding and the need for longer time horizons (Owen et al., 2019). Similarly, the importance of GVCs in China’s strategy to support technology ventures and the distinct program designs that leverage private investments underscore the need for a thorough assessment of these schemes ( Hussain et al., 2017; Li, 2015).
Contradictions arise when considering the impact of GVCs on innovation. While public funds are essential for early-stage ventures, (Pierrakis & Saridakis, 2017, 2019) this suggests that companies funded solely by public VCF are less likely to apply for patents compared to those with private VC backing, indicating a potential limitation of GVCs in promoting innovation. This is further complicated by the observation that public funds may avoid high-information asymmetry projects, potentially leading to under-funding of promising young companies (Prohorovs & Stikute, 2017a, 2017b). Therefore, analyzing the sustainability and growth of GVC funds is imperative to ensure they effectively target funding gaps, support innovation, and contribute to economic development. The need for flexibility, the potential for crowding out, and the balance between economic and socio-environmental returns are all factors that must be considered ( Owen et al., 2019; Owen, 2023; Pierrakis & Saridakis, 2017). Moreover, understanding the role of GVCs in the broader innovation ecosystem, as indicated by their influence on networking behaviors (Pierrakis & Saridakis, 2017), and their performance in public markets (Chae et al., 2014), is essential for policymakers and practitioners to design and implement effective GVC schemes.
Currently, no direct research has analyzed the financial statements of the Ghana Venture Capital Trust Fund (VCTF) to ascertain its growth and sustainability. This is a significant gap in the literature, as government-backed venture capital funds play a crucial role in supporting entrepreneurial ecosystems and understanding their financial health and long-term viability is essential for policymakers and stakeholders. Filling this gap can provide valuable insights into the performance and challenges of such government-initiated venture capital initiatives, which can inform policies and practices to enhance the effectiveness and sustainability of these funds. Venture capital funds are inherently subject to a dynamic and often unpredictable environment characterized by various challenges, such as investment risks, market fluctuations, and regulatory changes. By analyzing the financial statements and performance metrics of the VCTF, valuable insights can be obtained regarding the fund’s overall health, growth trajectory, and long-term sustainability. This study aims to conduct a thorough analysis of the government-backed VCTF’s financial performance and sustainability over seven years from 2016 to 2022. Through the examination of key financial ratios, growth indicators, and sustainability measures, this study evaluates the funds’ financial health, investment strategies, and ability to support the entrepreneurial ecosystem in Ghana.
Overview of Ghana’s VCTF
Venture Capital Trust Fund(VCTF) Ghana
The Venture Capital Trust Fund was established under the Venture Capital Trust Fund Act 2004 (Act 680) in 2015. The VCTF is a government-backed venture capital fund that focuses on investing in venture capital funds dedicated to small- and medium-scale enterprises (SMEs). Since its inception, VCTF has played a crucial role in supporting entrepreneurship, SMEs, and innovation in Ghana. As a key player in the country’s venture capital landscape, the VCTF has been instrumental in channeling investment capital to promising startups and medium-sized enterprises (SMEs) across various development-based sectors of Ghana’s economy. However, evaluating the financial performance and sustainability of a VCTF is essential to ensure its continued effectiveness and impact.
VCTF Operations: Mode of Operation
The Ghana Venture Capital Trust Fund (VCTF) operates through a network of Venture Capital Finance Companies (VCFCs). Each VCFC is managed by a Fund Manager, licensed by the Securities and Exchange Commission (SEC). These VCFC fund vehicles act as intermediaries between SMEs requiring funds for viable business projects and the Trust Fund. The investment proposal process works as follows: The Managers of the VCFCs receive and review investment proposals from SMEs. These Managers have the mandate to decide on investments after an approval process by their respective Investment Committees or Boards. This allows the VCTF to leverage the expertise and decision-making capabilities of the specialized
VCFC Fund Managers
The key responsibilities of each VCFC include deal sourcing, selection, monitoring, and exit of investments. The structure enables the VCFCs to play a hands-on role in supporting the SMEs throughout their investment lifecycle, from identifying promising opportunities to facilitating successful exits. It is worth noting that the VCFCs are encouraged to invest across all sectors of the economy, except for businesses that engage in direct imports for resale. Additionally, the VCTF Act defines an SME as a business with total assets (excluding land and buildings) not exceeding the cedi equivalent of USD 1 million and a total employee count not exceeding 100 persons. This targeted focus on SMEs is a key aspect of the VCTF’s mission to support entrepreneurship and innovation in Ghana.
Literature Review
Performance of Venture Capital Trust
Across the world, governments in their quest to boost entrepreneurship, innovation, and to develop the SME ecosystem establish venture capital trust funds to achieve this objective. These funds serve as enablers to provide access to patient capital to early-stage and high-growth companies that may struggle to access traditional financing channels. However, the profitability and sustainability of government-backed venture capital funds have been the subject of ongoing research and debate.
A seminal study conducted by (Lerner, 2000) examined the performance of the U.S. Small Business Innovation Research (SBIR) program. The study found that firms that received SBIR grants demonstrated significantly higher sales and employment growth relative to their peers who did not receive such support. This suggests that government-backed venture capital can have a positive impact on the growth and development of innovative companies. However, the author posits that the financial returns to the government were modest, exposing the challenges government-backed venture capitalists have in generating consistent profitability to sustain the program.
Further to this discussion,(Avnimelech & Teubal, 2006) investigated the performance of the government-backed venture capital program in Israel called the Yozma program. Their findings indicated that the Yozma program was successful in stimulating the growth of Israel’s venture capital industry and fostering the development of high-tech companies. In their research, they attributed the success of the fund to its ability to attract private-sector participation and consistent government funding sources.
In the context of emerging economies, (Wonglimpiyarat, 2011a, 2011b) examined venture capitalists in emerging economies with a special focus on the effectiveness of Thialand’s SME-focused venture capital trust fund. The study found that limited deal flow, lack of specialized expertise, and challenges in exit strategies as the major challenges impacting the growth of the Trust fund. The author posits that government-backed venture capital initiatives must align with the needs and characteristics of the local entrepreneurial ecosystem.
Analyzing the venture capital market in Australia and also conducting a literature review of venture capital models, (Cumming & Johan, 2016, 2017) posit that the financial returns to the government-backed venture capital trust are modest relative to privately owned venture capital trust. They advanced an argument for government-backed venture capital trust to strike a balance between achieving societal objectives and generating acceptable financial returns.
For Ghana’s venture capital Trust Fund to be effective in achieving its objective and ensuring long-term financial viability and profitability, factors such as operational efficiency, investment portfolio management and strategically aligning the fund to attract private participation are critical imperatives that must be pursued.
Business Growth
Rosenbusch et al. (2013) emphasized the importance of managing growth and maintaining appropriate sustainability levels to ensure the long-term success of venture-backed firms.. Strategies for Growth and Sustainability: The academic literature offers various insights into strategies that venture capital funds can employ to enhance their growth and long-term sustainability. (Gompers & Lerner, 1999) emphasized the importance of effective fund structure and corporate governance, such as the fee structure and limited partner composition, in shaping a fund’s performance and ability to raise follow-on capital.
Additionally, studies have explored the benefits of specialization and network connectivity for venture capital firms. Gompers et al. (2016) found that funds with more industry-focused portfolios and stronger syndication relationships tend to achieve higher returns and sustainability. (Hochberg, 2012; Hochberg et al., 2007) further demonstrated the positive impact of a fund’s network position on its fundraising and investment success.
Business Sustainability
Gompers et al. (2016) further explored the factors that contribute to the success and sustainability of venture capital firms, such as the experience of the investment team and the fund’s industry focus. (Higgins, 1977) introduced the concept of the sustainable growth rate (SGR) as a key metric for understanding a firm’s ability to finance growth without external equity. Moreover, the literature has extensively examined the application of the Altman Z-score model for predicting financial distress and assessing the overall financial health of organizations. (Eidleman, 1995) highlighted the model’s utility in identifying companies at risk of default, while (Dimitrić et al., 2019) finding that combining the Z-score with other financial analysis techniques can provide a more comprehensive assessment of a firm’s sustainability.
Review of Altman’s Z-score Model
The widely popular Z-score function used for analyzing and predicting bankruptcies was first published in 1968 by Edward I. Altman (Altman, 1968). In Altman’s study, the initial sample involved sixty-six corporations with thirty-three companies in each group in the period of 1946 to 1965. The Z-score uses multiple inputs from corporate income statements and balance sheets to measure the financial status of a company. The inputs that Altman selected were from those financial reports that are one reporting period earlier than bankruptcies. The inputs that Altman used were twenty-two different financial ratios. Altman considered that these financial ratios were chosen to eliminate size effects. Those ratios were divided into five categories: liquidity, profitability, leverage, solvency, and activity. The reason for dividing the input variables into 5 categories is ad hoc. They are standard financial categories. Celli (2015) posits that the Z-score degree of reliability is relatively high and works quite adequately in predicting listed industrial company failure in Italy. In another study in the public sector iron and steel industry in India, it was found the Z-Score properly predicts the financial distress of companies(Bhunia, 2007).
Z-Score Analysis
Altman used five ratios to calculate the Z-Score (Altman, 2013; Altman et al., 2017; Panigrahi, 2019). These different ratios were combined into a single measure Z-Score Analysis. The formula used to evaluate the Z-Score analysis as established by Altman is as follows:
Z = 0.012X1 + 0.014X2 + 0.033X3 + 0.006X4 + 0.999X5
“Z” is the overall index and the variables X1 to X4 are computed as absolute percentage values while X5 is computed in number of times.
Ratios Used in Z-Score Analysis
The following accounting ratios are used as variables to combine them into a single measure (index), which is efficient in predicting bankruptcy (Altman, 2013; Altman et al., 2017; Panigrahi, 2019).
X1 -The ratio of working capital to total assets (WC/TA*100). It is the measure of the net liquid assets of concern to the total capitalization.
X2 -The ratio of net operating profit to net sales (NOP/S*100). It indicates the efficiency of the management in manufacturing, sales, administration, and other activities.
X3 -The ratio of earnings before interest and taxes to total assets (EBIT/ TA*100). It is a measure of the productivity of assets employed in an enterprise. The ultimate existence of an enterprise is based on the earning power (profitability).
X4 -The ratio of the market value of equity to the book value of debt (MVE/ BVD *100). It is the reciprocal of the familiar debt-equity ratio. Equity is measured by the combined market value of all shares, while debt includes both current and long-term liabilities. This measures the extent to which assets of an enterprise can decline in value before the liabilities exceed the assets and the concern becomes insolvent.
X5 -The ratio of sales to total assets (S/TA). The capital turnover ratio is a standard financial measure for illustrating the sales-generating capacity of the assets.
If a company has a z-score greater than 1.8, then the average Z-Score of that company represents a healthy financial position (Panigrahi, 2019). Research conducted in the pharmaceutical industry using Altman’s ‘Z’ Score Model to test the financial distress of a few selected pharmaceutical companies, which covered a period of 5 years viz., 2012-2013 to 2016-2017 realized a score of 5.90 during the period of study. This score indicates that the pharmaceutical industry has a healthy financial position because the Z-Score is much above the cut-off score i.e., 1.8. (Panigrahi, 2019)
Data Source
The data for the analysis was sourced from the published audited account of the venture capital trust Fund from 2016 to 2022 and was published on the website of the fund: Reports - (vctf.com.gh). In addition the detailed report on the impact the VCTF has made was sorced from the management of the Fund.
Methodology
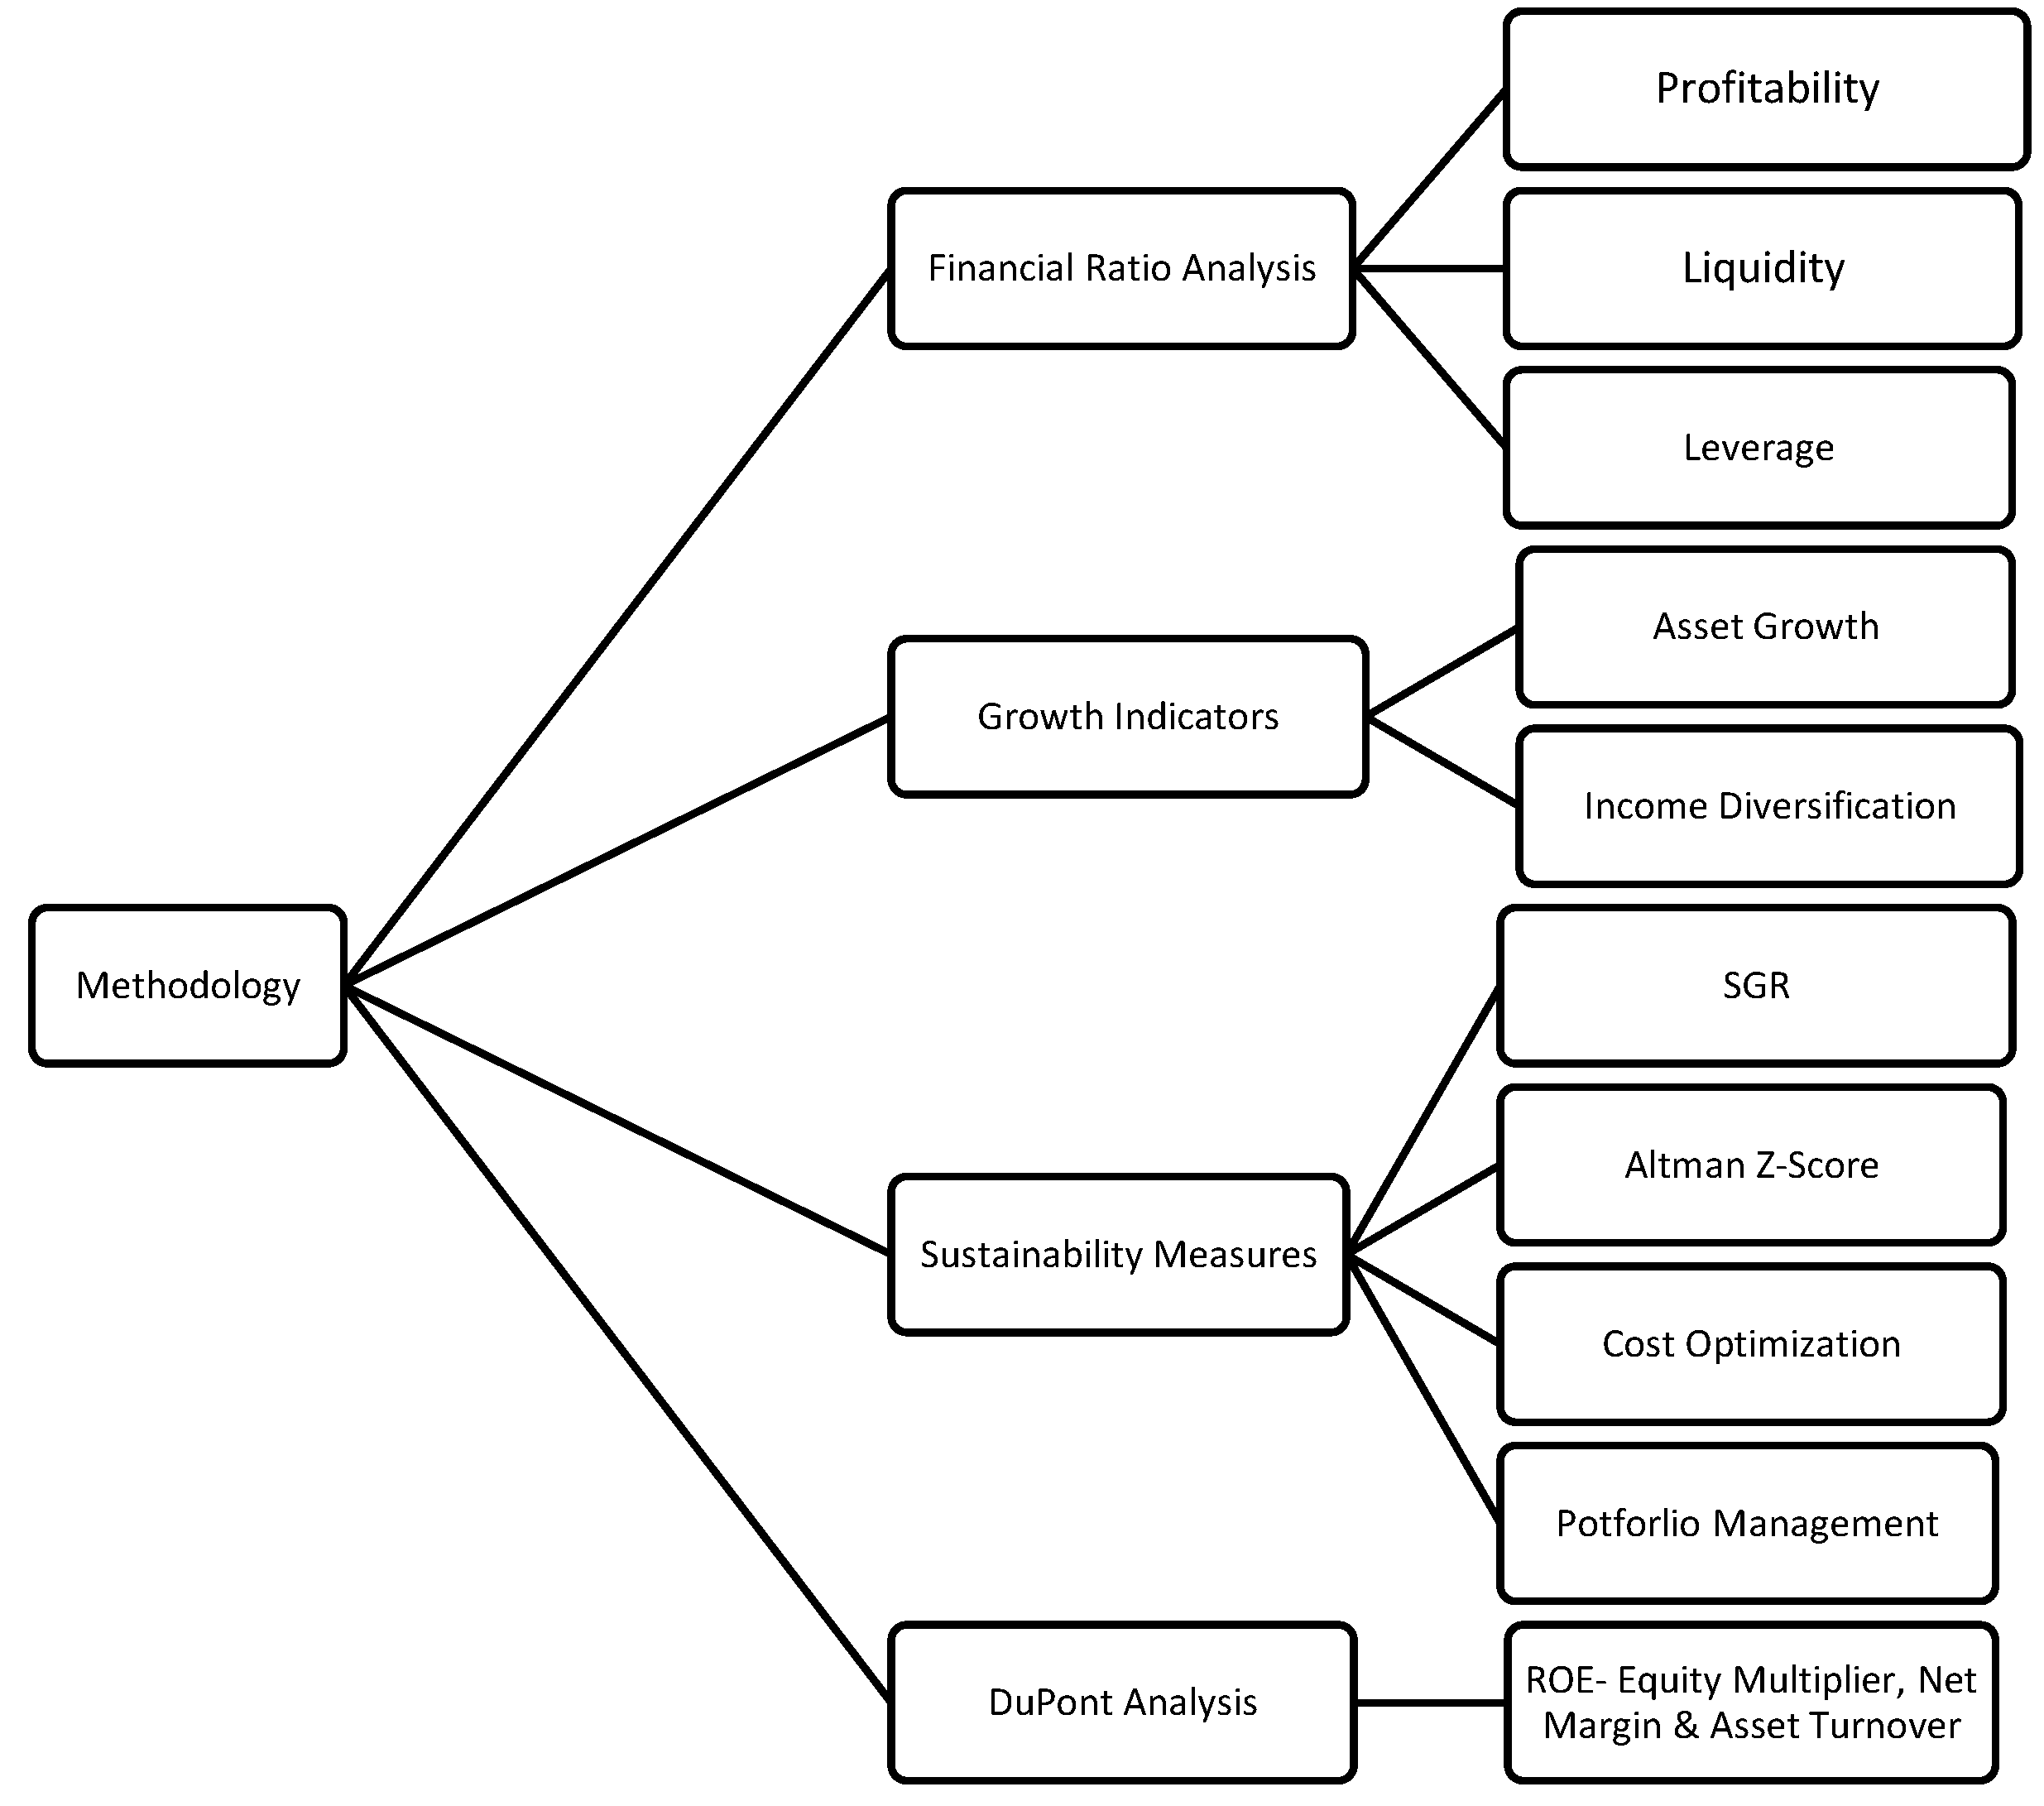
The analysis of the fund’s competitiveness, growth, and sustainability was done using several well-established financial analysis techniques and frameworks to provide insight into the sustainability and performance of VCTF. The key elements of the methodology include the DuPont model, including critical ratios that explain the Financial Health of the fund. In analyzing the financial health, we evaluated the VCTF’s liquidity, profitability, and leverage using ratios such as gross margin, net margin, return on investment (ROI), return on equity (ROE), and debt-to-equity. We also looked at the Growth Dynamics of the fund by looking at the fund’s asset growth, and income diversification, and to understand its expansion trajectory and revenue sources. Lastly, the Sustainability of the company was assessed using the VCTF’s long-term viability indicators through the computation of the sustainable growth ratio (SGR), Z-Score, and factors such as investment portfolio management, cost optimization, and resource mobilization strategies.
Figure 1.
Authors Design: Research Methodology,2024.
Financial Ratio Analysis
Profitability Ratios: Gross margin, net margin, return on investment (ROI), and return on equity (ROE) are calculated to assess the fund’s ability to generate profits from its investments and operations (Higgins, 1977).
Liquidity Ratios: Working capital and current ratio are used to evaluate the VCTF’s ability to meet its short-term financial obligations (Zacharakis & Meyer, 2000).
Leverage Ratios: Debt-to-equity and debt-to-income ratios are analyzed to measure the fund’s reliance on debt financing and its financial risk profile (Dimitrić et al., 2019).
Growth Indicators:
Asset Growth: The year-over-year change in total assets is examined to understand the fund’s expansion and resource mobilization capabilities.
Income Diversification: The composition and trends in the VCTF’s revenue sources, including investment income, grants, and other operating income, are analyzed to assess the diversification of its income streams.
Sustainability Measures:
Sustainable Growth Rate (SGR): The upper bound of the SGR is calculated based on the fund’s return on equity (ROE) to gauge its ability to finance growth without the need for additional external equity capital (Higgins, 1977).
Altman Z-Score: The Altman Z-score model is applied to the VCTF’s financial data to indicate the fund’s overall financial health and likelihood of financial distress or insolvency (Altman, 1968; Eidleman, 1995; Dimitrić et al., 2019).
Portfolio Management and Cost Optimization: Qualitative insights are gathered on the VCTF’s investment portfolio management practices, risk mitigation strategies, and cost optimization initiatives to understand their impact on the fund’s sustainability.
DuPont Analysis:
The DuPont framework is utilized to decompose the VCTF’s return on equity (ROE) into its key drivers: net profit margin, asset turnover, and equity multiplier. This analysis offers a deeper understanding of the fund’s profitability, efficiency, and financial leverage (Higgins, 1977; Gompers et al., 2016).
Data Analysis
The DuPont Analysis of financial performance was used to analyze the financial health of VCTF in Ghana. This method has been adopted by several other researchers to analyze the financial health of a form (Bhagyalakshmi & Saraswathi, 2019; Doorasamy, 2016; Kim, 2016; Shahnia & Endri, 2020; Sheela & Karthikeyan, 2012)
Table 1 above shows the results of the DuPont analysis and provides a detailed examination of the Ghana Venture Capital Trust Fund’s (VCTF) financial performance and profitability over the period from 2016 to 2022. The DuPont framework decomposes VCTF’s performance and profitability into return on equity (ROE), net profit margin, asset turnover, and equity multiplier. The DuPont analysis showed a mixed picture of the Ghana Venture Capital Trust Fund’s (VCTF) financial performance over the years examined. From 2016 to 2020, the fund struggled with significant challenges, as evidenced by its negative net profit margins and low asset turnover ratios. This combination of operational inefficiencies and poor investment returns translated into a dismal return on equity (ROE), which reached a low of -12.42% in 2017. However, the situation improved dramatically in recent years. In 2021 and 2022, the VCTF was able to achieve positive net profit margins of 0.249% and 0.326%, respectively even though lower than the industry average. This turnaround in profitability, coupled with modest increases in asset turnover, drove a substantial improvement in the fund’s ROE, which climbed to 4.16% in 2021 and an impressive 14.00% in 2022.
Net Profit Margin: The net profit margin of the fund showed significant fluctuations during the period under review. From 2016 to 2020, the fund experienced negative net profit margins, ranging from -2.637% in 2016 to -3.873% in 2020. This indicates that the fund was generating operating losses, which is a concerning trend for its long-term sustainability. However, the situation improved dramatically in 2021 and 2022, with the net profit margin turning positive at 0.249% and 0.326%, respectively. This was a s a result of grants that the fund received from the Ministry of Finance and the World Bank. The improved profitability in the later years suggests that the fund has been able to enhance its operational efficiency and investment performance. However, the limited sources of funding to the Trust Fund pose some concentration risks and issues of long-term unsustainability.
Asset Turnover: The asset turnover ratio, which measures the fund’s ability to generate revenue from its assets, was generally low throughout the period. The ratio ranged from a high of 0.118 in 2021 to a low of 0.016 in 2020. This indicates that the VCTF has not been effectively utilizing its assets to generate revenue to make it self-sustainable. This low asset turnover suggests that the fund may need to optimize its investment portfolio and explore new revenue streams to improve its overall productivity and efficiency.
Equity Multiplier: The equity multiplier, which represents the fund’s financial leverage, remained relatively stable, with values close to 1.0 across all years. This indicates that the VCTF maintained a low level of debt financing, relying primarily on grants and government funding as their sources of capital to fund its operations. The fund’s conservative approach to leverage is a positive factor, as it reduces its financial risk and enhances its ability to withstand economic downturns. It is however important to point out that, the fund’s long-term sustainability may be vulnerable to changes in government policies, budget allocations, or the priorities of development partners and donors.
Return on Equity (ROE):The VCTF’s return on equity was negative from 2016 to 2020, with the lowest ROE of -12.42% recorded in 2017. This reflects the operating losses incurred by the fund during this period. However, in 2021 and 2022, the ROE turned positive, reaching 4.16% and 14.00%, respectively. The dramatic improvement in ROE in the later years is a testament to the fund’s enhanced profitability and efficient utilization of its equity capital when the right sources of funding are sourced for the operations of the Fund.
Cost Optimization
To enhance the long-term financial sustainability of the VCTF, it is crucial to optimize the fund’s operational costs. A key area for improvement is by streamlining of administrative expenses, which have consistently accounted for a significant portion of the VCTF’s total expenditure, ranging from 71% to 79% over the years analyzed. This can be achieved through the implementation of automation and digitization, the outsourcing of non-core functions to specialized service providers, and the optimization of the fund’s lease arrangements.
Additionally, the VCTF should focus on enhancing the efficiency of its investment management activities. Strategies such as selective co-investment partnerships, the adoption of performance-based fee structures, and the streamlining of due diligence and portfolio monitoring processes can help the VCTF reduce costs without compromising the quality of its investment decisions. Furthermore, the VCTF should leverage economies of scale by negotiating favorable terms with service providers, establishing centralized shared service functions, and expanding its investment portfolio, which reached a high of GH¢200,874,584 in 2022, to spread fixed costs over a larger asset base. By implementing these cost optimization strategies, the VCTF can improve its financial sustainability and allocate more resources towards its core mandate of supporting entrepreneurship and innovation in Ghana.
Sustainability
The fund’s sustainability appears to have improved significantly in recent years, particularly in 2022. The strong financial performance, with a net operating income of GH¢4,360,164 and a positive return on equity of 14.00%, coupled with the substantial increase in total assets, suggests that the fund has enhanced its ability to sustain its operations and continue supporting its investment activities.
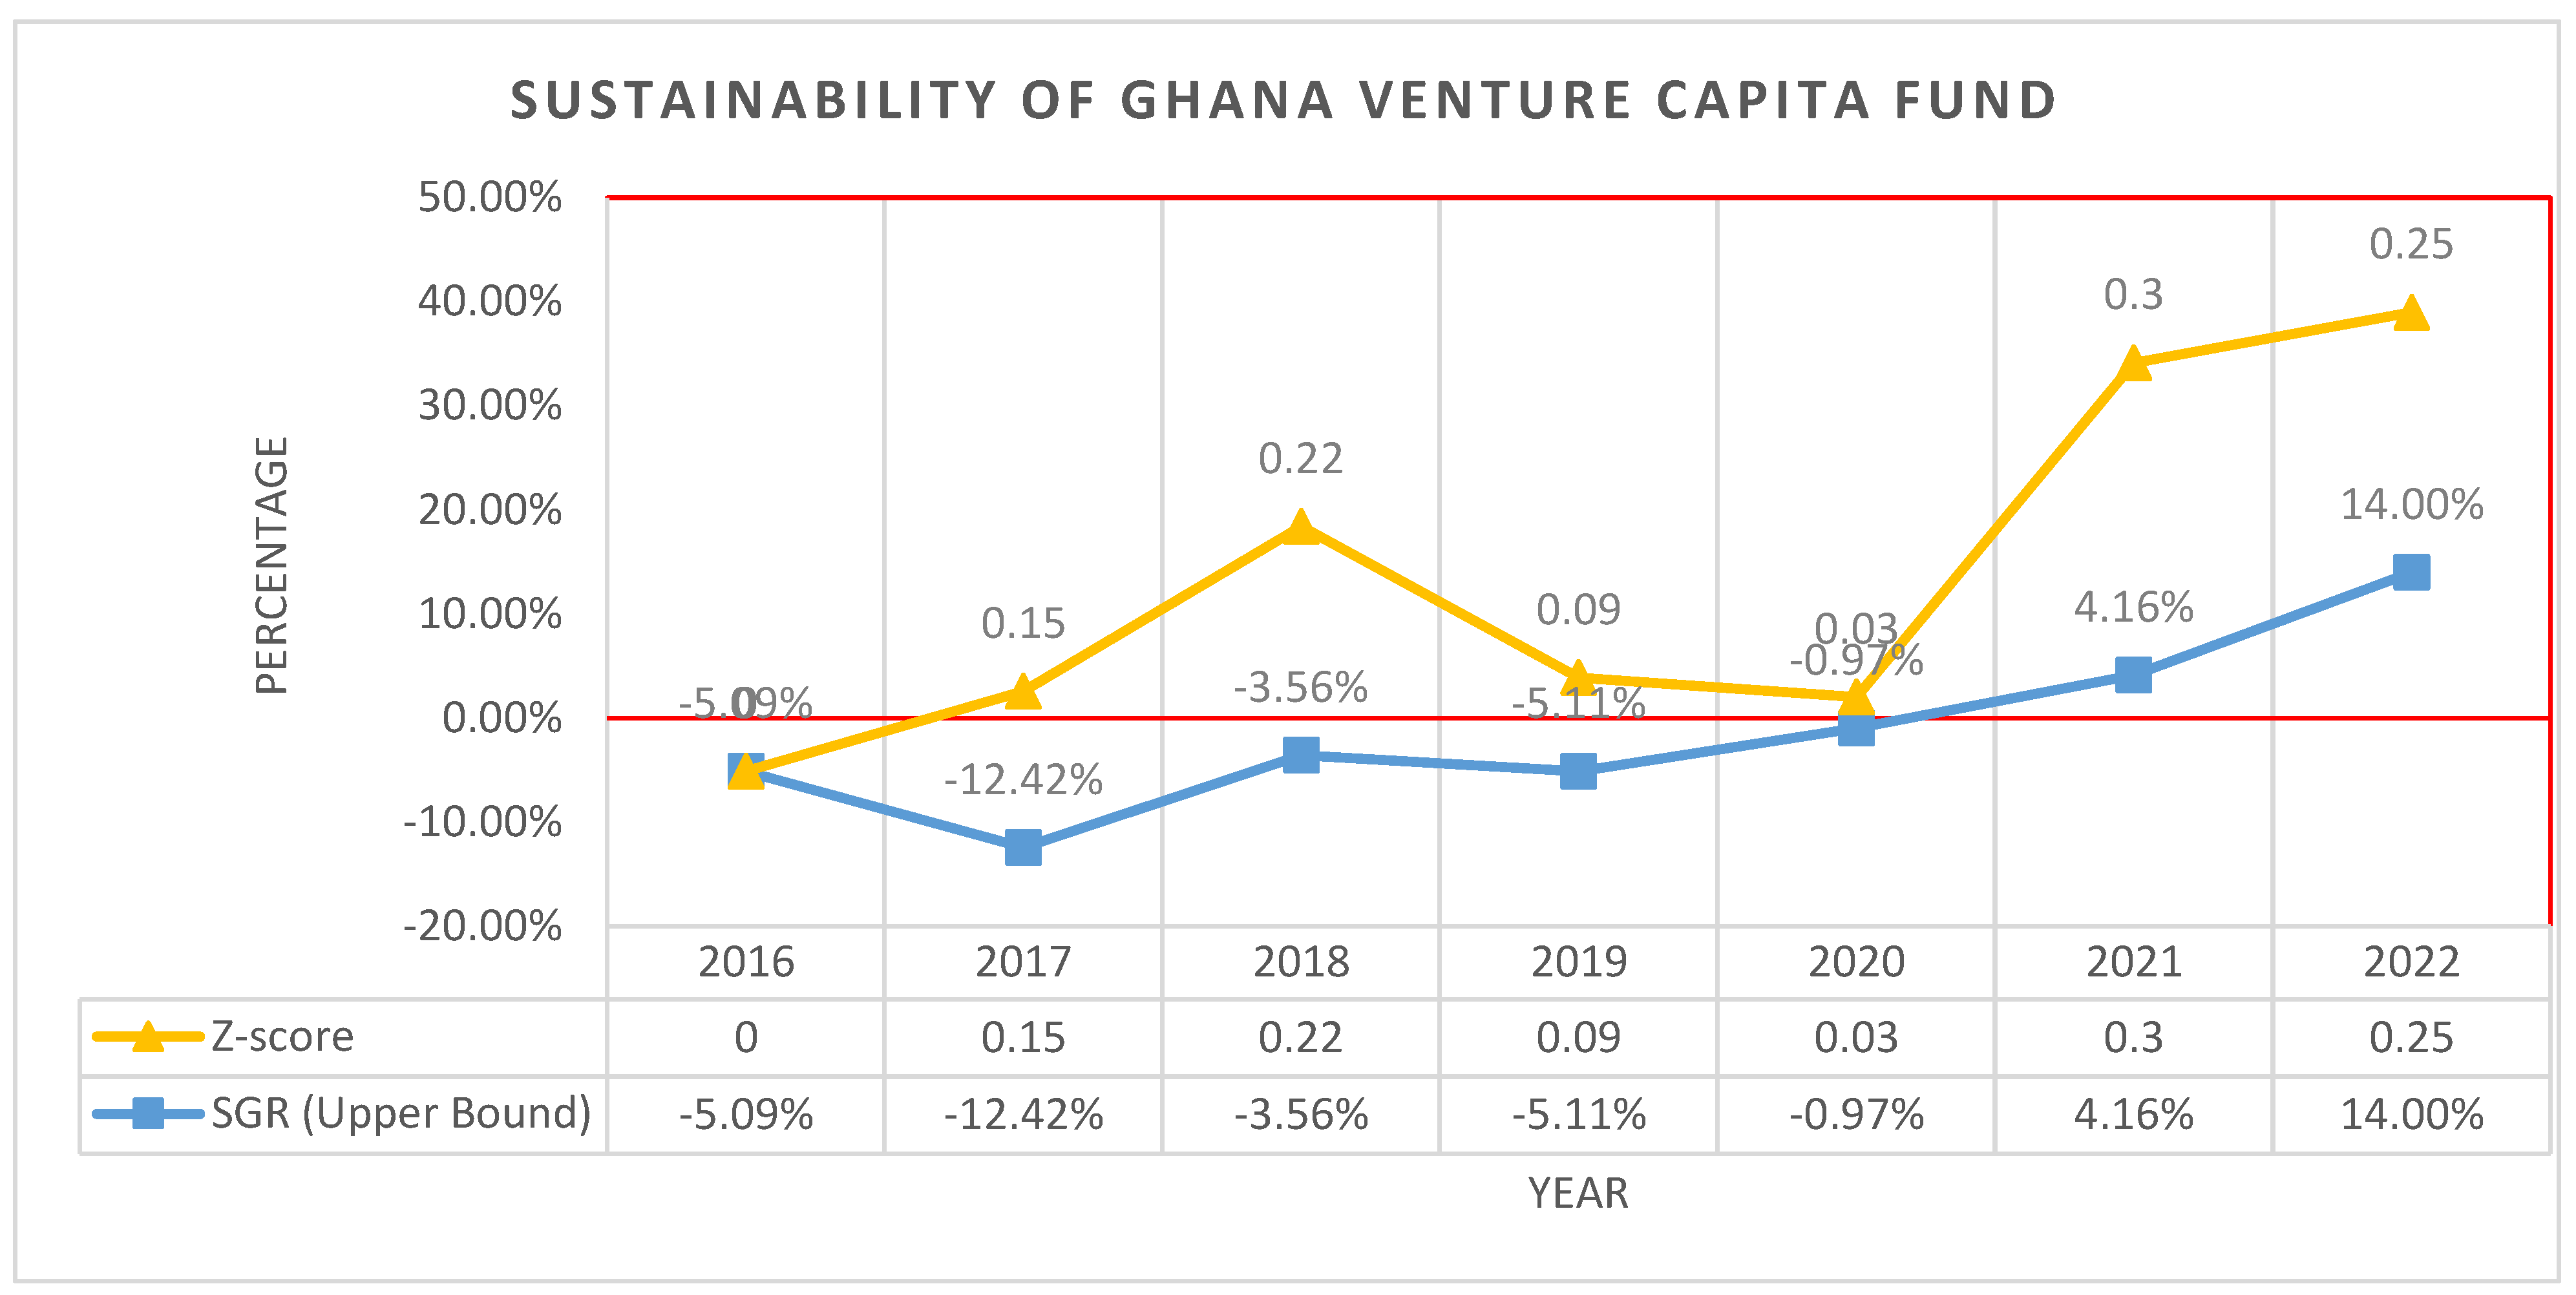
The sustainable growth rate (SGR), an approximation based on the assumption of no dividend payouts, fluctuated significantly. It reached a high of 14.00% in 2022, driven by the strong return on equity (ROE) achieved in that year. However, the SGR was negative in several earlier years, reflecting the fund’s operating losses and negative ROE during those periods.
Figure 2.
Sustainability indicators.
However, it is important to note that VCTF’s sustainability is heavily dependent on the performance of its investment portfolio, which constitutes a significant portion of its total assets. The impairment charges on investments in 2016 and 2017, amounting to GH¢1,626,911 and GH¢4,620,740, respectively, highlight the risks associated with the fund’s investment activities and the potential impact on its sustainability. The fund’s low debt levels and strong working capital position provide a solid foundation for long-term sustainability, as the fund is not burdened by significant debt obligations and has ample resources to meet its short-term liabilities. Moving forward, the fund’s ability to maintain strong investment returns, effectively manage its investment portfolio risks, and continue diversifying its income sources will be crucial for ensuring its long-term sustainability and growth.
The VCTF experienced financial challenges and operating losses in the earlier years of operations, but its financial health, growth, and sustainability have improved significantly in recent years, particularly in 2022. The fund’s strong liquidity position, low debt levels, improved profitability, and substantial asset growth have enhanced its ability to sustain its operations and support its investment activities. However, ongoing vigilance in investment risk management and diversification of income sources will be essential to maintain this positive trajectory and ensure the fund’s long-term sustainability.
Strategies for Growth and Sustainability
To improve the financial performance and sustainability of the Ghana Venture Capital Trust Fund (VCTF), the fund must adopt rigorous management and strategic decisions. One such strategy is to enhance the management of the investment portfolio by conducting thorough due diligence and risk assessments on potential investments. Additionally, diversifying the investment portfolio across different sectors, industries, and asset classes can help mitigate risks. Implementing robust monitoring and exit strategies for existing investments can also help the VCTF maximize returns. Another strategy is to strengthen income diversification by exploring additional sources of revenue such as advisory services or fund management fees. The VCTF should also actively seek grants or funding from various sources to support specific initiatives or operations. Finally, optimizing operational efficiency by continuously reviewing and streamlining administrative and operational expenses can help reduce costs without compromising service quality. Implementing technology solutions and leveraging economies of scale through strategic collaborations or partnerships with other venture capital firms or industry players can also contribute to cost savings.
In conclusion, this study provides a comprehensive assessment of the Ghana Venture Capital Trust Fund’s performance, growth, and sustainability using a multifaceted methodology. The findings reveal a mixed performance, with the fund struggling with negative net profit margins and low asset turnover in the earlier years, leading to poor ROE. However, the situation has improved significantly in recent years due to some injections of grants from the government, with the fund achieving positive profitability and impressive ROE. To ensure the long-term sustainability and growth of the fund, managers of the fund must diversify its revenue source; develop strategies that can attract private equities and technical assistance, and also improve the overall overhead cost of the business.
Author Contributions
Conceptualization: H.D: literature review: H.D. and K.B.; methodology: K.B. and H.D; formal analysis: H.D.; resources: K.B. and H.D.; writing – original draft preparation: K.B. and H.D.; writing – review and editing: K.B.
Funding
No funding was received for this study.
Institutional Review Board Statement
he consent of all individuals included in the study was sought before their inclusion in the study.
Informed Consent Statement
The authors consent to the publication was sought.
Data Availability Statement
Data for the study will be available on request.
Acknowledgments
The authors would like to thank Mr. Emmanuel Kusi and Mr. Boahen Collins for thier insightful comments in reviewing the manuscript.
Conflicts of Interest
The authors declare no conflict of interest.
Appendix A

Table A1.
Ratios of VCFT.
| Ratio | Formula | 2016 | 2017 | 2018 | 2019 | 2020 | 2021 | 2022 |
|---|---|---|---|---|---|---|---|---|
| Gross Margin | (Total Income - Expenditure) / Total Income | -3.64 | -3.37 | -1.96 | -3.11 | -4.87 | 0.25 | 0.67 |
| Net Margin | Net Operating Income / Total Income | -2.64 | -2.37 | -0.96 | -2.11 | -3.88 | 0.25 | 0.33 |
| ROI | (Net Income / Total Assets) x 100% | -5.01% | -12.32% | -3.54% | -5.08% | -0.96% | 4.14% | 13.94% |
| ROE | (Net Income / Shareholders’ Equity) x 100% | -5.09% | -12.42% | -3.56% | -5.11% | -0.97% | 4.16% | 14.00% |
| Debt-to-Equity Ratio | Total Liabilities / Shareholders’ Equity | 0.02 | 0.01 | 0.00 | 0.01 | 0.01 | 0.01 | 0.00 |
| Debt-to-Income Ratio | Total Liabilities / Total Income | 0.47 | 0.36 | 0.12 | 0.22 | 0.60 | 0.05 | 0.08 |
| EBITDA | Net Income + Interest + Taxes + Depreciation + Amortization | -3,430,779 | -2,773,581 | -1,624,502 | -2,524,708 | -3,074,389 | 2,119,863 | 4,818,546 |
| Z-score | (1.2Working Capital/Total Assets) + (1.4Retained Earnings/Total Assets) + (3.3EBIT/Total Assets) + (0.6Market Value of Equity/Total Liabilities) + (Sales/Total Assets) | 0.00 | 0.15 | 0.22 | 0.09 | 0.03 | 0.30 | 0.25 |
| Working Capital | Current Assets - Current Liabilities | 9,406,585 | 16,329,127 | 15,527,982 | 12,181,983 | 10,761,575 | 3,906,826 | 25,406,228 |
| SGR (Upper Bound) | ROE * Retention Rate (Assumed 1) | -5.09% | -12.42% | -3.56% | -5.11% | -0.97% | 4.16% | 14.00% |
Notes: To compute the Z-score, the Total revenue was used as Sales. The Z-score calculation requires additional information not provided in the financial statements, such as the market value of equity and sales data, so it could not be calculated. Working capital is calculated as current assets minus current liabilities.
Table A2.
Financial Spreadsheet of VCTF from 2016 -2022.
| 2016 | 2017 | 2018 | 2019 | 2020 | 2021 | 2022 | |
|---|---|---|---|---|---|---|---|
| Non-Current Assets | |||||||
| Property and Equipment | 4,054,907.00 | 13,302,784.00 | 13,303,566.00 | 12,778,997.00 | 12,269,282.00 | 11,956,016.00 | 11,941,174.00 |
| Financial Assets at fair value through Profit or Loss | 30,557,898.00 | 34,064,267.00 | 32,677,089.00 | 33,557,410.00 | 34,928,363.00 | 44,611,711.00 | 200,874,584.00 |
| 34,612,805.00 | 47,367,051.00 | 45,980,655.00 | 46,336,407.00 | 47,197,645.00 | 56,567,727.00 | 212,815,758.00 | |
| Current Assets | |||||||
| Investment Loans | 366,593.00 | - | 300,000.00 | 300,000.00 | |||
| Receivables | 5,534,857.00 | 988,722.00 | 1,170,134.00 | 918,368.00 | 1,076,971.00 | 1,035,293.00 | 1,565,357.00 |
| Cash and Cash Equivalents | 4,179,302.00 | 15,855,700.00 | 14,632,328.00 | 11,588,957.00 | 9,941,523.00 | 2,920,748.00 | 24,868,366.00 |
| 10,080,752.00 | 16,844,422.00 | 15,802,462.00 | 12,507,325.00 | 11,318,494.00 | 4,256,041.00 | 26,433,723.00 | |
| Total Assets | 44,693,557.00 | 64,211,473.00 | 61,783,117.00 | 58,843,732.00 | 58,516,139.00 | 60,823,768.00 | 239,249,481.00 |
| Liability | |||||||
| Current Liabilities | 674,167.00 | 515,295.00 | 275,480.00 | 325,342.00 | 556,919.00 | 349,215.00 | 1,027,495.00 |
| 674,167.00 | 515,295.00 | 275,480.00 | 325,342.00 | 556,919.00 | 349,215.00 | 1,027,495.00 | |
| Net Assets Attributable to Fund Investors | 44,019,390.00 | 63,696,178.00 | 61,507,637.00 | 58,518,390.00 | 57,959,220.00 | 60,474,553.00 | 238,221,986.00 |
| Total Liabilities and Net Assets attributle to fund investors | 44,693,557.00 | 64,211,473.00 | 61,783,117.00 | 58,843,732.00 | 58,516,139.00 | 60,823,768.00 | 239,249,481.00 |
Table A3.
Spreedsheet: Comprehensive Income Statement from 2016 - 2022.
| COMPREHENSIVE INCOME STATEMENT | |||||||
|---|---|---|---|---|---|---|---|
| Comprehensive Income | 2016 | 2017 | 2018 | 2019 | 2020 | 2021 | 2022 |
| Income | 1,440,414.00 | 1,437,479.00 | 2,297,003.00 | 1,468,552.00 | 934,921.00 | 306,255.00 | 5,984,429.00 |
| Grant from Ministry of Finance | 5,000,000.00 | 4,500,000.00 | |||||
| Grant for Technical Assistance | 1,860,261.00 | 1,717,636.00 | |||||
| Grant for Operations | 1,158,259.00 | ||||||
| Total Income | 1,440,414.00 | 1,437,479.00 | 2,297,003.00 | 1,468,552.00 | 934,921.00 | 7,166,516.00 | 13,360,324.00 |
| Less Expenditure | |||||||
| Industry Development (Tech Assist) | 805187 | 1158259 | |||||
| Trustee Emoluments | 166921 | 176810 | 146600 | 99510 | 59328 | 30000 | 272375 |
| Administrative Expenses | 4679272 | 4009250 | 3744905 | 3863750 | 3919982 | 4176466 | 7073144 |
| Auditors Remunerations | 25000 | 25000 | 30000 | 30000 | 30000 | 35000 | 38000 |
| Depreciation Charges | 280192 | 627891 | 569150 | 565878 | 534665 | 325764 | 447570 |
| Financial Cost | 87778 | 7621 | 12098 | 8484 | 11713 | 9035 | 10812 |
| 5,239,163.00 | 4,846,572.00 | 4,502,753.00 | 4,567,622.00 | 4,555,688.00 | 5,381,452.00 | 9,000,160.00 | |
| Net Operating Income | -3,798,749.00 | -3,409,093.00 | -2,205,750.00 | -3,099,070.00 | -3,620,767.00 | 1,785,064.00 | 4,360,164.00 |
| Other Income | 3,188,405.00 | 119,620.00 | 17,209.00 | 109,823.00 | 3,061,597.00 | 730,319.00 | 29,834,759.00 |
| impairment on Investments | -1,626,911.00 | -4,620,740.00 | -847,490.00 | ||||
| Decrease in Net Assets Attributable to Funds | -2,237,255.00 | -7,910,213.00 | -2,188,541.00 | -2,989,247.00 | -559,170.00 | 2,515,383.00 | 33,347,433.00 |
| Other Comprehensive Income | |||||||
| Net changes in fair value of financial assets T Fair value | |||||||
| Through profit or Loss | |||||||
| Revaluation Gain from Land Ridg | |||||||
| Total Comprehensive income for the year | -2,237,255.00 | -7,910,213.00 | -2,188,541.00 | -2,989,247.00 | -559,170.00 | 2,515,383.00 | 33,347,433.00 |
Table A4.
Spreadsheet: Statement of Cashflow from 2016 - 2022.
| 2016 | 2017 | 2018 | 2019 | 2020 | 2021 | 2022 | |
|---|---|---|---|---|---|---|---|
| operating Activities | |||||||
| Net Assets attributed to Fund Investors from operations | -2,237,255.00 | -323,213.00 | -2,188,541.00 | -2,989,247.00 | -559,170.00 | 2,515,333.00 | 33,347,433.00 |
| Other net changes in fair value of financial assets at fair value through profit or loss | |||||||
| Impairment charges | 1,626,911.00 | 2,220,938.00 | |||||
| Gain on revaluation of property Ridge | -7,587,000.00 | ||||||
| Depreciation Charges | 280,192.00 | 627,891.00 | 569,150.00 | 565,878.00 | 534,665.00 | 325,764.00 | 447,570.00 |
| Profit and Loss on disposal of Assets | -34,717.00 | -13,259.00 | -17,209.00 | -51,231.00 | -425.00 | -5,611.00 | |
| operating Cashflow before changes in Working Capital | -364,869.00 | -5,074,643.00 | -1,636,600.00 | -2,474,600.00 | -24,930.00 | 2,841,097.00 | 33,789,392.00 |
| Chages in Working Capital | |||||||
| Increase/((Decrease) in Loans | 3,500.00 | 366,593.00 | -181,413.00 | 251,766.00 | -300,000.00 | 300,000.00 | |
| Increase/((Decrease) in Receivables | -1,582,038.00 | 2,325,197.00 | -158,603.00 | 41,678.00 | -530,064.00 | ||
| Increase/((Decrease) in Payables | -111,916.00 | -158,872.00 | -239,816.00 | 49,863.00 | 231,577.00 | -207,704.00 | 678,280.00 |
| Net Changes in Working Capital | -1,690,454.00 | 2,532,918.00 | -421,229.00 | 301,629.00 | -227,026.00 | -166,026.00 | 448,216.00 |
| Net Cash generated from Operating activities | -2,055,323.00 | -2,541,725.00 | -2,057,829.00 | -2,172,971.00 | -251,956.00 | 2,675,071.00 | 34,237,608.00 |
| Investing Activities | |||||||
| Repayment of Financial Assets | - | 2,858,445.00 | 1,387,178.00 | 1,029,773.00 | 2,039,853.00 | 938,013.00 | 908,911.00 |
| Additio to Financial Assets | -194,518.00 | -6,364,813.00 | -1,910,094.00 | -3,410,807.00 | -10,621,360.00 | -157,171,784.00 | |
| Additions to Property and Equipment | -81,537.00 | -2,365,297.00 | -575,575.00 | -51,725.00 | -24,950.00 | -12,499.00 | -442,908.00 |
| Proceeds from Sale of Fixed Assets | 40,300.00 | 89,787.00 | 22,854.00 | 61,646.00 | 425.00 | - | 15,791.00 |
| Net Cashflow from investing activities | -235,755.00 | -5,781,878.00 | 834,457.00 | -870,400.00 | -1,395,479.00 | -9,695,846.00 | -156,689,990.00 |
| Financing Activities | |||||||
| Capital Injection from MOFEP | - | 20,000,000.00 | |||||
| Capital Injection from Ministry of Finance | 144,400,000.00 | ||||||
| Net Cashflow from Financing Activities | - | 20,000,000.00 | - | - | - | - | 144,400,000.00 |
| Net Increase in Cash and Cash equivalent | -2,291,078.00 | 11,676,398.00 | -1,223,372.00 | -3,043,371.00 | -1,647,435.00 | -7,020,775.00 | 21,947,618.00 |
| cash and Cash at 1 January | 6,470,380.00 | 4,179,302.00 | 15855700 | 14,632,328.00 | 11,588,957.00 | 9,941,523.00 | 2,920,748.00 |
| Cash and Cash Equivalence at 31 December | 4,179,302.00 | 15,855,700.00 | 14,632,328.00 | 11,588,957.00 | 9,941,522.00 | 2,920,748.00 | 24,868,366.00 |
References
- Adusei, C. and Isaac, T.-K. (2017) “Venture capital financing: Perspective of entrepreneurs in an emerging economy,” Archives of business research, 5(8). [CrossRef]
- Altman, E. I. (2013) “Predicting financial distress of companies: revisiting the Z-Score and ZETA® models,” in Handbook of Research Methods and Applications in Empirical Finance. Edward Elgar Publishing.
- Altman, E. I. et al. (2017) “Financial distress prediction in an international context: A review and empirical analysis of Altman’s Z-score model,” Journal of International Financial Management & Accounting, 28(2), pp. 131–171.
- Avnimelech, G. and Teubal, M. (2006) “Creating venture capital industries that co-evolve with high tech: Insights from an extended industry life cycle perspective of the Israeli experience,” Research policy, 35(10), pp. 1477–1498. [CrossRef]
- Barnett, C. et al. (2018) “Understanding and optimising the social impact of venture capital: Three lessons from Ghana,” African evaluation journal, 6(2). [CrossRef]
- Bhagyalakshmi, K. and Saraswathi, S. (2019) “A study on financial performance evaluation using DuPont analysis in select automobile companies,” International Journal of Management, 9(1), pp. 354–362.
- Boadu, F. et al. (2014) “Venture capital financing: An opportunity for small and medium scale enterprises in Ghana,” Journal of entrepreneurship and business innovation, 1(1), p. 1. [CrossRef]
- Chae, J. , Kim, J.-H. and Ku, H.-C. (2014) “Risk and reward in venture capital funds,” Seoul Journal of Business, 20(1), pp. 91–137.
- Cumming, D. and Johan, S. (2016) “Venture’s economic impact in Australia,” The Journal of technology transfer, 41(1), pp. 25–59. [CrossRef]
- Cumming, D. and Johan, S. (2017) “Crowdfunding and Entrepreneurial Internationalization,” in The World Scientific Reference on Entrepreneurship. WORLD SCIENTIFIC, pp. 109–126.
- Dimitrić, M. , Tomas Žiković, I. and Arbula Blecich, A. (2019) “Profitability determinants of hotel companies in selected Mediterranean countries,” Economic Research-Ekonomska Istraživanja, 32(1), pp. 1977–1993. [CrossRef]
- Doorasamy, M. and Lecturer, Department of Accounting, School of Accounting, Economics and Finance, University of Kwa-Zulu Natal, Westville campus (2016) “Using DuPont analysis to assess the financial performance of the top 3 JSE listed companies in the food industry,” Investment management and financial innovations, 13(2), pp. 29–44. [CrossRef]
- Eidleman, G. J. (1995) “Z scores-A Guide to failure prediction,” Venture Capital in. Edited by J. G. 52. Gatsi and O. Nsenkyire, 65(2).
- Gompers, P. , Kaplan, S. N. and Mukharlyamov, V. (2016) “What do private equity firms say they do?,” Journal of financial economics, 121(3), pp. 449–476. [CrossRef]
- Higgins, R. C. (1977) “How much growth can a firm afford?,” Financial management, 6(3), p. 7. [CrossRef]
- Hochberg, Y. V. (2012) “Venture capital and corporate governance in the newly public firm,” Review of finance, 16(2), pp. 429–480. [CrossRef]
- Hochberg, Y. V. , Ljungqvist, A. and Lu, Y. (2007) “Whom you know matters: Venture capital networks and investment performance,” The journal of finance, 62(1), pp. 251–301. [CrossRef]
- Kaplan, S. N. and Schoar, A. (2005) “Private equity performance: Returns, persistence, and capital flows,” The journal of finance, 60(4), pp. 1791–1823. [CrossRef]
- Kim, H.-S. (2016) “A study of financial performance using dupont analysis in food distribution market,” Culinary Science & Hospitality Research, 22(6), pp. 52–60.
- Owen, R. , North, D. and Mac an Bhaird, C. (2019) “The role of government venture capital funds: Recent lessons from the UK experience,” SSRN Electronic Journal. [CrossRef]
- Panigrahi, C. (2019) “Validity of Altman’s ‘z’score model in predicting financial distress of pharmaceutical companies,” NMIMS Journal of Economics and Public Policy, 4(1).
- Pierrakis, Y. and Saridakis, G. (2017) “Do publicly backed venture capital investments promote innovation? Differences between privately and publicly backed funds in the UK venture capital market,” Journal of business venturing insights, 7, pp. 55–64. [CrossRef]
- Pierrakis, Y. and Saridakis, G. (2019) “The role of venture capitalists in the regional innovation ecosystem: a comparison of networking patterns between private and publicly backed venture capital funds,” The Journal of technology transfer, 44(3), pp. 850–873. [CrossRef]
- Prohorovs, A. and Jonina, V. (2017a) “Structure of demand and supply of investments of state-subsidized venture capital funds in Latvia,” SSRN Electronic Journal. [CrossRef]
- Prohorovs, A. and Jonina, V. (2017b) “Whether the hybrid and public venture capital funds are the first investors of young innovative companies?,” SSRN Electronic Journal. [CrossRef]
- Samila, S. and Sorenson, O. (2011) “Venture capital, entrepreneurship, and economic growth,” The Review of Economics and Statistics, 93(1), pp. 338–349. [CrossRef]
- Shahnia, C. and Endri, E. (2020) “Dupont Analysis for the financial performance of trading, service & investment companies in Indonesia,” International Journal of Innovative Science and Research Technology, 5(4), pp. 193–211.
- Sheela, S. C. and Karthikeyan, K. (2012) “Financial performance of pharmaceutical industry in India using dupont analysis,” European Journal of Business and Management, 4(14), pp. 84–91.
- Sulemana, S. and Chen, H. (2019) “Exploring the effect of venture capital instruments and control mechanisms on growth of venture capital fund: Empirical evidence from Ghana,” Open journal of business and management, 07(01), pp. 180–193. [CrossRef]
- Wonglimpiyarat, J. (2011a) “Government programmes in financing innovations: Comparative innovation system cases of Malaysia and Thailand,” Technology in society, 33(1–2), pp. 156–164. [CrossRef]
- Wonglimpiyarat, J. (2011b) “The dynamics of financial innovation system,” The Journal of High Technology Management Research, 22(1), pp. 36–46. [CrossRef]
- Zacharakis, A. L. and Meyer, G. D. (2000) “The potential of actuarial decision models,” Journal of business venturing, 15(4), pp. 323–346. [CrossRef]
Table 1.
Venture Capital Dupont Analysis: 2016 – 2022.
| DuPont Analysis | 2016 | 2017 | 2018 | 2019 | 2020 | 2021 | 2022 |
|---|---|---|---|---|---|---|---|
| Net Profit Margin | -2.637 | -2.373 | -0.960 | -2.111 | -3.873 | 0.249 | 0.326 |
| Asset Turnover | 0.032 | 0.022 | 0.037 | 0.025 | 0.016 | 0.118 | 0.056 |
| Equity Multiplier | 1.015 | 1.008 | 1.004 | 1.006 | 1.010 | 1.006 | 1.004 |
| Return on Equity (ROE) | -5.09% | -12.42% | -3.56% | -5.11% | -0.97% | 4.16% | 14.00% |
NB: Return on Eq. (ROE) was negative from 2016-2020 until Grants from the government were given in 2021/2. And Net Profit follows the same trend.
Disclaimer/Publisher’s Note: The statements, opinions and data contained in all publications are solely those of the individual author(s) and contributor(s) and not of MDPI and/or the editor(s). MDPI and/or the editor(s) disclaim responsibility for any injury to people or property resulting from any ideas, methods, instructions or products referred to in the content. |
© 2024 by the authors. Licensee MDPI, Basel, Switzerland. This article is an open access article distributed under the terms and conditions of the Creative Commons Attribution (CC BY) license (http://creativecommons.org/licenses/by/4.0/).
Copyright: This open access article is published under a Creative Commons CC BY 4.0 license, which permit the free download, distribution, and reuse, provided that the author and preprint are cited in any reuse.


