
Submitted:
17 April 2024
Posted:
18 April 2024
You are already at the latest version
Abstract
We have now identified two thermodynamically distinct types (A and B) of energetic processes naturally occurring on Earth. Type A energy processes such as the classical heat engines, apparently well follow the second law of thermodynamics; Type B energy processes, such as the newly discovered thermotrophic function that isothermally utilizes environmental heat energy to do useful work in driving ATP synthesis, which follows the first law of thermodynamics (conservation of mass and energy) but does not have to be constrained by the second law, owing to their special asymmetric functions. Several Type-B energy processes such as asymmetric-function-gated isothermal electricity and epicatalysis have been created through human efforts. The innovative efforts on Type-B processes to enable isothermally utilizing endless environmental heat energy could help to liberate all peoples from their dependence on fossil fuel energy, thus helping to reduce greenhouse gas CO2 emissions and control climate change towards a sustainable future for the humanity on Earth.
Keywords:
Type-B energetic process
; thermotrophic function
; asymmetric-function-gated electricity
; epicatalysis
; superconductors
; isothermal heat utilization
; negative entropy event
The Discovery of Type-B energetic Processes in Biological Systems
Recently, through bioenergetics studies with the transmembrane-electrostatically localized protons (TELP) theory [1,2,3,4,5,6,7], it was surprisingly discovered that environmental heat energy can be isothermally utilized through TELP to help drive ATP synthesis in many biological systems including alkaliphilic bacteria [8], mitochondria [9], and anaerobic acetate-utilizing methanogenic archaea Methanosarcina [10]. This finding indicated that the protonic bioenergetic systems have a thermotrophic feature that can isothermally utilize environmental heat (dissipated-heat energy) through TELP with asymmetric membrane structures to generate significant amounts of Gibbs free energy to drive ATP synthesis [11,12].
This discovery has now led to a fundamentally new major understanding that there are two thermodynamically distinct types (A and B) of energetic processes naturally occurring on Earth [11]. Type A energy processes such as classical heat engines, and many of the known chemical, electrical, and mechanical processes apparently well follow the second law; Type B energy processes as exemplified by the thermotrophic function that isothermally utilizes environmental heat energy associated with TELP does not necessarily have to be constrained by the second law, owing to its special asymmetric function [8,9,11]. The scientific evidences that support this discovery are reviewed and presented as follows.
The Evidence in Alkaliphilic Bacteria for a Protonic Thermotrophic Function: Type-B Energetic Process
The evidence for the protonic thermotrophic function in alkaliphilic bacteria has shown the Gibbs free energy (Figure 1) as calculated from the experimental data of the alkalophilic bacterium Bacillus pseudofirmus [19,20,21] employing our experimentally measured cation-proton exchange equilibrium constants [3] for sodium, potassium and magnesium through the following set of protonic motive force (pmf) Gibbs free energy () equations updated from the newly developed transmembrane-electrostatically localized protons (TELP) theory [8,12].
Here is the transmembrane potential from the p-side to the n-side as defined by Mitchell [13,14], Nicholls and Ferguson [15,16]; is the gas constant; is the environmental temperature in Kelvin; is the Faraday constant; is the TELP concentration at the liquid-membrane interface on the positive (p) side of the membrane; is the “proton concentration in the bulk aqueous p-phase” (intermembrane space and cristae space in the case of mitochondria); and is the “proton concentration in the bulk liquid n-phase” (matrix in mitochondria) [5].
As reported previously [9], the first two terms of Eq. 1 comprise the Mitchellian bulk phase-to-bulk phase proton electrochemical potential gradients that we now call the “classic” pmf Gibbs free energy (); whereas the last term accounts for the “local” pmf from TELP as expressed more clearly in the following local pmf Gibbs free energy () equation:
According to Eq. 2, the local pmf Gibbs free energy () is mathematically related to the ratio () of TELP concentration at the liquid-membrane interface to the bulk-phase proton concentration at the same p-side of the membrane.
Based on the protonic capacitor concept [7], the ideal TELP concentration on the positive (p) side of the membrane is a function of the transmembrane potential as shown in the following equation:
where is “the specific membrane capacitance per unit surface area”, is “the thickness of the localized proton layer” [17], and is the Faraday constant.
The steady-state TELP concentration considering the cation-proton exchange with each of the cation species of the bulk liquid p-phase at the equilibrium state is:
Here is the equilibrium constant for the cation to exchange with TELP. and are, respectively, the non-proton cation concentration and the delocalized proton concentration in the bulk liquid p-phase.
Surprisingly, as shown in Figure 1, very large pmf Gibbs free energy values were found, which not only can well explain how these organisms are able synthesize ATP [18,19,20] but also significantly exceed the maximum chemical energy (redox potential energy limit: 22 kJ/mol) that could be supported thermodynamically by the Type-A energetic process through the respiratory redox-driven proton pump system. This finding subsequently led to the discovery that the alkalophilic bacteria are not only chemotrophs, but also have a thermotrophic feature that can create significant amounts of Gibbs free energy through isothermal utilization of environmental heat energy with TELP to do useful work in driving ATP synthesis.
The total pmf energy which is the sum of the local pmf energy and the classic pmf energy is presented in Figure 1. The overall pattern of the total pmf amazingly matched the Bacillus pseudofirmus OF4 cell population growth observed experimentally as the cell population growth doubling times. That is, the pattern of the total pmf energy calculated through the newly formulated pmf equations (Eqs. 1−4) from the ground up using experimental data including the liquid culture medium pH () and cation concentrations, the measured membrane potential (), and cytoplasmic pH () excellently matched the pattern of the observed cell population growth doubling times.
As shown in Figure 1, a large part of the total pmf Gibbs free energy curve is well above the redox (chemical) potential energy limit of −22.0 kJ/mol. For example, several of the total pmf Gibbs free energies (such as −45.5, −45.2, −38.9 and −28.5 kJ/mol) are significantly larger than the chemical energy input limit of −22.0 kJ/mol through the respiratory redox-driven proton pump system. How could the total pmf Gibbs free energy exceed the chemical energy limit imposed by the respiratory redox-driven proton pump system? We now know the answer: the local pmf Gibbs free energy is from a TELP-associated thermotrophic function (a type-B energetic process) that isothermally utilizes environmental heat (protonic thermal kinetic energy kT, which is the product of the Boltzmann constant k and temperature T contained within the of Eq. 2) to help drive the synthesis of ATP from ADP and Pi (inorganic phosphate) through FoF1-ATP synthase.
According to Eq. 2, as long as the TELP concentration is above zero, the Gibbs free energy () change is indeed a negative number. That is, the Gibbs free energy () change for the isothermal environmental heat utilization process is indeed negative if there is a TELP concentration (above zero). The amount of local pmf Gibbs free energy is a function of TELP concentration as shown in Eq. 2.
As shown in Figure 1, the amount of local pmf energy as calculated according to Eq. 2 quantitatively represents the activity of this amazing isothermal environmental heat (protonic thermal kinetic energy kT ) utilization function with TELP. Accordingly, it is the ratio () of TELP concentration at the membrane-liquid interface to the bulk-phase proton concentration at the same p-side of the membrane that mathematically relates to this special isothermal environmental heat utilization function.
The local pmf energy represents a substantial portion of the total pmf energy. For example, when the liquid culture medium pH was 7.5, the local pmf Gibbs free energy of −32.0 kJ/mol represents about 70% of the total pmf Gibbs free energy of −45.5 kJ/mol. When the liquid culture medium pH was raised to 10.5, the local pmf Gibbs free energy of −24.2 kJ/mol represents 85% of the total pmf Gibbs free energy of −28.5 kJ/mol. That is, the bacteria obtain as much as 70−85% of the total pmf Gibbs free energy from the isothermal utilization of environmental heat energy associated with TELP. Therefore, it is now quite clear that the bacteria have a significant thermotrophic function (Type-B energetic process) [22] in addition to being chemotrophs (Type-A energetic process).
The Evidence for a Protonic Thermotrophic Function as a Type-B Energetic Process in Mitochondria
The evidence for a Type-B energetic process (protonic thermotrophic function) in mitochondria was from the data (Table 1) of TELP density at the liquid-membrane interface, local protonic entropy change (), the classic protonic Gibbs free energy (), the local protonic Gibbs free energy () and the total protonic Gibbs free energy () calculated as a function of transmembrane potential at the physiological temperature T = 310 K through Eqs. 1−5 using the mitochondrial inner membrane capacitance of 0.55 µf/cm2 independently determined experimentally [23], the measured properties (, with the known reaction medium compositions of Ref. [24], and the experimental measurements of pH across the membrane-embedded FoF1-ATP synthase [25]. The cation concentrations, proton-cation exchange equilibrium constants and cation exchange reduction factor (1.29) are from Refs. [5,7].
Based on the FoF1-ATP synthase physiological phosphorylation potential of +55.3 kJ mol−1 calculated from the measurements in mitochondrial matrix [26], the physiologically required protonic Gibbs free energy () for ATP synthesis with a proton-to-ATP ratio of 8/3 in mitochondria should be −20.7 kJ mol−1 (−55.3 kJ mol−1/2.67). From here, we can immediately understand that even an 100% full use of the classic Mitchellian bulk phase-to-bulk phase protonic electrochemical potential gradients [27,28,29], is still below the physiologically required of −20.7 kJ mol−1 for ATP synthesis in mitochondria. Therefore, the known classic chemical energy process (Type-A energetic process) alone is not adequate to explain the ATP synthesis in mitochondria. This also indicates that there must be another fundamentally disparate biophysical energetics mechanism in mitochondria; which we now know is the thermotrophic function [9,10,30], which is now known as a Type-B energetic process that can isothermally utilize environmental heat energy associated with TELP in driving the synthesis of ATP molecules.
As shown in Table 1, the calculated local protonic Gibbs free energy () is in a range from −27.5 to −31.1 kJ mol−1 whereas the classic protonic Gibbs free energy () is in a range from −5.42 to −19.9 kJ mol−1 for a range of transmembrane potential () from 50 to 200 mV. The total protonic Gibbs free energy () that is the sum of the classic protonic Gibbs free energy () and the local protonic Gibbs free energy () was calculated to be in a range from −32.9 to −51.0 kJ mol−1. All of these and values (Table 1) are substantially above the physiologically required of −20.7 kJ mol−1 for ATP synthesis at any of the transmembrane potential () values in a range from 50 to 200 mV. Therefore, the application of the newly formulated protonic Gibbs free energy equations (Eqs. 1−5) has now consistently yielded an excellent elucidation for the energetics in mitochondria.
Fundamentally, we now understand that the formation of TELP under the transmembrane-electrostatic field effect of excess protons at the p-side and excess hydroxides at the n-side represents a special “negative entropy event”. The ratio () of the TELP concentration formed at the membrane-liquid interface to the bulk liquid-phase proton concentration at the same side in the mitochondria intermembrane space and cristae space is related to the “negative entropy change” as shown in the following quantitative expression:
This equation was derived from Eq. 2 by multiplying its two sides with (1/). As shown in Eq. 5, as long as the TELP concentration is above zero, the entropy change () will be a negative number. For example, the formation of TELP that gives rise a transmembrane potential of 100 mV will have a negative entropy change of −94.6 J/K·mol, which can be subsequently utilized to deliver a local pmf free energy () of −29.3 kJ/mol. That is, the entropy change of TELP formation that enables the isothermal environmental heat utilization function as a Type-B energy process is indeed negative as long as the TELP concentration is above zero in mitochondria.
Conversely, the local protonic Gibbs free energy () as expressed in Eq. 2 for driving ATP synthesis is from the utilization of the negative-entropy-event-created TELP concentration , thus giving rise a positive entropy change () which has the same absolute of but with an opposite sign. For example, the utilization of TELP concentration at transmembrane potential of 100 mV will have a positive entropy change of +94.6 J/K·mol, delivering a local pmf energy () of −29.3 kJ/mol.
Mechanism of Protonic Thermotrophic Function as a Type-B Energetic Process
We now understand the protonic thermotrophic function as a Type-B energy process is enabled through two key factors: 1) TELP formation and utilization (Eqs. 1–5, Table 1); and 2) the asymmetric structures of the biological membrane (Figure 2 and Figure 3).
The transmembrane-electrostatic proton localization is a protonic capacitor behavior that stems from the property of liquid water as a protonic conductor and the mitochondrial inner membrane as an insulator (Figure 2 and Figure 3). Consequently, creating an excess number of protons on one side of the mitochondrial inner membrane accompanied by a corresponding number of hydroxide anions on the other side, for instance, through the redox-driven electron-transport-coupled proton pumps across the membrane, will result in the formation of a protonic capacitor across the biomembrane as shown in Figure 2 and Figure 3. Accordingly, the excess positively charged protons in cristal aqueous medium will electrostatically become localized as TELP at the liquid-membrane interface, attracting an equal number of excess negatively charged hydroxides to the other side (matrix) of the mitochondrial inner membrane to form a “protons-membrane-anions capacitor structure”. The TELP activity at the liquid-membrane interface is now known to contribute to the amount of local protonic Gibbs free energy () according to Eq. 2.
The transmembrane asymmetric structure (Figure 1) such as the protonic outlets of proton-pumping protein complexes I, III, and IV protruding away from the membrane surface by about 1-3 nm into the bulk liquid p-phase (intermembrane space, IMS) while the protonic inlet of the ATP synthase (complex V) located at the localized proton layer along the membrane surface enables effective utilization of TELP with their thermal motion kinetic energy (kT) to do useful work in driving the rotatory molecular turbine of FoF1-ATP synthase for ATP synthesis. Consequently, mitochondria can isothermally utilize the low-grade environmental heat energy associated with the 37oC human body temperature to perform useful work driving the synthesis of ATP with TELP. Fundamentally, it is the combination of protonic capacitor and asymmetric membrane structure that makes this amazing thermotrophic (Type-B energy process) feature possible.
Furthermore, there is a lateral asymmetric feature from the geometric effect of mitochondrial cristae (a crista typically with an ellipsoidal shape is a fold in the inner membrane of a mitochondrion) that enhances the density of TELP at the cristae tips [7], where the F0F1-ATP synthase enzymes are located (Figure 3) in support of the thermotrophic function. As recently reported [7], the ratio of the TELP concentration at the crista tip () to that at the crista flat membrane region () equals the axial ratio () of an ellipsoidal mitochondrial crista. Consequently, for an ellipsoidal crista with a length of 200 nm and width of 20 nm, the TELP concentration at the crista tip () can be as high as 10 times that at the flat region (). This lateral asymmetric effect translates to a TELP associated liquid-membrane interface pH difference of about one pH unit between the crista tip (ridge) and the flat region within the same crista. It is now known that the proton-pumping “respiratory supercomplexes” (complexes I, III and IV) are situated at the relatively flat membrane regions where the TELP concentration () is relatively lower whereas the ATP synthase dimer rows are located at the cristae ridges (tips) where the TELP concentration () is significantly higher as shown in Figure 2 [7,32,33,34,35,36,37]. Consequently, even if the protonic outlets of the complexes I, III and IV are somehow in contact with the TELP layer at the crista flat membrane region so that their activities would be equilibrated with the redox potential chemical energy limit (−22.0 kJ mol−1), the total protonic Gibbs free energy () at the crista tip can still be as high as −27.9 kJ mol−1 since the TELP density at the crista tip can be as high as 10 times that of the crista flat region, equivalent to an additional effective protonic Gibbs free energy of −5.89 kJ mol−1 owning to the crista geometric effect on TELP at the liquid-membrane interface [7].
Note, when the axial ratio () equals unity (one) for a round sphere (symmetric), the density of TELP would be the same at any spot along the liquid-membrane interface for the entire spherical membrane system. Therefore, we now further understand: the ellipsoidal (asymmetric) vs the spherical (symmetric) shape change represents another revenue of spatial asymmetry that enables a lateral asymmetric TELP distribution along the crista liquid-membrane interface to increase TELP density at the crista tip (relative to the crista flat region) to enhance the TELP-associated thermotrophic function.
Thermodynamic Indication of Isothermal Heat Utilization in Methanogens and Anaerobic H2-producing and Acetic Acid-Producing Bacteria
Isothermal heat utilization in methanogens. The methanogenic bacteria [38], such as Methanosarcina sp., can grow in an anaerobic minimal culturing medium that contains acetic acid (CH3COOH) as the sole organic carbon source for their growth and production of methane (CH4) and carbon dioxide (CO2) [39,40]. Note, the production of methane (CH4) and carbon dioxide (CO2) from acetic acid (CH3COOH) is an endothermic reaction process that requires heat energy (3.77 kcal/mol, equivalent to +15.8kJ/mol) from the environment:
The methanogen’s anabolism, which utilizes acetic acid (CH3COOH), mineral nutrients (N, P, K, Ca, Mg, S, Fe, Zn, Cu, Mo, etc.) under anaerobic conditions to synthesize cellular materials including sugar, lipids, proteins, and nucleotides for cell growth, also requires exogenous energy input from the environment. Since both its catabolic production of methane (CH4) and carbon dioxide (CO2) and its anabolism in synthesizing the cellular materials from acetic acid (CH3COOH) are endothermic, the total metabolic process of Methanosarcina must thus be endothermic, requiring exogenous energy input. Consequently, based on the first law (conservation of mass and energy), the required energy input in this case must be from the isothermal utilization (absorption) of heat energy from the environment. This thus provides the thermodynamic first-law evidence for the existence of thermotrophic metabolism in the anaerobic methanogenic Methanosarcina cells.
It is worthwhile to note, this thermodynamic first-law evidence for the existence of thermotrophic metabolism in the anaerobic methanogenic Methanosarcina cells does not necessarily exclude the possibility for them still to be dual chemo-thermotrophs. Specifically, although its value is +15.8 kJ/mol, the entropy change for the production of methane (CH4) and carbon dioxide (CO2) from acetic acid (CH3COOH) is still a substantial positive number (; thus the Gibbs free energy change of Eq. 6 is a substantial negative number () [41]. That is, Methanosarcina may have a substantial “entropy-trophic” feature. On the other hand, all methanogens, to date, couple fermentation to generation of a chemiosmotic transmembrane potential [42,43], which according to Eqs. 2–4 may be associated with TELP and thus the TELP-enabled thermotrophic function (a Type-B energetic process).
Isothermal heat utilization in anaerobic H2-producing and acetic acid-producing bacteria. Our analysis [22] indicated that certain anaerobic H2-producing bacteria [44,45] are also likely to carry the thermotrophic function capable of isothermally utilizing environmental heat energy, in a way similar to that of the methanogenic archaea Methanosarcina cells. For example, the anaerobic hydrogen-producing “S” bacteria can utilize ethanol (CH3CH2OH) to produce molecular dihydrogen (H2) and acetic acid (CH3COOH) according to the following process reaction:
This catabolic production of and from (Eq. 7) is endothermic (19.16 kcal/mol) [22]. The “S” bacteria anabolism, which anaerobically utilizes ethanol (CH3CH2OH) and mineral nutrients (N, P, K, Ca, Mg, S, Fe, Zn, Cu, Mo) to synthesize cellular materials including sugar, lipids, proteins, and nucleotides for cell growth, also requires energy input. Consequently, based on the first law of thermodynamics, the anaerobic hydrogen producing “S” bacteria are also likely to carry thermotrophic function for isothermal utilization (absorption) of heat energy from the environment. However, under certain syntrophic conditions [41], anaerobic H2-producing and acetic acid-producing bacteria may still display substantial chemotrophic feature through interspecies-coupled energy metabolism.
Similarly, certain propanoic acid-utilizing, H2-producing and acetic acid-producing bacteria anaerobically utilize propanoic acid () to produce acetic acid (), hydrogen () and carbon dioxide () according to the following process reaction:
This catabolic production of acetic acid, hydrogen and carbon dioxide from propanoic acid (Eq. 8) is clearly endothermic (48.93 kcal/mol; kcal/mol; kcal/mol) [22]; Their anabolism that anaerobically utilize propanoic acid (CH3CH2COOH) and mineral nutrients to synthesize cellular materials for cell growth certainly also requires additional energy input. Based on the thermodynamic first law, their required energy must be from the isothermal utilization (absorption) of heat energy from the environment. Therefore, this analysis result also indicated the existence of thermotrophic metabolism in the propanoic acid-utilizing, H2-producing and acetic acid-producing bacteria.
Furthermore, certain butanoic acid-utilizing, H2-producing and acetic acid-producing bacteria anaerobically utilize butanoic acid () to produce acetic acid () and hydrogen () according to the following process reaction:
The catabolic production of acetic acid, hydrogen and carbon dioxide from butanoic acid (Eq. 9) is clearly endothermic (32.77 kcal/mol; kcal/mol; kcal/mol) [22]; This analysis result indicated the existence of thermotrophic metabolism in the butanoic acid-utilizing, H2-producing and acetic acid-producing bacteria.
Experimental Evidence of Isothermal Absorption (Utilization) of Environmental Heat Energy in Methanosarcina
The predicted isothermal utilization (absorption) of environmental heat energy through thermotrophic metabolism is expected to lower the temperature in the liquid Methanosarcina cell culture. This predicted isothermal utilization (absorption) of environmental heat energy by Methanosarcina was experimentally demonstrated as shown in the recently published report of Thermotrophy Exploratory Study [10]. Briefly, the Methanosarcina cells were enriched from a liquid inoculum of a methane-producing anaerobic digestor using a minimal liquid culture medium containing acetate as the sole source of carbon under the anaerobic conditions. The experimental observation demonstrated that the metabolic activities in Methanosarcina liquid cell culture indeed resulted in a substantial temperature change (drop) by about −0.10 oC (and sometimes drop as much as −0.45 oC) compared with the control (liquid medium only without cells). This is a noteworthy progress since it has been, for the first time, experimentally demonstrated the isothermal absorption (utilization) of environmental heat energy owing to thermotrophy.
The Thermotrophy-Associated Protonic Bioenergetic Systems as Type-B Energetic Processes Widely Operate in Natural Environments
It is now also clear that this Type-B thermotrophic process associated with TELP has occurred for billions of years already in the biosphere on Earth. All organisms including bacteria, fungi, algae, higher plants, and mitochondria-powered animals have chemiosmotic transmembrane potential that is associated with TELP (Eqs. 2–4). The intimate relationship between the ideal TELP concentration and transmembrane potential difference is described in the TELP equation (Eq. 3), which shows that as long as there is a substantial value of , there must be TELP. This relationship is true also for their vice versa. Therefore, TELP and represent the “two faces” of a protonic capacitor. As reported previously [5], fundamentally, it is the formation of a TELP-associated membrane capacitor that gives rise to as shown the following transmembrane potential equation:
On the other hand, the presence of must indicate the presence of TELP () which is the source of the local pmf energy (Eq. 2) that isothermally utilizes environmental heat energy.
Therefore, the TELP thermotrophy (Type-B energetic process) widely operate in all organisms everywhere in the biosphere on earth today, including the vast lands of crops and animals, mountains of forests, birds in the skies, and all the known organisms in soils, ponds, lakes, rivers, and seas. Therefore, we have now identified two thermodynamically distinct types (A and B) of energy processes naturally occurring on Earth, based on their properties of whether they follow the second law of thermodynamics or not. As mentioned before, Type-A energetic processes such as the classic heat engines, and many of the known chemical reactions and processes in our test tubes, computers, and cars apparently well follow the second law; Type-B energetic processes represented by the thermotrophic function (Figure 1, Figure 2 and Figure 3) here do not have to be constrained by the second law, owing to the special asymmetric function. That is, the second law remains still to be an incredibly good law. However, it does not necessarily have to be always universal as implied also by several independent studies [22,46,47,48,49,50,51,52,53,54,55,56,57].
We now have, at least, three well-defined biosystems, mitochondria [9], alkalophilic bacteria [8], and methanogen Methanosarcina [10] with well-corroborated scientific evidence showing a special Type-B process that perfectly follows the thermodynamic first law (conservation of mass and energy), but is not constrained by the second law of thermodynamics. As shown in Eq. 5, the entropy change () for the TELP-associated isothermal environmental heat utilization was calculated indeed to be a negative number.
Therefore, the new understanding of the Type-B process may represent a complementary development to the second law of thermodynamics and its applicability in bettering the science of bioenergetics and energy renewal. In addition to the naturally occurring Type-B energetic processes, a number of Type-B energetic processes have now been created by human efforts as briefly presented in the following sections.
Asymmetric Function-Gated Isothermal Electricity Production
Figure 4 presents an invention [55] of an integrated isothermal electricity generator system 1300 that comprises multiple pairs of emitters and collectors working in series. The system 1300 comprises four parallel electric conductor plates 1301, 1302, 1321 and 1332 set apart with barrier spaces (such as vacuum spaces) 1304, 1324, and 1334 in between the conductor plates. Accordingly, the first electric conductive plate 1301 has its right side surface coated with a thin layer of low work function (LWF) film 1303 serving as the first emitter; The second electric conductive plate 1302 has its left side surface coated with a thin layer of high work function (HWF) film 1309 serving as the first collector while its right side surface coated with a thin layer of low work function (LWF) film 1323 serving as the second emitter; The third electric conductive plate 1321 has its left side surface coated with a thin layer of high work function (HWF) film 1329 serving as the second collector while its right side surface coated with a thin layer of low work function (LWF) film 1333 serving as the third emitter; The fourth electric conductive plate 1332 has its left side surface coated with a thin layer of high work function (HWF) film 1339 serving as third (terminal) collector; The first barrier space 1304 allows the thermal electron flow 1305 to pass through ballistically between the first pair of emitter 1303 and collector 1309; The second barrier space 1324 allows the thermal electron flow 1325 to pass through ballistically between the second pair of emitter 1323 and collector 1329; The third barrier space 1334 allows the thermal electron flow 1335 to pass through ballistically between the third pair of emitter 1333 and collector 1339.
It is a preferred practice to employ: a first capacitor 1361 connected in between the first and second electric conductor plates 1301 and 1302; a second capacitor 1362 linked in between the second and third conductor plates 1302 and 1321; a third capacitor 1363 used in between third and the fourth conductor plates 1321 and 1332 as illustrated in Figure 4. The use of capacitors in this manner can typically provide better system stability and robust isothermal electricity delivery. In this example with the first conductor plate 1301 grounded, isothermal electricity can be delivered through outlet terminals 1306 and 1376 or 1377 depending on the specific output power needs. When the isothermal electricity is delivered through outlet terminals 1306 and 1376 across a pair of emitter and collector, the steady-state operating output voltage equals to V(c), which typically can be around 3~4 V depending on the system operating conditions including the load resistance and the difference in work function between the emitter and the collector. When the isothermal electricity is delivered through outlet terminals 1306 and 1377 across three pairs of emitters and collectors, the steady-state operating output voltage is 3xVc, which typically can be about 9~12 V in this example.
The isothermal electricity of the 1300 system (Figure 4) can be delivered also through outlet terminals1376 and 1377. In this case, the V(c) voltage at the second electric conductor plate 1302 generated by the activity of the first emitter (conductor 1301 with LWF film 1303) and first collector (HWF plate 1309) may serve as a bias voltage for the second emitter (LWF film 1323 on the right side surface of the second electric conductor plate 1302) so that the second emitter 1323 will more readily emit thermal electrons towards the second collector 1329 on the left side surface of the third conductor plate 1321 which has the third emitter 1333. Subsequently, the V(c) created at the second collector 1329 of the third conductor plate 1321 can serve as a bias voltage for the third emitter 1333 to emit thermal electrons more readily towards the terminal collector 1339 at the fourth conductor plate 1332 to facilitate the generation of isothermal electricity for delivery through the outlet terminals1376 and 1377. Therefore, use of this special feature can help better extract environmental energy especially when the operating environmental temperature is relatively low or when the work function of certain emitters alone may not be entirely low enough to function effectively. When the isothermal electricity is delivered through the outlet terminals 1376 and 1377, the steady-state operating output voltage is 2xVc, which typically can be about 6~8 V.
For a typical electron emitter, its emitted current density, J, is given by the Richardson–Dushman equation [58,59,60], J = AT2exp(−W/kT), i.e.,
Where T is the thermodynamic temperature of the emitter, W is its work function, k is the Boltzmann constant, and A is a constant.
For an asymmetric function-gated thermal electron power generator system 1300 as illustrated in Figure 4 that operates isothermally, the temperature at the emitter () equals to that of the collector (). Under the isothermal operating conditions (, the ideal net flow density (flux) of the emitted electrons 1105 from the emitter 1101 to the collector 1102, which is defined also as the ideal isothermal electron flux () normal to the surfaces of the emitter and collector can be calculated based on the use of Richardson-Dushman formulation in the following ideal isothermal current density () equation:
Where is the universal factor (as known as the Richardson-Dushman constant) which can be expressed as [where is the electron mass, is the electron unit charge, is the Boltzmann constant and is Planck constant]. is the absolute temperature in Kelvin (K) for both the emitter and the collector; is the work function of the emitter surface; the term of is the product of the electron unit charge and the voltage at the emitter; is the Boltzmann constant in (eV/K); is the work function of the collector surface; and is the product of the electron unit charge and the voltage at the collector [11].
When the voltage at the emitter (V(e)) is zero such as when the emitter is grounded as illustrated in Figure 4, the ideal net isothermal electrons flow density across the vacuum space from the emitter 1101 to the collector 1102 can be calculated using the following modified ideal isothermal current density () equation:
When the voltage at both the emitter (V(e)) and the collector (V(c)) are zero such as at the initial state of an isothermal electricity generation system, the maximum net isothermal electron flow density across the vacuum space from the emitter 1101 to the collector 1102 reaches the highest attainable, which is regarded as the “saturation” (upper limit) flux. This ideal saturation electron flux can be calculated using the following ideal saturation isothermal current density () equation:
Note, Eq. 13 shows that the ideal saturation electron flux is the emitter’s emitted current density, Je, (that is given by the Richardson–Dushman equation) minus the collector’s emitted current density, Jc, (that is given also by the Richardson–Dushman equation). This explains how the Richardson–Dushman equation was applied in Equations 11, 12 and 13.
Figure 5 presents the ideal isothermal electricity current density (A/cm2) curves as a function of output voltage V(c) from 0.00 to 4.10 V at operating environmental temperature of 273, 293, 298, and 303 K for a pair of emitter work function (WF(e) = 0.50 eV) and collector work function (WF(c) =4.60 eV, graphene and/or graphite) with the emitter grounded. These curves show that the isothermal electron current density is pretty much constant (steady) in a range of output voltage V(c) from 0.00 to 4.00 V at each of the operating environmental temperature of 273, 293, 298, and 303 K. Only when the output voltage V(c) is raised beyond 4.00 V up to the limit of 4.10 V, the isothermal electron current density is dramatically reduced to zero. The level of the steady-state isothermal electron current density at an output voltage of 3.50 V increases dramatically with temperature from 5.26x10⁻³ A/cm2 at 273 K (0 oC) to 2.59x10⁻² A/cm2 at 293 K (20 oC), 3.73 x10⁻² A/cm2 at 298 K (25 oC), and to 5.32 x10⁻² A/cm2 at 303 K (30 oC).
More evidence and scientific support for the disclosed invention (Type-B energetic process) are not only the computed numerical data of the isothermal electron current density (Figure 5), but also the isothermal electron current density () equation (Eq. 13) per se where the isothermal environmental heat utilization is inherently embedded with the “” thermal term, based on well-established physical sciences. The physics equation (Eq 13) also shows that the asymmetric function-gated isothermal electricity generators can produce isothermal electricity as long as the electron work function [WF(e)] of the emitter is substantially lower than that of the collector [WF(c)]. Furthermore, sustainable isothermal electricity production has already been experimentally demonstrated through a prototype of an asymmetric function-gated isothermal electrons-based environmental heat energy utilization system (see paragraphs 0097 – 0103 and experimental data listed in Table 7; and paragraphs 0172 – 0190 and experimental data in Table 10 and Table 11 of the PCT International Patent Application Publication [55]).
Epicatalysis generating a Temperature Difference Between Catalysis-Asymmetric Filaments
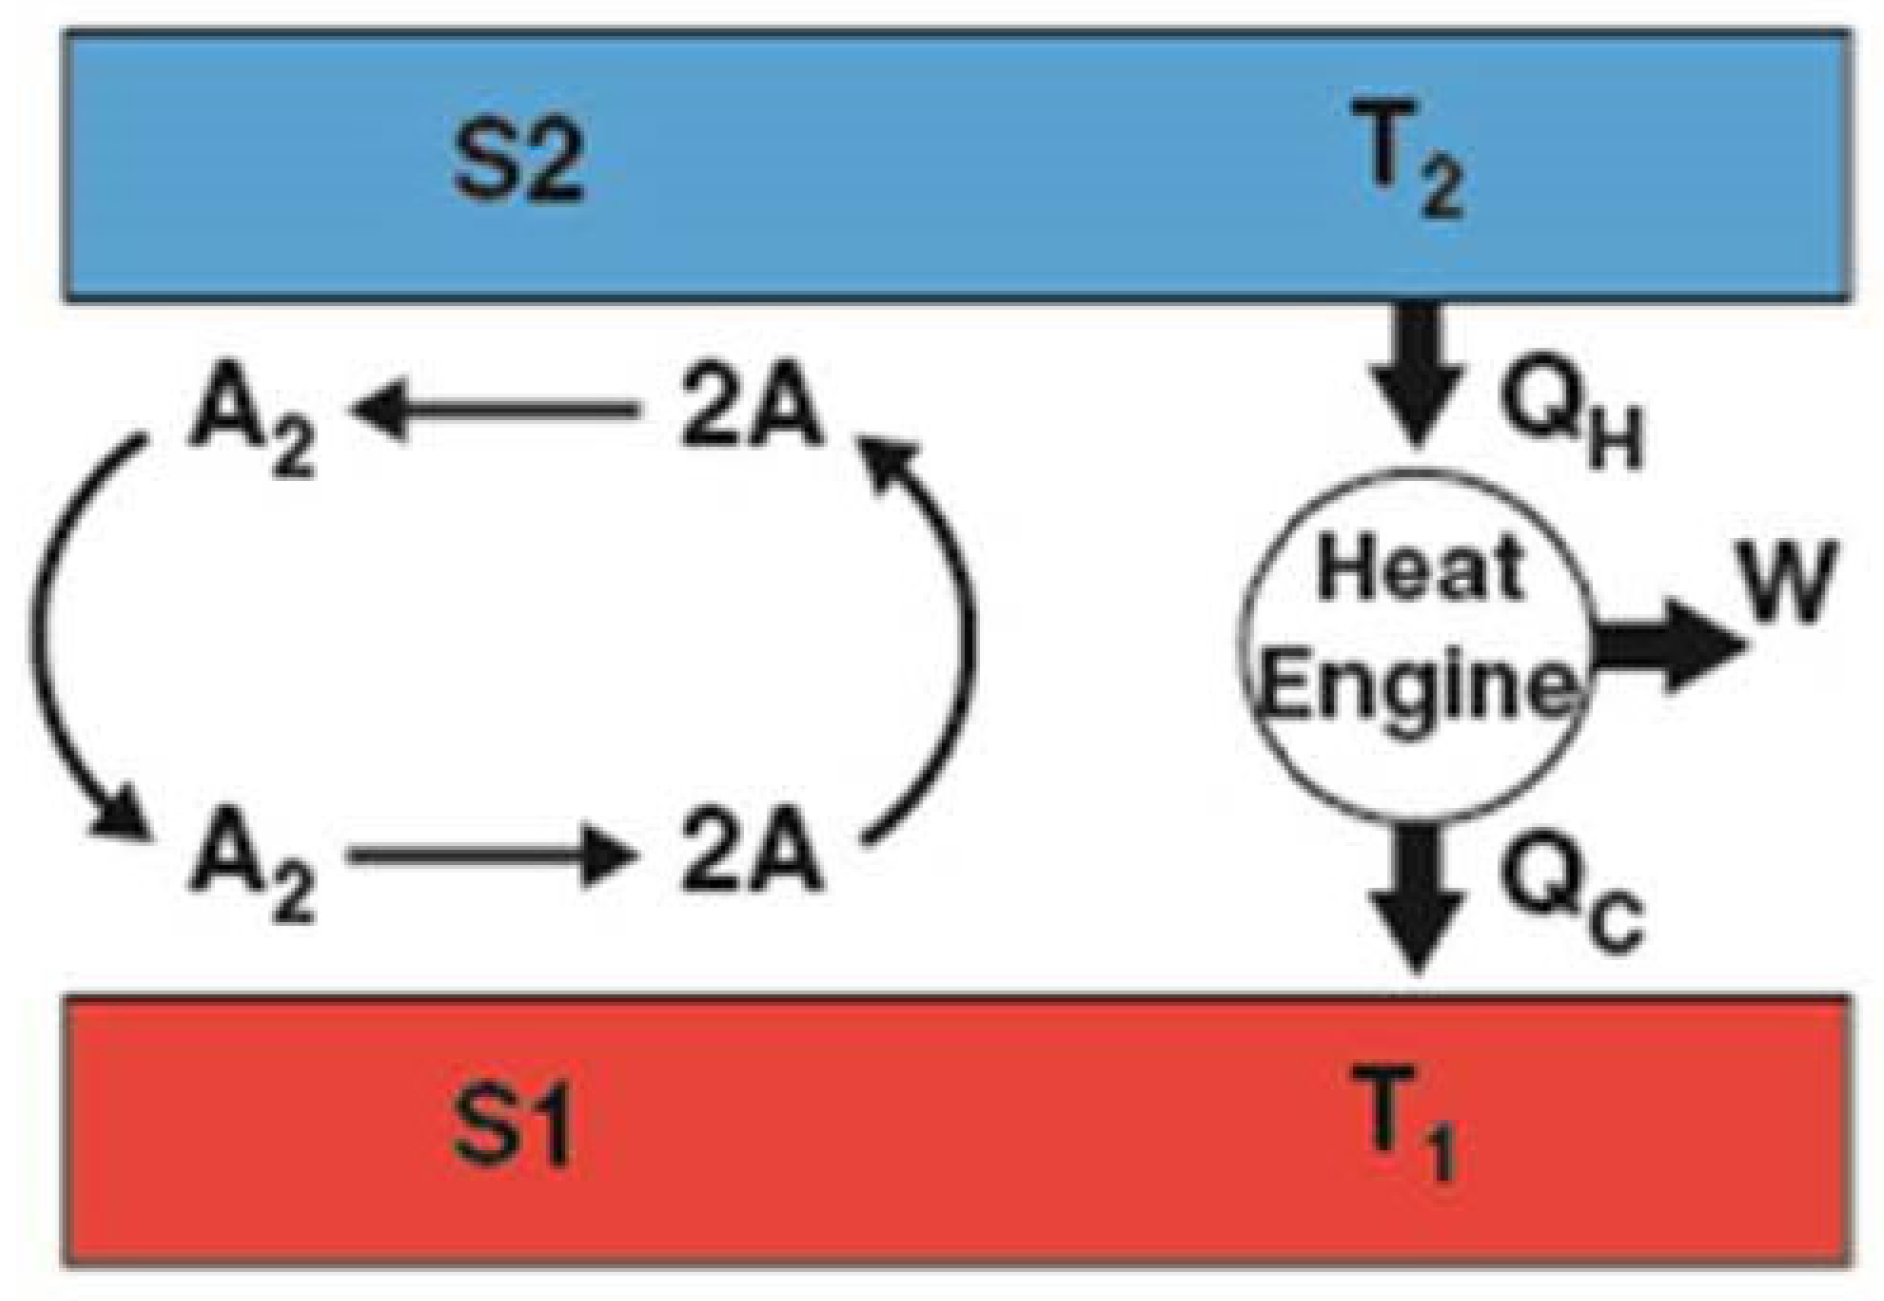
In experimental tests of Duncan’s paradox [61], Sheehan et al [50] experimentally demonstrated that epicatalysis can generate a temperature difference between catalysis-asymmetric filaments (Figure 5). The experiment employed molecular hydrogen H2 dissociation (H2 → 2H) on rhenium (Re) and tungsten (W) filaments at high temperature. In the high-temperature hydrogen/W/Re blackbody cavity experiment, large steady-state temperature differences (∆T ≥ 120 K) were observed and consequently a power production densities of roughly 104 Watts/m2 were inferred [50]. Therefore, this experimental result may represent a clear demonstration of a human-created Type-B energetic process.
Figure 6.
Experimental demonstration of an artificial Type-B energetic process: Differential chemical reactions on S1 and S2 establish a permanent temperature difference (∆T = T2 − T1) that perpetually drives a classic heat engine. S1 cools because dissociation (A2 → 2A) is endothermic and, conversely, S2 heats because recombination (2A → A2) is exothermic. Adapted from Ref. [50].
Artificially-Made Asymmetric Membrane Concentration Cell
Sheehan et al [62] have recently created an asymmetric membrane concentration cell which charges using a unique mechanism of isothermally utilizing environmental heat energy: “its concentration difference is generated internally by a chemically-asymmetric membrane that drives anisotropic diffusion of electrolyte ions, rather than being provided by an external source”. They experimentally demonstrated an asymmetric membrane separator-generated ΔpH of 0.04, which was converted to electron motive force and current (5× 10⁻³ V, ∼ 10−6 A), resulting in a power generation of 5×10⁻⁹ W. Sheehan’s analysis [63] indicated that asymmetric membrane separator-generated ΔpHs ∼ 1–2 should be attainable, corresponding to concentration ratios of 10–100, which can be utilized to generate an electric power density of more than to 107 W/m3. The experimental results [62] agree well with theoretical predictions [63], which represents another example of an human-created Type-B energetic process.
Fu’s Experiment on Heat-Electric Conversion Using Surface Electron Emission under a Static Magnetic Field
As recently reported [64], Fu’s experiment employed a vacuum tube containing two identical and coplanar Ag-O-Cs surfaces separated by a mica insulator (Figure 7). The two Ag-O-Cs surfaces serve as emitters A and B (work function 0.8eV) that ceaselessly emit thermal electrons at room temperature. The trajectory of the emitted electrons is controlled (bent) by use of a static uniform magnetic field so that the number of electrons migrate from A to B exceeds that from B to A (or vice versa). The net migration of thermal electrons from A to B quickly results in a charge distribution of A charged positively and B negatively. Consequently, a voltage difference between A and B emerges, enabling a continuous output current (power) through an external load.
Figure 8 presents the continuous output current (I) experimentally measured from Fu’s electrotube FX12-51 at various static uniform magnetic field B at a room temperature of 22 oC. The data showed the continuous output current (I) at a static magnetic field range from −15 to 15 gauss. At the static magnetic field of 2.7 gauss, the measured continuous output current (I) reached as high as 180 fA. Therefore, this experimental result may also represent another clear demonstration of a Type-B energetic process that isothermally utilize environmental heat energy to produce electricity.
Notably, Fu’s finding of heat-electric conversion using surface electron emission under a static magnetic field [64,65] that he had repeatedly demonstrated through his pioneering work of more than 40 years since 1980s [66,67,68] has recently been independently demonstrated also by the work of Perminov and Nikulov [69] who in 2011 were apparently unaware of Prof. Fu’s pioneering work in the field. Therefore, the validity of Fu’s discovery on heat-electric conversion using surface electron emission under a static magnetic field [66,67,68,69,70] has been proven well beyond any reasonable doubt. Therefore, it is now classified as a human-created Type-B energetic process.
Dynamic Processes in Superconductors Indicating Type-B Energetic Process
The observations of the dc voltage on an asymmetric superconducting ring testify that one of the ring segments is a dc power source [70]. According to Nikulov and his associates, the persistent current flows against the total electric field in this segment. This paradoxical phenomenon is observed when the ring or its segments are switched between superconducting and normal state by non-equilibrium noises. It was demonstrated that the dc voltage and the power increase with the number of identical rings connected in series. Large voltage and power sufficient for practical application can be obtained in a system with a sufficiently large number of the rings. This points to the possibility of using such a system for the observation of dc voltage in the normal state of superconducting rings and in asymmetric rings made of normal metal.
Furthermore, according to Nikulov’s analysis [71], the Meissner effect generating a persistent (perpetual) current in certain superconductors apparently contradicts with the law of entropy increase (the second law), especially when the annihilation of an electric current in normal metal with the generation of Joule heat is considered [72]. That is, the phenomenon of superconductors may indicate a kind of Type-B energetic process characteristics.
Type-B Energetic Processes: The Second Law of Thermodynamics Does Not Necessarily Have to Be Universal
The identification of Type-B energy processes shows that there is an entirely new world of physics, chemistry, and biochemistry yet to be fully explored.
We all understand that the second law remains still as an incredibly good law. However, it does not necessarily have to be always absolute or universal as implied also by other well-documented independent studies [22,46,47,48,49,50,51,52,53,54,55,56,57,73]. The special Type-B process perfectly follows the first law (conservation of mass and energy) of thermodynamics but does not obey the second law of thermodynamics. In other words, the TELP-associated thermotrophic function as a Type-B process clearly represents an example of a natural “second law violation” since Type-B process by its definition is not constrained by the second law.
Note, the second law of thermodynamics was developed from the Sadi Carnot cycle [74] that was based on the ideal gas law (nRT = PV; here P is pressure, V is volume and n is the number of moles) where the ideal molecular particles were assumed to have freedom in a 3-dimensional space (volume) without the consideration of any asymmetric structures. In the case of protonic bioenergetic systems, the TELP are on a 2-dimensional membrane surface with asymmetric properties, which is quite different from the assumed 3-dimensional space (volume) system that the second law was based on. Therefore, one must be careful not to mindlessly apply something like the second law derived from a 3-dimensional space (volume) system to a two-dimensional and/or one-dimensional system without looking into the specific facts.
Furthermore, the thermodynamic-spatial asymmetric features that may be human-made [11,50,75] and/or have resulted from the billion years of natural evolution were not considered by the formulation of the second law per se; this is another reason that one shall be careful not to mindlessly or blindly apply the second law with monolithic thinking to certain special cases involving asymmetric systems without looking into the specifics.
That is, the second law can be well applied to the Type-A processes such as classical heat engines, and many of the known chemical, electrical, and mechanical processes where the second law belongs; The second law should not be blindly applied to Type B energy processes owing to their special asymmetric functions. It is important now for our scientific communities to avoid monolithic thinking and keep an open mind to consider the Type-B processes and their related phenomena in certain physical, chemical, and/or biological processes especially where asymmetric mechanisms are involved. The scientific communities may well benefit from the new fundamental understanding of Type-B processes uncovered in the natural Earth environment. To avoid the blind faith in the second law, the scientific community must pay attention to what this law was really based on and to better understand its limitations that are of great scientific and practical importance.
Concluding Remarks
It is now quite clear that many of the recent scientific explorations in regards to the second law of thermodynamics such as the recent studies of Sheehan et al [47,50,76], Fu [64,66,67,68] and Nikulov [70,72,77,78] are really legitimate and thus should be encouraged to move the field forward. In hindsight, however, some of the language used in the past such as “challenging the second law of thermodynamics” [47,77,79,80] appears to be somewhat inaccurate or did not seem carry the right messages for the scientific community. It could in-part explain why the messages so far still have not been well received by many in the scientific community, who may feel the second law is serving their research very well for good reasons. In fact, to many in the scientific community who may be familiar only with the Type-A processes, the term “challenging the second law of thermodynamics” could be misunderstood as “challenging” their career establishment that might have been built on the classic thermodynamic second law as taught in the textbooks. Consequently, some of them may feel “totally upset” or “annoyed” with “total disbelief,” quite often tending to completely ignore or reject the topic of discussions. Therefore, this author encourages the use of some more accurate terms like “challenging the applicability (or universality) of the thermodynamic second law,” since the second law is applicable to Type-A processes but may not necessarily be applicable to Type-B processes because of their special asymmetric functions.
For the modern world in which the second law is now known to be not absolute, the Type-B processes may be harnessed to do useful work such as generating isothermal electricity to power the modern electricity-based world economy. For example, a novel invention on isothermal electricity for energy renewal (WO 2019/136037 A1) has now been made to generate isothermal electricity by innovatively translating the concept of the asymmetric protonic membrane capacitor-enabled Type-B process into an isothermal electron-based power generation system, which could be made into a chip device [55,81]. Its isothermal electricity power density could be so surprisingly good that its chip with a size of about 40 cm2 may be sufficient to continuously power a smart mobile phone device forever [11]. That is, based on the invention [55], novel Type-B energy technologies such as the asymmetric function-gated isothermal electricity generator systems have the potential for use to permanently power many electric devices, electric motors, machines and vehicles including (but not limited to) mobile phones, laptops, cars, buses, trains, ships, and airplanes utilizing the limitless environmental heat energy alone without requiring any fossil fuel energy [11]. Therefore, innovative scientific research and development efforts in mimicking and/or creating of Type-B processes [11] to isothermally utilize the endless environmental heat energy [11,50,55,70,75] should be highly encouraged to help ultimately liberate all peoples from their dependence of fossil fuel energy, thus helping to reduce greenhouse gas CO2 emissions and control climate change towards a common shared sustainable future for the humanity on Earth [81].
Author Contributions
Lee designed and performed research, analyzed data, and wrote the paper.
Acknowledgments
The author (Lee) thanks George Hathaway (founder and President of Hathaway Research International) for his review and editing of this manuscript, and Prof. Daniel Sheehan and Dr. Alexey Nikulov for their reading of the manuscript with insightful comments and discussions. Lee also thanks the editors and anonymous peer reviewers for their highly valuable and constructive review comments that made this article better. This work was supported in part with the Lee laboratory start-up research funds provided by the Department of Chemistry and Biochemistry, the College of Sciences, the Office of Research at Old Dominion University, and by the Old Dominion University Research Foundation, and also in part by a Multidisciplinary Biomedical Research Seed Funding Grant from the Graduate School, the College of Sciences, and the Center for Bioelectrics at Old Dominion University, Norfolk, Virginia, USA. The asymmetric-function-gated isothermal electricity generator invention (WO 2019/136037 A1) was made through a private scientific exploration effort outside Old Dominion University.
Conflicts of Interest
The author declares no competing interests.
References
- Lee, J.W. Proton-electrostatics hypothesis for localized proton coupling bioenergetics. Bioenergetics 2012, 1, 1–8. [Google Scholar]
- Lee, J.W. Proton-electrostatic localization: Explaining the bioenergetic conundrum in alkalophilic bacteria. Bioenergetics 2015, 4, 1–8. [Google Scholar]
- Saeed, H.; Lee, J. Experimental determination of proton-cation exchange equilibrium constants at water-membrane interface fundamental to bioenergetics. WATER Journal: Multidisciplinary Research Journal 2018, 9, 116–140. [Google Scholar]
- Lee, J.W. A possible electrostatic interpretation for proton localization and delocalization in chloroplast bioenergetics system. Biophysical Journal 2005, 88, 324a–325a. [Google Scholar]
- Lee, J.W. Electrostatically localized proton bioenergetics: Better understanding membrane potential. Heliyon 2019, 5, e01961. [Google Scholar] [CrossRef] [PubMed]
- Lee, J.W. Electrostatically localized protons bioenergetics over Mitchell’s classic chemiosmotic theory. Biochemical & Molecular Engineering 2013, 2, 4. [Google Scholar]
- Lee, J.W. Protonic Capacitor: Elucidating the biological significance of mitochondrial cristae formation. a Nature research journal: Scientific Reports 2020, 10, 10304. [Google Scholar] [CrossRef] [PubMed]
- Lee, J.W. Isothermal Environmental Heat Energy Utilization by Transmembrane Electrostatically Localized Protons at the Liquid-Membrane Interface. Acs Omega 2020, 5, 17385–17395. [Google Scholar] [CrossRef]
- Lee, J.W. Mitochondrial energetics with transmembrane electrostatically localized protons: Do we have a thermotrophic feature? Sci Rep-Uk 2021, 11, 14575. [Google Scholar] [CrossRef]
- Lee, J.W. Thermotrophy Exploratory Study. Journal of Scientific Exploration 2023, 37, 5–16. [Google Scholar] [CrossRef]
- Lee, J.W. Energy Renewal: Isothermal Utilization of Environmental Heat Energy with Asymmetric Structures. Entropy-Switz 2021, 23, 665. [Google Scholar] [CrossRef]
- Lee, J.W. TELP theory: Elucidating the major observations of Rieger et al. 2021 in mitochondria. Mitochondrial Communications 2023, 1, 62–72. [Google Scholar] [CrossRef]
- Mitchell, P.; Moyle, J. Estimation of Membrane Potential and Ph Difference across Cristae Membrane of Rat Liver Mitochondria. Eur J Biochem 1969, 7, 471–484. [Google Scholar] [CrossRef] [PubMed]
- Mitchell, P. The Correlation of Chemical and Osmotic Forces in Biochemistry. J Biochem 1985, 97, 1–18. [Google Scholar] [CrossRef]
- Nicholls, D.G.; Ferguson, S.J. 3—Quantitative Bioenergetics: The Measurement of Driving Forces. In Bioenergetics (Fourth Edition), Academic Press: Boston, 2013; pp 27-51.
- Nicholls, D.G.; Ferguson, S.J. 3—Quantitative bioenergetics: The measurement of driving forces. In Bioenergetics 2, Ferguson, D.G.N.J., Ed.; Academic Press: Cambridge, MA, USA, 1992; pp. 38–63. [Google Scholar]
- Lee, J.W. Protonic conductor: Better understanding neural resting and action potential. J Neurophysiol 2020, 124, 1029–1044. [Google Scholar] [CrossRef] [PubMed]
- Guffanti, A.; Krulwich, T. Bioenergetic problems of alkalophilic bacteria. Biochem Soc T 1984, 12, 411. [Google Scholar] [CrossRef]
- Krulwich, T.A.; Gilmour, R.; Hicks, D.B.; Guffanti, A.A.; Ito, M. Energetics of alkaliphilic Bacillus species: Physiology and molecules. Advances in microbial physiology 1998, 40, 401–438. [Google Scholar] [PubMed]
- Krulwich, T.A.; Liu, J.; Morino, M.; Fujisawa, M.; Ito, M.; Hicks, D.B. Adaptive mechanisms of extreme alkaliphiles. Extremophiles handbook 2011, 119–139. [Google Scholar]
- Padan, E.; Bibi, E.; Ito, M.; Krulwich, T.A. Alkaline pH homeostasis in bacteria: New insights. Biochimica et biophysica acta (BBA)-biomembranes 2005, 1717, 67–88. [Google Scholar] [CrossRef]
- Lee, J.W. There may be thermotrophic type of life on Earth (Report by the Former Zhejiang Agriculture University, Department of Agromony, Student Research Group on Thermotroph Exploration Study led by James Weifu Lee). Potential Science, published in Beijing, China 1983, 1.
- Pauly, H.; Packer, L.; Schwan, H.P. Electrical properties of mitochondrial membranes. J Biophys Biochem Cytol 1960, 7, 589–601. [Google Scholar] [CrossRef]
- Chinopoulos, C.; Vajda, S.; Csanady, L.; Mandi, M.; Mathe, K.; Adam-Vizi, V. A Novel Kinetic Assay of Mitochondrial ATP-ADP Exchange Rate Mediated by the ANT. Biophysical Journal 2009, 96, 2490–2504. [Google Scholar] [CrossRef]
- Rieger, B.; Arroum, T.; Borowski, M.-T.; Villalta, J.; Busch, K.B. Mitochondrial F1FO ATP synthase determines the local proton motive force at cristae rims. Embo Rep 2021, 22, e52727. [Google Scholar] [CrossRef] [PubMed]
- Jacobus, W.E.; Moreadith, R.W.; Vandegaer, K.M. Mitochondrial respiratory control. Evidence against the regulation of respiration by extramitochondrial phosphorylation potentials or by [ATP]/[ADP] ratios. J Biol Chem 1982, 257, 2397–2402. [Google Scholar] [CrossRef] [PubMed]
- Mitchell, P. Coupling of phosphorylation to electron and hydrogen transfer by a chemi-osmotic type of mechanism. Nature 1961, 191, 144–148. [Google Scholar] [CrossRef] [PubMed]
- Mitchell, P. Possible molecular mechanisms of the protonmotive function of cytochrome systems. J Theor Biol 1976, 62, 327–367. [Google Scholar] [CrossRef]
- Mitchell, P. David Keilin's respiratory chain concept and its chemiosmotic consequences. Nobel prize lecture 1978, 1, 295–330. [Google Scholar]
- Lee, J.W. Type-B Energetic Processes and Their Associated Scientific Implication. Journal of Scientific Exploration 2022, 36, 487–495. [Google Scholar] [CrossRef]
- Dudkina, N.V.; Kouril, R.; Peters, K.; Braun, H.P.; Boekema, E.J. Structure and function of mitochondrial supercomplexes. Bba-Bioenergetics 2010, 1797, 664–670. [Google Scholar] [CrossRef]
- Kuhlbrandt, W. Structure and function of mitochondrial membrane protein complexes. Bmc Biol 2015, 13, 1–11. [Google Scholar] [CrossRef]
- Davies, K.M.; Strauss, M.; Daum, B.; Kief, J.H.; Osiewacz, H.D.; Rycovska, A.; Zickermann, V.; Kuhlbrandt, W. Macromolecular organization of ATP synthase and complex I in whole mitochondria. P Natl Acad Sci USA 2011, 108, 14121–14126. [Google Scholar] [CrossRef]
- Davies, K.M.; Anselmi, C.; Wittig, I.; Faraldo-Gomez, J.D.; Kuhlbrandt, W. Structure of the yeast F1Fo-ATP synthase dimer and its role in shaping the mitochondrial cristae. P Natl Acad Sci USA 2012, 109, 13602–13607. [Google Scholar] [CrossRef]
- Blum, T.B.; Hahn, A.; Meier, T.; Davies, K.M.; Kuhlbrandt, W. Dimers of mitochondrial ATP synthase induce membrane curvature and self-assemble into rows. P Natl Acad Sci USA 2019, 116, 4250–4255. [Google Scholar] [CrossRef] [PubMed]
- Davies, K.M.; Blum, T.B.; Kuhlbrandt, W. Conserved in situ arrangement of complex I and III2 in mitochondrial respiratory chain supercomplexes of mammals, yeast, and plants. P Natl Acad Sci USA 2018, 115, 3024–3029. [Google Scholar] [CrossRef] [PubMed]
- Guo, R.Y.; Gu, J.K.; Zong, S.; Wu, M.; Yang, M.J. Structure and mechanism of mitochondrial electron transport chain. Biomed J 2018, 41, 9–20. [Google Scholar] [CrossRef]
- Fox, G.E.; Magrum, L.J.; Balch, W.E.; Wolfe, R.S.; Woese, C.R. Classification of Methanogenic Bacteria by 16s Ribosomal-Rna Characterization. P Natl Acad Sci USA 1977, 74, 4537–4541. [Google Scholar] [CrossRef] [PubMed]
- Weimer, P.J.; Zeikus, J.G. Acetate Assimilation Pathway of Methanosarcina-Barkeri. J Bacteriol 1979, 137, 332–339. [Google Scholar] [CrossRef] [PubMed]
- Weimer, P.J.; Zeikus, J.G. Acetate Metabolism in Methanosarcina-Barkeri. Arch Microbiol 1978, 119, 175–182. [Google Scholar] [CrossRef] [PubMed]
- Buan, N.R. Methanogens: Pushing the boundaries of biology. Emerging Topics in Life Sciences 2018, 2, 629–646. [Google Scholar]
- Diender, M.; Stams, A.J.M.; Sousa, D.Z. Pathways and Bioenergetics of Anaerobic Carbon Monoxide Fermentation. Front Microbiol 2015, 6, 1275. [Google Scholar] [CrossRef]
- de Poorter, L.M.I.; Keltjens, J.T. Convenient fluorescence-based methods to measure membrane potential and intracellular pH in the Archaeon Methanobacterium thermoautotrophicum. J Microbiol Meth 2001, 47, 233–241. [Google Scholar] [CrossRef]
- Anukam, A.; Mohammadi, A.; Naqvi, M.; Granstrom, K. A Review of the Chemistry of Anaerobic Digestion: Methods of Accelerating and Optimizing Process Efficiency. Processes 2019, 7, 504. [Google Scholar] [CrossRef]
- Turker, L.; Gumus, S.; Tapan, A. Biohydrogen production: Molecular aspects. J Sci Ind Res India 2008, 67, 994–1016. [Google Scholar]
- Sheehan, D.P. Maxwell Zombies: Conjuring the Thermodynamic Undead. Am Sci 2018, 106, 234–241. [Google Scholar] [CrossRef]
- Sheehan, D.P.; Garamella, J.T.; Mallin, D.J.; Sheehan, W.F. Steady-state nonequilibrium temperature gradients in hydrogen gas-metal systems: Challenging the second law of thermodynamics. Phys Scripta 2012, 2012, 014030. [Google Scholar] [CrossRef]
- Sheehan, D.P. Infrared Cloaking, Stealth, and the Second Law of Thermodynamics. Entropy-Switz 2012, 14, 1915–1938. [Google Scholar] [CrossRef]
- Pal, P.S.; Rana, S.; Saha, A.; Jayannavar, A.M. Extracting work from a single heat bath: A case study of a Brownian particle under an external magnetic field in the presence of information. Phys Rev E 2014, 90, 022143. [Google Scholar] [CrossRef]
- Sheehan, D.P.; Mallin, D.J.; Garamella, J.T.; Sheehan, W.F. Experimental Test of a Thermodynamic Paradox. Found Phys 2014, 44, 235–247. [Google Scholar] [CrossRef]
- Serreli, V.; Lee, C.F.; Kay, E.R.; Leigh, D.A. A molecular information ratchet. Nature 2007, 445, 523–527. [Google Scholar] [CrossRef] [PubMed]
- Vologodskii, A.V.; Zhang, W.T.; Rybenkov, V.V.; Podtelezhnikov, A.A.; Subramanian, D.; Griffith, J.D.; Cozzarelli, N.R. Mechanism of topology simplification by type II DNA topoisomerases. P Natl Acad Sci USA 2001, 98, 3045–3049. [Google Scholar] [CrossRef]
- Jennings, R.C.; Belgio, E.; Zucchelli, G. Photosystem I, when excited in the chlorophyll Q(y) absorption band, feeds on negative entropy. Biophys Chem 2018, 233, 36–46. [Google Scholar] [CrossRef]
- Lee, J.W. Localized excess protons and methods of making and using the same. United States Patent Application Publication No. US 20170009357 A1 2017, (Copyright (C) 2017 American Chemical Society (ACS). All Rights Reserved.), 73pp.
- Lee, J.W. Isothermal electricity for energy renewal PCT International. WO 2019/136037 A1, 2019. [Google Scholar]
- Koski, J.V.; Maisi, V.F.; Pekola, J.P.; Averin, D.V. Experimental realization of a Szilard engine with a single electron. P Natl Acad Sci USA 2014, 111, 13786–13789. [Google Scholar] [CrossRef]
- Battail, G. Living Versus Inanimate: The Information Border. Biosemiotics-Neth 2009, 2, 321–341. [Google Scholar] [CrossRef]
- Khalid, K.A.A.; Leong, T.J.; Mohamed, K. Review on Thermionic Energy Converters. Ieee T Electron Dev 2016, 63, 2231–2241. [Google Scholar] [CrossRef]
- Yoshizumi, T.; Hayashi, K. Thermionic Electron Emission from a Mayenite Electride-Metallic Titanium Composite Cathode. Appl Phys Express 2013, 6, 015802. [Google Scholar] [CrossRef]
- Dominguez-Andrade, H.; Anaya, J.; Croot, A.; Cattelan, M.; Twitchen, D.J.; Kuball, M.; Fox, N.A. Correlating Thermionic Emission with Specific Surface Reconstructions in a <100> Hydrogenated Single-Crystal Diamond. ACS Appl Mater Interfaces 2020, 12, 26534–26542. [Google Scholar] [PubMed]
- Duncan, T.L. Comment on ``Dynamically maintained steady-state pressure gradients''. Phys Rev E 2000, 61, 4661. [Google Scholar] [CrossRef] [PubMed]
- Sheehan, D.P.; Hebert, M.R.; Keogh, D.M. Concentration cell powered by a chemically asymmetric membrane: Experiment. Sustainable Energy Technologies and Assessments 2022, 52, 102194. [Google Scholar] [CrossRef]
- Sheehan, D.P. A Self-Charging Concentration Cell: Theory. Batteries 2023, 9, 372. [Google Scholar] [CrossRef]
- Fu, X.; Fu, Z. Realization of Maxwell’s Hypothesis An Experiment of Heat-Electric Conversion in Contradiction to the Kelvin Statement. Preprints (www.preprints.org) 2020.
- Fu, X.; Fu, Z. Realization of Maxwell’s Hypothesis: A Heat-Electric Conversion in Contradiction to the Kelvin Statement. In Preprints, Preprints: 2016.
- Fu, X. An approach to realize Maxwell's hypothesis. Energy Conversion and Management 1982, 22, 1–3. [Google Scholar] [CrossRef]
- Fu, X.; Fu, Z. Realization of Maxwell's Hypothesis. arXiv: General Physics 2003.
- Fu, X.; Fu, Z. Another Way To Realize Maxwell's Demon. arXiv: General Physics 2005.
- Perminov, A.; Nikulov, A. Transformation of Thermal Energy into Electric Energy via Thermionic Emission of Electrons from Dielectric Surfaces in Magnetic Fields. AIP Conference Proceedings 2011, 1411, 82–100. [Google Scholar]
- Gurtovoi, V.L.; Antonov, V.N.; Exarchos, M.; Il'in, A.I.; Nikulov, A.V. The dc power observed on the half of asymmetric superconducting ring in which current flows against electric field. Physica C 2019, 559, 14–20. [Google Scholar] [CrossRef]
- Nikulov, A. The Law of Entropy Increase and the Meissner Effect. Entropy (Basel) 2022, 24, 83. [Google Scholar] [CrossRef] [PubMed]
- Nikulov, A.V. Dynamic processes in superconductors and the laws of thermodynamics. Physica C 2021, 589, 1353934. [Google Scholar] [CrossRef]
- Capek, V.; Bok, J. A thought construction of working perpetuum mobile of the second kind. Czech J Phys 1999, 49, 1645–1652. [Google Scholar] [CrossRef]
- Saslow, W.M. A History of Thermodynamics: The Missing Manual. Entropy 2020, 22, 77. [Google Scholar] [CrossRef] [PubMed]
- Mangum, J.M.; Harerimana, F.; Gikunda, M.N.; Thibado, P.M. Mechanisms of Spontaneous Curvature Inversion in Compressed Graphene Ripples for Energy Harvesting Applications via Molecular Dynamics Simulations. Membranes 2021, 11, 516. [Google Scholar] [CrossRef] [PubMed]
- Sheehan, D.P.; Moddel, G.; Lee, J.W. More on the demons of thermodynamics. Phys Today 2023, 76, 13. [Google Scholar] [CrossRef]
- Nikulov, A. Observations of Persistent Current at Non-Zero Resistance: Challenge to the Second Law of Thermodynamics. Second Law of Thermodynamics: Status and Challenges 2011, 1411, 122–144. [Google Scholar]
- Nikulov, A. The Law of Entropy Increase and the Meissner Effect. Entropy-Switz 2022, 24, 83. [Google Scholar] [CrossRef]
- Eling, C.; Bekenstein, J.D. Challenging the generalized second law. Phys Rev D 2009, 79, 024019. [Google Scholar] [CrossRef]
- Cápek, V.; Sheehan, D.P. SpringerLink Challenges to the second law of thermodynamics : Theory and experiment, 1st ed.; Springer: Netherlands: Dordrecht, 2005. [Google Scholar]
- Lee, J.W. Type-B Energy Process: Asymmetric Function-Gated Isothermal Electricity Production. Energies 2022, 15, 7020. [Google Scholar] [CrossRef]
Figure 1.
Gibbs free energy graph revealing a Type-B energetic process: thermotrophic feature. Calculated total pmf energy (), local pmf energy () and classic pmf energy () of Bacillus pseudofirmus OF4 as a function of external pH compared to the minimally required Giggs free energy (−11 kJ/mol) required to synthesize ATP and to the maximum chemical energy (redox potential energy limit: −22 kJ/mol) that could be supported thermodynamically by the type-A energetic process through the respiratory redox-driven proton pump system. The measured cell population growth doubling times, reproduced from Figure 1c of Ref. [21], are also superimposed.
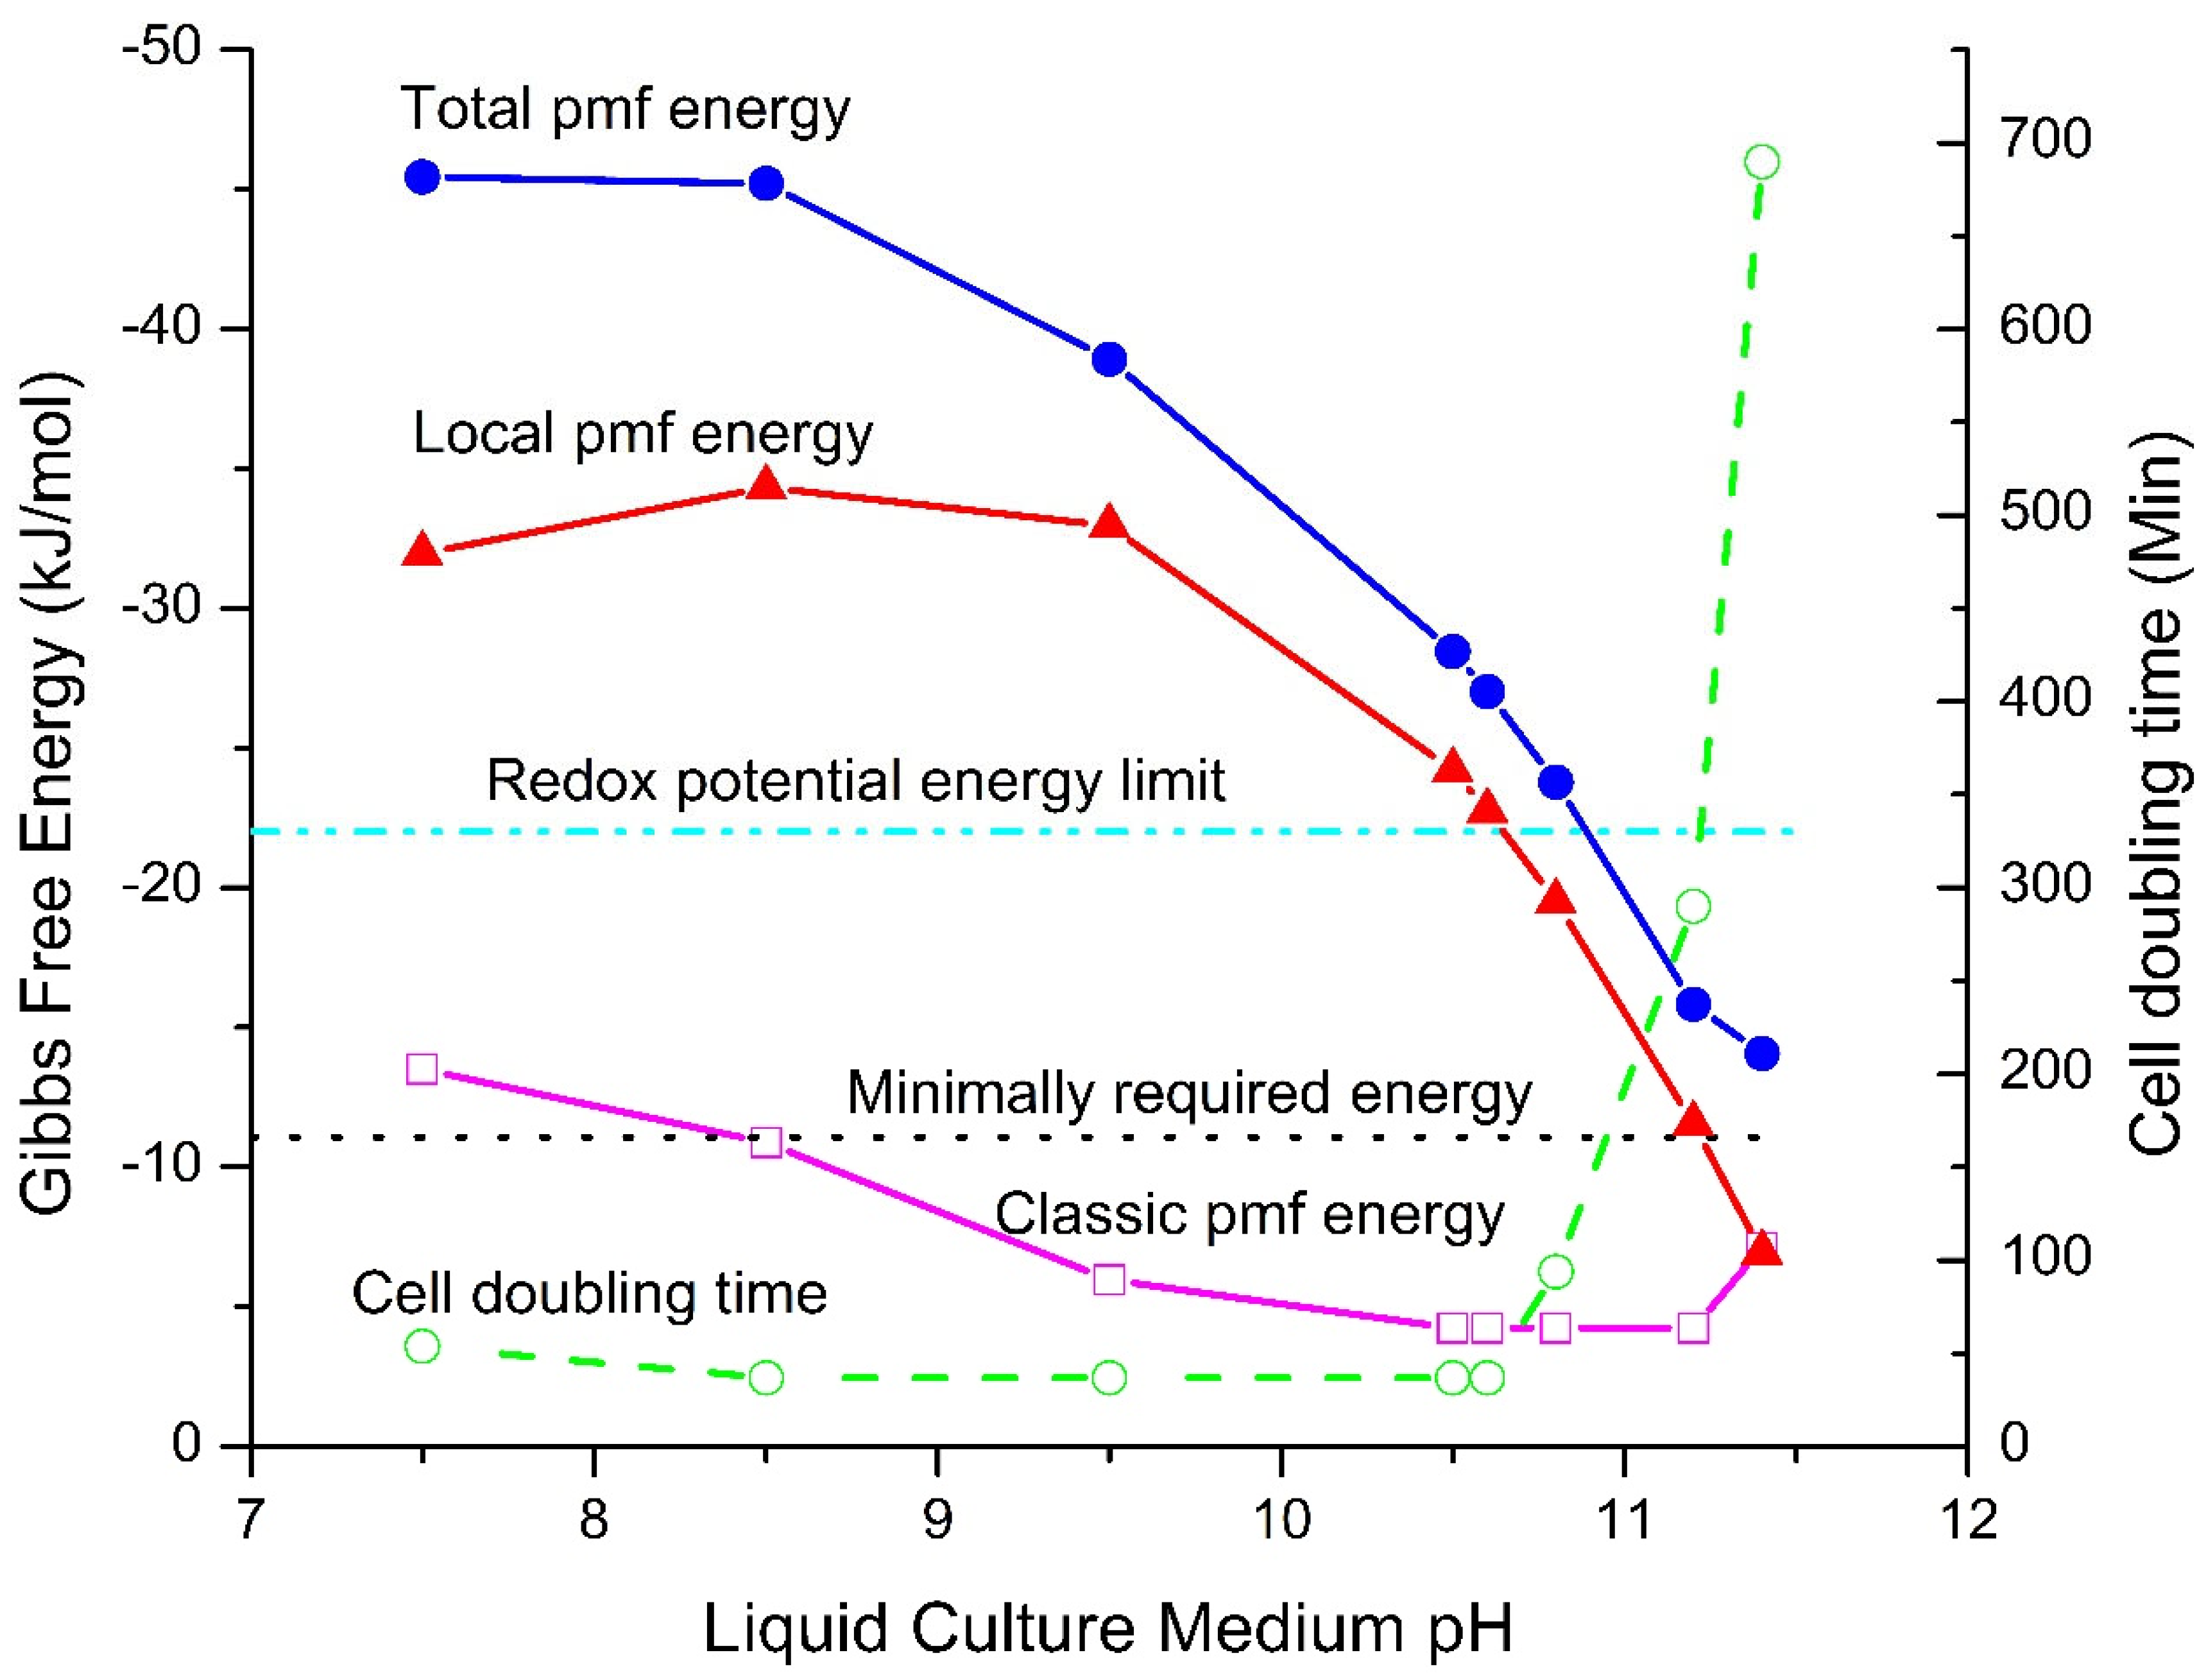
Figure 2.
The transmembrane asymmetric structure is one of the key factors that enables isothermal environmental heat energy utilization as a Type-B process to do useful work in driving ATP synthesis in the matrix (M) side. This figure presents the known structures of mitochondrial respiratory membrane protein complexes I, II, III, IV, and FoF1-ATP synthase (complex V) in relation to the location of the inner membrane (IM) surfaces indicated by the horizontal dotted lines. The thickness of the membrane lipid bilayer (in between two dotted lines) is known to be about 4 nm, with which as a reference frame, the protonic outlets of the proton pumping complexes I, III and IV are seen to be all protruded by about 1-3 nm into the bulk liquid phase of the intermembrane space (IMS) while the protonic inlet of F0F1-ATP synthase (complex V) is located at the transmembrane-electrostatically localized proton layer along the membrane surface. Adapted from Ref. [8], which was adapted and modified from a schematic representation of the oxidative-respiratory phosphorylation system given in Ref. [31].
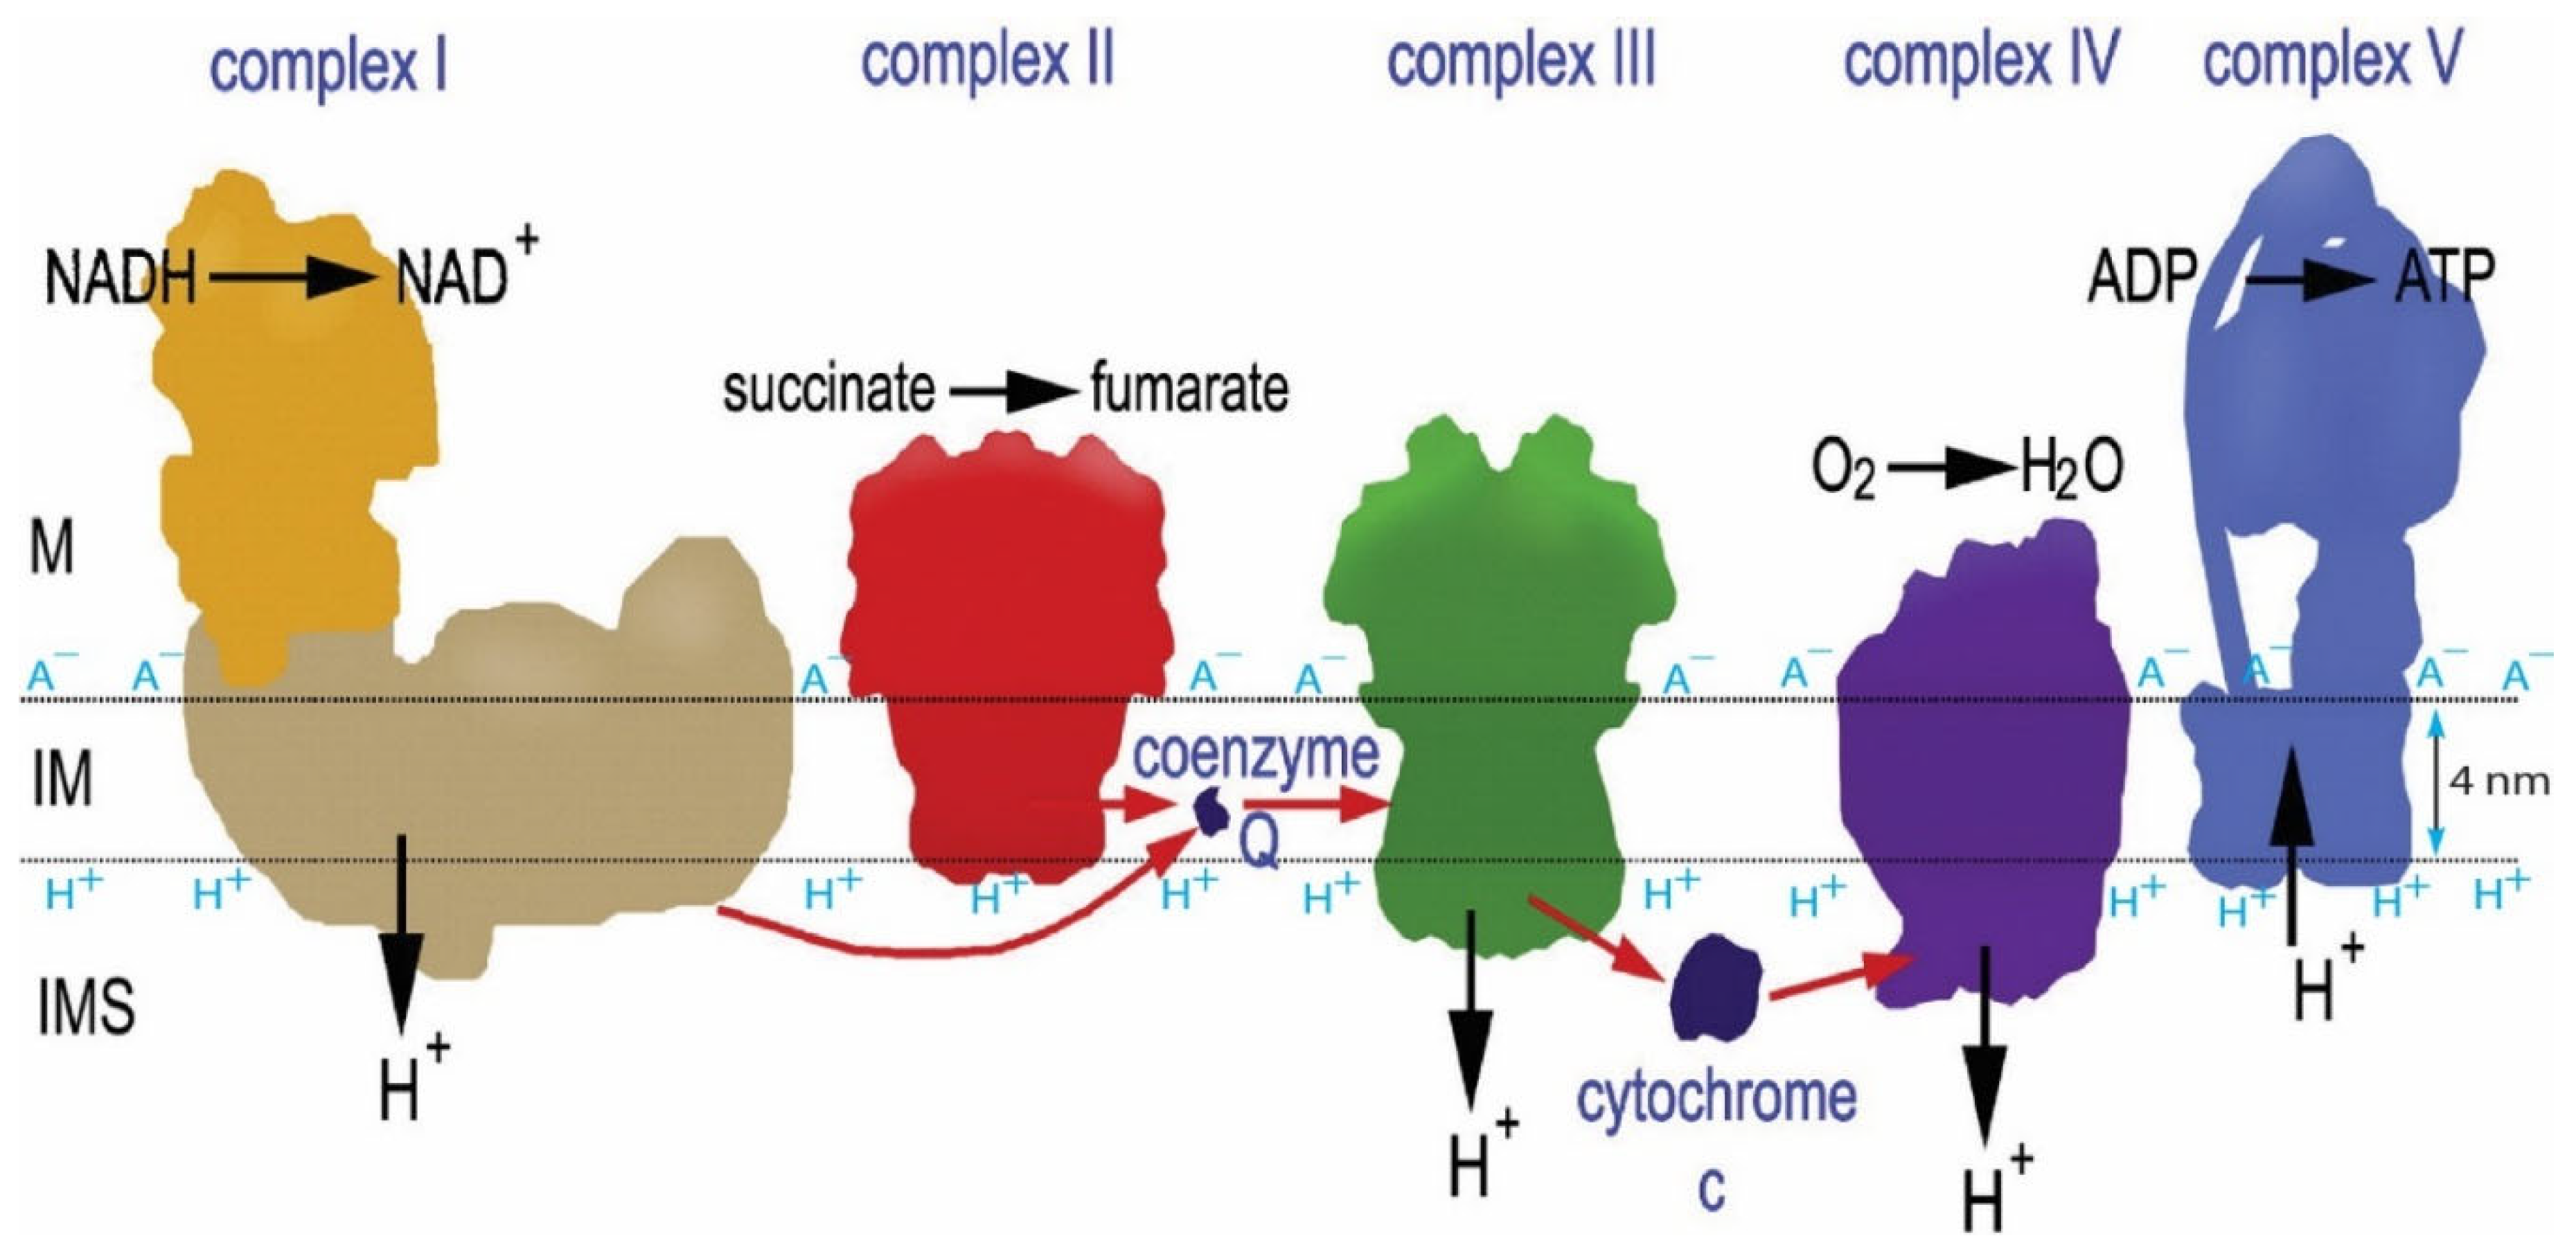
Figure 3.
The protonic capacitor formation through transmembrane-electrostatic proton localization is another key factor that enables isothermal environmental heat energy utilization as a Type-B process to do useful work in driving ATP synthesis. This figure illustrates the lateral asymmetric feature resulted from the geometric effect of mitochondrial membrane cristae which enhances the density of transmembrane electrostatically localized protons at the cristae tips (left and right ends of the crista ellipse shown) where the FoF1-ATP synthase enzymes reside in contrast to that at the relatively flat membrane region where the proton pumping complexes I, III and IV stay as shown in a cross section for an ellipsoidal-shaped mitochondrial crista. Adapted from Ref. [7].
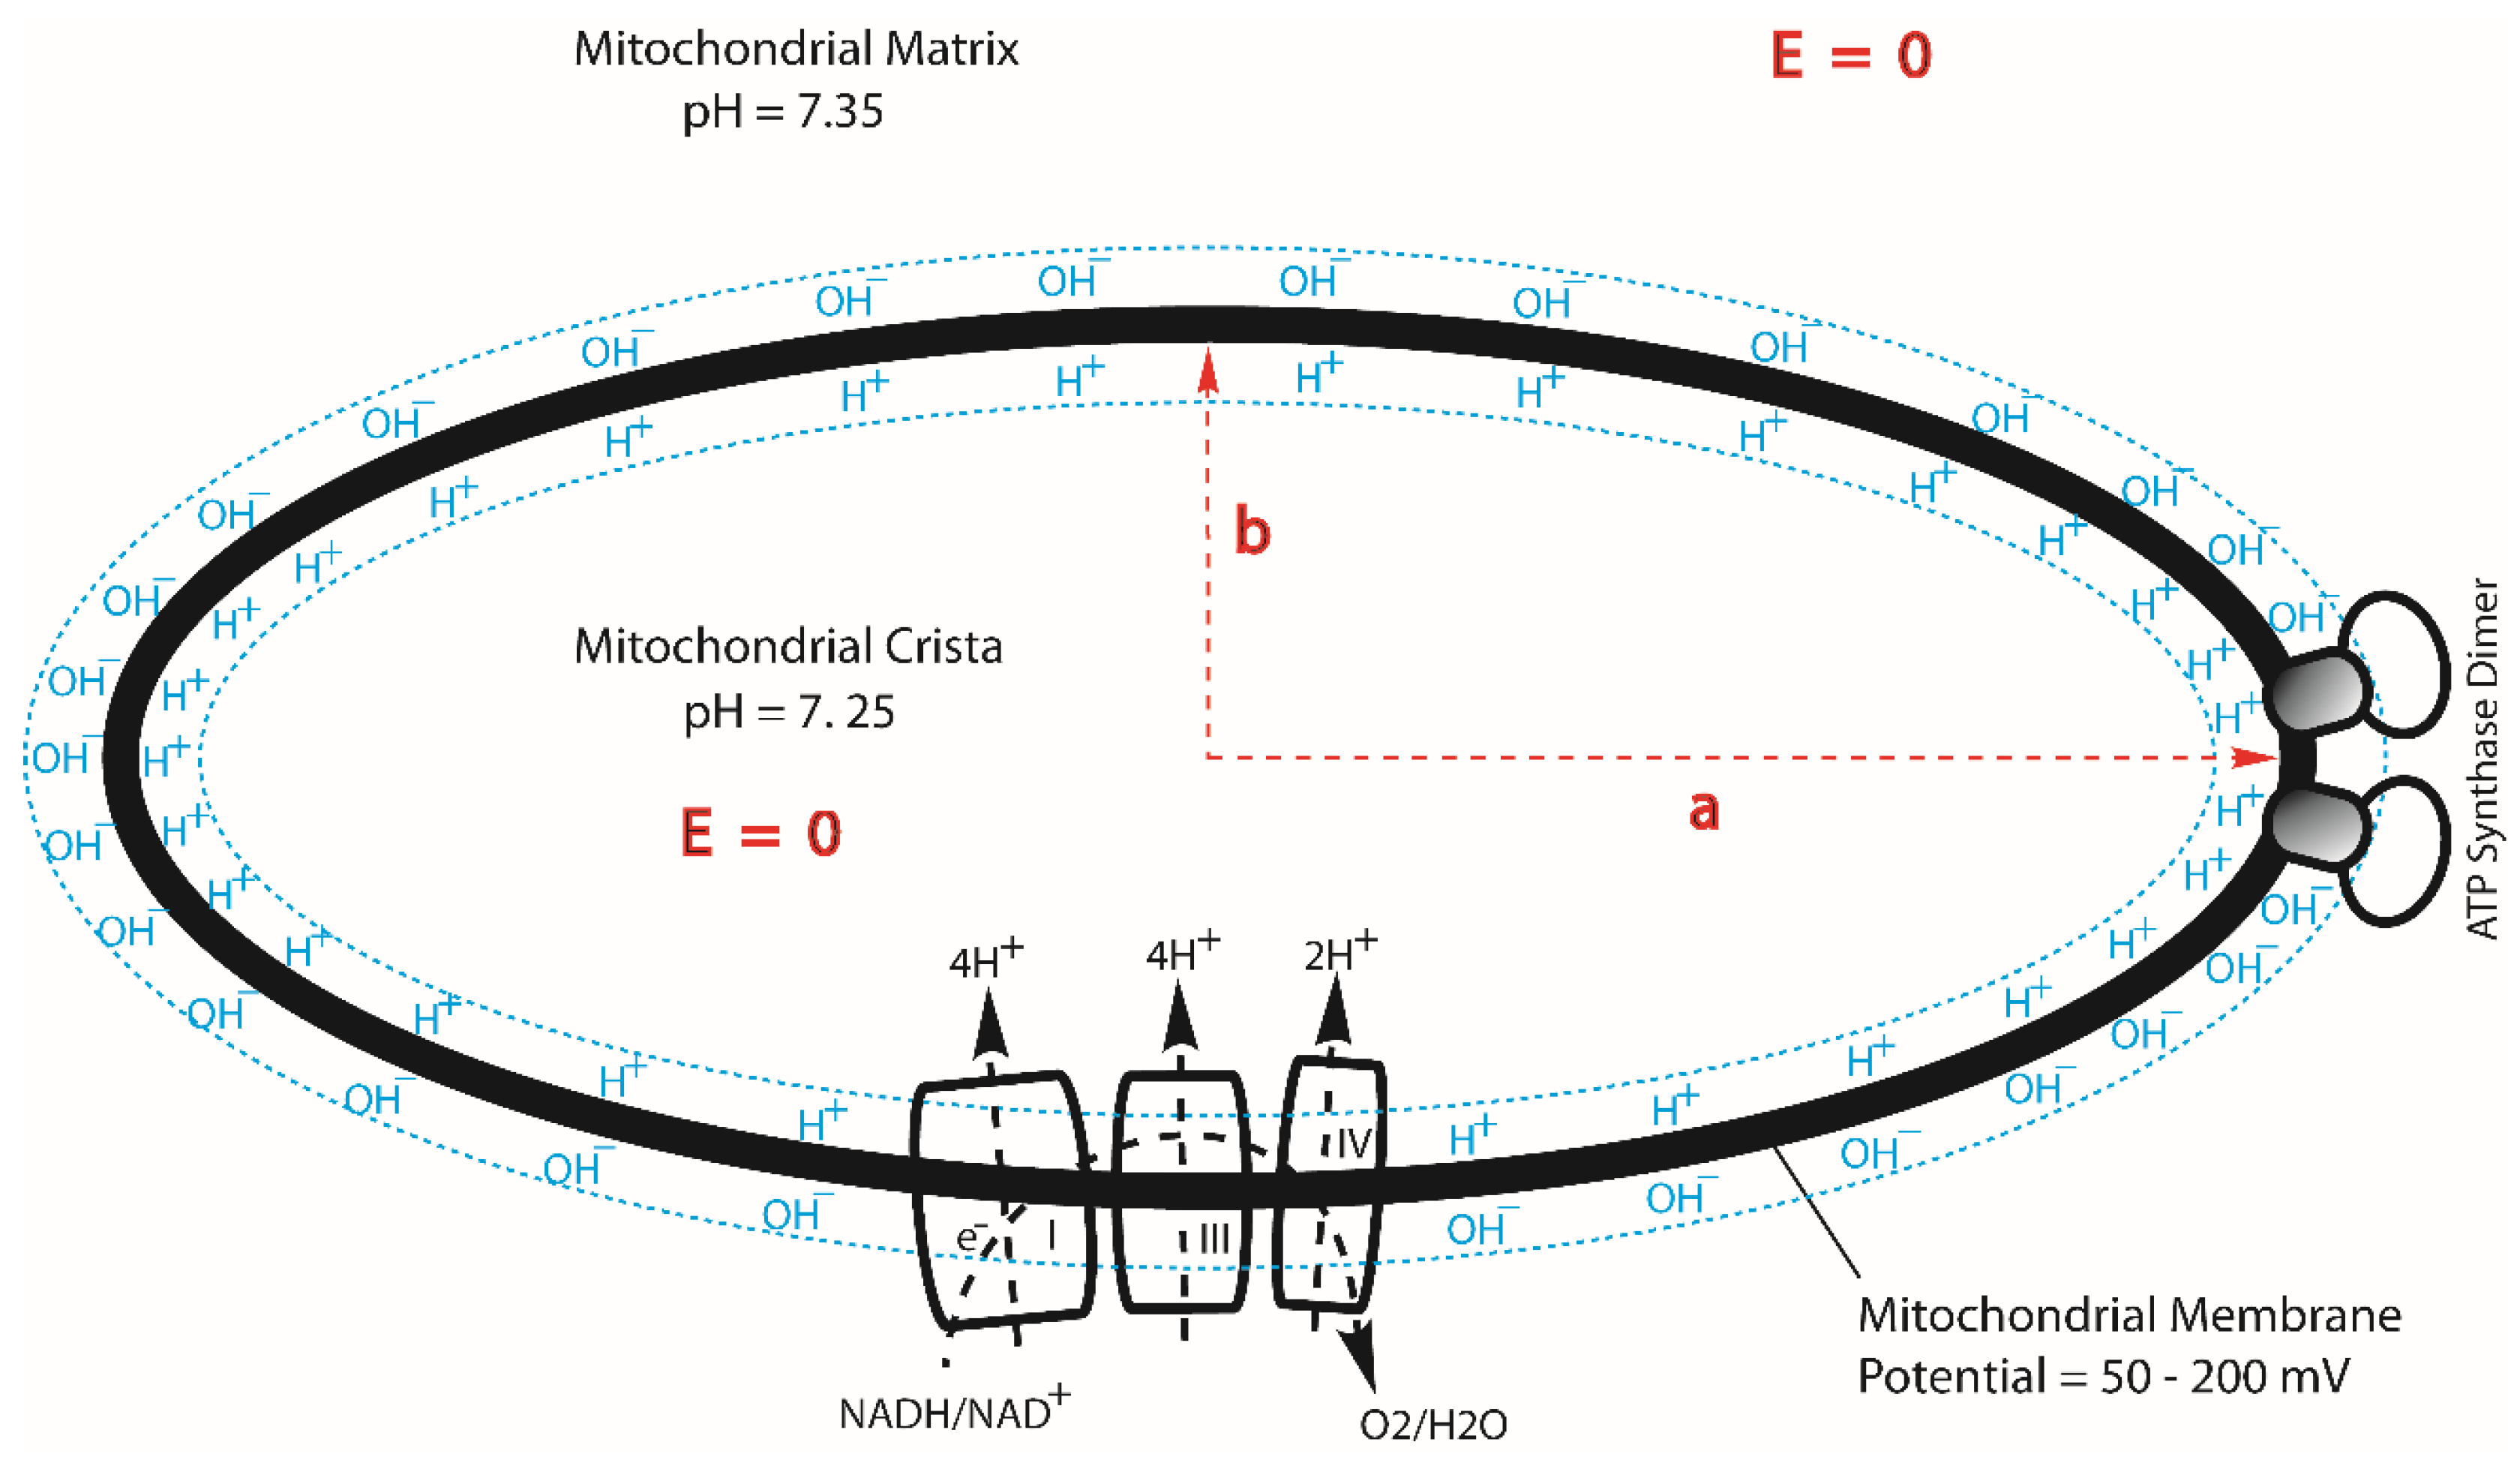
Figure 4.
presents an integrated isothermal electricity generator system 1300 that comprises multiple (e.g., three) pairs of emitters and collectors working in series. Adapted from ref. [55].
Figure 4.
presents an integrated isothermal electricity generator system 1300 that comprises multiple (e.g., three) pairs of emitters and collectors working in series. Adapted from ref. [55].
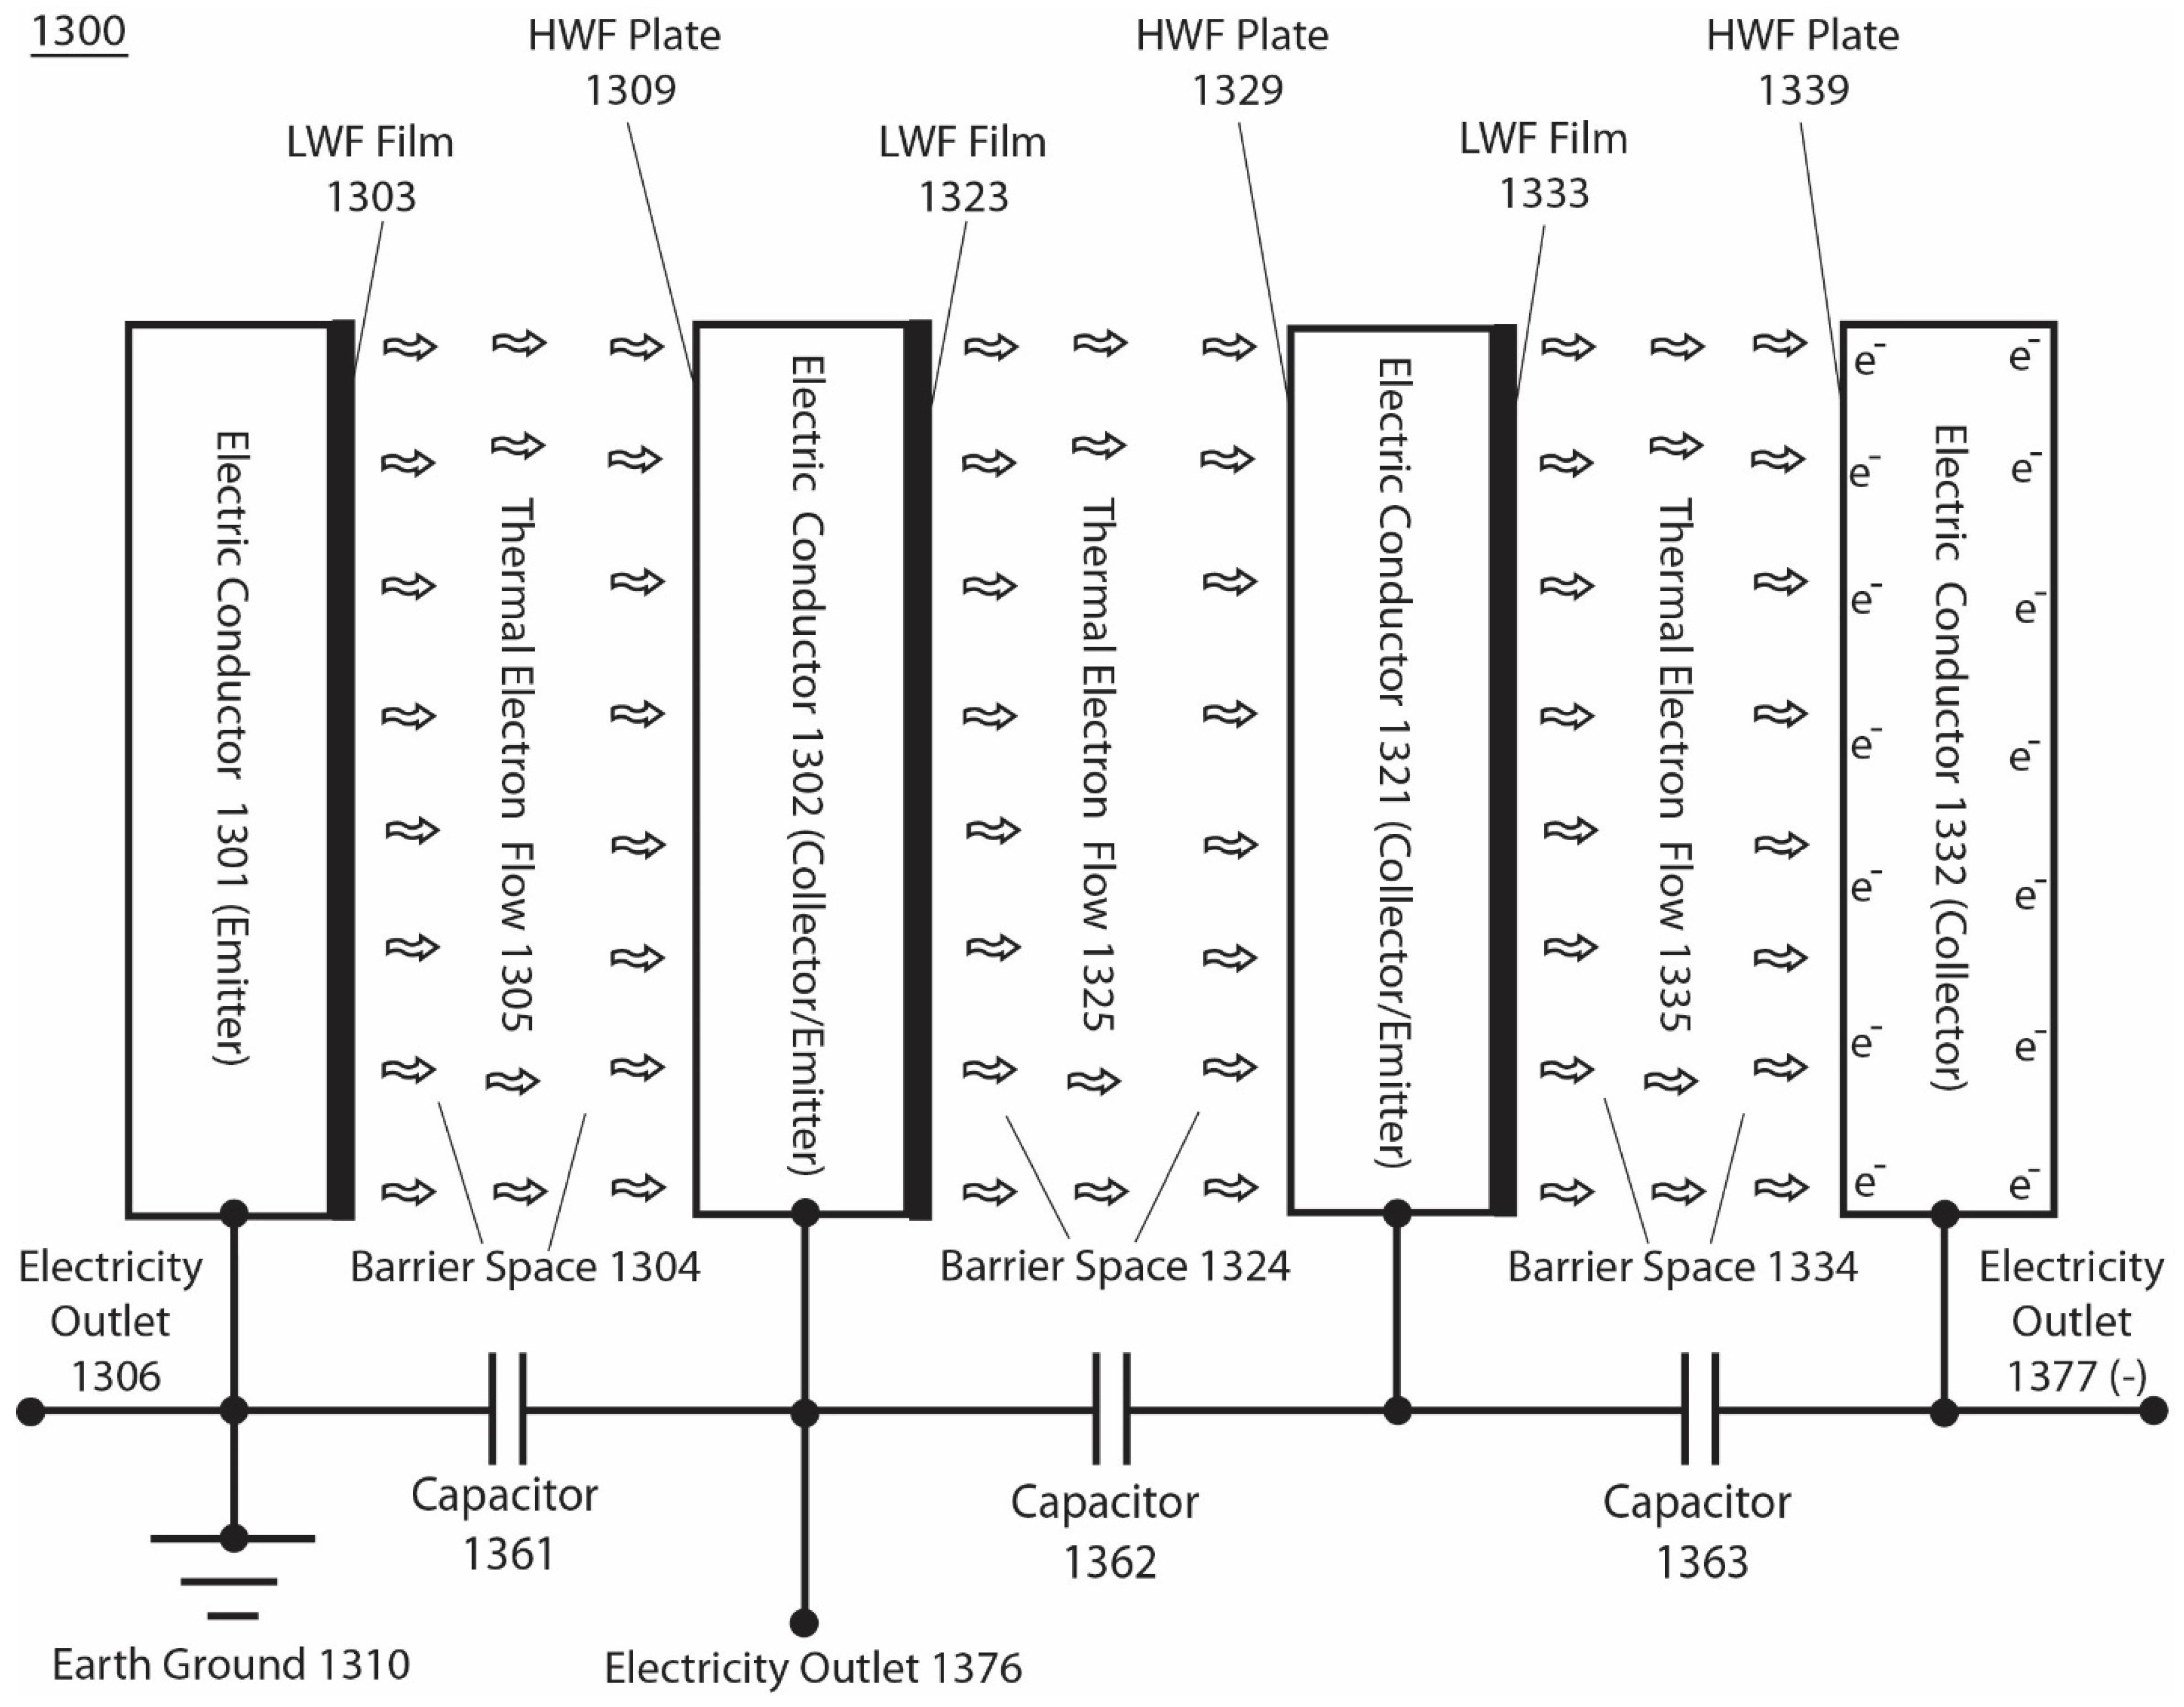
Figure 5.
presents examples of the isothermal electron current density (A/cm2) curves as a function of output voltage V(c) volts from 0.00 to 4.10 V at an operating environmental temperature of 273, 293, 298, or 303 K for a pair of emitter work function (0.50 eV) and collector work function (4.60 eV), with the emitter grounded. Adapted from Ref. [55].
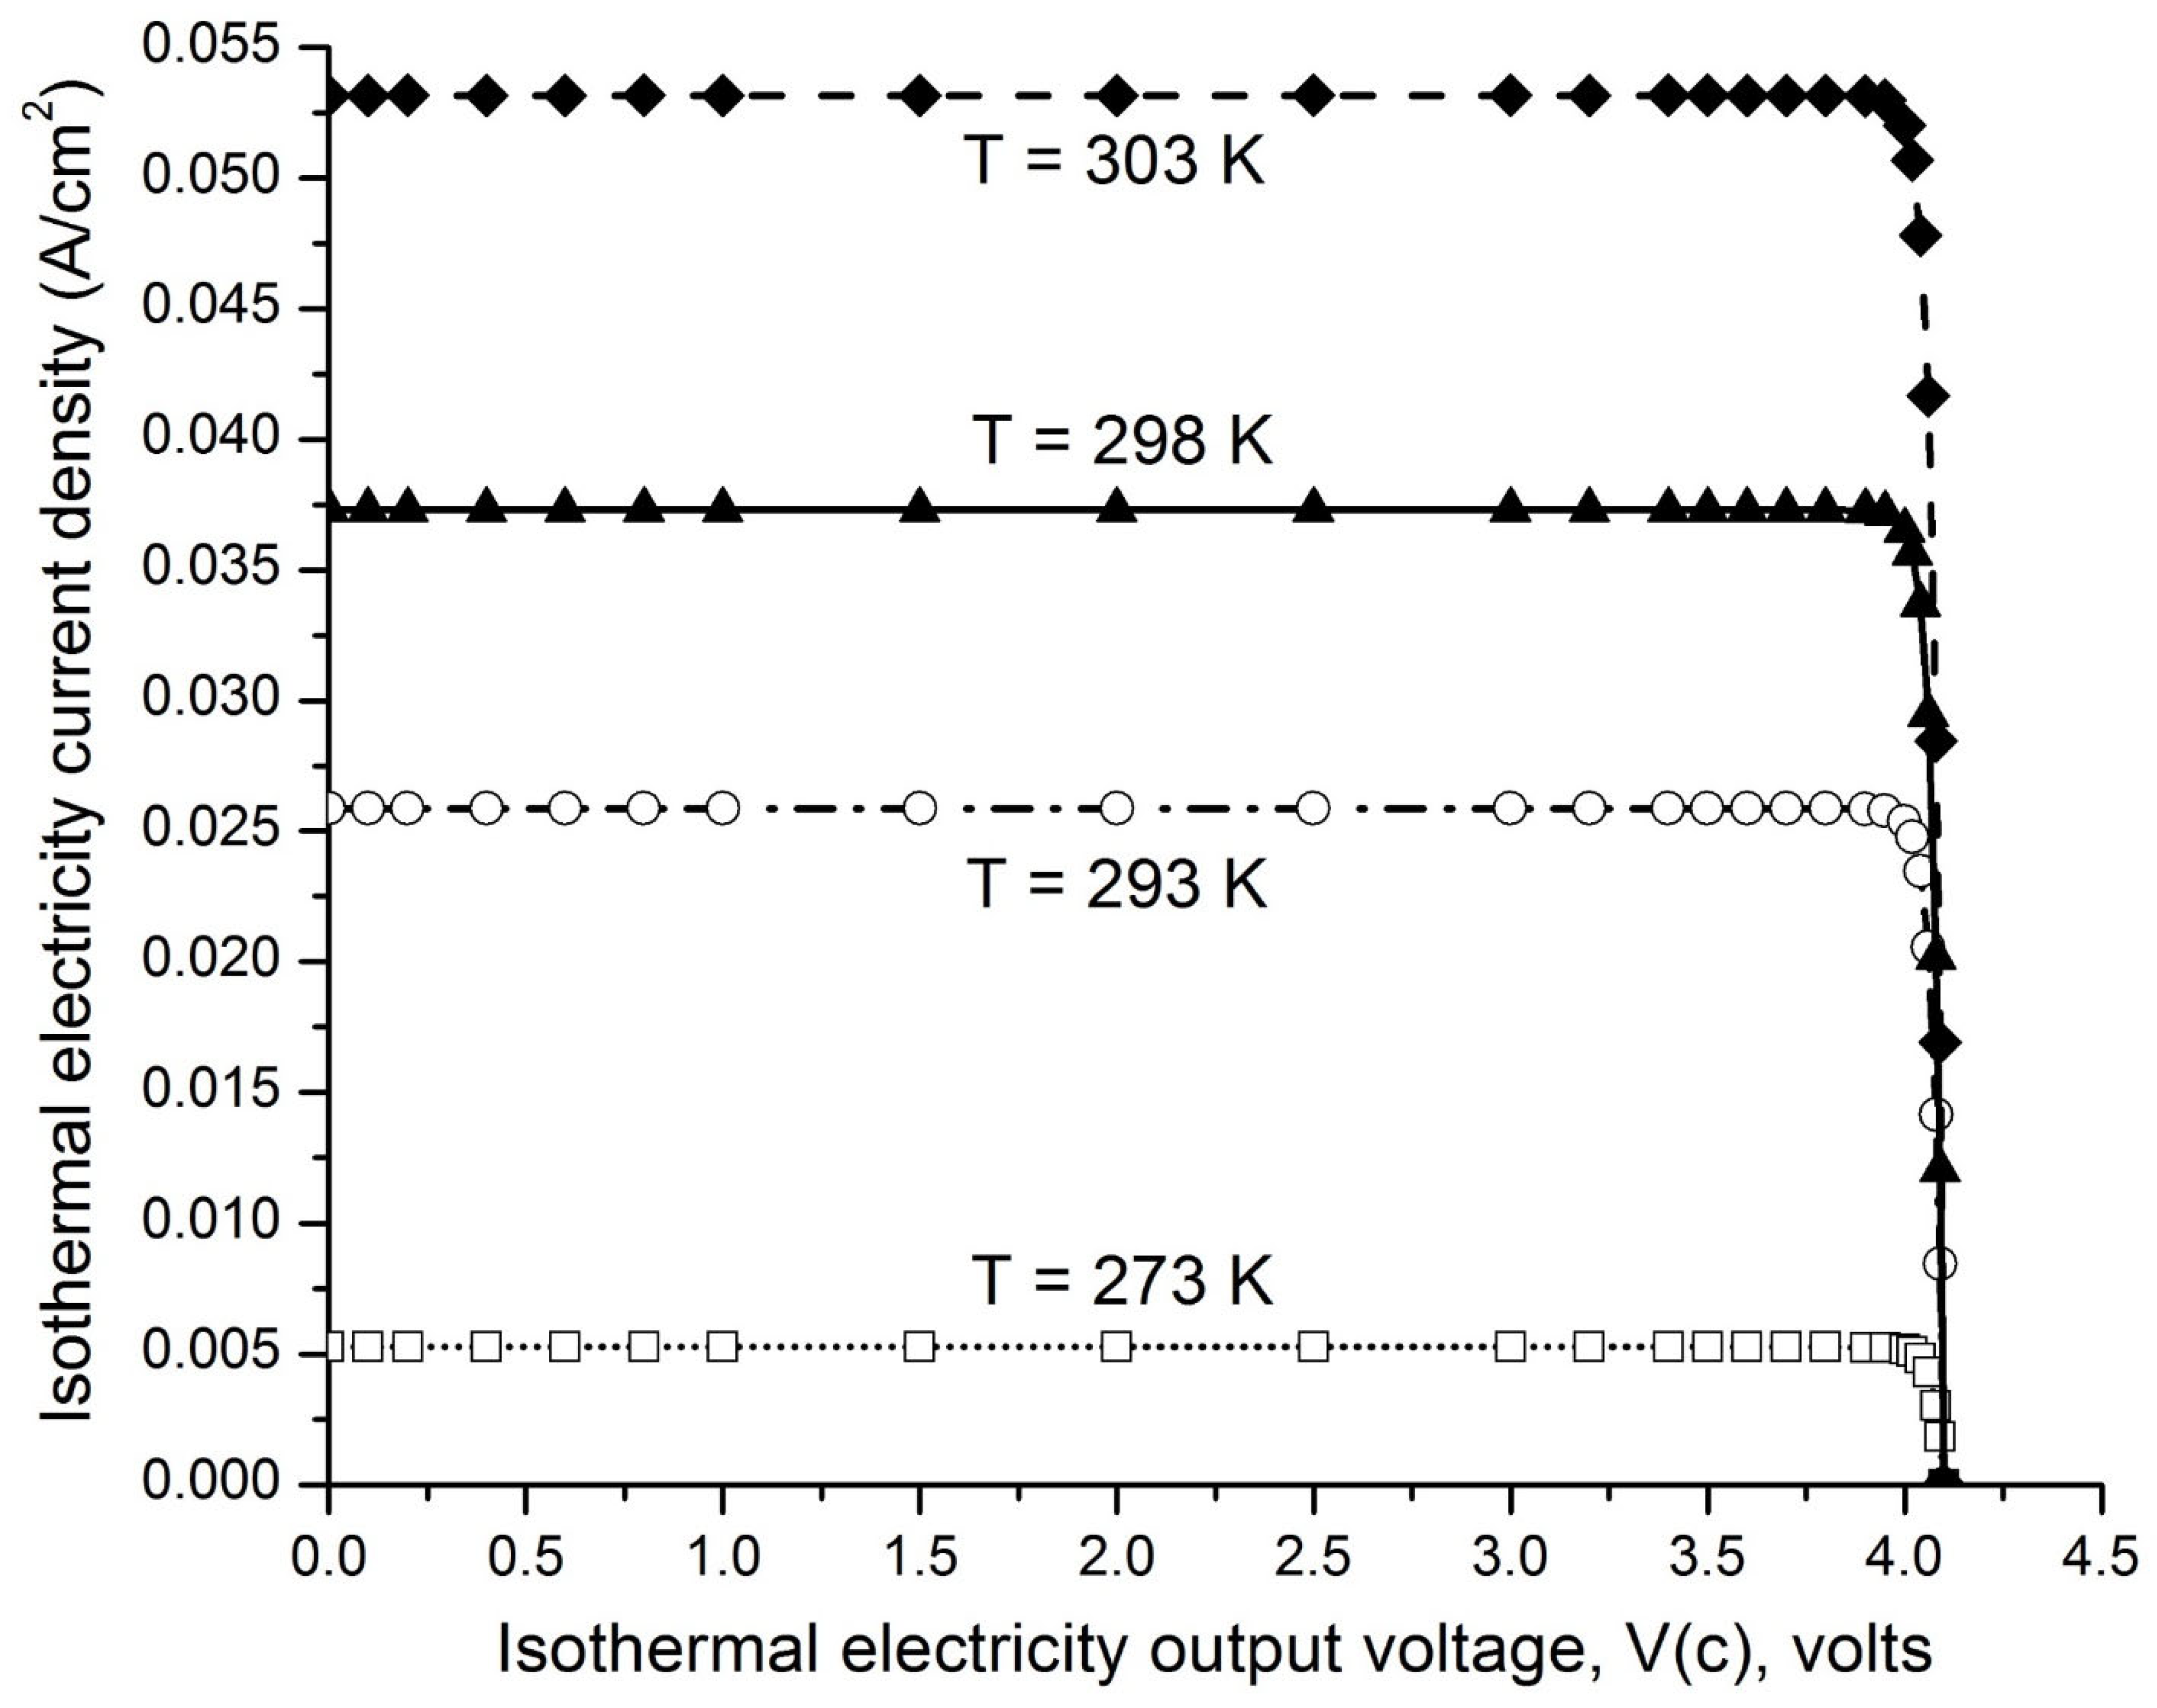
Figure 7.
Fu’s experiment: thermal electrons’ motion with or without a magnetic field. Adapted with Prof. Fu’s permission from ref. [64].
Figure 7.
Fu’s experiment: thermal electrons’ motion with or without a magnetic field. Adapted with Prof. Fu’s permission from ref. [64].
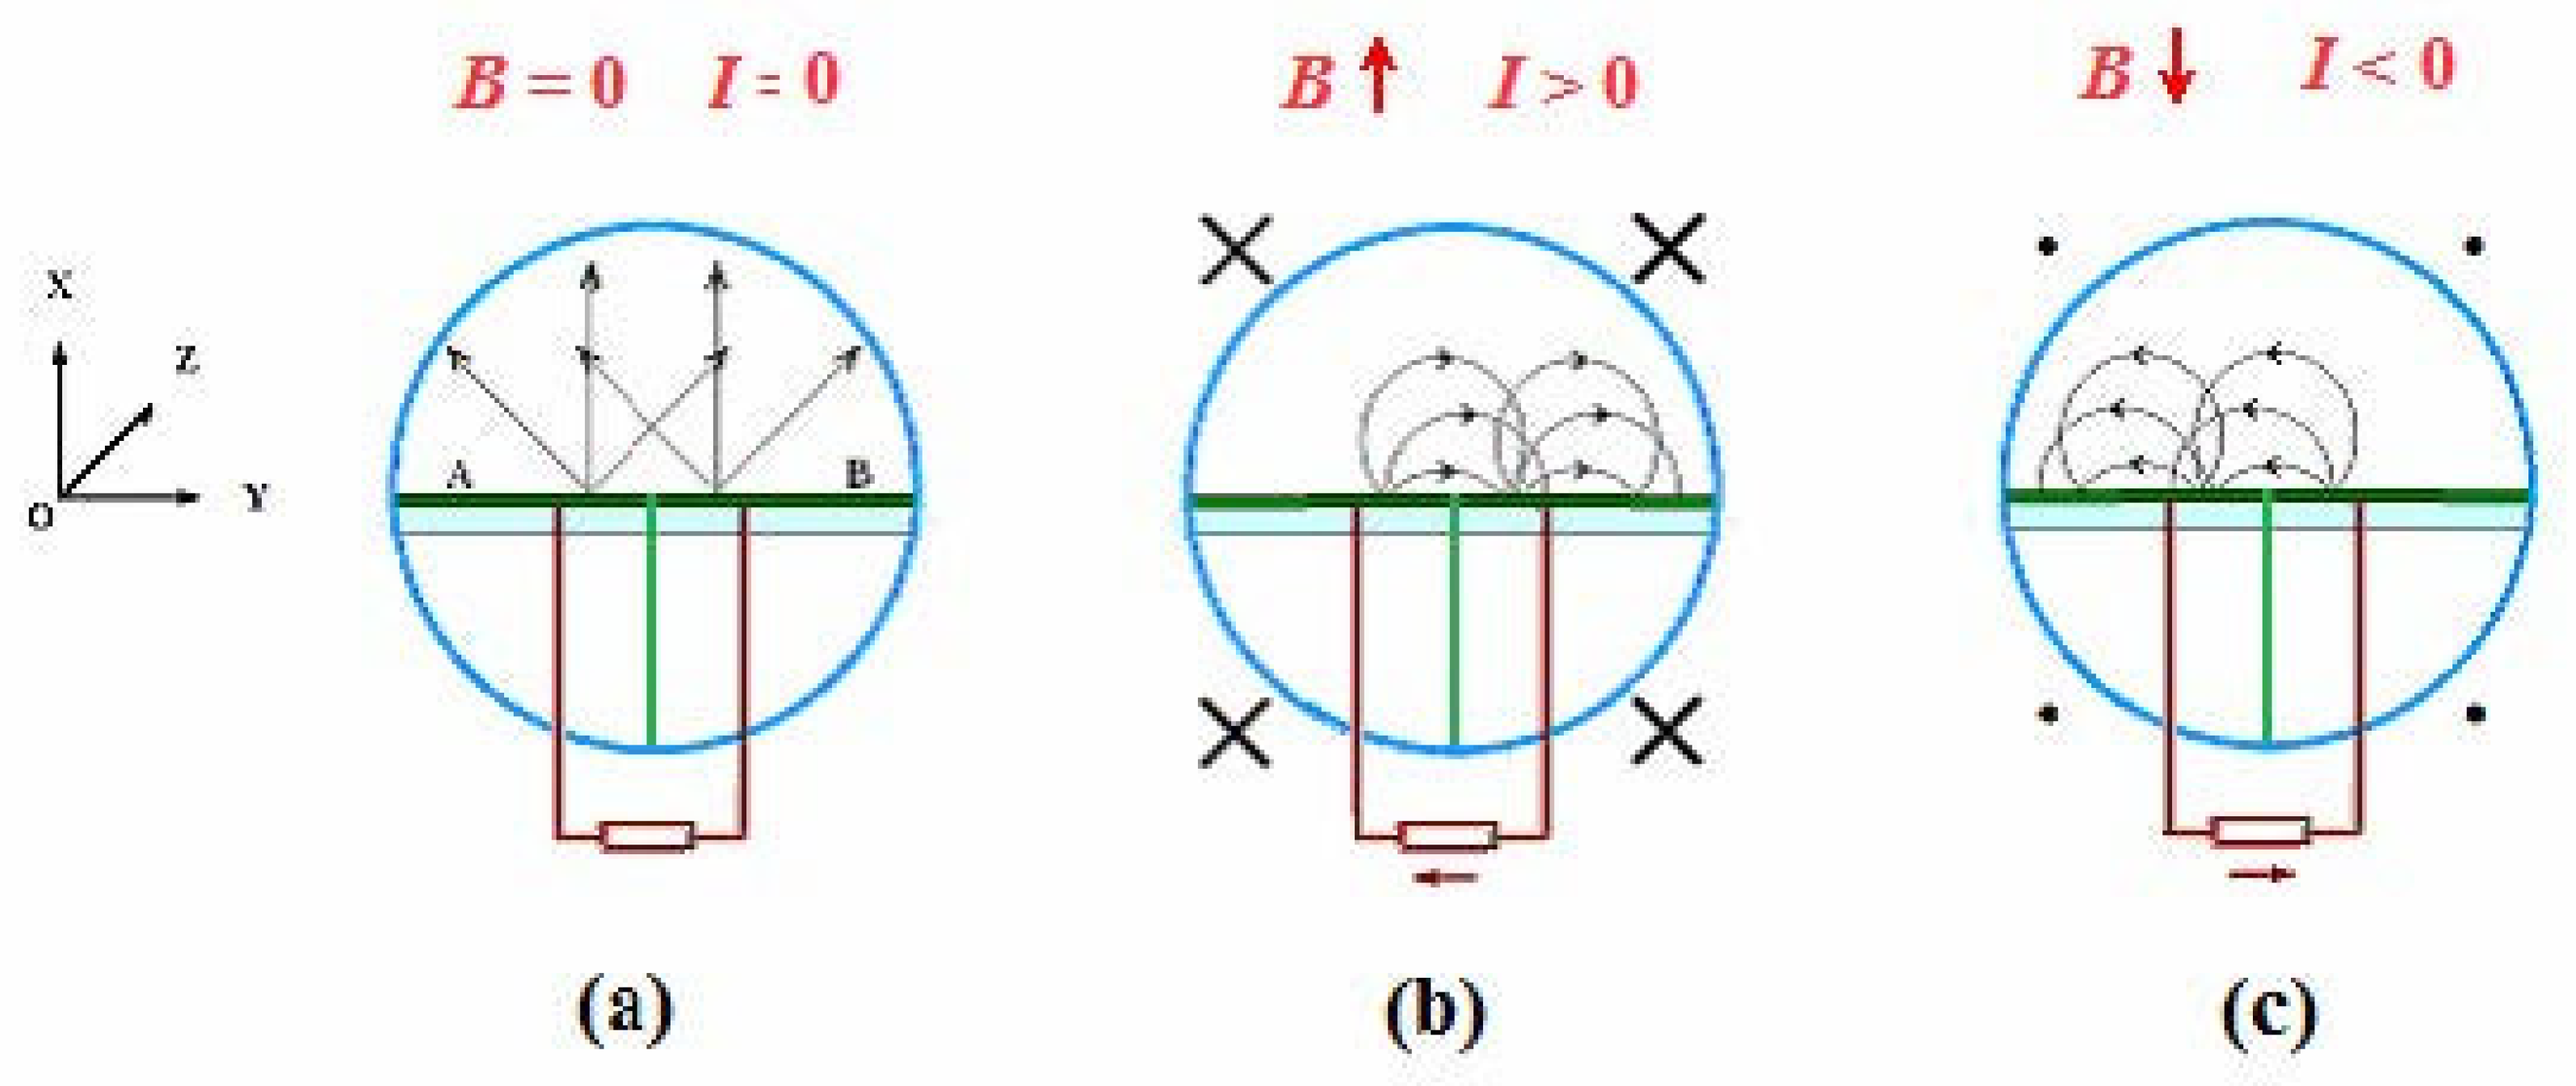
Figure 8.
The electric current (I) measured from the electrotube FX12-51 at a series of static uniform magnetic field B at 22 oC. Adapted with Prof. Fu’s permission from ref. [64].
Figure 8.
The electric current (I) measured from the electrotube FX12-51 at a series of static uniform magnetic field B at 22 oC. Adapted with Prof. Fu’s permission from ref. [64].
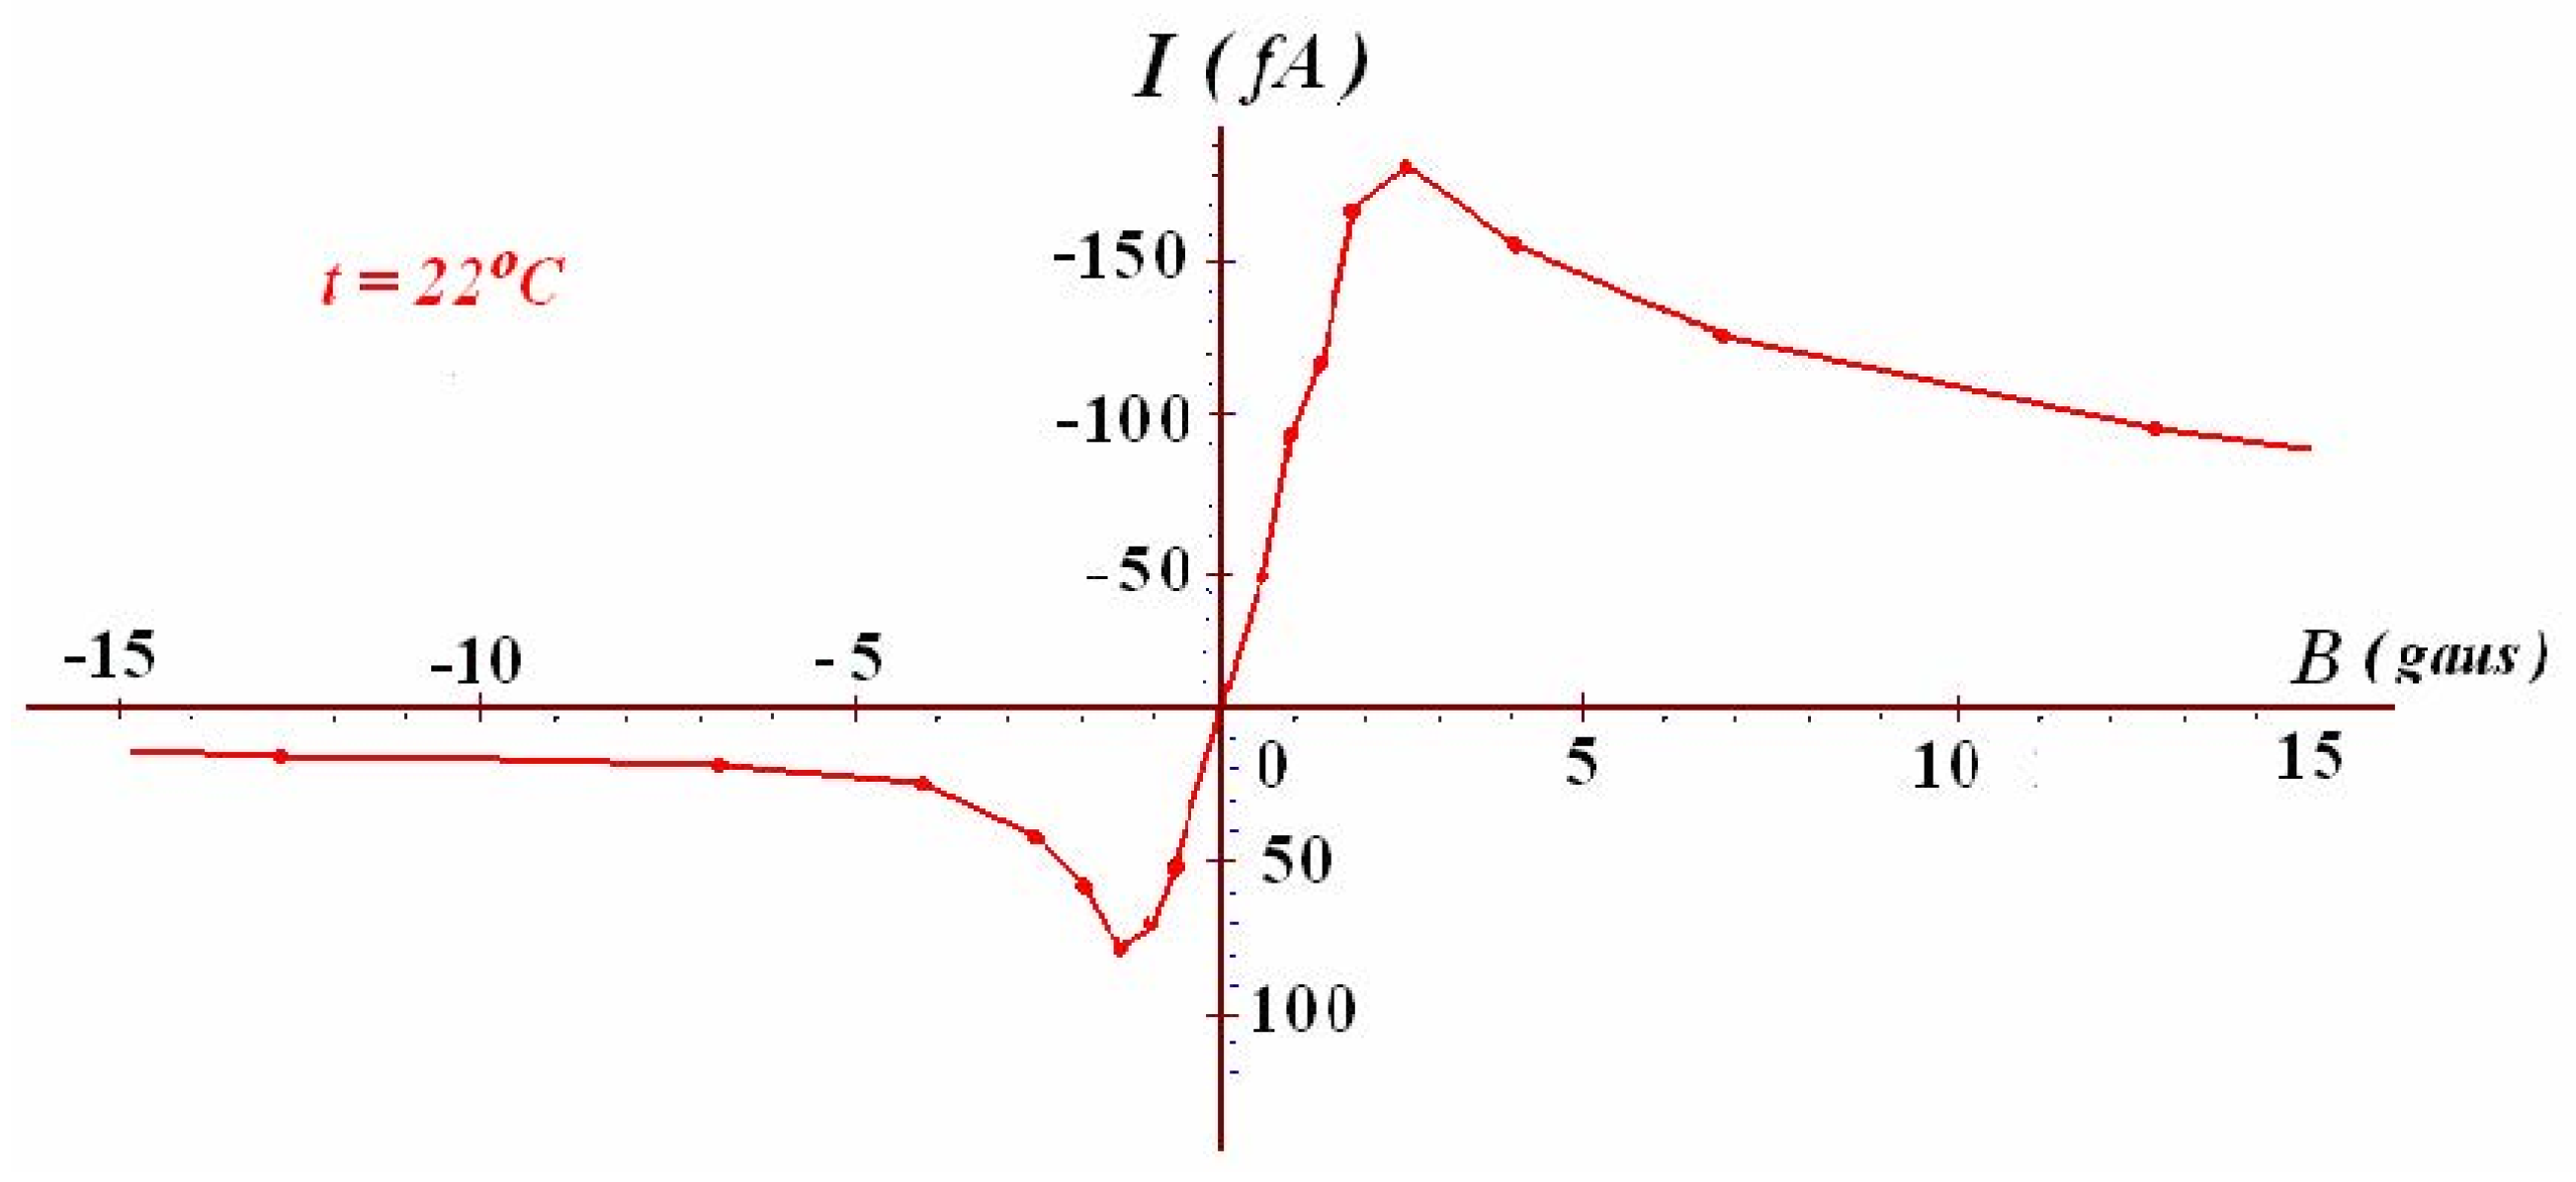

Table 1.
Calculated data of mitochondrial protonic thermotrophy including the transmembrane-electrostatically localized protons (TELP) density per membrane surface area ( per µm2), TELP concentration () at the liquid-membrane interface, TELP formation entropy change (), the classic protonic Gibbs free energy (), the local protonic Gibbs free energy () and the total protonic Gibbs free energy () calculated as a function of transmembrane potential using Eqs. 1−5 based on the measured properties (, with the known reaction medium compositions of ref. [24] and the experimental measurements of pH across the membrane-embedded FoF1-ATP synthase [25]. The cation concentrations, proton-cation exchange equilibrium constants and cation exchange reduction factor (1.29) are from Ref. [5,7]; and the temperature T = 310 K. Adapted and updated from Refs. [5,11,12], through the latest calculation using the mitochondrial inner membrane capacitance of 0.55 µf/cm2 independently determined experimentally [23] and the FoF1-ATP synthase physiological phosphorylation potential of +55.3 kJ mol−1 calculated from the measurements in mitochondrial matrix [26].
|
mV |
per µm2 |
mM |
J/K·mol |
kJ/mol |
kJ/mol |
kJ/mol |
kJ/mol |
kJ/mol |
||
|---|---|---|---|---|---|---|---|---|---|---|
| 50 | 7.3 | 7.4 | 1330 | 2.21 | −88.8 | −5.42 | −27.5 | −32.9 | −20.7 | −22.0 |
| 55 | 7.3 | 7.4 | 1460 | 2.43 | −89.6 | −5.90 | −27.8 | −33.7 | −20.7 | −22.0 |
| 60 | 7.3 | 7.4 | 1600 | 2.65 | −90.3 | −6.38 | −28.0 | −34.4 | −20.7 | −22.0 |
| 65 | 7.3 | 7.4 | 1730 | 2.87 | −91.0 | −6.86 | −28.2 | −35.1 | −20.7 | −22.0 |
| 70 | 7.3 | 7.4 | 1860 | 3.09 | −91.6 | −7.35 | −28.4 | −35.7 | −20.7 | −22.0 |
| 75 | 7.3 | 7.4 | 2000 | 3.31 | −92.2 | −7.83 | −28.6 | −36.4 | −20.7 | −22.0 |
| 80 | 7.3 | 7.4 | 2130 | 3.54 | −92.7 | −8.31 | −28.7 | −37.1 | −20.7 | −22.0 |
| 90 | 7.3 | 7.4 | 2400 | 3.98 | −93.7 | −9.28 | −29.0 | −38.3 | −20.7 | −22.0 |
| 100 | 7.3 | 7.4 | 2660 | 4.42 | −94.6 | −10.2 | −29.3 | −39.6 | −20.7 | −22.0 |
| 110 | 7.3 | 7.4 | 2930 | 4.86 | −95.4 | −11.2 | −29.6 | −40.8 | −20.7 | −22.0 |
| 120 | 7.3 | 7.4 | 3190 | 5.30 | −96.1 | −12.2 | −29.8 | −42.0 | −20.7 | −22.0 |
| 130 | 7.3 | 7.4 | 3460 | 5.74 | −96.7 | −13.1 | −30.0 | −43.1 | −20.7 | −22.0 |
| 140 | 7.3 | 7.4 | 3730 | 6.19 | −97.4 | −14.1 | −30.2 | −44.3 | −20.7 | −22.0 |
| 150 | 7.3 | 7.4 | 3990 | 6.63 | −97.9 | −15.1 | −30.4 | −45.4 | −20.7 | −22.0 |
| 160 | 7.3 | 7.4 | 4260 | 7.07 | −98.5 | −16.0 | −30.5 | −46.6 | −20.7 | −22.0 |
| 170 | 7.3 | 7.4 | 4520 | 7.51 | −99.0 | −17.0 | −30.7 | −47.7 | −20.7 | −22.0 |
| 180 | 7.3 | 7.4 | 4790 | 7.95 | −99.5 | −18.0 | −30.8 | −48.8 | −20.7 | −22.0 |
| 190 | 7.3 | 7.4 | 5060 | 8.40 | −99.9 | −18.9 | −31.0 | −49.9 | −20.7 | −22.0 |
| 200 | 7.3 | 7.4 | 5320 | 8.84 | −100 | −19.9 | −31.1 | −51.0 | −20.7 | −22.0 |
Disclaimer/Publisher’s Note: The statements, opinions and data contained in all publications are solely those of the individual author(s) and contributor(s) and not of MDPI and/or the editor(s). MDPI and/or the editor(s) disclaim responsibility for any injury to people or property resulting from any ideas, methods, instructions or products referred to in the content. |
© 2024 by the author. Licensee MDPI, Basel, Switzerland. This article is an open access article distributed under the terms and conditions of the Creative Commons Attribution (CC BY) license (http://creativecommons.org/licenses/by/4.0/).
Copyright: This open access article is published under a Creative Commons CC BY 4.0 license, which permit the free download, distribution, and reuse, provided that the author and preprint are cited in any reuse.


