Submitted:
17 April 2024
Posted:
18 April 2024
You are already at the latest version
Abstract
Background/Objectives: Concurrent opioid (OPI) and benzodiazepine (BZD) use may exacerbate falls/fractures risk compared to no use or use alone. Yet, patients may need concurrent OPI-BZD use for co-occurring conditions (e.g., pain and anxiety). Therefore, we examined the association between longitudinal OPI-BZD dosing patterns and subsequent injurious falls risk. Methods: We conducted a retrospective cohort study including non-cancer fee-for-service Medicare beneficiaries initiating OPI and/or BZD in 2016-2018. We identified OPI-BZD use patterns during the 3 months following OPI and/or BZD initiation (i.e., trajectory period) using group-based multi-trajectory models. We estimated time to first injurious fall within 3 months post-trajectory period using inverse-probability-of-treatment-weighted Cox proportional hazards models. Results: Among 622,588 beneficiaries (age≥65=84.6%, female=58.1%, White=82.7%; having injurious falls=0.45%), we identified 13 distinct OPI-BZD trajectories: Group(A):Very-low OPI-only (early discontinuation)(44.9% of the cohort); (B):Low OPI-only (rapid decline)(15.1%); (C):Very-low OPI-only (late discontinuation)(7.7%); (D):Low OPI-only (gradual decline)(4.0%); (E):Moderate OPI-only (rapid decline)(2.3%); (F):Very-low BZD-only (late discontinuation)(11.5%); (G):Low BZD-only (rapid decline)(4.5%); (H):Low BZD-only (stable) (3.1%); (I):Moderate BZD-only (gradual decline)(2.1%); (J):Very-low OPI (rapid decline)/Very-low BZD (late discontinuation)(2.9%); (K):Very-low OPI (rapid decline)/Very-low BZD (increasing)(0.9%); (L):Very-low OPI (stable)/Low BZD (stable)(0.6%); and (M):Low OPI (gradual decline)/Low BZD (gradual decline)(0.6%). Compared with Group(A), 6 trajectories had increased 3-month injurious fall risks: (C): HR, 95%CI=1.78, 1.58-2.01; (D): 2.24, 1.93-2.59; (E): 2.60, 2.18-3.09; (H): 2.02, 1.70-2.40; (L): 2.73, 1.98-3.76; and (M): 1.96, 1.32-2.91. Conclusions: Our findings suggest that 3-month injurious fall risk varied across OPI-BZD trajectories, highlighting the importance of considering both dose and duration when assessing fall risks of OPI-BZD use among older adults.
Keywords:
trajectory
; opioid
; benzodiazepine
; falls
; fractures
1. Introduction
With the aging of global population, falls and related injuries (e.g., hip fractures) have become a significant public health issue [1]. Each year, 30% of older people in the US reported ≥1 fall, and around 20% falls causes serious injuries such as broken bones or traumatic brain injuries [2,3]. Injurious falls increase the risk of emergency department (ED) visit, hospitalization, and death, which can lead to high medical costs [1]. In 2014, among the 2.8 million US older adults who visited ED for fall-related injuries, 29% were subsequently hospitalized leading to an average cost of $30,000 per hospitalization and a total estimated medical cost of $50 billion [2].
According to a systemic review and meta-analysis, OPI use and BZD use are both associated with an increased fall risk compared to no use, with an adjusted odds ratio of 1.60 (95% confidence interval [95%CI]=1.35-1.91) and 1.42 (95%CI=1.22-1.65), respectively [4,5]. Concurrent use of OPIs and BZDs may further exacerbate the risk of injurious falls. For example, a retrospective cohort study using Medicare data found that for patients receiving BZD monotherapy, having OPI use within 180 days before BZD initiation was associated with an increased risk of fall injuries (adjusted hazard ratio [aHR] 1.22, 95%CI 1.07-1.40) [6]. Therefore, the Beers criteria recommended against the concurrent use of OPI and BZD [7]. Despite these warnings, OPI are sometimes co-prescribed with BZD [8]. In 2015, the co-prescribing rate of OPI and BZD was roughly 2.7% [8].
Existing evidence is limited by only reporting the cross-sectional co-prescription rate of OPI and BZD and using an intention-to-treat design (e.g., if the patient received an OPI at the beginning of the study, then he/she is considered an OPI user) to assess OPI-BZD’s associated risk of injurious falls. However, OPI and BZD may be used intermittently, and the doses may change over time [9,10]. Prior studies have also relied on simplistic concurrent use definitions based on overlap in days of supply of prescriptions (e.g., >30 overlapping days) [11]. There are needs to better understand the differential risk of falls/fractures among distinct longitudinal dose/duration patterns of OPI-BZD use (i.e., trajectories). In this study, we aimed to investigate the OPI-BZD trajectories most associated with injurious falls (including fractures) using data-driven group-based multi-trajectory modeling (GBMTM) approach.
2. Materials and Methods
2.1. Data Sources and Study Design
This retrospective cohort study included a 15% nationally representative sample of Medicare beneficiaries plus all beneficiaries in Florida from 2016 to 2018. Medicare is a national health insurance program available to US populations aged 65+ or those with end-stage renal disease or disability [12]. We restricted our analysis to beneficiaries enrolled fee-for-service plans including Part A (hospital), Part B (medical), and Part D (prescription drug) as previous reports suggest incomplete data capture for those enrolled in Medicare Part C plans (Medicare Advantage) [13].
Throughout the study period, we excluded beneficiaries who (1) were non-US residents, (2) had malignant cancer diagnosis, (3) had claims for hospice services, and (4) did not have any eligible OPI or BZD prescriptions. Eligible OPI was defined as non-injectable, non-buprenorphine (for opioid use disorder) OPI. Then, among beneficiaries who had ≥1 eligible OPI or BZD from 2016-2018, we further excluded those who: 1) did not have continuous fee-for-service enrollment 6 months prior to and 3 months after the index date (i.e., date of first OPI or BZD dispensing record); 2) had their first OPI or BZD prescription dispensed before July 1, 2016, or after Oct 1, 2018; 3) had any fall-related diagnosis or procedure code within 6 months before the index date; 4) had their first OPI or BZD prescription dispensed on the same date of injurious falls claims; 5) had claims for accidental injury within 6 months before the index date as they were with higher risk of having falls or fractures; or 6) had claims for orthopedics visits with any related image diagnosis (+/-3 days) within 1 month before the index date to avoid misclassification of exposure-outcome temporal relationship (AppendixFigure 1).
This study followed the Strengthening the Reporting of Observational Studies in Epidemiology (STROBE) guideline and was approved by the University of Florida Institutional Review Board [14].
2.2. Exposure Ascertainment
The exposure of interest was the patient’s membership in a distinct trajectory of OPI-BZD use. We used GBMTM to identify single (i.e., OPI or BZD alone) and concurrent medication use patterns over time (i.e., trajectories) [15,16,17,18]. GBMTM estimates the maximum likelihood of each patient’s group membership to identify subgroups that follow similar trajectories [17]. We included the daily measures of average standardized daily dose (SDD) separately for OPIs and BZDs as longitudinal, continuous dependent variables and the 3 months trajectory measurement period after index date as the independent variable (Appendix Figure 2). The SDD for OPIs was calculated as the average daily morphine milligram equivalents (MME) using dispensing information (i.e., fill date, dose, and days’ supply) and the conversion factors provided by the Centers for Disease Control and Prevention (CDC) [19,20]. The SDD for BZDs was the daily diazepam milligram equivalents (DME) calculated based on published equivalent dosing conversions (Table S1) [21,22,23]. Analytical details regarding the identification of distinct OPI-BZD trajectories were described in our previous work [24].
We allowed for the most flexible functional form of time (up to the fifth order polynomial function) [24]. The final number of trajectories were selected using a combination of criteria, including: 1) larger Bayesian Information Criterion (BIC) [25]; 2) Nagin’s criteria [26]; 3) requirement for each trajectory group to have at least two fall injury cases (to obtain valid risk estimates in Cox models) [27]; and 4) requirement for each trajectory to have sufficient number of beneficiaries to support clinical relevance of identified patterns (i.e., each identified trajectory reflects a clinically meaningful OPI and BZD dose pattern over time, with a preference for fewer number of trajectories to minimize complexity and maintain clinical interpretability). The study investigators qualitatively labeled individual trajectories based on the observed dose/duration patterns for OPI and BZD use over the trajectory measurement period. In general, we defined OPI dose level as: very-low- (SDD <25 MME), low- (25–50 MME), moderate- (51–90 MME), high- (91–150 MME), and very-high-dose (>150 MME) (37). Similarly, we defined BZD dose level as very-low- (<10 DME), low- (10–20 DME), moderate- (21–40 DME), high- (41–60 DME), and very-high-dose (>60 DME). We considered early discontinuation of OPIs or BZDs when discontinuation occurred within 30 days after initiation; otherwise, it was defined as late discontinuation. If drug dose was reduced by >10 MME or >10 DME within 30 days, then the reduction was defined as rapid decline; otherwise, we defined it as gradual decline.
2.3. Outcome Ascertainment
The primary outcome was time to the first injurious fall event recorded in the 3 months following the index date. Patients were censored at the occurrence of the outcome, switch to a Medicare advantage plan, death, or end of the study period, whichever came first. We used International Classification of Diseases codes (ICD-9 before Oct 2015/ICD-10 after Oct 2015; Table S2 [28]) to identify injurious fall events based on validated algorithms [29,30,31]. We chose 3 months as trajectory and outcome measurement windows because injurious falls events are more likely to occur due to the changes in drug use (e.g., new addition, dose change). We also examined the 6-month risk of injurious falls after the index date in the sensitivity analysis to test the robustness of the results.
2.4. Covariate Ascertainment
We measured relevant covariates during the 6 months prior to the index date. Demographic covariates included age, sex, race/ethnicity, disability status, receipt of low-income subsidy (LIS) and dual Medicaid eligibility, and metropolitan residence. Based on literature and clinician input for fall-related risks [32,33,34], covariates related to health status included Elixhauser comorbidity Index, substance use disorders, anxiety, mood, sleep, and musculoskeletal disorders and individual pain conditions (Table S2). Health services use factors included any hospitalization, number of ED visits, and number of outpatient visits. We also measured a series of medication-use related variables including number of antidepressants, antipsychotics, gabapentinoids, muscle relaxants, naltrexone, and polypharmacy with ≥5 medications including OPI and/or BZD. Finally, we described several OPI/BZD-related characteristics including type of medications (e.g., short-acting, long-acting), unique medication ingredients, average days supplied and average number of fills for OPI and BZD prescriptions in the 3-month trajectory measurement period, respectively.
2.5. Statistical Analysis
We used the inverse probability of treatment weighting (IPTW) approach to minimize the confounding resulted from the different patient characteristics and disease complexity across the trajectory groups. First, we included baseline covariates measured in the 6 months before the index date in the gradient boosting machine to estimate the probability of an individual’s likelihood to be grouped in a specific trajectory (i.e., propensity score [PS]). IPTW was calculated as the 1/PS [35]. We compared patient characteristics across trajectory groups before and after IPTW using the standardized mean differences (SMD) [36]. Then, we applied the IPTW in the weight function of the Cox proportional hazards model to compare the time-to-event (i.e., injurious falls) within 3 months after the index date across different OPI-BZD trajectories, adjusting for covariates with non-negligible differences (mean SMD>0.1) after IPTW (i.e., doubly robust method) [37]. The proportional hazards assumption was examined using Schoenfeld residuals [38].
We reported patient characteristics using number and proportion for categorical variables, mean and standard deviation [SD] for continuous variables. To assess the risk of injurious falls within 3 and 6 months respectively, we reported number of injurious falls, follow-up duration, and crude/adjusted HR with 95%CI. Finally, we calculated E-value to assess the minimum strength of association a confounder would need to have with the exposure (i.e., trajectory membership) and outcome (i.e., injurious fall) to bias away the association, conditional on measured covariates [39].
We used STATA 16.0 (Stata-Corp LP, College Station, TX) and the TRAJ macro (free download at http://www.andrew.cmu.edu/user/bjones) for GBMTM; R packages, tableone and survey for SMD; and SAS version 9.4 (SAS Inc., Cary, NC, USA) for other analyses.
3. Results
Figure 1 illustrates the daily dose utilization patterns for OPI and BZD use in the 3-month period following OPI or BZD initiation. Based on the labeling rules described in the Methods, we identified 13 distinct OPI-BZD trajectories. Figure 1 shows 5 trajectory groups with OPI use only (n=459,994; 73.9% of the cohort) including Group (A): Very-low OPI-only (early discontinuation) (n=279,263; 44.9%); (B): Low OPI-only (rapid decline) (n=93,703; 15.1%); (C): Very-low OPI-only (late discontinuation) (n=47,851; 7.7%); (D): Low OPI-only (gradual decline) (n=24,952; 4.0%); (E): Moderate OPI-only (rapid decline) (n=14,225; 2.3%). Figure 1 shows 4 trajectory groups using BZD only (n=132,067; 21.2%) including (F): Very-low BZD-only (late discontinuation) (n=71,715; 11.5%); (G): Low BZD-only (rapid decline) (n=28,109; 4.5%); (H): Low BZD-only (stable) (n=19,230; 3.1%); (I): Moderate BZD-only (gradual decline) (n=13,013; 2.1%). Figure 1 shows 4 trajectory groups with OPI-BZD use (n=30,527; 4.9%) including (J): Very-low OPI (rapid decline) / Very-low BZD (late discontinuation) (n=17,750; 2.9%); (K): Very-low OPI (rapid decline) / Very-low BZD (increasing) (n=5,601; 0.9%); (L): Very-low OPI (stable) / Low BZD (stable) (n=3,729; 0.6%); and (M): Low OPI (gradual decline) / Low BZD (gradual decline) (n=3,447; 0.6%).
Before IPTW, there were multiple non-negligible differences in patient characteristics across trajectory groups (Table 1). For example, compared to the overall study cohort, individuals using higher doses of OPI and/or BZD (Groups E, I, M) were more likely to be younger (age ≥65 years: 64.5%–78.0% vs. 84.6% overall). After IPTW, all characteristics had a mean SMD of <0.1, which was considered balanced across trajectories (Table 1). Table S3 presents the minimum and maximum SMDs across the 78 group comparisons ().
As shown in Table S4, the most common OPI was short-acting hydrocodone (45.8%), which was similar across trajectory groups. During the 3-month trajectory measurement period, the mean days supplied was 8.4 (SD=9.4), the mean daily MME was 2.7 (SD=5.1), and the mean number of OPI fills was 1.4 (SD=0.9). Table S5 suggested that the most widely used BZD was alprazolam (34.6%). The mean days supplied was 24.2 (SD=22.5), the mean daily DME was 1.3 (SD=4.2), and the mean number of fills was 1.5 (SD=1.0). Group F and Group J had lower mean days supplied (F: 14.6 [SD=11.7], J: 9.8 [SD=10.6]) and mean number of fills (F: 1.1 [SD=0.3], J: 1.1 [SD=0.3]) compared to the overall cohort.
In the 3 months after the first prescription of OPI or BZD, 2,826 (0.45%) beneficiaries experienced injurious falls (Table 2 and Figure 2). Compared with Group (A) (crude rate: 1,037 per 10,000 person–months), the 3-month injurious fall risk significantly increased among individuals in the six trajectories (18.2% of the cohort): (C) aHR=1.78, 95%CI=1.58–2.01, (D) aHR=2.24, 95%CI=1.93–2.59, (E) aHR=2.60, 95%CI=2.18–3.09, (H) aHR=2.02, 95%CI=1.70–2.40, (L) aHR=2.73, 95%CI=1.98–3.76, and (M) aHR=1.96, 95%CI=1.32–2.91.
The results were generally robust in the sensitivity analysis where the risk of injurious falls within 6 months after the first prescription of OPI or BZD was evaluated (Table S6 and Figure S3). In addition to Groups (C) aHR=1.54, 95%CI=1.40–1.69, (D) aHR=1.93, 95%CI=1.72–2.16, (E) aHR=2.22, 95%CI=1.93–2.55, (H) aHR=1.82, 95%CI=1.59–2.07, (L) aHR=2.64, 95%CI=2.08–3.36, (M) aHR=1.72, 95%CI=1.26–2.35, Group (I) aHR=1.31, 95%CI=1.09–1.58 also had an increased risk compared to Group (A).
Table S7 shows our findings’ robustness to potential influences of unmeasured confounders. The E–values for trajectory groups C, D, E, H, L, and M ranged from 3.48 to 6.42, indicating that estimated HRs were robust to unmeasured confounders.
4. Discussion
Among the 13 OPI–BZD trajectories during the 3–month following OPI or BZD initiation, trajectories with concurrent use of OPI and BZD were not necessarily associated with a higher risk of injurious falls. Instead, those with a higher dose of OPI (≥25 MME) and/or BZD (≥10 DME) or with a longer duration were associated with 1.8 to 2.7 times increased injurious fall risks compared to the lowest–dose (<25 MME), early discontinuing, OPI-only trajectory. Therefore, both dose and duration rather than simple concurrent use of OPI and BZD may impact the risk of injurious falls.
To our knowledge, this study is the first to identify longitudinal trajectories of concurrent OPI and BZD use at high risk of injurious falls. Our findings aligned with previous studies showing that the effect of OPI and BZD on injurious fall risk may be dose dependent. For OPI, Miller et al. divided all OPI prescriptions into low- (1-75 mg), med- (76-225 mg), and high-dose (>225 mg) by the equivalents of codeine per day, and they found a dose-response relationship between OPI use and risk of fractures (aHR [95%CI]: low-dose=2.2 [0.9-5.2]; medium-dose=4.6 [3.2-6.6]; high-dose=5.1 [3.7-7.2]) [40]. Saunders et al. divided OPI use into low- (1-19mg), med- (20-50mg) and high-dose (>50mg) by its daily MME dose, and they found a dose-response relationship between OPI use and fracture risk (aHR [95%CI]: low-dose=1.20 [0.92-1.56]; med-dose=1.34 [0.89-2.01]; high-dose=2.00 [1.24-3.24]) [41]. For BZD, Ray et al. found that the adjusted rate ratio (95%CI) of fall risk increased from 1.30 (1.12-1.52) for a DME of ≤2 mg, to 2.21 (1.89-2.60) for a DME of > 8 mg compared to no use [42]. Long-term drug use may also be associated with an increase in the risk of falls. For example, a nationwide population-based case–crossover study suggested that the longer the prescription period of BZDs, the higher the risk of falls and fractures was (adjusted odds ratio [95%CI]: day 7=1.48 [1.14-1.93], day 49 =2.02 [1.64-2.49], day 120=3.22 [2.58-4.02]) [43]. However, dose and duration of OPI-BZD use are likely to change over time varied by patient’s characteristics that may affect injurious falls risks. Unlike prior studies using simple concurrent use measures (e.g., any overlapping use) and intention-to-treat exposure assignment, our study sheds additional insights into the longitudinal use patterns of OPI-BZD use over time most associated with injurious falls risks.
Our findings have significant clinical implications. For example, though the current CDC guidelines recommend against concurrent OPI–BZD use [44], it may not be clinically actionable to completely avoid co-prescribing OPI and BZD for patients in need (e.g., those suffering from co-occurring severe anxiety and chronic pain), since the benefits may outweigh the risks (e.g., falls and fractures). Identifying trajectories associated with a higher risk of injurious falls provides additional information for clinicians when prescribing OPI and/or BZD for patients. Additionally, deprescribing (including dose reduction and discontinuation) of OPI and BZD is common and recommended if pain and related anxiety or sleep disorders are relieved [45]. The rate of deprescribing may affect the risk of injurious falls, yet this was not reported in the previous literature. We found that a dose reduction of >10 MME/DME within 30 days may still be safe regarding the injurious fall risk although abrupt tapering or discontinuation is not recommended due to potential withdrawal syndromes and unintended consequences [46].
This study has several limitations. First, we used claims data, which provided limited information regarding disease severity (e.g., chronic pain, anxiety), actual drug taking behavior, and some self-paid medications (e.g., over-the-counter analgesics). These unmeasured confounders may result in residual confounding, yet our E-value proved that the risk estimates were robust. We also adjusted for several clinical diagnoses and medication use as proxy of these unmeasured confounders. Second, a follow-up period of three months after the first prescription of OPI and/or BZD may be too short to identify all injurious falls. However, the high-risk groups remained similar in sensitivity analysis lengthening the follow-up period to six months. Third, we presented the average OPI-BZD dosing patterns in each trajectory, which may vary from individuals among each trajectory [47]. However, GBMTM allows us to assign patients with the most similar dosing patterns into a group to provide insights on medication use patterns in real-world clinical settings. Fourth, our findings may not be generalized to other populations (e.g., Medicaid). Despite the limitations, our study identified dosing patterns of OPI-BZD at high risk of injurious falls among older adults, providing clinically valuable information for clinicians when prescribing the drugs to older adults.
5. Conclusions
Our findings suggest that 3-month injurious fall risk varied across OPI-BZD trajectories, highlighting the importance of considering both dose and duration when assessing fall risks of OPI-BZD use among older adults.
Supplementary Materials
The following supporting information can be downloaded at: www.mdpi.com/xxx/s1, Table S1. Equivalency Conversion Table for Benzodiazepines, Table S2. ICD-9-CM and ICD-10-CM Codes of Diseases and Conditions Used in the Study, Table S3. Minimum and Maximum Standardized Mean Differences across Trajectory Group Comparisons, Table S4. Patterns of Opioid Use During 3-month Trajectory Measurement Period by Trajectory Group, Table S5. Patterns of Benzodiazepine Use During 3-month Trajectory Measurement Period by Trajectory Group, Table S6. Trajectories of Opioid and Benzodiazepine Use and Risk of Subsequent Injurious Falls among Medicare Beneficiaries, Table S7. E-values of Hazard Ratio Estimates for Injurious Falls among Medicare Beneficiaries, Figure S1. Sample Size Flowchart, Figure S2. Study Design Diagram, Figure S3. Trajectories of Opioid and Benzodiazepine Utilization Patterns and Risk of Injurious Falls: Sensitivity Analyses including Beneficiaries with Injurious Falls During the 6-month Trajectory Period (n=622,588).
Author Contributions
All authors have contributed substantially to the work reported: conceptualization, J.M.H.-C., W.F.G. and W.-H.L.-C.; methodology, J.M.H.-C., W.F.G. and W.-H.L.-C.; formal analysis, B.L.J. and S.Y.; writing—original draft preparation, G.H.-M.W.; writing—review and editing, everyone; visualization, B.L.J.; supervision, W.-H.L.-C.; project administration, D.L.W. All authors have read and agreed to the published version of the manuscript.
Funding
This research received no external funding.
Institutional Review Board Statement
This study was approved by the University of Florida Institutional Review Board.
Informed Consent Statement
This study was approved by the University of Florida Institutional Review Board to be exempted from the Informed Consent Statement.
Data Availability Statement
The datasets generated or analyzed in this study are not publicly accessible per Center’s for Medicare & Medicaid Services (CMS) regulation. Researchers wishing to analyze these datasets must submit a formal application to ResDAC. For more information, please visit their website at https://resdac.org/cms-research-identifiable-request-process-timeline.
Conflicts of Interest
Dr. Lo-Ciganic has received grant funding from Merck, Sharp & Dohme and Bristol Myers Squibb. Dr. Lo-Ciganic also serves as a consultant for Teva Pharmaceutical Industries Ltd.. Dr. Kwoh has received grant funding from AbbVie and EMD Serono. Dr. Kwoh also serves as a consultant for EMD Serono. All these conflicts of interest are unrelated to this project. The funders had no role in the design of the study; in the collection, analyses, or interpretation of data; in the writing of the manuscript; or in the decision to publish the results.
References
- Jia, H.; Lubetkin, E.I.; DeMichele, K.; Stark, D.S.; Zack, M.M.; Thompson, W.W. Prevalence, risk factors, and burden of disease for falls and balance or walking problems among older adults in the US. Preventive medicine 2019, 126, 105737. [Google Scholar] [CrossRef] [PubMed]
- Choi, N.G.; Choi, B.Y.; DiNitto, D.M.; Marti, C.N.; Kunik, M.E. Fall-related emergency department visits and hospitalizations among community-dwelling older adults: examination of health problems and injury characteristics. BMC Geriatr. 2019, 19, 1–10. [Google Scholar] [CrossRef] [PubMed]
- Vaishya, R.; Vaish, A. Falls in older adults are serious. Indian journal of orthopaedics 2020, 54, 69–74. [Google Scholar] [CrossRef]
- Seppala, L.J.; Wermelink, A.M.; de Vries, M.; Ploegmakers, K.J.; van de Glind, E.M.; Daams, J.G.; van der Velde, N.; Blain, H.; Bousquet, J.; Bucht, G.; et al. Fall-Risk-Increasing Drugs: A Systematic Review and Meta-Analysis: II. Psychotropics. J. Am. Med Dir. Assoc. 2018, 19, 371–e11. [Google Scholar] [CrossRef]
- Seppala, L.J.; van de Glind, E.M.; Daams, J.G.; Ploegmakers, K.J.; de Vries, M.; Wermelink, A.M.; van der Velde, N.; Blain, H.; Bousquet, J.; Bucht, G.; et al. Fall-Risk-Increasing Drugs: A Systematic Review and Meta-analysis: III. Others. J. Am. Med Dir. Assoc. 2018, 19, 372–e1. [Google Scholar] [CrossRef] [PubMed]
- Maust, D.T.; Bohnert, A.S.B.; Strominger, J.; Alexander, N.; Min, L.; Hoffman, G.J.; Goldstick, J.E. Prescription characteristics associated with fall-related injury risk among older adults prescribed benzodiazepines: a cohort study. BMC Geriatr. 2022, 22, 1–10. [Google Scholar] [CrossRef] [PubMed]
- Panel, A.G.S.B.C.U.E.; Fick, D.M.; Semla, T.P.; Steinman, M.; Beizer, J.; Brandt, N.; Dombrowski, R.; DuBeau, C.E.; Pezzullo, L.; Epplin, J.J. American Geriatrics Society 2019 updated AGS Beers Criteria® for potentially inappropriate medication use in older adults. Journal of the American Geriatrics Society 2019, 67, 674–694. [Google Scholar]
- Rhee, T.G. Coprescribing of Benzodiazepines and Opioids in Older Adults: Rates, Correlates, and National Trends. Journals Gerontol. Ser. A 2018, 74, 1910–1915. [Google Scholar] [CrossRef] [PubMed]
- Guerriero, F. Guidance on opioids prescribing for the management of persistent non-cancer pain in older adults. World J. Clin. Cases 2017, 5, 73–81. [Google Scholar] [CrossRef]
- Tannenbaum, C. Inappropriate benzodiazepine use in elderly patients and its reduction. J. Psychiatry Neurosci. 2015, 40, E27–E28. [Google Scholar] [CrossRef]
- Centers for Medicare and Medicaid Services. Concurrent use of opioids and benzodiazepines in a Medicare Part D population. https://www.cms.gov/Medicare/Prescription-Drug-Coverage/PrescriptionDrugCovContra/Downloads/Concurrent-Use-of-Opioids-and-Benzodiazepines-in-a-Medicare-Part-D-Population-CY-2015.pdf. Published , 2016. Accessed January 13, 2024. 12 May.
- Mues, K.; Liede, A.; Liu, J.; Wetmore, J.B.; Zaha, R.; Bradbury, B.D.; Collins, A.J.; Gilbertson, D.T. Use of the Medicare database in epidemiologic and health services research: a valuable source of real-world evidence on the older and disabled populations in the US. Clin. Epidemiology 2017, ume 9, 267–277. [Google Scholar] [CrossRef]
- Creighton, S.; Duddy-Tenbrunsel, R.; Michel, J. The promise and pitfalls of Medicare Advantage encounter data. Health Affairs Forefront 2019.
- Von Elm, E.; Altman, D.G.; Egger, M.; Pocock, S.J.; Gøtzsche, P.C.; Vandenbroucke, J.P. The Strengthening the Reporting of Observational Studies in Epidemiology (STROBE) statement: Guidelines for reporting observational studies. J. Clin. Epidemiol. 2008, 61, 344–349. [Google Scholar] [CrossRef] [PubMed]
- Twisk, J.; Hoekstra, T. Classifying developmental trajectories over time should be done with great caution: a comparison between methods. J. Clin. Epidemiology 2012, 65, 1078–1087. [Google Scholar] [CrossRef] [PubMed]
- Jones, B.L.; Nagin, D.S. Advances in Group-Based Trajectory Modeling and an SAS Procedure for Estimating Them. Sociol. Methods Res. 2007, 35, 542–571. [Google Scholar] [CrossRef]
- Nagin, D.S.; Jones, B.L.; Passos, V.L.; E Tremblay, R. Group-based multi-trajectory modeling. Stat. Methods Med Res. 2016, 27, 2015–2023. [Google Scholar] [CrossRef] [PubMed]
- Zhou, L.; Bhattacharjee, S.; Kwoh, C.K.; Tighe, P.J.; Reisfield, G.M.; Malone, D.C.; Slack, M.; Wilson, D.L.; Chang, C.; Lo-Ciganic, W. Dual-trajectories of opioid and gabapentinoid use and risk of subsequent drug overdose among Medicare beneficiaries in the United States: a retrospective cohort study. Addiction 2020, 116, 819–830. [Google Scholar] [CrossRef] [PubMed]
- Center for Disease Control and Prevention. Guideline for Prescribing Opioids for Chronic Pain. Available online: https://www.cdc.gov/drugoverdose/pdf/guidelines_at-a-glance-a.pdf (accessed on 4 March).
- Brandt, J.; Alkabanni, W.; Alessi-Severini, S.; Leong, C. Translating Benzodiazepine Utilization Data into Meaningful Population Exposure: Integration of Two Metrics for Improved Reporting. Clin. Drug Investig. 2018, 38, 565–572. [Google Scholar] [CrossRef]
- Farinde, A.; Medscape Benzodiazepine Equivalency Chart. Medscape. Available online: https://emedicine.medscape.com/article/2172250-overview#showall (accessed on 20 October).
- Psychiatric Disorders. Conn’s current therapy 2016, Bope, E.T., Kellerman, R.D., Eds.; Elsevie: Philadelphia, PA, 2016; pp. 969–1004. [Google Scholar]
- MDCalc. Benzodiazepine Conversion Calculator. Available online: https://www.mdcalc.com/benzodiazepine-conversion-calculator#evidence (accessed on 21 October).
- Lo-Ciganic, W.; Hincapie-Castillo, J.; Wang, T.; Ge, Y.; Jones, B.L.; Huang, J.L.; Chang, C.; Wilson, D.L.; Lee, J.K.; Reisfield, G.M.; et al. Dosing profiles of concurrent opioid and benzodiazepine use associated with overdose risk among US Medicare beneficiaries: group-based multi-trajectory models. Addiction 2022, 117, 1982–1997. [Google Scholar] [CrossRef]
- Schwarz, G. Estimating the Dimension of a Model. Ann. Stat. 1978, 6, 461–464. [Google Scholar] [CrossRef]
- Nagin, D.S.; Nagin, D.; Nagin, T.H. Group-Based Modeling of Development; Harvard University Press: 2005.
- Vittinghoff, E.; McCulloch, C.E. Relaxing the Rule of Ten Events per Variable in Logistic and Cox Regression. Am. J. Epidemiology 2006, 165, 710–718. [Google Scholar] [CrossRef] [PubMed]
- Lo-Ciganic, W.-H.; Huang, J.L.; Zhang, H.H.; Weiss, J.C.; Wu, Y.; Kwoh, C.K.; Donohue, J.M.; Cochran, G.; Gordon, A.J.; Malone, D.C.; et al. Evaluation of Machine-Learning Algorithms for Predicting Opioid Overdose Risk Among Medicare Beneficiaries With Opioid Prescriptions. JAMA Netw. Open 2019, 2, e190968. [Google Scholar] [CrossRef] [PubMed]
- Kim, S.-B.; Zingmond, D.S.; Keeler, E.B.; Jennings, L.A.; Wenger, N.S.; Reuben, D.B.; Ganz, D.A. Development of an algorithm to identify fall-related injuries and costs in Medicare data. Inj. Epidemiology 2016, 3, 1–11. [Google Scholar] [CrossRef]
- Ganz, D.A.; Kim, S.; Zingmond, D.S.; Ramirez, K.D.; Roth, C.P.; Jennings, L.A.; Mori, T.; Keeler, E.B.; Wenger, N.S.; Reuben, D.B. Effect of a Falls Quality Improvement Program on Serious Fall-Related Injuries. J. Am. Geriatr. Soc. 2015, 63, 63–70. [Google Scholar] [CrossRef] [PubMed]
- Hoffman, G.J.; Hays, R.D.; Shapiro, M.F.; Wallace, S.P.; Ettner, S.L. Claims-based Identification Methods and the Cost of Fall-related Injuries Among US Older Adults. Med Care 2016, 54, 664–671. [Google Scholar] [CrossRef] [PubMed]
- Meara, E.; Horwitz, J.R.; Powell, W.; McClelland, L.; Zhou, W.; O'Malley, A.J.; Morden, N.E. State Legal Restrictions and Prescription-Opioid Use among Disabled Adults. New Engl. J. Med. 2016, 375, 44–53. [Google Scholar] [CrossRef] [PubMed]
- Health, U.D.o.; Services, H. Falls and Fractures in Older Adults: Causes and Prevention. 2023.
- Deandrea, S.; Lucenteforte, E.; Bravi, F.; Foschi, R.; La Vecchia, C.; Negri, E. Risk factors for falls in community-dwelling older people:” a systematic review and meta-analysis”. Epidemiology 2010, 658–668. [Google Scholar] [CrossRef] [PubMed]
- Chesnaye, N.C.; Stel, V.S.; Tripepi, G.; Dekker, F.W.; Fu, E.L.; Zoccali, C.; Jager, K.J. An introduction to inverse probability of treatment weighting in observational research. Clin. Kidney J. 2021, 15, 14–20. [Google Scholar] [CrossRef] [PubMed]
- Andrade, C. Mean difference, standardized mean difference (SMD), and their use in meta-analysis: as simple as it gets. The Journal of clinical psychiatry 2020, 81, 11349. [Google Scholar] [CrossRef]
- Funk, M.J.; Westreich, D.; Wiesen, C.; Stürmer, T.; Brookhart, M.A.; Davidian, M. Doubly Robust Estimation of Causal Effects. Am. J. Epidemiology 2011, 173, 761–767. [Google Scholar] [CrossRef]
- Grambsch PM, Therneau TM. Proportional hazards tests and diagnostics based on weighted residuals. Biometrika 1994, 81, 515–526.
- VanderWeele, T.J.; Ding, P. Sensitivity Analysis in Observational Research: Introducing the E-Value. Ann. Intern. Med. 2017, 167, 268–274. [Google Scholar] [CrossRef] [PubMed]
- Miller, M.; Stürmer, T.; Azrael, D.; Levin, R.; Solomon, D.H. Opioid Analgesics and the Risk of Fractures in Older Adults with Arthritis. J. Am. Geriatr. Soc. 2011, 59, 430–438. [Google Scholar] [CrossRef]
- Saunders, K.W.; Dunn, K.M.; Merrill, J.O.; Sullivan, M.; Weisner, C.; Braden, J.B.; Psaty, B.M.; Von Korff, M. Relationship of Opioid Use and Dosage Levels to Fractures in Older Chronic Pain Patients. J. Gen. Intern. Med. 2010, 25, 310–315. [Google Scholar] [CrossRef] [PubMed]
- Ray, W.A.; Thapa, P.B.; Gideon, P. Benzodiazepines and the Risk of Falls in Nursing Home Residents. J. Am. Geriatr. Soc. 2000, 48, 682–685. [Google Scholar] [CrossRef]
- Na, I.; Seo, J.; Park, E.; Lee, J. Risk of Falls Associated with Long-Acting Benzodiazepines or Tricyclic Antidepressants Use in Community-Dwelling Older Adults: A Nationwide Population-Based Case–Crossover Study. Int. J. Environ. Res. Public Heal. 2022, 19, 8564. [Google Scholar] [CrossRef] [PubMed]
- Dowell, D.; Ragan, K.R.; Jones, C.M.; Baldwin, G.T.; Chou, R. CDC Clinical Practice Guideline for Prescribing Opioids for Pain—United States, 2022. MMWR. Recomm. Rep. 2022, 71, 1–95. [Google Scholar] [CrossRef] [PubMed]
- Wang, Y.; Wilson, D.L.; Fernandes, D.; Adkins, L.E.; Bantad, A.; Copacia, C.; Dharma, N.; Huang, P.-L.; Joseph, A.; Park, T.W.; et al. Deprescribing Strategies for Opioids and Benzodiazepines with Emphasis on Concurrent Use: A Scoping Review. J. Clin. Med. 2023, 12, 1788. [Google Scholar] [CrossRef]
- Wang, Y.; Wilson, D.L.; Fernandes, D.; Adkins, L.E.; Bantad, A.; Copacia, C.; Dharma, N.; Huang, P.-L.; Joseph, A.; Park, T.W.; et al. Deprescribing Strategies for Opioids and Benzodiazepines with Emphasis on Concurrent Use: A Scoping Review. J. Clin. Med. 2023, 12, 1788. [Google Scholar] [CrossRef]
- Hickson, R.P.; Annis, I.E.; Killeya-Jones, L.A.; Fang, G. Opening the black box of the group-based trajectory modeling process to analyze medication adherence patterns: An example using real-world statin adherence data. Pharmacoepidemiol. Drug Saf. 2019, 29, 357–362. [Google Scholar] [CrossRef]
Figure 1.
Trajectories of Opioid and Benzodiazepine Utilization Patterns among 622,588 Medicare Beneficiaries. Trajectory groups include A: Very-low OPI-only (early discontinuation) (n=279,263; 44.9%); B: Low OPI-only (rapid decline) (n=93,703; 15.1%); C: Very-low OPI-only (late discontinuation) (n=47,851; 7.7%); D: Low OPI-only (gradual decline) (n=24,952; 4.0%); E: Moderate OPI-only (rapid decline) (n=14,225; 2.3%); F: Very-low BZD-only (late discontinuation) (n=71,715; 11.5%); G: Low BZD-only (rapid decline) (n=28,109; 4.5%); H: Low BZD-only (stable) (n=19,230; 3.1%); I: Moderate BZD-only (gradual decline) (n=13,013; 2.1%); J: Very-low OPI (rapid decline) / Very-low BZD (late discontinuation) (n=17,750; 2.9%); K: Very-low OPI (rapid decline) / Very-low BZD (increasing) (n=5,601; 0.9%); L: Very-low OPI (stable) / Low BZD (stable) (n=3,729; 0.6%); M: Low OPI (gradual decline) / Low BZD (gradual decline) (n=3,447; 0.6%). We calculated SDDs for OPIs using MME and for BZDs using DME. To facilitate the labeling of opioid and benzodiazepine dose levels for each trajectory, we defined opioid dosage use as: very-low- (SDD <25 MME), low- (25–50 MME), moderate- (51–90 MME), high- (91–150 MME), and very-high-dose (>150 MME). Similarly, we defined BZD dosage use as very-low- (<10 DME), low- (10–20 DME), moderate- (21–40 DME), high- (41–60 DME), and very-high-dose (>60 DME). Abbreviations: BZD, benzodiazepine; DME, diazepam milligram equivalent; MME, morphine milligram equivalent; OPI, opioid; SDD, standardized daily dose.
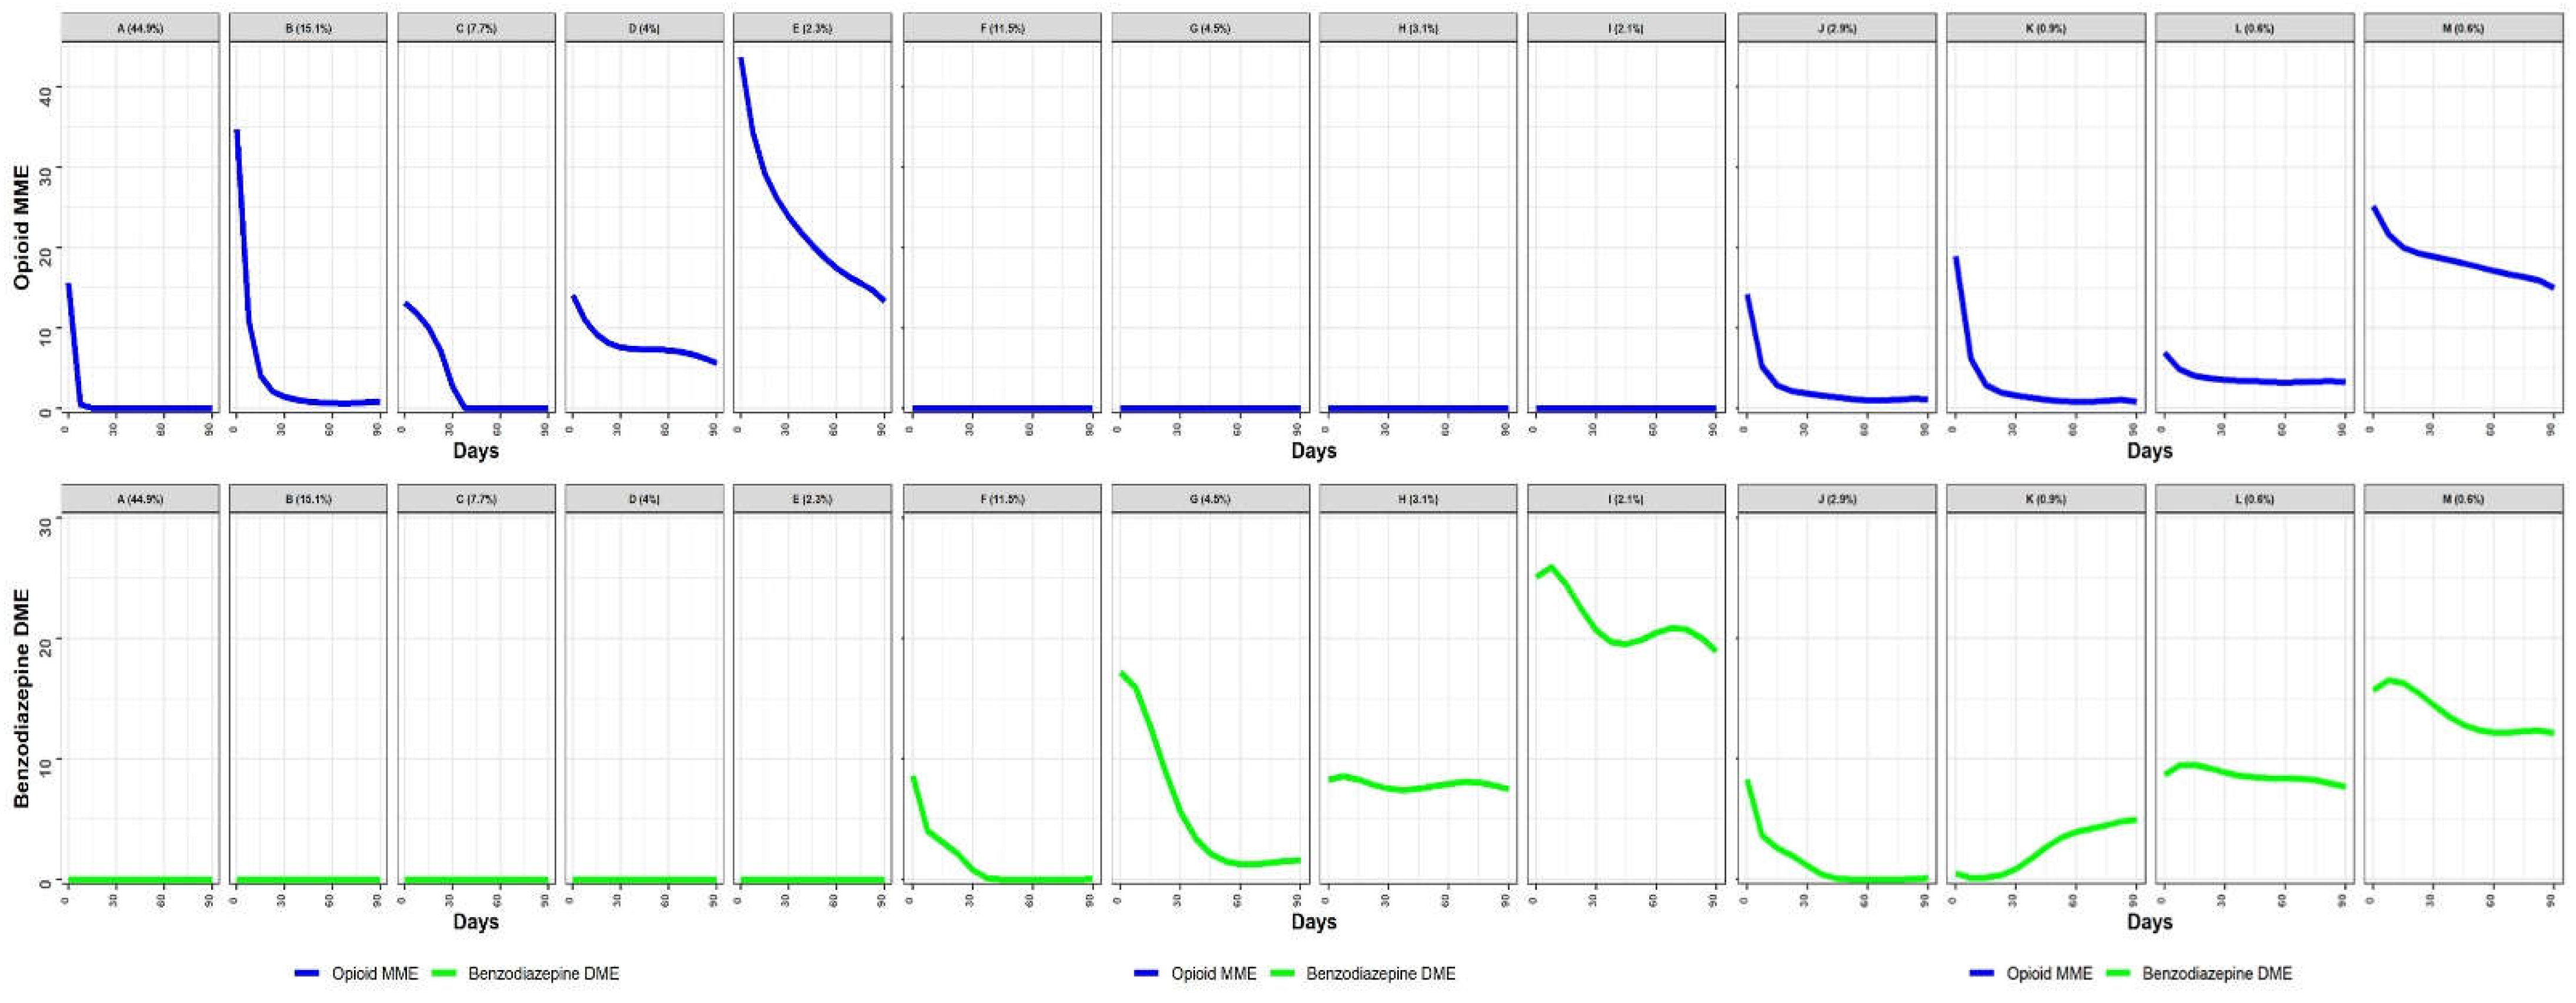
Figure 2.
Trajectories of Opioid and Benzodiazepine Utilization Patterns and Risk of Injurious Falls During the 3-month Trajectory Period. Trajectory groups include A: Very-low OPI-only (early discontinuation) (n=279,263; 44.9%); B: Low OPI-only (rapid decline) (n=93,703; 15.1%); C: Very-low OPI-only (late discontinuation) (n=47,851; 7.7%); D: Low OPI-only (gradual decline) (n=24,952; 4.0%); E: Moderate OPI-only (rapid decline) (n=14,225; 2.3%); F: Very-low BZD-only (late discontinuation) (n=71,715; 11.5%); G: Low BZD-only (rapid decline) (n=28,109; 4.5%); H: Low BZD-only (stable) (n=19,230; 3.1%); I: Moderate BZD-only (gradual decline) (n=13,013; 2.1%); J: Very-low OPI (rapid decline) / Very-low BZD (late discontinuation) (n=17,750; 2.9%); K: Very-low OPI (rapid decline) / Very-low BZD (increasing) (n=5,601; 0.9%); L: Very-low OPI (stable) / Low BZD (stable) (n=3,729; 0.6%); M: Low OPI (gradual decline) / Low BZD (gradual decline) (n=3,447; 0.6%). We calculated SDDs for OPIs using MME and for BZDs using DME. To facilitate the labeling of opioid and benzodiazepine dose levels for each trajectory, we defined opioid dosage use as: very-low- (SDD <25 MME), low- (25–50 MME), moderate- (51–90 MME), high- (91–150 MME), and very-high-dose (>150 MME). Similarly, we defined BZD dosage use as very-low- (<10 DME), low- (10–20 DME), moderate- (21–40 DME), high- (41–60 DME), and very-high-dose (>60 DME). Abbreviations: BZD, benzodiazepine; DME, diazepam milligram equivalent; MME, morphine milligram equivalent; OPI, opioid; SDD, standardized daily dose.
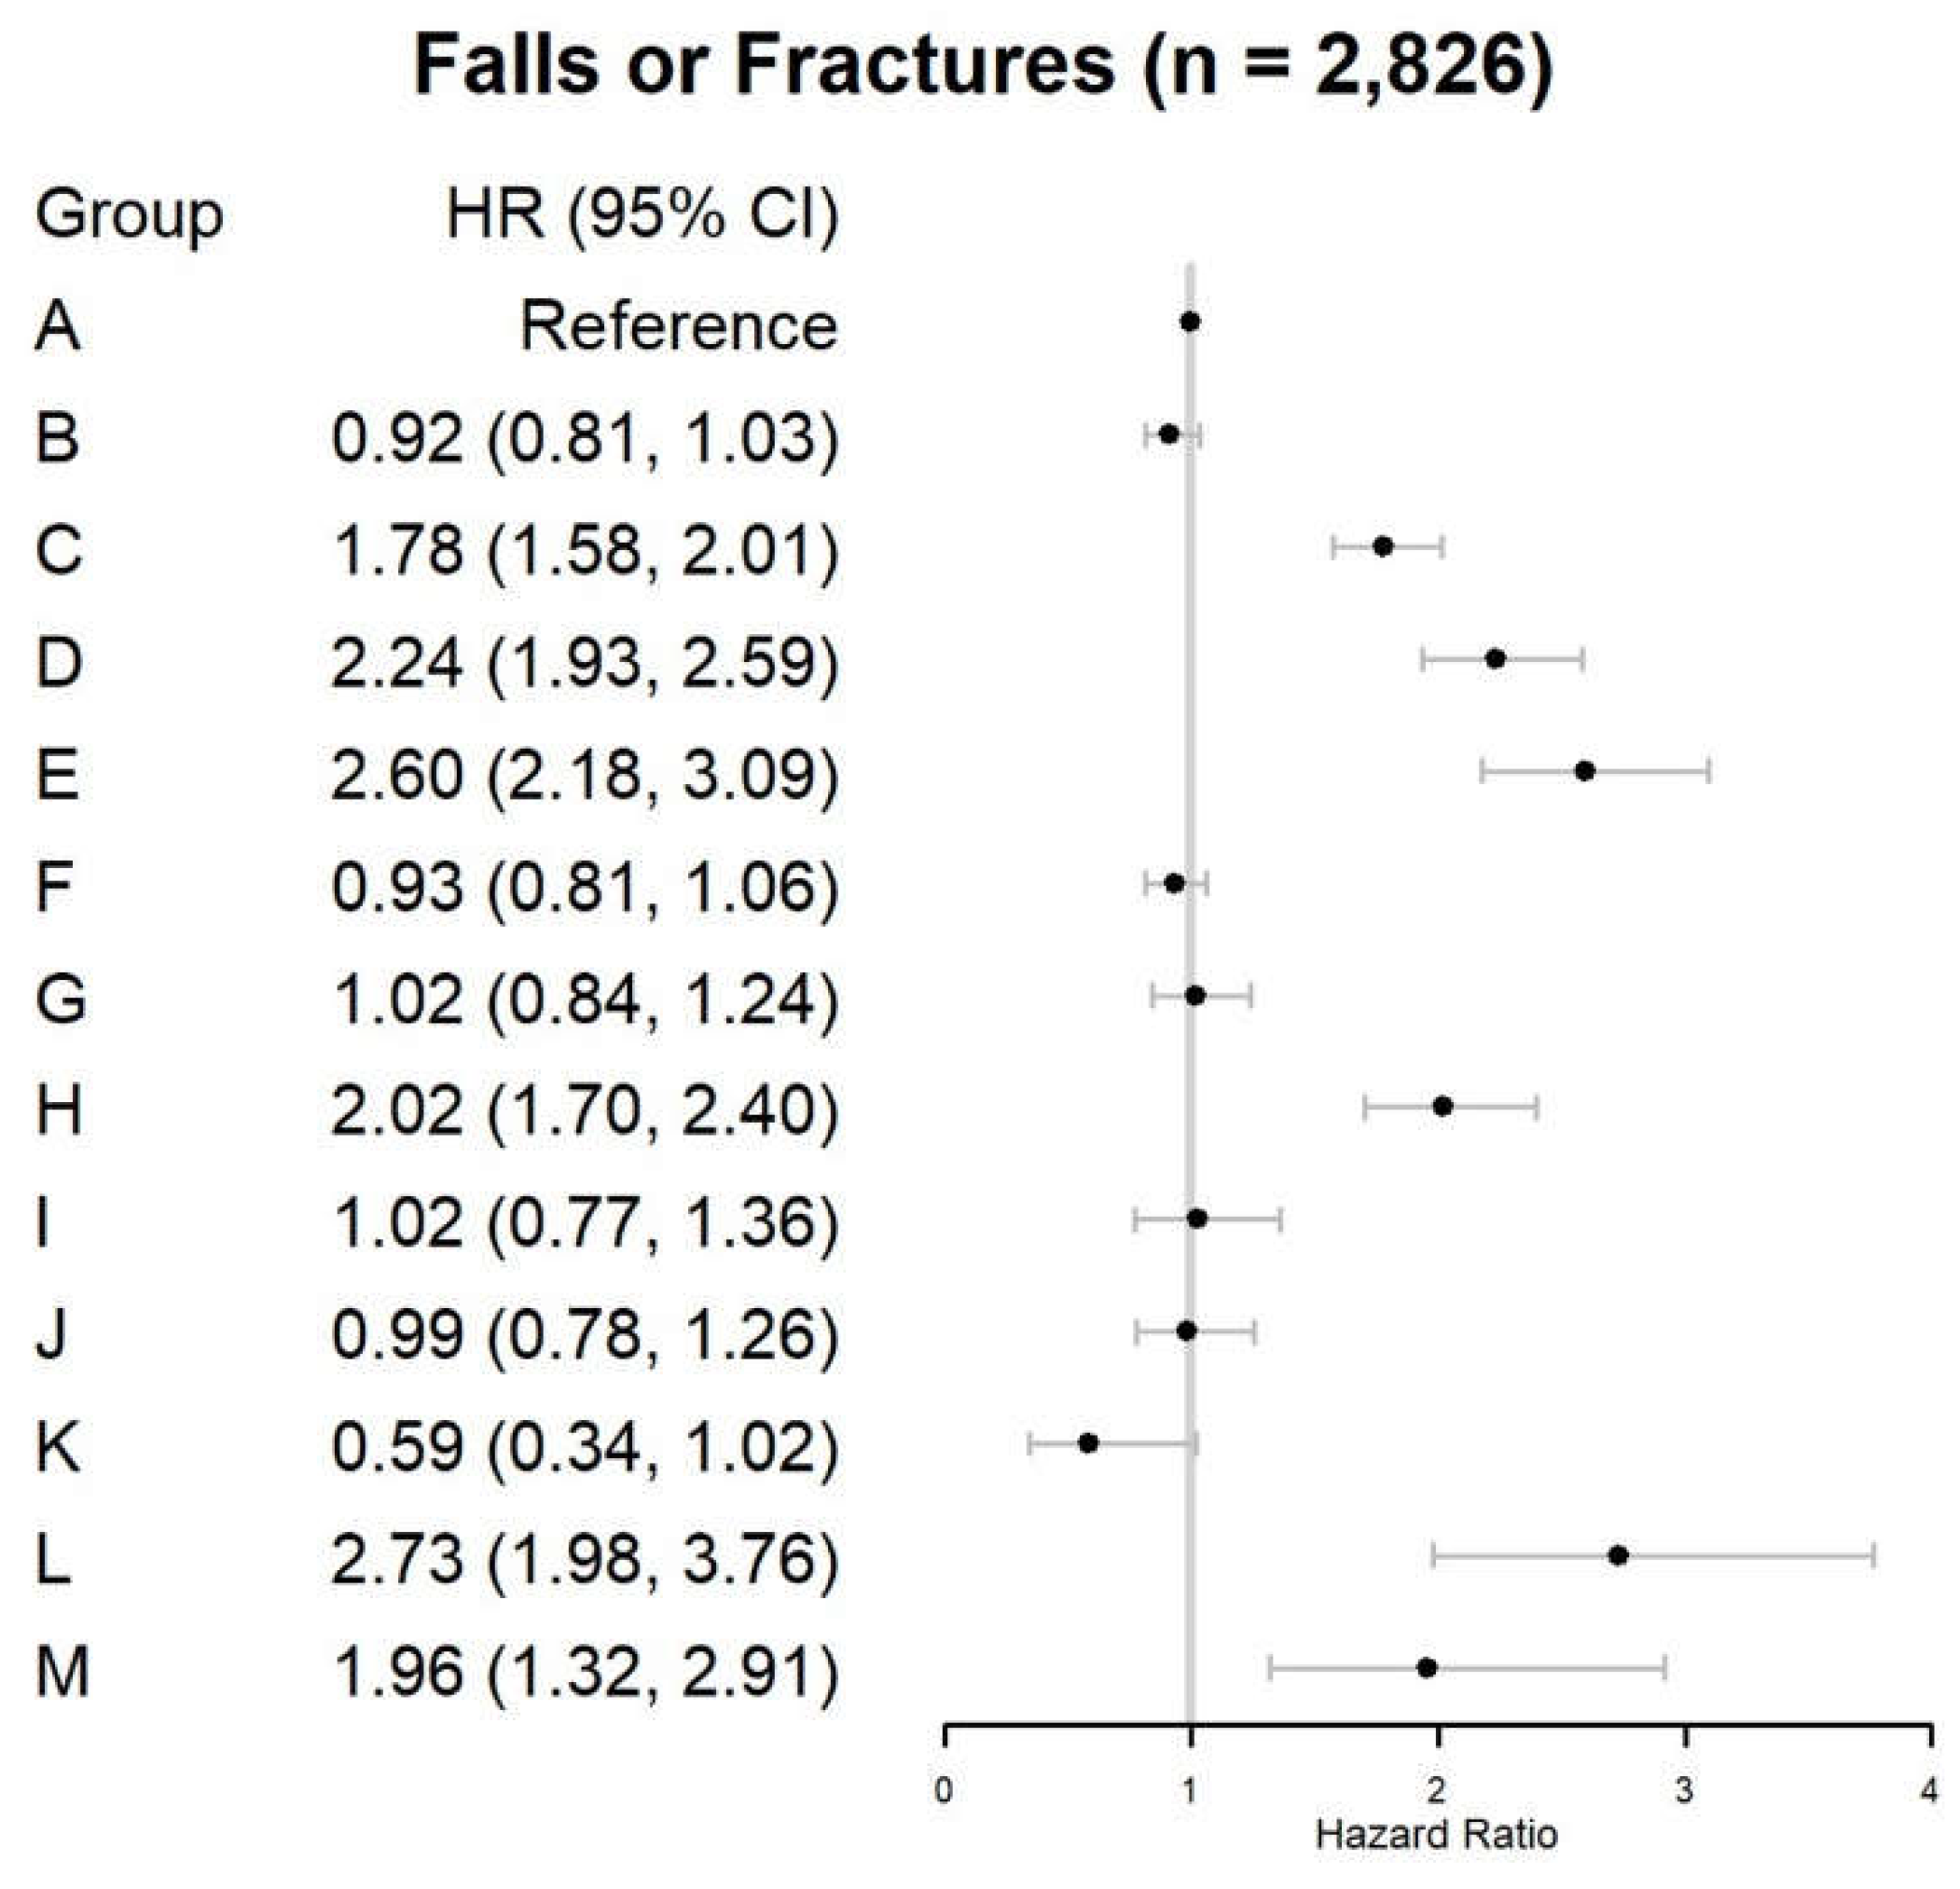

Table 1.
Characteristics of Medicare Beneficiaries by Opioid and Benzodiazepine Trajectory Group†.
| Trajectory groups* | Overall: n=622,588 (100.0%) | OPI use only† | BZD use only† | OPI-BZD use only† | SMD‡ | |||||||||||
| A: n=279,263 (44.9%) | B: n=93,703 (15.1%) | C: n=47,851 (7.7%) | D: n=24,952 (4.0%) | E: n=14,225 (2.3%) | F: n=71,715 (11.5%) | G: n=28,109 (4.5%) | H: n=19,230 (3.1%) | I: n=13,013 (2.1%) | J: n=17,750 (2.9%) | K: n=5,601 (0.9%) | L: n=3,729 (0.6%) | M: n=3,447 (0.6%) | before IPTW | after IPTW |
||
| Age ≥65 years, % | 84.6 | 85.5 | 85.1 | 87.3 | 82.8 | 78.0 | 85.7 | 82.0 | 83.9 | 69.3 | 85.7 | 81.6 | 79.5 | 64.5 | 0.18 | 0.01 |
| Female, % | 58.1 | 53.8 | 53.3 | 64.3 | 62.9 | 52.9 | 70.9 | 66.3 | 59.5 | 56.8 | 63.8 | 65.5 | 63.0 | 57.3 | 0.14 | 0.02 |
| Race/ethnicity group, % | ||||||||||||||||
| White | 82.7 | 82.2 | 83.7 | 76.3 | 77.2 | 83.4 | 86.8 | 84.4 | 84.3 | 82.9 | 86.8 | 84.1 | 85.3 | 84.4 | 0.09 | 0.02 |
| Black | 9.0 | 9.5 | 9.3 | 12.5 | 13.1 | 10.2 | 5.7 | 6.2 | 5.9 | 6.7 | 6.3 | 7.7 | 6.5 | 8.2 | 0.10 | 0.03 |
| Others | 8.3 | 8.2 | 6.9 | 11.1 | 9.7 | 6.4 | 7.5 | 9.4 | 9.7 | 10.4 | 6.9 | 8.2 | 8.2 | 7.5 | 0.06 | 0.01 |
| Disability status, % | 21.6 | 19.8 | 21.1 | 21.6 | 27.4 | 30.9 | 19.5 | 24.3 | 22.9 | 38.1 | 19.6 | 25.1 | 28.2 | 43.9 | 0.18 | 0.01 |
| LIS/Dual eligibility, % | ||||||||||||||||
| No LIS/dual eligibility | 72.9 | 75.5 | 76.1 | 66.6 | 58.9 | 69.6 | 74.8 | 68.1 | 65.9 | 56.3 | 78.3 | 70.2 | 63.4 | 58.6 | 0.18 | 0.02 |
| LIS or dual eligibility | 5.1 | 5.0 | 4.8 | 5.4 | 7.0 | 7.9 | 4.2 | 5.1 | 5.2 | 7.8 | 4.0 | 4.9 | 7.5 | 11.9 | 0.09 | 0.01 |
| LIS and dual eligibility | 22.0 | 19.5 | 19.1 | 27.9 | 34.1 | 22.5 | 21.1 | 26.9 | 29.0 | 35.9 | 17.7 | 24.9 | 29.1 | 29.4 | 0.16 | 0.02 |
| Metropolitan residence | 81.9 | 81.6 | 80.0 | 81.6 | 79.2 | 79.4 | 85.5 | 84.4 | 80.6 | 83.8 | 84.3 | 82.8 | 80.2 | 80.1 | 0.07 | 0.02 |
| Elixhauser Comorbidity Index, mean (SD) | 3.3 (2.7) | 3.1 (2.6) | 3.6 (2.7) | 3.8 (2.7) | 4.1 (2.9) | 3.6 (2.8) | 3.1 (2.5) | 3.3 (2.7) | 3.4 (2.6) | 3.5 (2.8) | 3.2 (2.7) | 3.8 (2.9) | 4.0 (3.1) | 3.7 (3.1) | 0.14 | 0.01 |
| Opioid use disorder, % | 0.4 | 0.2 | 0.4 | 0.3 | 0.5 | 1.5 | 0.3 | 0.5 | 0.3 | 1.6 | 0.4 | 0.5 | 0.6 | 2.6 | 0.07 | 0.01 |
| Alcohol use disorders, % | 1.2 | 1.0 | 1.2 | 0.9 | 1.4 | 1.8 | 1.1 | 1.9 | 1.2 | 2.8 | 1.5 | 1.4 | 1.3 | 3.5 | 0.06 | 0.02 |
| Other SUD, % | 0.8 | 0.6 | 0.7 | 0.5 | 0.7 | 1.2 | 0.7 | 1.5 | 0.9 | 3.2 | 0.8 | 1.2 | 1.3 | 2.4 | 0.07 | 0.01 |
| Anxiety disorders, % | 11.1 | 6.7 | 8.3 | 7.3 | 9.3 | 9.7 | 20.8 | 26.1 | 19.2 | 30.7 | 14.7 | 17.8 | 24.6 | 25.7 | 0.27 | 0.02 |
| Mood disorders, % | 12.3 | 9.5 | 11.6 | 10.8 | 15.0 | 14.3 | 14.6 | 20.2 | 16.9 | 29.4 | 13.0 | 17.5 | 20.6 | 24.3 | 0.17 | 0.02 |
| Sleep disorders, % | 15.1 | 13.2 | 16.8 | 14.4 | 16.6 | 19.5 | 14.3 | 18.7 | 16.3 | 24.0 | 16.6 | 19.2 | 21.9 | 21.7 | 0.10 | 0.01 |
| Musculoskeletal conditions, % | 47.4 | 41.3 | 58.8 | 59.6 | 63.3 | 71.4 | 43.1 | 40.3 | 36.6 | 36.3 | 51.9 | 54.4 | 48.7 | 58.5 | 0.27 | 0.03 |
| Pain conditions, % | ||||||||||||||||
| Osteoarthritis | 36.8 | 32.4 | 46.3 | 44.8 | 47.3 | 53.1 | 34.0 | 31.2 | 28.9 | 27.1 | 40.2 | 42.2 | 37.6 | 41.9 | 0.20 | 0.02 |
| Low back pain | 21.2 | 17.5 | 25.2 | 31.7 | 36.0 | 36.6 | 17.7 | 16.3 | 14.2 | 15.9 | 25.7 | 27.2 | 24.1 | 36.9 | 0.23 | 0.02 |
| Neck pain | 8.0 | 6.6 | 9.0 | 10.7 | 11.3 | 12.5 | 7.8 | 7.0 | 5.8 | 6.5 | 10.6 | 10.5 | 9.3 | 15.1 | 0.11 | 0.01 |
| Chest pain | 12.4 | 11.5 | 13.5 | 12.9 | 13.5 | 12.1 | 12.2 | 14.0 | 11.2 | 12.1 | 13.8 | 15.7 | 17.4 | 15.5 | 0.06 | 0.01 |
| Abdominal pain | 17.5 | 19.3 | 20.2 | 15.5 | 16.3 | 14.7 | 13.2 | 13.5 | 11.5 | 12.5 | 16.5 | 21.8 | 19.4 | 20.1 | 0.11 | 0.01 |
| Rheumatoid arthritis | 2.6 | 2.1 | 2.9 | 4.5 | 4.9 | 3.9 | 2.0 | 2.2 | 1.9 | 2.0 | 2.7 | 3.1 | 2.7 | 3.3 | 0.07 | 0.01 |
| Pelvic pain | 3.1 | 3.1 | 3.1 | 2.7 | 2.5 | 2.5 | 3.6 | 3.1 | 2.1 | 2.5 | 4.1 | 4.3 | 3.6 | 4.4 | 0.05 | 0.01 |
| Headache/migraine | 5.2 | 4.6 | 5.1 | 5.5 | 5.8 | 5.6 | 6.2 | 6.4 | 4.6 | 6.4 | 7.0 | 7.9 | 7.9 | 7.9 | 0.06 | 0.01 |
| TMJ | 0.2 | 0.2 | 0.2 | 0.2 | 0.2 | 0.1 | 0.3 | 0.3 | 0.2 | 0.2 | 0.3 | 0.4 | 0.02 | 0.02 | ||
| Others | 21.5 | 19.9 | 25.3 | 25.0 | 26.3 | 27.2 | 19.7 | 18.0 | 16.0 | 17.0 | 24.9 | 26.4 | 23.4 | 26.3 | 0.11 | 0.01 |
| Any hospitalization, % | 13.8 | 11.0 | 28.0 | 10.2 | 12.1 | 29.2 | 7.8 | 11.5 | 9.0 | 14.8 | 12.9 | 16.3 | 17.9 | 20.6 | 0.21 | 0.04 |
| ED visits, % | ||||||||||||||||
| 0 | 87.9 | 88.5 | 87.5 | 88.2 | 85.6 | 87.4 | 89.4 | 85.5 | 88.3 | 83.7 | 87.8 | 83.0 | 81.2 | 81.5 | 0.09 | 0.01 |
| 1 | 10.5 | 10.1 | 10.7 | 10.2 | 12.1 | 10.7 | 9.1 | 12.2 | 10.0 | 13.4 | 10.3 | 14.0 | 15.7 | 15.1 | 0.08 | 0.01 |
| ≥2 | 1.7 | 1.4 | 1.8 | 1.6 | 2.3 | 1.9 | 1.5 | 2.3 | 1.7 | 2.9 | 2.0 | 3.0 | 3.1 | 3.4 | 0.05 | 0.01 |
| Outpatient visits, % | ||||||||||||||||
| 0 | 38.0 | 38.3 | 29.1 | 40.3 | 37.6 | 32.0 | 42.7 | 45.1 | 43.9 | 46.8 | 38.4 | 34.2 | 37.0 | 37.8 | 0.12 | 0.02 |
| 1 | 23.4 | 23.6 | 23.3 | 22.7 | 22.3 | 23.3 | 23.6 | 23.2 | 23.2 | 23.4 | 22.9 | 23.1 | 23.0 | 22.2 | 0.01 | 0.01 |
| 2-5 | 33.3 | 32.9 | 39.9 | 32.3 | 34.2 | 38.0 | 29.8 | 28.2 | 29.4 | 26.5 | 33.3 | 35.8 | 34.1 | 33.8 | 0.10 | 0.02 |
| >5 | 5.3 | 5.2 | 7.7 | 4.7 | 5.9 | 6.7 | 3.9 | 3.6 | 3.5 | 3.3 | 5.4 | 6.9 | 6.0 | 6.2 | 0.08 | 0.01 |
| No. antidepressants | 0.8 (2.1) | 0.7 (1.9) | 0.7 (1.9) | 0.8 (2.1) | 1.1 (2.5) | 0.9 (2.2) | 1.0 (2.4) | 1.3 (2.6) | 1.2 (2.7) | 1.8 (3.2) | 0.9 (2.1) | 1.2 (2.4) | 1.2 (2.5) | 1.2 (2.6) | 0.14 | 0.01 |
| No. antipsychotics | 0.3 (1.7) | 0.2 (1.4) | 0.2 (1.2) | 0.2 (1.3) | 0.3 (1.6) | 0.2 (1.1) | 0.4 (2.1) | 0.7 (2.8) | 0.6 (2.5) | 1.4 (3.8) | 0.2 (1.2) | 0.4 (2.0) | 0.4 (2.0) | 0.5 (3.6) | 0.14 | 0.02 |
| No. gabapentinoids | 0.2 (1.0) | 0.2 (0.9) | 0.3 (1.1) | 0.4 (1.2) | 0.6 (1.6) | 0.4 (1.3) | 0.2 (0.9) | 0.2 (1.0) | 0.2 (1.0) | 0.3 (1.2) | 0.2 (0.9) | 0.3 (1.1) | 0.3 (1.2) | 0.4 (1.4) | 0.11 | 0.01 |
| No. muscle relaxants | 0.1 (0.6) | 0.1 (0.5) | 0.1 (0.6) | 0.1 (0.6) | 0.2 (0.9) | 0.2 (0.7) | 0.1 (0.6) | 0.1 (0.6) | 0.1 (0.6) | 0.1 (0.7) | 0.1 (0.6) | 0.1 (0.7) | 0.1 (0.6) | 0.2 (0.8) | 0.07 | 0.01 |
| No. naltrexone | 0.0 (0.1) | 0.0 (0.1) | 0.0 (0.1) | 0.0 (0.1) | 0.0 (0.1) | 0.0 (0.1) | 0.0 (0.1) | 0.0 (0.2) | 0.0 (0.1) | 0.0 (0.2) | 0.0 (0.1) | 0.0 (0.1) | 0.0 (0.0) | 0.0 (0.1) | 0.02 | 0.01 |
| Polypharmacy (≥5 medications including OPI/BZD), % | 87.6 | 86.1 | 88.2 | 91.7 | 91.7 | 85.6 | 87.7 | 88.5 | 90.0 | 87.0 | 87.9 | 90.9 | 88.5 | 78.0 | 0.11 | 0.01 |
Abbreviations: BZD: benzodiazepine; CCB: calcium channel blocker; ED, emergency department; IPTW, inverse probability of treatment weighting; LIS, low-income subsidy; No., number of; NSAID, nonsteroidal anti-inflammatory drug; OPI: opioids; PCP, primary care providers; PD: Parkinson’s disease; PPI: proton pump inhibitors; SD, standard deviation; SMD: standardized mean difference; SSRI: selective serotonin reuptake inhibitors; SUD: substance use disorder; TCA: tricyclic antidepressants; TMJ: temporomandibular disorder pain. * Trajectory groups: A: Very-low OPI-only (early discontinuation); B: Low OPI-only (rapid decline); C: Very-low OPI-only (late discontinuation); D: Low OPI-only (gradual decline); E: Moderate OPI-only (rapid decline); F: Very-low BZD-only (late discontinuation); G: Low BZD-only (rapid decline); H: Low BZD-only (stable); I: Moderate BZD-only (gradual decline); J: Very-low OPI (rapid decline) / Very-low BZD (late discontinuation); K: Very-low OPI (rapid decline)/ Very-low BZD (increasing); L: Very-low OPI (stable)/Low BZD (stable); M: Low OPI (gradual decline)/ Low BZD (gradual decline). † To facilitate the labeling of opioid and benzodiazepine dose levels for each trajectory, we defined opioid dosage use as: very-low- (SDD <25 MME), low- (25–50 MME), moderate- (51–90 MME), high- (91–150 MME), and very-high-dose (>150 MME). Similarly, we defined BZD dosage use as very-low- (<10 DME), low- (10–20 DME), moderate- (21–40 DME), high- (41–60 DME), and very-high-dose (>60 DME). ‡ Average SMD of 78 SMDs from group comparisons (the number of 2-combinations from 13 trajectories). Table S3 includes the maximum and minimum SMDs.
Table 2.
Trajectories of Opioid and Benzodiazepine Utilization Patterns and 3-month Risk of Injurious Falls among Medicare Beneficiaries (n=622,588).
Table 2.
Trajectories of Opioid and Benzodiazepine Utilization Patterns and 3-month Risk of Injurious Falls among Medicare Beneficiaries (n=622,588).
| Trajectory Groups§ | Injurious Falls (n=2,826) | |||
| N (crude rate*) | Days of follow-up, median (IQR) | HR (95%CI) | ||
| Unadjusted | Adjusted† | |||
| OPI use only | ||||
| Very-low OPI-only (early discontinuation) | 1,037 (12.4) | 44 (41.0) | Reference | Reference |
| Low OPI-only (rapid decline) | 323 (11.5) | 51 (45.0) | 0.93 (0.82, 1.05) | 0.92 (0.81, 1.03) |
| Very-low OPI-only (late discontinuation) | 360 (25.1) | 37 (46.5) | 2.03 (1.80, 2.29) | 1.78 (1.58, 2.01) |
| Low OPI-only (gradual decline) | 219 (29.3) | 48 (37.0) | 2.37 (2.05, 2.74) | 2.24 (1.93, 2.59) |
| Moderate OPI-only (rapid decline) | 122 (28.6) | 40 (41.0) | 2.32 (1.92, 2.79) | 2.60 (2.18, 3.09) |
| BZD use only | ||||
| Very-low BZD-only (late discontinuation) | 276 (12.8) | 51 (39.5) | 1.04 (0.91, 1.18) | 0.93 (0.81, 1.07) |
| Low BZD-only (rapid decline) | 122 (14.5) | 47 (46.0) | 1.17 (0.97, 1.41) | 1.02 (0.84, 1.24) |
| Low BZD-only (stable) | 147 (25.5) | 34 (38.0) | 2.06 (1.74, 2.45) | 2.02 (1.70, 2.40) |
| Moderate BZD-only (gradual decline) | 58 (14.9) | 51 (45.0) | 1.20 (0.92, 1.56) | 1.03 (0.77, 1.36) |
| OPI and BZD use | ||||
| Very-low OPI (rapid decline) / Very-low BZD (late discontinuation) | 73 (13.7) | 57 (36.0) | 1.11 (0.87, 1.40) | 0.99 (0.78, 1.26) |
| Very-low OPI (rapid decline) / Very-low BZD (increasing) | 14 (8.3) | 67 (29.0) | 0.67 (0.40, 1.14) | 0.59 (0.34, 1.02) |
| Very-low OPI (stable) / Low BZD (stable) | 48 (42.9) | 45 (51.5) | 3.48 (2.61, 4.65) | 2.73 (1.98, 3.76) |
| Low OPI (gradual decline) / Low BZD (gradual decline) | 27 (26.1) | 41 (39.0) | 2.11 (1.44, 3.10) | 1.96 (1.32, 2.91) |
Abbreviations: CI, confidence interval; BZD, benzodiazepines; HR, hazard ratio; OPI, opioid; OPI-BZD, concurrent opioid and benzodiazepine use. § To facilitate the labeling of opioid and benzodiazepine dose levels for each trajectory, we defined opioid dosage use as: very-low- (SDD <25 MME), low- (25–50 MME), moderate- (51–90 MME), high- (91–150 MME), and very-high-dose (>150 MME). Similarly, we defined BZD dosage use as very-low- (<10 DME), low- (10–20 DME), moderate- (21–40 DME), high- (41–60 DME), and very-high-dose (>60 DME). We considered early discontinuation of OPIs or BZDs when discontinuation occurred within 30 days after initiation; otherwise, it was defined as late discontinuation. If drug dose was reduced by >10 MME or >10 DME within 30 days, then the reduction was defined as rapid decline; otherwise, we defined it as gradual decline. * The unit for crude rates is per 10,000 person-months. † For primary analysis, we excluded 8 beneficiaries with extreme IPTWs (>10) using trimming methods to increase validity of treatment effect estimates.
Disclaimer/Publisher’s Note: The statements, opinions and data contained in all publications are solely those of the individual author(s) and contributor(s) and not of MDPI and/or the editor(s). MDPI and/or the editor(s) disclaim responsibility for any injury to people or property resulting from any ideas, methods, instructions or products referred to in the content. |
© 2024 by the authors. Licensee MDPI, Basel, Switzerland. This article is an open access article distributed under the terms and conditions of the Creative Commons Attribution (CC BY) license (https://creativecommons.org/licenses/by/4.0/).
Copyright: This open access article is published under a Creative Commons CC BY 4.0 license, which permit the free download, distribution, and reuse, provided that the author and preprint are cited in any reuse.


