1. Introduction
With the rapid development of industrialization and urbanization, high-density and high-intensity urban construction has led to the continuous reduction of UGS, and the relationship between city inhabitants and the natural environment has become increasingly distant, which has led to a series of public health problems, such as cardiovascular disease, diabetes, obesity and other chronic diseases as well as mental diseases. Statistical data show that in 2010, 30.6% of adults in China were overweight, of which 12.0% were obese. The uneven distribution and insufficient supply of UGS and people’s excessive reliance on transportation are several important reasons for the lack of physical activity (PA). In 2010, the World Health Organization (WHO) identified insufficient PA as the fourth leading risk factor for global mortality. In 2005, a WHO report stated that 31.5% of the loss of healthy lives worldwide was caused by mental health issues. A 2013 study estimated that over 30 million people in China suffer from varying degrees of depression. Therefore, it is crucial to prevent or alleviate chronic diseases, promote PA, and alleviate mental stress through UGS.
Policy documents continuously promote the construction of a healthy China and healthy cities. In October 2016, China issued the “Outline of the Healthy China 2030 Plan”, proposing to integrate the concept of health into the entire process of urban planning, construction, and governance. In January 2017, the State Council issued “The 13th Five-Year Plan for Hygienism and Health”, which proposes a transformation in urban development from disease-treatment centered to health centered. In July 2019, the State Council issued the “Opinions of the State Council on Implementing the Healthy China Action”, which proposed that the key to health issues should shift from traditional “cure” methods to passive or proactive “prevention” and “intervention” methods, clarify the construction of healthy cities, and implement healthy environment promotion actions. The National Health Commission (NHC) released the “Report on the Nutrition and Chronic Disease Status of Chinese Residents” in 2020, which pointed out that the PA level of Chinese residents is generally insufficient (for example, the frequent PA rate of residents aged 20-69 is only 18.7%), and insufficient PA has become one of the factors that contributes to public health risks, which directly affects the occurrence of the following two public health problems: (1) the problem of overweight and obesity continues to be prominent and (2) the incidence rate of chronic diseases is on the rise, and the death rate of chronic diseases is high. In 2021, the NHC issued the “Guidelines for Physical Activity of the Chinese People”, proposing the minimum level of PA standards that are beneficial to physical health for different age groups in China. As a public product with positive health effects provided by the government, utilizing UGS to actively intervene in public health is of great significance for the construction of healthy China and healthy cities.
Numerous studies have confirmed that UGS contribute to human health. The four mainstream theories are stress relief theory [
1], attention restoration theory, restorative environment theory, and therapeutic landscapes [
2,
3]. These theories explain the role of natural or artificial environmental landscapes in the physical and mental health of the public from different perspectives. Research shows that natural landscapes can help relieve mental stress and play a positive role in people’s physical and mental health recovery [
4]. The natural environment is widely favored by people and can easily evoke a sense of joy and familiarity. People do not need to focus on the natural environment to appreciate it. Therefore, the natural environment has a positive effect on people’s recovery from mental fatigue. The environment can help people better recover from psychological fatigue and negative emotions associated with stress [
5]. Due to the special resonance that humans have with the natural environment, the natural environment has a higher restorative effect than the urban architectural environment [
6,
7]. The appreciation of plants and the imagination of natural scenery can help alleviate stress and eliminate anxious emotions, which is beneficial for physical and mental health.
On this basis, the internal relations between UGS and public health have been studied. In terms of the internal relations between the quantity of UGS and public health, studies have shown that the presence of more UGS in the community is associated with better health in children [
8,
9]. Accessibility (distance/proximity) [
10] is also an important factor affecting the use of UGS and has an important impact on people’s health. Increasing accessibility to UGS (i.e., by reducing the distance between residents and UGS) can effectively increase UGS use, which positively impacts residents’ health [
11]. The effective service area of UGS (available green space rate) also plays an important role in residents’ health. Increasing the spatial coverage of UGS can effectively improve residents’ evaluation of their own health and reduce obesity and mental health problems such as anxiety and stress [
12]. In terms of the internal relations between the quality of UGS and public health, the quality of UGS is related to well-being [
13], general health status [
14] and mental health [
15]. High-quality UGS can improve the frequency and duration of PA [
16]. A larger UGS can promote residents’ PA, so residents can obtain more health benefits [
17]. UGS with more activity facilities are more likely to promote PA and improve residents’ health [
18]. Natural environmental quality factors (plant species and quantity, vegetation coverage area, waterscape, etc.) in UGS play a major role in alleviating mental stress.
Research has confirmed that UGS are an important public resource for promoting people’s physical and mental health, but there is still much space to fill in the current research on the health benefits of UGS. In terms of the impact of the quantity of UGS on public health, further exploration is needed to determine to what extent the two are associated and which indicators are most significantly associated. In terms of the impact of UGS quality on public health, further analysis is needed to determine which UGS quality indicators have a positive correlation and the most significant correlation with public health benefits. In addition, discussions on thresholds are currently rare in the literature. Most of the existing studies have been conducted in developed countries, and there are few studies on this topic conducted in China. Chinese cities typically have a different type of city structure than cities in developed countries, with a higher population density and fewer UGS. Therefore, recommendations for cities in developed countries may not necessarily be valid for Chinese cities. Conducting such research in developing countries can make a positive contribution to establishing a global framework for the use of UGS [
19]. Therefore, this study uses Hangzhou, China as the research area to explore the above issues. The correlation between the health benefits of UGS and their quantity and quality factors was analyzed. We studied the quantity and quality factors that have a practical impact on the selected use and health benefits of UGS, explored thresholds, and proposed UGS design strategies to promote residents’ physical and mental health. This research provides theoretical and methodological guidance for the construction of UGS to promote residents’ physical and mental health.
2. Materials and Methods
2.1. Study Area
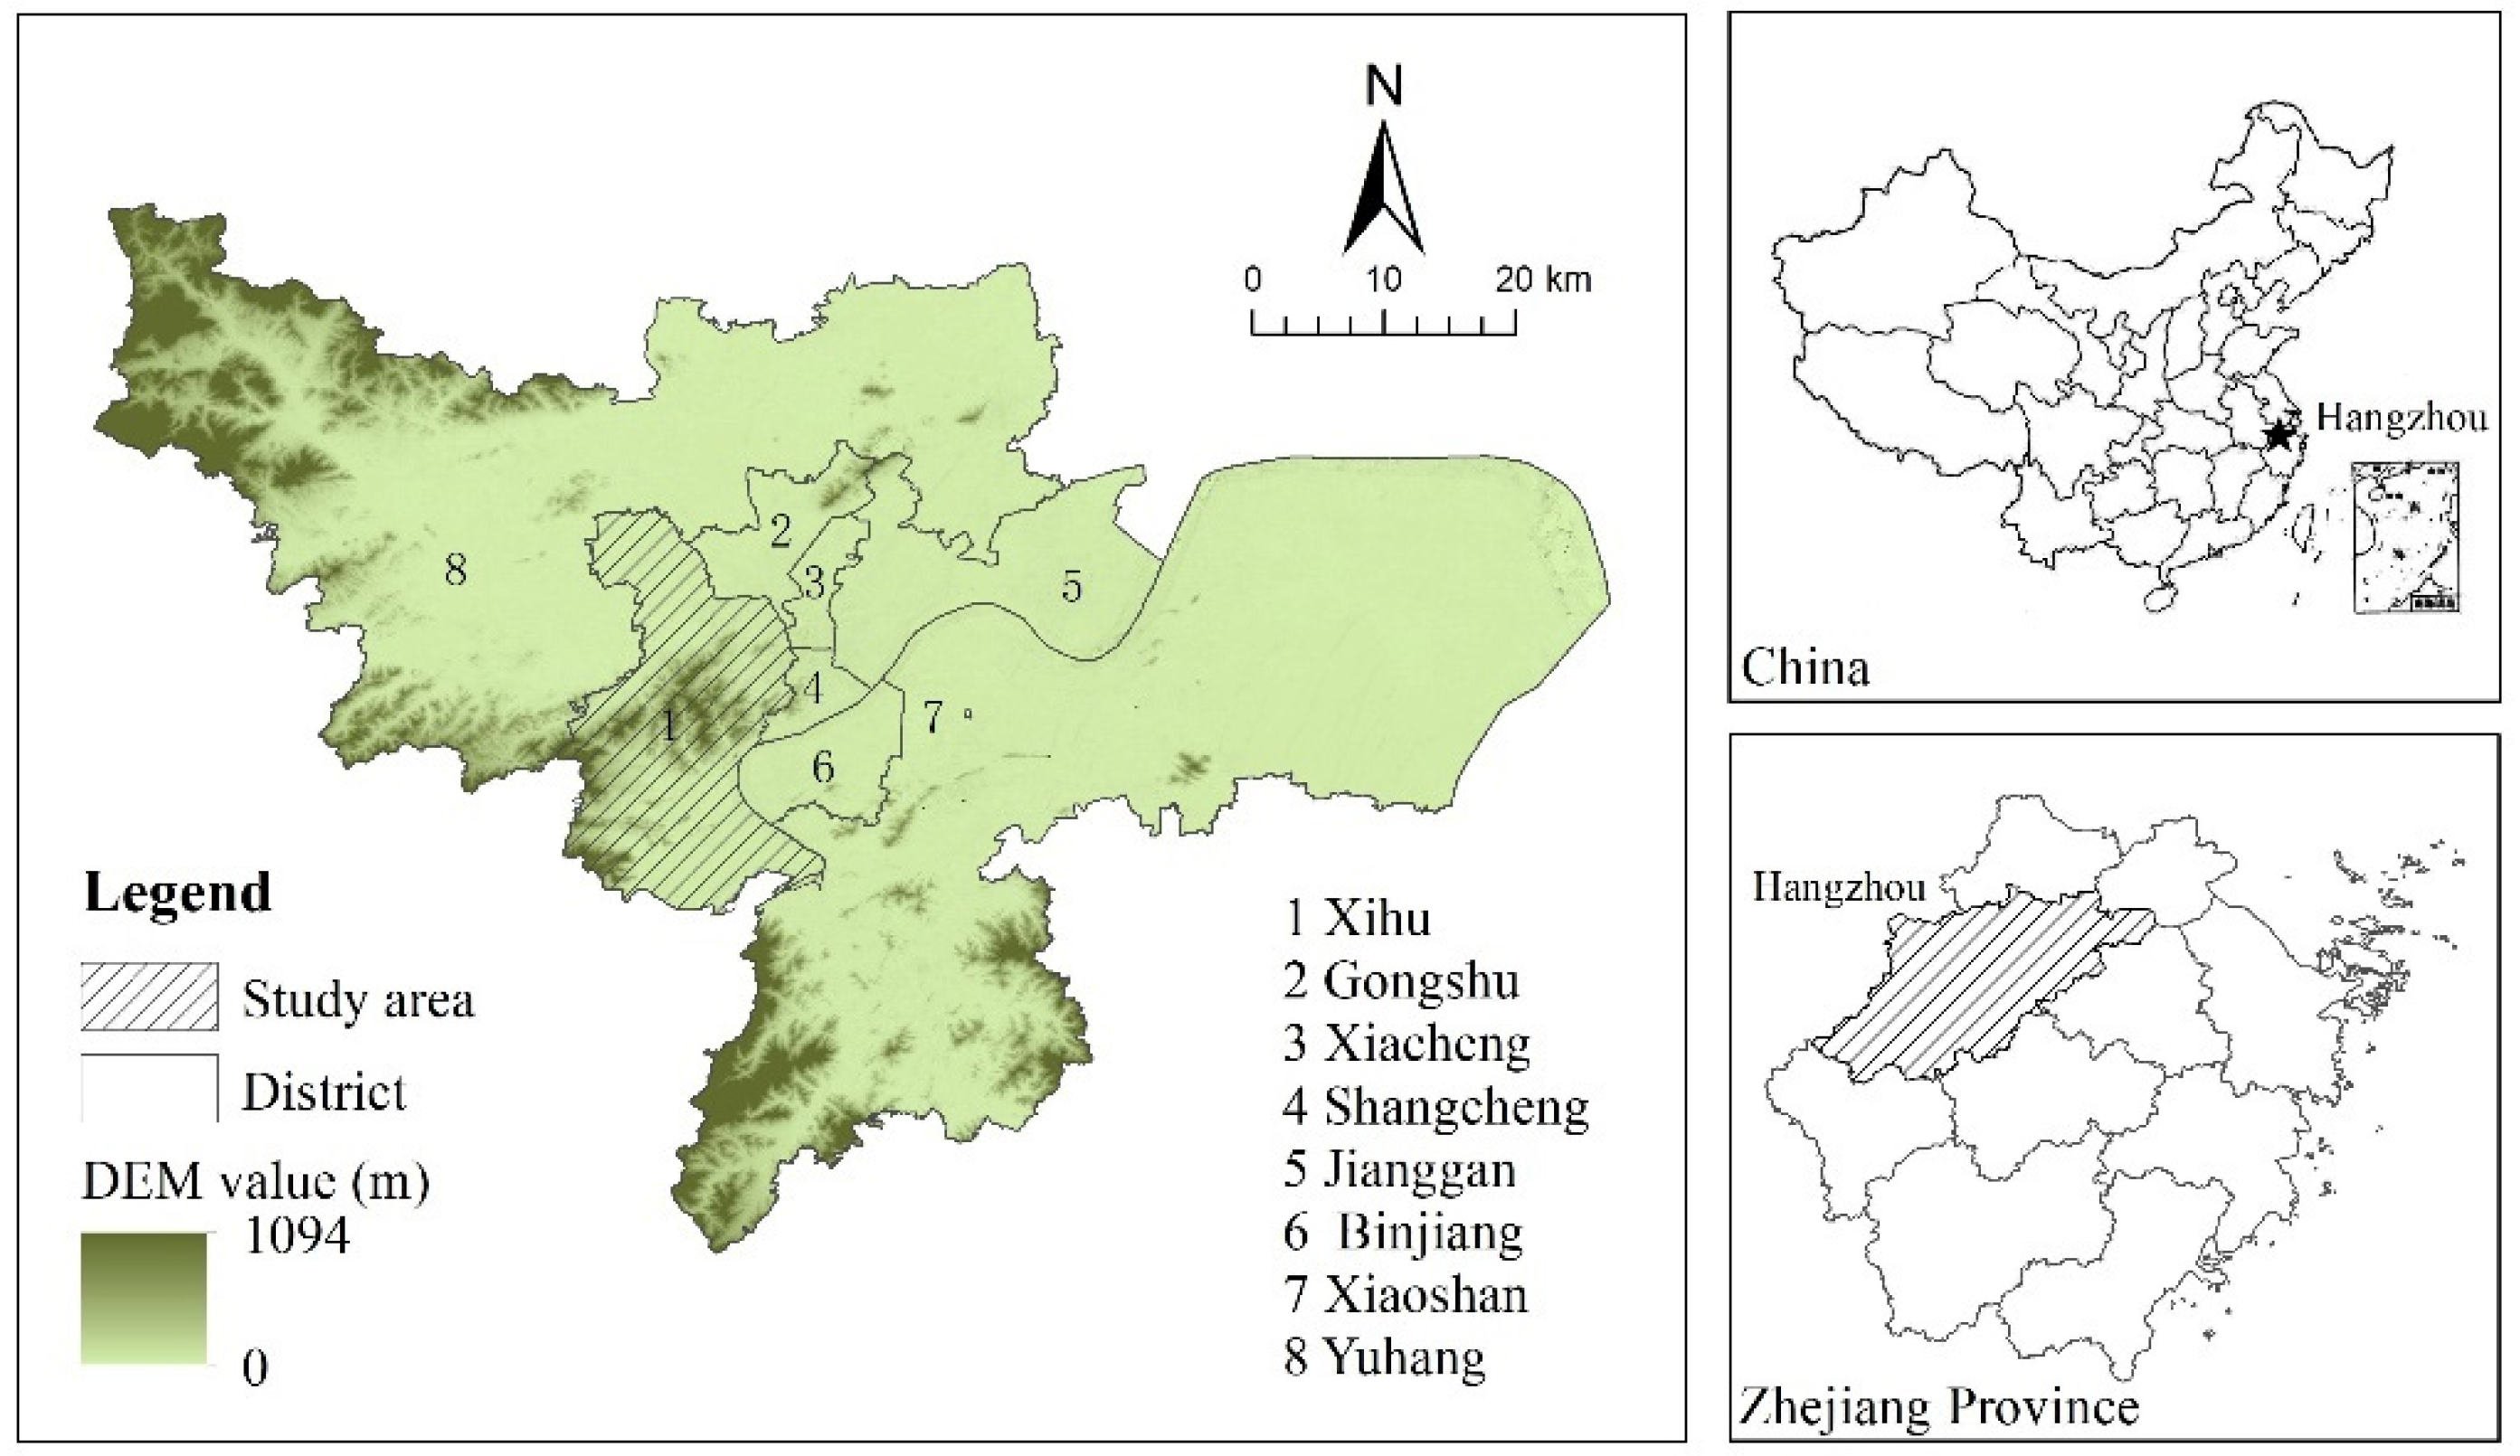
The data used in this research were collected from Xihu District, Hangzhou, China (
Figure 1). Hangzhou is a metropolitan city with a population of 12.376 million, located in the north of the southeast coast of China, northern Zhejiang Province. The city has a typical subtropical monsoon climate that is warm and humid, with obvious alternation of four seasons, sufficient light and abundant rainfall. The average annual rainfall is 1546 mm. Xihu District is located in the west of the main city zone of Hangzhou, covering an area of 312.43 square kilometers. According to China’s “Classification Standards for UGS” (CJJ/T85-2017) and based on the classification standards for UGS in the “UGS System Planning of Hangzhou (2002-2020)” (
Table 1), combined with field investigations, all existing good and valuable UGS in Xihu District were selected for research, including 24 community-level UGS, 1 district-level UGS (Tanshan Park) and 4 municipal-level UGS (Xixi National Wetland Park, West Lake Scenic Area, Hangzhou Chengxi Leisure Park, and Hangzhou Dinosaur Dream Park) (
Figure 2).
2.2. Data Collection Questionnaire
The questionnaire was distributed between September and December 2019. The survey time included working days and rest days. The respondents (except children) were randomly selected to ensure the validity of the sample data. A total of 1086 questionnaires were distributed to 29 UGS in Xihu District (including 653 community-level UGS and 433 district- and municipal-level UGS); a total of 974 valid questionnaires were collected (including 600 community-level UGS and 374 district- and municipal-level UGS), and the effective rate of the questionnaire was 89.6%. The questionnaire included the basic information of the respondents, the use of UGS, health benefits, and the quality and quantity factors that affect their choice to use UGS.
3. Methods
3.1. Evaluation Method of Health Benefits of UGS
3.1.1. Selection of Evaluating Indicators
The theoretical and case research results of scholars on the relationship between UGS and public health are analyzed, and the selection criteria of evaluation indicators are diverse. The improvement of self-reported health (SRH) [
12,
16,
20] and body mass index (BMI) [
21,
22]; the reduction in the number of the obesity rate, the recovery of negative emotions, loneliness, and feelings of loss; the increase of social support [
23,
24,
25]; and other health indicators are used to evaluate the health benefits obtained by UGS use.
Based on the relevant research results, according to the principles of comprehensiveness, hierarchy, distinction and logic of indicator selection, the health benefits obtained by the public using UGS are divided into two categories: overall health and subdividing health. Among them, SRH was used to evaluate overall health. Second, according to the definition of health by the World Health Organization (WHO) (‘health refers to the good state of physical, psychological and social adaptation, not just the absence of disease or weakness’) and referring to the criteria for dividing health in relevant studies (the impact of green space on residents’ health mainly focuses on three aspects: physical, mental and social health), this research further divides health into physical health, mental health and social health. Finally, considering the availability of data, this research identified indicators to evaluate the health benefits obtained by the public using UGS (
Table 2).
3.1.2. Quantification of Indicators
(1) Overall health
The SRH of the respondents was obtained through questionnaires. The respondents were asked to rate their health on a 5-point Likert scale (1=extremely negative, 2=negative, 3=average, 4=positive, 5=extremely positive).
(2) Subdividing health
Respondents were also asked ‘do you think using this UGS is beneficial to your health’ and told to rate their responses on a 5-point Likert scale (1=No benefit, 2=Basically no benefit, 3=A little benefit, 4=Beneficial, 5=Very beneficial). Respondents were also asked ‘What are the benefits of regular PA in UGS for your health’, and the answer choices were ‘to reduce obesity’, ‘to reduce the risk of common diseases’ and other previously determined subdividing indicators of subdividing health.
3.2. The Quantity and Quality Factors Affecting the Health Benefits of UGS
3.2.1. Selection of Factors
(1) Quantity factors
Traditional quantitative indicators such as per capita UGS area, UGS service radius, and UGS coverage ratio ignore the relationship between UGS spatial distribution and accessibility. In this regard, foreign scholars used ‘accessibility/distance/proximity/availability’ and ‘green space coverage ratio’ indicators, and used buffer or network analysis tools of ArcGIS to carry out research on the relationship between UGS, PA and public health [
12,
26,
27]. By analyzing the existing research results, two quantity factors of ‘distance to UGS’ and ‘effective UGS service area ratio’ are determined:
1) Distance to UGS:
The distance between the respondents’ home and the nearest entrance to the UGS they used.
2) Effective service area ratio:
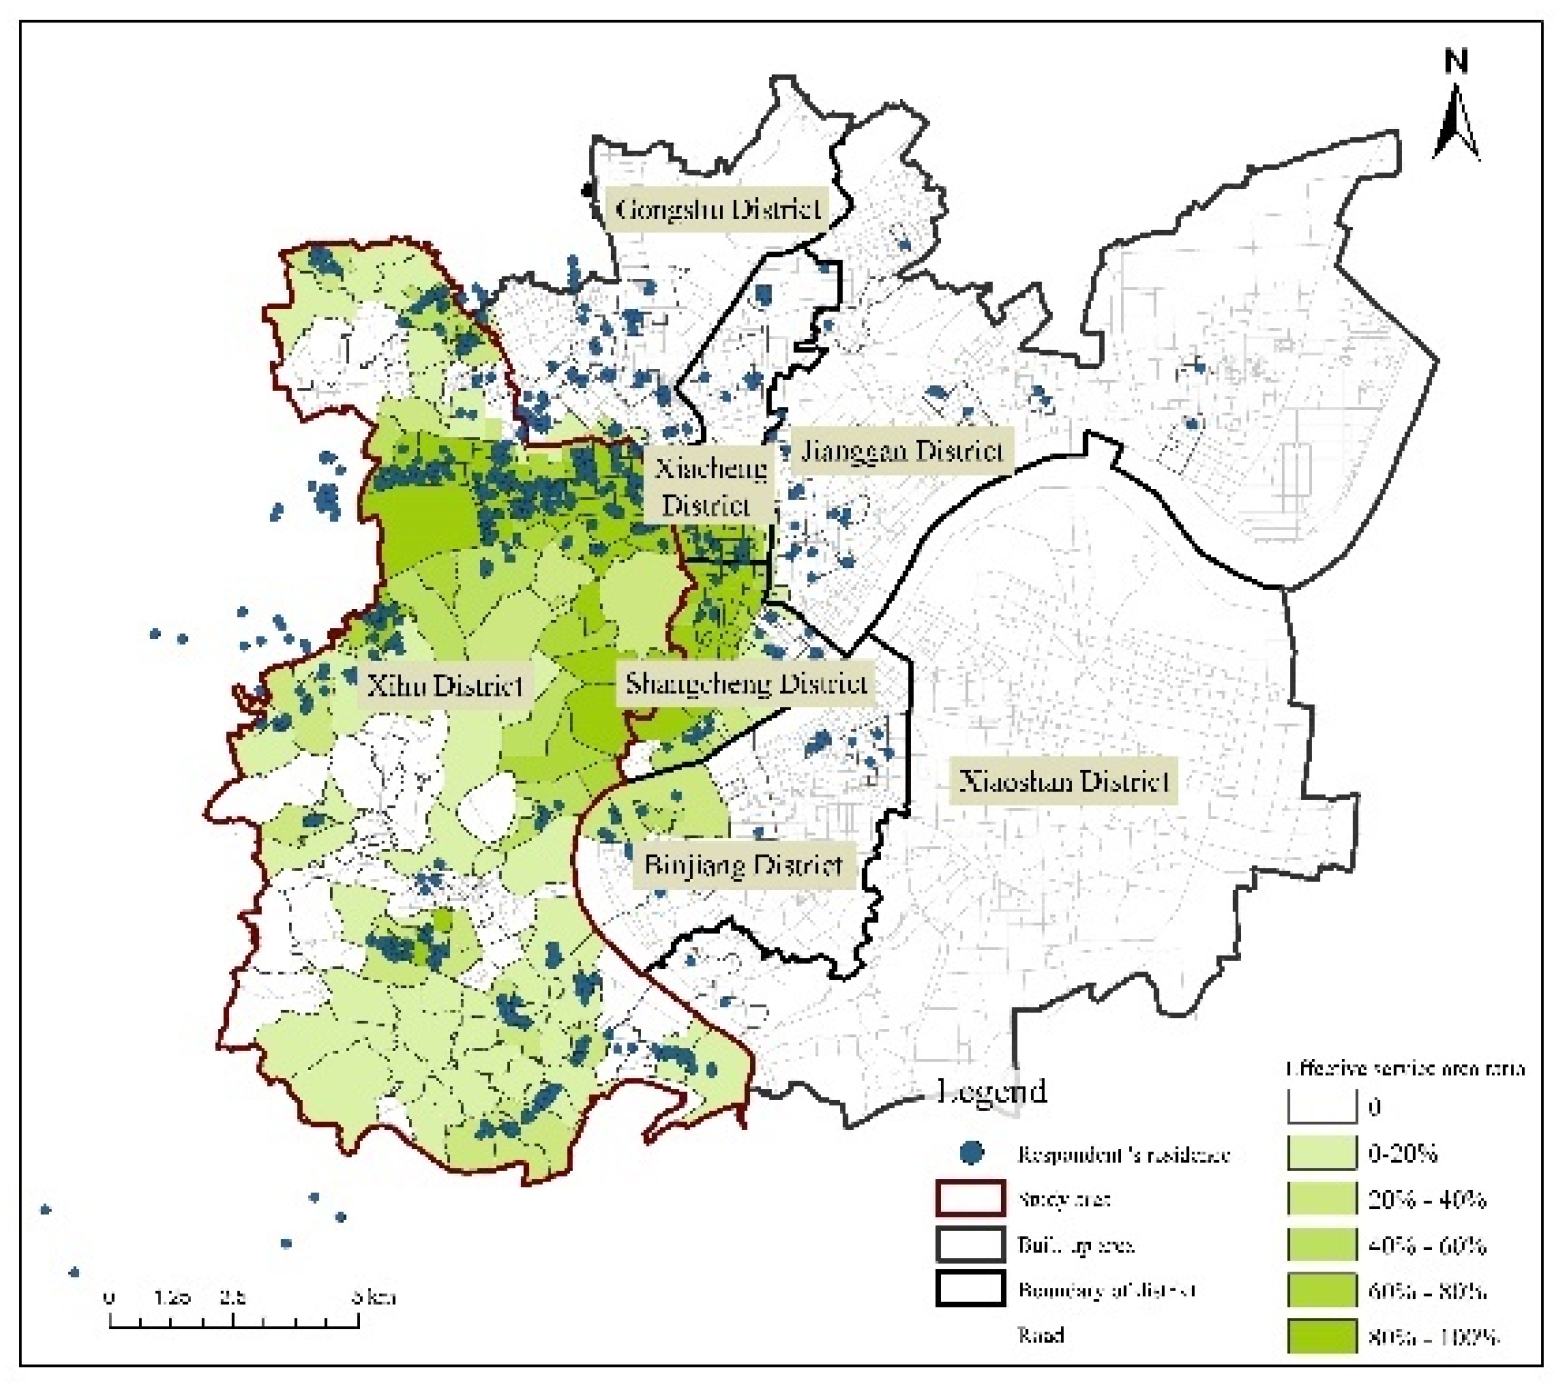
The ratio of UGS service area to research unit area. The formula is as follows: Grj = Gsj/Acj. In the formula, Grj is the effective UGS service area ratio of research unit j (the area of the community where the respondents live in this research), Gsj is the effective UGS service area within research unit j, and Acj is the area of research unit j. In addition, because people can only use one UGS at the same time, when calculating the effective UGS area in research unit j, if there is partial or complete overlap in the effective service range of two or more UGS, the overlapping part will not be repeatedly included in the effective service area of UGS in this research unit j.
(2) Quality factors
Existing research results show that the quality of UGS is closely related to their health benefits [
18,
26]. Based on the consultation of designers, experts and scholars and considering the availability of research data and the practical guiding value of research conclusions, 12 quality factors affecting UGS health benefits were selected from three aspects: planning quality, design quality and management and maintenance quality.
The quantity and quality factors of UGS health benefits selected in this research are shown in
Table 3.
3.2.2. Analysis of Factors
(1) Quantity factors
1) Distance to UGS
Through the questionnaire, the information of the respondents’ residence, the mode of transportation to the UGS, the length of transportation, and the calculation of the distance to UGS are obtained.
2) Effective service area ratio
First, the community where the respondents live is obtained through questionnaires. ArcGIS was used to calculate the community area. Second, based on the road network data of the study area, according to the service radius of UGS at all levels stipulated in the “UGS System Planning of Hangzhou (2002-2020)”, the effective service area of UGS in Xihu District is calculated by the ArcGIS network analysis method. Finally, the calculation formula is input into ArcGIS to model and calculate the effective service area ratio of UGS.
(2) Quality factors
The score of quality factors is obtained by questionnaire. The respondents were asked to evaluate the quality factors (e.g., charge, landscape, largeness) on a 5-point Likert scale.
(3) Multivariate regression analysis
Based on the obtained data, SPSS software is used to conduct multilevel and multicategory multivariate regression analysis and finally determine the factors that have a practical impact on people’s access to health benefits in the context of quantitative and qualitative UGS factors.
4. Results
4.1. Demographics
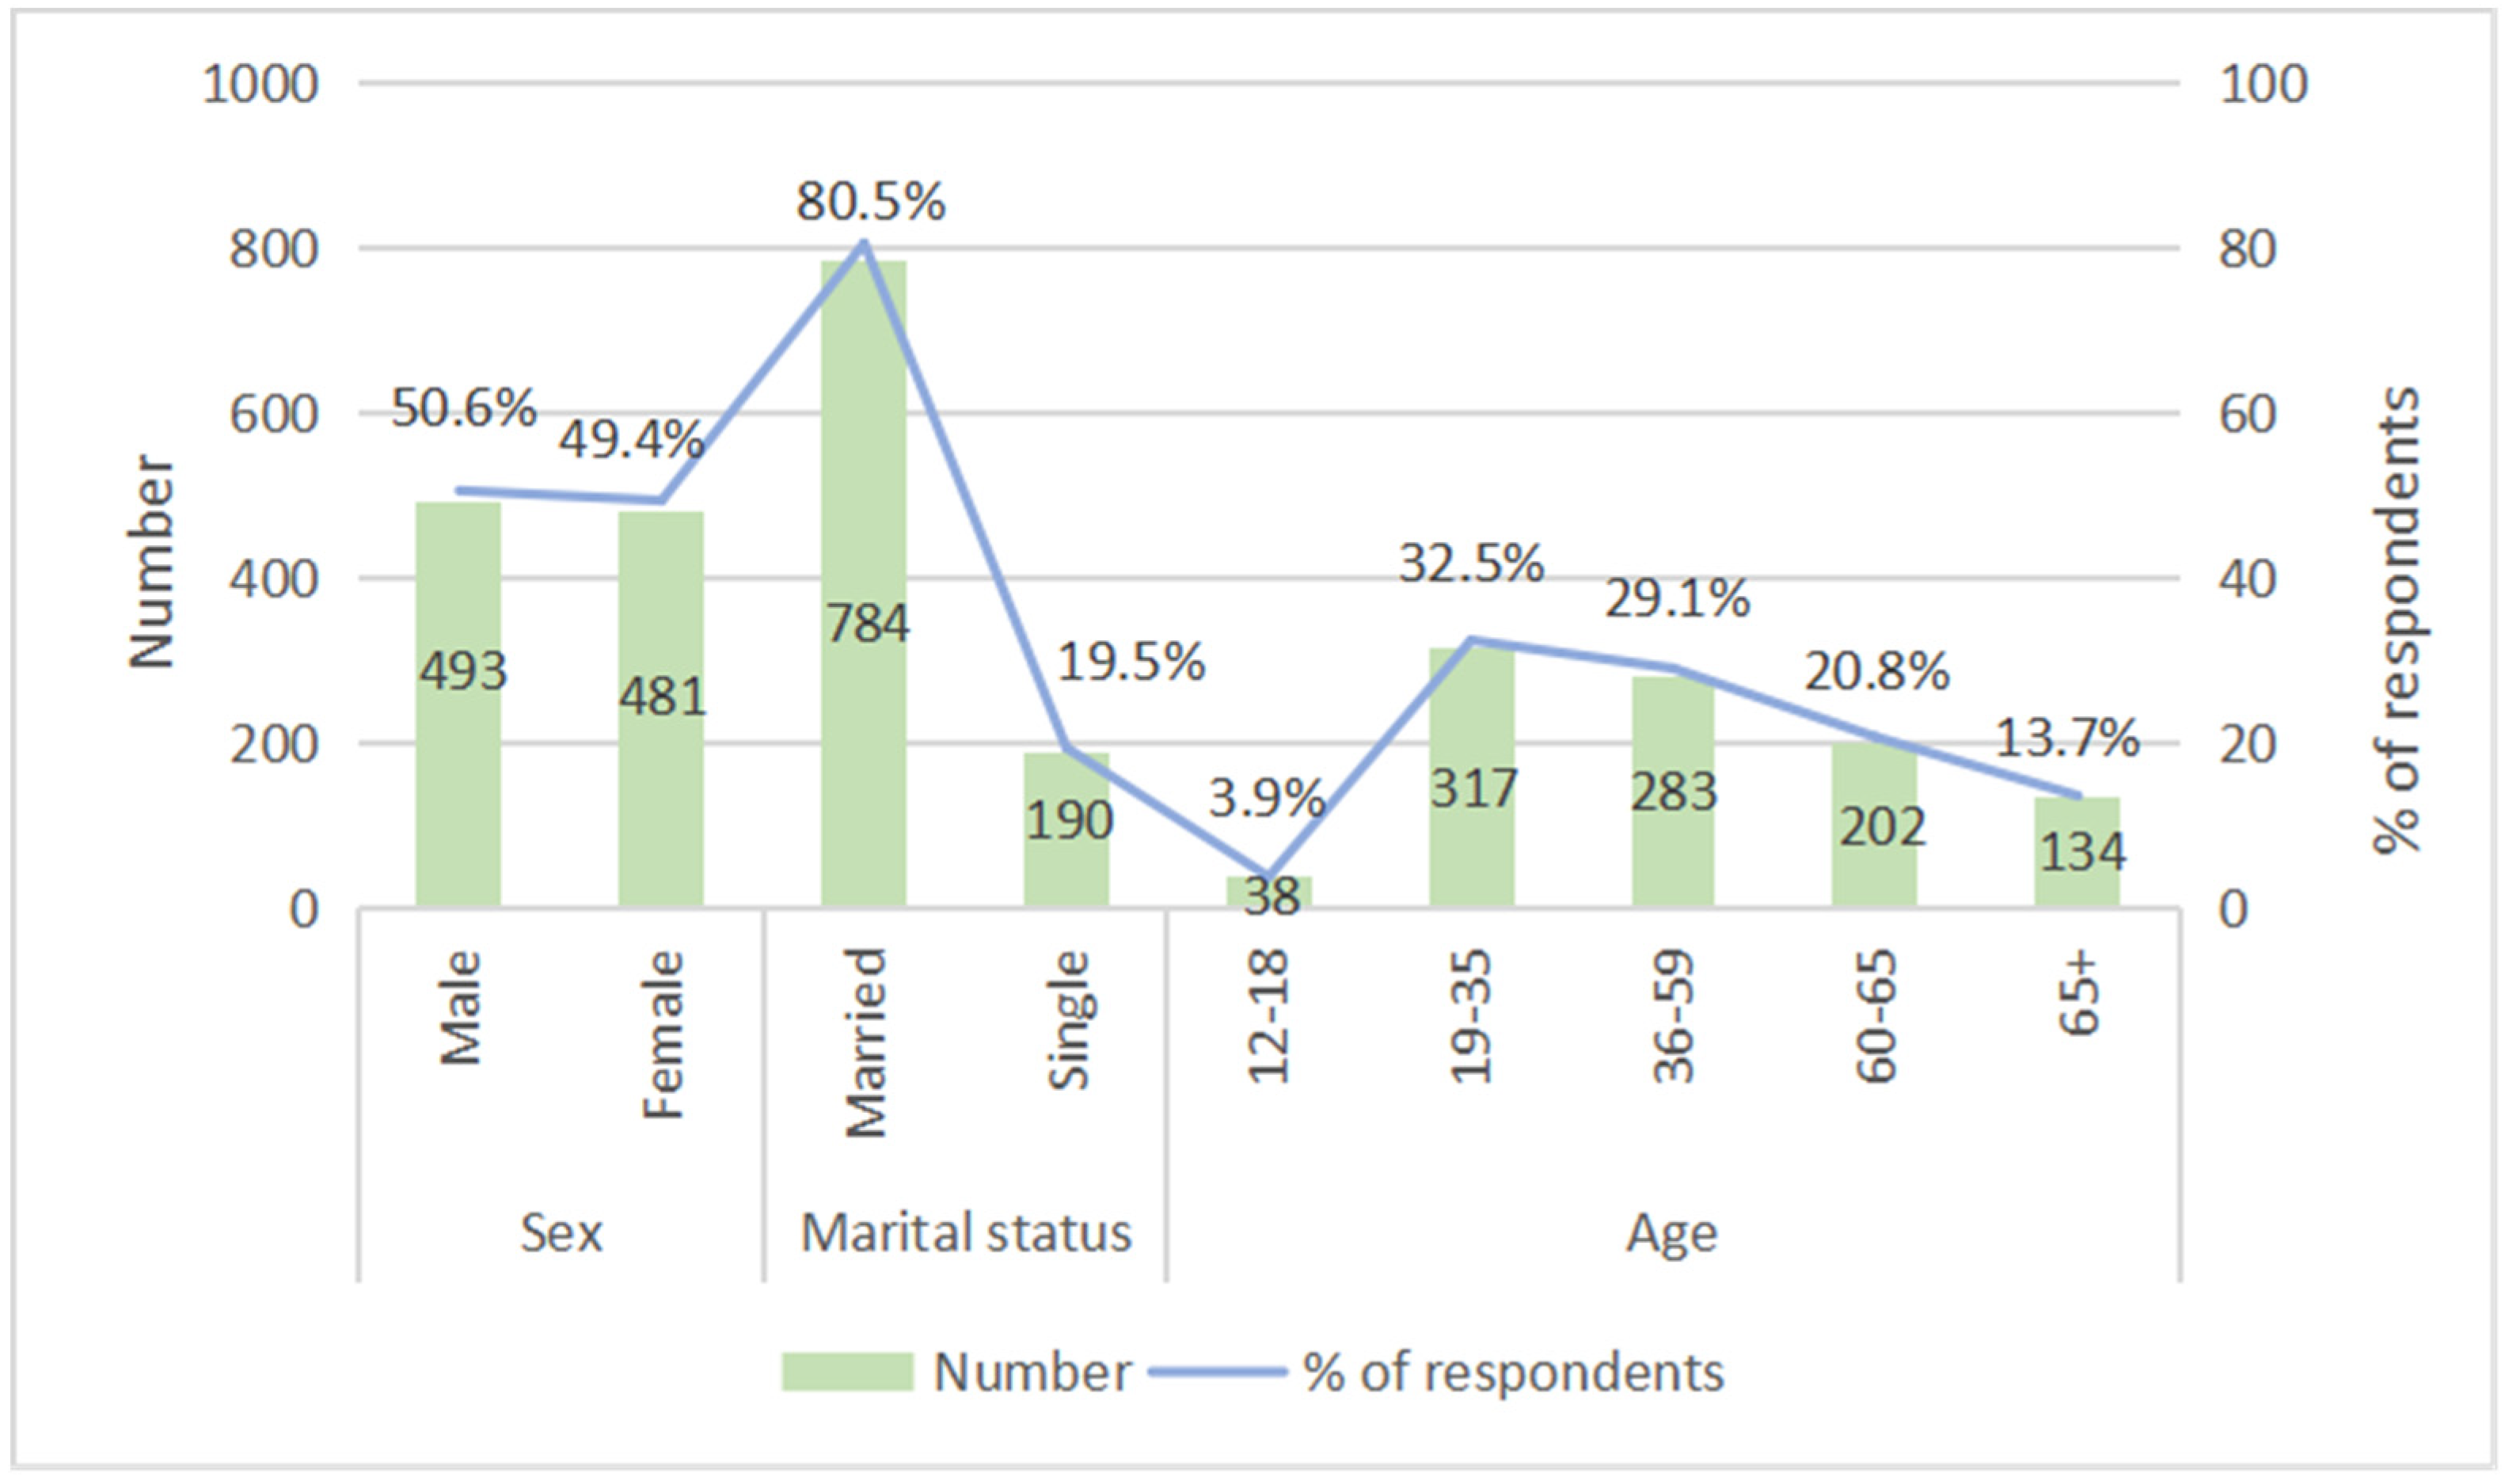
The basic information of respondents was collected (
Figure 3). The respondents were mainly adults, of which 32.5% were 19-35 years old, 29.1% were 36-59 years old, and 34.5% were over 60 years old. Among the respondents, 50.6% were male and 49.4% were female. A total of 80.5% of the respondents were married, while 19.5% were single. On the whole, the age distribution and gender distribution of the sample respondents are relatively balanced and representative.
4.2. Frequency, Duration and Type of PA
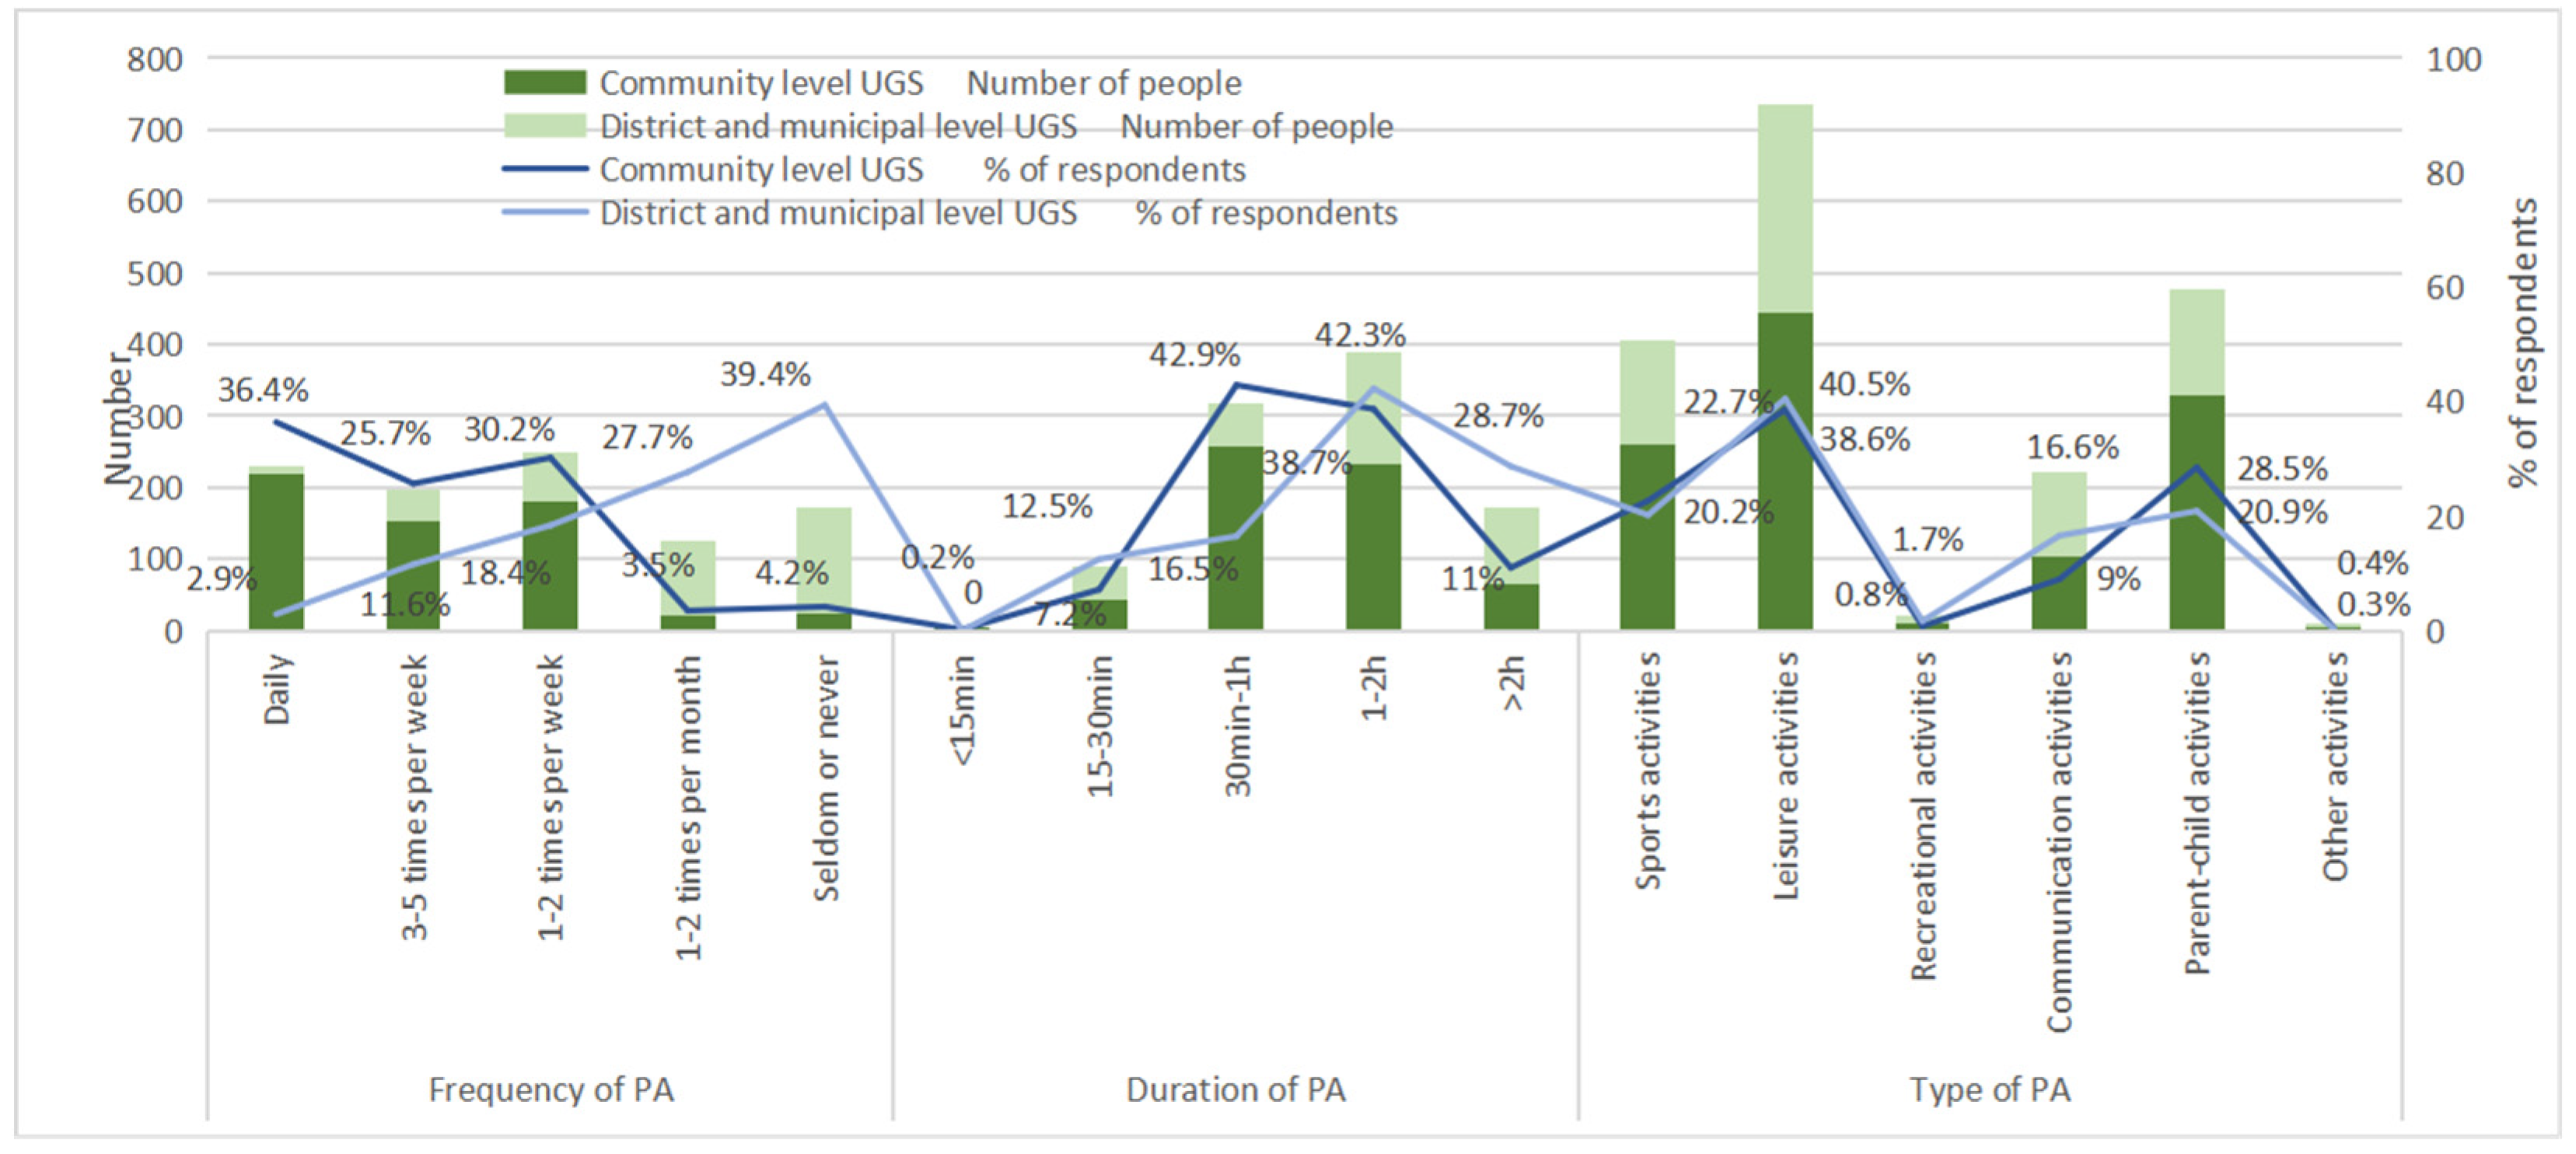
In terms of the PA of UGS, the statistical results show (
Figure 4) that for PA frequency and duration, respondents use community-level UGS with high frequency and high intensity, while the frequency of UGS use in district- and municipal-level parks is much lower than that of community-level UGS. However, in contrast, the duration of each use of district- and municipal-level UGS was longer than that of community-level UGS. For UGS activity types, respondents have relatively small differences in the choice of PA types in UGS at the community level, district level, and municipal level. They are more inclined to carry out recreational activities (community level accounts for 38.6%, district and municipal level accounts for 40.5%) and parent–child activities (community level accounts for 28.5%, district and municipal level accounts for 20.9%), followed by sports activities (community level accounts for 22.7%, district and municipal level accounts for 20.2%), and communication activities (community level accounts for 9%, district and municipal level accounts for 16.6%). According to the existing research results, PA will have a positive effect on people’s physical, psychological and social health.
4.3. Health Benefits
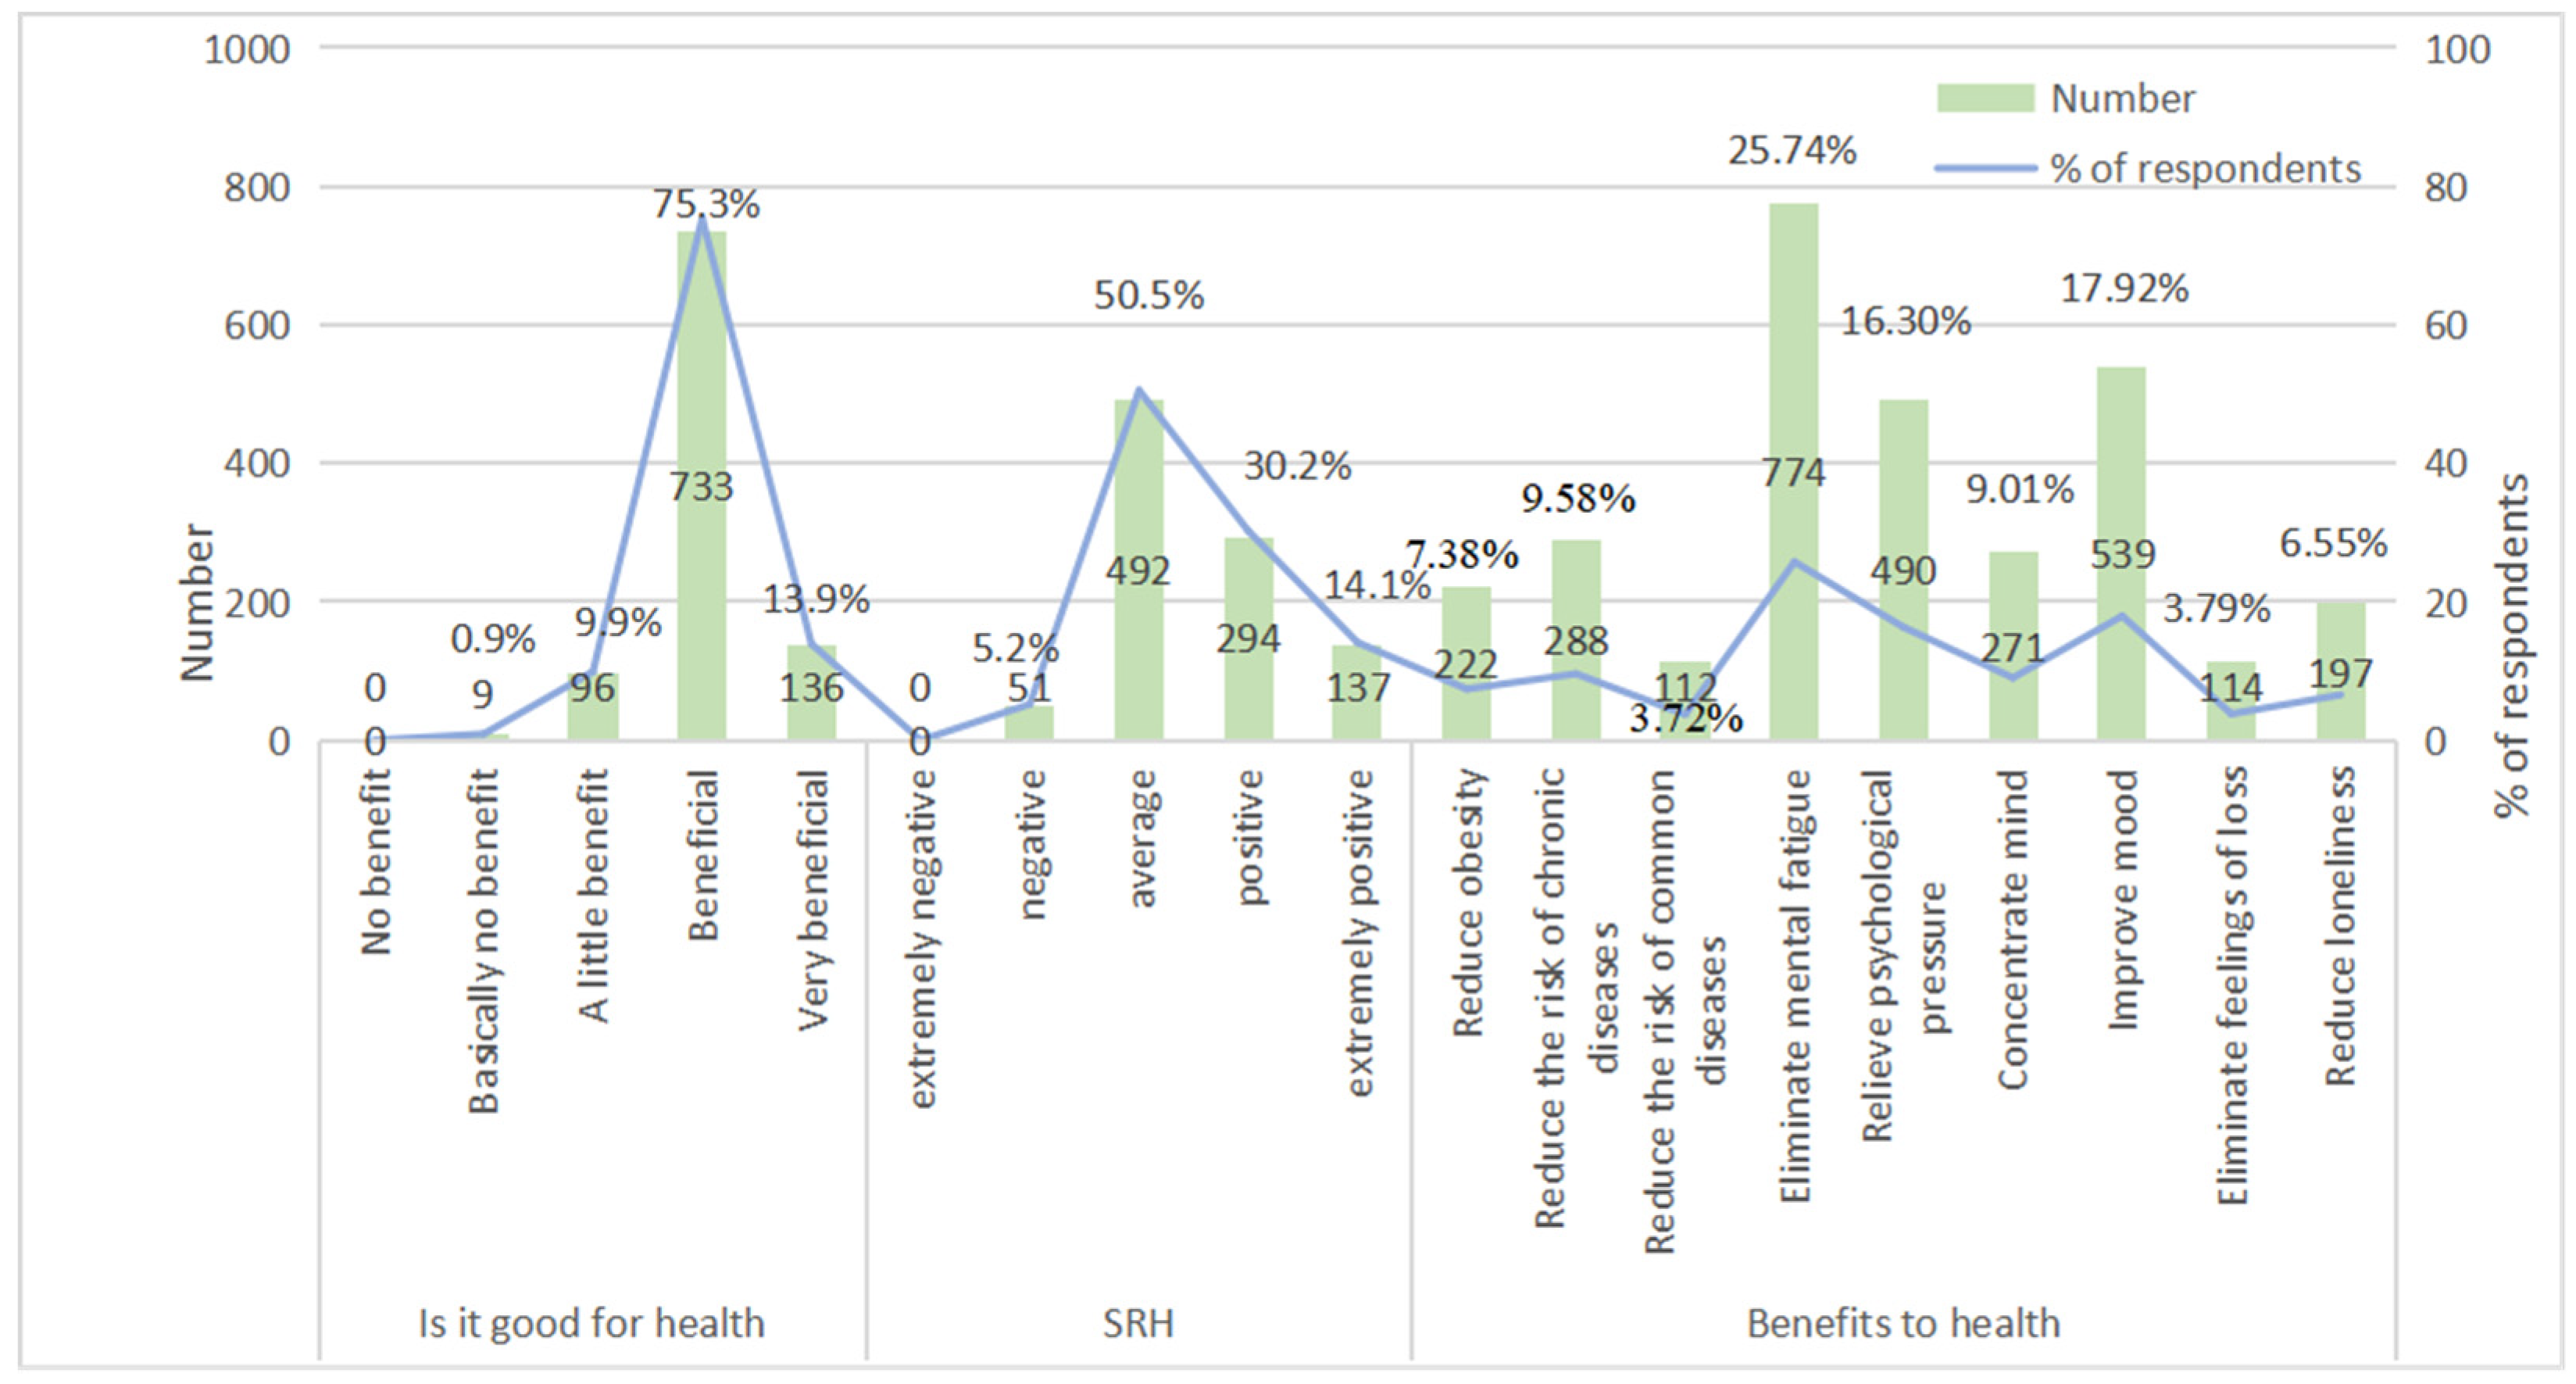
In terms of health benefits (
Figure 5), for overall health indicators, approximately 89.2% of respondents were positive about the health benefits of using UGS (respondents believed that using UGS was “beneficial” and “very beneficial” to health); 9.9% of respondents believed that using UGS had “a little benefit”. The SRH data showed that most respondents had positive evaluations of their health. For subdividing health indicators, respondents believe that the main benefits of UGS activities are mental health benefits, among which the elimination of mental fatigue is the highest. The recognition of physical health benefits is higher than that of social health benefits.
4.4. Associations between Health Benefits and Quantity Factors of UGS
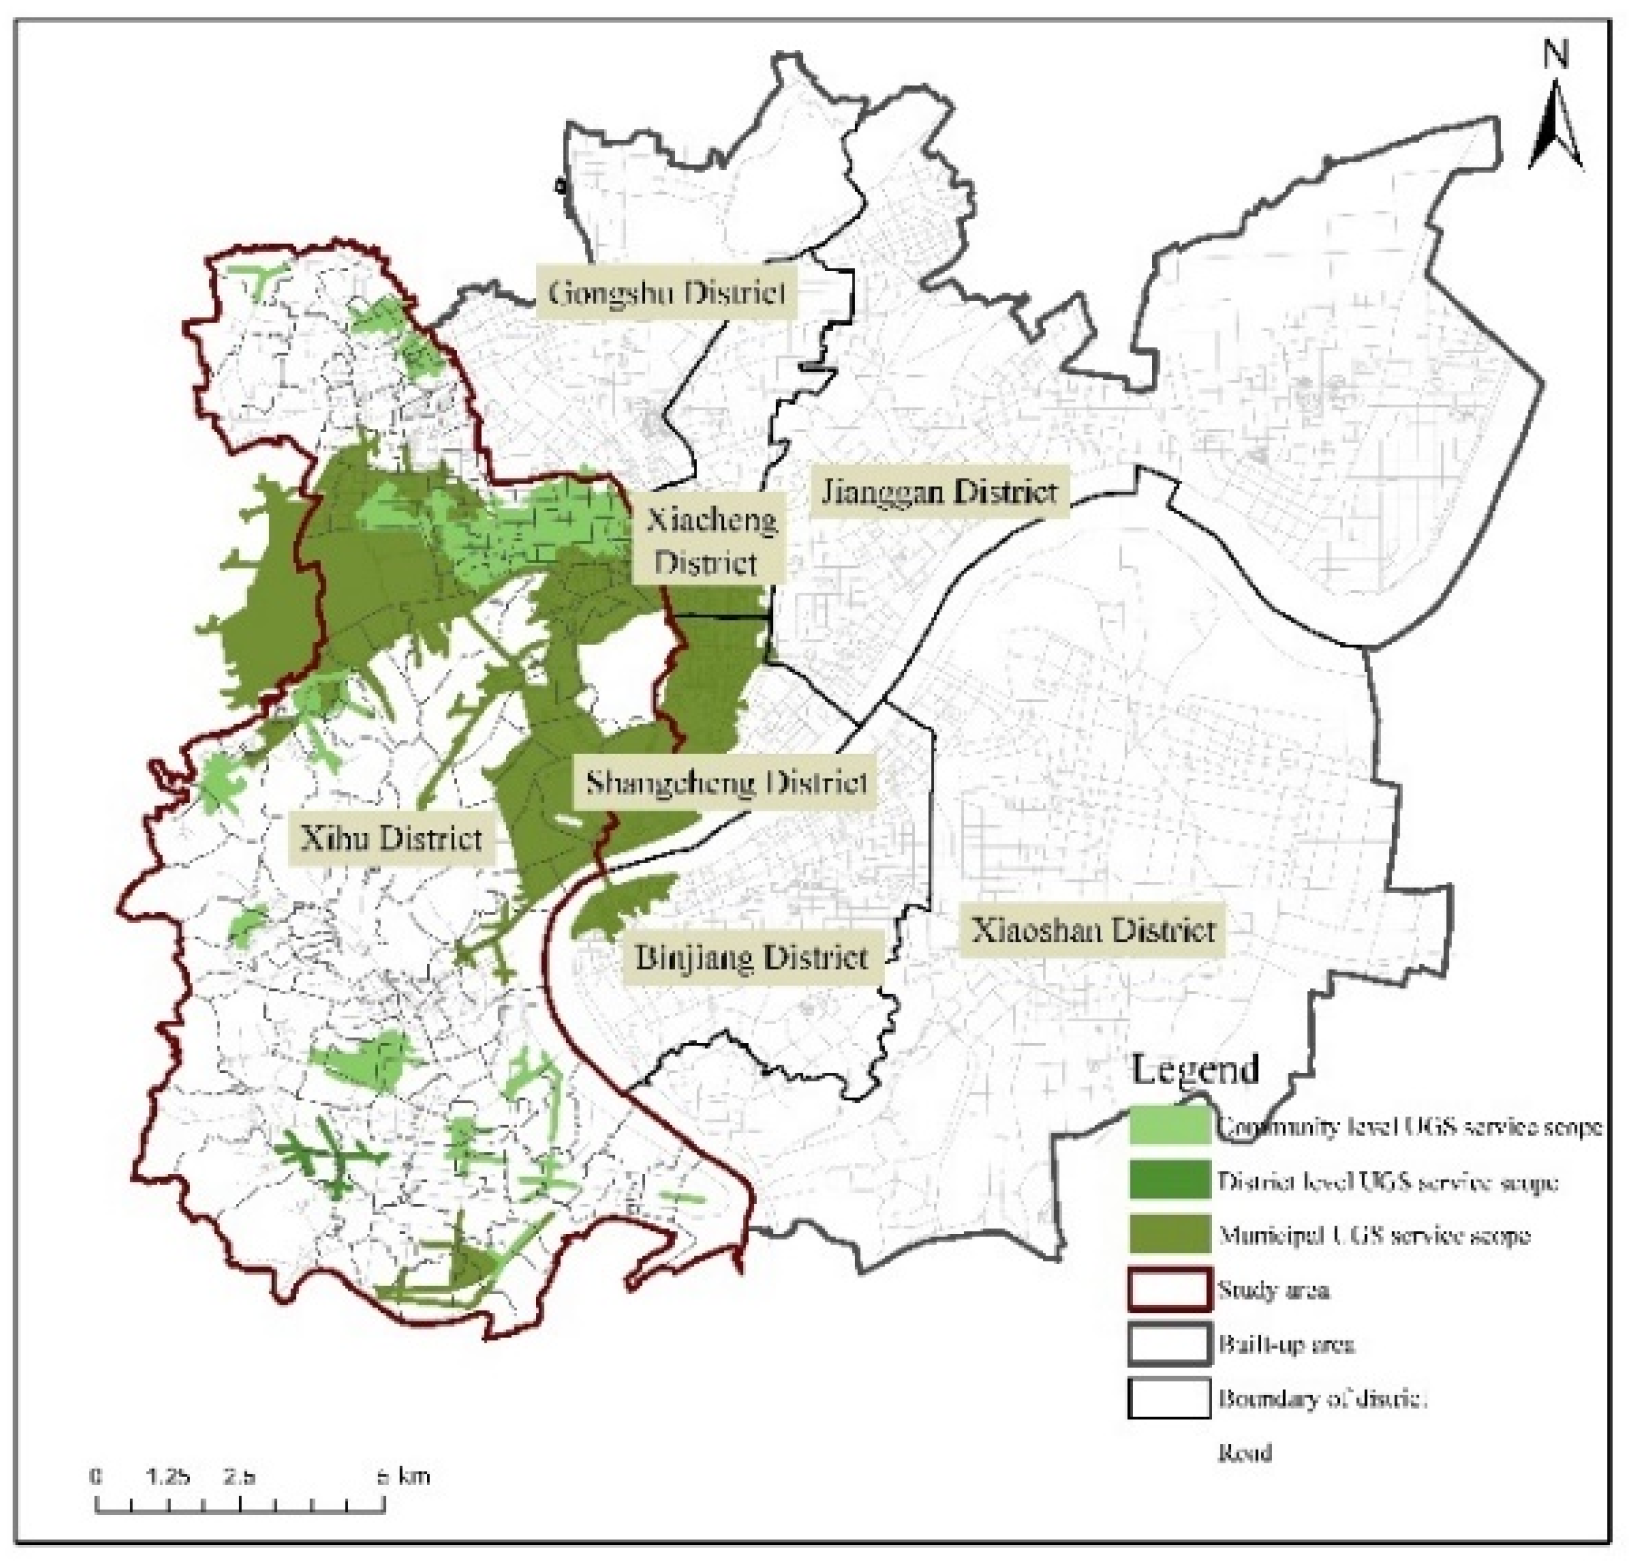
Based on the basic data obtained from the questionnaire, the distance between the respondents and UGS was calculated. The ArcGIS network analysis method was used to calculate the service scope and effective service area ratio of UGS at the community, district and municipal levels (
Figure 6 and Figure 7). SPSS software was used to analyze the associations between the health benefits obtained by the respondents and the quantity factors of UGS.
In terms of the associations between UGS quantity factors and overall health (
Table 4), the distance to UGS was significantly negatively associated with the SRH of respondents, and the effective service area ratio was significantly positively associated with the SRH of respondents; that is, the closer the distance to an UGS and the higher the effective service area ratio of the UGS, the better the SRH of respondents.
In terms of the associations between UGS quantity factors and subdividing health (
Table 5), the distance to UGS was significantly negatively associated with physical health and mental health; that is, the shorter the distance to UGS, the greater the physical health benefits and mental health benefits obtained by the respondents. The effective service area ratio of UGS is positively associated with social health; that is, the higher the effective service area ratio of UGS is, the greater the social health benefits obtained by respondents.
The associations between different UGS quantity factors and the health indicators of respondents were further analyzed. The distance to UGS is divided into five virtual variables (thresholds): 1) < 500 m (reference distance), 2) 500- < 1 km, 3) 1 km- < 1.5 km, 4) 1.5 km- < 2 km, and 5) ≥ 2 km. The effective service area ratio is divided into five virtual variables (threshold): 1) ≥ 80% (reference ratio), 2) < 80-60%, 3) < 60-40%, 4) < 40-20%, and 5) < 20-0%. We analyzed whether there is a threshold when the distance to UGS and the effective service area ratio affect the use of UGS to obtain health benefits.
The results showed that compared with the reference distance (< 500 m), the distance to UGS (1.5 km- < 2 km) and the distance to UGS (≥ 2 km) were significantly negatively associated with the SRH of the respondents (
Table 6). Compared with the reference ratio (≥ 80%), the effective service area ratio (< 20-0%) and the effective service area ratio (< 40-20%) were significantly negatively associated with the SRH of the respondents (
Table 7). That is, compared to respondents with the best reference distance, the SRH of respondents whose distance to UGS is greater than 1.5 km is worse; compared to respondents with the best reference ratio, respondents with an effective service area ratio of less than 40% had poor SRH.
4.5. Associations between Health Benefits and Quality Factors of UGS
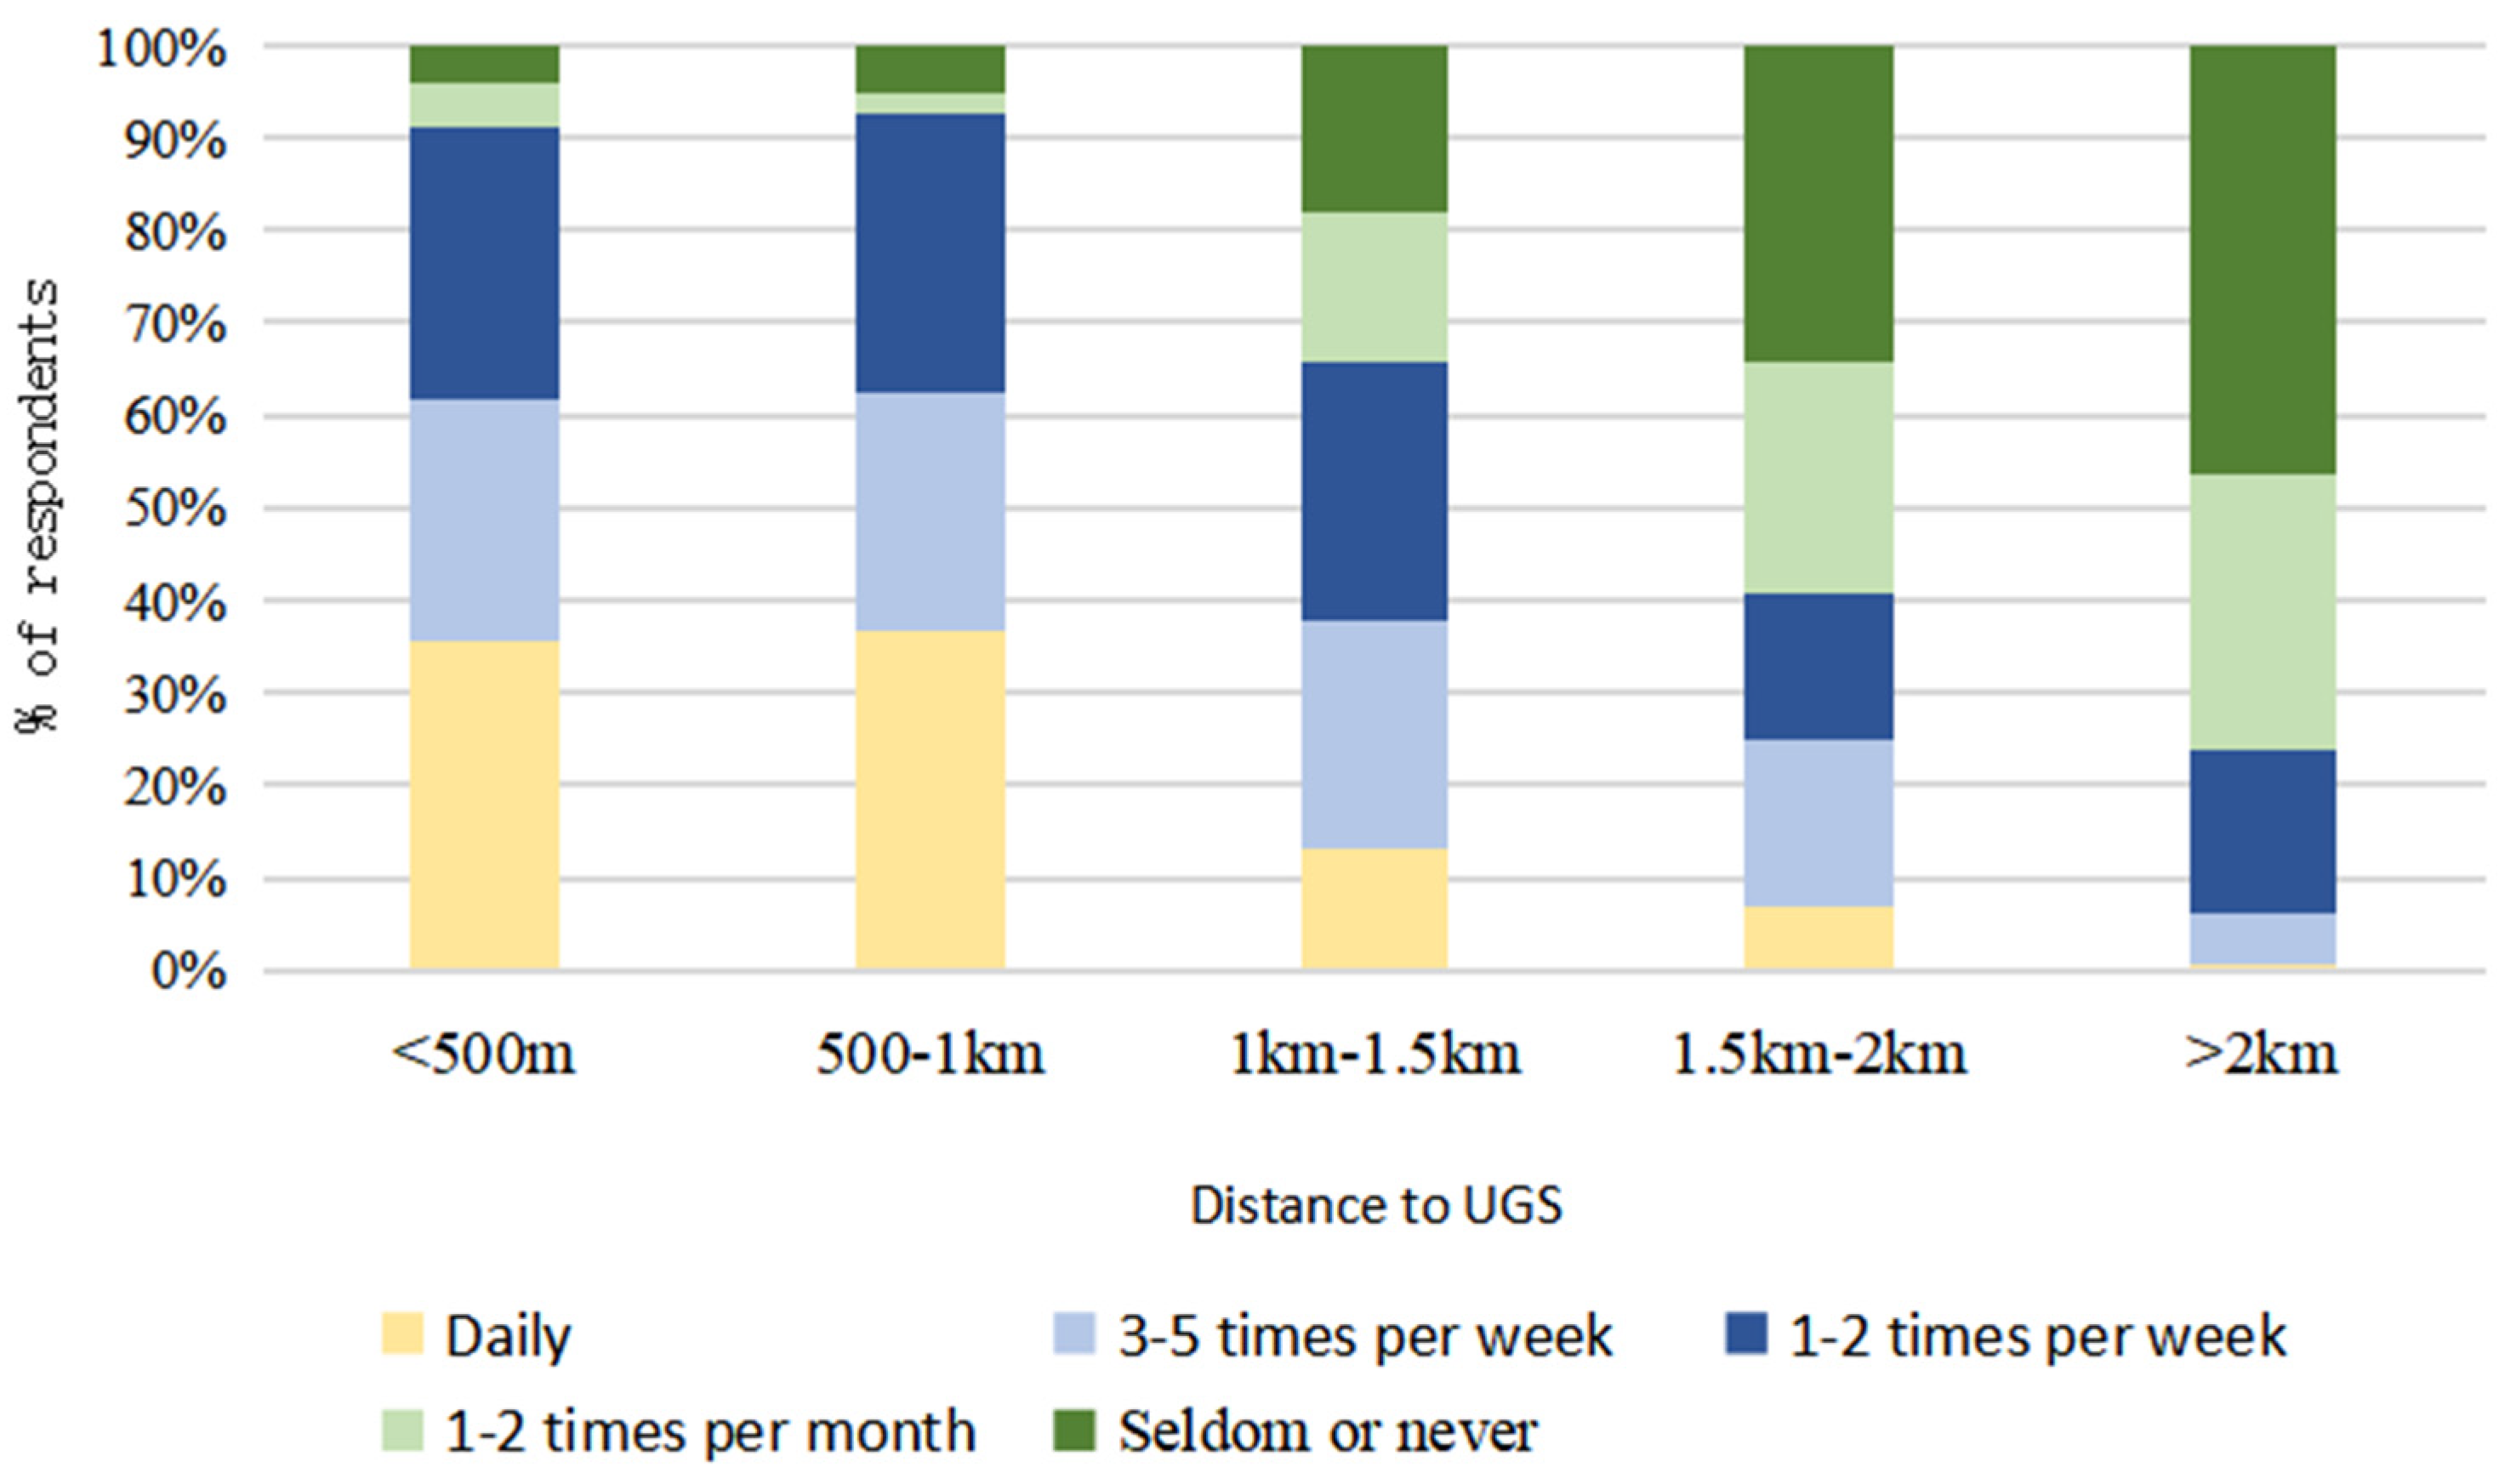
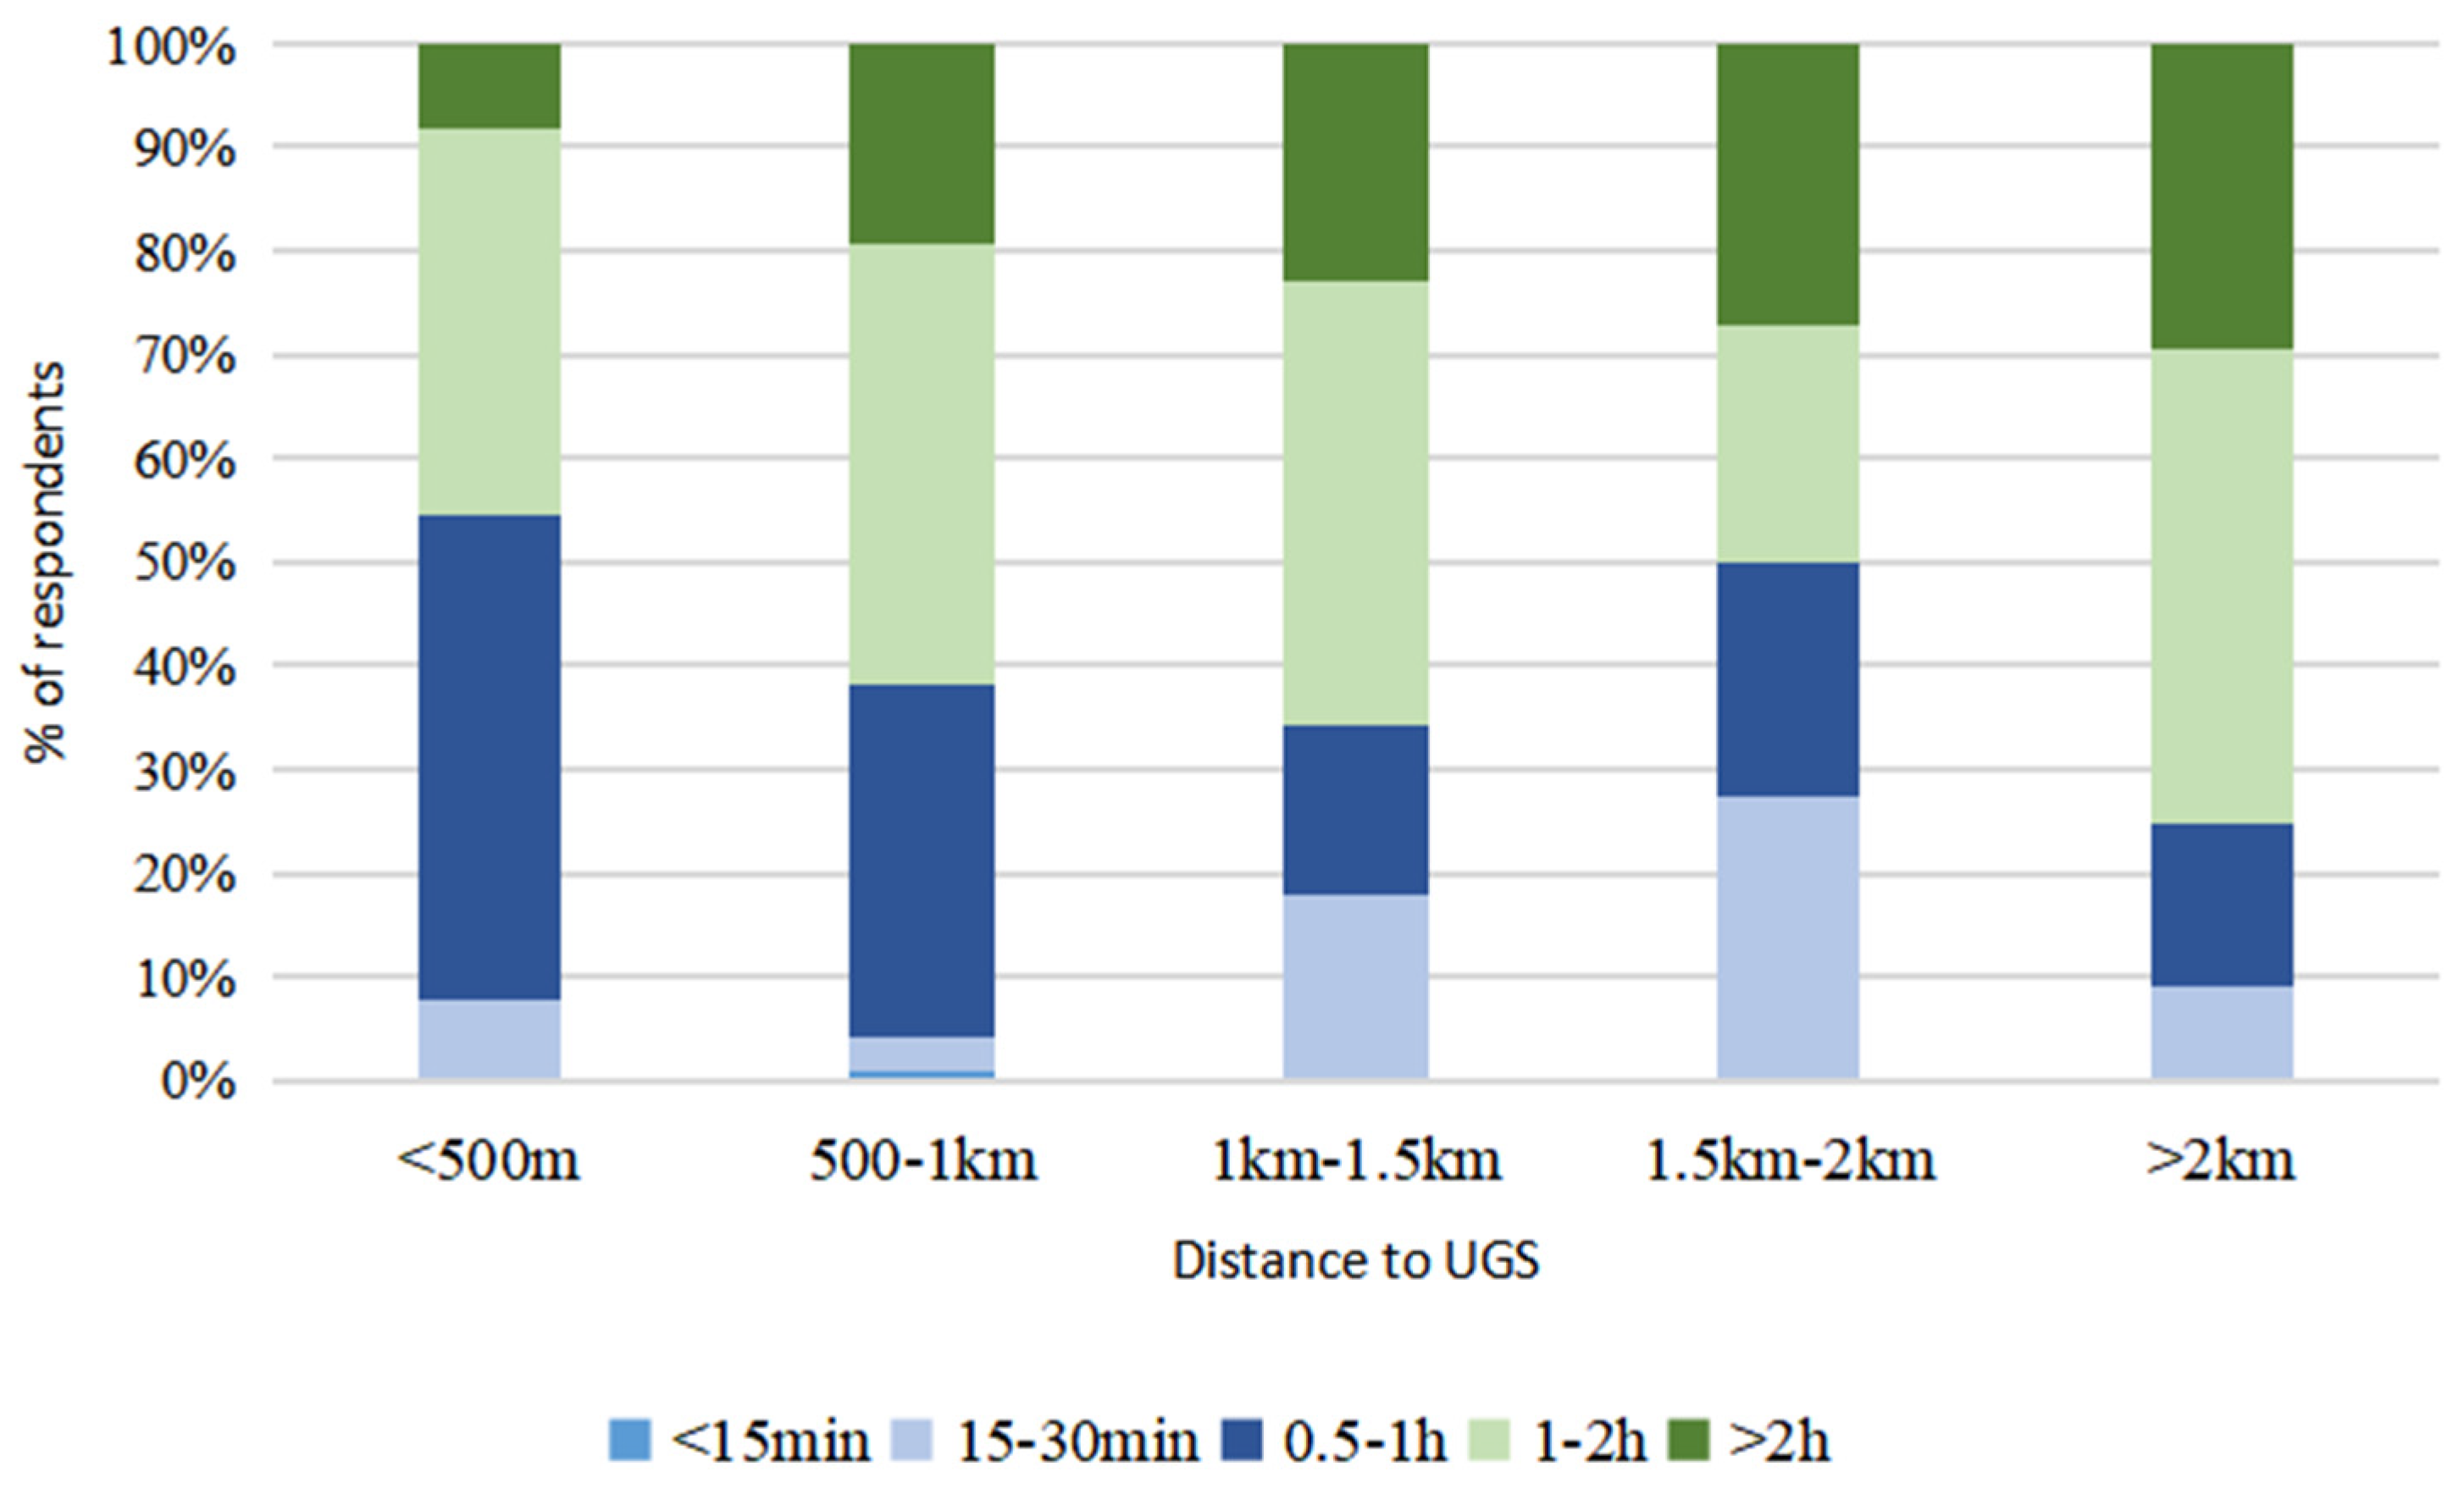
The associations between UGS distance and the frequency and duration of PA were analyzed (
Figure 8 and Figure 9). As the distance to UGS increases, the PA frequency decreases significantly, but the frequency of long-term PA (≥1 hour) in UGS increases significantly (except for the ‘blank zone’ between the district-level UGS and municipal-level UGS service ranges, that is, 1.5 km-2 km).
The associations between UGS quality factors and the frequency and duration of PA were analyzed (
Table 8). The distance to UGS and whether the UGS has costs associated with it are significantly negatively associated with the frequency of PA. Whether an UGS is accessible is significantly positively associated with the frequency of PA. No other significant associations were observed with the frequency of PA. That is, for the respondents, the closer the distance to an UGS and the better the accessibility of UGS, the greater the frequency of PA. Whether the park has costs associated with it will have a negative effect on people’s choice to use UGS. The distance to UGS, rest facilities and UGScleanliness were significantly positively associated with the duration of PA. Functional diversity was significantly negatively associated with the duration of PA. No other significant associations were observed with the duration of PA. That is, for the respondents, the farther the distance to the UGS, the more complete the rest of the UGS facilities, and the better the UGS cleanliness, then the longer the respondents’ PA time in the UGS. The stronger the functional diversity in the UGS, the shorter the PA time.
The associations between quality factors of UGS, frequency and duration of PA, and overall health were analyzed (
Table 9). The distance to UGS was significantly negatively associated with SRH. The duration of PA was significantly positively associated with SRH. No other significant associations were observed with SRH. That is, for the respondents, the closer the distance to UGS and the longer the PA time in the UGS, the better the SRH of the respondents.
Combined with the associations between quality factors of UGS and frequency and duration of PA, duration of PA was significantly positively associated with leisure facilities and cleanliness of UGS and significantly negatively associated with functional diversity. It can be concluded that the distance to UGS, leisure facilities and cleanliness of UGS have a clear positive effect on the use of UGS and the acquisition of overall health benefits, while functional diversity has a reverse effect.
The associations between quality factors of UGS, frequency and duration of PA, and subdividing health were analyzed (
Table 10). The physical health of the respondents was significantly positively associated with the frequency of PA and significantly negatively associated with the distance to UGS. The mental health of respondents was positively associated with the frequency and duration of PA and UGS cleanliness. The social health of the respondents was significantly positively associated with the frequency of PA and the size and cleanliness of UGS and significantly negatively associated with their distance to UGS. In summary, the distance to UGS, cleanliness and size of UGS, and frequency and duration of PA have a clear positive effect on the subdividing health benefits of respondents. Combined with the relationship between UGS quality factors and the frequency and duration of PA, the frequency of PA is significantly positively associated with UGS accessibility and is significantly negatively associated with whether the UGS has costs associated with it. The duration of PA is significantly positively associated with leisure facilities and UGS cleanliness and is significantly negatively associated with functional diversity. It can be concluded that the five factors of distance to UGS, accessibility, leisure facilities, cleanliness and largeness of UGS have a clear positive effect on the use of UGS and the acquisition of subdividing health benefits, while whether the UGS has costs associated with it and functional diversity have a reverse effect.
5. Discussion
Based on the above research results, this research proposes UGS planning and design strategies for improving residents’ health benefits. In terms of quantity, first, the number and distribution density of UGS should be reasonably determined. Most of the users of community-level UGS are residents living around UGS, and most of them are elderly people who usually choose to walk to UGS. Considering the weak travel ability of elderly individuals, the service radius of UGS should be set at approximately 500 m to ensure that elderly individuals can reach UGS on foot within 10 minutes. When the distance between UGS and the residence of the respondents is greater than 1.5 km, it is significantly negatively associated with the health of the respondents. Under the condition of balanced distribution and basic indicators, the effective service radius of district-level UGS should be set at 1 km-1.5 km, and the effective service radius of municipal-level UGS should be set at approximately 2 km. Second, the spatial coverage of UGS should be reasonably determined. When the effective service area ratio of UGS is less than 40%, it is significantly negatively associated with the SRH of respondents. Therefore, 40% of the UGS service area ratio should be guaranteed during planning. UGS at all levels should follow the principle of balanced distribution of resources. The planning should consider the function and landscape connection between UGS at all levels.
In terms of quality, we should first build an accessible path. Because the distance to UGS and accessibility have an important effect on the health benefits of residents, when planning UGS, we should not only pay attention to the requirements of quantity, scale and service radius but also pay attention to the connection between UGS and the green space system and walking system. High-quality road networks, comfortable walking routes and good accessibility can enhance residents’ willingness to visit UGS and effectively extend residents’ duration of PA, thereby increasing the health benefits of UGS for the public. Second, various functional spaces that support diverse activities should be created. For recreational activities, people are more inclined to use semiprivate, private dotted or planar spaces. For communication activities, an open or semi-open linear or planar space should be created. For sports activities, it is necessary to reasonably plan activity venues according to the different needs of residents, configure fitness venues of different sizes, and reasonably distinguish functional spaces for different groups of people. For parent–child activities, attention should be given to the design of children’s recreational facilities and the creation of soft lawns to ensure children’s play and improve safety. Finally, the health intervention of UGS should be strengthened. UGS with good accessibility, large scale, perfect leisure facilities and good cleanliness can increase the frequency of residents’ visits, thus improving the health status of residents. Therefore, UGS accessibility and scale should be strengthened in UGS planning. In the design of UGS, attention should be given to the rational allocation of leisure facilities and the maintenance of cleanliness after the completion and during the operation of UGS, and active health intervention should be the focus of UGS planning and design to fully take advantage of the benefits of UGS on public health.
In the correlation analysis of UGS health benefits and their quality factors, a result that seems to violate common sense was found: the stronger the functional diversity of UGS, the shorter the PA time of respondents in UGS. Leisure activities and parent–child activities rank as the top two PA types of respondents, which need a quiet, safe and comfortable environment. UGS with strong functional diversity may have a noisy environment, resulting in respondents who prefer quieter settings not wanting to stay in them for a long time; this results in significant negative associations between UGS functional diversity and PA duration in UGS. This needs to be further verified by examples to guide the configuration of functional sites in UGS design.
There are some limitations in this research. Although this research is only devoted to exploring the relationship between the quantity and quality of UGS and public health, the results show that there is not a simple linear relationship between demographic characteristics (covariate factors, such as sex and age) and residents’ health. In the future, further research can be done on the differences between different groups of people. For example, in the context of an aging society, it is unclear how to meet the needs of the elderly population in UGS system planning and how to consciously carry out age-appropriate UGS design. In the study of UGS quality and public health, this research only determines the quality influencing factors from three aspects: planning quality, design quality and management and maintenance quality, which has certain limitations. In a follow-up study, the influencing factors can be further expanded, such as increasing the influencing factors of UGS spatial perception and refining the influencing factors of UGS design, to provide a more comprehensive and detailed theoretical basis and optimization strategy for the planning and design of UGS for the purpose of improving residents’ health.
6. Conclusions
Like many developing countries, China’s rapid urbanization has made UGS increasingly difficult to protect. In China, most citizens do not have a private garden; therefore, UGS are the main place for citizens to engage in PA and have a positive effect on improving people’s health. Protecting and maintaining UGS to meet the growing demand for leisure and recreation activities is a challenge for cities in developing countries. This research focuses on the health of citizens as the starting point and comprehensively evaluates the relationship between the quantity and quality factors of UGS and the health benefits of citizens. The results show that the two quantity factors of distance to UGS and effective service area ratio play an important role in promoting respondents’ use of UGS and health benefits, but the effect of distance to UGS is more obvious. The four quality factors of accessibility, leisure facilities, cleanliness and size have a clear positive effect on respondents’ use of UGS and health benefits. UGS charges and functional diversity have a reverse effect. This research expands the value of urban and rural planning disciplines by strengthening the active intervention of UGS on residents’ health and provides theoretical and methodological guidance for the future construction of UGS to promote benefits to residents’ physical and mental health, which has broad application prospects.
Author Contributions
Shanfeng Zhang: Conceptualization, Methodology, Writing—review & editing, Funding acquisition, Validation. Ming Fang: Formal analysis, Data curation, Writing—review & editing. Jiayun Hu: Resources, Writing—original draft. All authors have read and agreed to the published version of the manuscript.
Funding
This study was supported by the Zhejiang Provincial Natural Science Foundation of China (Grant No. LY18C160007), National Natural Science Foundation of China (Grant No. 41301176).
Data Availability Statement
If you have any data requirements, you can provide the request to this email: fm85021126@163.com.
Conflicts of Interest
The authors declare no conflict of interest.
References
- Han, K.-T. A Reliable and Valid Self-Rating Measure of the Restorative Quality of Natural Environments. Landsc. Urban Plan. 2003, 64, 209–232. [Google Scholar] [CrossRef]
- Gesler, W.M. Therapeutic Landscapes: Theory and a Case Study of Epidauros, Greece. Environ. Plan. Soc. Space 1993, 11, 171–189. [Google Scholar] [CrossRef]
- Lau, S.S.Y.; Yang, F. Introducing Healing Gardens into a Compact University Campus: Design Natural Space to Create Healthy and Sustainable Campuses. Landsc. Res. 2009, 34, 55–81. [Google Scholar] [CrossRef]
- Hansmann, R.; Hug, S.-M.; Seeland, K. Restoration and Stress Relief through Physical Activities in Forests and Parks. Urban For. Urban Green. 2007, 6, 213–225. [Google Scholar] [CrossRef]
- Velarde, M.D.; Fry, G.; Tveit, M. Health Effects of Viewing Landscapes – Landscape Types in Environmental Psychology. Urban For. Urban Green. 2007, 6, 199–212. [Google Scholar] [CrossRef]
- Kaplan, S. The Restorative Benefits of Nature: Toward an Integrative Framework. J. Environ. Psychol. 1995, 15, 169–182. [Google Scholar] [CrossRef]
- Berto, R. Exposure to Restorative Environments Helps Restore Attentional Capacity. J. Environ. Psychol. 2005, 25, 249–259. [Google Scholar] [CrossRef]
- Markevych, I.; Tiesler, C.M.T.; Fuertes, E.; Romanos, M.; Dadvand, P.; Nieuwenhuijsen, M.J.; Berdel, D.; Koletzko, S.; Heinrich, J. Access to Urban Green Spaces and Behavioural Problems in Children: Results from the GINIplus and LISAplus Studies. Environ. Int. 2014, 71, 29–35. [Google Scholar] [CrossRef] [PubMed]
- Balseviciene, B.; Sinkariova, L.; Grazuleviciene, R.; Andrusaityte, S.; Uzdanaviciute, I.; Dedele, A.; Nieuwenhuijsen, M.J. Impact of Residential Greenness on Preschool Children’s Emotional and Behavioral Problems. Int. J. Environ. Res. Public. Health 2014, 11, 6757–6770. [Google Scholar] [CrossRef]
- Schipperijn, J.; Ekholm, O.; Stigsdotter, U.K.; Toftager, M.; Bentsen, P.; Kamper-Jørgensen, F.; Randrup, T.B. Factors Influencing the Use of Green Space: Results from a Danish National Representative Survey. Landsc. Urban Plan. 2010, 95, 130–137. [Google Scholar] [CrossRef]
- Peschardt, K.K.; Stigsdotter, U.K. Associations between Park Characteristics and Perceived Restorativeness of Small Public Urban Green Spaces. Landsc. Urban Plan. 2013, 112, 26–39. [Google Scholar] [CrossRef]
- Coppel, G.; Wüstemann, H. The Impact of Urban Green Space on Health in Berlin, Germany: Empirical Findings and Implications for Urban Planning. Landsc. Urban Plan. 2017, 167, 410–418. [Google Scholar] [CrossRef]
- Bowler, D.E.; Buyung-Ali, L.M.; Knight, T.M.; Pullin, A.S. A Systematic Review of Evidence for the Added Benefits to Health of Exposure to Natural Environments. BMC Public Health 2010, 10, 456. [Google Scholar] [CrossRef]
- De Jong, K.; Albin, M.; Skärbäck, E.; Grahn, P.; Wadbro, J.; Merlo, J.; Björk, J. Area-Aggregated Assessments of Perceived Environmental Attributes May Overcome Single-Source Bias in Studies of Green Environments and Health: Results from a Cross-Sectional Survey in Southern Sweden. Environ. Health 2011, 10, 4. [Google Scholar] [CrossRef]
- De Vries, S.; van Dillen, S.M.E.; Groenewegen, P.P.; Spreeuwenberg, P. Streetscape Greenery and Health: Stress, Social Cohesion and Physical Activity as Mediators. Soc. Sci. Med. 2013, 94, 26–33. [Google Scholar] [CrossRef] [PubMed]
- Akpinar, A. How Is Quality of Urban Green Spaces Associated with Physical Activity and Health? Urban For. Urban Green. 2016, 16, 76–83. [Google Scholar] [CrossRef]
- Sugiyama, T.; Francis, J.; Middleton, N.J.; Owen, N.; Giles-Corti, B. Associations Between Recreational Walking and Attractiveness, Size, and Proximity of Neighborhood Open Spaces. Am. J. Public Health 2010, 100, 1752–1757. [Google Scholar] [CrossRef] [PubMed]
- Kaczynski, A.T.; Potwarka, L.R.; Saelens, B.E. Association of Park Size, Distance, and Features With Physical Activity in Neighborhood Parks. Am. J. Public Health 2008, 98, 1451–1456. [Google Scholar] [CrossRef] [PubMed]
- Kabisch, N.; Qureshi, S.; Haase, D. Human–Environment Interactions in Urban Green Spaces — A Systematic Review of Contemporary Issues and Prospects for Future Research. Environ. Impact Assess. Rev. 2015, 50, 25–34. [Google Scholar] [CrossRef]
- Feng, X.; Astell-Burt, T. Residential Green Space Quantity and Quality and Child Well-Being: A Longitudinal Study. Am. J. Prev. Med. 2017, 53, 616–624. [Google Scholar] [CrossRef]
- Veitch, J.; Abbott, G.; Kaczynski, A.T.; Wilhelm Stanis, S.A.; Besenyi, G.M.; Lamb, K.E. Park Availability and Physical Activity, TV Time, and Overweight and Obesity among Women: Findings from Australia and the United States. Health Place 2016, 38, 96–102. [Google Scholar] [CrossRef] [PubMed]
- Ghimire, R.; Ferreira, S.; Green, G.T.; Poudyal, N.C.; Cordell, H.K.; Thapa, J.R. Green Space and Adult Obesity in the United States. Ecol. Econ. 2017, 136, 201–212. [Google Scholar] [CrossRef]
- Maas, J.; van Dillen, S.M.E.; Verheij, R.A.; Groenewegen, P.P. Social Contacts as a Possible Mechanism behind the Relation between Green Space and Health. Health Place 2009, 15, 586–595. [Google Scholar] [CrossRef] [PubMed]
- Pretty, G.M.H.; Andrewes, L.; Collett, C. Exploring Adolescents’ Sense of Community and Its Relationship to Loneliness. J. Community Psychol. 1994, 22, 346–358. [Google Scholar] [CrossRef]
- Prezza, M.; Amici, M.; Roberti, T.; Tedeschi, G. Sense of Community Referred to the Whole Town: Its Relations with Neighboring, Loneliness, Life Satisfaction, and Area of Residence. J. Community Psychol. 2001, 29, 29–52. [Google Scholar] [CrossRef]
- Hartig, T.; Evans, G.W.; Jamner, L.D.; Davis, D.S.; Gärling, T. Tracking Restoration in Natural and Urban Field Settings. J. Environ. Psychol. 2003, 23, 109–123. [Google Scholar] [CrossRef]
- Stessens, P.; Khan, A.Z.; Huysmans, M.; Canters, F. Analysing Urban Green Space Accessibility and Quality: A GIS-Based Model as Spatial Decision Support for Urban Ecosystem Services in Brussels. Ecosyst. Serv. 2017, 28, 328–340. [Google Scholar] [CrossRef]
Figure 2.
Distribution of UGS in Xihu District.
Figure 2.
Distribution of UGS in Xihu District.
Figure 3.
Basic information of respondents.
Figure 3.
Basic information of respondents.
Figure 4.
Frequency, duration and type of PA.
Figure 4.
Frequency, duration and type of PA.
Figure 5.
Health benefits.
Figure 5.
Health benefits.
Figure 6.
UGS service scope.
Figure 6.
UGS service scope.
Figure 7.
UGS effective service area ratio.
Figure 7.
UGS effective service area ratio.
Figure 8.
Distance to UGS versus frequency of PA, in percent of the respondents.
Figure 8.
Distance to UGS versus frequency of PA, in percent of the respondents.
Figure 9.
Distance to UGS versus duration of PA, in percent of the respondents.
Figure 9.
Distance to UGS versus duration of PA, in percent of the respondents.
Table 1.
Hangzhou UGS division standard.
Table 1.
Hangzhou UGS division standard.
| UGS level |
Area (10000 square meters) |
Service radius (meters) |
notes |
| Municipal level UGS |
>10 |
3000 |
|
| District level UGS |
2~20 |
1500 |
|
| Urban section level UGS |
5~10 |
1500 |
Within the urban cluster |
| Community level UGS |
2~5 |
1000 |
|
| Residential quarter level UGS |
≥0.4 |
1000 |
|
Table 2.
Evaluation indicators for UGS health benefits.
Table 2.
Evaluation indicators for UGS health benefits.
| Categories |
Evaluation indicators |
Indicators subdivision |
| Overall health |
SRH |
-- |
| Subdividing health |
Physical health |
Reduce obesity |
| Reduce the risk of common diseases |
| Reduce the risk of chronic diseases |
| Mental health |
Eliminate mental fatigue |
| Relieve psychological pressure |
| Concentrate mind |
| Improve mood |
| Social health |
Eliminate feelings of loss |
| Reduce loneliness |
Table 3.
The quantity and quality factors affecting the health benefits of UGS.
Table 3.
The quantity and quality factors affecting the health benefits of UGS.
| Categories |
Factor |
| Quantity factors |
Distance to UGS |
| Effective service area ratio |
| Quality factors |
Charge |
| Landscape |
| Largeness |
| Functional diversity |
| Leisure facilities |
| Accessibility |
| Pollution |
| Function |
| Cleanliness |
| Security |
| Facility maintenance |
| Landscape maintenance |
Table 4.
Summary of unstandardized multivariate regression coefficients for quantity factors of UGS and overall health indicators.
Table 4.
Summary of unstandardized multivariate regression coefficients for quantity factors of UGS and overall health indicators.
| |
SRH |
| β |
SE |
| Sex(male) |
-.120* |
.052 |
| Age |
-.004 |
.036 |
| Occupation |
.034 |
.031 |
| Education level |
.211** |
.036 |
| Income level |
.041** |
.014 |
| Marital status (married) |
.397** |
.077 |
| Distance to UGS |
-.064** |
.016 |
| Effective service area ratio |
.180** |
.059 |
| R2 |
.167** |
Table 5.
Summary of unstandardized multivariate regression coefficients for quantity factors of UGS and subdividing health indicators.
Table 5.
Summary of unstandardized multivariate regression coefficients for quantity factors of UGS and subdividing health indicators.
| |
Physical health |
Mental health |
Social health |
| β |
SE |
β |
SE |
β |
SE |
| Sex(male) |
.033 |
.067 |
.036 |
.073 |
.013 |
.047 |
| Age |
-.196** |
.046 |
.037 |
.050 |
-.150** |
.032 |
| Occupation |
-.108** |
.040 |
-.001 |
.043 |
-.009 |
.028 |
| Education level |
.116* |
.046 |
.118* |
.050 |
.088** |
.032 |
| Income level |
.024 |
.018 |
.074** |
.020 |
-.015 |
.013 |
| Marital status (married) |
.077 |
.099 |
.293** |
.108 |
.231** |
.069 |
| Distance to UGS |
-.055** |
.021 |
-.099** |
.023 |
-.025 |
.015 |
| Effective service area ratio |
.065 |
.076 |
-.081 |
.083 |
.131* |
.053 |
| R2
|
.044** |
.152** |
.111** |
Table 6.
Summary of unstandardized multivariate regression coefficients for different distances to UGS and overall health indicators.
Table 6.
Summary of unstandardized multivariate regression coefficients for different distances to UGS and overall health indicators.
| |
SRH |
| β |
SE |
| Sex(male) |
-.106* |
.053 |
| Age |
-.008 |
.036 |
| Occupation |
.042 |
.031 |
| Education level |
.215** |
.036 |
| Income level |
.040** |
.014 |
| Marital status (married) |
.463** |
.079 |
| Distance to UGS/500 m-1 km |
-.019 |
.070 |
| Distance to UGS/1 km-1.5 km |
-.037 |
.090 |
| Distance to UGS/1.5 km-2 km |
-.537** |
.108 |
| Distance to UGS/>2 km |
-.283** |
.063 |
| R2 |
.171** |
Table 7.
Summary of unstandardized multivariate regression coefficients for different UGS effective service area ratios and overall health indicators.
Table 7.
Summary of unstandardized multivariate regression coefficients for different UGS effective service area ratios and overall health indicators.
| |
SRH |
| β |
SE |
| Sex(male) |
-.132* |
.053 |
| Age |
-.005 |
.037 |
| Occupation |
.043 |
.032 |
| Education level |
.185** |
.036 |
| Income level |
.044** |
.015 |
| Marital status (married) |
.355** |
.078 |
| Effective service area ratio/<80-60% |
-.090 |
.108 |
| Effective service area ratio/<60-40% |
-.100 |
.137 |
| Effective service area ratio/<40-20% |
-.158* |
.080 |
| Effective service area ratio/<20-0% |
-.207** |
.055 |
| R2
|
.144** |
Table 8.
Summary of unstandardized multivariate regression coefficients for quality factors of UGS and frequency and duration of PA.
Table 8.
Summary of unstandardized multivariate regression coefficients for quality factors of UGS and frequency and duration of PA.
| |
Frequency of PA |
Duration of PA |
| β |
SE |
β |
SE |
| Sex(male) |
-.192* |
.080 |
-.330** |
.066 |
| Age |
.308** |
.056 |
.280** |
.046 |
| Occupation |
-.016 |
.048 |
-.020 |
.040 |
| Education level |
-.160** |
.055 |
.024 |
.045 |
| Income level |
-.071** |
.022 |
-.040* |
.018 |
| Marital status (married) |
.341** |
.118 |
.320** |
.098 |
| Distance to UGS |
-.357** |
.025 |
.194** |
.021 |
| Charge |
-.085* |
.034 |
.015 |
.028 |
| Landscape |
.035 |
.057 |
-.071 |
.047 |
| Largeness |
-.036 |
.053 |
.045 |
.043 |
| Functional diversity |
.028 |
.053 |
-.112* |
.048 |
| Leisure facilities |
-.005 |
.052 |
.115** |
.048 |
| Accessibility |
.222** |
.072 |
.028 |
.044 |
| Pollution |
.005 |
.058 |
-.040 |
.048 |
| Function |
-.040 |
.038 |
-.023 |
.031 |
| Cleanliness |
.003 |
.061 |
.101* |
.050 |
| Security |
.022 |
.063 |
.025 |
.052 |
| Facility maintenance |
.071 |
.066 |
-.066 |
.054 |
| Landscape maintenance |
-.043 |
.067 |
-.028 |
.055 |
| R2
|
.549** |
.230** |
Table 9.
Summary of unstandardized multivariate regression coefficients for quality factors of UGS, frequency and duration of PA, and overall health.
Table 9.
Summary of unstandardized multivariate regression coefficients for quality factors of UGS, frequency and duration of PA, and overall health.
| |
SRH |
| β |
SE |
| Sex(male) |
-.073 |
.054 |
| Age |
-.041 |
.038 |
| Occupation |
.047 |
.031 |
| Education level |
.228** |
.036 |
| Income level |
-.042** |
.014 |
| Marital status (married) |
-.078 |
.052 |
| Distance to UGS |
-.072** |
.020 |
| Frequency of PA |
.042 |
.025 |
| Duration of PA |
.073* |
.030 |
| Charge |
.000 |
.022 |
| Landscape |
-.017 |
.037 |
| Largeness |
-.019 |
.035 |
| Functional diversity |
.002 |
.035 |
| Leisure facilities |
.048 |
.034 |
| Accessibility |
.049 |
.035 |
| Pollution |
-.029 |
.038 |
| Function |
-.031 |
.025 |
| Cleanliness |
.056 |
.040 |
| Security |
-.001 |
.041 |
| Facility maintenance |
-.060 |
.043 |
| Landscape maintenance |
-.008 |
.044 |
| R2
|
.180** |
Table 10.
Summary of unstandardized multivariate regression coefficients for quality factors of UGS, frequency and duration of PA, and subdividing health.
Table 10.
Summary of unstandardized multivariate regression coefficients for quality factors of UGS, frequency and duration of PA, and subdividing health.
| |
Physical health |
Mental health |
Social health |
| β |
SE |
β |
SE |
β |
SE |
| Sex(male) |
.009 |
.068 |
.058 |
.075 |
.042 |
.048 |
| Age |
-.153** |
.049 |
-.021 |
.053 |
-.108** |
.034 |
| Occupation |
-.106** |
.040 |
.000 |
.044 |
-.010 |
.028 |
| Education level |
.128** |
.046 |
.097 |
.050 |
.024 |
.035 |
| Income level |
-.018 |
.018 |
.069** |
.020 |
-.002 |
.013 |
| Marital status (married) |
.040 |
.100 |
.261* |
.109 |
.246** |
.070 |
| Distance to UGS |
-.059* |
.025 |
-.039 |
.028 |
-.060** |
.018 |
| Frequency of PA |
.088** |
.032 |
.081* |
.035 |
.096** |
.022 |
| Duration of PA |
.056 |
.039 |
.108* |
.042 |
.026 |
.027 |
| Charge |
-.022 |
.028 |
-.016 |
.031 |
-.015 |
.020 |
| Landscape |
-.009 |
.048 |
.070 |
.052 |
-.018 |
.033 |
| Largeness |
.002 |
.044 |
.014 |
.048 |
.067* |
.031 |
| Functional diversity |
-.016 |
.044 |
-.025 |
.048 |
.010 |
.031 |
| Leisure facilities |
-.012 |
.044 |
.038 |
.048 |
.028 |
.031 |
| Accessibility |
-.003 |
.045 |
-.007 |
.048 |
.019 |
.031 |
| Pollution |
.078 |
.048 |
.058 |
.053 |
.025 |
.034 |
| Function |
.051 |
.032 |
.024 |
.035 |
.021 |
.022 |
| Cleanliness |
.063 |
.051 |
.112* |
.056 |
.073* |
.036 |
| Security |
.037 |
.053 |
.081 |
.057 |
.045 |
.037 |
| Facility maintenance |
-.007 |
.055 |
.070 |
.060 |
.034 |
.038 |
| Landscape maintenance |
.016 |
.056 |
.077 |
.061 |
.040 |
.039 |
| R2
|
.072** |
.185** |
.151** |
|
Disclaimer/Publisher’s Note: The statements, opinions and data contained in all publications are solely those of the individual author(s) and contributor(s) and not of MDPI and/or the editor(s). MDPI and/or the editor(s) disclaim responsibility for any injury to people or property resulting from any ideas, methods, instructions or products referred to in the content. |
© 2024 by the authors. Licensee MDPI, Basel, Switzerland. This article is an open access article distributed under the terms and conditions of the Creative Commons Attribution (CC BY) license (https://creativecommons.org/licenses/by/4.0/).
