Submitted:
17 April 2024
Posted:
17 April 2024
Read the latest preprint version here
Abstract
The normal growth and development of skeletal muscle is essential for the health of the body. The regulation of skeletal muscle by intestinal microorganisms and their metabolites has been continuously revealed. Acetate is the predominant short-chain fatty acid synthesized by gut microbiota through the fermentation of dietary fiber, however, the underlying molecular mechanisms governing the interaction between acetate and skeletal muscle during rapid growth stage remain to be further elucidated; Here, specific pathogen-free (SPF) mice, germ-free (GF) mice, and germ-free mice supplemented with sodium acetate (GS) were used to evaluate the effects of acetate on skeletal muscle growth and development of young mice with gut microbiota deficiency; We found the concentration of serum acetate, body mass gain, succinate dehydrogenase activity and expression of myogenesis maker gene of skeletal muscle in the GS group was higher than GF group following sodium acetate supplement. Furthermore, the transcriptome analysis revealed that acetate activated biological processes regulating skeletal muscle growth and development in GF group that are inhibited due to gut microbiota deficiency. In vitro experiment, we proved that acetate up-regulated Gm16062 to promote skeletal muscle cell differentiation; Overall, our findings proved that acetate promote skeletal muscle growth and development in young mice via increase Gm16062 expression.
Keywords:
gut microbiota
; acetate
; skeletal muscle
; Gm16062
1. Introduction
The skeletal muscle, constituting more than 40% of body weight and storing approximately 50–75% of human protein in various forms, is the largest and one of the most critical organs in the body [1]. Achieving and maintaining the normal growth and development of skeletal muscle requires a harmonious interplay of internal and external factors. Myogenesis is a highly orchestrated process that encompasses muscle stem cell activation, proliferation, differentiation, and fusion into multinucleated myotubes with contractile capacity [2]. The regulation of myogenic processes predominantly falls on myogenic regulatory factors (MRFs), including myoblast determination protein (Myod1), myogenin (Myog), and muscle-specific regulatory factor 4 (Mrf4/Myf6), which govern myoblast proliferation, differentiation, and fusion. Additionally, the myocyte enhancer factor (Mef2a), which regulates the expression of MRFs and participates in skeletal muscle-specific transcriptional processes regulated by MRFs [3].
The intestinal micro-ecosystem, consisting of tens of billions of bacteria that colonize the host’s intestinal cavity, plays an indispensable role in the host’s overall health [4]. Imbalance of the gut microbiota can cause substantial damage to skeletal muscle physiology [5,6,7]. Short-chain fatty acids (SCFAs) are produced by intestinal flora fermentation of dietary fiber [8] and affect various physiological aspects of different organs, including against lung injury [9], promote liver regeneration [10], cardiac metabolism [11], improve brain function [12] and immune system functions [13]. Acetate is the dominant SCFAs in the peripheral circulation [14] and is considered harmless [15]. Nevertheless, the current understanding of how gut microbiota-derived acetate regulates skeletal muscle remains incomplete, especially, in the stage of rapid skeletal muscle growth.
Long non-coding RNA (lncRNA) that without protein-coding capacity and typically exceeding 200 nucleotides in length, possessing a wide array of biological functions [16]. As a regulatory factor, it plays a pivotal role in the process of skeletal muscle cell proliferation, differentiation, and muscle-related diseases [17]. Recent researches have shown the role of lncRNA, serving as competing endogenous RNA (ceRNA) and to affect skeletal muscle growth and development. For example, linc-MD1 [18], lnc-MAR1 [19], and lnc-IRS1 [20]. Although the functions of these lncRNA have been elucidated in vivo or in vitro during myogenesis, the roles of other lncRNA await to discovery. Supplementing germ-free mice with SCFAs brings their transcriptomes and chromatin states closer to those of mice colonized with gut microbiota [21]. Furthermore, acetate supplementation significantly regulates DNA methylation levels of the miR-378a promoter [22], underscoring its irreplaceable role in host epigenetic regulation. LncRNA is crucial for epigenetic regulation; however, to the best of our knowledge, few studies have investigated the role of lncRNA involvement in acetate-mediated regulation of skeletal muscle growth and development in young mice.
Here, three experimental groups of specific-pathogen free mice (SPF), germ-free mice (GF), and germ-free mice supplemented with sodium acetate (GS), were prepared to evaluate the effect of acetate on the growth and development of skeletal muscle in young mice lacking gut microbiota. Our findings indicate that acetate mitigates the impairment to skeletal muscle growth and development in young mice induced by gut microbiota depletion and demonstrate that this is partially mediated by the Gm16062/miR-129-2-3p/Mef2a regulatory axis.
2. Results
2.1.1. Identification of Sterile Experimental Mice
To ensure that GF mice was not contaminated by microorganisms throughout the experiment, we assessed microbial DNA and 16S rRNA abundance of feces. The fecal microorganisms were barely detectable in both the GF and GS groups compared to the SPF group (Figure S1A–C). Furthermore, the cecum exhibited hypertrophy and an increased weight in both the GF and GS groups (Figure S1D,E). These findings align with previous studies that have reported cecum hypertrophy in GF mice [23]. Collectively, these results provide strong evidence for the successful establishment of the sterile mice groups in the context of our research.
2.1.2. Acetate Relieves Gut Microbiota Depletion-Induced Skeletal Muscle Impairment
The concentration of acetate in the peripheral circulation was significantly higher in the SPF group than in the GF group, and acetate concentration in the serum, and the concentration of serum acetate in the GS group was increased following sodium acetate supplementation (Figure 1A). Body weight gain (except cecum weight) was higher in SPF group and GS group than in GF group (Figure 1B,C). Furthermore, histological staining revealed that reduced activity of the mitochondrial enzyme, SDH, in the GF group, compared with that in SPF and GS groups (Figure 1D,E). Acetate may affect the mass and physiology function of skeletal muscle; therefore, to assess the impact of acetate on myogenesis, we measured the expression levels of key transcription factors, including Myod1, Myog, Myf6, and Mef2a, which play pivotal roles in transcriptional regulation during skeletal muscle development [24,25]. Compared to GF group, Mef2a expression in skeletal muscle of GS group increased in total, but not be observed in SPF group (Figure 1F,J and Figure S2A,E,I). Additionally, the expression level of Myod1, Myog and Myf6 in skeletal muscle of SPF and GS group upregulated (Figure 1G–I,K–M and Figure S2B–D,F–H,J–L). In summary, acetate administration mitigated the compromised physiological parameters resulting from gut microbiota depletion.
2.1.3. Skeletal Muscle Transcriptome Differences among Groups
To further insight the impacts of gut microbiota and acetate on skeletal muscle growth and development. The LD and the BF were used for transcriptome analysis as representative muscles of the mouse trunk and hind limb, respectively. On the basis of transcriptome expression profiles of BF and LD for SPF, GF and GS groups (Figure 2A,B and Figure S4A,B), GSEA was performed. The GSEA revealed that biological processes regulating the growth and development of BF muscle were inhibited in the GF group, including contractile fiber (Figure 2C), structural constituent of muscle (Figure 2D), striated muscle cell development (Figure 2E), and regulation of skeletal muscle tissue development (Figure 2F), “skeletal muscle tissue regeneration” (Figure 2G), “positive regulation of myotube differentiation” (Figure 2H), “skeletal muscle satellite cell proliferation” (Figure 2I), “striated muscle contraction” (Figure 2J) and “striated muscle adaptation” (Figure 2K), compared to SPF group. The GSEA also revealed that biological processes, regulating skeletal muscle regeneration, proliferation, differentiation were activated in the GS group (Figure S2), compared to GF group. Furthermore, similar results were obtained for LD muscle (Figure S4C–H). Notably, in both BF and LD muscles, acetate mitigated the inhibition of skeletal muscle cell differentiation induced by gut microbiota depletion (Figure 2H, Figure S3F and Figure S4C,H). These results indicate that the gut microbiota absence significantly inhibited skeletal muscle growth and development; in contrast, acetate facilitated the growth and development of skeletal muscle in GF mice.
2.1.4. The lncRNA Involved in the Underlying Mechanism That Acetate Alleviates Skeletal Muscle Impairment Induced by Gut Microbiota Depletion
The GO enrichment analysis outcome revealed a strong association between these lncRNA and biological processes related to muscle cell differentiation, positive regulation of muscle tissue development, muscle system process, and positive regulation of skeletal muscle fiber development. (Figure 3A,B). Notably, within this cohort of lncRNA, Gm16062 had remarkably high Pearson correlation coefficients of 0.797, 0.9224, and 0.9126 with Myf6, Myod1, and Myog, respectively (Figure 3C–E). To further substantiate these findings, we evaluated the expression levels of Gm16062 in skeletal muscle tissue. Intriguingly, Gm16062 expression was up-regulated in the skeletal muscle of the SPF and GS group, compared to the GF group (Figure 3F). These results not only hint at the potential involvement of lncRNA in mitigating skeletal muscle injury induced by gut microbiota elimination but also underscore the pivotal role that Gm16062 might play in the intricate processes of skeletal muscle myogenesis.
2.1.5. Acetate Promotes the Differentiation of C2C12 Cells
In order to verify the impact of acetate on myogenesis and explore the molecular mechanism of Gm16062 on myogenesis, we performed cell experiment using C2C12 cells, a skeletal muscle cell line. First, we confirmed that there was no mycoplasma contamination in the C2C12 cells cultured for this experiment and the noncytotoxic SA (Figure 4A,B). we explored the impact of different concentrations of sodium acetate treatment on C2C12 myoblast differentiation. In comparison to the control group (0 mmol/L), the presence of 2 mmol/L SA notably enhanced the expressions of Mef2a, Myod1, Myog, and Gm16062 on the fifth day of C2C12 differentiation (Figure 4C–F). To validate these results, we conducted immunofluorescence staining for MYH4 revealed that acetate indeed promoted the differentiation of C2C12 myoblasts and facilitated the fusion of myotubes (Figure 4G,H). In summary, these findings strongly indicated that acetate plays an important role in promoting the differentiation of skeletal muscle cells.
2.1.6. Characteristics of Gm16062 and Promotion of C2C12 Cell Differentiation by Overexpression Gm16062
According to the co-expression analysis result of MRFs and Gm16062. Moreover, we proved that SA could up-regulate the Gm16062 expression in vivo and vitro. We explored the expression patterns of Gm16062. The Gm16062 expression gradually increased throughout the differentiation process (Figure S5A) and was consistently enhanced by sodium acetate treatment during C2C12 myogenic differentiation (Figure S5B). These findings strongly indicated that Gm16062 may be crucial factor in myogenic differentiation. General characteristics and sequence details of Gm16062 are presented in Supplementary (Figure S5C,D). The molecular mechanisms of lncRNA functions depend on their subcellular location [26]. A specific, fluorescently labeled probe revealed Gm16062 to be primarily distributed in the cytoplasm during C2C12 differentiation (Figure S5E). Gm16062 may therefore act in the same way as a ceRNA. To investigate the role of Gm16062 during myogenesis in vitro, we overexpressed Gm16062(OE-Gm16062). Successful overexpression of Gm16062(Figure 5A), which resulted in significant promotion of C2C12 differentiation, as shown by upregulated expression of myogenic marker genes (Mef2a, Myod1 and Myog) (Figure 5B–D) and increased number of positive myotubes (Figure 5E,F). In conclusion, we identified a novel lncRNA termed Gm16062 and demonstrated that Gm16062 promoted myogenic differentiation of C2C12 cells by facilitating the expression of myogenic marker genes and myotube fusion.
2.1.7. miR-129-2-3p Inhibits C2C12 Differentiation
We found that miR-129-2-3p, as the target gene of Gm16062, can also bind to the 3 ‘-UTR of MEF2A。And, the expression of miR-129-2-3p in the BF of the SPF and GS groups significantly reduced, compared with the GF group (Figure 6B), although this effect was not observed in LD muscle (Figure 6A). Furthermore, both sodium acetate treatment and the overexpression of Gm16062 inhibited miR-129-2-3p expression during C2C12 myogenic differentiation (Figure 6C,D). Additionally, Mef2a expression was consistently enhanced by sodium acetate treatment during C2C12 myogenic differentiation (Figure 6E). The expression level of miR-129-2-3p initially increased on the first day of C2C12 myogenic differentiation and then rapidly decreased (Figure 6F). Therefore, we hypothesized that miR-129-2-3p might play a role in hindering the process of myogenesis. Overexpression of miR-129-2-3p using a miRNA mimic (Figure 6G), downregulated Gm16062 (Figure 6H) and resulted in significant inhibition of C2C12 differentiation, as shown by decreased expression of myogenic marker genes (Mef2a, Myod1, and Myog) (Figure 6I–K), as well as a decreased number of positive myotubes (Figure 6L,M). Conversely, knockdown of miR-129-2-3p using a miRNA inhibitor increased Gm16062 expression and promoted C2C12 differentiation, as confirmed by RT-qPCR and immunofluorescence staining analysis (Figure S6A–G). Collectively, these findings provide compelling evidence that miR-129-2-3p indeed impedes the process of myogenic differentiation of C2C12 cells.
2.1.8. Gm16062/miR-129-2-3p/Mef2a Axis Regulate C2C12 Differentiation
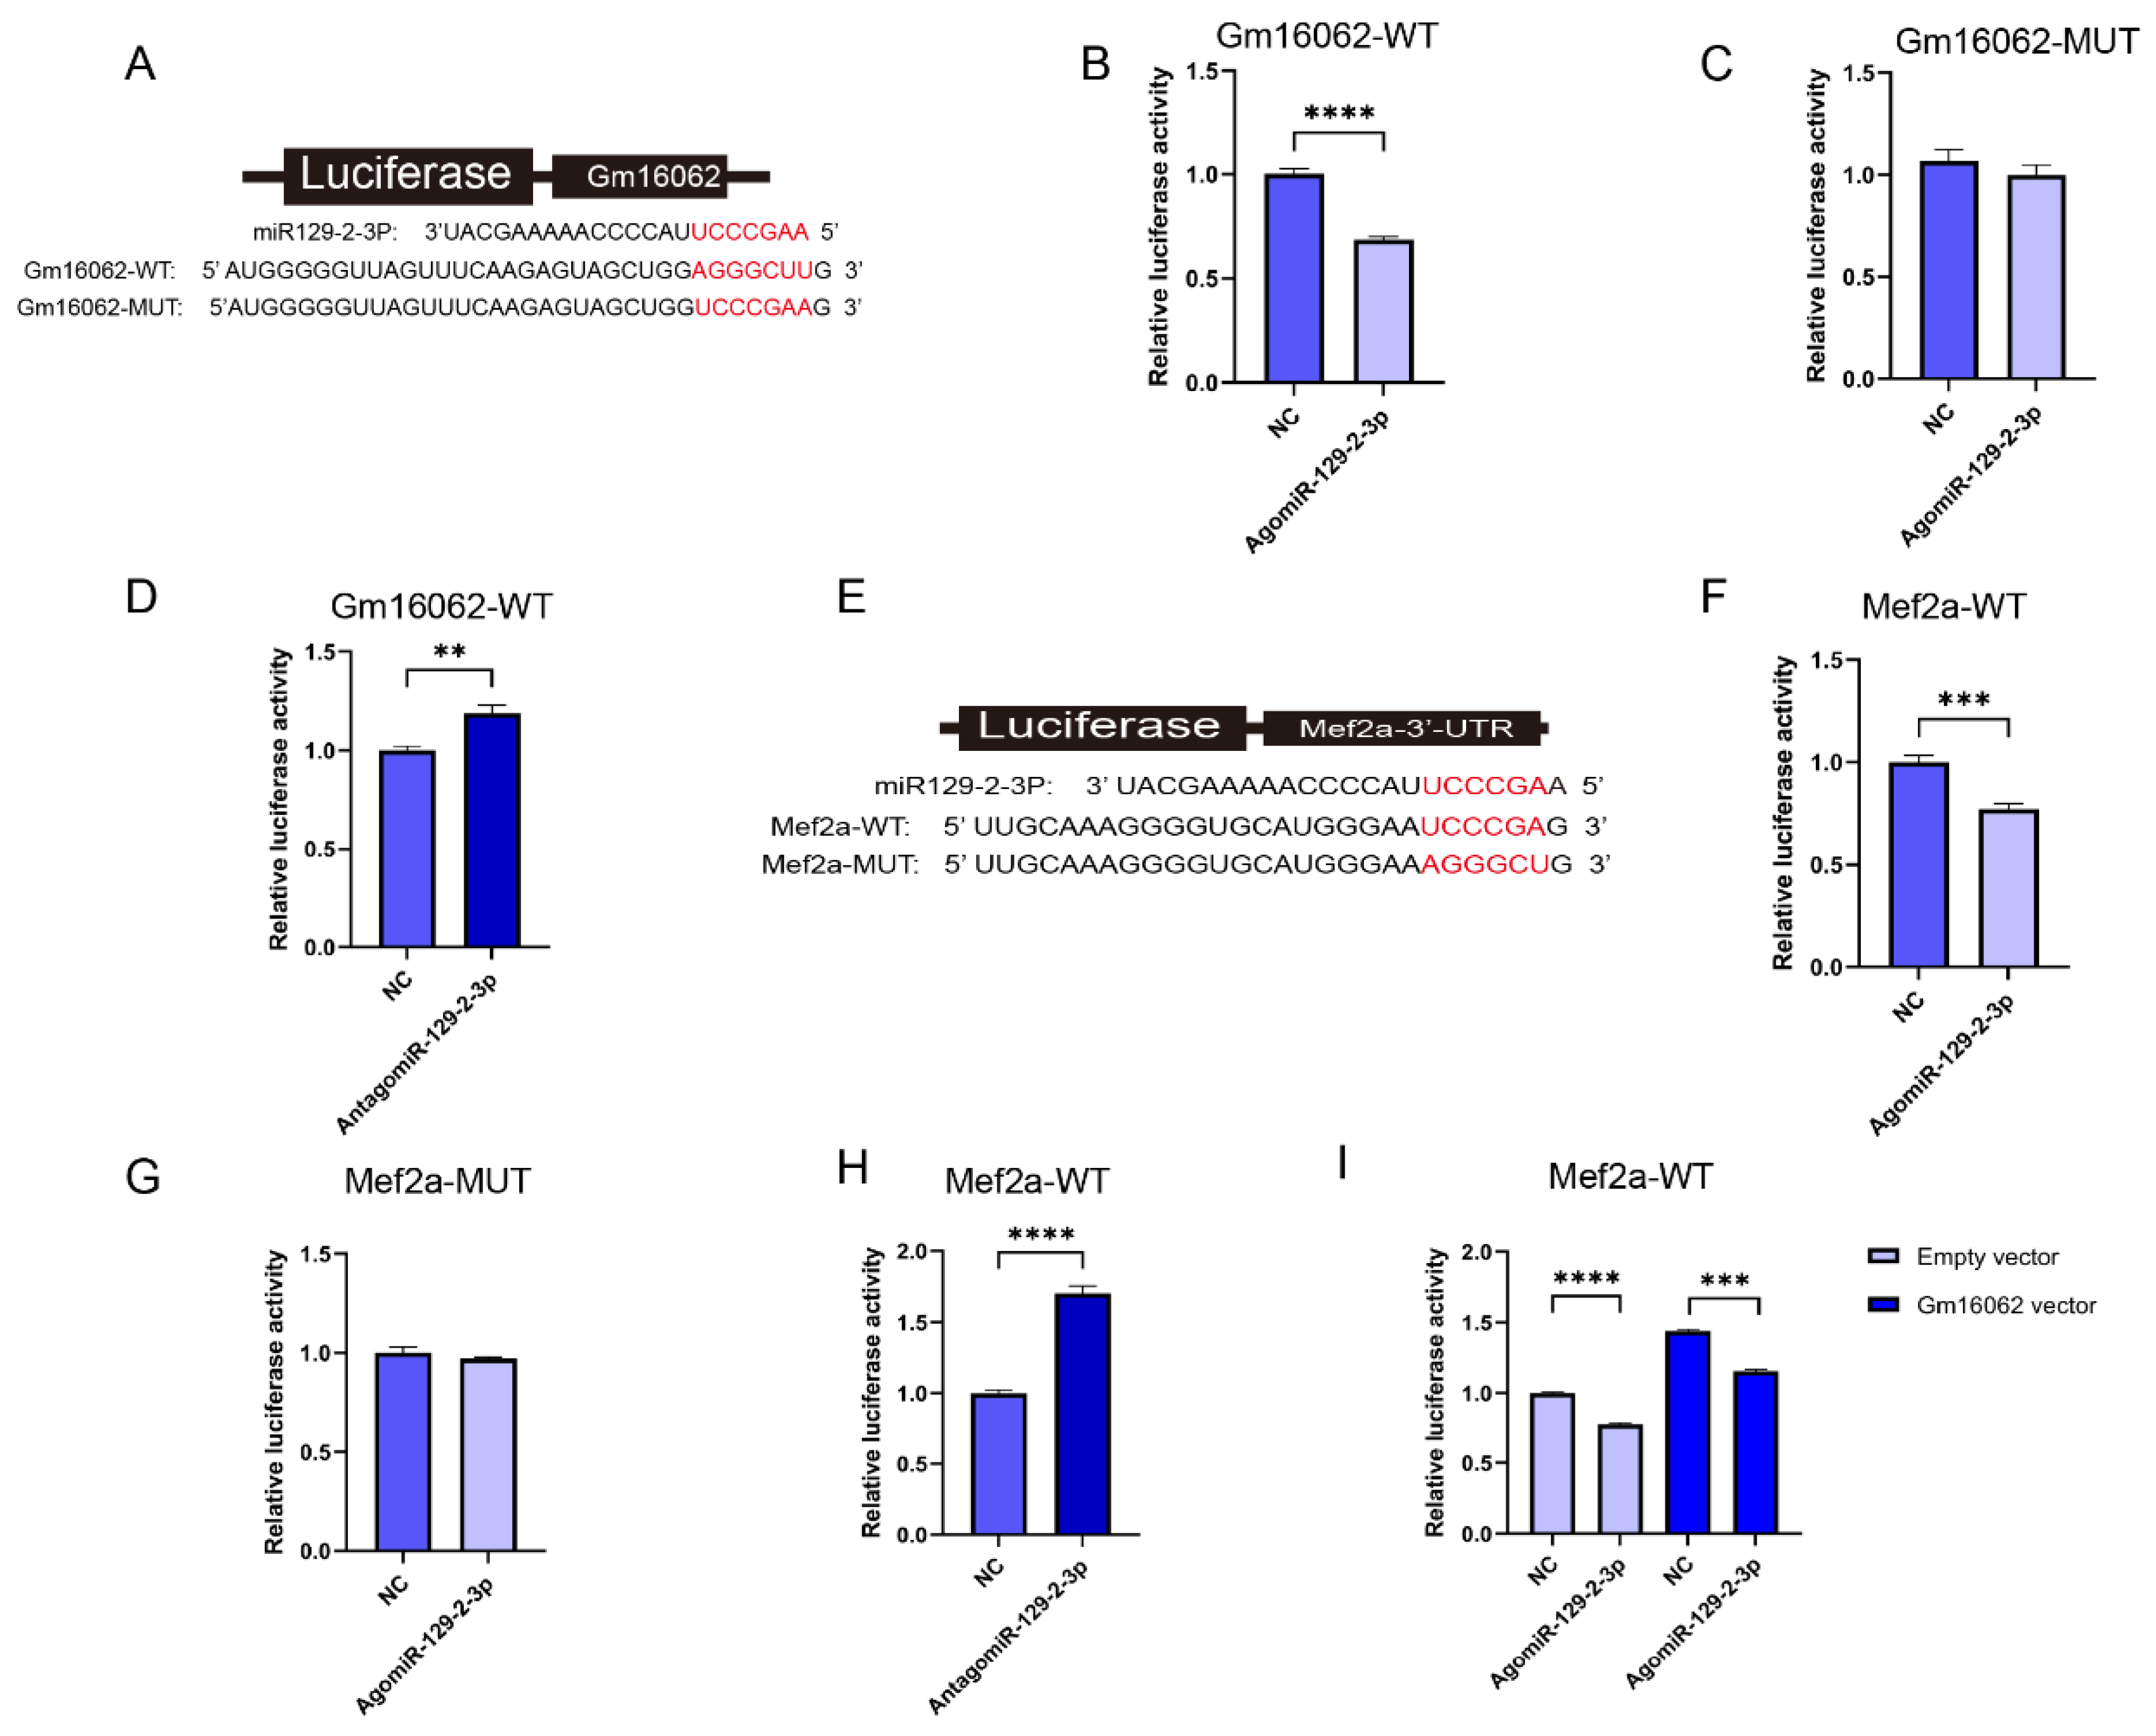
To demonstrate that Gm16062 specifically binds to miR-129-2-3p, the luciferase reporters containing a wild type (WT) or mutant (MUT) target site from Gm16062 were constructed (Figure 7A). Overexpression of miR-129-2-3p inhibited the luciferase activity of Gm16062-WT (Figure 7B), but not of Gm16062-MUT (Figure 7C). Furthermore, he luciferase activity of Gm16062-WT increased, when the abundance of endogenous miR-129-2-3p was inhibited (Figure 7D). The above results indicated that Gm16062 specifically targets the miR-129-2-3p seed sequence and negatively regulates miR-129-2-3p. To demonstrate that miR-129-2-3p specifically binds to Mef2a (Figure 7E), the luciferase reporters containing a wild type (WT) or mutant (MUT) target site from Mef2a 3’-UTR were constructed. Overexpression of miR-129-2-3p inhibited the luciferase activity of Mef2a-WT (Figure 7F), whereas not of Mef2a-MUT (Figure 7G). Furthermore, the luciferase activity of Mef2a-WT increased, when the abundance of endogenous miR-129-2-3p was inhibited (Figure 7H). Finally, we demonstrated that overexpression of Gm16062 could relieve the inhibition of the luciferase activity of Mef2a-WT caused by overexpression of miR-129-2-5p, as shown by co-transfection assay (Figure 7I). All these data proofed that Gm16062 competitively sponges miR-129-2-3p to relieve its inhibitory effect on Mef2a to regulate C2C12 differentiation.
3. Discussion
Acetate is not only the most predominant, accounting for more than 60%, but also the primary SCFAs entering the peripheral circulation [27,28,29]. Here, we proofed that the concentration of acetate in serum of SPF mice were substantially higher than those of GF mice and exhibited a higher body weight gain (except cecum weight) and SDH activity, compared to the GF group. It is worth noting that the minimal amount of acetate detected in the serum of GF mice may originate from their dietary intake [30]. We therefore speculated that a high concentration of acetate in peripheral circulation may play a pivotal role in regulating the growth and development of peripheral tissues and organs.
The loss of gut microbiota led to skeletal muscle atrophy and decreased expression of MRFs in mice and Bama pigs [5,6]. Liu and Qiu have also proposed that skeletal muscle atrophy caused by aging is closely related to gut microbiota disorder [31,32]. The absence or perturbation of gut microbiota can therefore substantially impair the physiological function of skeletal muscle. In contrast, in this study acetate promoted the expression of MRFs across multiple skeletal muscle tissues of the GF group. A few previous study demonstrated that acetate had a positive effect on skeletal muscle, such as Maruta et al. showed that long-term acetate supplementation can mitigate aging-induced loss of muscle mass [33]. However, in the background of gut microbiota deficiency, the impact of acetate on skeletal muscle growth and development of young mice is still worthing disclosing. In this study, the concentration of acetate in the serum of GS group significantly increased following SA supplement and exhibited a higher body weight gain (except cecum weight) and SDH activity, compared to the GF group. Additionally, the absence of gut microbiota inhibited the expression of MRFs in multiple skeletal muscle tissues.
Furthermore, the transcriptome sequencing was employed to determine the effect of gut microbiota deficiency and the impact of acetate on the skeletal muscle growth and development of GF mice. The GSEA revealed that gut microbiota deficiency had a detrimental effect on skeletal muscle growth and development, including regulation of skeletal muscle tissue development, skeletal muscle tissue regeneration, regulation of myoblast differentiation, and skeletal muscle cell proliferation. These findings align with the emerging concept of the gut-muscle axis, in which the absence or dysfunction of gut microbiota has a negative influence on the mass and function of skeletal muscles and associates with sarcopenia and cachexia [5,34]. Moreover, specific intestinal probiotics, such as Lacticaseibacillus casei LC122 and Bifidobacterium longum BL986, are crucial to the physiological function of skeletal muscle [31,34]. Our study did not investigate the relationship between specific probiotics and skeletal muscle growth and development, however, investigation of specific probiotics that are beneficial to skeletal muscle growth and development is warranted.
Moreover, The GSEA revealed that acetate promoted skeletal muscle growth and development in GF mice, including regulation skeletal muscle cell differentiation, positive regulation of skeletal muscle tissue development, and skeletal muscle tissue regeneration. We observed that acetate mitigated the inhibitory effects of gut microbiota depletion on skeletal muscle cell differentiation, both in LD and BF. Therefore, we supposed that acetate may be more favorable for skeletal muscle cell differentiation. It is important to note that besides acetate, the gut microbiota also produces various other metabolites, including branched-chain amino acids, biogenic amines, bile acids, trimethylamine N-oxide, tryptophan, and indole derivatives [35]. In recent years, bile acids were demonstrated affect glucose metabolism, insulin sensitivity, energy metabolism, mass and atrophy of skeletal muscle [32,36,37,38]. And branched chain amino acids, it was reported that skeletal muscle growth and development are closely related to branched chain amino acid metabolism [39,40]. Therefore, an intriguing avenue for future exploration is whether metabolites other than acetate produced by the gut microbiota also play a role in regulating skeletal muscle growth and development. Collectively, the above evidence indicates that acetate can alleviate the impaired of skeletal muscle growth and development induced by gut microbiota depletion.
In our study, the co-expression analysis unveiled the involvement of lncRNA in the regulatory network underlying the acetate mediated alleviation of skeletal muscle growth and development retardation induced by gut microbiota depletion. LncRNA was initially considered to be genomic transcription “noise” [41]. However, mounting evidence has underscored that lncRNA play a crucial role in regulating myogenesis. For example, linc-MD1 [18], lnc-MAR1 [19], lncIRS1 [20]. Here, we identified a new lncRNA, Gm16062, to be upregulated by acetate in skeletal muscle cells in vivo and in vitro. The functional mechanisms of lncRNA often hinge on their subcellular localization [42], Finally, our findings indicated that Gm16062 regulates C2C12 myogenesis as a ceRNA, mechanistically, Gm16062 sponges miR-129-2-3p, liberating the inhibitory effect of miR-129-2-3p on Mef2a to up-regulate the expression of Myod1 and Myog. It is noteworthy that miR-129-5p, in the same family as miR-129-2-3p, inhibits C2C12 myogenesis by targeting Mef2a [43]. Bioinformatics analysis revealed that Mef2a was also the target gene of miR-129-2-3p. In this study, we found that miR-129-2-3p inhibited C2C12 myogenesis by targeting Mef2a.
In recent decades, significant progress has been made in understanding the intricate interplay between gut microbiota and skeletal muscle. Here, we demonstrated that a lack of gut microbiota severely inhibited skeletal muscle growth and development in young mice. Conversely, acetate can alleviate the retardation of skeletal muscle growth and development induced by gut microbiota depletion in young mice. Furthermore, we have disclosed that the Gm16062/miR-129-2-3p/Mef2a regulatory axis partially mediates acetate improve gut microbiota depletion-induced retardation of skeletal muscle growth and development. These outcomes supply a novel insight into the underlying mechanisms by which acetate (gut microbiota metabolites) modulate skeletal muscle and inform future research on therapeutic strategies aiming to optimize skeletal muscle function.
4. Materials and Methods
4.1. Mice and Sampling
Animal protocols were approved by the Animal Care and Ethics Committee of the College of Animal Science and Technology, Sichuan Agricultural University, Chengdu, China (Approval Number DKY-S2020202037,18 May 2022). In details, nine 3-week-old healthy male C57BL/6JGpt mice were selected, including three specific-pathogen free (SPF) mice and six germ-free (GF) mice. The SPF mice was divided into SPF group; the GF mice was randomly and evenly divided into GF group and GS group; GS group was treated with 150 mmol/L [22] sodium acetate (SA) (purity ≥99%, Sigma, USA) in drinking water throughout the entire experimental period. The GF mice was housed in special plastic isolators (GemPharmatech, Nanjing, China), and the SPF mice housed in IVC cages in an environment of 23±2°C, the humidity was 40-70%, the noise was ≤ 60 dB, and the illumination was 15-20 lx (under a strict 12 hours light cycle). All mice in each group were weighed after 3 days of acclimatization, and a 6-week experiment was initiated. During the experiment, drinking water was changed twice a week and sufficient feed was provided. At the end of the experiment, the mice in each group were weighed, and the feces of the mice in each group were collected into sterile centrifuge tubes and frozen for subsequent analysis; the serum was collected and then mice were euthanized by cervical dislocation. The longissimus dorsi (LD), psoas major (PM), biceps femoris (BF), gastrocnemius (Gas), and tibialis anterior (TA) were collected.
4.2. Sequencing and Analysis
The total RNAs of tissues and cells were extracted under the guidance of HiPure Universal RNA Mini Kit instructions (Magen, China). The library (ribosomal RNA removal) was constructed and paired-end reads of 150-bp length were generated on Illumina Nova6000 platform. The protein coding gene (PCG) and lncRNA reference transcript file and Genome annotation file, were obtained from the GENCODE website. The transcript-level quantification was completed by kallisto [44] software, and gene-level quantification (Transcripts Per Kilobase of exon model per Million mapped reads, TPM) were determined by R package Tximport. The gene differential expression analysis was performed by DESeq2. The criteria used to identify differentially expressed gene was |log2FC| ≥ 1.0 and P-value ≤ 0.05.
4.3. Co-expression Analysis between PCG and lncRNA
Gene ontology (GO) enrichment analysis based on co-expression analysis was performed to examine the potential biological functions of identified lncRNA. We calculated the Pearson correlation coefficients between PCG and lncRNA by R package Hmisc, only PCG were selected with |r| ≥ 0.8 and P-value ≤ 0.05 against lncRNA. The selected PCG was further analyzed for Gene Ontology (GO) enrichment using the Metascape. Specifically, GO terms related to muscle growth and development were visualized using the R package ggplot2.
4.4. Gene Set Enrichment Analysis (GSEA)
To determine whether the GO item related to muscle growth and development have significantly changed between groups, we have used GSEA analysis tool to interrogate specific gene sets which relate to muscle growth and development against our pre-ranked PCG expression data. Only GO terms with FDR ≤ 0.25 and P-value ≤ 0.05 were considered significantly changed.
4.5. 16S rRNA Sequencing
Bacterial genomic DNA from fresh stool samples was extracted using a DNA stool kit. The 16S rRNA V3~V4 hypervariable region sequence was amplified, using the forward primer 5’-CCTAYGGGRBGCASCAG-3’ and the reverse primer 5’- GGACTACNNGGGTATCTAAT -3’, and sequenced on the Illumina NovaSeq platform to obtain 250bp paired-end data. Sequence data analyses were performed using QIIME2.
4.6. Gas Chromatograph-Mass Spectrometry (GC-MS)
For serum isolation, blood samples were collected from fasted mice, separated by centrifugation at 3000 g for 5 min at room temperature. The composition of acetate was determined by Beijing Masspeaks Technology Co., Ltd. (Beijing, China) using GC-MS (Agilent, USA).
4.7. Fluorescence In Situ Hybridization (FISH)
An oligonucleotides probe (RiboBio, China) targeting Gm16062 was modified with Cy3. Briefly, for Gm16062 FISH, cells were fixed by 4% polyformaldehyde (BOSTER, China), permeabilized by Triton X-100 (Beyotime, China), and hybridized with the Gm16062 probe in buffer overnight at 37 ̊C. Then, nuclei were stained with DAPI (RIB Bio, China). Images were visualized using a laser scanning confocal microscope (Nikon, Japan).
4.8. CCK-8 Assay
SA cytotoxicity was assessed using the Cell Counting Kit-8 (CCK-8) assay (Beyotime, China). In details, C2C12 cells were seeded in 96-well plates and cultured in growth medium. When the cell confluence reached 50%~60%, cells were treated with different concentration of SA and cultured for 24 hours. Then CCK-8 reagent was added to each well for 1 h at 37°C. Finally, the absorbance was measured at 450 nm using a chemiluminescent microplate detector (Bio-tek, USA).
4.9. RT-qPCR
Reverse transcription quantitative PCR (RT-qPCR) was performed according to the manufacturer’s instructions of reagent. In brief, the reverse transcription of PCG and lncRNA from total RNA were accomplished using PrimeScriptTM RT Reagent Kit with gDNA Eraser (Takara, Japan); the reverse transcription of miRNA from total RNA were accomplished using Mir-X miRNA First-Strand Synthesis Kit (Takara, Japan). The relative abundance of the gene was determined using TB Green® Premix Ex Taq™ II (Takara, Japan) under QuantStudioTM Flex System (Thermo, USA) protocols. Finally, relative gene expression values were calculated using 2ΔΔT [45] method. The gene specific-primer sequences are listed in Supplementary Table S1.
4.10. Immunofluorescence Staining and Fusion Index
C2C12 cells were fixed in 4% paraformaldehyde for 30 min and permeabilized in Triton X-100 for 20 min at room temperature. C2C12 cells were then blocked with goat serum (Beyotime, China), and incubated with primary anti-MYH4 (Myosin heavy chain 4, MYH4) (Abcam, 1:100, USA) at 4°C overnight. The cells were then incubated with Cy3 Goat Anti-Mice IgG secondary antibody (ABclonal, 1:200, China) at room temperature for 1h and nuclei were labeled with DAPI (Beyotime, China). Images were captured using a fluorescence microscope (Leica, Germany). Myotube fusion index was calculated by ImageJ.
4.11. Succinate Dehydrogenase (SDH) Staining
For histological staining, serial cross sections (14μm thick) were cut from the BF muscle, fixed in optimal cutting temperature compound (Sakura, USA) and frozen in liquid nitrogen. SDH staining kit (Solarbio, China) was used to identify SDH positive area, then SDH positive area ratio was calculated by ImageJ.
4.12. Cell Culture, Treatment, and Transfection
The C2C12 cell line was obtained from Sichuan Agricultural University, cultured with Dulbecco’s modified Eagle’s medium (DMEM) (Hyclone, China) supplemented with 10% fetal bovine serum (Gibco, USA) and 1% penicillin/streptomycin (Procell, China) at 37°C in a 5%(v/v) CO2 incubator. To induce differentiation the medium was changed to DMEM containing 2% horse serum (Thermo, USA) and 1% penicillin/streptomycin after cells reached 70% confluency. For cell treatments, myotubes were treated with vehicle or SA solutions of different concentrations. The pcDNA3.1-Gm16062 (Gm16062 vector) and pcDNA3.1-NC (empty vector) were manufactured by RIB Bio; the agomiR-129-2-3p, antagomir-129-2-3p and negative control (NC) were manufactured by TsingKe Biotech. Transient transfection of cells was performed in 12-well plate or 24-well plate using Lipofectamine 3000 reagent (Invitrogen, USA) or HiPerFect (Qiagen, Germany) according to manufacturer’s direction.
4.13. Luciferase Reporter Assay
According to the binding site information of Gm16062 and Mef2a-3’UTR with miR-129-5p seed sequence, respectively, pmirGLO-Gm16062-WT(Gm16062-WT), pmirGLO-Gm16062-Mutate (Gm16062-MUT), pmirGLO-Mef2a-3’UTR-WT(Mef2a-WT) and pmirGLO-Mef2a-3’UTR-Mutate (Mef2a-MUT), were manufactured by TsingKe Biotech respectively. For luciferase reporter analysis, plasmid or nucleic acid molecule was transfected into cell according to experimental design, using Lipofectamine3000 or HiPerFect. After 48 h, the luciferase activity analysis was performed using Dual Luciferase Reporter Gene Detection Kit (Beyotime, China). Firefly luciferase activity was normalized against Renilla luciferase activity.
4.14. Data Statistics Analysis
The data visualization involved in this experiment was completed by GraphPad Prism 9.0, R 4.2.1 language and Cytoscape 3.9.1, and unpaired two tailed Student’s test or One-way ANOVA was used for statistical analysis of data, and the results were expressed as means ± SEM, *P<0.05, **P<0.01, ***P<0.001, ****P<0.0001.
Supplementary Materials
The following supporting information can be downloaded at the website of this paper posted on Preprints.org, Table S1: Primer sequences for RT-qPCR, Figure S1: Detection of microbial content of mice among groups; Figure S2: Acetate relieves gut microbiota depletion-induced inhibition of MRFs expression in skeletal muscle; Figure S3: GSEA reveals that acetate promote the growth and development of BF in GS group; Figure S4: Transcriptome difference among groups of LD and GSEA reveals that acetate alleviates the growth and development inhibition of LD in mice induced by the absence of gut microbiota; Figure S5: Expression patterns and characteristics of Gm16062; Figure S6: Inhibition of miR-129-2-3p expression promotes C2C12 myogenic differentiation.
Author Contributions
Conceptualization, Guitao YANG, Jinwei ZHANG and Jideng MA; methodology, Jinwei ZHANG and Yan LIU; data curation, Dengfeng Xu, Lu LU, and Keren LONG; writing—original draft preparation, Guitao YANG and Yan LIU; writing—review and editing, Jideng MA; visualization, Jinwei ZHANG; supervision, Xuewei LI, Jing SUN and Liangpeng GE; project administration, Xuewei LI, Jing SUN and Liangpeng GE; funding acquisition, Jideng MA. All authors have read and agreed to the published version of the manuscript.
Funding
This research was funded by Agricultural germplasm resources survey, collection, protection and identification service project of Ministry of Agriculture and Rural Affairs (no. A120202), the Major Science and Technology Projects of Tibet Autonomous Region (no. XZ202101ZD0005N), and the National Natural Science Foundation of China (no. 32072687).
Institutional Review Board Statement
Animal Care and Ethics Committee of the College of Animal Science and Technology, Sichuan Agricultural University, Chengdu, China (Approval Number DKY-S2020202037,18 May 2022).
Informed Consent Statement
Not applicable.
Data Availability Statement
The raw sequence data reported in this paper have been deposited in the Genome Sequence Archive in National Genomics Data Center, China National Center for Bioinformation / Beijing Institute of Genomics, Chinese Academy of Sciences (GSA: CRA010722 and CRA010722) that are publicly accessible at https://ngdc.cncb.ac.cn/gsa.
Acknowledgments
We are particularly grateful to Tinghuan ZHANG, Associate Researcher at the Pig Research Institute of Chongqing Academy of Animal Sciences, for providing free server access to analyze transcriptome data during our study.
Conflicts of Interest
The authors declare no conflicts of interest.
References
- Frontera WR, Ochala J. Skeletal muscle: a brief review of structure and function[J]. Calcif Tissue Int. 2015, 96(3), 183-195.
- Berkes CA, Tapscott SJ. MyoD and the transcriptional control of myogenesis[J]. Semin Cell Dev Biol. 2005, 16(4-5), 585-595.
- Taylor MV, Hughes SM. Mef2 and the skeletal muscle differentiation program[J]. Semin Cell Dev Biol. 2017, 72, 33–44.
- Hooper LV, Gordon JI. Commensal host-bacterial relationships in the gut[J]. Science. 2001, 292(5519), 1115-1118.
- Lahiri S, Kim H, Garcia-Perez I et al. The gut microbiota influences skeletal muscle mass and function in mice[J]. Sci Transl Med. 2019, 11(502).
- Qi R, Sun J, Qiu X et al. The intestinal microbiota contributes to the growth and physiological state of muscle tissue in piglets[J]. Sci Rep. 2021, 11(1), 11237.
- Nay K, Jollet M, Goustard B et al. Gut bacteria are critical for optimal muscle function: a potential link with glucose homeostasis[J]. 2019, 317(1), E158-E171.
- Tremaroli V, Bäckhed F. Functional interactions between the gut microbiota and host metabolism[J]. Nature 2012, 489, 242–249. [CrossRef] [PubMed]
- Zhang Y, Zhang L, Mao L et al. Intestinal Microbiota-derived Propionic Acid Protects against Zinc Oxide Nanoparticle-induced Lung Injury[J]. Am J Respir Cell Mol Biol. 2022, 67, 680–694. [CrossRef]
- Yin Y, Sichler A, Ecker J et al. Gut microbiota promote liver regeneration through hepatic membrane phospholipid biosynthesis[J]. J Hepatol. 2023, 78, 820–835. [CrossRef]
- Nogal A, Valdes AM, Menni C. The role of short-chain fatty acids in the interplay between gut microbiota and diet in cardio-metabolic health[J]. Gut Microbes. 2021, 13, 1–24.
- Dalile B, Van Oudenhove L, Vervliet B et al. The role of short-chain fatty acids in microbiota-gut-brain communication[J]. Nat Rev Gastroenterol Hepatol. 2019, 16, 461–478. [CrossRef] [PubMed]
- Erny D, Dokalis N, Mezö C et al. Microbiota-derived acetate enables the metabolic fitness of the brain innate immune system during health and disease[J]. Cell Metab. 2021, 33, 2260–2276.e2267. [CrossRef]
- Frampton J, Murphy KG, Frost G et al. Short-chain fatty acids as potential regulators of skeletal muscle metabolism and function[J]. Nat Metab. 2020, 2, 840–848. [CrossRef]
- Veech RL, Gitomer WL. The medical and metabolic consequences of administration of sodium acetate[J]. Adv Enzyme Regul. 1988, 27: 313-343.
- Rinn JL, Chang HY. Genome regulation by long noncoding RNAs[J]. Annu Rev Biochem. 2012, 81: 145-166.
- Luo H, Lv W, Tong Q et al. Functional Non-coding RNA During Embryonic Myogenesis and Postnatal Muscle Development and Disease[J]. Front Cell Dev Biol. 2021, 9: 628339.
- Cesana M, Cacchiarelli D, Legnini I et al. A long noncoding RNA controls muscle differentiation by functioning as a competing endogenous RNA[J]. Cell. 2011, 147, 358–369. [CrossRef]
- Zhang ZK, Li J, Guan D et al. A newly identified lncRNA MAR1 acts as a miR-487b sponge to promote skeletal muscle differentiation and regeneration[J]. J Cachexia Sarcopenia Muscle. 2018, 9, 613–626. [CrossRef]
- Li Z, Cai B, Abdalla BA et al. LncIRS1 controls muscle atrophy via sponging miR-15 family to activate IGF1-PI3K/AKT pathway[J]. J Cachexia Sarcopenia Muscle. 2019, 10, 391–410. [CrossRef]
- Krautkramer KA, Kreznar JH, Romano KA et al. Diet-Microbiota Interactions Mediate Global Epigenetic Programming in Multiple Host Tissues[J]. Mol Cell. 2016, 64, 982–992. [CrossRef] [PubMed]
- Du J, Zhang P, Luo J et al. Dietary betaine prevents obesity through gut microbiota-drived microRNA-378a family[J]. Gut Microbes. 2021, 13, 1–19.
- Uzbay T. Germ-free animal experiments in the gut microbiota studies[J]. Curr Opin Pharmacol. 2019, 49: 6-10.
- Emerson, CP. Myogenesis and developmental control genes[J]. Curr Opin Cell Biol. 1990, 2, 1065–1075. [Google Scholar] [CrossRef]
- Weintraub H, Davis R, Tapscott S et al. The myoD gene family: nodal point during specification of the muscle cell lineage[J]. Science. 1991, 251, 761–766. [CrossRef]
- Chen, LL. Linking Long Noncoding RNA Localization and Function[J]. Trends Biochem Sci. 2016, 41, 761–772. [Google Scholar] [CrossRef]
- Cummings JH, Pomare EW, Branch WJ et al. Short chain fatty acids in human large intestine, portal, hepatic and venous blood[J]. Gut 1987, 28, 1221–1227.
- Rauf A, Khalil AA, Rahman UU et al. Recent advances in the therapeutic application of short-chain fatty acids (SCFAs): An updated review[J]. Crit Rev Food Sci Nutr. 2021: 1-21.
- Høverstad T, Midtvedt T. Short-chain fatty acids in germfree mice and rats[J]. J Nutr. 1986, 116, 1772–1776.
- Darzi J, Frost GS, Robertson MD. Do SCFA have a role in appetite regulation?[J]. Proc Nutr Soc. 2011, 70, 119–128.
- Liu C, Cheung WH, Li J et al. Understanding the gut microbiota and sarcopenia: a systematic review[J]. J Cachexia Sarcopenia Muscle. 2021.
- Qiu Y, Yu J, Li Y et al. Depletion of gut microbiota induces skeletal muscle atrophy by FXR-FGF15/19 signalling[J]. Ann Med. 2021, 53, 508–522. [CrossRef]
- Maruta H, Abe R, Yamashita H. Effect of Long-Term Supplementation with Acetic Acid on the Skeletal Muscle of Aging Sprague Dawley Rats[J]. Int J Mol Sci. 2022, 23(9).
- Giron M, Thomas M, Dardevet D et al. Gut microbes and muscle function: can probiotics make our muscles stronger?[J]. J Cachexia Sarcopenia Muscle. 2022, 13, 1460–1476. [CrossRef] [PubMed]
- Agus A, Clement K, Sokol H. Gut microbiota-derived metabolites as central regulators in metabolic disorders[J]. Gut. 2021, 70, 1174–1182. [CrossRef] [PubMed]
- Ðanić M, Stanimirov B, Pavlović N et al. Pharmacological Applications of Bile Acids and Their Derivatives in the Treatment of Metabolic Syndrome[J]. Front Pharmacol. 2018, 9: 1382.
- Kars M, Yang L, Gregor MF et al. Tauroursodeoxycholic Acid may improve liver and muscle but not adipose tissue insulin sensitivity in obese men and women[J]. Diabetes. 2010, 59, 1899–1905. [CrossRef] [PubMed]
- Mancin L, Wu GD, Paoli A. Gut microbiota-bile acid-skeletal muscle axis[J]. Trends Microbiol. 2023, 31, 254–269. [CrossRef]
- Waddell DS, Baehr LM, van den Brandt J et al. The glucocorticoid receptor and FOXO1 synergistically activate the skeletal muscle atrophy-associated MuRF1 gene[J]. Am J Physiol Endocrinol Metab. 2008, 295, E785–797. [CrossRef]
- de Campos-Ferraz PL, Andrade I, das Neves W et al. An overview of amines as nutritional supplements to counteract cancer cachexia[J]. J Cachexia Sarcopenia Muscle. 2014, 5, 105–110. [CrossRef]
- Kapranov P, Cheng J, Dike S et al. RNA maps reveal new RNA classes and a possible function for pervasive transcription[J]. Science 2007, 316, 1484–1488. [CrossRef] [PubMed]
- Statello L, Guo CJ, Chen LL et al. Gene regulation by long non-coding RNAs and its biological functions[J]. Nat Rev Mol Cell Biol. 2021, 22, 96–118. [CrossRef]
- Peng Y, Xu M, Dou M et al. MicroRNA-129-5p inhibits C2C12 myogenesis and represses slow fiber gene expression in vitro[J]. Am J Physiol Cell Physiol. 2021, 320, C1031–c1041. [CrossRef]
- Bray NL, Pimentel H, Melsted P et al. Near-optimal probabilistic RNA-seq quantification[J]. Nat Biotechnol. 2016, 34, 525–527. [CrossRef]
- Livak KJ, Schmittgen TD. Analysis of relative gene expression data using real-time quantitative PCR and the 2(-Delta Delta C(T)) Method[J]. Methods. 2001, 25, 402–408. [CrossRef] [PubMed]
Figure 1.
Acetate relieves gut microbiota depletion induced inhibition of physiological function and MRFs expression in skeletal muscle. A. Concentration of acetate in serum detected by GC-MS. B. Body weight minus cecum weight. C. Body weight gain(except cecum weight). D. Representative images of BF muscle sections from stained for the enzyme SDH (n = 3 per section per group, 20×, scale bar, 50 μm). E. Quantitative analysis of the ratio of SDH positive area using ImageJ. F-M. Detection of LD(F-I) and BF (J-M) expression of Mef2a, Myod1, Myog and Myf6 by RT-qPCR, respectively. All data are expressed as the means ± SEM (n = 3 per group). Data were analyzed using unpaired two tailed Student’s t test or one-way ANOVA test and were considered statistically significant, at *P < 0.05, **P < 0.01, and ***P < 0.01 between indicated groups.
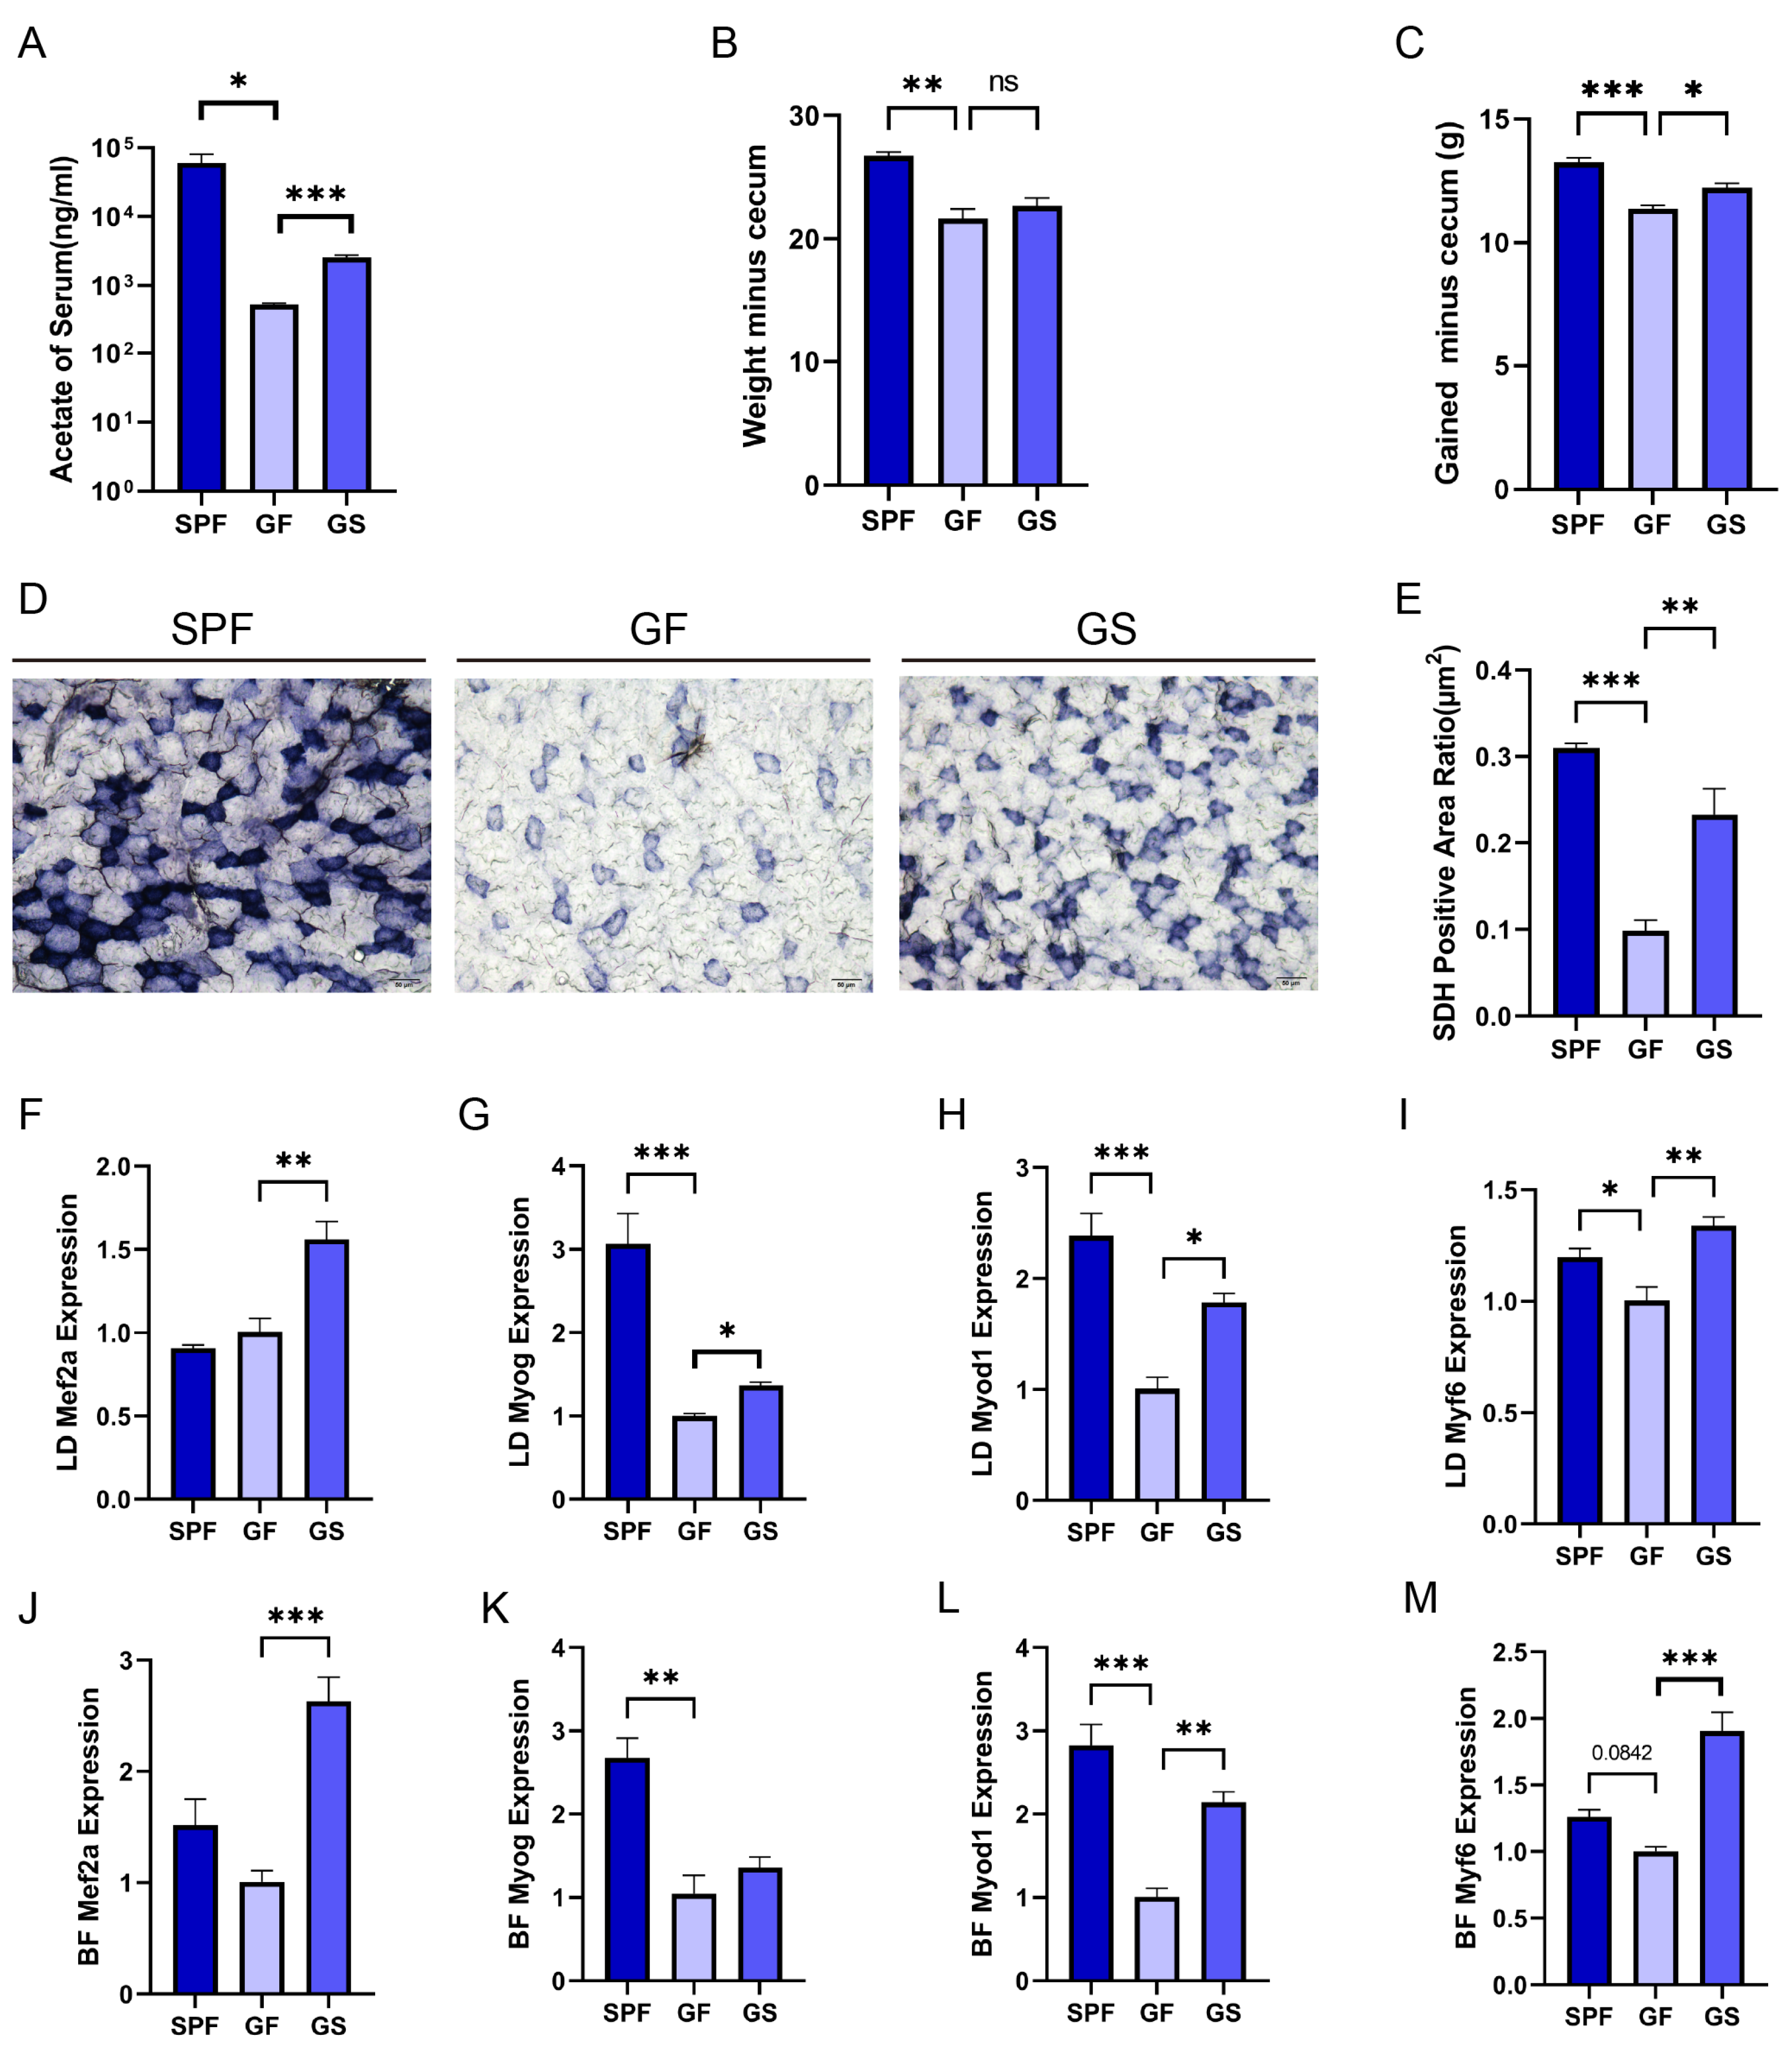
Figure 2.
Transcriptome differences in BF and GSEA reveals that the absence of gut microbiota inhibits the growth and development of BF in GF group. A, B. Heatmap of differentially expressed genes of in BF in SPF vs. GF (A) and GF vs. GS (B). C-K. Compared to the SPF group, loss of gut microbiota inhibits “contractile fiber” (C), “structural constituent of muscle” (D), “striated muscle cell development” (E), “regulation of skeletal muscle tissue development” (F), “skeletal muscle tissue regeneration” (G), “positive regulation of myotube differentiation” (H), “skeletal muscle satellite cell proliferation” (I), “striated contraction” (J) and “striated muscle adaptation” (K) biological processes in the BF muscle of GF group.
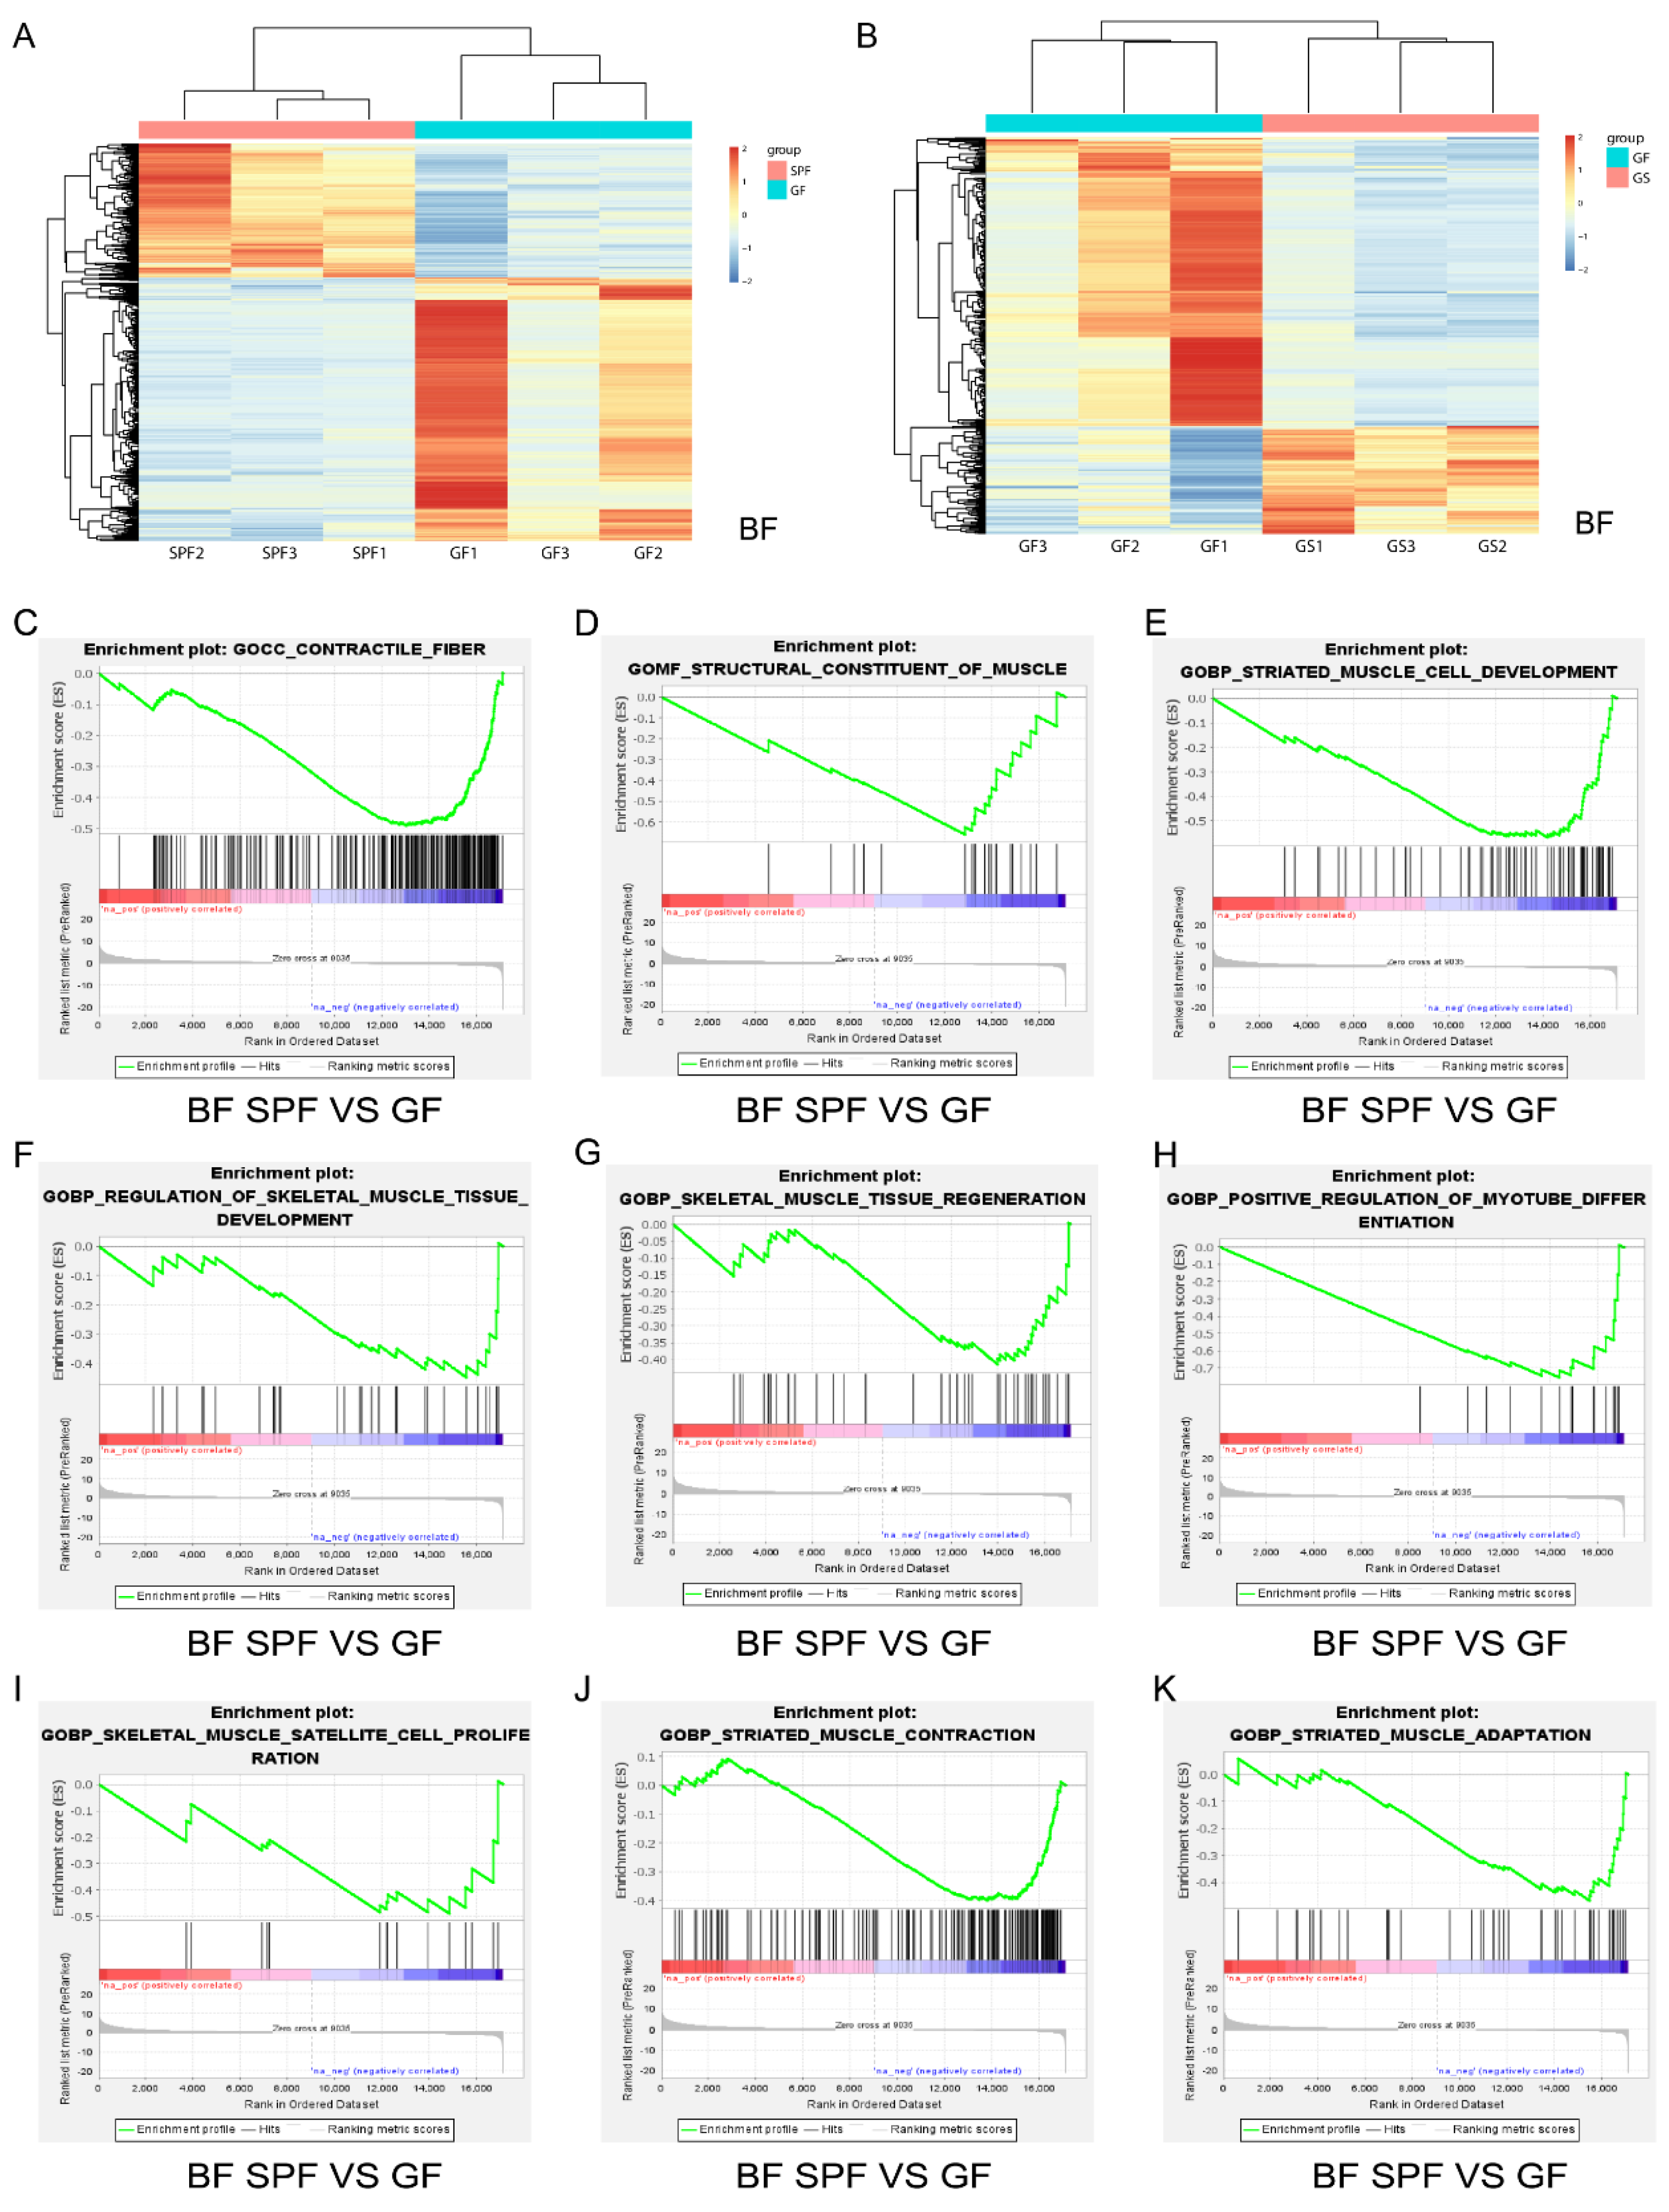
Figure 3.
The lncRNA participated in the regulatory network underlying acetate alleviation of impaired growth and development of skeletal muscle in mice caused by gut microbiota depletion. A, B. GO enrichment analysis accomplished based on co-expression analysis between differentially expressed PCG and lncRNA of BF (A) and LD (B), respectively. C. Interaction network of 22 lncRNA with Myf6, Myod1 and Myog based on BF and LD sequencing. D. TPM values of Myf6, Myod1, Myog, and Gm16062 based on BF and LD sequencing. E. Pearson correlation coefficients of Gm16062 with Myf6, Myod1, and Myog were calculated according to the data in Figure D. F. Gm16062 expression level was determined by RT-qPCR in skeletal muscle tissue. All data are expressed as the means ± SEM (n = 3 per group). Data were analyzed using one-way ANOVA test and were considered statistically significant, at *P < 0.05 and **P < 0.01 between indicated groups.
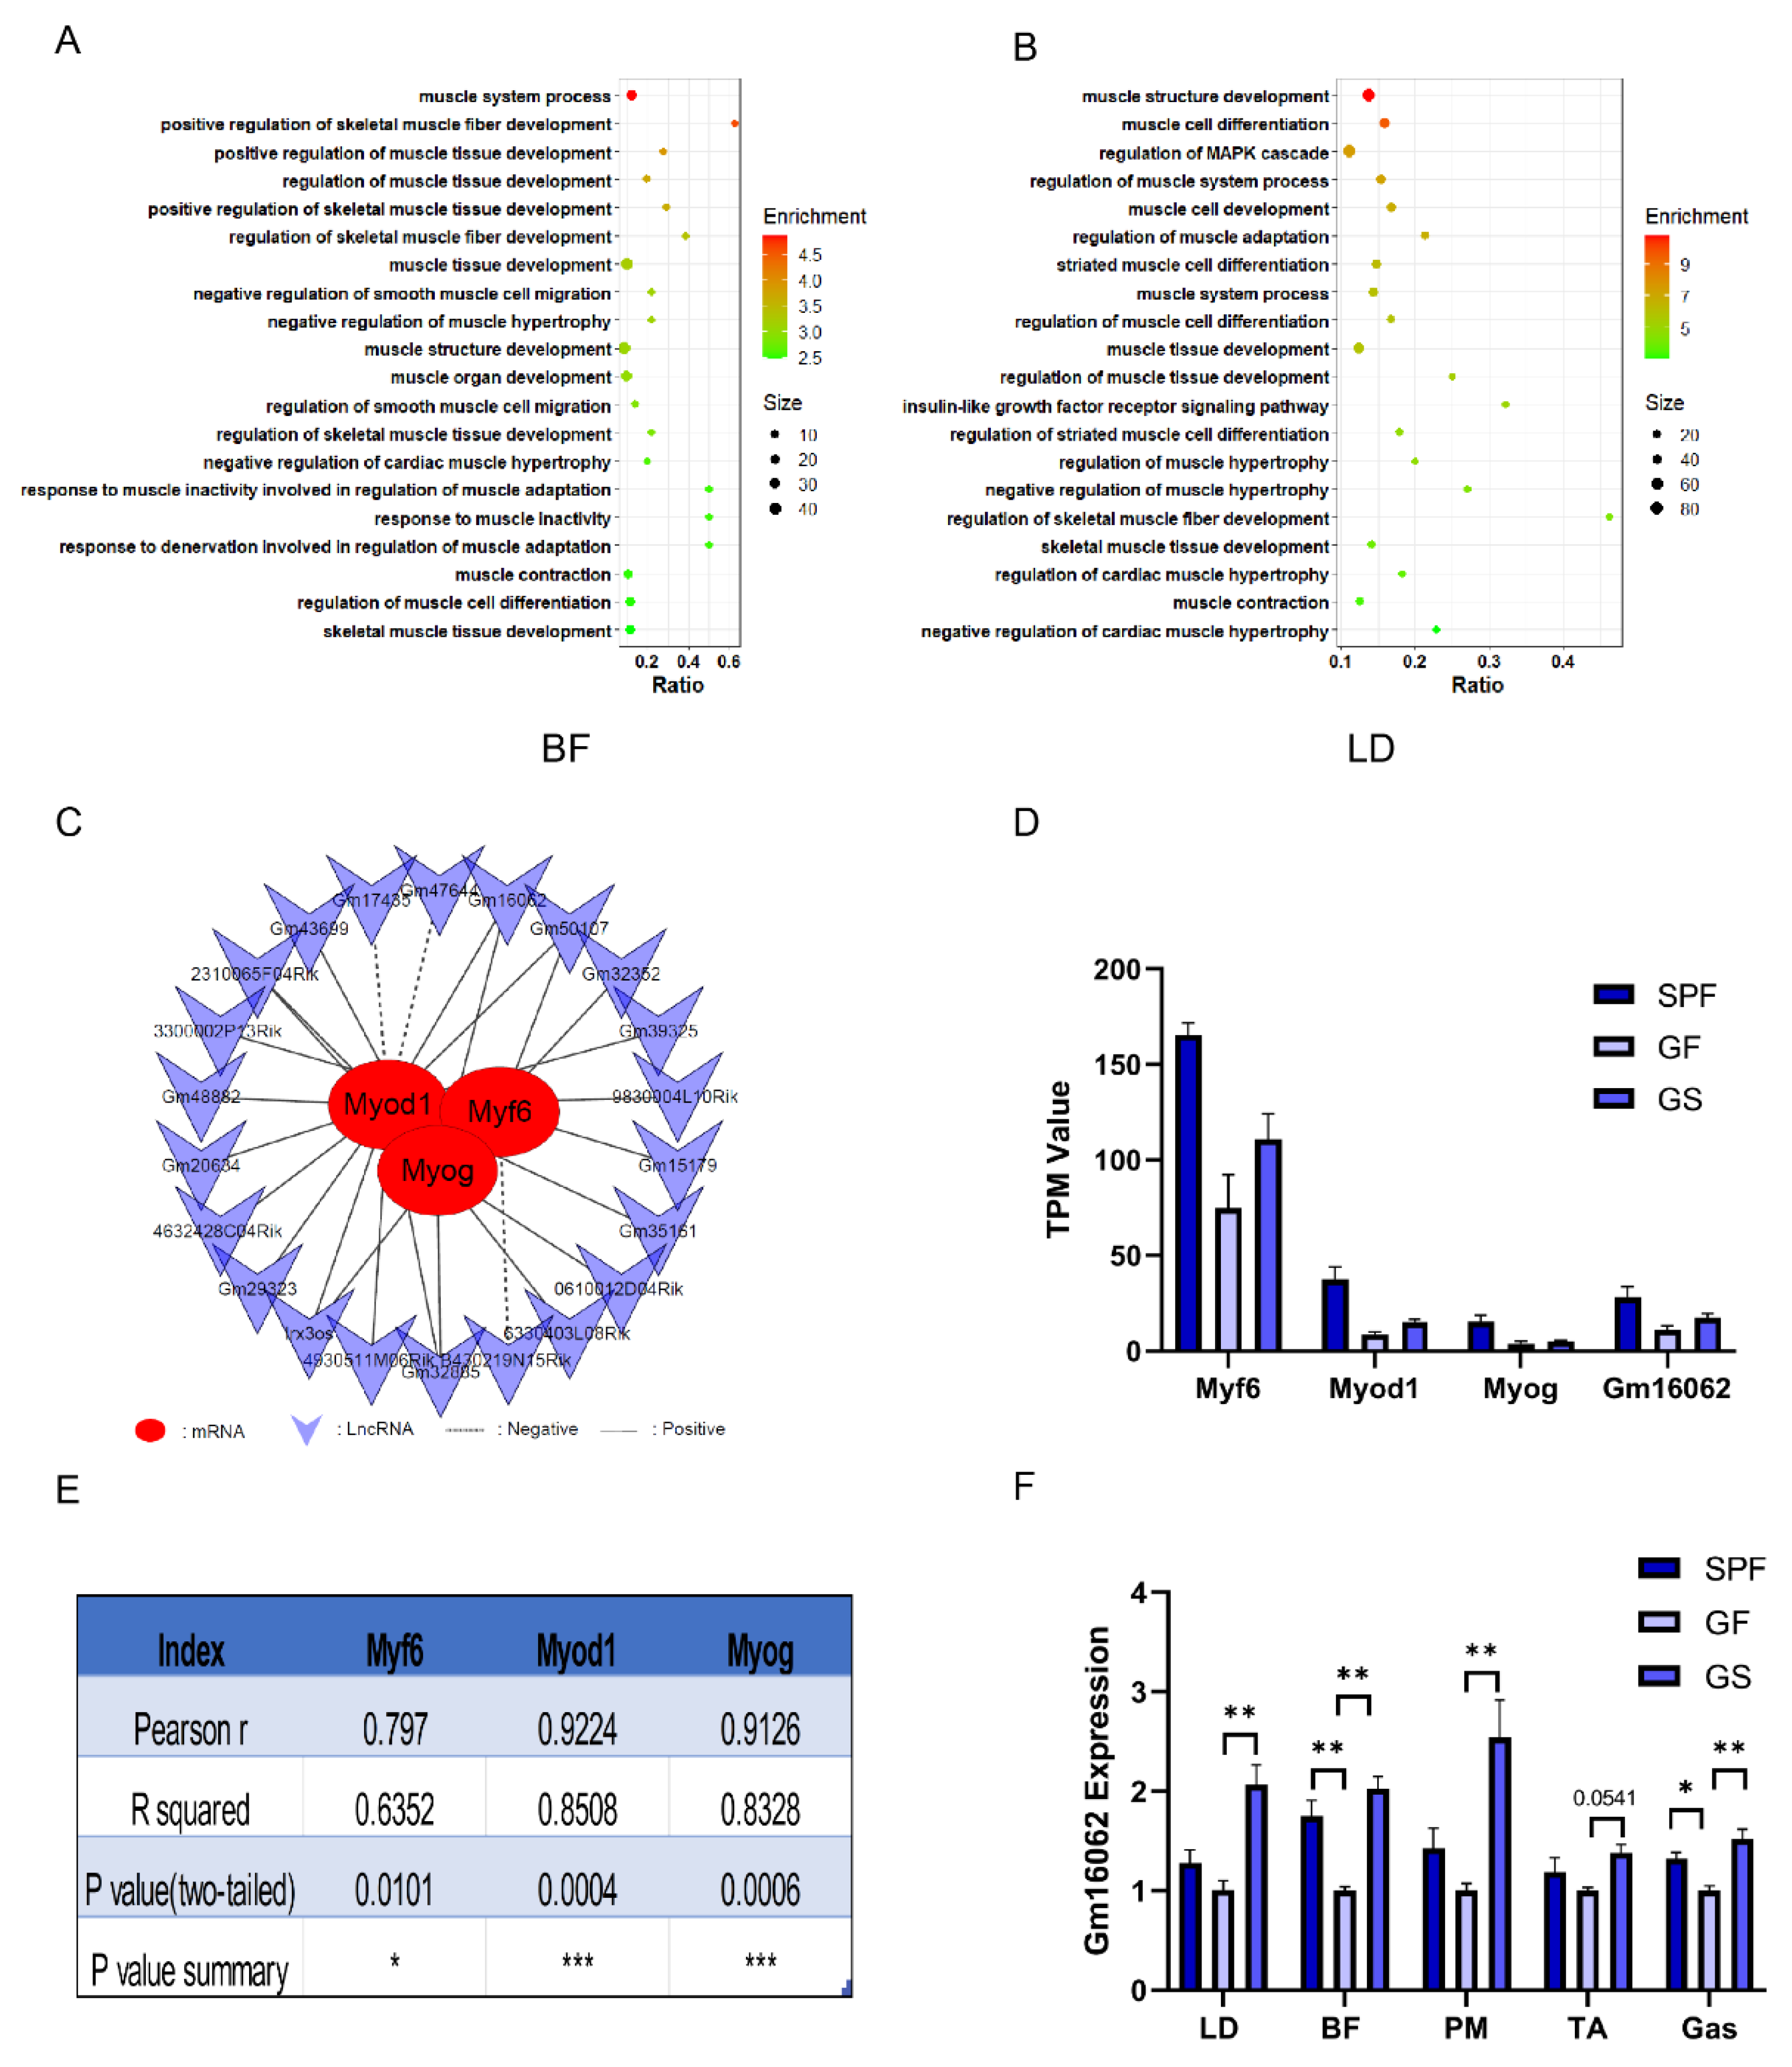
Figure 4.
Acetate promotes myogenic differentiation of C2C12 cells. A. Mycoplasma detection results, lane#1: positive control, lanes#2-4: C2C12 culture supernatant, lane#5: DL2000 DNA Marker. B. CCK-8 assays to detect the cytotoxicity of C2C12 with different concentrations of sodium acetate supplementation (n = 5 per group). C-E. The expressions of Mef2a (C), Myog (D) and Myod1 (E) were detected on the 5th day of C2C12 differentiation with different SA concentrations supplementation by RT-qPCR (n = 3 per group). F. Gm16062 expression level was detected by RT-qPCR on the 5th day of C2C12 differentiation with 2 mmol/L SA supplementation (n = 3 per group). G. MYH4 was detected by immunofluorescence staining on the 5th day of C2C12 differentiation, 20×, scale bar, 100 μm (n = 5 per section per group). H. The myotube fusion index was calculated by ImageJ (n = 5 per group). All data are expressed as the means ± SEM. Data were analyzed using unpaired two tailed Student’s t test or one-way ANOVA test and were considered statistically significant, at *P < 0.05, **P < 0.01, ***P < 0.001, and ****P < 0.0001 between indicated groups.
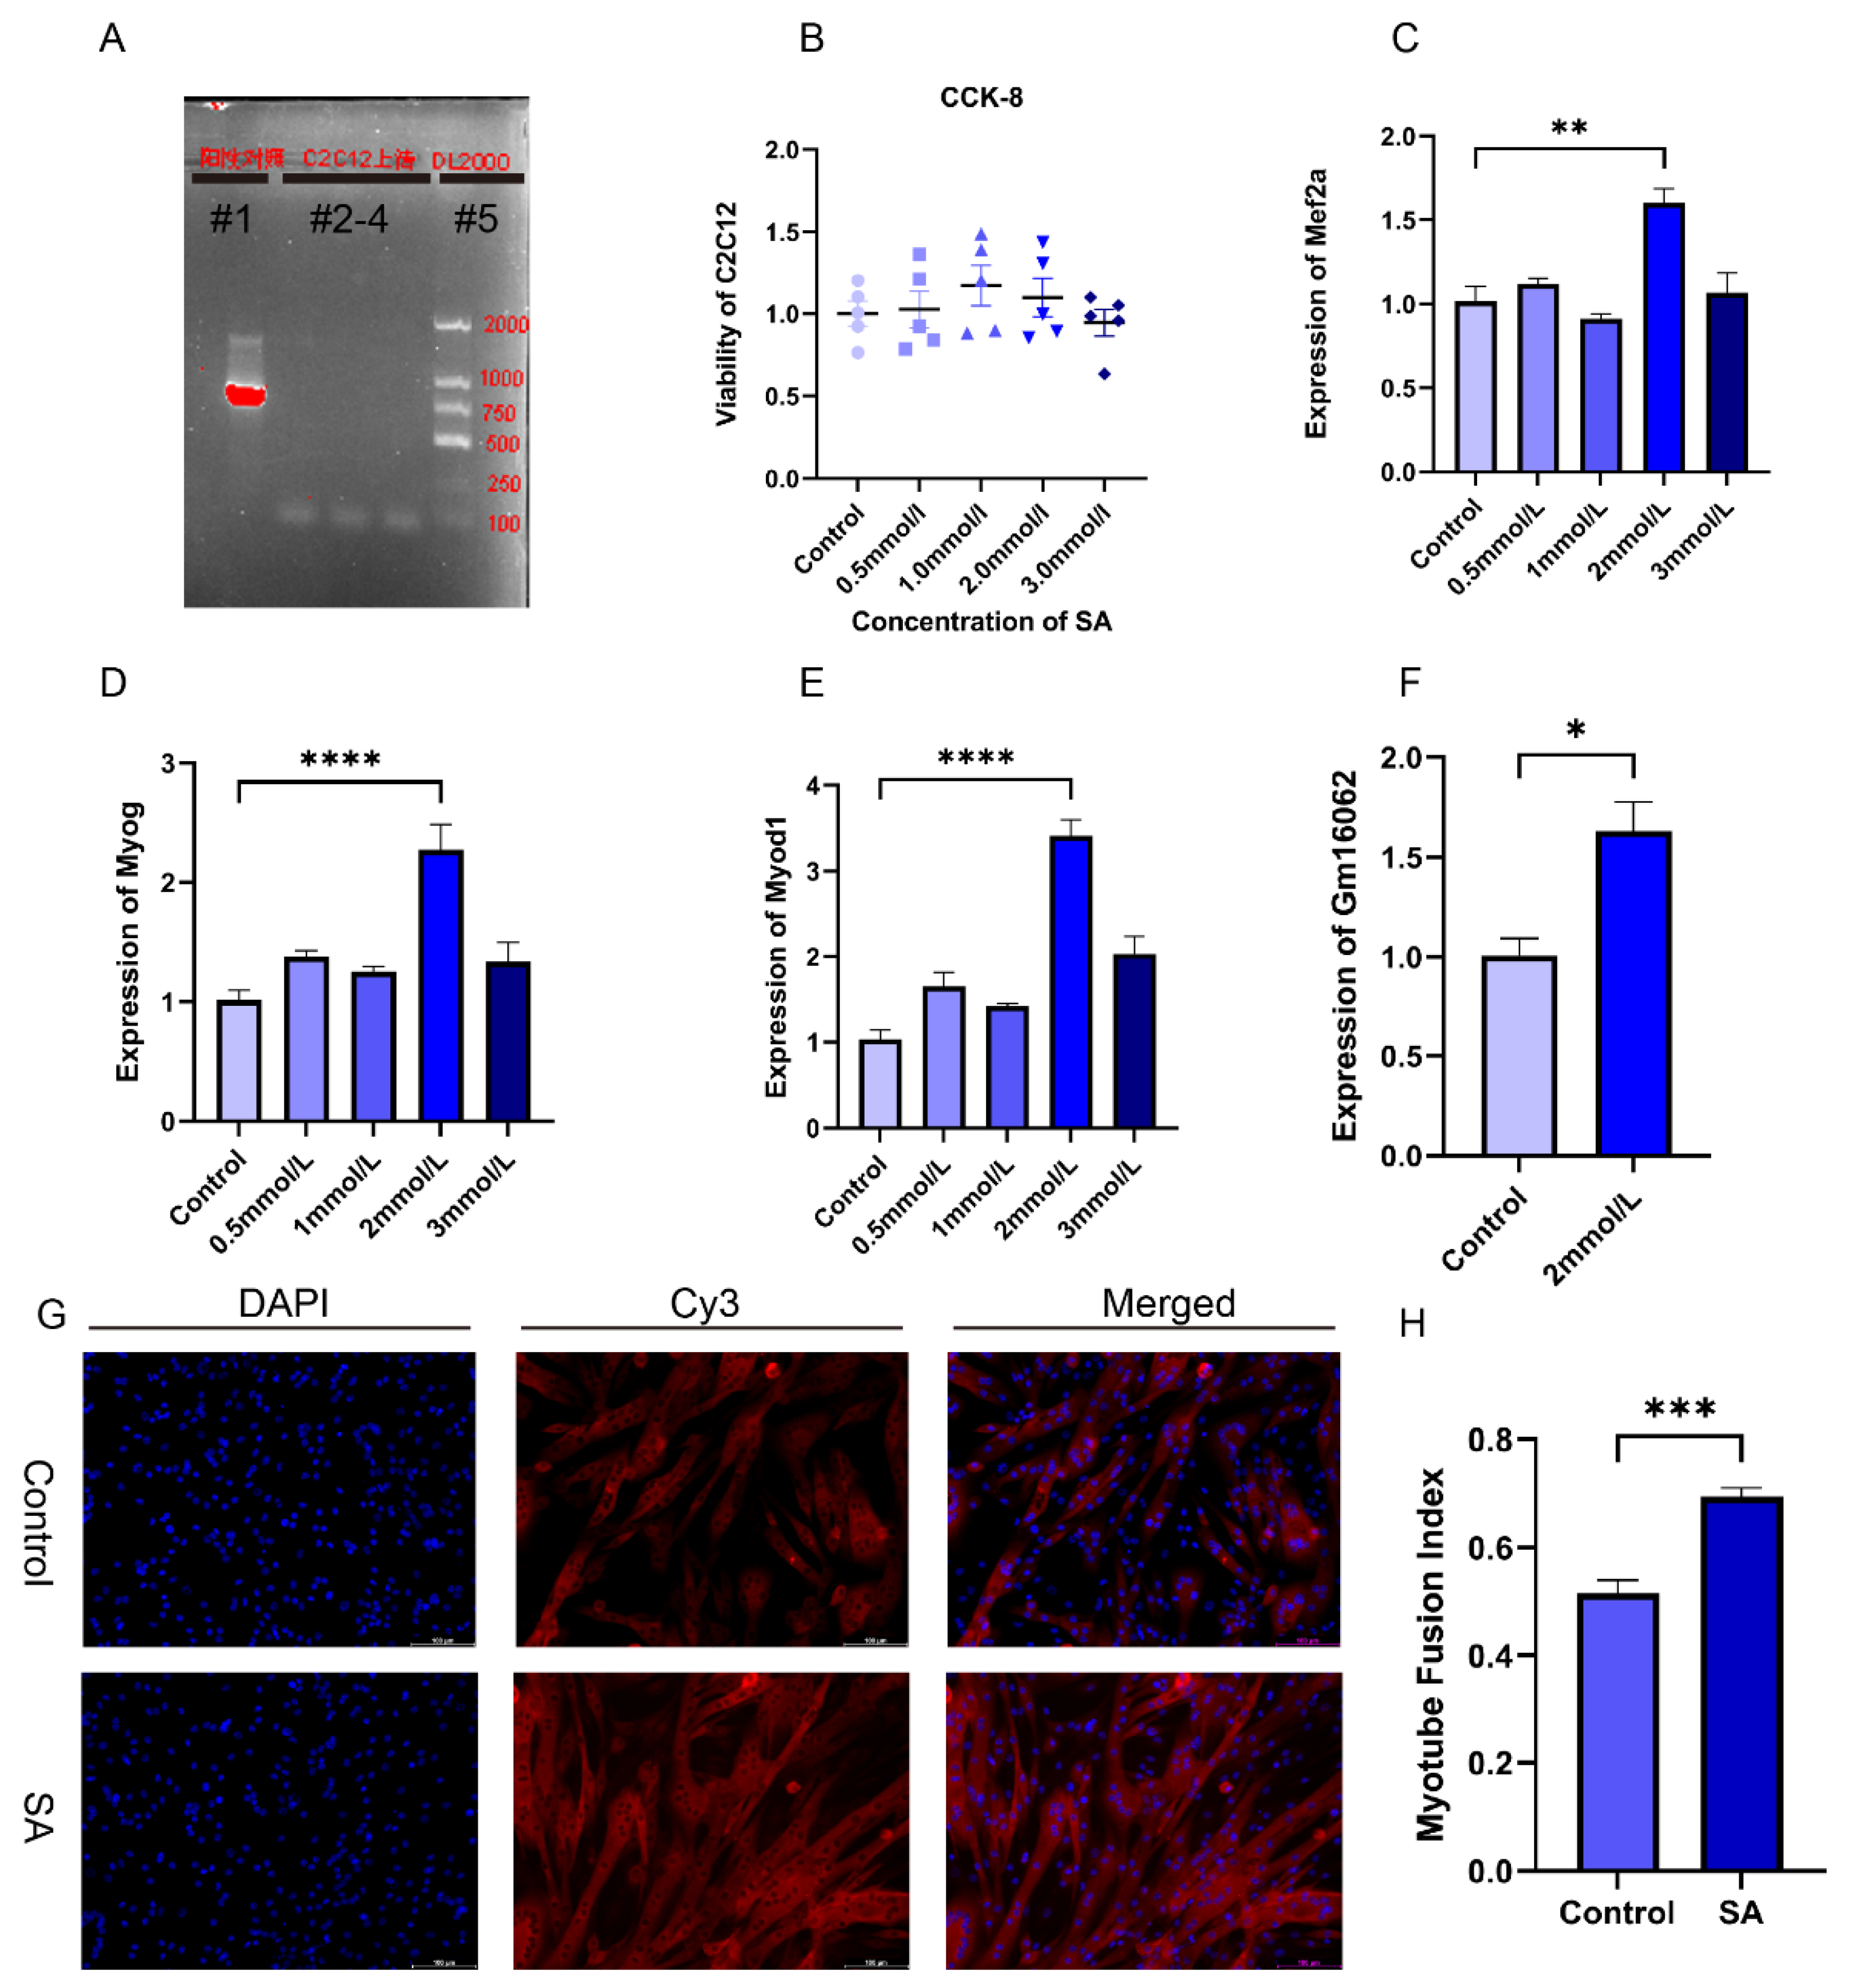
Figure 5.
Overexpression of Gm16062 promotes myogenic differentiation of C2C12. A. The transfection efficiency of Gm16062 overexpression vector was detected by RT-qPCR 48 h after overexpression of Gm16062 (n = 3 per group). B-D. The expression of Mef2a (B), Myod1 (C) and Myog (D) was detected by RT-qPCR on the 5th day of C2C12 differentiation after overexpression of Gm16062 (n = 3 per group). E. MYH4 was detected by immunofluorescence staining on the 5th day of C2C12 differentiation transfected with Gm16062 vector, 20×, scale bar, 100 μm (n = 5 per section per group). H. The myotube fusion index was calculated by ImageJ (n = 5 per group). All data are expressed as means ± SEM. Data were analyzed using unpaired two tailed Student’s t test and were considered statistically significant, at *P < 0.05, **P < 0.01, ***P < 0.001, and ****P < 0.0001 between indicated groups.
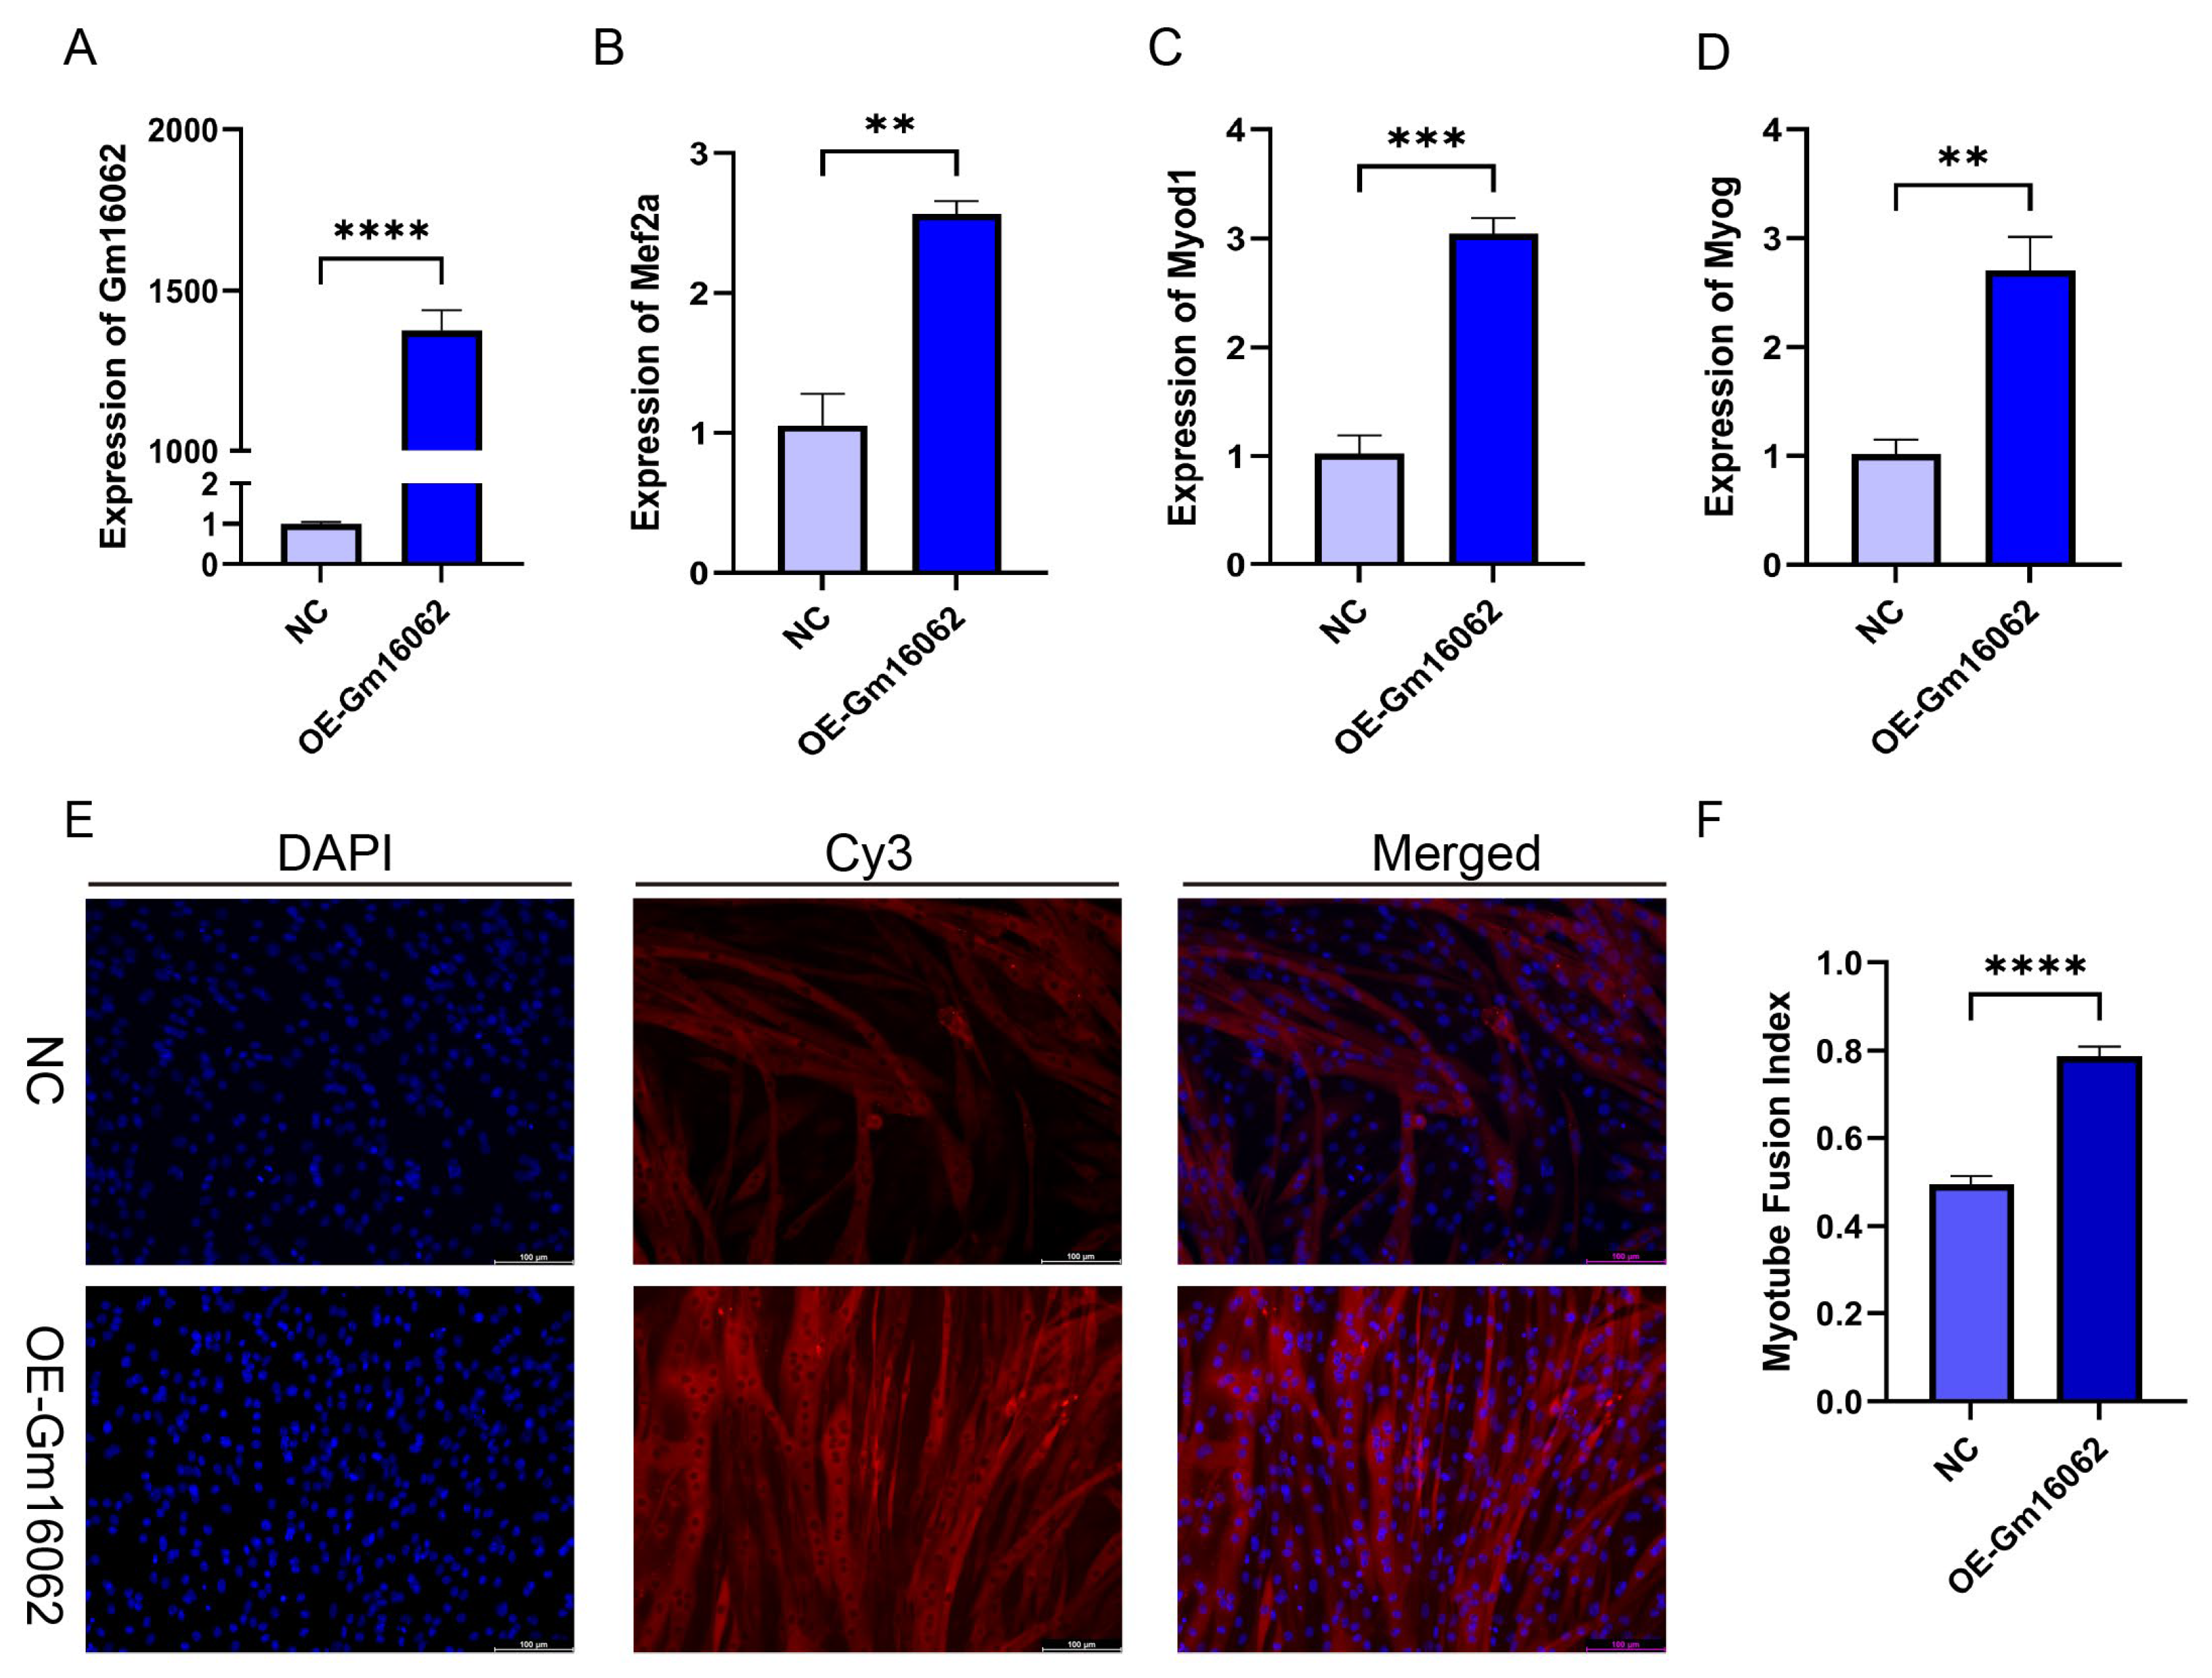
Figure 6.
Overexpression of miR-129-2-3p inhibits C2C12 myogenic differentiation. A-D. Detection of the expression level of miR-129-2-3p in LD (A) and BF muscle (B), with SA supplementation (C) and Gm16062 overexpression (D) by RT-qPCR, respectively (n = 3 per group). E. The expression pattern of miR-129-2-3p during myogenic differentiation detected by RT-qPCR (n = 3 per group). F. The transfection efficiency of agomiR-129-2-3p 48 h after transfection was detected by RT-qPCR (n = 3 per group). G-I. The expression levels of Mef2a (G), Myod1 (H), Myog (I) and Gm16062 (J) were detected by RT-qPCR on the 5th day of C2C12 differentiation transfected with agomiR-129-2-3p (n = 3 per group). K. MYH4 was detected by immunofluorescence staining on the 5th day of C2C12 differentiation transfected with agomiR-129-2-3p, 20×, scale bar, 100 μm (n = 5 per section per group). L. The myotube fusion index was calculated by ImageJ (n = 5 per group). All data are expressed as means ± SEM. Data were analyzed using unpaired two tailed Student’s t test or one-way ANOVA test and were considered statistically significant, at *P < 0.05, **P < 0.01, ***P < 0.001, and ****P < 0.001 between indicated groups.
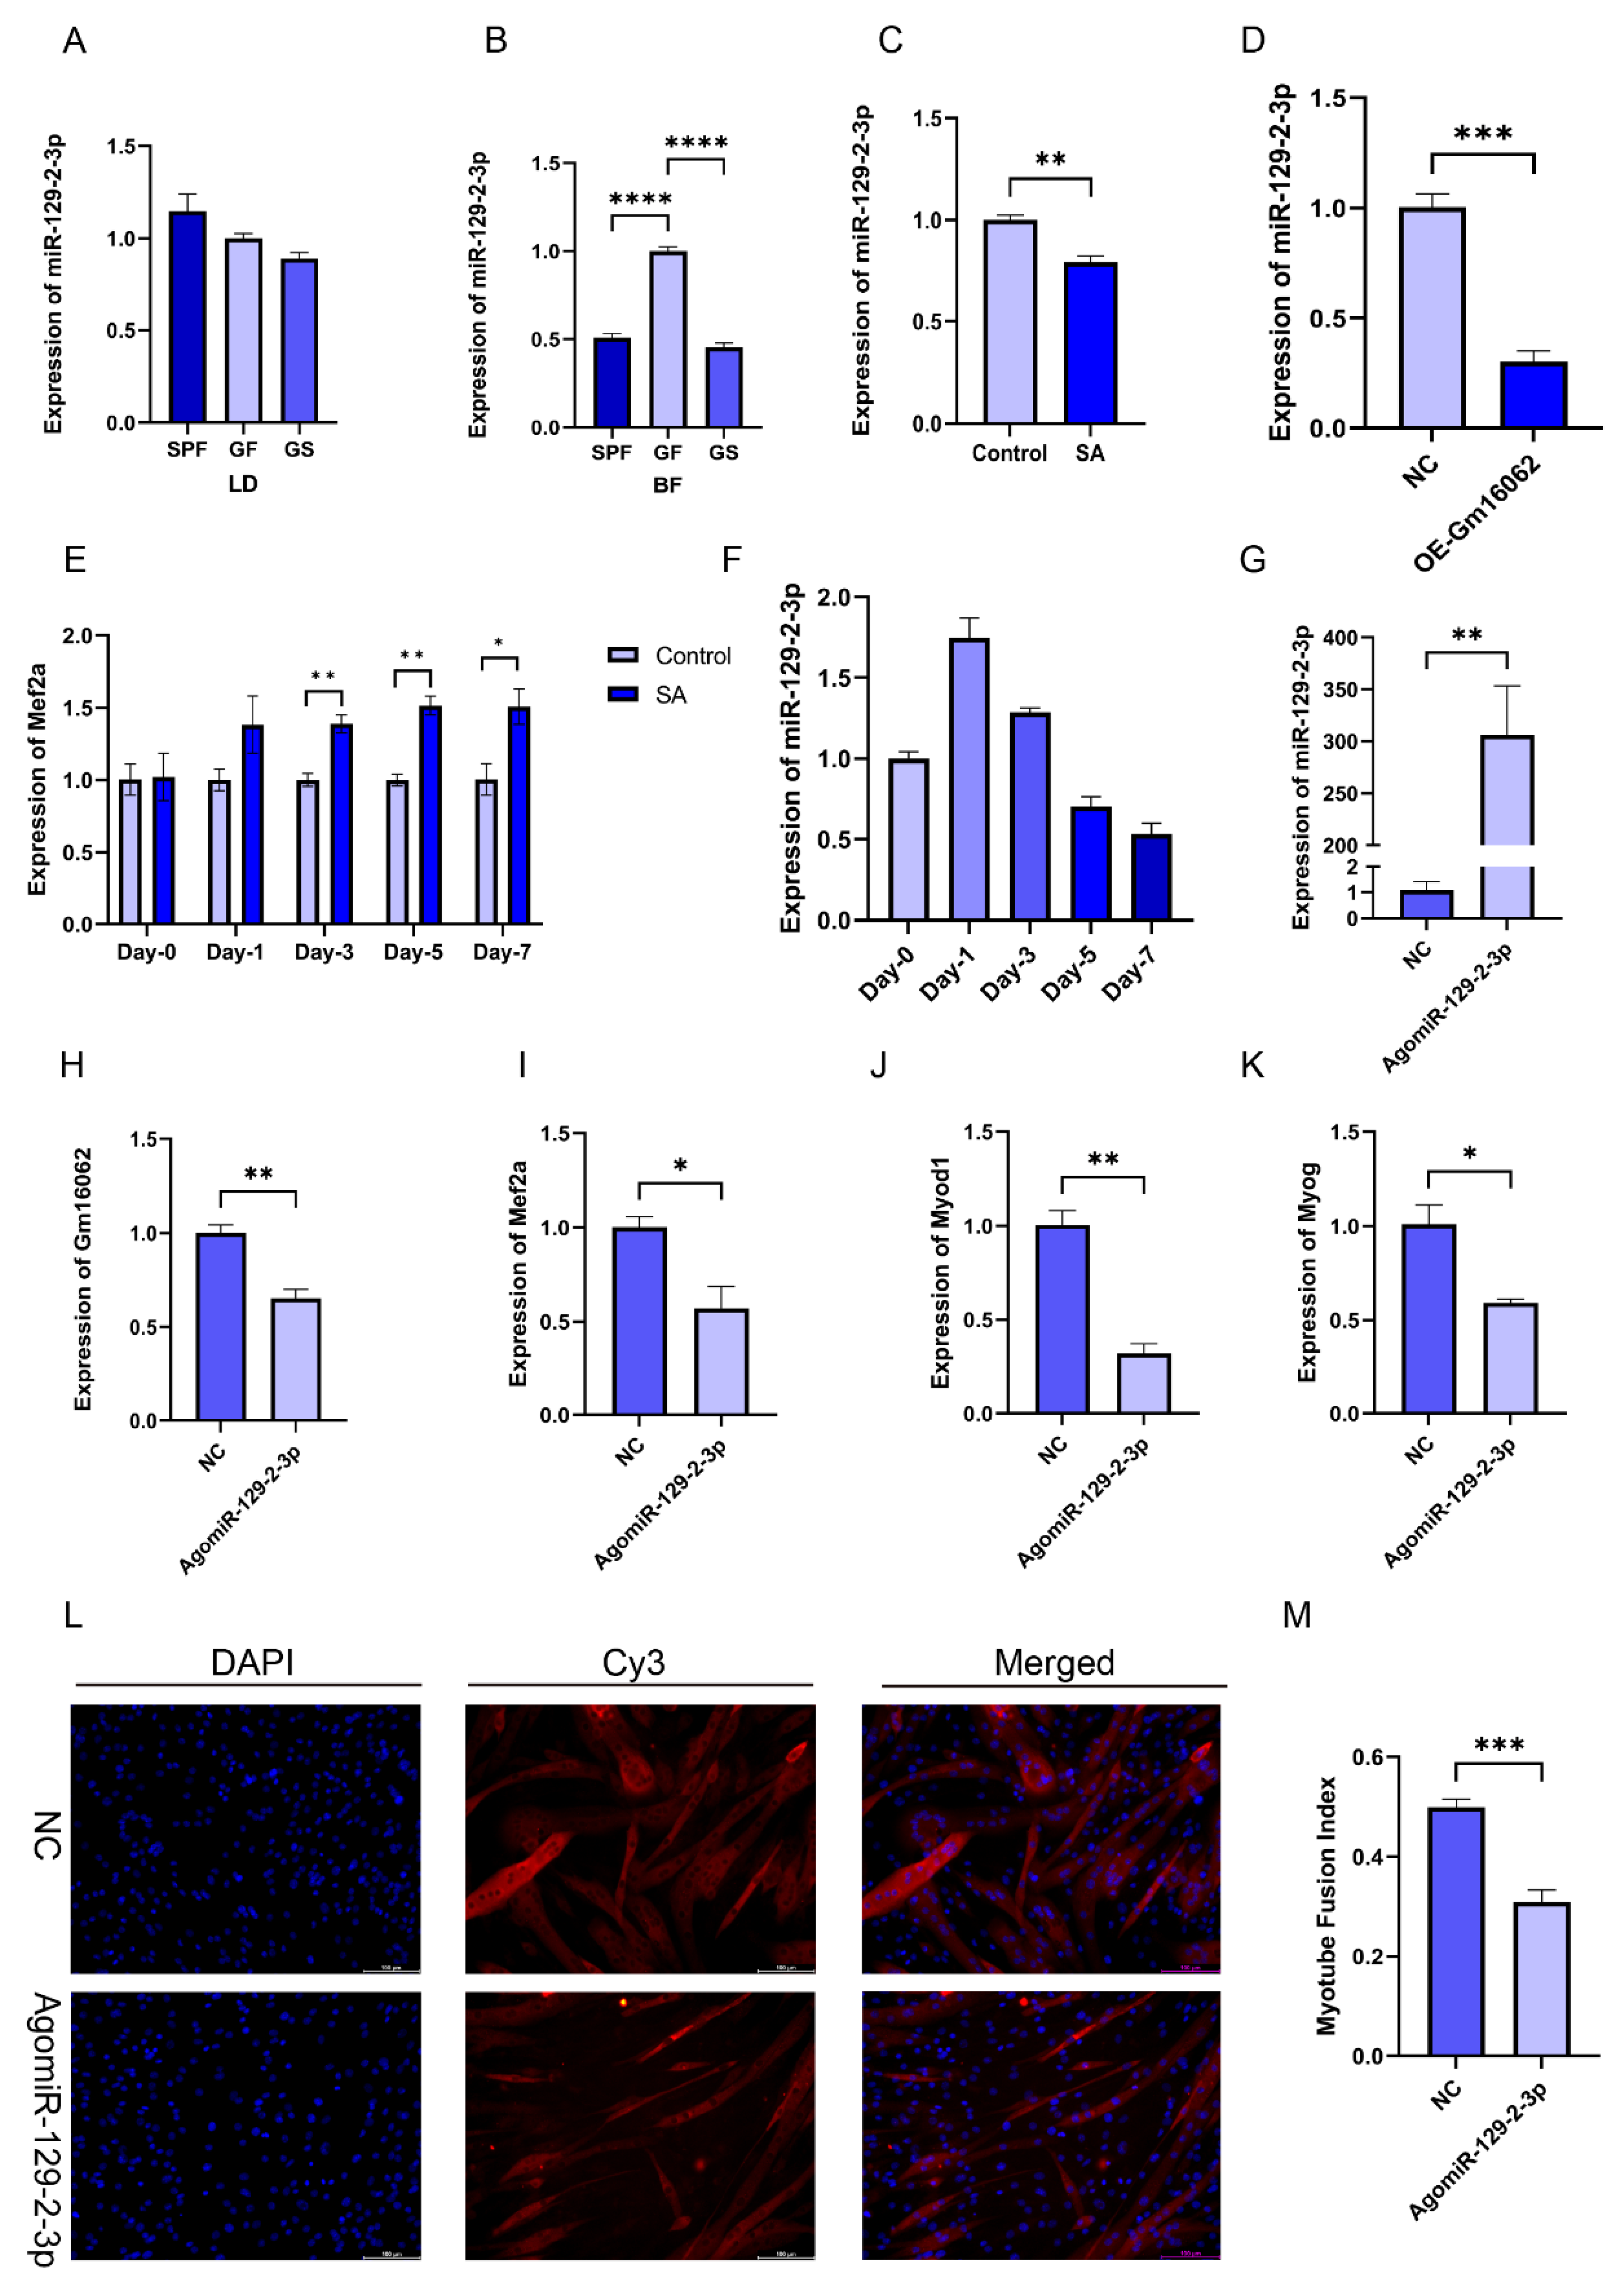
Figure 7.
Identification of Gm16062/miR-129-2-3p/Mef2a regulatory axis. A. The binding site between miR-129-2-3p and Gm16062. B. Detection of Gm16062-WT luciferase activity after overexpression of miR-129-2-3p for 48 hours. C. Detection of Gm16062-MUT luciferase activity after overexpression of miR-129-2-3p for 48 hours. D. The activity of Gm16062-WT luciferase was detected after inhibition of endogenous miR-129-2-3p for 48 hours. E. The binding site between miR-129-2-3p and Mef2a-3’UTR. F. The expression of Mef2a during C2C12 differentiation between control group and SA supplementation group detected by RT-qPCR. G. Mef2a-WT luciferase activity was detected after overexpressing miR-129-2-3p for 48 h. H. Mef2a-MUT luciferase activity was detected after overexpression miR-129-2-3p for 48 hours. I. The activity of Mef2a-MUT luciferase was detected after inhibition of endogenous miR-129-2-3p for 48 hours. J. the luciferase activity of Mef2a-WT was detected after co-transfection of agomiR-129-2-5p or NC with Gm16062 vector or empty vector for 48 hours. All data are expressed as means ± SEM and the luciferase activity was normalized by Renilla luciferase activity. Data were analyzed using unpaired two tailed Student’s t test and were considered statistically significant, at *P < 0.05, **P < 0.01, ***P < 0.001, and ****P < 0.001 between indicated groups.
Disclaimer/Publisher’s Note: The statements, opinions and data contained in all publications are solely those of the individual author(s) and contributor(s) and not of MDPI and/or the editor(s). MDPI and/or the editor(s) disclaim responsibility for any injury to people or property resulting from any ideas, methods, instructions or products referred to in the content. |
© 2024 by the authors. Licensee MDPI, Basel, Switzerland. This article is an open access article distributed under the terms and conditions of the Creative Commons Attribution (CC BY) license (http://creativecommons.org/licenses/by/4.0/).
Copyright: This open access article is published under a Creative Commons CC BY 4.0 license, which permit the free download, distribution, and reuse, provided that the author and preprint are cited in any reuse.


