
Submitted:
24 March 2024
Posted:
16 April 2024
You are already at the latest version
Abstract
The impacts of inflation on international finance are generally reflected in the decline of buying power, risks of investment and deposit loss from currency devaluation. For the purpose of optimized allocation and management of asset values, i.e., annual income or research grants, a framework of a three-level model for static financial management is presented to maximize banking interests, bonuses, and the remaining balance after spending necessary expenditures. Meanwhile, in retrospect to higher-level financial inflation, strategies of dynamic investment, i.e., posing regular tests of flipping coins, exploiting variations of the currency exchange rate, as well as applying the theory of broad money, are presented to increase the appreciation rate of net assets in and post the era of COVID-19. Quantitative evaluations in case studies verify the feasibility of improving the financial situation, indicating broader applications for budgeting and investing when US inflation rate is below 3.0%. Besides, combining approaches of static and dynamic strategies, the expected annual growth rate of individual zero-risk asset investment is predicted as within the range of 8.30~9.62% according to budgeted appreciation on net assets in 12 months, which is capable of overcoming negative impacts from higher level annual inflation, i.e., those as highest as 8.01% in the Year 2022.
Keywords:
Static fiscal management
; dynamic strategic approach
; asset appreciation
; theory of broad money
; dynamic stochastic general equilibrium (DSGE)
1. Introduction
In the real world, everything has its rate of natural growth. International finance also has a similar behavior. As is claimed by financial researchers, the economic growth of a nation or region can be stimulated by mild financial inflation, which is within the range of 2.5% annual inflation rate (AIR). The rising price of commodities inevitably affects the buying power of each cash value that consumers spend. Hence, to survive with robust financial conditions with respect to annual income, deposits and asset values coming from individuals or any other commercial property, there are generally two options to fight against inflation that people are unhappy to face: spending your income and trade in goods that worth higher than keeping it cumulatively as banking deposits, or smartly managing it in the form of variable, accumulative investment so as to achieve a higher financial growth rate in contrast to the naturally unavoidable AIR.
Historically, the phenomenon of inflation appeared at intervals since ancient times, while the potential causes and remedies of resolution are under heated debates all over the world (Fan 2011). We have studied some of the most distinguished scholars’ work in the past 40 years, and classified the progress of their study and opinions of review in the following scenarios: Bailey proposed a thought test to fully predict the constant inflation rate resulted from the constant growth of money supply, which set up a creative example of quantitative policy evaluation; meanwhile, with respect to Keynes’s theory of money demand, a “welfare triangle” was applied to measure the welfare cost of inflation (Bailey et al. 1956). When estimating the welfare cost of inflation, Barro reconstructed the curve of money demands to prove the opinions such that inflation may speed up the frequency of payments and thereby reduce its number of uses as payment media, resulting in even higher trade costs (Barro 1972). While individual welfare loss and socio-economic cost directly result from inflation, its hidden cost is also difficult to recognize, indicating that the main body of economic behavior, shows deviation from reality when predicting inflation, and hence, inflation and the uncertainty of expecting inflation are generated (Chen and Chen, 2011). Open discussions towards the various impacts of such kind of uncertainty on national finance and the global economy, can be chronologically divided into four categories: Friedman hypothesized that a higher inflation rate may increase its uncertainty, where its model is reshaped by Ball (Friedman and Ball, 1977), and the positive correlations between inflation and its uncertainty in US were later verified by ARIMA-GARCH time series model testing (Payne, 2009) and mechanism transformation based ARCH model (Chang and He, 2010). Opposite views suggested that the increased uncertainty of inflation may also generate stronger fluctuations in the inflation rate, leading to an increase in its level (Cukeriman and Meltzer, 1986). Meanwhile, the intervention and prediction of inflation from various economies, such as governments and individuals, may upgrade accuracy along with the uprise of inflation levels, thereby reducing the uncertainty of inflation (Pourgermi and Markus, 1986); later, the supportive evidence subsequently appeared in the seasonal dummy variables when empirically modeling behaviors of worldwide inflation (Ungar and Zilberfarb, 1993). For the possible feedback effects between inflation and its uncertainty, governmental macro-control was claimed to play the role of alleviating inflation levels and reducing their uncertainty (Holland 1995), where this viewpoint finally got convincing evidence from dynamics of persistence in inflation among G7 nations (Kumar and Okimoto 2007), and the example validation of Thai finance, emphasizing that the uprise of inflation levels may also lead to increased uncertainty, which in turn brings about suppression on regional inflation (Payne 2009).
While following these crucial products had promoted some progress on worldwide financial inflation prior to 2012, different mathematical models may generate variable impacts on studying the sustainability of inflation (Chen and Chen, 2011). In the most recent decade, a variety of research scholars progressively established theoretical studies and treatment proposals on the formation and governance of global inflation (Lu et al. 2022). The uprise of price levels was triggered by the monetary easing policy from US Federal Reserve, which was modeled from indicators such as US money supply, price levels and commodity price indices (Alessio et al. 2010). Another econometric model was constructed to study the main reason for the inflation level and uprise in commodity prices, which concluded as excess liquidity (Belke 2014). Later, it was also believed that the price level of China, especially the producer price index (PPI), could be significantly influenced by the International Commodity Research Bureau (CRB) Index (Lu and Zhao, 2017). These studies may indirectly prove four main channels for propagating inflation transmission among nations, i.e., monetary transmission, change in need for commodities, direct transmission of prices, and expected transmission of inflation (Lu et al. 2022).
In this era of post-COVID-19, more complicated features appear in current global inflation: due to the policy of rampant trade protection in some western countries, global industrial chains are often threatened by increased risks of disrupting supply chains and booming costs; meanwhile, the intensified risks of global trade since the spreading of COVID-19, constantly pushed up costs on trade; the excessive global liquidity, resulting from extremely loose monetary policies of western countries, also nourished objective conditions for inflation; besides, a few geopolitical conflicts are consecutively providing fuels, and hence, we are surviving in an upward phase of high inflation (Lu et al. 2022). For instance, the average inflation rate in US was reported as 8.0% in 2022, indicating the highest data over the past 40 years. We also concurrently experience the rise of prices in articles for daily use, and the hidden increase of living cost in the past few years. As a result, constructing reliable fiscal models, as well as optimizing both static and dynamic plans for finance, may not only benefit the quality of life in person but also provide some help for the social public on decent allocation and management of asset values.
A better management framework may help people capture the deserved growth rate while at minimum risks of investment. This static strategy of a “multi-level” financial model takes into account optimized fiscal management for the reference of individual persons, households, and companies. To begin with, it is supposed to estimate asset values of intellectual property, family deposits, or research funding and divide the amount into equivalent units (e.g., every $10,000 per unit). With respect to the weight or shares by 0.50, 0.30 and 0.15 (or 0.60, 0.25, and 0.10, depending on your preference or practical needs) for a single unit, each of the sharing can be deposited into three online banks (referring to the current annual percentage interests (API), and rank their priority from high to low by taking concerns on API, reputation, degree of easiness and financial safety (i.e., in the Year 2013, online banking interests are ranked as follows: CIT Bank, 1.05%; Barclays, 1.00%; Ally, 0.95%; American Express Bank, 0.90%; Discover, 0.80%; ING direct, 0.75%; Capital One: 0.65%; HSBC, 0.40%; …), then the best three banks are picked up depending on personal belief); then, your saving deposits (taking up 0.95 of one’s entire deposit) becomes a static part of your saving deposit, which plays a role of long-term investment. On the other hand, the remainder weight of “0.05” (i.e., proportionally $500 per unit), can be divided into comparatively equivalent shares and deposited into the corresponding checking accounts, one of which plays the role of daily consumption for our domestic family; at the same time, since consumers mainly buy goods through credit cards in a nation, individuals with reliable credit scores are more likely to connect credit cards with the checking accounts to their trusted banks, which offer personal credit cards waiving annual fees when the credit score of a reliable client is higher than a certain threshold.
Simply speaking, the static planning approach of allocation asset value is conceived as follows: treat daily consumption with credit cards in personal life, and pay back to credit companies from checking accounts. It can be a dynamic process of “keeping smart and active management on your fiscal digits”. Any knowledge, artistic life, deposits, and funding, are suggested to be viewed as a “network node” that propagates with a certain level of growth rate, while successful people intend to make legal and efficient ways to grow their “nodes” at a faster and higher rate.
It is best for personal managers to square the accounts every month (or every other week), and bind individual salary cards to the online saving accounts via direct deposit (consider using interleave links if possible and taking bi-week deposits proportionally with respect to domestic income). Meanwhile, the checking accounts can be “fed” with the smallest 0.10/0.15-weighted part from just one saving account and ensure that the 0.05-weighted proportion (from one saving account, which “feeds” all checking accounts) is sufficient to satisfy the demands of daily expenditures. As mentioned before, the largest proportion of 0.50/0.60-weighted saving account plays the role of long-term investment, which not only receives interest from online savings and money markets but also gets rationally bundled into either one or multiple asset pools for investing stocks, real estate, commercial foundations, and even lotteries, to name a few.
For variable funding status, potential financial difficulties, and also the degree of risks (for credibility and security), one should keep alert and be calm in heart. The safety of mechanism on asset management should be regularly evaluated with a letter-graded assessment (A+, A, A-, B+, B, B-, C+, C, C-, ...; for simplicity, sometimes a sole letter A, B and C is in use). In other words, the self-assessment can be concisely described as follows: if one may get rid of any debts (from credit cards, friends and parents), reserve surplus after deducting living expenses and other consumption each other, an A-level evaluation will be used in self-assessment (either A+ or A is contrasted to different fiscal situations); provided that the red figures for deficits occur or other negative conditions come into existence, one often needs to keep self-consciousness (including family members or other collaborative persons) for potential risks, and show mutual belief to improve the “less favorable” situations.
At present, one of these “less favorable” situations appears to be a tendency for rising inflation across the world. As indicated by a current study from the international financial communities, it may take 3-4 years to stabilize the expected inflation at a controllable level since the outbreak of COVID-19 (Lu et al. 2022). High inflation may directly impose negative impacts on the national economy and people’s livelihoods, not only increasing trade costs but also resulting in supply shortages and booming prices. Taking US as an example, while the inflation rate has dropped from its peak of 9.1% in June 2022 to 3.7% in September 2023, the current data of temporarily stable inflation does not exclude counter measures such as superpower countries pursuing trade protectionism in the global range, promoting an aggressive policy of raising interest rates, and shifting potential risks of inflation. As a result, in developing countries, urban and rural residents at the bottom of society, should adopt active and dynamic strategies on financial management in order to slow down the depreciation of net property and ensure the possibilities of preserving capital on savings. Hence, it is necessary to design a feasible framework for dynamic financial planning, which utilizes a small portion of current assets to obtain higher returns via smart investments under lower-risk conditions. Applying alternative strategies such as “flipping coins”, “exploiting exchange rate differentials,” and “shaping broad currency” may promote the real-time value of assets and purchasing power. In this paper, in combination with the proposed static fiscal model, dynamic strategies on financial planning are adapted to maintain stable purchasing power of asset values in conditions of higher inflation levels per year, where quantitative analysis is carried out under the insights of financial econometrics and dynamic stochastic general equilibrium (DSGE) based schemes.
The main contributions of this article are summarized in the following manifolds:
a) With respect to managing and budgeting individual income from US graduate students’ perspective (who previously survived and pursued Master’s and Ph.D. degrees in the past decade), a framework of a three-level static fiscal model is derived, aiming to optimize limited personal earnings based on static strategy in the condition that the annual financial inflation retains in low levels, i.e., 1.5~3.0% on average for a calendar year.
b) When facing hardships of financial pressures as well as the uprise of commodity prices during and after the epidemic situation of COVID-19, each piece of dynamic strategies on fiscal modeling, i.e., using arbitrage pricing theory to explain the ideas of flipping coins, covering the expenses from variations of currency exchange rate, and applying the theory of broad money which intersects with time series analysis and machine learning based schemes, are established for the better trade, management, and investing the flexible individual funds to pace up with much higher annual inflation rate, i.e., 8.0% on average for Year 2022.
c) A set of case studies and experimental results are presented, which quantitatively verified the difference between annual income and percentage of remaining balance with or without the proposed static fiscal framework, and how the strategies from dynamic fiscal modeling helped increase the rate of earnings to offset negative impacts from the high rate of annual inflation in peace time.
d) Combining the fundamental theory of mathematical finance and technological financials, a variety of refreshed insights towards improving managing and budgeting individual earnings or family income are discussed in accordance with the limitations of our current study, up-to-date observations of international finance, as well as refreshed technical advances towards the corresponding topics on computational economics.
The remainder of this paper is organized as follows. Section 2 presents methodology, which includes rising typical questions and offering suggested proposed solutions on the static fiscal framework and dynamic strategies for better management of asset values in the presence of regular and higher-level annual inflation. Section 3 establishes the case study and experimental results by quantitatively evaluating a set of test examples under different financial statuses of individuals. Brief discussions on the advantages, potential limitations, and shortcomings of the proposed fiscal models are presented in Section 4. Finally, Section 5 concludes our accomplished work and shows prospects for future investigations.
2. Methodology
Since the impact factors of inflation varies a lot among nations, time period as well as social and political status, it is extremely difficult to construct uniform mathematical models on real-time simulation. For explicit appraisal of individual related inflation, we present our approaches in the following scenarios: with respect to the keynote questions on managing and budgeting asset values, i.e., personal income from the view of a former US graduate student, static fiscal model is sketched and distributed in a workflow-based diagram, under the assumption that annual inflation rate remains low-level and steady. Meanwhile, a few dynamic fiscal strategies such as flipping coins, exploiting variations of currency exchange rate and applying the theory of broad money, are presented in the following subsections. Machine learning based metrics for performance evaluation on managing asset values are established therein, which are shown as prerequisites for the case examples and quantitative results in the next section.
2.1. Typical Questions on Individual Management and Budgeting
For the accumulated scores from credit cards and traded gift cards, credit returns to paying living expenses; some cash back (from both accumulated credit score and rebate website via online shopping) returns to Saving Account; Checking Accounts are mostly reliable on the feeds from Saving Account III; meanwhile, monthly balances (mortgage) from credit cards are fed from one or two corresponding checking account at regularly business days each week.
Questions: From an international graduate student’s perspective, how to derive a (nearly) suitable strategy to optimize income and balance savings? Also, how to consider an efficient “multi-level” financial plan for your domestic development in the future?
Testing example: Take a Ph.D. student’s financial status during his or her study as a simulation example. Three cases of funding status prevalently exist among all Ph.D. students in The University of Arizona, AZ, Tucson, USA. In general, a Ph.D. student’s annual-based financial support status, can be categorized in three different scenarios:
i) Case I: One is awarded with full graduate assistantships (20 hours per week of teaching assistant (TA) or research assistant (RA), counting as 0.5 Full Time Employee (FTE)) for twelve months in the USA, whose annual salary after tax has been estimated as approximately $18,000 per calendar year.
ii)Case II: One is awarded with partial assistantships (e.g., 13 hours per week of TA or RA, 0.33 FTE, estimated as $13,000; or 10 hours per week, 0.25 FTE, estimated as $10,000) per calendar year.
iii) Case III: One receives no assistantship, being self-supported for entire calendar year (while neither one’s Ph.D. advisor had any funding to support this Ph.D. student’s research topic, nor did the department had any TA positions granted for this student).
2.2. Proposed Static Fiscal Model to Distribute Income When Sharing Graduate Students’ Perspective
In retrospect to previous practical experience when a smart student is pursuing a Master’s or Ph.D. degree in US, consider the case study when a faculty sharing students’ perspective, a framework of “multi-level” static fiscal model for reasonably distributing variable source of incomes is presented in Figure 1, in which the model is contributed towards banking accounts with respect to living expenses and credit cards. Such kind of strategies can be implemented for managing family deposits, annual research funding, or conceiving a similar “multi-level” framework for knowledge enhancement on how to evaluate the performance of group members.
Recall that in common cases, we do not need to strictly put hands into the 0.50/0.60 and 0.25/0.30-weighted saving accounts, which are static assets during “tough” financial situations despite that a large amount of expenditure is compulsory. For the operational mechanism of three-level financial management system (Saving—Checking Accounts— Credit Cards), the weight of every account in the same level, can be flexibly adjusted, depending on your demands with respect to individual fiscal status at that time.
The website of Top online banks (saving or checking accounts) is linked as below: (www.bargaineering.com/articles/top-5-online-banks-savings-or-checking-accounts.html).
Take a city with relatively lower living cost as an example. In Tucson, the second largest city in Arizona of United States, a thrift student may require $9,000 ~ 10,000 on average for budgeting living expenses per person in 12 months (including off-campus housing, grocery, insurance and other miscellaneous expenditures, etc., while excluding tuition and medical payments,), which is under the assumption that this student is single, frugal, and also capable of cooking regular meals almost all by himself or herself.
The latter two financial cases as presented above may cause difficulties if students expect highly independence of themselves in fiscal managements. Meanwhile, inflation is another factor that we have to consider, even if it is as mild as 1%~3% on average per fiscal year, needless to mention the time cost in pursuing a Ph.D. degree, which is likely to demand comparatively longer period for rewarding returns.
Now that the following questions are generated. When implementing the proposed static fiscal model that we proposed above (in presence of common financial fluctuations and dynamic financial growth), can individuals or a single family obtain a significantly improved outcome of annual fiscal increasing rate? Suppose the increasing rate makes sense, what are the comparison and prediction in contrast to the monthly based and average annual inflation rate?
Let’s make conservative budgets on each part of the multi-level static fiscal model, then calculating the gross rate of annual growth for a financial unit (i.e., a US graduate student’s annual gross income before and after graduation) in the next section.
2.3. Proposed Dynamic Fiscal Strategy to Increase Income When Surviving COVID-19 and Post-Era under the Risk of Higher Financial Inflation
While the static fiscal model is clearly visible and easy for quantitative calculations, timing factors of funding investment and cash return are out of consideration, hence, it lacks the capability of adapting some uncontrollable variations from external financial environment. Besides, due to the static strategy of allocating and managing individual income, it is also common to experience an actual rate of annual profit below the original expectations. As a result, dynamic strategies of management and budgeting are a part of necessity when reasonably building up mathematical models on optimizing income.
Since Spring 2020, due to the negative impact of COVID-19, the controversial public health policy of social isolation directly and indirectly affects many aspects of social life in worldwide scenarios. Most notably, persistent uprise in the average price of goods and services affects people’s daily life. As is reflected in the US inflation rates from April 2021 to May 2023, this trend gave rise to extensive concerns about social and individual pressures of inflationary on international finance. For instance, due to the rising demand, interference of supply chain and tensions from COVID-19 related events, the cost of groceries, fuels, airfares and healthcare are soaring. Analysis on the impact of higher- level inflation on different sectors can be searched out from various resources.
In this subsection, dynamic fiscal strategies are proposed in the following scenarios:
i) Implement arbitrage pricing theory (APT) model (Ross 1976) to the origination of “flipping coins” for buying and selling. It was well known for coin dealers the common sense for doing business, i.e., buying something at lower price and selling it at higher price. For instance, with respect to the greysheet price list, a common year of morgan dollar is priced at $40 at Almost Uncirculated (AU) condition, while the dealers trade them in at 40% of retail price from warehouse, which is $16. There are a few options for selling: place these silver coins on a bid board (either physically on site or electronically on internet platforms such as Ebay) attracting regular customers to bid on these coins, or put these coins in physical stores for sale. The price difference deducting comprehensive loss (transaction fees, transportation and labor cost, etc.) per item, stands for the profits.
Two antique coin shops carry out different styles of doing business, one store trades in morgan dollars at 40% of market price, while the actual auction price on deal (at the bid board after deduction) is about 65% of its retail price; the other coin store did not trade in morgan dollars from original warehouse, instead by offering a fairer price, i.e., 75% of market price to attract regular customers trading in collected morgan dollars, then offer a 10% discount off its retail price to sell them back to retail markets. Hence, a morgan dollar collector has one strategy on collection: win the bid of morgan dollars (at 65% of retail price) from the former coin store, and sell them in small batches to the other coin store (at 75% of retail price). For every 10 morgan dollars, $40 is gained while yielding the rest profit to both sides of the two stores. The small part of accumulated earnings from side products of “flipping coins” is supposed to invest reliable morgan dollars which may preserve individual asset values, or return to the proposed cycle of multi-level framework of static model for fiscal management. A primary APT model is formulated in the Section 3 for quantitative analysis on real statistics of flipping silver dollars in some periods.
ii) Adopt auto-regressive integrated moving average (ARIMA) model on predicting how to prevent risks of losing property values from variations of currency exchange rate. In cross-continent companies, risks of transaction, accounting translating and economics stand for three major types of risks. Due to the continuous and significant rise of interest rate by US Federal Reserve, the exchange rates of US dollar for major national currencies are soaring. For individuals, what are the relatively smart strategies to face up with the reality on depreciation of domestic currency and appreciation of US dollar?
Think about the story of “freely travel to spend summary vocation” via exploiting the variation of Sino-US currency exchange rate. Suppose in a certain period when RMB appreciates in accordance with the depreciation of US dollar, i.e., currency exchange rate changed from 6.80 to 6.00 from May to August of the same year. There is an assumption that a US tourist may convert $100,000 to¥680,000, after spending¥80,000 touring in China during the summer, the remaining¥600,000 was converted to $100,000 just before coming back to US. By similar assumption, while US dollar appreciates along with the imposition of depreciating RMB, it was observed that the currency exchange rate sharply increased from about 6.30 to 7.30 over 8 months in the last year, and hence, it is assumed that a domestic investor was capable of converting¥6.30 million to $1 million in March 2022, then spending $137,000 to buy a condominium of 1,000 square feet in metropolitan area of Tucson, Arizona, or paying the down payment of starter home as evaluated by real estate ranging from Detroit, Michigan to St. Louis, Missouri (lower than $150,000, as reported in 2022), and changing back the rest US dollars to the original amount of RMB in November 2022. Proper orders and numerical values are determined when exploiting ARIMA model for risk prediction on currency exchange related investments in Section 3.
iii) Apply the theory of broad money (Sharma and Dahiya 2023). In contrast to the concept of narrow money, broad money refers to inclusions of liquid cash funds, current deposits as well as deposit currency with slightly less liquidity but regular interests. The difference of broad money (M2) from narrow money (M1) is just specified as the funds in the banks, comprising current deposits and term deposits. Meanwhile, several other types of short-term current assets, i.e., treasury bonds, bills of bank acceptance, and cash back in credit cards, are also included in the aggregation of broad money (M3) (Zhang 2021). In addition to enhancing purchase power of consumers and improving economic growth and quality of life, the main advantages of broad money are also recognized as promotion of currency circulation, better control of inflation to support governmental fiscal policies and financial stability. However, the side effects of broad money (M3) may include potential output of rapid currency flow and financial instability resulted from excessive production of broad currency (Pei et al 2021). These asset values predicted with our proposed dynamic strategies refer to the second type of broad money (M3).
iv) Present the evaluation indices of financial econometrics. In arbitrage pricing theory (APT), excessive profit and muti-factor model are presented when estimating the combined interest rates per unit asset values. With respect to time series analysis, goodness of fit, seasonal index and predicted outcome from the ARIMA models are tabulated for compares and contrasts. Meanwhile, the difference of broad money (M3) before and after adopting the combinations of dynamic fiscal strategies (i.e., APT and time series analysis), is formulated when leveraging an international equation for computation. If the annual growth rate of asset values may closely approach or even go beyond the highest annual inflation rate, and the risk evaluation suggest the safety of combining such kind of investment, it is asserted that the dynamic fiscal strategies are both robust and feasible when allocating and managing most cases of fixed assets.
3. Case Study and Quantitative Analysis
With respect to the static and dynamic strategies discussed in Section 2 for fiscal modeling, this section presents quantitative evaluations before and after applying these schemes on typical examples of asset values. Our work is established in three manifolds: i) present case studies when a former US graduate student applied the static model in Tucson, AZ to experience three different financial situations; ii) discuss the potential weakness of this static model and the necessity of using dynamic strategic approaches in contrast to the statistics of annual and monthly-based US inflation rate in Years 2012- 2023; iii) Establish an optimized joint combination on both of these strategic methods, and then calculate the enhanced difference on growth rate of asset values to convince people in presence of higher-level inflation, i.e., about 15% depreciation of RMB over the last year 2022. Interpretation on how to allocate and manage the combined fiscal models, as well as the experimental conclusions can be drawn from the subsequent quantitative results.
3.1. Assumption
Our assumptions are presented as follows. let the monthly living expense in Tucson be $1,000 on average for graduate students of Case i), and $800 for ones of Cases ii) and iii). One third of the living expenses (conservative estimation) can be spent via credit card, The online expenditures that have at least 1% cash back rewards take up 5~10% of the living expenses (simulation takes 8% as median value, which is a common example).
Most notably, sharing an international graduate student’s prospective, the annual $200 bonus, may come from opening account rewards and friend referral (by practical estimation on average), while the 5% annual investment and 3% mortgage rate are sketched as future prospects for capable group investors (as advertised by large online banks) that of interests to the proposed static fiscal model. Note that you can adjusting the numerical values with respect to multiple districts of consumption standards all over the world. The real rate of economic growth has been updated in consideration of annual inflation rate of 2.5% on average.
3.2. Case study and Quantitative Results of the Proposed Static Fiscal Model
Table 1 illuminates the comparison of annual fiscal income and total expenditures with/without the upgrading of the proposed multi-level fiscal model above in condition of three typical financial situations for Ph.D. students.
As is illustrated from Table 1, in condition of the parameter assumption for half- time (20 hours per week) graduate assistant (GA), quarter-time (10 hours per week) GA and self-supported student, the percentage differences of asset values with or without the strategy of multi-level static management were estimated as 3.27%, 4.48% and 3.55%, respectively. When processed with the proposed static fiscal model for evaluating initial rate of difference, the percentage is higher than the annual inflation rate in condition of regular financial growth (Note: In contrast to US annual inflation calculator: http://www. usinflationcalculator.com/, annual inflation growth of 2011 to 2012, 2012 to 2013, 2013 to 2014 are found as 2.07%, 1.46% and 2.10% respectively; however, due to the hysteresis effects of COVID-19 on propagation, the average inflation growth rate over the past 30 months, i.e., from May 2021 to Oct. 2023, has been calculated as 6.21%). In contrast with the proposed multi-level static fiscal model, it is clearly indicated that an annual growth rate of 3~5% can be achieved for the tested financial unit without much difficulties, which is significantly higher than the mild annual inflation rate, but slightly less than the 30-month inflation growth on average when the inflation level is much higher. Compact structure with close relation among the same level helps to ensure fiscal safety. The weakness of this static fiscal model still lies on the difference of balance in the banking statement. Given the statistics that Citi bank currently shows a 4.35% of annual percentage yield (APY), the 7-month fixed rate Certificate of Deposit (CD) for US dollars is 4.75% APY at present (https://www.citi.com/banking/cd-account), while the Federal Reserve may continue to retain a targeted range of the federal funds rate between 5.25% and 5.50%, hence, achieving a better percentage of difference, i.e., close to 10% is more convincing than simple savings when the inflation rate was as high as 8.0% in the year 2022.
This three-case static fiscal modeling with respect to financial motions and inflation, just illustrates a typical example for improving financial status for US graduate students and research faculties. Similar static strategy indicates broader applications, for instance, budgeting annual research funds, investing financial products, estimating costs for a multi-destination touring trip, and even managing intellectual property values, etc. The presence of moderate 2.5% annual inflation rate displays mild fiscal environment, which has become a metric to eliminate financial bubbles. Meanwhile, enhancing the values of some crucial parameters in each kernel part (level) of income, also plays an important role that positively affects the annual financial settlements.
An annual US inflation rate in the past twelve years (2012-2023, 12-month based on average for each year) was charted in Figure 2, which reflects the average inflation rate every calendar year when using consumer price index (CPI) data, where the statistical data is validated by the confidence intervals (CI) for the same metric. From Figure 2, it is implied that the shortest CI was found at 2019, reflecting slow downed global financial growth and the termination of super-cycle on US dollars; the longest CI was displayed at 2021, which not only exhibiting a peak value of inflation over the past 39 years, but also resulting from a negative impact of rising living cost due to the spreading of COVID-19.
Table 2 presents a more accurate report on the monthly based US annual inflation rates, where data source is originated from US Bureau of Labor Statistics (BLS). For example, the inflation rate in Aug. 2016 was 1.06%. In the last column, inflation rates on average of this year are tabulated using CPI data. For instance, due to COVID-19, the average inflation rate in 2020 and 2021 were 1.23% and 4.70%, respectively, displaying a sharp contrast. The average inflation rate in 2022 was even increased to 8.01%, while those numbers in the past 12 months of 2023 gradually dropped back to below 4.0%. Instead of seasonally adjustment or discussed in the worldwide news media, these BLS published numbers are averaged by all items in US cities covering all urban consumers, taking retrospect to the nearly accurate inflation rate for one specific calendar year.
Recall that when simulating the percentage of difference using our static model, broad money (M3) such as cash back earnings from credit cards were included, but the highest digit was below 4.50% in one city while living expenses varies among cities and states in US. Besides, another prerequisite of this approach depends on the base digits of income level from US graduate assistants which are part-time based and much lower than the median of household income. In the next subsection, we apply these dynamic strategic approaches followed by APT theory, ARIMA model for fitting and prediction, as well as the asset appreciation rate in presence of necessary components in broad money (M3).
3.3. Dynamic Strategic Approaches for Asset Appreciation under Higher-Level Inflation
We start to present our first dynamic strategy according to APT theory (Ross 1976). Instead of building up effective asset portfolios, the relations between zero-risk profits and expected reward rates obtained by any investors are estimated in a well-run capital market (Zhang and Zhou, 2021): due to incorrect capital pricing, irregular links of price and efficiency shortage of other chances when trading, zero-risk profits may be gained through buying underpriced assets followed by selling them when assessed with higher price in marketing. The fundamental styles of arbitrage pricing include those with space, time, instrument, risk and tax arbitrage, while those forms in stock or futures are mainly classified as cross-period, cross-market a cross-commodity arbitrage (Zhu et al. 2022).
The standard APT model and brief derivations are presented as follows (Zhang and Zhou, 2021): Let the morgan silver dollars and peace silver dollars represent two types of assets i and j for APT. Assume that the reward rate of i and j were both affected by risk factor F1, where the factor loading is denoted as bi1 and bj1, and hence, the portfolio investment return under a single factor model can be expressed as
where ωiand ωj stand for the ratio of investment in these silver coins, bi1 and bj1 reflect the dependency of i and j towards the factor F1. Note that risk-free investment comes into existence when (ωibi1+ ωjbj1) F1 = 0, where its return rate equals that of risk-free cases, otherwise, arbitrage chances co-exist in marketing. As a result, in presence of risk factor F1 which may affect potential profit, constructing risk-free portfolios by investors yields
where the solution becomes
ωi ri + ωj rj = ωi[E(ri) + bi1F1] + ωj[E(rj) + bj1F1] = [ωiE(ri) + ωjE(rj)] + (ωi bi1 + ωj bj1) F1
ωi bi1 + ωj bj1 = (1-ωj) bi1 + ωj bj1 = 0
ωj= bi1 / (bi1-bj1)
Given the equation (ωi bi1 + ωj bj1) F1 = 0 implies risk-free and its return is ωiE(ri) + ωjE(rj). Let the risk-free return rate marked as r0, it follows that
ωiE(ri) + ωjE(rj) = (1-ωj) E(ri) + ωj E(rj) = r0
Hence,
ωj= [E(ri)-r0] / [E(ri)-E(rj)]
Combining (3) and (5) yields the following equation such that
(bi1-bj1) [E(ri)-r0] = bi1 [E(ri)-E(rj)]
Substituting ωj= 1-ωi into the computational process of (6) yields
(bi1-bj1) [E(rj)-r0] = bj1 [E(ri)-E(rj)]
Let λ1 equals the ratio of [E(ri)-E(rj)] to (bi1-bj1), with respect to (6) and (7), the average return rate of assets in marketing can be written as
λ1bi1 = E(ri)-r0 , λ1bj1 = E(rj)-r0
The outcome of (8) implies that for any i and j, it satisfies that
where the outcome of single factor-based APT suggests the principle of linear pricing, which claims that an expected return rate of any asset results from a linear combination of risk-free return rate and risky reward, in which risky reward is jointly determined by sensitivity of risk factors and average market returns. Most notable, the extended form of (9) appears as the multi-factor APT model, which is expressed as
E(rk) = r0 + λ1bk1, k = i, j
E(r) = r0 + λ1b1 + λ2b2 + ... + λkbk, k = the number of factors
We applied the APT model to flipping these antique silver dollars between Catalina coin store and Old Pueblo coin shop over a few periods of time in Tucson, AZ, USA. The input money for portable investment takes a small portion of annual income, i.e., a few hundred US dollars per week, where the operations of instant buying and selling are weekend activities. Recall that our combinations of arbitrage meet all three conditions: no necessity of extra spending, zero sensitivity towards any factors, and always positive for expected return (Zhang and Zhou, 2021). Assume that cash back gained from credit transactions and cost for travel were excluded from those trades. The sum of asset values of buying, selling and return rate corresponding to one period (month-year) for arbitrage silver dollars are tabulated in Table 3, where the average return rate of all these antique silver dollars participated in APT is computed as 20.26%. The lowest return rate (9.54%) was found in Mar-17, and the highest (34.96%) was displayed in Dec-20. It is observed that the return rates during COVID-19 are higher than those at the first few periods.
As is illustrated in Table 3, while APT has no direct assumptions on individual return, it is not only adaptable for some negotiable securities in stock market, but also fits these appreciating assets such as antique silver coins. Besides, multi-stage combination of APT may also increase the return rate. Because the actual ratio on investing morgan dollars to other silver coins are 3:1, it is likely that the original expect return rate is 25% × 3/4 + 6% × 1/4 = 20.25% (Note: as estimated by a common example, buying a morgan dollar for $24 and selling for $30, buying a peace dollar for $18 while selling for $19). If only investing morgan dollars, the updated combination can achieve an expected return rate of 25% × 1 + 6% × 0 = 25.00%, which coincides the claims that with neither newly added investments nor alternations on systematic risks, an increase of 4.75% may appear in the updated return rate after the optimization of investment portfolios.
To sum up with the APT-model based dynamic strategy for investment, suppose that the net asset of annual income is $60,000 after deducting any living expenses. Each month, a budget of $500 is put forward to flipping morgan dollars based on APT, the cumulated earning of 12 month can be estimated as $500 × 25% × 12 = $1,500, which implies a return rate of 1,250 / 60,000 = 2.5%, exactly offsetting the impact of depreciation caused by mild financial inflation as stated in the opening paragraph of Introduction session.
Our second approach of dynamic fiscal strategy intends to analyze and predict the variations of currency exchange rate, then determine appropriate investment models for increasing income to compensate the negative impact from financial inflation. In the past two decades, the RMB to US dollar (USD) exchange rate system went through significant adjustments, which include “July 21 exchange rate reform” in 2005, “Aug. 11 exchange rate reform” in 2015, “self-disciplined mechanism” in 2016 and the involvement of antiperiodic factor in May 2017, 2018 and March 2022 (Liu 2023). Facing up with the risks of substantial depreciation of a currency exchange rate such as RMB to USD, distributed investors have the following options to protect their net asset values: for one thing, with the goal of increasing savings and accumulating funds, expenses of daily consumption are controlled to avoid waste or excessive consumption. For another, with respect to individual risk preference and return goals, financial risks and high-rate returns must be diversified by reasonable asset allocation and investment portfolios. Besides, growing commodities, stocks or properties can be chosen for investing to obtain reliable returns, where the dynamics of market and changes of policy require attention.
We take the data samples of monthly average exchange rate of RMB-USD from Jan. 2005 to Oct. 2023 for testing, where the original data came from website of China foreign exchange trade system (https://www.chinamoney.com.cn/chinese/index.html). Since the benchmark and degree of marketization of the central parity rate between RMB and USD had been enhanced by “811 Exchange Rate Reform”, the predictability of exchange rate has been validated via tests based on run-length, variance ratio and rescale extreme value from Sep. 2015 to Dec. 2022 (Liu 2023). Parallel to some contemporary work for predicting the regulations and trends on variations of exchange rate under the Sino-US trade war (Xiao 2020), ARIMA-GARCH model related combined forecasting for the exchange rates of RMB-USD (Xu et al. 2021), and ARIMA model based exchange rate prediction of RMB on fluctuation trend under COVID-19 epidemic (Shi 2022), we adopt ARIMA model for predicting using 8-year data from Sep. 2015 to Jan. 2023, where the trend on monthly average middle price of RMB-USD exchange rate in sample interval is depicted in Figure 3 (Liu 2023).
As depicted in Figure 3, there have been a sharp increase of exchange rate from Mar. 2022 to Nov. 2022, while the involvement of antiperiodic factors directly impacted the relatively sharp vibration of currency exchange rates: monthly average middle price of RMB-USD fluctuated within the range of 6.30 to 7.30 (lowest at 6.2764 on Apr. 02, 2028, highest at 7.2555 on Nov. 04, 2012, daily statistics available at: https://www.chinamoney. com.cn/chinese/bkccpr/?tab=2). ARIMA (p, d, q) model was implemented for predicting the trend of exchange rate in the following steps (Yi and Wang, 2021):
(1) Import sample data for initial testing;
(2) Perform follow-up experiments for stationarity test (applying differential methods to generate operations of stationarization on non-stationary data sequences);
(3) Determine the order of the ARIMA model (p, d, q) (i.e., selecting appropriate paired (p,q) values) first, then decide d, d = 0 for low-order and d = 1 for high-order);
(4) Perform residual test to check if the residual is a white noise process;
(5) Read the predicted values output by the program. Autocorrelation function (ACF) and partial autocorrelation function (PACF) are exploited to determine the order of the time series model.
We examined the simulated ARIMA model with different combinations of (p, d, q) from (1, 0, 1) to (4, 1, 7), where the predicted trend of remaining months of 2023 and later years jumped beyond the interval of [6.30, 7.30], due to the fact that it is normal for 15% fluctuation of national currency within one year, and hence, ARIMA model fails to meet the demands on accurate long-term prediction of future exchange rate for RMB-USD.
Meanwhile, attempting other combinations of ARIMA-GARCH models for currency rate prediction, as implied from the outcome that MA (1) - GARCH (1,1) model showed better accuracy on short-term and medium-term prediction accuracy, while the MA (1) model displayed slight superior performance on long-term prediction (Xu et al. 2021). We studied cases of fitting GARCH(1,1) model and its derivatives, while discovered that the positive and negative disturbance terms are not balanced, and hence, it is tentatively asserted that ARIMA-GARCH models may not match the standards of second term on our expected dynamic strategic approach.
One simple alternative plan to make up this failure is as follows: in majors bank in China, the spot exchange price of buying and selling US dollars has a short gap on price, where the service charges stand for the corresponding difference on price. For instance, on Nov. 16, 2023, the USD-RMB spot exchange for selling, buying and cash buying for China Bank is 7.2612, 7.2324 and 7.2308, respectively, displaying variation on exchange rate of about 0.42%. The exchange limit of individual exchange is $50,000 per year since 2019. In accordance with much stricter foreign currency regulations that we carefully follow, this amount is divide into 100 units in which $500 stands for a unit. With respect to demands from reliable friends, oversea scholars and students for currency exchange, a reference exchange rate with private party (i.e., buying for 7.240 and selling for 7.255) is set up for trading small amount of currency using multiple banking accounts. Due to the 1.5 percent difference for cumulative earnings, the annual profit from difference of USD- RMB is calculated as $500*1.5%*100 = $750. All transactions must be legal and zero-risk.
Our third approach is to combine static fiscal modeling and two dynamic strategic schemes as prior discussed, which not only progressively performs optimization on the multi-level static model on allocating and managing individual income, but also devote to enhancing annual rate of growth on net assets in presence of higher-level inflation when applying the paradigm of broad money (M3). The updated budgeting for net asset appreciation can be established as follows:
In the United States, one single person has annual pre-tax income of $150,000 after completing an engineering Ph.D. degree (or the equal amount of an average couple’s joint pre-tax income). The deduction rate of highest tax level plus various insurance are estimated as 40%, followed by the deduction of highest monthly living expenses on average, i.e., Top 2 are $3,070 per month in Hawaii and $2,838 per month in California (https://baijiahao.baidu.com/s?id=1773577590714820367&wfr=spider&for=pc, $3,075 may be applied as the amount of deduction). Considering the remaining balance per month plus tax refunds from the year 2023, the net assets should be between $50,000 to $60,000 for 12 months, which stands for our base digits for investing.
We have implemented this joint strategic approach as an integrated algorithm on evaluating the annual growth rate under the scenario of broad money (M3), as attached in the third program in MATLAB R2022a, the major steps are summarized as follows:
Step 1. Compute the annual net assets after each deduction as discussed above, then initial this amount as M0.
Step 2. Estimate the net appreciation from two dynamic static schemes using APT- based silver dollar investment and difference of currency exchange rates, mark this sum as Delta_M0, representing first type of appreciation.
Step 3. Computing the earnings from cash back and gift credits when using credit cards for consumption (i.e., Citi double cash reward card may always have 2% cashback, others are ranging from 1~5% in different period of months), mark this sum as Delta_M1, representing second type of appreciation.
Step 4. Reapply our static fiscal modeling, counting interests from online accelerate saving accounts or 1-year Certificate of Deposits (CD). Note that current API, current rate for CD, and reduced interest rate (assume that US Federal Bureau may reduce API by 25 percentage points three times of each per year) represent three cases when estimating. Mark this sum as Delta_M1, representing third type of appreciation.
Step 5. Make the sum of three types of appreciation, then mark it as the difference of broad money (M3), find three percentages of net asset appreciation in proportion to M0.
Note that the ratio of net assets is tentatively set up as 10% of each for recursive investment on the first and second type of appreciation, while the rest 80% may be used for saving interests on the third type of appreciation. Current APY of 4.35% in accelerate online saving in Citi bank and 5.25% for federal funds rate are tested for reference. The percentage of net asset values with or without our joint approach combining the proposed dynamic and static strategies are displayed in Table 4, where the highest appreciation is estimated as 9.62% given the rate of CD is highest for term deposit, the lowest is estimated as 8.30% upon prediction of reducing banking interests.
Seen from Table 4, while the first three rows display the same digits, the difference is originated from interests of online saving accounts due to the characteristics of investment are zero-risk and thereby conservative. The lower bound and upper bound of estimated percentage are generated from varying tax deductible rates (25%:5%:50%) and investment ratio (10%:2%:20%) for first-type appreciation, while the tabulated results in last row provide a referenced range on the appreciation rate, which basically coincides with our prediction such that achieving an appreciation rate of net assets ranging between 8 ~ 10% in presence of higher-level financial inflation.
4. Discussions
4.1. Limitations of Our Study
The limitations of our study can be summarized in several manifolds. Firstly, due to limits of time, space and labor, the simplified format of proposed mathematical models are mostly primary models. Secondly, while the simulated numerical results match our prediction, the sensitivity analysis on percentage of net asset appreciation for static fiscal modeling and joint approach, needs further supplementation. Our current purposes of study are primarily oriented on zero-risk investing and management, while other type of the precious metals such as gold or platinum might bring about higher rate of earnings than those of silver dollars, their potential risks for investment are also increasing. Besides, machine learning and deep learning-based schemes on financial forecasting (Chen et al. 2022; Ali et al. 2023), as well as some artificial intelligence (AI) related topics on financial performance (Shiyyab et al. 2023) are with the scope of our subsequent investigation.
Most notably, similar examples are carried out using online banking or financial products from highly reliable banks instead of those from marketing of stocks or futures. In addition, predicting the trends on variations of currency exchange rate should require successful implementation of time series analysis models, or hybrid schemes such as long short-term memory (LSTM) and genetic algorithm (GA) for sequential prediction (Ali et al. 2023), whose success may prospect higher volume of profits along with safe and legal investment on foreign currencies other than exchanging RMB-USD.
4.2. Summary of Research Challenges
With respect to the status of our current study, several opening questions have been conceived as follows: what is the optimal “golden ratio” on allocating the net assets? If applying the topics on completely static game theory, what degree of financial risks can be decided for financial management with respect to a quantitative metric on machine learning, i.e., loss function or cost function? Upon meeting the balance of potential risks and monetary rewards from investing, how can we update the comprehensive strategies of joint approach on enhancing the appreciation rate of net assets from 10% to 15%?
Subsequent research challenging issues are specifically oriented in a few aspects: we may require a professional software such as Eviews 9.0 to systematically perform time series analysis models and progressive achieve better simulation results upon dynamic modeling of currency exchange data, as well as Pytorch platform for implementing deep learning-based algorithms on financial analysis and accurate forecasting. Ablation tests and sensitivity analysis on those advanced modeling also call for further attention.
5. Conclusions and Future Work
In sum, we have presented a static fiscal management framework, which devotes to achieving better growth rate of individual asset values in presence of regular inflation. Experimental results indicate that the fiscal-managing strategy and “multi-level” fiscal plan not only helps US graduate student in better budgeting daily life and annual fiscal digits, but also suggests wider implementations in the source and style of funds for both individuals and cooperative investors. In presence of higher-level inflation, we have discussed three approaches on dynamic fiscal management, which followed by arbitrage pricing theory (APT) based silver dollar investment, exploitation of difference on foreign currency exchange rate and application on theory of broad money (M3). Combining three dynamic strategies and the prior static fiscal model yields to an algorithm on jointly enhancing the annual appreciation rate on net assets, which was computed as 9.62% in median, given major funds applied for one-year term deposit, and no lower than 7.43% upon prediction of worst-case scenarios when banking interests are constantly decreasing. Experimental results suggest that our joint approach is able to compensate the negative influence of net asset depreciation in condition of higher-level inflation.
In our future work, we aim to investigate whether the robustness of fiscal modeling strategies in condition of practical financial motions, the related potential collaboration of a dynamic fiscal model, and the adaptivity in managing the budgets of a research grants over a funding cycle. With respect to the aforementioned opening questions and summary of research challenges, we plan to evaluate a few hybrid schemes on financial forecasting, derivative tools in contrast to time series analysis, dynamic stochastic general equilibrium (DSGE) models with financial frictions established by Ben Salem et al. (2024), as well as some advanced techniques on mathematical finance applied to the low-risk management of economic modeling.
Author Contributions
Conceptualization, X. G.; methodology, X. G.; software, X. G. and F.-F. N.; validation, X. G., F.-F. N. and Y.-M. W.; formal analysis, X. G.; investigation, X. G.; resources, X. G., Y.-M. W., B.-W. J. and L.-Y. Z.; data curation, X. G. and Y.-M. W.; writing—original draft preparation, X. G.; writing—review and editing, X. G., F.-F. N., Y.-M. W., B.-W. J. and Y.-D. Z.; visualization, X. G., F.-F. N. and B.-W. J.; supervision, X. G. and Y.-D. Z.; project administration, X. G. and Y.-M. W.. All authors have read and agreed to the published version of the manuscript.
Funding
This research received no external funding.
Informed Consent Statement
Not applicable.
Data Availability Statement
US annual inflation data is derived from official institutional sources or web pages of research scholars. For instance, current US inflation rates (2000-2023): https:// www.usinflationcalculator.com/inflation/current-inflation-rates/ (up to date).
Conflicts of Interest
The authors declare no conflict of interest.
Appendix A. MATLAB Simulation Example: Three Cases of a Ph.D. Student’s Financial Status with the Proposed Static and Dynamic Strategic Approaches
%% StaticFiscalModel_case1to3.m
%% Evaluation of Annual Fiscal Increasing Rate
clear all; close all; clc;
format compact; warning off; fontsize = 10;
tic;
%% Case I: Budget of 0.5FTE Graduate Assistant (GA, either TA or RA) annual salary
A0 = 18000;
ax0 = A0/26; % Payroll Period for one calendar year (365/14 = 26)
wt1 = 0.60; wt2 = 0.25; wt3 = 0.10; % Weights of depositing saving accounts
n1 = 1.00/100; % Saving Account I (CIT/Barclay) annual percentage interest (current API)
n2 = 0.90/100; % Saving Account II (Ally Bank/Discover) API (on average of the past 2 years)
n3 = 0.75/100; % Saving Account III (Capital One 360/Bank of Interest) (current API)
ax1 = zeros(1,12); ax2 = zeros(1,12); ax3 = zeros(1,12); % Initialization (a indicates case I)
for i = 1:12 % Online-saving automatically deposits monthly interests, calculating interests if fully deposits into one single saving account
ax1(i) = ax0*(2*i)*(n1/12); % Assume monthly interest deposited at the end of each month
ax2(i) = ax0*(2*i)*(n2/12);
ax3(i) = ax0*(2*i)*(n3/12);
end
y1 = (A0+sum(ax1))*wt1 + (A0+sum(ax2))*wt2 + (A0+sum(ax3))*wt3 + A0*(1-wt1-wt2-wt3);
% Account credit after annual (12-month) saving;
rate1 = 0.05; % Annual average yield rate from investment in Saving I, considered as 5%
rate2 = 0.03; % Annual mortgage rate in Saving II, considered as 3%
bonus = 200; % Bonus credit from opening all new accounts (annual, on average)
exped_a = 1000;
cred_score1 = (exped_a/3)*2.0*12; % Conservative estimation for all accumulated credit scores
% (Assume 1/3 expenditures spent towards credit score, count 2.0% on average)
% In fact, quite many credit cards offer 5.0% cash back calender rewards)
% Practically annual accumulated credit score has been estimated as 8000.
gift1 = (cred_score1*0.5/0.9)/100;
% Gift card credit, half of the credit score has been traded into gift_card on sale (10% discount)
online_consumption1 = exped_a*12*0.08; % 5-10% online consumption, counting 8% on average
cashback1 = cred_score1*0.5/100 + 0.01*online_consumption1; % Annual cashback from major credit cards
Y_case1 = y1 + (A0+sum(ax1))*wt1*rate1 + (A0+sum(ax1))*wt2*rate2 + bonus + gift1 + cashback1;
% Estimated end-of-the-year balance
inflation = 0.025;
living_cost = zeros(1,12);
for j = 1:12
living_cost(j) = exped_a*(1 + inflation*(j-1)/12);
% Buying power of the spent cost in presence of 2.5% annual inflation rate
end
Accumulated_living_cost = sum(living_cost);
% $1000 is the remainder GA should grossly pay (deducting GA refund) for two semesters per calender year
Tuition_payments = 500*2;
% $1000 is the remainder GA should grossly pay (deducting GA refund) for two semesters per calender year
Total_expense1 = Accumulated_living_cost + Tuition_payments;
delta1 = Y_case1 - Total_expense1; % Living expenses in presence of annual inflation (2.5% on average)
A0 = A0*(1 + inflation);
AP1 = (A0 - Total_expense1)/A0 * 100;
% The remaining balance without multi-level fiscal modeling in proportion to single direct deposits
AP2 = (delta1 / A0) * 100; % The remaining balance after multi-level fiscal modeling for comparison
AP3 = (Y_case1 - A0)/A0 * 100; % Annual financial increasing rate in presence of modeling
Y_case1
Total_expense1
delta1
AP1
AP2
AP3
%% Case II: Budget of 12-month Quarter TA/RA Annual Gross Salary
unit1 = 450; unit2 = 400;
B0 = unit1*11 + unit2*15; % first $5,000 / $5,800 is tax free due to US-China, US-India treaty
bx0 = B0/26; % Average deposit per payroll period for one calendar year (365/14 = 26)
wt1 = 0.60; wt2 = 0.25; wt3 = 0.10; % Weights of depositing saving accounts
n1 = 1.00/100; % Saving Account I (CIT/Barclay) annual percentage interest (API)
n2 = 0.90/100; % Saving Account II (Ally Bank) API
n3 = 0.75/100; % Saving Account III (ING Direct) API
bx1 = zeros(1,12); bx2 = zeros(1,12); bx3 = zeros(1,12); % Initialization
for i = 1:12 % Online-saving automatically deposits monthly interests, calculating interests if fully deposits into one single saving account
if i <= 5
bx1(i) = unit1*(2*i)*(n1/12); % Assume monthly interest deposited at the end of each month
bx2(i) = unit1*(2*i)*(n2/12);
bx3(i) = unit1*(2*i)*(n3/12);
else
bx1(i) = unit2*(2*i)*(n1/12); % Assume monthly interest deposited at the end of each month
bx2(i) = unit2*(2*i)*(n2/12);
bx3(i) = unit2*(2*i)*(n3/12);
end
end
y2 = (B0+sum(bx1))*wt1 + (B0+sum(bx2))*wt2 + (B0+sum(bx3))*wt3 + B0*(1-wt1-wt2-wt3);
% Account credit after annual (12-month) saving;
rate1 = 0.05; % Annual average yield rate from investment in Saving I, considered as 5%
rate2 = 0.03; % Annual mortgage rate in Saving II, considered as 3%
bonus = 200; % Bonus credit from opening all new accounts (annual, on average)
exped_bc = 800;
cred_score2 = (exped_bc*0.5)*2.0*12;
% Conservative estimation for all accumulated credit scores (Assume 1.5% cash back on average)
gift2 = (cred_score2*0.5/0.8)/100; % Gift card credit
online_consumption2 = exped_bc*12*0.08; % 5-10% online consumption, counting 8% on average
% Annual cashback from major credit cards
cashback2 = cred_score2*0.5/100 + 0.01*online_consumption2;
Y_case2 = y2 + (B0+sum(bx1))*wt1*rate1 + (B0+sum(bx1))*wt2*rate2 + bonus + gift2 + cashback2;
% Estimated end-year balance
inflation = 0.025;
thrift_living_cost_bc = zeros(1,12);
for j = 1:12
thrift_living_cost_bc(j) = exped_bc*(1 + inflation*(j-1)/12);
% Buying power of the spent cost in presence of 2.5% annual inflation rate
end
Accumulated_thrift_living_cost = sum(thrift_living_cost_bc);
Tuition_payments = 500*2;
% $1000 is the remainder GA should grossly pay (deducting GA refund) for two semesters per calender year
Total_expense2 = Accumulated_thrift_living_cost + Tuition_payments;
delta2 = Y_case2 - Total_expense2; % Living expenses in presence of annual inflation (2.5% on average)
B0 = B0*(1 + inflation); % Estimating the dynamic buying power (in presence of 2.5% annual inflation;
% e.g., the buying power of $10,000 at the end of last year, is equal to $10,250 at the end of current year)
BP1 = (B0 - Total_expense2)/B0 * 100;
% The remaining balance without multi-level fiscal modeling in proportion to single direct deposits
BP2 = (delta2 / B0) * 100; % The remaining balance after multi-level fiscal modeling for comparison
BP3 = (Y_case2 - B0)/B0 * 100; % Annual financial increasing rate in presence of modeling
toc;
Y_case2
Total_expense2
delta2
BP1
BP2
BP3
%% Case III: Self-support (coming from parental support)
L0 = 2*10^6 * 0.05;
C0 = L0/6.25;
% Relying on a financial product (5% annual interest) of main investment, divided by the currency rate
% Half of the interest benefits pay the tuition and medical insurance, the other half pays the living expenses
cx0 = C0*0.6/12; % Unit of monthly expenditures (60% on living expenses)
wt1 = 0.60;
wt2 = 0.25; wt3 = 0.10; % Weights of depositing saving accounts
n1 = 1.00/100; % Saving Account I (CIT/Barclay) annual percentage interest (API)
n2 = 0.90/100; % Saving Account II (Ally Bank) API
n3 = 0.75/100; % Saving Account III (ING Direct) API
cx1 = zeros(1,12); cx2 = zeros(1,12); cx3 = zeros(1,12); % Initialization
for i = 1:12 % Estimating how much remaining funds participating in the calculation of interests
cx1(i) = (C0 - cx0*i) * (n1/12); % Compound Interest added, if fully depositing into Saving Account I
cx2(i) = (C0 - cx0*i) * (n2/12); % Similarly for Saving Account II
cx3(i) = (C0 - cx0*i) * (n3/12); % Similarly for Saving Account III
end
y3 = (C0+sum(cx1))*wt1 + (C0+sum(cx2))*wt2 + (C0+sum(cx3))*wt3 + C0*(1-wt1-wt2-wt3);
% Account credit after annual (12-month) saving;
rate1 = 0.05; % Annual average yield rate from investment in Saving I, considered as 5%
rate2 = 0.03; % Annual mortgage rate in Saving II, considered as 3%
bonus = 200; % Bonus credit from opening all new accounts (annual, on average)
tutorial_unit = 16*2;
tutorial_allowance = tutorial_unit * 15 * 2; % Two semesters of allowance in Sunday Chinese school
exped_bc = 800;
cred_score3 = (exped_bc*0.5)*2.0*12;
% Conservative estimation for all accumulated credit scores (Assume 1.5% cash back on average)
gift3 = (cred_score3*0.5/0.8)/100; % Gift card credit
online_consumption3 = exped_bc*12*0.08; % 5-10% online consumption, counting 8% on average
cashback = cred_score3*0.5/100 + 0.01*online_consumption3; % Annual cashback from major credit cards
Y_case3 = y3 + (C0+sum(cx1))*wt1*rate1 + (C0+sum(cx2))*wt2*rate2...
+ bonus + gift3 + cashback + tutorial_allowance; % Estimated end-year balance
thrift_living_cost_bc = zeros(1,12);
inflation = 0.025;
for j = 1:12
thrift_living_cost_bc(j) = exped_bc*(1 + inflation*(j-1)/12);
% Buying power of the spent cost in presence of 2.5% annual inflation rate
end
Accumulated_thrift_living_cost = sum(thrift_living_cost_bc);
Tuition_payments = 1787 + 2333 + 100 * 2;
% Tuition and medical payments of Fall’14 and Spring’15, plus international student fee $100*2
Total_expense3 = Accumulated_thrift_living_cost + Tuition_payments;
% Annually expenditure in 2014-2015
delta3 = Y_case3 - Total_expense3; % Living expenses in presence of annual inflation (2.5% on average)
C0 = C0*(1 + inflation)+ tutorial_allowance; % Estimate the dynamic buying power in presence of 2.5% annual inflation; note: allowance is considered of 0% interest, into checking
% e.g., the buying power of $10,000 at the end of last year, should be considered as $10,250 at the end of current year)
CP1 = (C0 - Total_expense3)/C0 * 100;
% The percentage of remaining balance to annual expenditures without multi-level fiscal modeling
% in proportion to original deposits coming from parental support
CP2 = (Y_case3 - Total_expense3)/C0 * 100; % The remaining balance after multi-level fiscal modeling for comparison % Note: CP2 = delta3 /A0 * 100; identical
CP3 = (Y_case3 - C0)/C0 * 100;
% Difference with / without multi-level fiscal modeling (also known as the percentage increment)
Y_case3
Total_expense3
delta3
CP1
CP2
CP3
toc;
% Y_case1 = 1.9053e+04
% Total_expense1 = 13138
% delta1 = 5.9159e+03
%
% AP1 = 28.7940
% AP2 = 32.0646
% AP3 = 3.2706
% Y_case2 = 1.1726e+04
% Total_expense2 = 10710
% delta2 = 1.0162e+03
%
% BP1 = 4.5773
% BP2 = 9.0543
% BP3 = 4.4769
% Y_case3 = 1.8195e+04
% Total_expense3 = 14030
% delta3 = 4.1655e+03
%
% CP1 = 19.1820
% CP2 = 22.7353
% CP3 = 3.5533
%% Calculation of Average US Annual Inflation based on monthly statistics (2012-Present)
%% Load the Inflation rates (2012-Present)
Y2012 = [2.93 2.87 2.65 2.30 1.70 1.66 1.41 1.69 1.99 2.16 1.76 1.74];
Y2013 = [1.59 1.98 1.47 1.06 1.36 1.75 1.96 1.52 1.18 0.96 1.24 1.50];
Y2014 = [1.58 1.13 1.51 1.95 2.13 2.07 1.99 1.70 1.66 1.66 1.32 0.76];
Y2015 = [-0.09 -0.03 -0.07 -0.20 -0.04 0.12 0.17 0.20 -0.04 0.17 0.50 0.73];
Y2016 = [1.37 1.02 0.85 1.13 1.02 1.00 0.83 1.06 1.46 1.64 1.69 2.07];
Y2017 = [2.50 2.74 2.38 2.20 1.87 1.63 1.73 1.94 2.23 2.04 2.20 2.11];
Y2018 = [2.07 2.21 2.36 2.46 2.80 2.87 2.95 2.70 2.28 2.52 2.18 1.91];
Y2019 = [1.55 1.52 1.86 2.00 1.79 1.65 1.81 1.75 1.71 1.76 2.05 2.29];
Y2020 = [2.49 2.33 1.54 0.33 0.12 0.65 0.99 1.31 1.37 1.18 1.17 1.36];
Y2021 = [1.40 1.68 2.62 4.16 4.99 5.39 5.37 5.25 5.39 6.22 6.81 7.04];
Y2022 = [7.48 7.87 8.54 8.56 8.28 9.06 8.52 8.26 8.20 7.75 7.11 6.45];
Y2023 = [6.41 6.04 4.98 4.93 4.05 2.97 3.18 3.67 3.70 3.24 3.14 3.35 ];
%% Firstly, compute the 12-month mean and std of US inflation rate in the past ten years
% Note: mean and std for Year 2023 are 10-month based statistics
data_mean = [mean(Y2012) mean(Y2013) mean(Y2014) mean(Y2015) mean(Y2016)...
mean(Y2017) mean(Y2018) mean(Y2019) mean(Y2020) mean(Y2021) mean(Y2022)]; % mean(Y2023)
data_std = [std(Y2012) std(Y2013) std(Y2014) std(Y2015) std(Y2016)...
std(Y2017) std(Y2018) std(Y2019) std(Y2020) std(Y2021) std(Y2022) ]; % std(Y2023)
%% Choose color with respect to individual demands
RGB2 = cbrewer2(‘seq’, ‘Blues’, 12, ‘linear’);
RGB = [RGB2(5,:)]; % Define the color of bars
%% Plot the curves
figure();
y = data_mean;
neg = data_std;
pos = data_std;
n = size(y,2);
n0 = 2012;
nk = 2012 + n - 1;
x = n0:1:nk;
h = bar(x,y);
hold on; grid on; grid on;
%% Set up the color of j-th bar separately
for j = 1:(n-1)
h.FaceColor = ‘flat’;
h.CData(j,:) = RGB(j,:);
h.EdgeColor = ‘flat’;
end
%% Acquire the x-value of error bars
xx = h.XEndPoints;
% Plot the error curves
hold on; grid on; grid on;
errorbar(xx, y, neg, pos, ‘LineStyle’, ‘none’, ‘Color’, ‘k’, ‘LineWidth’, 1);
hold off;
%% Set up the format of figure (default fontsize = 8, fontstyle = Arial)
set(gca, ‘FontSize’, 12);
set(gca,’FontName’,’Times New Roman’);
% Set up xticklabels at x-axis
set(gca, ‘XTickLabel’, {‘\fontname{Times New Roman}Con1’, ‘\fontname{Times New Roman}Con2’, ...
‘\fontname{Times New Roman}Con3’},’FontSize’,12);
% Set up the tags of y-axis
ylabel(‘\fontname{Times New Roman}y\fontname{Times New Roman}Average Inflation Rate’,’FontSize’,14);
% Set up the range of y-axis
ylim([0 10]);
% Remove upper boundary and right boundary
box off
% Set up the thickness of frames
set(gca,’XColor’,’k’,’YColor’,’k’,’linewidth’,1);
%% Predict the annual growth rate of appreciation on saving net assets
%% with respect to jointly combine static and dynamic strategic approaches
%% via Arbitrage silver dollars, Arbitrage 2-pt RMB-USD Exchange rate,
%% Zero-risk Online Savings or 1-year CD, Cash back and Gift Credits (M3)
%% By Xin Gao et al, Jiangsu Normal University, Xuzhou, Jiangsu, China, Nov. 2023
clear all; close all; format compact; fontsize = 10; warning off;
tic;
%% Step 1. Compute the annual net assets after each deduction as discussed above,
%% and initial this amount as M0.
Gross_Income = 150000; % Median of annual gross-income of middle-class family
Month_Income = Gross_Income/12;
Tax_Paying = Month_Income * 0.37; % Highest tax-rate is 37%
Avg_Month_Expense = 3075; % Estimated with State of highest cost, i.e.,Hawaii
Month_Net_Assets = (Month_Income - Tax_Paying - Avg_Month_Expense);
Annual_Net_Assets = Month_Net_Assets*12;
%% Step 2.Apply Dynamic Strategic Approaches: APT Silver Dollar and Currency Exchange Rates
APT_Silver_Dollar = Month_Net_Assets*0.10*0.25*12; % 10% of Net Assets
APT_Currency_Rate = 50000*2/100; % Upper limit of $50,000 per year in China
Current_Rate = 4.35/100; % Current API of Citi Online Banking
CD_Rate = 5.25/100; % Current CD_rate (highest 5.50% minus 25 percentage points)
Deducted_rate = 4.35 - 0.25*3; % Assume Federal Bureau reduce API 0.25% three times
%% Steps 3-4.Reapply Static Fiscal Modeling, calculating interests from online saving or 1-year CD
Saving_API = Annual_Net_Assets*0.80*Current_Rate;
Saving_CD = Annual_Net_Assets*0.80*CD_Rate; % Assume Conducting 1-year CD
Saving_API_deduction = Annual_Net_Assets*0.80*Deducted_rate/100; % Reduced Saving bonus
Avg_Cash_Rate = 0.02; % Most consumption with Citi double-cash reward card
% Others ranging from 1% to monthly 5% bonus cashback
Annual_Cash_Back = Avg_Month_Expense*12*Avg_Cash_Rate;
Delta_Gift_Reward = 5; % Average 5 bucks per month estimated for gift reward
Annual_Gift_Money = Delta_Gift_Reward*12;
M0 = Annual_Net_Assets;
Delta_M0 = APT_Silver_Dollar + APT_Currency_Rate;
Delta_M1 = Annual_Cash_Back + Annual_Gift_Money;
Delta_M2_A = Saving_API;
Delta_M2_B = Saving_CD;
Delta_M2_C = Saving_API_deduction;
%% Step 5. Calculate the appreciation of net assets in broad money (M3),
%% and compute the percentage of appreciation in three cases.
Delta_M3_A = Delta_M0 + Delta_M1 + Delta_M2_A;
Delta_M3_B = Delta_M0 + Delta_M1 + Delta_M2_B;
Delta_M3_C = Delta_M0 + Delta_M1 + Delta_M2_C;
Percent_Diff_A = 100*Delta_M3_A/M0;
Percent_Diff_B = 100*Delta_M3_B/M0;
Percent_Diff_C = 100*Delta_M3_C/M0;
Vector = [Percent_Diff_A Percent_Diff_B Percent_Diff_C]’;
Vector
toc;
>> Dynamic_Static_Asset_Pred
Elapsed time is 0.000470 seconds.
Vector =
8.8953
9.6153
8.2953
Appendix B. Possible Options for Choosing Banking Service
Saving Account I: CIT bank / Barclay (API = 1.00% in Jan. 2013; API = 4.35% in 2023)
Saving Account II: Ally bank / Synchrony Bank (API = 0.95% - 1.00%)
Saving Account III: Capital one 360 / Discover Bank (API = 0.75% - 0.90%)
Checking Account I, II: Chase Total Checking I, and II
Checking Account III: Bank of America Online Checking Account, or Capital one online interest Checking Account
Checking Account IV: Capital one 360 Investment checking or Money Market
Credit Card I, II: Chase Freedom Card I, Chase Rapid Rewards (or Sapphire Platinum) Card II (I for rent and grocery; II for travel, insurance and other maintenance)
Credit Card III, IV: Discovery & Bank of America Credit Card (for grocery and other daily expenditures)
Credit Card V: CIT / Capital One Premium Card (which are oriented for travel, service terms and online shopping, etc.)
References
- Anzuimi, Alessio, Marco J. Lombardi, and Patrizio Pagano 2010. The impact of monetary policy shocks on commodity prices. SSRN Electronic Journal 9, 1232.
- Al Ali, Amal, Ahmed M. Khedr, Magdi El Bannany, and Sakeena Kanakkayil 2023. GALSTM-FDP:A time-series modeling approach using Hybrid GA and LSTM for financial distress prediction. Int. J. Financial Studies 11, 38. https://doi.org/ 10. Int. J. Financial Studies; //doi: 11, 38. https, 3390. [Google Scholar] [CrossRef]
- Bailey, Martin J. The welfare cost of inflationary finance. Journal of Political Economy 1956, 64, 93–110. [Google Scholar] [CrossRef]
- Barro, Robert J. Inflationary finance and the welfare cost of inflation. Journal of Political Economy 1972, 80, 978–1001. [Google Scholar] [CrossRef]
- Belke, A. H., I. G. Bordon, and T. W. Hendricks 2014. Monetary policy, global liquidity and commodity prices dynamics. The North American Journal of Economics and Finance 28, 1–16.
- Chen, Yi-Chang, Shih-Ming Kuo, Yonglin Liu, Zeqiong Wu, and Fang Zhang 2022. Improving returns on strategy decisions through integration of neural networks for the valuation of asset pricing: the case of Taiwanese stock. Int. J. Financial Studies. 2022, 10, 99. [CrossRef]
- Chang, Kuang-Liang and Chi-Wei He, 2010. Does the magnitude of the effect of inflation uncertainty on output growth depend on the level of inflation? The Manchester School 78, 126–148.
- Chen, Liang and Xia Chen 2011. Review and research comments of research abroad on inflation. Economic Theory and Business Management 2, 50–58.
- Cukierman, Alex and Allan H. Meltzer 1986. A theory of ambiguity, credibility, and inflation under discretion and asymmetric information. Econometrica 54, 1099–1128.
- Fan, Fangzhi, Studies on Inflation 2011. Social Sciences in Ningxia 165, 25–33.
- Friedman, Milton 1977. Nobel lecture: inflation and unemployment. Journal of Political Economy 85, 451–472.
- Holland, A. S 1995. Inflation and uncertainty: tests for temporal ordering. Journal of Money, Credit and Banking 27, 727–837.
- Kumar, Manmohan S. and Tatsuyoshi Okimoto 2007. Dynamics of persistence in international inflation rates. Journal of Money, Credit and Banking 39, 1457–1479.
- Liu, Xichun 2023. Prediction of exchange rate on RMB under the influence of US monetary policy. Thesis, Nanjing University of Information Science and Technology.
- Lu, Yanchun and Gongzheng Zhao 2017. New changes of international commodity prices towards the transmission effects of PPI and CPI in China. Prices: Theory and Practice 7, 25–28.
- Lu, Yanchun, Gongzheng Zhao, Chao Zhang, Xianfeng Zhu, Mijia Zhong, and Rui Guo 2022. Research on the formation and governance of current global inflation. Price: Theory and Practice 9, 5–9.
- James E. Payne 2009. Inflation targeting and the inflation-inflation uncertainty relationships: evidence from Thailand. Applied Economics Letters 16, 233–238. [CrossRef]
- Pourgerami, Abbas and Keith E. Maskus 1987. The effects of inflation on the predictability of price changes in Latin America: some estimates and policy implications. World Development 15, 287–290.
- Ross, Stephen A. The arbitrage theory of capital asset pricing. Journal of Economic Theory 1976, 13, 341–360. [Google Scholar] [CrossRef]
- Ben Salem, Salha, Sonia Sayari, and Moez Labidi 2024. Effect of financial frictions on monetary policy conduct: a comparative analysis of DSGE models with and without financial frictions. Economies 12, 72.
- Shi, Tingting 2021; 108-110: Prediction of RMB exchange rate fluctuation trend under COVID-19 epidemic based on ARIMA model. Modern Business.
- Shiyyab, Fadi Shehab, Abdallah Bader Alzoubi, Qais Mohammad Obidat, and Hashem Alshurafat 2023. The impact of artificial intelligence disclosure on financial performance. Int J. Finance Studies 11, 115. [CrossRef]
- Ungar, Meyer and Ben-Zion Zilberfarb 1993. Inflation and its unpredictability theory and empirical evidence. Journal of Money, Credit and Banking 25, 709–720.
- Xiao, Long 2020. Predicting the regulations and trends on variations of exchange rate under the Sino-US trade war: empirical ressearch based on ARIMA model. Jilin Financial Studies 6, 12–15.
- Xu, Tao, Yinjie Zhao, and Ziyou Zhou 2021. Combined forecasting of exchange rates based on ARIMA-GARCH model. Economic Horizon 15, 126–128.
- YI, Danhui and Yan Wang 2021. Applied Times Series Analysis, Fifth Edition. Remin University of China Edition.
- Zhang, Yuanping and Yuan Zhou 2021; 77-82: Fundamentals of Mathematical Finance, 3rd Edition. Peking University Press.
- Zhu, Shuzhen, Chenglong Li, and Yufeng Ji 2022; 234-236: Financial Risk Management, 4th Edition. Peking University Press.
Figure 1.
Proposed multi-level framework of static modeling for fiscal management when distributing direct deposits or income (*: Regular bi-week direct deposit is set up by assumption. Percentage of distribution or weight (Wt.) can also be adjustable.).
Figure 1.
Proposed multi-level framework of static modeling for fiscal management when distributing direct deposits or income (*: Regular bi-week direct deposit is set up by assumption. Percentage of distribution or weight (Wt.) can also be adjustable.).
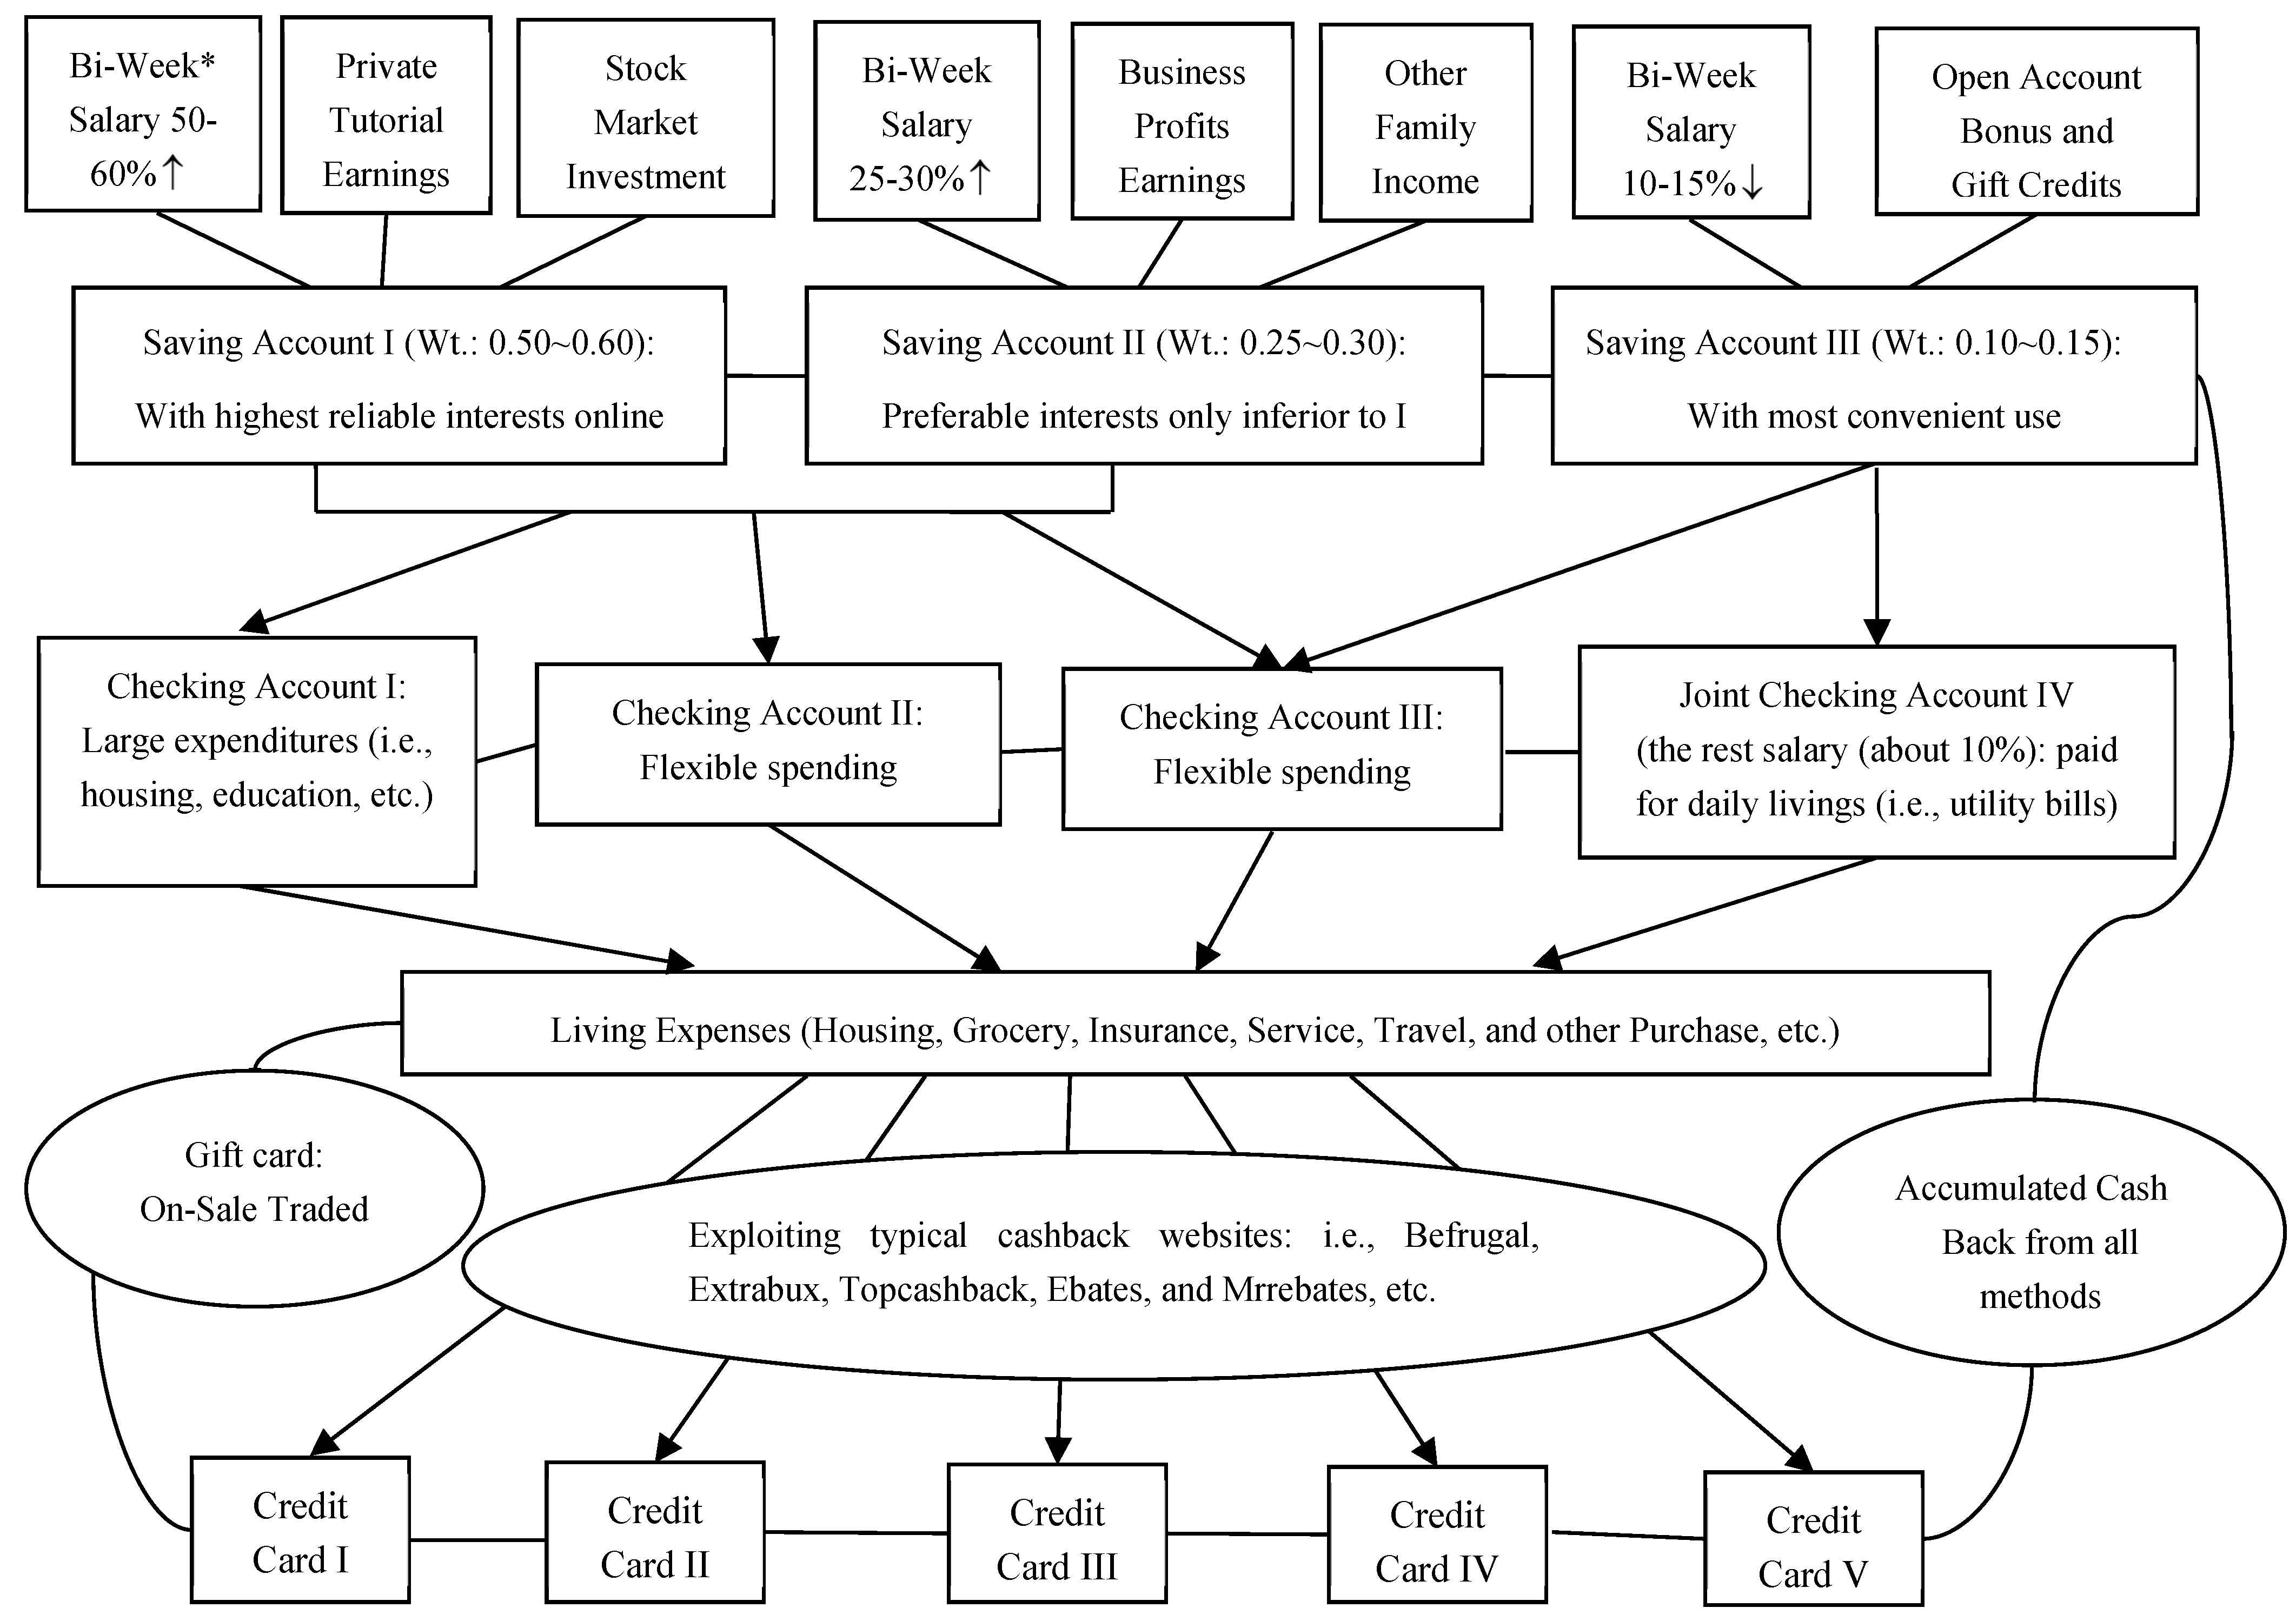
Figure 2.
US annual inflation rates in the past twelve years (2012-2023). Mean values and standard deviations are based on 12-month statistical average using CPI data for each calendar year.
Figure 2.
US annual inflation rates in the past twelve years (2012-2023). Mean values and standard deviations are based on 12-month statistical average using CPI data for each calendar year.
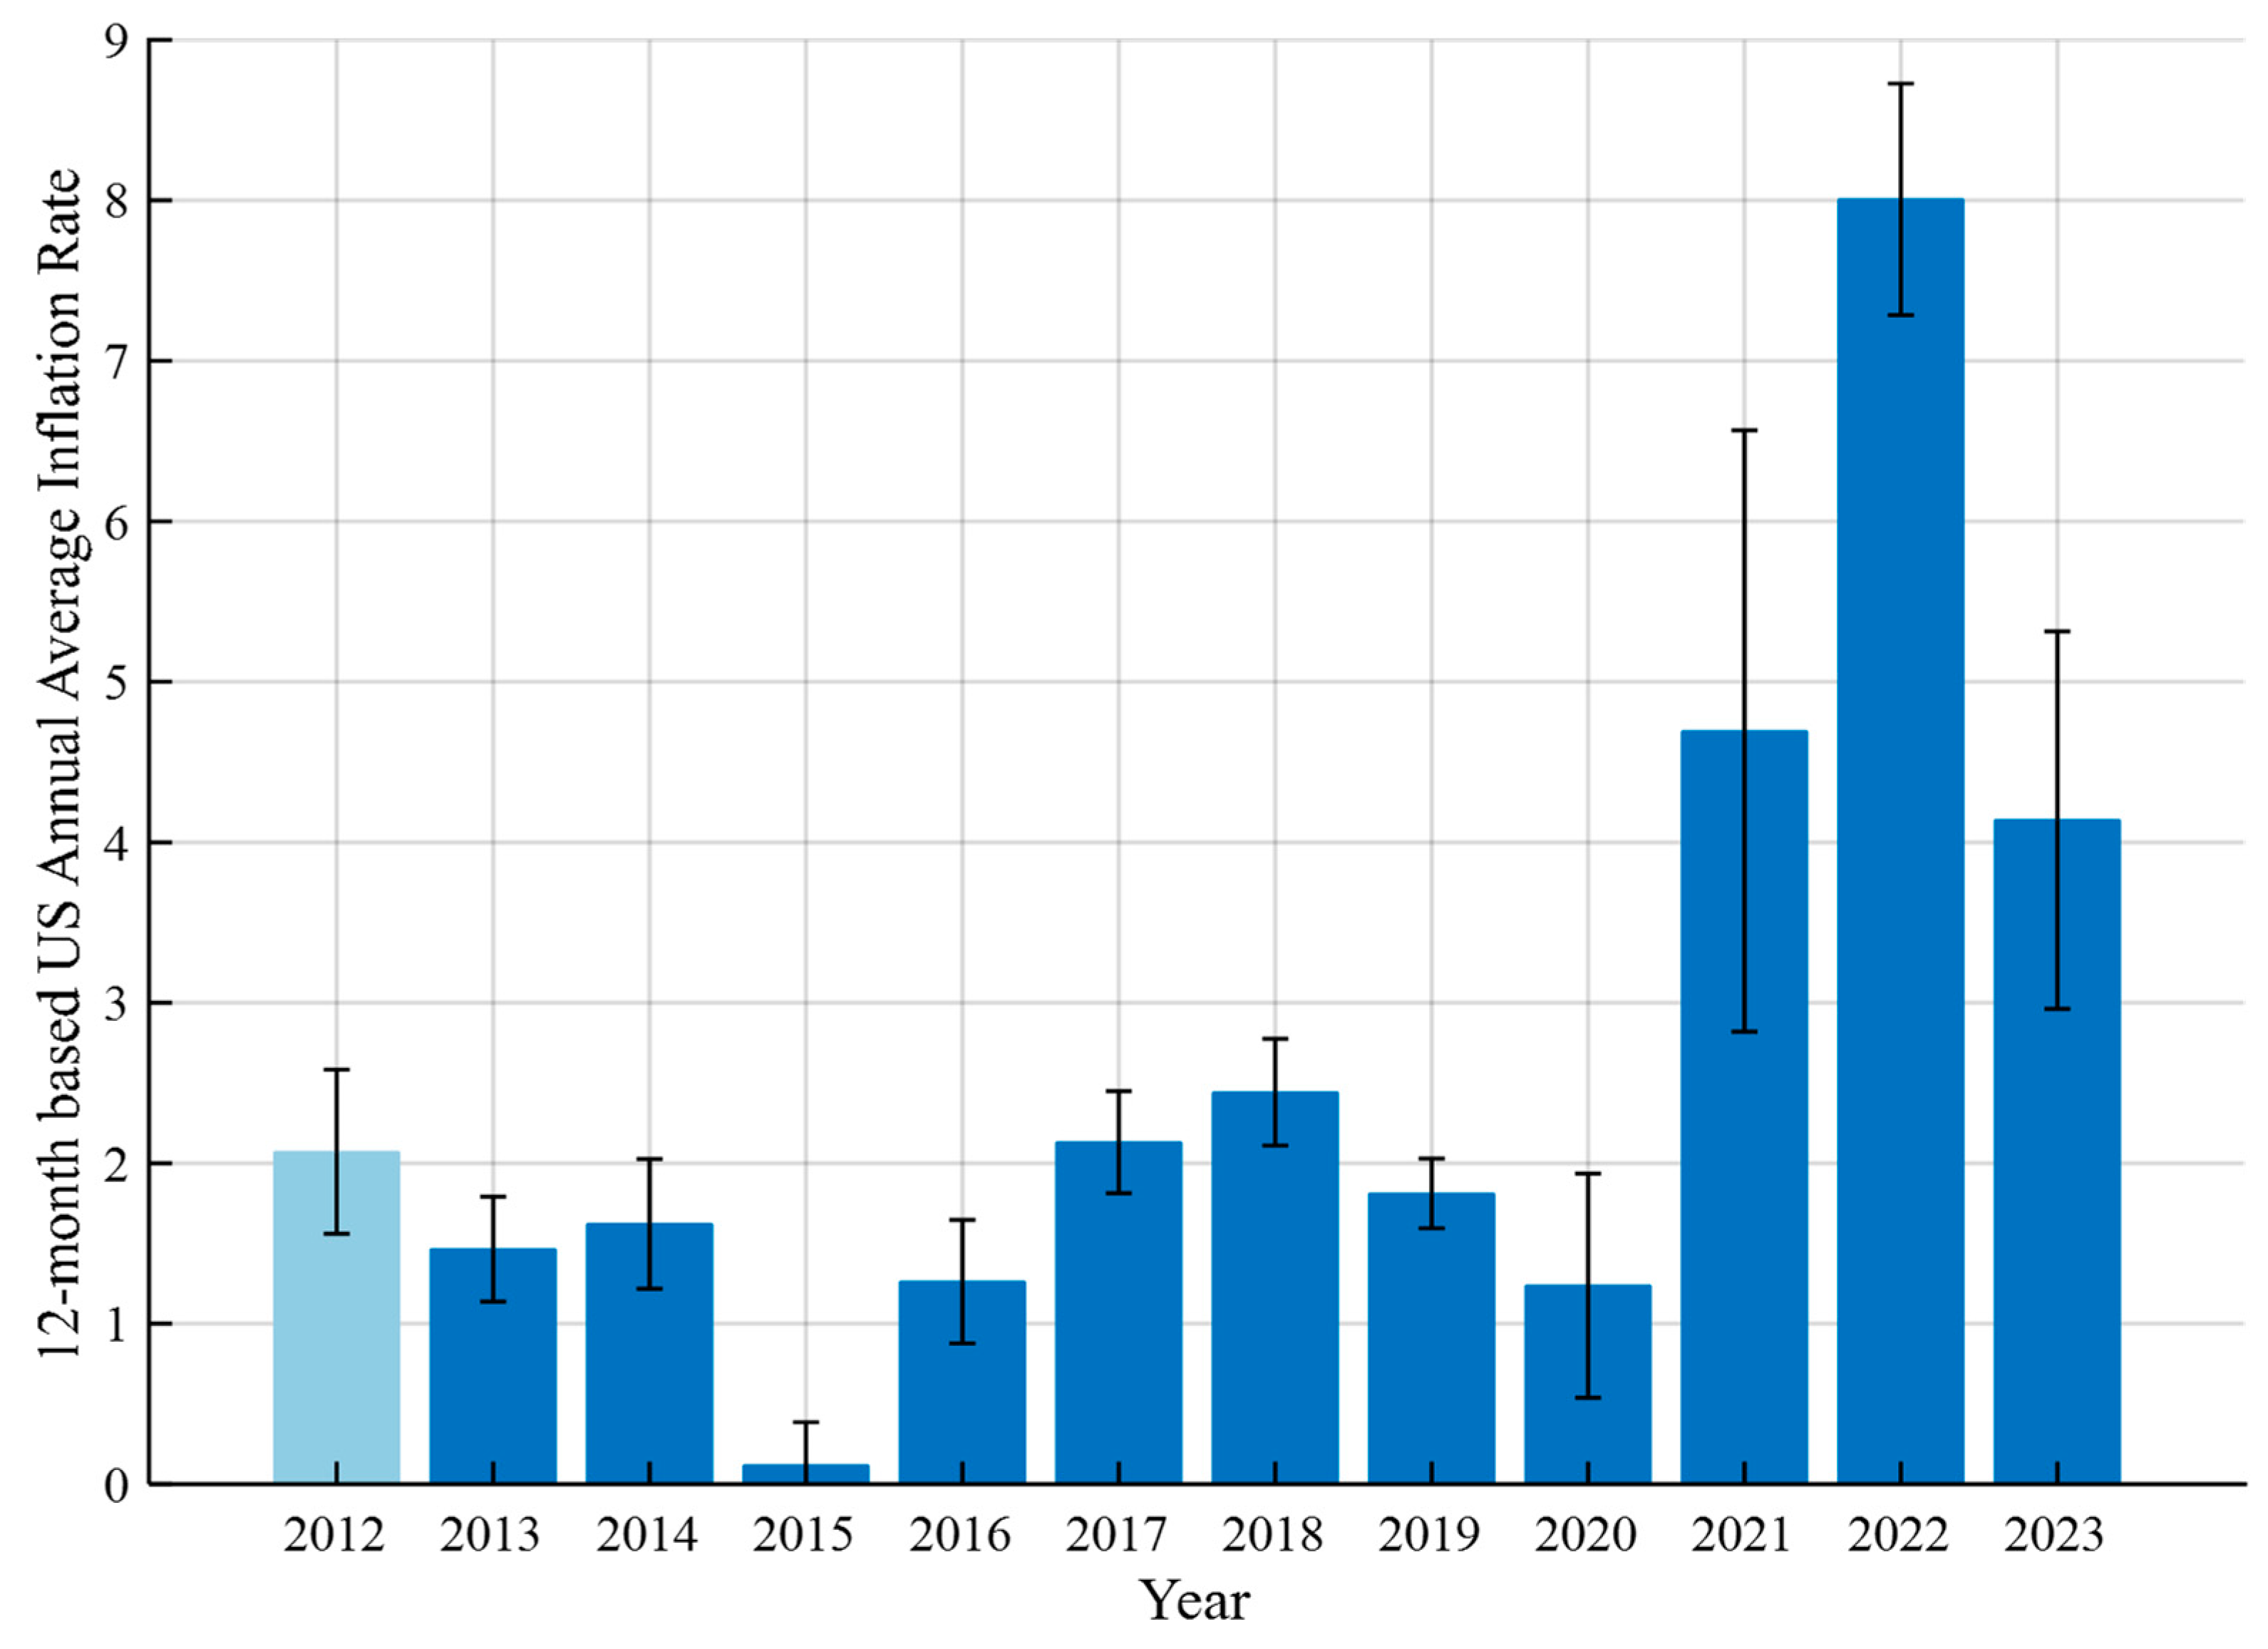
Figure 3.
Monthly average median price of RMB-USD exchange rate (from Sep. 2015 to Jan. 2023).
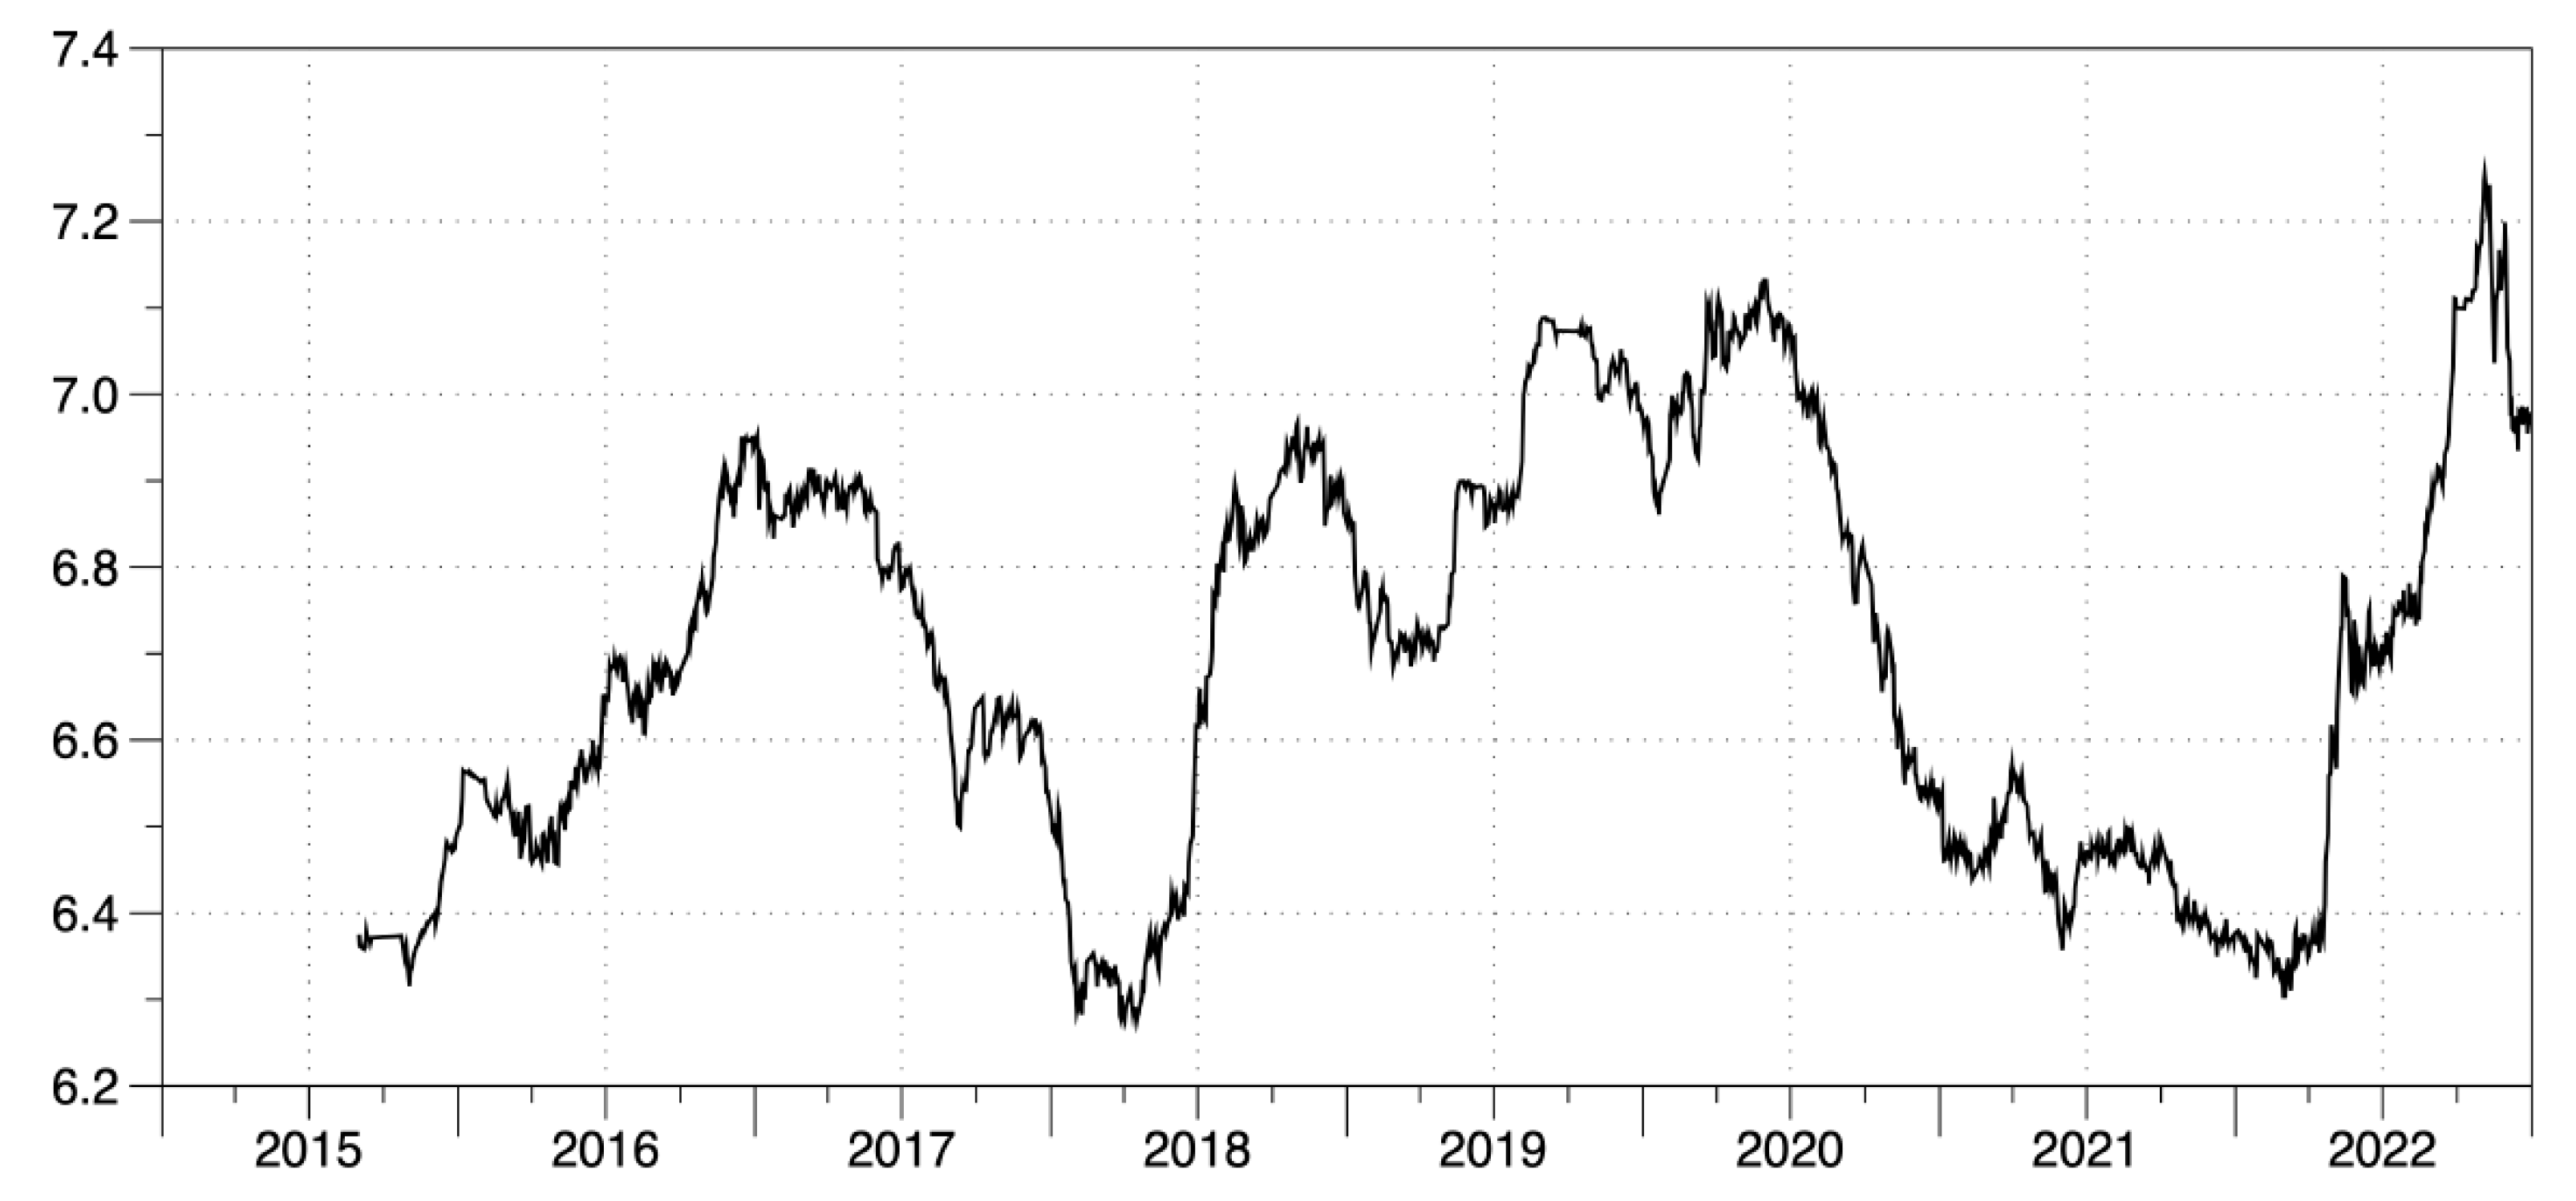

Table 1.
Comparison of Annual Income with / without Multi-level Static Fiscal Modeling.
| Fiscal Statistic Metrics | Half-Time RA / TA | Quarter RA / TA | Self-Support |
|---|---|---|---|
| Original annual income | $ 18,000 | $ 10,950 | $ 1,000 (other $ 16,000 self-support per year) |
| Updated after modeling | $ 19,053 | $ 11,726 | $ 17,977 |
| Total annual expense | $ 13,138 | $ 10,710 | $ 14,030 |
| Remaining asset values after multi-level fiscal modeling | $ 5,915.9 | $ 1,016.2 | $ 3,946.8 |
| Original percentage of balance to expenditures | 28.79 % | 4.58 % | 19.18 % |
| Upgraded percentage of balance to expenditures | 32.06 % | 9.05 % | 22.74 % |
| Percentage of difference with/without strategy | 3.27 % | 4.48 % | 3.55 % |
Table 2.
Monthly-based US inflation rate from Jan. 2012 to Dec. 2023. The last column tabulates 12-month average inflation rate using CPI data for a given calendar year in the same row. (Note: *The actual inflation rate in Dec. 2023 was available on Jan. 12, 2024, which was predicted from China External Environment Monitor (CEEM) and worldwide open websites such as Ycharts and US inflation calculators for financial indications.).
| Year | Jan | Feb | Mar | Apr | May | Jun | Jul | Aug | Sep | Oct | Nov | Dec | Ave |
|---|---|---|---|---|---|---|---|---|---|---|---|---|---|
| 2023 | 6.41 | 6.04 | 4.98 | 4.93 | 4.05 | 2.97 | 3.18 | 3.67 | 3.70 | 3.24 | 3.14 | 3.35 | 4.10 |
| 2022 | 7.48 | 7.87 | 8.54 | 8.56 | 8.28 | 9.06 | 8.52 | 8.26 | 8.20 | 7.75 | 7.11 | 6.45 | 8.01 |
| 2021 | 1.40 | 1.68 | 2.62 | 4.16 | 4.99 | 5.39 | 5.37 | 5.25 | 5.39 | 6.22 | 6.81 | 7.04 | 4.70 |
| 2020 | 2.49 | 2.33 | 1.54 | 0.33 | 0.12 | 0.65 | 0.99 | 1.31 | 1.37 | 1.18 | 1.17 | 1.36 | 1.23 |
| 2019 | 1.55 | 1.52 | 1.86 | 2.00 | 1.79 | 1.65 | 1.81 | 1.75 | 1.71 | 1.76 | 2.05 | 2.29 | 1.81 |
| 2018 | 2.07 | 2.21 | 2.36 | 2.46 | 2.80 | 2.87 | 2.95 | 2.70 | 2.28 | 2.52 | 2.18 | 1.91 | 2.44 |
| 2017 | 2.50 | 2.74 | 2.38 | 2.20 | 1.87 | 1.63 | 1.73 | 1.94 | 2.23 | 2.04 | 2.20 | 2.11 | 2.13 |
| 2016 | 1.37 | 1.02 | 0.85 | 1.13 | 1.02 | 1.00 | 0.83 | 1.06 | 1.46 | 1.64 | 1.69 | 2.07 | 1.26 |
| 2015 | -0.09 | -0.03 | -0.07 | -0.20 | -0.04 | 0.12 | 0.17 | 0.20 | -0.04 | 0.17 | 0.50 | 0.73 | 0.12 |
| 2014 | 1.58 | 1.13 | 1.51 | 1.95 | 2.13 | 2.07 | 1.99 | 1.70 | 1.66 | 1.66 | 1.32 | 0.76 | 1.62 |
| 2013 | 1.59 | 1.98 | 1.47 | 1.06 | 1.36 | 1.75 | 1.96 | 1.52 | 1.18 | 0.96 | 1.24 | 1.50 | 1.46 |
| 2012 | 2.93 | 2.87 | 2.65 | 2.30 | 1.70 | 1.66 | 1.41 | 1.69 | 1.99 | 2.16 | 1.76 | 1.74 | 2.07 |
Table 3.
Test outcome for return rates of APT-based buying and selling morgan and peace silver dollars in Tucson, AZ, USA. Last blank at bottom right shows the average.
Table 3.
Test outcome for return rates of APT-based buying and selling morgan and peace silver dollars in Tucson, AZ, USA. Last blank at bottom right shows the average.
| Period | Nov-16 | Dec-16 | Jan-17 | Mar-17 | Apr-17 | May-17 | Jun-17 | Aug-17 | Sep-17 |
|---|---|---|---|---|---|---|---|---|---|
| Buy ($) | 2081 | 1684 | 2516 | 2830 | 1047 | 1829 | 1345 | 2264 | 1701 |
| Sell ($) | 2426 | 1919 | 2770 | 3100 | 1312 | 2151 | 1669 | 2611 | 2078 |
| Return/% | 16.58 | 13.96 | 10.10 | 9.54 | 25.31 | 17.61 | 24.09 | 15.33 | 22.16 |
| Period | Oct-17 | Dec-17 | Feb-18 | Jun-19 | Dec-19 | Dec-20 | Aug-21 | Mar-22 | Sum |
| Buy ($) | 1543 | 1711 | 2563 | 2140 | 3148 | 2397 | 2176 | 1825 | 34900 |
| Sell ($) | 1902 | 2211 | 2948 | 2472 | 4030 | 3235 | 2735 | 2403 | 41972 |
| Return/% | 23.27 | 29.22 | 15.02 | 15.51 | 28.02 | 34.96 | 25.69 | 31.67 | 20.26 |
Table 4.
Comparison of net asset appreciation with the proposed joint approach on static and dynamic fiscal modeling under the paradigm of broad money (M3).
Table 4.
Comparison of net asset appreciation with the proposed joint approach on static and dynamic fiscal modeling under the paradigm of broad money (M3).
| Fiscal Statistic Metrics | Current API | 1-year CD | Reduced API |
|---|---|---|---|
| Annual net assets | $ 53,100 | $ 53,100 | $ 53,100 |
| Delta_M0 | $ 2,077.5 | $ 2,077.5 | $ 2,077.5 |
| Delta_M1 | $ 798 | $ 798 | $ 798 |
| Delta_M2 | $ 1,847.9 | $ 2,230.2 | $ 1,529.3 |
| Delta_M3 | $ 4,723.4 | $ 5,105.7 | $ 4,404.8 |
| Percentage of annual net asset appreciation | 8.90 % | 9.62 % | 8.30 % |
| Lower and upper bounds of estimated percentage | [8.03 %, 9.92 %] | [8.75 %, 10.64 %] | [7.43 %, 9.32 %] |
Disclaimer/Publisher’s Note: The statements, opinions and data contained in all publications are solely those of the individual author(s) and contributor(s) and not of MDPI and/or the editor(s). MDPI and/or the editor(s) disclaim responsibility for any injury to people or property resulting from any ideas, methods, instructions or products referred to in the content. |
© 2024 by the authors. Licensee MDPI, Basel, Switzerland. This article is an open access article distributed under the terms and conditions of the Creative Commons Attribution (CC BY) license (http://creativecommons.org/licenses/by/4.0/).
Copyright: This open access article is published under a Creative Commons CC BY 4.0 license, which permit the free download, distribution, and reuse, provided that the author and preprint are cited in any reuse.


