Submitted:
12 April 2024
Posted:
15 April 2024
You are already at the latest version
Abstract
China's economic development has shifted from high speed to high quality. This study constructs an evaluation index for China’s high-quality development utilizing a new development concept. The entropy method and cluster analysis were used to assess the level of high-quality development in China between 2015 and 2021. Kernel density estimation method was employed to explore spatiotemporal dynamics. The results reveal significant differences in the level of economic development among provinces in China; the eastern region is significantly better than the central, northeastern, and western regions. From the perspective of the sub-item evaluation, challenges with uneven, uncoordinated, and insufficient economic development exist in various Chinese provinces.
Keywords:
high-quality development
; five principles of development
; entropy method
; cluster analysis
; kernel density estimation
1. Introduction
Since the reform and opening up of the country, China has witnessed a rapid increase in its level of economic development, creating a “Chinese economic miracle,” which has shocked the world. However, ecological and environmental problems caused by over-exploitation, inefficient utilization, and wasteful consumption of resources are increasingly prominent [1,2]. Therefore, China’s future development necessitates a shift in the mode of economic development and an improvement in its quality [3]. The Fifth Plenary Session of the 18th Central Committee of the Communist Party of China established, for the first time, the new concepts of “innovation, coordination, greenness, openness, and sharing” for economic and social development. The report of the 19th National Congress of the Communist Party of China stated that “socialism with Chinese characteristics has entered a new era, with the economy shifting from a high-speed growth to high-quality development” [4]. Some scholars argue that high-quality economic development entails pursuing both quantity and quality simultaneously, which represents coordinated development [5]. However, high-quality economic development is a concept that appears simple yet difficult to grasp, posing new and complex challenges in statistical accounting. This study aims to measure the level of high-quality economic development and its spatiotemporal dynamic evolution in each province from 2015 to 2021. Investigating these claims presents crucial practical significance in promoting high-quality development in China.
Existing studies have had different understandings of high-quality development since their proposal. Some literature focuses on a single evaluation index, such as total factor productivity, green total factor productivity [6,7,8], labor productivity [9], GDP per capita [10], economic growth rate [11], and labor productivity [12,13,14] to quantify high-quality development. However, one indicator hardly suffices to capture the entirety of high-quality economic development. While others constructed a multi-dimensional evaluation index system of high-quality development [15,16], Ma [17] (2022) designed an evaluation index system of high-quality economic development employing three dimensions of “economic development, social life, ecological environment.” Moreover, Huang et al. [18] established the evaluation index system of China’s high-quality development from five aspects such as innovation development, urban-rural coordination, ecological environment, opening to the outside world, and individuals’ livelihood.
Current research is mostly guided by the five principles of development and constructs a high-quality economic development evaluation system from the five dimensions of innovation, coordination, greenness, openness, and sharing [19,20,21,22,23,24]. Chen et al. [25] used principal component analysis to measure China’s high-quality economic development in each province and explored the main factors influencing high-quality economic development. Chen et al. [26] used the Entropy weight Topsis model to evaluate the urban ecological level. Xiao et al. [27] employed evaluation systems, the entropy-weighted method, and the Gini coefficient method to explore high-quality development levels and evolving trends from 2015 to 2020. Li et al. [28] explored the effects of environmental regulation, foreign direct investment, and their interaction term on high-quality economic development, while Yuan et al. [29] analyzed the influencing factors of high-quality coordinated development and identified problem areas.
Various studies on economic development revolve around spatial correlation patterns [30,31,32]. Chen et al. [33] explored the spatial correlation mechanism of high-quality development by using social network analysis. Zhou et al. [34] examined the coupling coordination and spatial correlation effects of green finance and high-quality economic development in 30 Chinese provinces, while others used the Dagum Gini coefficient method and the kernel density function to describe the dynamic evolution of high-quality development [35,36,37].
Zhang et al. [38] explored the spatiotemporal patterns and evolution characteristics of the coupling coordination degree (CCD) between urban resilience and high-quality development and further analyzed the influence factors with the spatial econometric models. Liu and Zhou [39] examine the spatiotemporal evolution dynamics associated with high-quality urban development trends in the region. Hu et al. [40] investigated the spatial-temporal pattern of the coupling and coordinated development of the three-dimensional economic, social, and ecological environments system in 21 prefecture-level cities. Wang et al. [41] explored the characteristics of spatial-temporal variations in the high-quality development level from 2010 to 2020 and use the obstacle degree model to explore the factors that are obstacles to high-quality development. Wan et al. [42] evaluated the CCD between the social economy and ecological environment, analyzed the changing laws and characteristics of the CCD from the perspective of time and space, and used regression analysis to determine the key factors affecting it.
To summarize, scholars have conducted in-depth research on the connotation and evaluation system of high-quality economic development, which exploration of this study. First, it is essential to clarify the connotation of high-quality economic development and select measurement indicators purposefully. Second, compared to a single indicator, comprehensive indicators can provide a comprehensive and accurate evaluation of high-quality economic development. Third, while the subjective empowerment method cannot emphasize objective and effective information, various objective empowerment evaluation methods exist to choose from. Fourth, the spatiotemporal dynamic evolution of high-quality development is conducive to grasping the situation of economic and social development. Therefore, based on these principles of development, this study employs the entropy method to measure the level of high-quality economic development. Cluster analysis and kernel density estimation were utilized to examine the spatiotemporal dynamic evolution of high-quality economic development, providing support and a theoretical foundation for achieving high-quality economic development in various regions.
The structure of this paper is as follows. Section 2 introduces the methodology of this study. Section 3 presents the measurement and analysis of the overall index and various subdimensions of high-quality economic development. Section 4 describes the dynamic spatiotemporal evolution of high-quality economic development. Finally, Section 5 presents conclusions and suggestions.
2. Measurement Methods and Indicator System Construction
2.1. Entropy Method
The entropy value method was used to compute the weight of urban resilience and high-quality development indicators to ensure reasonable and scientifically sound weighting results [43]. The calculation steps are as follows:
Step 1. We standardized the initial data using the range method to remove dimensional connections between indicators and improve comparability:
Step 2. We calculated the information entropy using the formula:
where n represents the total number of provinces surveyed.
Step 3. We calculated the weight of indicators using the formula:
Step 4. We calculated the final result based on the weight.
2.2. The Construction of Evaluation Index System
The connotations of high-quality economic development are significant. Using a single indicator to measure it may not accurately express its meaning. Therefore, it is essential to construct an indicator system to define high-quality economic development. In 2020, the Chinese government introduced the “Proposal of the Central Committee of the Communist Party of China on Formulating the Fourteenth Five-Year Plan for National Economic and Social Development and the Visionary Goals for 2035,” which identified five principles of development: innovation, coordination, greenness, openness, and sharing. According to these principles, the evaluation index system for China’s high-quality economic development level, constructed in this study, includes five primary indicators, 11 secondary indicators, and 21 tertiary indicators.
1) Innovation. Innovation has a high efficiency value. According to the principles of economic development, when the growth rate of investment reaches a plateau and fails to meet effective demand, innovation becomes the driving force for sustainable economic development. Innovative activities encompass processes that begin with inputs, including financial and human resources, and culminate in the production of innovative results. Therefore, innovation development can be expressed in terms of innovation and output.
2) Coordination. Coordination development mainly considers the integrity, systematics, and equilibrium of the socialist market economy’s development to address developmental imbalances. Under the concept of new development, the level of coordinated development can be expressed regarding urban-rural coordination and economic and social coordination.
3) Greenness. Greenness emphasizes sustainability, drawing upon the rich ecological wisdom found in traditional Chinese culture. Concepts such as the unity of heaven and man, the law of nature, and the equality of all living beings in Confucianism, Taoism, and Buddhism reflect a deep-rooted awareness of the interconnectedness between man and nature. Green development is primarily assessed through three aspects: resource consumption, ecological environment, and green life.
4) Openness. The concept of openness prioritizes the value of mutual benefit and a win-win situation, reflecting a commitment to the shared destiny of humanity. Openness entails embracing the principles of mutual benefit and common prosperity, advancing with time. Openness development is comprehensively reflected in two aspects: trade and investment openness.
5) Sharing. Sharing emphasizes the value of justice and stands as the ultimate goal of economic and social development, serving as the driving force for building a moderately prosperous society. In China, shared development comprises efficiency and fairness embodies the socialist goal of common prosperity. The concept of shared development can be expressed in both economic and social outcomes. The evaluation indicators at the various levels are listed in Table 1.
2.3. Data Sources and Pre-Processing
We collected data from 30 provinces of China (excluding Tibet, Hong Kong, Macao, and Taiwan). The study period spanned from 2015 to 2021. The index data and related variables utilized in this study were mainly obtained from sources such as the “China Statistical Yearbook,” the “China Urban Statistical Yearbook,” and the “China Energy Statistical Yearbook.” During the period from 2016 to 2021, the total output value of large and medium-sized industrial enterprises was missing. In such cases, we substituted it with the profit of large and medium-sized industrial enterprises. For certain years, the urban sewage treatment rate data were missing for Beijing, Tianjin, and Shanghai. In these cases, we calculated the average of similar years.
3. Measurement and Analysis of High-Quality Economic Development
3.1. Analysis of the Overall Index and Sub-Dimension Index
- 1)
- Analysis of the overall index of high-quality economic development
This section calculates the comprehensive evaluation values and rankings of high-quality economic development in 30 provinces from 2015 to 2021 using the entropy method (Table 1), and the evaluation results range from 0 to 1. From a comprehensive perspective, Guangdong, Jiangsu, Beijing, Zhejiang, Shanghai, and Shandong consistently ranked among the top six. Among them, Guangdong and Jiangsu were in the top two, with occasional changes in the positions of Beijing, Shanghai, and Zhejiang. Shandong has always ranked sixth, indicating that these six provinces and cities have the strongest overall strengths in terms of innovation, coordination, greenness, openness, and sharing. Second, Tianjin, Fujian, Liaoning, Hubei, Hunan, Hainan, and Anhui also had high comprehensive scores, and their high-quality development levels alternated with the top ten. However, Xinjiang, Qinghai, Gansu, Ningxia, and other provinces and cities had lower comprehensive scores, reflecting their overall weaker strengths.
- 2)
- Analysis of the Subdimensional
The entropy method was used to calculate the sub-dimensional index and ranking of high-quality economic development in 30 provinces in 2021 (Table 2), and the evaluation results ranged from 0 to 1. From the perspective of the various dimensional indices, there were significant differences in the results of the five-dimensional indices. In terms of innovation, the top five were Guangdong, Jiangsu, Zhejiang, Shandong, and Beijing (all in the eastern region), followed by Fujian, Anhui, Shanghai, Hubei, and Henan. Fujian and Shanghai belong to the eastern region, whereas Anhui, Hubei, and Henan belong to the central region. The last five were Heilongjiang, Xinjiang, Gansu, Ningxia, Hainan, and Qinghai. Heilongjiang is in the northeastern region, whereas Xinjiang, Gansu, Ningxia, and Qinghai are in the western region. Hainan Province has a low level of innovative development in the eastern region.
Regarding coordination, the top five regions were Heilongjiang, Qinghai, Liaoning, Anhui, and Chongqing. Heilongjiang and Liaoning belong to the northeastern region, whereas Anhui and Chongqing belong to the western region. Jilin, Shanxi, Guangxi, Hubei, and Sichuan followed. Jilin belongs to the northeast region, Shanxi and Hubei belong to the central region, and Guangxi and Sichuan belong to the western region, indicating that the urban–rural gap in these areas is not significant. The last five were Guangdong, Zhejiang, Fujian, Beijing, and Guizhou, with the eastern region accounting for the four economically developed regions. Guizhou belongs to the western region, indicating a significant urban–rural development gap in these areas.
For greenness, the top five cities are Beijing, Shandong, Jiangsu, Zhejiang, and Hainan, all of which are economically developed and belong to the eastern region. The effect of emphasizing the quality of economic development is significant, indicating that these regions have achieved good results in controlling the total energy consumption and carbon dioxide emissions. Hunan, Fujian, Liaoning, Tianjin, and Anhui scored relatively high. Fujian and Tianjin belong to the eastern region, Anhui and Hunan belong to the central region, and Liaoning belongs to the western region, indicating that these provinces and cities have worked well on green environmental protection. The other five cities were Xinjiang, Ningxia, Guizhou, Inner Mongolia, and Qinghai. Except for Inner Mongolia, all these regions belong to the western region.
Regarding openness, the top five were Shanghai, Guangdong, Shanghai, Hainan, and Jiangsu, all of which belong to the eastern region, followed by Shandong, Beijing, Zhejiang, Tianjin, and Fujian, all of which belong to the eastern region, indicating a high level of open development in the eastern region. The last five cities are Inner Mongolia, Guizhou, Gansu, Ningxia, and Qinghai. Except for Inner Mongolia, which belongs to the central region, the remainder belongs to the western region.
Regarding sharing, the top five were Beijing, Shanghai, Jiangsu, Zhejiang, and Guangdong, all of which belong to the eastern region. Tianjin, Shandong, Shaanxi, Fujian, and Hubei followed. Except for Shaanxi, which belongs to the western region, and Hubei, which belongs to the central region, the rest are in the eastern region, indicating that these provinces and cities have relatively good development in the sharing economy. The bottom five provinces are Ningxia, Liaoning, Guangxi, Gansu, and Heilongjiang, with Liaoning and Heilongjiang belonging to the northeast and the remaining provinces in the western region.
3.2. Temporal Evolution of High-Quality Economic Development
Using the entropy method, the high-quality economic development levels of 30 provinces in China were measured from 2015 to 2021, and the evaluation results ranged from 0 to 1. From the average values for each year, the region with the highest economic high-quality development index was Guangdong (0.7647), and the province with the lowest was Gansu (0.1032). The high-quality development of the Chinese economy has not continued to increase as it has grown, which also indicates the necessity of shifting towards high-quality development at this stage. From a regional perspective, the level of high-quality economic development in China varies with decreasing trends in the eastern, central, northeastern, and western regions. The high-quality economic development of the eastern provinces is above the national average, whereas that of the central, northeastern, and western regions is lower than the national average (see Figure 1).
3.3. Spatial Analysis of High-Quality Economic Development
To obtain the spatial distribution of high-quality economic development in China, K-means clustering analysis was used to obtain five aspects of economic development in each province and city. The economic and social development levels of 30 provinces and cities were divided into four categories. The results are summarized in Table 2.

Table 4.
The 2021 high-quality development cluster analysis results.
| Index | Innovation | Coordination | Greenness | Openness | Sharing | High-Quality Development |
|---|---|---|---|---|---|---|
| Category | ||||||
| High level | Jiangsu Guangdong |
Heilongjiang | Beijing | Guangdong | Beijing | Guangdong Jiangsu |
| Middle high level | Zhejiang Shandong |
Shanxi, Liaoning Jilin, Anhui Guangxi, Qinghai Chongqing |
Jiangsu, Zhejiang Fujian, Shandong Hunan, Hainan |
Shanghai, Hainan | Tianjin, Shanghai Jiangsu, Zhejiang Guangdong |
Beijing, Shanghai Zhejiang, Shandong |
| Middle level | Beijing, Hebei Shanghai, Anhui Fujian, Henan Hubei, Hunan Sichuan, Shaanxi |
Beijing, Jiangsu Zhejiang, Guangdong Fujian, Guizhou Yunnan, Gansu |
Tianjin, Hebei Shanxi, Liaoning Jilin, Heilongjiang Anhui, Henan Hubei, Guangdong Chongqing, Yunnan Shanxi |
Beijing, Tianjin Jiangsu, Zhejiang Fujian, Shandong |
Inner Mongolia Fujian, Shandong Hubei, Hunan Chongqing, Sichuan Shaanxi, Xinjiang |
Tianjin, Hebei Liaoning, Anhui Fujian, Henan Hubei, Hunan Chongqing, Sichuan Hainan, Shaanxi |
| Low level | Tianjin, Liaoning, Shanxi, Jilin Inner Mongolia Heilongjiang, Jiangxi, Guangxi Hainan, Guizhou Yunnan, Gansu Qinghai, Ningxia, Xinjiang, Chongqing |
Tianjin, Hebei, Inner Mongolia Shanghai, Hunan Sichuan, Jiangxi Shandong, Henan Hubei, HainanShaanxi, Ningxia, Xinjiang |
Inner Mongolia, Shanghai Sichuan, Guizhou Gansu, Jiangxi Guangxi, Qinghai Ningxia, Xinjiang |
Hunan, Sichuan Shaanxi, Hebei Shanxi, Inner Mongolia Liaoning, Jilin Heilongjiang, Anhui Jiangxi Henan, Hubei Guangxi, Guizhou Chongqing, Yunnan Gansu, Qinghai Ningxia, Xinjiang |
Hebei, Henan Hainan, Liaoning Jilin,Heilongjiang Anhui, Jiangxi Guizhou, Yunnan Shanxi, Gansu Qinghai, Ningxia |
Shanxi, Inner Mongolia Jilin, HeilongjiangJiangxi, Gu Guangxi, Yunnan Gansu, Qinghai Ningxia, Xinjiang |
This study utilized the k-means clustering analysis method to conduct spatial classification research on high-quality economic development levels of various regions in 2021. The analysis categorized the level of high-quality economic development into four, indicating a spatial imbalance. The results indicated that Guangdong and Jiangsu provinces are at the highest level of high-quality economic development. Additionally, Beijing, Shanghai, Zhejiang, and Shandong, all located in the eastern region, attained a higher level, with most of these provinces also demonstrating high levels of innovation, greenness, openness, and sharing.
A low level of coordination indicated a significant gap between urban and rural development. Exceptions to the following situations, Beijing and Shanghai are at a middle level of innovation development. Beijing, Jiangsu, Zhejiang, and Shandong are at a middle level in openness development and Shanghai is at a low level in greenness development. The provinces with a middle level of high-quality economic development include Tianjin, Hebei, Liaoning, Anhui, Fujian, Henan, Hubei, Hunan, Chongqing, Sichuan, Hainan, and Shaanxi, with the majority being in the eastern and central provinces. Tianjin, Liaoning, Chongqing, and Hainan are at a low level of innovation development. Sichuan had a low level of greenness development, Shanxi had a low level of openness development, Hainan had a middle-high level of openness development, and Fujian had a middle-high level of greenness development. Provinces with low levels of high-quality economic development, particularly in the western region, include Shanxi, Inner Mongolia, Jilin, Heilongjiang, Jiangxi, Guizhou, Guangxi, Yunnan, Gansu, Qinghai, Ningxia, and Xinjiang. Most of these provinces also have a low level of innovation, greenness, openness, and sharing, whereas Heilongjiang and Qinghai have a high level of coordinated development.
4. Analysis of the Dynamic Evolution Distribution of High-Quality Economic Development
4.1. Principle of Kernel Density Estimation
Non-parametric kernel density estimation is a method adopted to estimate probability density functions, providing continuous density curves that depict the distributional pattern of random variables. Compared to histograms, this method offers improved continuity of the estimation results. Therefore, the study utilizes the kernel density estimation method to analyze the spatiotemporal evolution characteristics of high-quality economic development, exploring distribution position, main peak distribution trend, polarization trend, and extensibility. The formula for kernel density estimation used is as follows:

where N is the number of observations, Xi represents independent and identically distributed observations, x is the mean of all observations, K(·) represents the kernel density function, and h denotes the bandwidth. Generally, a smaller bandwidth leads to higher estimation accuracy. f(x) is the density function of high-quality Chinese development. We used the Gaussian kernel density function to estimate the distribution and dynamic evolution results of the national high-quality economic development index and various dimensional indices.
4.2. Analysis of the Distribution and Dynamic Evolution Characteristics of High-Quality Economic Development in China
Figure 2 presents the evolution of the national high-quality development index and its various dimensions from 2015 to 2021. Figure 2 (a) shows the three-dimensional kernel density distribution dynamics of the national high-quality development index, while Figure 2b-f presents the three-dimensional kernel density distribution dynamics of the innovation, greenness, openness, sharing, and coordination development indices. Based on the peak shift, Figure 2 (a) reveals that the main peak position of the distribution curve shifts to the right continuously, indicating that the level of high-quality economic development across the country is improving constantly. Observing the peak shift in Figure 2(a), we note a continuous rightward movement of the main peak position of the distribution curve. This indicates that the gap in high-quality economic development among different regions across the country shows an increasing trend. Based on the extensibility of distribution, the left-tailed feature of the kernel density curve is significantly weakened, while the right-tailed phenomenon is further enhanced. This indicates that provinces with lower levels of high-quality economic development nationwide have a trend towards approaching the mean, while provinces with higher levels of development still retain their “sample power.” For example, Guangdong, Jiangsu, Beijing, Zhejiang, Shanghai, and Shandong are at the forefront of high-quality development.
Figure 2 b-f illustrates a rightward shift in the main peak positions of each dimension index, indicating a continual improvement in development levels across dimensions. The innovation index distribution exhibits a slight right tail, indicating that certain provinces, such as Guangdong, Jiangsu, Beijing, Zhejiang, Shanghai, and Shandong in the eastern region, possess significant advantages in innovation development. The presence of multiple peaks in the polarization phenomenon indicates varying levels of polarization. The widening distribution of the coordination index signifies a significant gap in coordination development among provinces, with provinces exhibiting higher coordination development differing from those with higher levels of high-quality and innovation development. Provinces such as Heilongjiang, Chongqing, Jilin, Liaoning, and Tianjin demonstrate leading levels of coordination development.
The widening distribution of the green development index indicates a significant gap in green development levels among provinces. While the polarization phenomenon has weakened, provinces with high levels of high-quality economic development continue to lead in green development. Similarly, the narrowing distribution of the openness development index indicates significant developmental gaps among provinces. While the polarization phenomenon persists, the number of peaks has decreased over time, indicating a weakening polarization trend. Provinces with advanced economic development still exhibit higher openness development. The distribution of sharing development levels has narrowed, indicating a gradual reduction in the gap between provinces with lower levels of sharing development. Provinces with lower levels of shared development are gradually approaching the mean, while those with higher levels of high-quality economic development still lead. Despite some polarization, indicating differing development levels among provinces, the overall trend suggests a narrowing gap in sharing development.
Figure 2.
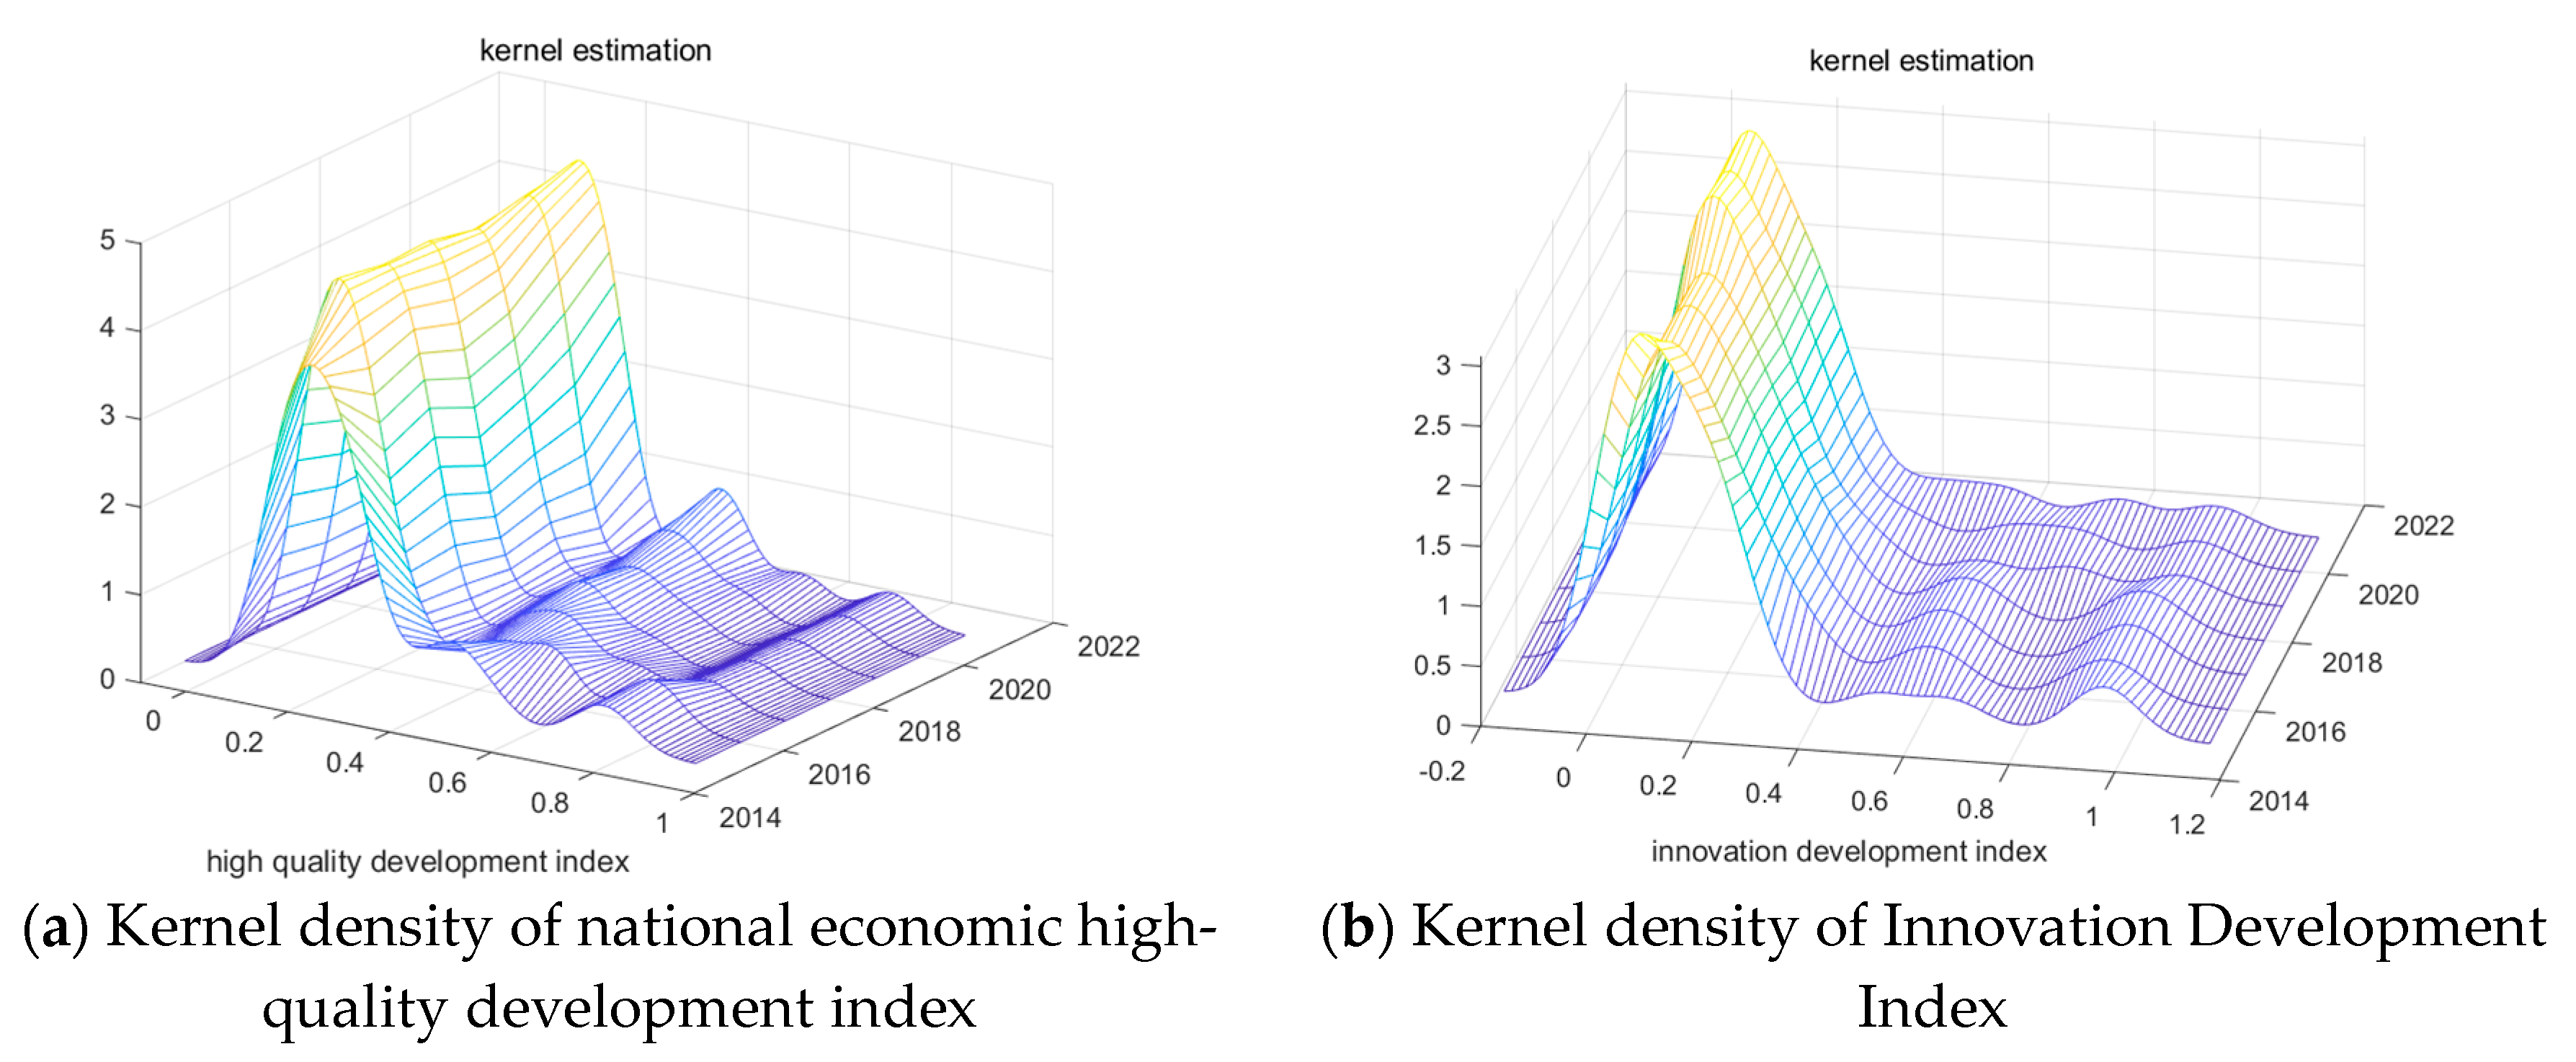
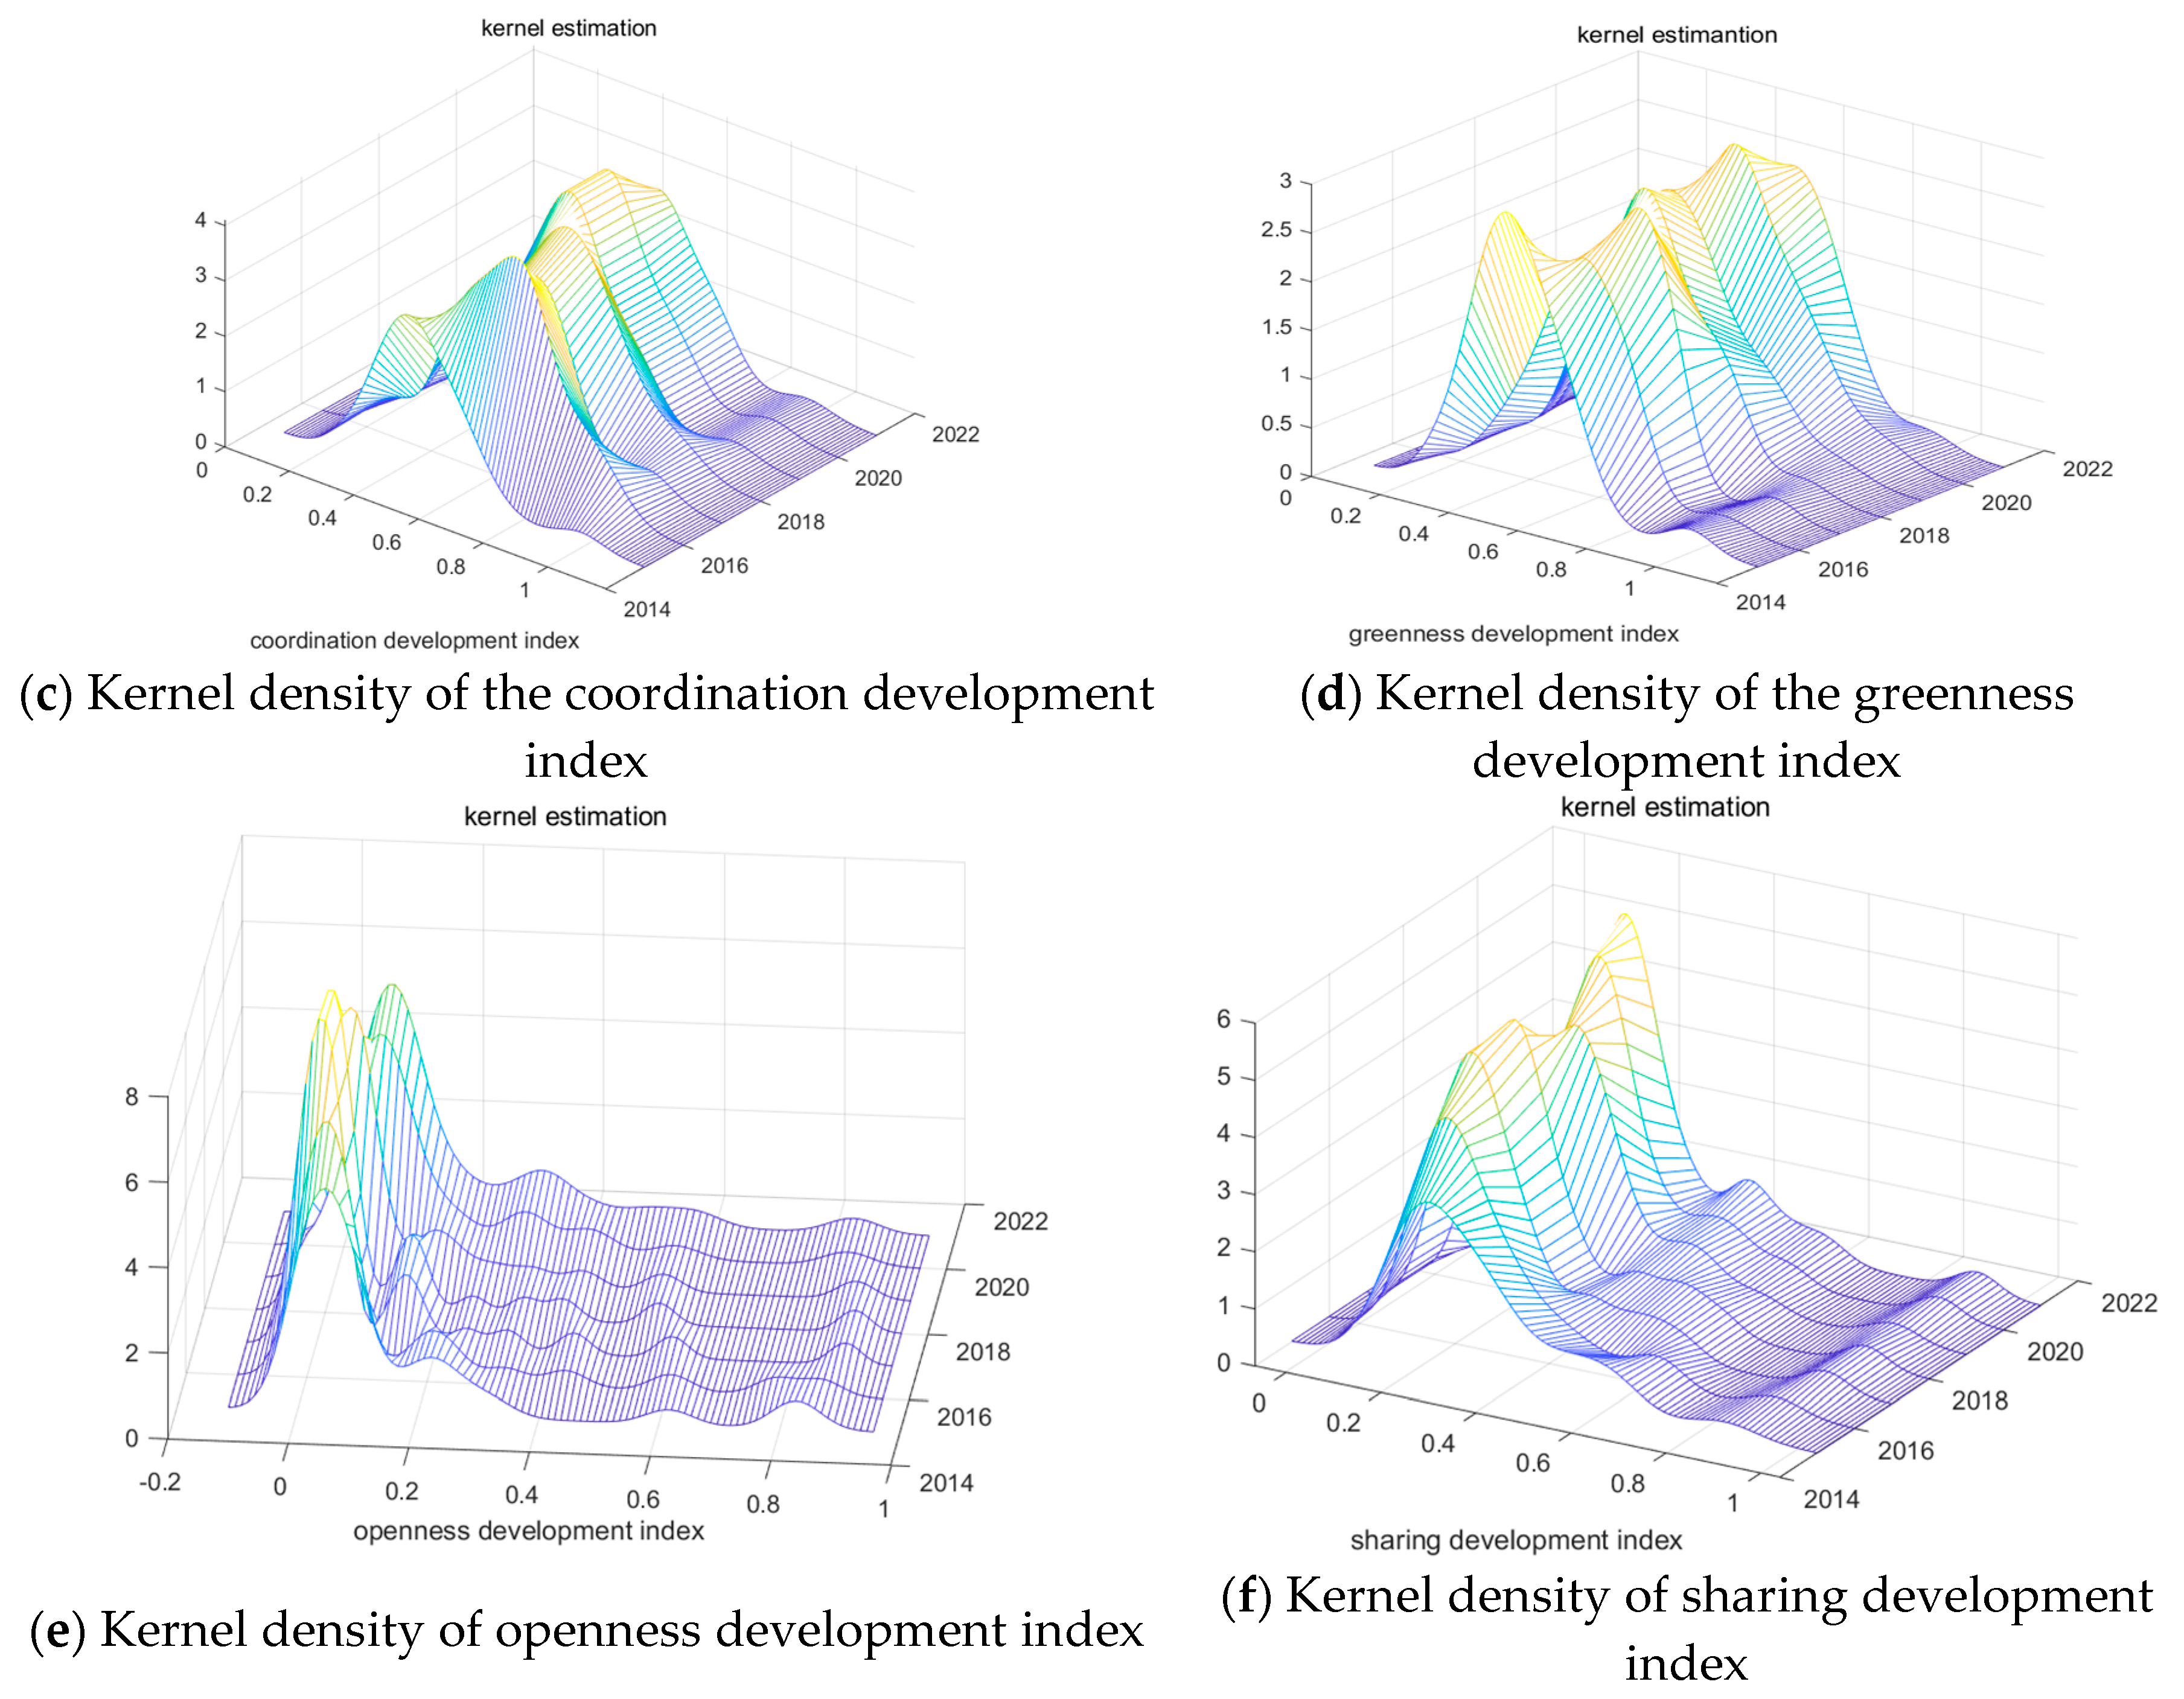
Table 5.
Distribution and dynamic evolution characteristics.
| Categories | Distribution Location | Main Peak Distribution Pattern | Distribution Extensibility | Polarization Phenomenon |
|---|---|---|---|---|
| High-quality development index | right-shift | Peak rise, The width narrows |
Right trailing, Extension widen | Polarization, with three peaks observed in most years |
| Innovation | right-shift | The peak value first decreases, then increases and then decreases, The width narrows |
Right trailing, Extension narrows | Polarization, with three peaks observed in most years |
| Coordination | right-shift | The peak value first rises, then falls, then rises and then falls again, The width narrows |
Right trailing, Extension widen | No polarization phenomenon |
| Greenness | right-shift | The peak value first decreases then rises, then decreases, and then rises again, The width narrows |
Right trailing, Extension widen | Polarization phenomenon weakened |
| Openness | right-shift | The peak value first rises, then decreases, and then rises again, The width narrows |
Right trailing, Extension widen | Polarization, with three peaks observed in most years |
| Sharing | right-shift | The peak first value rises, then decreases, and then rises again, The width narrows |
Right trailing, Extension narrows | Polarization, with three peaks observed in most years |
5. Conclusions and Recommendations
This study utilizes factor and cluster analyses to conduct a sub-evaluation and comprehensive evaluation of the HQED of China’s provincial economy. The findings reveal that China’s HQED in the five aspects of innovation, coordination, greenness, openness, and sharing has achieved certain results. However, the economic development of the provinces is still uneven, uncoordinated, and insufficient. Significant differences were observed in the level of economic development among the provinces, with the eastern region outperforming the central, western, and northeastern regions. To promote HQED in China, the following policy recommendations are based on the characteristics of high-quality economic development in each province.
1) Improved level of innovation development
The empirical analysis results indicate that the level of innovation development in various provinces of China is uneven, with Guangdong Province ranking first with the highest level of innovation, while Henan Province ranks fifth with significantly lower scores. Other provinces also scored below Henan’s 0.63 points on the innovation common factor. China’s transition from rapid high-quality development has increased its dependence on external factors, including rising labor costs. First, it is crucial to fully leverage the leading role of technological innovation centers, such as Guangdong and Jiangsu. Second, increasing innovation investment in innovation, particularly in strategic emerging industries represented by big data such as artificial intelligence, the Internet of Things, and cloud computing, is essential. Third, efforts should be made to cultivate multilevel innovative talent and optimize the human capital allocation system. This can be achieved by implementing measures to attract talent and integrating multilevel talent resources across different levels and regions. Fourth, active promotion of technological innovation is vital, fostering effective cooperation among government agencies, enterprises, and universities to ensure the coordinated development of production factors and innovative resources.
2) Strengthening the coordinated development of urban and rural areas
Coordinated development is essential for sustainable and healthy economic development. To achieve this: First, the coordinated development of urbanization with a multilayered structure must be implemented. Additionally, a multilayered urban system with regional central cities, local central cities, and small towns at its core should be established according to the situation of each region. Second, through the spatial agglomeration effect of innovative and new industries, the region’s economic development must be promoted, and the economic growth of other regions must be radiated. The radiation and diffusion of multiple regions with a high level of high-quality regional development positively influence the mode of production, production behavior, and production layout of the surrounding regions. Third, the barriers between urban and rural areas must be broken. According to the different functions of urban and rural areas, a proper division of labor must be carried out, forming a regional community of interconnected, mutually supportive, and dependent urban and rural areas.
3) Enhancing China’s economic sustainability and driving China’s economic growth with green total factor productivity
Green development is crucial for promoting individuals’ well-being and improving living conditions. First, the concepts of green development and technology were applied to support every aspect of social production and reproduction. These include green design and production. Second, to enhance the level of comprehensive utilization of resources, the mode of economic development from rough to intensive, and the mode of production from high pollution and high consumption to low emission and low pollution clean. In addition, the resource recycling technology can be comprehensively utilized to realize green production and form a high-quality supply. Third, environmental protections must be strengthened by implementing measures such as bolstering nature reserves, and urban forests, and restoring wetlands with ecological functions.
4) Enhancing reform and opening up and establishing a new situation of comprehensive reform and opening-up
The promotion of regional economic prosperity and development through openness involves several key strategies: First, provinces should constantly strengthen their cooperation with neighboring developed countries and provinces to facilitate the convergence of international and domestic markets. This includes reducing barriers to market integration and fostering organic integration between the global and Chinese economies. Second, all provinces should actively engage in the construction of international and regional areas along the “One Belt, One Road” route. By participating in initiatives such as the construction of free trade zones, provinces can seize opportunities for integration into the global economy and capitalize on economic globalization. Third, provinces should proactively expand their domestic and overseas market channels to promote economic globalization. By strengthening the construction of open platforms such as bonded zones, free trade zones, export processing zones, and ports, they train and import high-level domestic and foreign talent.
5) Improving the system of ensuring individuals’ livelihoods and achieving shared development
The ultimate goals of economic and social development are aligned to achieve shared prosperity. First, efforts should be made to narrow the income gap between urban and rural areas, reducing spatial differences in regional development, establishing a fair and reasonable distribution system, and reflecting on the superiority of socialist systems. Second, we should concentrate our efforts on carrying out basic, inclusive, and bottom-line livelihood projects, providing services in areas such as healthcare, education, and public service supply, and consolidating the system to improve individual livelihoods. Third, the government must promote poverty alleviation, social security, common prosperity, and inclusive development among all provinces.
6. Patents
Author Contributions
L.Y.: Methodology, Literature review, Writing—Original draft preparation, Investigation. X.B: Conceptualization, Software, Policies, Supervision, Validation, Writing—Reviewing and Editing. X.S.: Visualization, Data curation. All authors have read and agreed to the published version of the manuscript.
Funding
This paper was supported in part by the Social Science Foundation of Liaoning Province under Grant (L21BJY009).
Institutional Review Board Statement
Not applicable.
Informed Consent Statement
Not applicable.
Data Availability Statement
The datasets used during the current study are available from the corresponding or first author on reasonable request.
Conflicts of Interest
The authors declare that they have no known competing financial interests or personal relationships that could have appeared to influence the work reported in this paper.
References
- Qashou, Y.; Samour, A.; Abumunshar, M. Does the Real Estate Market and Renewable Energy Induce Carbon Dioxide Missions? Novel Evidence from Turkey. Energies 2022, 15, 763. [Google Scholar]
- Samour, A.; Pata, U.K. The impact of the US interest rate and oil prices on renewable energy in Turkey: a bootstrap ARDL approach. Environ. Sci. Pollut. Res. 2022, 29, 50352–50361. [Google Scholar] [CrossRef] [PubMed]
- Guan, H.; Zhang, Y. Measurement and Evaluation of the Coupling Coordination of Environmental Regulation and High-quality Economic Development. Ecol. Econ. 2022, 38, 169–176. [Google Scholar]
- Yue, X. National Capacity and Economic Development—Rethinking Based on the Goal of High-quality EconomicDevelopment. Economist. 2021, 54–62. [Google Scholar]
- Gu, W.; Wang, J.; Hua, X.; Liu, Z. Entrepreneurship and high-quality economic development: based on the triple bottom line of sustainable development. Int. Entrep. Manag. J. 2020, 17, 1–27. [Google Scholar] [CrossRef]
- Mei, L.; Chen, Z. The Convergence Analysis of Regional Growth Differences in China: The Perspective of the Quality of Economic Growth*. J. Serv. Sci. Manag. 2016, 09, 453–476. [Google Scholar] [CrossRef]
- Zhao, X.; Ma, X.; Shang, Y.; Yang, Z.; Shahzad, U. Green economic growth and its inherent driving factors in Chinese cities: Based on the Metafrontier-global-SBM super-efficiency DEA model. Gondwana Res. 2022, 106, 315–328. [Google Scholar] [CrossRef]
- Hua, X.; Lv, H.; Jin, X. Research on High-Quality Development Efficiency and Total Factor Productivity of Regional Economies in China. Sustainability 2021, 13, 8287. [Google Scholar] [CrossRef]
- Chen, S.; Chen, D. Smog pollution, government governance and high-quality economic development. Econ. Res. 2018, 53, 20–34. [Google Scholar]
- Ge, H.; Wu, F. Digital economy empowers high-quality economic development: Theoretical mechanisms and empirical evidence. Nanjing Soc. Sci. 2021, 1, 24–33. [Google Scholar]
- Luo, S.; Shi, Y.; Sun, Y.; Zhao, Z.; Zhou, G. Can FDI and ODI two-way flows improve the quality of economic growth? Empirical Evidence from China. Appl. Econ. 2021, 53, 5028–5050. [Google Scholar] [CrossRef]
- Ma, Y.; Zhang, Q.; Yin, H. Environmental management and labor productivity: The moderating role of quality management. J. Environ. Manag. 2019, 255, 109795. [Google Scholar] [CrossRef] [PubMed]
- Hua, X.; Lv, H.; Jin, X. Research on High-Quality Development Efficiency and Total Factor Productivity of Regional Economies in China. Sustainability 2021, 13, 8287. [Google Scholar] [CrossRef]
- Li, Y.; Zhong, R.; Wang, Z.; Yu, M.; Wu, Y.; Irfan, M.; Hao, Y. Would the inequality of environmental quality affect labor productivity and the income gap? Evidence from China. J. Environ. Plan. Manag. 2022, 67, 25–58. [Google Scholar] [CrossRef]
- Xu, W. Environmental Regulation and High-Quality Development in China. Scientific and Social Research. 2021, 5, 105–112http://journalsinnosciencepresscom/indexphp/ssr. [Google Scholar] [CrossRef]
- Hu, J.; Liang, J.; Tian, L.; Wang, S. Measurement and Coupling Coordination of High-Quality Development in Guangdong Province of China: A Spatiotemporal Analysis. Int. J. Environ. Res. Public Heal. 2023, 20, 4305. [Google Scholar] [CrossRef]
- Ma, X.; Xu, J. Impact of Environmental Regulation on High-Quality Economic Development. Front. Environ. Sci. 2022, 10. [Google Scholar] [CrossRef]
- Huang, X.; Cai, B.; Li, Y. Evaluation Index System and Measurement of High-quality Development in China. Rev. de Cercet. si Interv. Sociala 2020, 68, 163–178. [Google Scholar] [CrossRef]
- Wei, M.; Li, S. The Construction and Measurement of Evaluation System of China’s Economic Growth Quality under the New Normal. Economist 2018, 4, 19–26. [Google Scholar]
- Zhang, C. Measurement of High Quality Development of Regional Economy in China. Mod. Bus 2021, 20, 92–94. [Google Scholar]
- Du, J.; Zhang, J.; Li, X. What Is the Mechanism of Resource Dependence and High-Quality Economic Development? An Empirical Test from China. Sustainability 2020, 12, 8144. [Google Scholar] [CrossRef]
- Liu, R.; Guo, T. Construction and Application of the High-quality Development Index—Also on the High-quality Development of Northeast China’s Economy. J. Northeast. Univ. (Soc. Sci.) 2020, 22, 31 (In Chinese). (In Chinese) [Google Scholar]
- Yang, G.; Deng, F.; Wang, Y.; Xiang, X. Digital Paradox: Platform Economy and High-Quality Economic Development—New Evidence from Provincial Panel Data in China. Sustainability 2022, 14, 2225. [Google Scholar] [CrossRef]
- Huang, X.; Cai, B.; Li, Y. Evaluation Index System and Measurement of High-quality Development in China. Rev. de Cercet. si Interv. Sociala 2020, 68, 163–178. [Google Scholar] [CrossRef]
- Md. Nazmul Islam, Kusay Faisal Al-tabatabaie, Md. Ahasan Habib, Sheikh Sharif Iqbal, Khurram Karim Qureshi and Eid M. Al-Mutairi, Design of a Hollow-Core Photonic Crystal Fiber Based Edible Oil Sensor, Crystals 2022, 7, 101. [CrossRef]
- Chen, Y.; Zhu, M.; Lu, J.; Zhou, Q.; Ma, W. Evaluation of ecological city and analysis of obstacle factors under the background of high-quality development: Taking cities in the Yellow River Basin as examples. Ecol. Indic. 2020, 118, 106771. [Google Scholar] [CrossRef]
- Weitong, X.; Saiya, N.; Aoyang, L.; Bo, T. A Study on Spatio-Temporal Pattern and Optimization of High-Quality Development in the Pearl River-West River Economic Belt. Acad. J. Bus. Manag. 2023, 5. [Google Scholar] [CrossRef]
- Li, X.; Lu, Y.; Huang, R. Whether Foreign Direct Investment can Promote High-quality Economic Development under Environmental Regulation: Evidence from the Yangtze River Economic Belt, China. Environ. Sci. Pollut. Res. 2021, 28, 21674–21683. [Google Scholar] [CrossRef]
- Yuan, D.; Guo, J.; Zhu, C. Spatial Characteristics and Influencing Factors of the Coupling and Coordination of High-Quality Development in Eastern Coastal Areas of China. Sustainability 2023, 15, 7217. [Google Scholar] [CrossRef]
- Wan, J.; Wang, Z.; Ma, C.; Su, Y.; Zhou, T.; Wang, T.; Zhao, Y.; Sun, H.; Li, Z.; Wang, Y.; et al. Spatial-temporal differentiation pattern and influencing factors of high-quality development in counties: A case of Sichuan, China. Ecol. Indic. 2023, 148. [Google Scholar] [CrossRef]
- Zha, Q.; Liu, Z.; Song, Z.; Wang, J. A study on dynamic evolution, regional differences and convergence of high-quality economic development in urban agglomerations: A case study of three major urban agglomerations in the Yangtze river economic belt. Front. Environ. Sci. 2022, 10. [Google Scholar] [CrossRef]
- Cao, R.; Xiao, Y.; Yin, F. Spatio-Temporal Evolution of High-Quality Development and the Impact of Carbon Emissions Trading Schemes. Sustainability 2023, 15, 2900. [Google Scholar] [CrossRef]
- Chen, M.; Li, Q.; Zhang, B.; Xie, L.; Liu, J.; Geng, Y.; Liu, Z. The Spatial Correlation Network of China’s High-Quality Development and Its Driving Factors. Sustainability 2023, 15, 15738. [Google Scholar] [CrossRef]
- Zhou, T.; Ding, R.; Du, Y.; Zhang, Y.; Cheng, S.; Zhang, T. Study on the Coupling Coordination and Spatial Correlation Effect of Green Finance and High-Quality Economic Development—Evidence from China. Sustainability 2022, 14, 3137. [Google Scholar] [CrossRef]
- Zhao, M.; Zhang, R.; Liu, H.; Zhang, X.; Wang, Y. A Study on the Spatial-Temporal Evolution and Problem Area Identification of High-Quality Urban Development in the Central Region. Sustainability 2023, 15, 11098. [Google Scholar] [CrossRef]
- Yongsheng, C.; Deyuan, Z. Spatial and Temporal Differentiation Trends and Attributions of High-quality Development in the Huaihe Eco-Economic Belt. J. Resour. Ecol. 2023, 14, 517–532. [Google Scholar] [CrossRef]
- Zou, W.; Xu, L. Dynamic Development Characteristics and Driving Factors of High Quality Development Level in China’s Five Major Urban Agglomerations. Chin. Geogr. Sci. 2024, 1–15. [Google Scholar] [CrossRef]
- Zhang, J.; Yuan, J.; Wang, Y. Spatio-temporal evolution and influencing factors of coupling coordination between urban resilience and high-quality development in Yangtze River Delta Area, China. Front. Environ. Sci. 2023, 11. [Google Scholar] [CrossRef]
- Liu, T.; Zhou, B. Valuation and Obstacle Factors of High-quality Development in Coastal Cities along the Yangtze River. Ocean & Coastal Management 2023, 244, 106818. [Google Scholar]
- Wang, X.; Han, R.; Zhao, M. Evaluation and Impact Mechanism of High-Quality Development in China’s Coastal Provinces. Int. J. Environ. Res. Public Heal. 2023, 20, 1336. [Google Scholar] [CrossRef]
- Wang, X.; Han, R.; Zhao, M. Evaluation and Impact Mechanism of High-Quality Development in China’s Coastal Provinces. Int. J. Environ. Res. Public Heal. 2023, 20, 1336. [Google Scholar] [CrossRef] [PubMed]
- Wan, J.; Li, Y.; Ma, C.; Jiang, T.; Su, Y.; Zhang, L.; Song, X.; Sun, H.; Wang, Z.; Zhao, Y.; et al. Measurement of Coupling Coordination Degree and Spatio-Temporal Characteristics of the Social Economy and Ecological Environment in the Chengdu–Chongqing Urban Agglomeration under High-Quality Development. Int. J. Environ. Res. Public Heal. 2021, 18, 11629. [Google Scholar] [CrossRef] [PubMed]
- Xiao-Sheng, L.; Yu-Ling, L.; Rafique, M.Z.; Asl, M.G. The effect of fiscal decentralization, environmental regulation, and economic development on haze pollution: empirical evidence for 270 Chinese cities during 2007–2016. Environ. Sci. Pollut. Res. 2021, 29, 20318–20332. [Google Scholar] [CrossRef] [PubMed]
Figure 1.
Mean of High-Quality Economic Development.
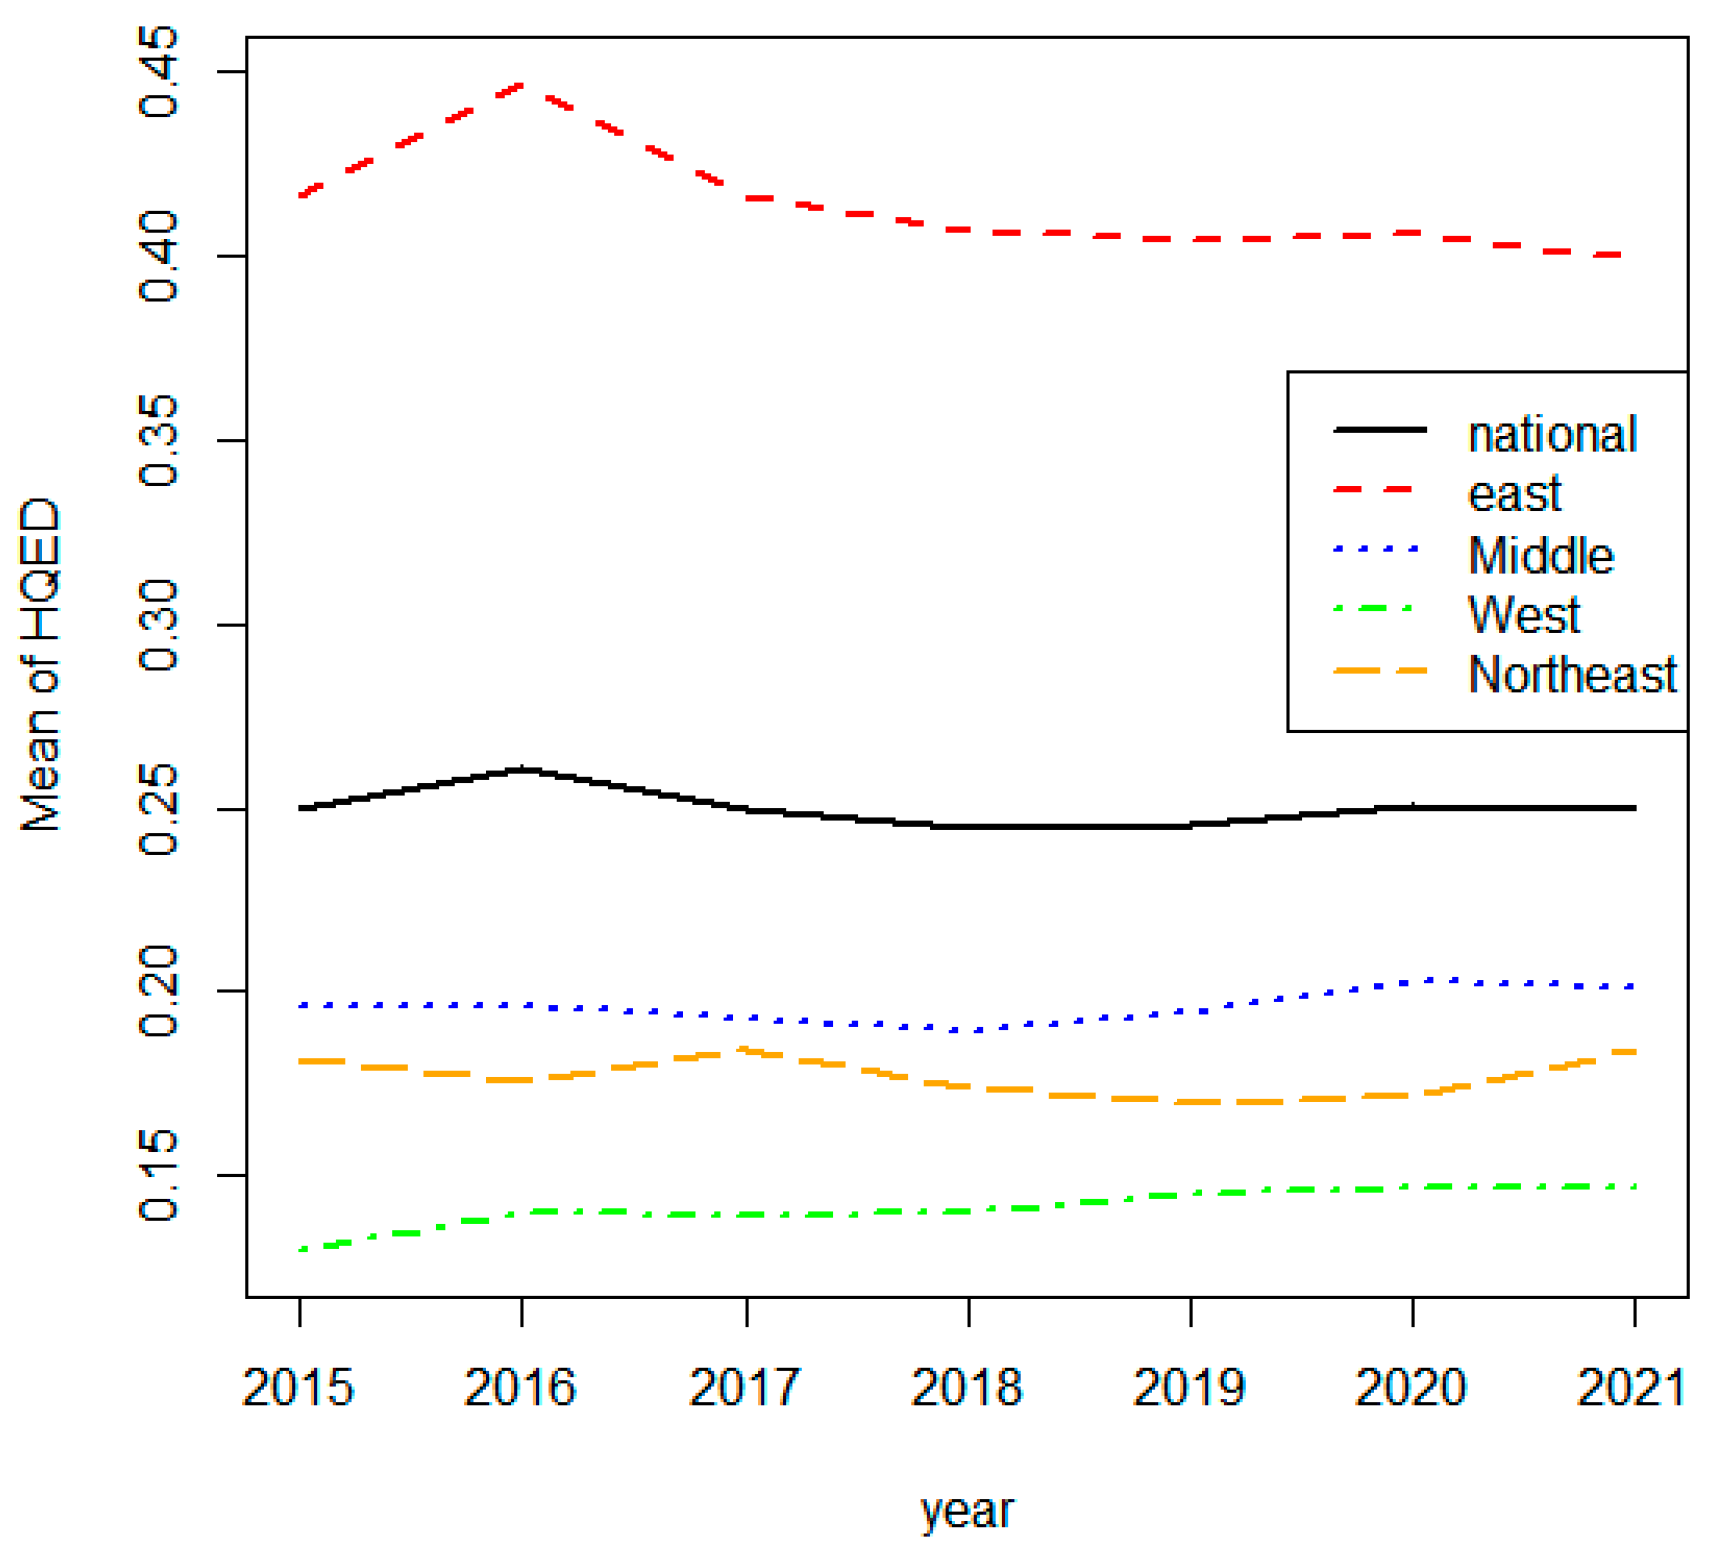
Table 1.
The indicator system of high-quality economic development in China.
| Primary Indicators |
Secondary Indicators |
Tertiary Indicators | Unit | Indicator Attributes |
|---|---|---|---|---|
| Innovation | Innovationinput | Number of R&D person A1 | person | + |
| R&D expenditure A2 | million yuan | + | ||
| Innovationoutput | The gross output value of large and medium-sized industrial enterprises A3 | billion yuan | + | |
| Number of patent applications received A4 | Individual | + | ||
| Coordination | Urban-rural coordination | The difference in per capita disposable income between urban and rural areas A5 | - | - |
| The difference between urban and rural per capita living consumption expenditure A6 | - | - | ||
| Economic and Social Coordination | The proportion of social security and employment expenditure to fiscal expenditure A7 | - | + | |
| Urban registered unemployment rate A8 | % | - | ||
| Greenness | Resource and energy consumption | Energy consumption per unit of GDP A19 | tons of standard coal per ten thousand Yuan | - |
| Electricity consumption per unit of GDP A10 | million hours/yuan | - | ||
| Ecological environment | Greening coverage rate of built-up area A11 | % | + | |
| Green Life | Public vehicles per 10,000 people A12 | Standard Vehicles per 10,000 individuals | + | |
| Urban sewage treatment rate A13 | % | + | ||
| Openness | Trade Openness | Total import/export/GDP A14 | - | + |
| Openness of Investment | Number of foreign-invested enterprises at the end of the year A15 | individual | + | |
| Foreign-invested enterprises’ total investment of A16 | million dollars | + | ||
| Sharing | Economic Achievement | GDP per capita A17 | % | + |
| General public service expenditure A18 | million yuan | + | ||
| Per capita education expenditure A19 | million yuan per individual | + | ||
| Social Achievements | Tertiary education per 100,000 individuals A20 | per 100,000 individuals | + | |
| Health technicians per 10,000 individuals A21 | per 10,000 individuals | + |
Table 2.
Results of high-quality development.
| 2015 | 2016 | 2017 | 2018 | 2019 | 2020 | 2021 | ||||||||
|---|---|---|---|---|---|---|---|---|---|---|---|---|---|---|
| Cities | Score | Rank | Score | Rank | Score | Rank | Score | Rank | Score | Rank | Score | Rank | Score | Rank |
| Beijing | 0.405 | 6 | 0.5564 | 3 | 0.5152 | 3 | 0.4995 | 3 | 0.5075 | 3 | 0.4714 | 4 | 0.4537 | 3 |
| Tian jin | 0.3192 | 7 | 0.3401 | 7 | 0.2958 | 7 | 0.2717 | 7 | 0.2443 | 8 | 0.232 | 11 | 0.2638 | 8 |
| Hebei | 0.1974 | 17 | 0.1884 | 17 | 0.1888 | 17 | 0.1897 | 17 | 0.1869 | 17 | 0.2012 | 18 | 0.1942 | 18 |
| Shanxi | 0.1368 | 24 | 0.1271 | 25 | 0.1369 | 24 | 0.1366 | 24 | 0.1356 | 25 | 0.1455 | 24 | 0.1702 | 22 |
| Inner Mongolia | 0.1517 | 20 | 0.1582 | 20 | 0.1497 | 21 | 0.138 | 23 | 0.1336 | 26 | 0.1379 | 25 | 0.1433 | 25 |
| Liaoning | 0.2501 | 9 | 0.2242 | 11 | 0.2435 | 9 | 0.2295 | 9 | 0.2152 | 14 | 0.2069 | 15 | 0.2157 | 13 |
| Jinlin | 0.1546 | 19 | 0.1572 | 21 | 0.1464 | 22 | 0.1434 | 21 | 0.1371 | 23 | 0.1482 | 23 | 0.158 | 23 |
| Heilongjiang | 0.1397 | 23 | 0.1452 | 23 | 0.1617 | 20 | 0.1482 | 20 | 0.1565 | 19 | 0.1585 | 20 | 0.1778 | 19 |
| Shanghai | 0.5102 | 3 | 0.5558 | 4 | 0.5095 | 4 | 0.4582 | 4 | 0.4433 | 5 | 0.4257 | 5 | 0.4103 | 5 |
| Jiangshu | 0.7074 | 2 | 0.7128 | 2 | 0.6312 | 2 | 0.5982 | 2 | 0.5868 | 2 | 0.5788 | 2 | 0.5713 | 2 |
| Zhejiang | 0.4287 | 5 | 0.4729 | 5 | 0.4423 | 5 | 0.4521 | 5 | 0.4676 | 4 | 0.484 | 3 | 0.4503 | 4 |
| Anhui | 0.23 | 12 | 0.2177 | 12 | 0.215 | 12 | 0.2179 | 12 | 0.2274 | 11 | 0.2472 | 8 | 0.2411 | 10 |
| Fujian | 0.2757 | 8 | 0.2813 | 8 | 0.2581 | 8 | 0.2693 | 8 | 0.2729 | 7 | 0.2737 | 7 | 0.2677 | 7 |
| Jiangxi | 0.16 | 18 | 0.1686 | 18 | 0.1666 | 18 | 0.1645 | 18 | 0.1733 | 18 | 0.1811 | 19 | 0.176 | 20 |
| Shandong | 0.451 | 4 | 0.4393 | 6 | 0.4044 | 6 | 0.3695 | 6 | 0.355 | 6 | 0.3995 | 6 | 0.4081 | 6 |
| Henan | 0.2418 | 10 | 0.24 | 10 | 0.2304 | 11 | 0.2181 | 11 | 0.2156 | 13 | 0.2262 | 13 | 0.2099 | 16 |
| Hubei | 0.2409 | 11 | 0.2543 | 9 | 0.2352 | 10 | 0.2273 | 10 | 0.229 | 10 | 0.2332 | 10 | 0.2371 | 11 |
| Hunan | 0.2069 | 15 | 0.1912 | 16 | 0.1989 | 16 | 0.2068 | 13 | 0.2321 | 9 | 0.2438 | 9 | 0.2289 | 12 |
| Guangdong | 0.7588 | 1 | 0.7595 | 1 | 0.7695 | 1 | 0.7927 | 1 | 0.7864 | 1 | 0.7661 | 1 | 0.7202 | 1 |
| Guangxi | 0.1398 | 22 | 0.1599 | 19 | 0.1617 | 19 | 0.1545 | 19 | 0.1447 | 20 | 0.1569 | 21 | 0.136 | 21 |
| Hainan | 0.143 | 21 | 0.1523 | 22 | 0.1387 | 23 | 0.1346 | 25 | 0.14 | 22 | 0.2301 | 12 | 0.1705 | 9 |
| Chongqing | 0.207 | 14 | 0.2066 | 14 | 0.2056 | 14 | 0.1997 | 16 | 0.2048 | 16 | 0.2016 | 17 | 0.2632 | 15 |
| Sichuan | 0.2085 | 13 | 0.1994 | 15 | 0.2052 | 15 | 0.2042 | 14 | 0.2234 | 12 | 0.2215 | 14 | 0.2128 | 14 |
| Guizhou | 0.1021 | 29 | 0.1154 | 27 | 0.1076 | 28 | 0.1156 | 27 | 0.1233 | 27 | 0.1255 | 27 | 0.2129 | 29 |
| Yunnan | 0.1102 | 25 | 0.1208 | 26 | 0.1282 | 26 | 0.1322 | 26 | 0.1419 | 21 | 0.1499 | 22 | 0.1077 | 24 |
| Shanxi | 0.2004 | 16 | 0.2129 | 13 | 0.2079 | 13 | 0.2022 | 15 | 0.2057 | 15 | 0.2064 | 16 | 0.1447 | 17 |
| Gansu | 0.1028 | 28 | 0.1113 | 28 | 0.0993 | 29 | 0.1004 | 30 | 0.1046 | 30 | 0.1042 | 30 | 0.2029 | 30 |
| Qinghai | 0.0843 | 30 | 0.1006 | 30 | 0.0974 | 30 | 0.1052 | 29 | 0.1179 | 28 | 0.1113 | 29 | 0.1057 | 27 |
| Ningxia | 0.1053 | 27 | 0.1072 | 29 | 0.1156 | 27 | 0.1085 | 28 | 0.1094 | 29 | 0.1118 | 28 | 0.1147 | 28 |
| Xinjiang | 0.1097 | 26 | 0.1392 | 24 | 0.1321 | 25 | 0.1411 | 22 | 0.1363 | 24 | 0.1365 | 26 | 0.1128 | 26 |
Table 3.
Results of the 2021 high-quality development.
| Innovation | Coordination | Greenness | Openness | Sharing | ||||||
|---|---|---|---|---|---|---|---|---|---|---|
| Cities | score | rank | score | rank | score | rank | score | rank | score | rank |
| Beijing | 0.322 | 5 | 0.2595 | 29 | 0.9167 | 1 | 0.2886 | 6 | 0.8409 | 1 |
| Tian jin | 0.0795 | 19 | 0.461 | 13 | 0.5872 | 9 | 0.2279 | 8 | 0.4229 | 6 |
| Hebei | 0.1366 | 13 | 0.453 | 15 | 0.5658 | 13 | 0.0663 | 17 | 0.2021 | 23 |
| Shanxi | 0.087 | 18 | 0.5505 | 7 | 0.5127 | 16 | 0.0317 | 24 | 0.204 | 22 |
| Inner Mongolia | 0.0636 | 20 | 0.4278 | 18 | 0.3426 | 29 | 0.0203 | 26 | 0.2672 | 11 |
| Liaoning | 0.1105 | 17 | 0.6134 | 3 | 0.5877 | 8 | 0.1293 | 11 | 0.1805 | 27 |
| Jinlin | 0.0411 | 23 | 0.5564 | 6 | 0.4744 | 19 | 0.0406 | 23 | 0.2282 | 17 |
| Heilongjiang | 0.0327 | 25 | 0.8699 | 1 | 0.5775 | 11 | 0.051 | 21 | 0.1342 | 30 |
| Shanghai | 0.2278 | 8 | 0.4316 | 17 | 0.4384 | 21 | 0.5143 | 2 | 0.5714 | 2 |
| Jiangshu | 0.8069 | 2 | 0.3636 | 23 | 0.6808 | 3 | 0.3574 | 4 | 0.5062 | 3 |
| Zhejiang | 0.5847 | 3 | 0.2878 | 27 | 0.6765 | 4 | 0.2726 | 7 | 0.441 | 4 |
| Anhui | 0.2304 | 7 | 0.6037 | 4 | 0.5819 | 10 | 0.0754 | 14 | 0.1864 | 25 |
| Fujian | 0.2366 | 6 | 0.2862 | 28 | 0.6174 | 7 | 0.1757 | 9 | 0.2884 | 9 |
| Jiangxi | 0.1174 | 16 | 0.458 | 14 | 0.4161 | 23 | 0.0588 | 19 | 0.2271 | 18 |
| Shandong | 0.457 | 4 | 0.3796 | 22 | 0.7374 | 2 | 0.291 | 5 | 0.3459 | 7 |
| Henan | 0.2031 | 10 | 0.4029 | 20 | 0.5124 | 17 | 0.0565 | 20 | 0.2286 | 16 |
| Hubei | 0.224 | 9 | 0.4997 | 9 | 0.507 | 18 | 0.067 | 16 | 0.2808 | 10 |
| Hunan | 0.1927 | 11 | 0.4651 | 12 | 0.6297 | 6 | 0.0689 | 15 | 0.2435 | 15 |
| Guangdong | 1 | 1 | 0.3067 | 26 | 0.4607 | 20 | 0.7571 | 1 | 0.4387 | 5 |
| Guangxi | 0.0477 | 22 | 0.5306 | 8 | 0.4016 | 24 | 0.137 | 10 | 0.1746 | 28 |
| Hainan | 0.002 | 29 | 0.4129 | 19 | 0.6697 | 5 | 0.441 | 3 | 0.1904 | 24 |
| Chongqing | 0.1178 | 15 | 0.6034 | 5 | 0.5659 | 12 | 0.0809 | 13 | 0.2482 | 14 |
| Sichuan | 0.1855 | 12 | 0.4678 | 10 | 0.4177 | 22 | 0.0857 | 12 | 0.2511 | 13 |
| Guizhou | 0.041 | 24 | 0.224 | 30 | 0.3487 | 28 | 0.0184 | 27 | 0.2067 | 21 |
| Yunnan | 0.0505 | 21 | 0.3258 | 25 | 0.517 | 14 | 0.0471 | 22 | 0.2107 | 20 |
| Shanxi | 0.1355 | 14 | 0.3841 | 21 | 0.5128 | 15 | 0.0609 | 18 | 0.3247 | 8 |
| Gansu | 0.0187 | 27 | 0.3472 | 24 | 0.3854 | 25 | 0.0143 | 28 | 0.1676 | 29 |
| Qinghai | 0.0014 | 30 | 0.6231 | 2 | 0.2485 | 30 | 0 | 30 | 0.2189 | 19 |
| Ningxia | 0.0128 | 28 | 0.4658 | 11 | 0.3598 | 27 | 0.0096 | 29 | 0.1849 | 26 |
| Xinjiang | 0.0316 | 26 | 0.4513 | 16 | 0.3681 | 26 | 0.0248 | 25 | 0.2563 | 12 |
Disclaimer/Publisher’s Note: The statements, opinions and data contained in all publications are solely those of the individual author(s) and contributor(s) and not of MDPI and/or the editor(s). MDPI and/or the editor(s) disclaim responsibility for any injury to people or property resulting from any ideas, methods, instructions or products referred to in the content. |
© 2024 by the authors. Licensee MDPI, Basel, Switzerland. This article is an open access article distributed under the terms and conditions of the Creative Commons Attribution (CC BY) license (http://creativecommons.org/licenses/by/4.0/).
Copyright: This open access article is published under a Creative Commons CC BY 4.0 license, which permit the free download, distribution, and reuse, provided that the author and preprint are cited in any reuse.


