Submitted:
12 April 2024
Posted:
12 April 2024
You are already at the latest version
Abstract
This article summarizes the results of a research conducted to create an intelligent platform supporting small farmers growing vegetables. In Bulgaria, many farmers use relatively small areas for their production. Considering this situation, the platform is designed for regional use, trying to make maximum use of the specific climatic features of the monitored microdistrict. Consequently, special attention is paid to the possibilities of adapting the platform to the specific environment in which the observed plants grow. Thus, the platform is implemented as an agent-oriented system providing needed flexibility. The core of the platform is a personal assistant, which is responsible for tracking the vegetation cycle of the monitored crop and, upon detection of anomalies, preparing warnings to the farmer. The general architecture of the platform is also presented. In a distributed knowledge base, agriculture-specific knowledge are stored. Furthermore, a standardized interface for receiving data from the sensor networks located in the production areas is briefly described. Currently, the platform is being tested for monitoring four varieties of tomatoes grown on the territory of the national research center for potato breeding. Special attention is paid to the measurements carried out. Conclusions have been drawn that will help improve the platform.
Keywords:
smart agriculture
; software platforms
; personal assistant
1. Introduction
The agricultural sector is undergoing a period of rapid transformation, driven by climate change, demographic and migration flows, and uneven economic growth [1]. Digitalization can help the agricultural sector increase crop yields while contributing to the fight against climate change. Farmers cannot always access accurate information that will allow them to manage agricultural activities successfully and efficiently. Approaches using artificial intelligence, enhanced with emerging technologies such as the Internet of Things (IoT), cyber-physical-social systems, big data, and machine learning provide new opportunities for agriculture.
At the core of smart farming lies the need to obtain accurate data from a variety of sources equipped with a plethora of measuring devices. Various IoT components are therefore an integral part of smart farming platforms. The paper [2] presents a scalable digital data platform that is focused on enhancing the value to small business owners. A model has been developed to generate data specific to fruit and vegetable production in Andalusia (Spain). The digital platform called farmdata connects to several regional, national, public, and private databases, aggregating data and providing decision-making tools. In smart agriculture, large amounts of data are collected from various sources such as wireless sensor networks, networked weather stations, surveillance cameras, and smartphones. These data represent valuable assets to be used in data-driven services and decision support systems in agricultural applications. A platform approach considering various requirements for seamless integration, processing, and use of farm data is proposed in [3]. These requirements in a smart farming platform include interoperability, reliability, scalability, real-time data processing, security and privacy, and standardized regulations and policies. According to [4], a platform is a middleware that enables different IoT devices to work together. A platform is a piece of software that works as a kind of "glue" to combine platforms and orchestrate capabilities that connect devices, users, and applications/services in a "cyber-physical" world. This paper proposes an IoT architecture connecting five IoT devices to improve wine production. In [5], an Internet of Things (IoT) multi-sensor system for agriculture is described consisting of a soil probe, an air probe, and a smart data logger. The main objective of the study presented in [6] is to design and implement a flexible IoT-based platform for remote monitoring of agricultural farms of different scales, allowing continuous data collection from different IoT devices. A flexible approach and technical aspects of four layers are applied: a truss perception layer, a sensors and actuators layer, a communication layer, and an application layer. In [7], a monitoring and control framework is proposed for the design and deployment of IoT systems. The use of the framework in a real smart farming scenario is demonstrated.
Smart agriculture technologies generate many spatial and temporal data streams that, when analyzed, can reveal several issues regarding farm productivity and efficiency. In this context, anomaly detection can help identify observations that deviate from the norm. Adapting an anomaly detector into an ensemble of selective combination of outliers is proposed in [8]. A DeepAnomaly algorithm combining deep learning and anomaly detection that exploits homogeneous field characteristics is presented in [9].
Counting objects in images has been studied extensively, particularly with the advent of deep network models. Existing counting models typically output point estimates of the number of objects in given images. However, none of them can provide a reliable quantification of the uncertainty of the resulting count estimates, which is critical for subsequent decision-making in the adoption of these count models in real-world applications. In [10], a new deep counting model within a Bayesian framework is proposed. The focus is specifically on plant census, which plays an important role in AI-enhanced agriculture, for example crop yield estimates and farm management.
In all regions of the world, more and more efforts are being made to digitize the agricultural sector and transform it into the so-called smart agriculture. A wide range of smart agriculture initiatives are now in development. The FaST (Farm Sustainability Tool) project [11] intends to create an agriculture platform that will provide digital services to assist European farmers and agencies in improving their respective capacities across a wide range of agricultural, environmental, and sustainability-related activities. This project is financed by the European Commission's "Agriculture and Rural Development" Department, the EU Space Programme, and the EU ISA Programme [12,13]. It is envisaged that adopting the platform will minimize the administrative load on farmers and agencies while also improving and streamlining communication between farmers and public entities. The platform's development also seeks to establish the groundwork for a full digital ecosystem for sustainable farming.
The Farm21 platform [14] offers field solutions that ensure constant and up-to-date data from sensors, soil, crops, weather, and satellites. Data on real-time water management, disease pressures, weeds, and growth cycles can be acquired. The platform identifies trends, correlations, and hazards to help users make better decisions about irrigation, fertilization, protection, sowing, and harvesting. It is possible to construct unique trays based on the crops observed. The Farm21 platform includes interfaces for integrating with other platforms. It also includes an intelligent assistant that can be programmed to notify farmers of potential issues.
The globe today is facing difficulty in providing water, energy, and food for all: limited natural resources and the environment are being exploited, while demand for fresh water, agricultural products, and energy is rising. Climate change exacerbates inequalities in the distribution and access to water, electricity, and food. The Water, Energy, and Food Security Resource Platform is an independent information and facilitation platform created as part of the "Nexus Regional Dialogues" global program, which is being implemented by Deutsche Gesellschaft für Internationale Zusammenarbeit (GIZ) GmbH and co-funded by the Federal Ministry of Economic Affairs, Cooperation, and Development and the European Union. We are aiming to incorporate the Nexus (The Water, Energy & Food Security Resource Platform)[15] debate on water, energy, and food security into high-level regional policy discussions and investment decisions.
The FAO (Food and Agriculture Organization) Regional Office for Africa is building a regional technical platform [16] to enable stakeholders and partners to share expertise, best practices, and lessons learned on shared agricultural policies and practices, as well as to boost collaborative efforts. The goal is to increase production efficiency in order to promote nutrition, save the environment, and, eventually, provide a better living for the population.
The CGIAR Platform for Big Data in Agriculture [17] aims to use big data to accelerate and increase the effect of international agricultural research. The platform intends to boost the impact of agricultural development by utilizing big data methodologies to solve development challenges more quickly, effectively, and on a bigger scale than previously.
Nuru [18] is a mobile AI assistant for farmers that runs on a regular smartphone and can properly diagnose cassava problems offline, even without an internet connection. It has been included in the CGIAR platform. Nuru's AI consists of three components: expert-level crop disease diagnosis using computer vision, anomaly detection and prediction based on ground and satellite data, and human language understanding and automated responses to farmer questions.
The platforms outlined above, which were developed with significant finance, are intended to answer larger global smart agriculture issues. They can be effectively used by large farmers with vast tracts of land. These systems primarily use and analyze information derived from satellite imagery.
Agriculture is a sector of particular importance for Bulgaria. For our region, it is also becoming more and more urgent to look for new opportunities for efficient use of fresh water, optimal loading of the environment with chemicals and pesticides, and preservation and increase of yields in the changing climatic conditions. Two years ago, a national scientific program “Intelligent Agriculture” was launched. According to the program, an infrastructure for intelligent agriculture is being developed. The infrastructure is built on two levels – local and regional. At the local level, three sensor networks are created, positioned in an open wheat plot, a tomato greenhouse, and a cow pasture. At the next higher level, a regional data center is being built and deployed over a server cluster. In the future, it is planned to build a national data center deployed on a supercomputer. The functionality of this infrastructure is being tested in a pilot project for the region of Plovdiv city. Plovdiv is one of the most important centers for agricultural production. In addition, the city is home to some of the largest universities for the training of agricultural and IT professionals.
This paper presents a smart farming platform known as ZEMELA. The platform is deployed on the infrastructure mentioned above. Unlike other platforms discussed, ZEMELA is a regional platform designed mainly to support small farmers growing vegetables and fruit. In Bulgaria, the producers of vegetables and fruits (in contrast to the producers of wheat, corn, and sunflower) are mainly small and medium-sized farmers, operating on relatively small areas, and this production receives insufficient financial support by the state. For this reason, we pay great attention to the platform's ability to adapt to the specific farm.
The second feature of the platform is our understanding that the farmer should be directly involved in the management of agricultural processes. Although the farmer remains at the heart of agricultural data collection, there is still little focus on putting farmers at the centre of platforms. Accordingly, the core of the platform is an active component operating as a personal assistant to farmers when interacting with the platform. The main function of the personal assistant is to detect and pinpoint various anomalies, promptly notifying the farmer of their occurrence. These can be deviations in the different phases of the vegetation of vegetables, signs of pest infestation, and symptoms of diseases. Given the regional focus of the platform, it is crucial to effectively tailor the personal assistant for monitoring based on the unique characteristics of the observed vegetable type and the specific environmental conditions of the area. To achieve this goal, special attention is paid to observations and conducted experiments, the results of which are summarized in this article.2. Development of the platform
The platform was developed as a cyber-physical-social system [19], the core of which is a personal assistant supporting farmers.
2.1. Architecture of the Platform
ZEMELA consists of five basic components (Figure 1.), which will be briefly presented here.
Personal Assistant (PA). The core of the platform is a PA that operates as a specialized interface between the platform and agricultural specialists and farmers. The main task of the PA is to monitor the normal course of certain agricultural processes such as the vegetation of crops and when anomalies are identified, the PA has to notify farmers and assist them in the preparation of preventive, diagnostic, or compensatory activities.
Event Engines (EEs). The responsibility of the second type of module named Event Engines is mainly to support the PA in detecting anomalies in the vegetation of crops. The theoretical ground for identifying anomalies is the so-called event model, according to which the various agricultural processes can be modeled as a sequence of events [20]. The EEs serve as specialized interpreters that analyze the acquired data to reveal patterns -indicating the occurrence of specific event. Events encompass various types, including domain events like the progression of plants through phases of development and emergency events such as diseases.
Agriculture Data and Knowledge Center (ADK Center). This center serves as the central repository of knowledge and data for the platform. It consists of two main components. The first component is a distributed knowledge base in which theoretical knowledge about agriculture is stored and managed. This knowledge encompasses information about “natural artifacts”, includingcrops and the factors affecting their vegetation such as soil quality, air conditions, and water availability. In addition, knowledge is stored about “artificial artifacts” – these are irrigation systems, sensor networks, ventilation systems, and others. The third type of stored knowledge is about farming activities and events occurring in farming scenarios and settings. The knowledge is stored in mutually integrated ontologies, frames, and rules. Some of the currently implemented basic ontologies for agriculture are presented in [21]. Knowledge bases modeling agricultural knowledge in the form of rules and frames are described in [22]. The second part consists of relational databases and NoSQLs for storing various data on agricultural crops and the processes taking place in them. The databases correspond to knowledge bases. In this way, four so-called “natural databases” are being developed – a database of agricultural crops, a database of air, a database of soil, and a database of water. In addition, the so-called “artificial database” is being built to store data about artificial artifacts such as irrigation installations, sensor networks, ventilation installations, and others. Furthermore, data is considered both static and dynamic. Special databases store the dynamic data arriving from the physical surrounding world, usually from the sensor networks installed in outdoor plots and greenhouses. The ADK Center also provides tools for receiving, storing, and processing a large volume of structured, semi-structured, and unstructured agriculture data.
Agriculture Models Library (AML). The AML is an extension of the ADK Center supplying various agricultural models that support the work of the PA. For example, when making a certain decision, the PA can take into account the results obtained from processing a certain model. The main modeling approach used in this library is based on DEVS (Discrete Event System Specification). DEVS [23] is a general modeling and simulation formalism dedicated to the dynamic discrete events system. DEVS modelling of an irrigation system is presented in [24].
Guards. The Guards operate as an interface between the virtual and the physical worlds. The guards serve to transform and transmit data between the two worlds. The physical world is an IoT Node Network that can collect up-to-date information on the “situation on the ground”, i.e., sensory data from the observed open and closed agriculture areas (for example, greenhouses). Considering the varying climatic conditions and terrain, particularly in open areas, a broader array of sensor network devices is required. The support network will be constructed from interconnected static devices such as sensors, actuators, and controllers. Communication between the separate IoT Nodes is mainly implemented on a public Internet and private LoRaWAN network [25].
Briefly, we will present the interaction between the individual components of the platform. Some of the activities are described in more detail in the following section. The farmer interacts with the platform through the personal assistant (1). The farmer records observations about the current state of the observed plant into the ADK Center (2). The knowledge base designer inputs basic agricultural knowledge (in this case, for tomato cultivation) into the ADK Center (3). Current data from the sensor networks are obtained from the guards and stored in the ADK Center (4). The personal assistant extracts the necessary information for its work from the ADK Center (5). The Event Engine, utilizing the current sensor data (6), assists the personal assistant in identifying various events, including anomalies (7). The personal assistant can activate models, the results of which can be used in decision-making (8).
Implementation of the ZEMELA platform. The Platform includes various types of software components. To facilitate the implementation process, we explored the option of using technology involving homogeneous development tools, which proved to a very challenging task. However, we have configured an integrated technology including development tools operating on JVM (Java Virtual Machine) (Figure 2.). As we have already mentioned, in the ADK Center repository, knowledge specialized for agriculture is modeled as ontologies, rules, and frame structures. We use the Protégé environment [26] to develop the ontologies and Win-Prolog [27], Flex [28], and VisiRule [29] for the rules and frames. The structured data is stored in the relational database PostgreSQL [30] and the unstructured and semi-structured data is in MongoDB NoSQL [31].
The PA implementation is supported by the JaCaMo framework [32] that combines three separate technologies, each of them being well-known on its own and developed for many years so they are fairly robust and fully-fledged. JaCaMo is a combination of:
- Jason – for programming autonomous agents using the agent-oriented language AgentSpeak [33];
- Cartago – for programming agents’ environment based on a model known as Аrtifact-Аction (АА) model [34];
- Moise – an organizational model for multi-agent systems based on notions like roles, groups, and missions.
2.2. Personal Assistant
2.2.1 Architecture and Life Cycle
The PA is a central component of the platform, which is responsible for the identification and location of anomalies in the vegetation of agricultural crops. Moreover, the personal assistant supports the farmers during their work with the platform. The general architecture of the personal assistant is shown in Figure 3. The PA is implemented as a rational BDI agent [35]. Theoretically, a BDI agent possesses the following mental states:
- Beliefs (B), which model the agent's view of the state of its environment.
- Desires (D), which present the agent's possible options.
- Intentions (I) represent the agent's goals.
- Furthermore, the agent operates according to a life cycle comprising the following two phases:
- Deliberation – in this phase, knowing the state of its environment, the agent selects an actual goal from its available desires (options).
- Means-ends-reasoning - in this phase, the agent prepares a plan to achieve the goal, usually using a library of pre-prepared plans.
In the theory of BDI agents, insufficient attention is paid to adaptation at a higher level of abstraction, although this may not be considered essential. For the development of a specialized PA in the ZEMELA platform, providing opportunities for adequate initialization and adaptation is extremely important for the correct operation of the assistant. The life cycle of our PA is represented as pseudocode in Figure 4.
Initialization. Initialization is part of the PA adaptation process for specific conditions. A plan exists to perform the initialization, which is also stored in the Plan Library. When the PA is activated for the first time to monitor the selected agricultural crop, this plan is automatically triggered. The initialization plan is detailed in section 2.2.3.
Goal selection. The PA, functioning as an intelligent agent, exhibits goal-directed behavior. The current state of the environment (beliefs) and the available options (desires) of the PA are used to determine the current goal. The goal (intention) is selected from the options. In our case, the options are grouped into different types. After completing the adaptation during the initialization, the current beliefs and desires for the observed plant are determined. To start the actual monitoring, the option type “monitoring_vegetation” is usually selected following initialization.
Plan selection. After the current Intention of the PA is specified, the PA must select a suitable plan of action. Planning depends on the option selected to become the current intention of the PA. For each option type, a base plan is implemented and saved in the Plan Library. Depending on the type of option selected as the current intention, the corresponding base plan is accessible. This plan can be updated depending on actual beliefs.
Execution of a plan. Typically, plan implementation requires additional time, or running plans have to be changed. For these reasons, supporting plan implementation is not a trivial task and is specified as a separate step. For greater flexibility, it is important to use different options for structuring plans – sub-plans, partial, cyclical, and branched. During the normal vegetation course , it can simply inform the farmer about the values of desired parameters. When an anomaly is detected, there are several possibilities. The PA maintains its own internal plan library from which it can select a ready-made plan or adapt a genetic one. Another option is for the PA to activate components from the platform, e.g. AML to run a particular model.
For the plans to be executed correctly, it is essential to have reliable and precise control values of the used parameters. Thus, the measurements presented in the next point are extremely important.
Furthermore, for better clarity, the data used by the PA are categorized into two main groups:
- Control numbers (cn) – these are different threshold (limiting) values, the reaching of which enables the PA to draw different conclusions. Examples include limit values of heat units (DD) for passing to the next phase, or expected vegetation parameters of the monitoring plant. These values are stored in ADK Center ontologies. Since specific measurements for past periods are unavailable, the control numbers were initially determined using literature sources (for areas with similar climatic conditions). Currently, these numbers are being updated based on the measurements made in the Plovdiv area and their analysis is presented in the next section.
- Current values (cv) – these represent the actual values of parameters at a given time. Meteorological data required for monitoring the individual phases of vegetation, are obtained from sensor networks through the guard system. The parameters of the observed plant (such as stem diameter, number of leaves, etc.) are input by farmers through a user interface.
Interaction of the PA with other components of the platform is integral to its overall functioning. The PA is responsible for the overall functioning of the platform and therefore its interaction with other components is essential. From the perspective of the PA, the other components of the platform are its environment, which it interprets as artifacts. The personal assistant can monitor these artifacts and take note of changes in their states. In this way, the following system events can be useful:
- Creating (generating) a new artifact in the surrounding environment of interest to the PA.
- Updating an existing artifact.
- Deleting an existing artifact in the surrounding environment that is no longer of interest to the PA.
Before introducing how the PA executes selected plans from the library, let us examine mental states and their role in the assistant's operational activity.
2.2.2. Mental States
Representing the PA's environment as its Beliefs: in principle, the PA views its environment as consisting of artifacts, whose state it can perceive and, if necessary, interact with. Beliefs (B) of the PA include the following three operational structures:
- Vegetation Control Table (VCT) – this structure serves as a guide for the PA’s operations. Entries in the table describe the vegetation phases of the observed plant. Each record describes a single phase, including parameters such as identifier, start time, expected duration, and control number of DD. Using this table, the PA orients itself to the current phase of the plant’s vegetation .
- Estimated State Table (EST) – it presents the expected state (parameters) of the monitored crops. The entries in this table have a one-to-one correspondence with the entries of the VCT. The entries in the EST contain information about the expected state of the plant for the corresponding vegetation stage. Each record consists of a phase identifier and an expected state of the observed plant. In our case, the plant’s state is characterized by parameters such as height, diameter of the stem, and number of leaves.
- Current State Vector (CSV) – the structure is identical to an EST record that stores the current real state of the monitored plant and is dynamically changing as vegetation progresses over time. The CSV data is input by farmers through a user interface following appropriate measurements.
The rest of the platform components are also part of the PA environment; the way of interaction and control is different. While the first two structures (VCT and EST) are fully controlled by the PA, control with the rest of the platform components is shared – e.g. in CSV, guards can write, while the PA can only read. Usually, the PA can only select data from ADK Center, while knowledge input and update is done by the system administrator.
Representing the PA’s desires and intentions. The PA has various desires (options) that can change during the life cycle. The options are grouped into types containing one or more particular options. Below are the main types of options used in the current version of the PA:
- D0 = {select_crop} – a single option that is available before agent initialization.
- Dmv = {mv_germination_and_early_growth, mv_vegetative_period, mv_flowering_phase, mv_flowering_phase, mv_early_fruiting, mv_mature_fruiting} – a group of options that allow the PA to be activated to track individual vegetation phases.
- Danom = {anomaly_detected} – upon detection of anomalies, the PA uses this option to react by triggering a corresponding plan.
The select_crop option defaults to the starting intention I0 of the PA. Depending on the events occurring during the monitoring process, the PA selects its current goals from the set of possible options.
2.2.3. Plan Library
The PA plan library stores one or more base plans for each option type. These plans can be parameterized depending on the specific conditions. Here we will present three main plans for the agent's work.
The first plan is Initialization. The PA always has one initial intention by default (I0 = select_crop) that must be satisfied in this phase. During initialization, the PA establishes a connection with the ADK Center to retrieve the necessary information from the ontologies and generates the initial state of two of its environment tables (VCT and EST). Once initialized, these two structures remain static; they do not change their contents. The data in them are used as control numbers.
The second plan is designed to track the phases of vegetation. Tracking the phases of vegetation is necessary for the PA to reference the current records in VCT and EST. This enables the PA to understand the characteristics of the current phase and, accordingly, the control numbers of the plant parameters associated with that phase. In the current version of the PA, the transition to the next phase is guided based on the concept of heat units. When the expected limit values (control numbers) are reached, the PA assumes that the plant has passed to the next phase. Accordingly, the current intention of the PA becomes the monitoring of this new phase. The concept of heat units or degree days (DDs) was first introduced in 1868 by Daniel Putnam, an American agricultural scientist who was working on ways to improve crop yields. He observed that the growth and development of crops were closely related to temperature and proposed the idea of using accumulated heat (measured in DDs) as a way to predict the timing of different growth stages. Putnam’s concept of DDs has since been refined and expanded upon by other scientists and is now widely used in agriculture to track the growth and development of a wide variety of crops, including tomatoes. DDs measure the amount of heat accumulated over time. They can be calculated in many different ways. The simplest way to calculate DD accumulation is the simple average method following the next equation:
where Tmin and Tmax are the minimum and maximum daily temperatures, respectively, and Tbase is the lower development threshold (for the tomatoes we accept 10 °C). The specific DDs required for different growth stages of crops can vary depending on their variety, the planting date, and the weather conditions. However, the approximate DDs and phase duration for tomato crops in a climate like that of the region of Plovdiv are presented in Table 1 in the following section.
DD = (Tmin + Tmax)/2 – Tbase,
We obtain the data necessary for calculating the DDs from the meteorological sensors through the guards. The data flow commences with the inception ofmeasurements conducted by devices within the sensor group (Figure 5). The recorded values are subsequently read and consolidated into a singular data package by a dedicated controller device. This controller functions as an intermediary, adapting between the diverse sensor devices, each with its specific interface, and the broader system.
At regular intervals (typically every 1 to 5 minutes), the controller transmits the data package to the Data Endpoint of the software system. Upon arrival, the data package is directed to a Data Transformation module. Its primary function is to decompose the data package into a series of individual measurements, each associated with its respective value and metric. The implementation of the Data Transformation module leverages the Node Red's Flows [36]. For every measurement, the Data Transformation module initiates a discrete REST request to the OGC's SensorThings API, which, in turn, stores the measurement in the Data Storage. The Fraunhofer IOSB implementation [37] serves as the backbone for the SensorThings API. PostgreSQL, enhanced with the TimescaleDB extension [38], serves as the designated Data Storage.
Once the data are securely stored in the Data Storage, retrieval becomes possible through a variety of SensorThings API read methods. These methods accommodate a broad spectrum of filters, allowing for meticulous customization of the retrieved data. Applications such as Grafana [39] can leverage SensorThings API read methods for monitoring, visualization, or data export. Grafana, for instance, features a convenient preconfigured data source for seamless integration with the SensorThings API.
The third plan is to identify anomalies in the vegetation of the plant under monitoring. The plan includes the following steps:
- Periodic scan of the CState structure - the EState is updated depending on the data measured by the sensors and/or observed by the farmers. This is done by the guards of the platform.
- By comparing the expected state with the actual state of the observed culture and working with the three structures, the PA can detect anomalies in the vegetation of the monitored plants. For the current phase of the vegetation, it compares the expected with the actual state and, in case of observed deviations, concludes the presence of anomalies.
- Anomaly detection - in the current version of the PA, when an anomaly is detected, a warning is prepared with a detailed description of the case for the farmer.
3. Adaptation
The experiment presented in the next section aims to help in adapting the platform for the Plovdiv region. The adaptation of the platform can be done in the following two aspects:
- Adaptation to the observed plant – this is a more complex adaptation because new background knowledge needs to be introduced into the ADK that is specific to the plant desired for monitoring. For example, such knowledge concerns the course of the vegetation cycle or features related to the nature of the plant. As the use of the platform progresses, this adaptation will become progressively easier as we will have accumulated background knowledge on different crops in the ADK.
- Adaptation to the specific area – for this purpose, we identify various parameters to characterize the area desired for adaptation. We have called the values of these parameters control numbers. By their nature, the control numbers are the expected values of the parameters. Actual values are obtained in real time from the sensor network. Through measurements, we try to refine the control numbers. The personal assistant adapts relatively easily to the control numbers. When it adapts for the specific area, it retrieves the control numbers from the ADK and incorporates them into its working structures. For example, the vegetation tracking control numbers are written into the VCT.
The measurements presented in the next section are intended to refine the control numbers for the vegetation cycle of the monitored plant (four tomato varieties) and the expected condition at the different vegetation stages. Because of the absence of control numbers for the Plovdiv region, the control numbers used by the personal assistant during the experiment for the necessary comparisons of expected and actual conditions were sourced from literature representing similar climatic regions.
4. Experimental Study and Data Analysis
Precise adaptation to the monitored area is an essential activity for the effective use of the ZEMELA platform. An empirical study was conducted on the growth of several varieties of tomato crops, grown in the open greenhouse of the Bulgarian Institute of Vegetable Crops "Maritsa", Plovdiv. The tomato cultivars studied were “Aleno surce”, “Rozovo surce”, “Rozovo siyanie” and “Dara”. The study period covers the following growth phases: Planting, Vegetative growth, Flowering, Fruit formation and Ripening. For each variety in the corresponding phase of growth, 25 separate plantations were observed, and for each of them, measurements of three main parameters characterizing the growth and development of the studied tomato varieties were recorded. The measured parameters are: stem height, stem diameter, and number of leaves formed on the plant.
4.1. Measurements to Support the Management of Vegetation Phases
The purpose of this type of measurement is to determine the DDs, based on which PA monitors the vegetation phases. The primary data used for this analysis is meteorological data. The predicted values (control numbers) used up to the moment of the measurements and the actual measured values are summarized in Table 1. The columns are as follows: the phases of the plant’s vegetation (Phase), tomato varieties (Varieties), the data when vegetation enters a phase (PhED), real accumulated DDs (ADDs), the forecast DDs interval at which the plant is expected to enter the corresponding phase (FDDs), the actual duration (ADu) and the estimated duration of the phase (FDu) in a day’s interval.
The expected values (control numbers) in the table are gained from the literature for regions with a similar climate to the Plovdiv region. The largest discrepancies between expected and actual values are observed for DD and phase duration. Еach of the phases is reached with significantly fewer DDs than expected. The actual duration of the individual phases is also significantly shorter than their expected duration. In the four phases (Planting, Vegetative growth, Fruit formation, and Ripening), real accumulated DDs do not depend on the tomato varieties. In the Flowering phase, the Rozovo surce and Aleno surce expose the same DDs, while the DDs of Rozovo siyanie are smaller and these of Dara are bigger. Regarding the duration, the values of the two varieties Rozovo surce and Aleno surce are the same in all phases. The duration of the Rozovo siyanie is significantly shorter in the Flowering phase and it is longer in the Fruit formation phase. The duration for the Dara is considerably longer in the Flowering phase and it is shorter in the Fruit formation phase.
Table 2 summarizes the results of the expected and measured parameters of the four varieties of tomatoes, which are essential for assessing their states. The expected values (control numbers) used up to the moment of the measurement are borrowed from literary sources for climatic conditions close to those in the Plovdiv region. The actual values of the parameters were measured manually by laboratory workers at the Maritsa Institute, Plovdiv. The columns of the table are as follows: the phases of the plant’s vegetation (Phase), tomato varieties measured (Varieties), the measured average height in cm (H), the expected height in a cm interval (EH), the measured average number of the leaves (LN), the expected number interval of the leaves (ELN), the measured average stem diameter (SD) in mm, and the expected stem diameter (ESD) in a mm interval.
The measured heights were different for different tomato varieties in all phases. The actual heights for all varieties exceeded the control numbers in the first phase Planting, and in the last phase, Ripening, whereas they were lower than expected in the remaining three phases. The number of leaves for all varieties was within expectations in the first three phases but exceeded expectations in the last two phases. The measured stem diameters were as expected in the first three phases, while they were significantly smaller than expected in the last two phases.
4.2. Measurements to Support the Crop State Control Values
At approximately two-week intervals during the experiment, values for stem height, stem diameter, and number of leaves were measured in a representative sample of 25 tomato plants for each of the studied varieties in the individual growth phases. The start and end dates of the experiment are 04.05.2023 and 20.07.2023, respectively, during which period the measurements were taken.
Analysis and statistical processing of the measured data were carried out to establish nominal (representative) values of the three measured parameters, as well as the permissible deviations from these values, for each variety and growth phase. The statistical processing of the data was carried out using the descriptive statistics tools, implemented in the program system IBM SPSS Statistics, version 26 [40].
Analysis of stem height, stem diameter, and leaves number data included the determination of the mean, median, standard deviation, maximum, and minimum values. A 95% confidence interval was used to determine the mean. Regarding the height and diameter of the stem, the hypothesis of normality of the frequency distributions of the measurements was investigated. For this purpose, the Kolmogorov-Smirnov and Shapiro-Wilk tests for normality of distribution were used [41], [42]. In cases of normal distribution, the mean value and the standard deviation were taken as representative values of the studied parameter for the respective phase. A frequency analysis of the measurements was employed to determine the results regarding the number of leaves . The obtained statistical results also enable us to ascertain the dynamics of development of the tomato plantations in terms of height, diameter and number of leaves of the plants during the entire period of study.
4.3. Summary of Results
The statistical characteristics of the measured data for varieties “Aleno surce”, “Rozovo surce”, “Rozovo siyanie”, and “Dara” in the five growth phases Planting, Vegetative Growth, Flowering, Fruit Formation, and Ripening are shown in Table 3, Table 4, Table 5 and Table 6, respectively.
For each of the studied parameters the mean, minimum, maximum value, and standard deviation are displayed. As a result of the statistical analysis and performed normality tests, the values in the tables are accepted as representative of stem height, stem diameter, and number of leaves characterizing the development of the plantations in the growth phases. The obtained results show a uniform development of the plantations during the first three phases of growth, while during the last two phases, an intense increase in the height and diameter of the stem is observed. From the data in the tables, it is also evident that the standard deviations from the mean values of stem height and stem diameter are highest in the last two phases of growth, and this applies to all four varieties.
The mean values from the above tables were used to track the dynamics of development of stem height, stem diameter, and number of leaves for the entire growth period. For example, the growth of the average values of stem height, stem diameter, and number of leaves in the five growth phases of the “Aleno surce” variety is illustrated in Figure 6, Figure 7 and Figure 8.
Similar data are obtained regarding the dynamics of development of varieties “Rozovo surce”, “Rozovo siyanie” and “Dara”.
4.4. Discussion of Results
The data in Table 3, Table 4, Table 5 and Table 6 show that the “Aleno surce”, “Rozovo surce”, “Rozovo siyanie”, and “Dara” varieties have similar characteristics determining their development during all growth phases. The increase in the mean values of height, diameter, and number of leaves of the stem during the first three growth phases was uniform, indicating a consistent development of the plants during these phases. The increase in the values of height and the number of leaves during the phases of fruit formation and ripening is intense, and this mostly applies to the height of the stem. In terms of stem diameter, the mean values increased almost linearly throughout the growth period. This feature is observed in all four tomato varieties.
The graphics in Figure 6, Figure 7 and Figure 8 illustrate the dynamics of the development of height, diameter, and number of leaves for the “Aleno surce” variety during the individual growth phases. From Figure 7, it is evident that the growth of the stem diameter is almost linear for the entire period. The graphs of Figure 6 and Figure 8 show an almost linear increase in the stem height and the number of leaves for the first four growth phases, while a sharper increase in the values of these parameters was observed during the last phase. The same characteristics of development are also found in the “Rozovo surce”, “Rozovo siyanie”, and “Dara” varieties.
The results in this part of the paper establish the statistical characteristics of three main parameters determining the growth and development of four investigated varieties of tomato plantations. The plants were grown in the open greenhouse of the Institute of Vegetable Crops "Maritsa", under climatic conditions typical for the region of the city of Plovdiv. The statistical results obtained were used in the development of the software platform for intelligent crop production "ZEMELA".4. Conclusions
The research contributions encompass the specification of accepted cultivation data tailored to the region and specific crop, thereby facilitating the timely detection of anomalies. An experiment involving data calibration for the Plovdiv region and tomato plants is detailed, with ongoing testing focusing on four tomato varieties at a national research center. The primary objective is to enrich the knowledge base with region-specific and crop-specific data, considering climatic characteristics and vegetation patterns, ultimately aiming to enhance yields across diverse agricultural regions.
The agricultural sector is currently experiencing a shift towards precision crop production, driven by advancements in modern technology. The developed software platform provides advanced tools to assist vegetable producers in optimizing their operations, increasing productivity, and promoting sustainability. Given the platform's focus outlined in this article, precise adaptation to the observed micro-district is crucial for its effective usability. The measurements and subsequent analysis aim to refine the control parameters stored in the platform's ADK Center, which serve as the foundation for the platform's operation.
Due to the localized nature of vegetable production and the lack of statistical information on climatic parameters and soil for small areas, literature data were utilized. An important conclusion drawn is the significant difference between the previously accepted control parameter values and the measured ones. Additionally, it was observed that certain phases of vegetation exhibit consistent measured values across tomato varieties, while others display significant differences. This newfound knowledge underscores the importance of continuing to track these trends and expanding the analysis with additional parameters, including the integration of new sensor types into existing sensor networks.
Long-term planning is crucial for deploying and adapting the platform to specific micro-districts. Preprocessing involves measuring significant parameters for at least one vegetation cycle of the observed crops to mitigate discrepancies between initially accepted and actual control parameter values. However, manual measurements of plant-related parameters are time-consuming, prompting consideration for automation using deep learning methods for imaging diagnostics, with current experiments focusing on grape arrays.
Furthermore, to effectively operate the personal assistant (PA), expanding its capabilities to identify anomalies is essential. Two new methods based on deep learning and explainable artificial intelligence are being tested for this purpose. The PA can simultaneously monitor multiple crops, with each crop generating a distinct instance of the personal assistant.
Author Contributions
“Conceptualization, S.S., V.M., L.D. and I.S.; methodology, V. T-K., S.S., E.D..; software, I.S., E.D., A.S-D.; formal analysis, V.M., I.T., D.G., S.G.; investigation, V.T-K., A.S-D., A.T., S.T..; resources, S.T., S.G., A.T.; data curation, A.T., S.G., V.T., S.T.; writing—original draft preparation, S.S., V.M..; writing—review and editing, L.D.; supervision, S.S., V.M.; project administration, S.S.; funding acquisition, L.D., D.G.
Funding
This research was funded by the Bulgarian Ministry of Education and Science under the National Research Program “Smart crop production” approved by Decision of the Ministry Council №866/26.11.2020.
Acknowledgments
This work is supported by the Bulgarian Ministry of Education and Science under the National Research Program “Smart crop production” approved by Decision of the Ministry Council №866/26.11.2020.
Conflicts of Interest
The authors declare no conflicts of interest.
References
- Carletto, C. Better data, higher impact: Improving agricultural data systems for societal change. Eur. Rev. Agric. Econ. 2021, 48, 719–740. [Google Scholar] [CrossRef]
- Borrero, J.D.; Mariscal, J. A Case Study of a Digital Data Platform for the Agricultural Sector: A Valuable Decision Support System for Small Farmers. Agriculture 2022, 12, 767. [Google Scholar] [CrossRef]
- Amiri-Zarandi, M.; Hazrati Fard, M.; Yousefinaghani, S.; Kaviani, M.; Dara, R. A Platform Approach to Smart Farm Information Processing. Agriculture 2022, 12, 838. [Google Scholar] [CrossRef]
- Sergio Trilles, Alberto González-Pérez, Joaquín Huerta, An IoT Platform Based on Microservices and Serverless Paradigms for Smart Farming Purpose. Sensors 2020, 20, 2418. [CrossRef] [PubMed]
- Titus Balan, Catalin Dumitru, Gabriela Dudnik, Enrico Alessi, Marc Correvon, Fabio Passaniti, Antonella Licciardello, Smart Multi-Sensor Platform for Analytics and Social Decision Support in Agriculture. Sensors 2020, 20, 4127. [CrossRef] [PubMed]
- Ahmed, M.A.; Gallardo, J.L.; Zuniga, M.D.; Pedraza, M.A.; Carvajal, G.; Jara, N.; Carvajal, R. LoRa Based IoT Platform for Remote Monitoring of Large-Scale Agricultural Farms in Chile. Sensors 2022, 22, 2824. [Google Scholar] [CrossRef] [PubMed]
- Senoo, E. E. K.; Akansah, E.; Mendonça, I.; Aritsugi, M. Monitoring and Control Framework for IoT, Implemented for Smart Agriculture. Sensors 2023, 23, 2714. [Google Scholar] [CrossRef] [PubMed]
- Moso, C.J.; Cormier, S.; de Runz, C.; Fouchal, H.; Wandeto, M.J. Anomaly Detection on Data Streams for Smart Agriculture. Agriculture 2021, 11, 1083. [Google Scholar] [CrossRef]
- Peter Christiansen, Lars N. Nielsen, Kim A. Steen, Rasmus N. Jørgensen, Henrik Karstoft, DeepAnomaly: Combining Background Subtraction and DeepLearning for Detecting Obstacles and Anomalies in an Agricultural Field. Sensors 2016, 16, 1904. [Google Scholar] [CrossRef] [PubMed]
- Yucheng Wang, Mengmeng Gu, Mingyuan Zhou, and Xiaoning Qian. 2022. Attention-Based Deep Bayesian Counting For AI-Augmented Agriculture. 6 November 2022; -9. [CrossRef]
- FaST Platform. Available online: https://fastplatform.eu/ (accessed on 5 December 2023).
- Copernicus. Available online: https://www.copernicus.eu/en (accessed on 5 December 2023).
- Defence Industry and Space. Available online: https://defence-industry-space.ec.europa.eu/eu-space-policy/galileo/galileo-system_en (accessed on 5 December 2023).
- Farm21. Available online: https://www.farm21.com/farming-platform-to-farm-smarter/ (accessed on 5 December 2023).
- Nexus. Available online: https://www.water-energy-food.org/ (accessed on 5 December 2023).
- Food and Agriculture Organization (FAO). Available online: https://www.fao.org/platforms/common-practices/en (accessed on 5 December 2023).
- CGIAR Platform for Big Data in Agriculture. Available online: https://bigdata.cgiar.org/about-the-platform/ (accessed on 5 December 2023).
- PLANTVILLAGE NURU: PEST AND DISEASE MONITORING USING AI. Available online: https://bigdata.cgiar.org/digital-intervention/plantvillage-nuru-pest-and-disease-monitoring-using-ai/ (accessed on 5 December 2023).
- Wang, F.-Y. The emergence of intelligent enterprises: From CPS to CPSS. IEEE Intell. Syst. 2010, 25, 85–88. [Google Scholar] [CrossRef]
- Stoyanov, S.; Stoyanova-Doycheva, A.; Ivanova, V.; Tabakova-Komsalova, V. An Event Model for Smart Agriculture. In Proceedings of the 2021 IEEE International Conference Automatics and Informatics (ICAI), Varna, 30 September–2 October 2021. [Google Scholar]
- Stoyanova-Doycheva, A.; Doychev, E.; Ivanova, V.; Valkanov, V.; Tabakova-Komsalova, V. Event Ontology about Wheat Cultivation, AgriControl 2022. In Proceedings of the 7th IFAC Conference on Sensing, Control and Automation Technologies for Ag-riculture, Munich, Germany, 14–16 September 2022. [Google Scholar]
- Stoyanov, S.; Tabakova-Komsalova, V.; Doukovska, L.; Stoyanov, I.; Dukovski, A. An Event-Based Platform Sup-porting Smart Agriculture Applications. In Proceedings of the IEEE Intelligent Systems IS’22, Warsaw, Poland, 12–14 October 2022. [Google Scholar]
- Zeigler, B.; Kim, D.; Praehofer, H. Theory of modeling and simulation: Integrating Discrete Event and Continuous Complex Dynamic Systems, Academic Press. 2000.
- Yochkova, P.; Tabakova-Komsalova, V.; Cherecharov, S.; Doukovska, L.; Stoyanov, S. DEVS Modeling of an Irrigation System. In Proceedings of the IEEE Intelligent Systems IS’22, Warsaw, Poland, 12–14 October 2022. [Google Scholar]
- LoRaWAN. Available online: https://lora-alliance.org/about-lorawan/ (accessed on 4 December 2023).
- Protégé. Available online: https://protege.stanford.edu/ (accessed on 4 December 2023).
- Shalfield, R.; Spenser, C.; Steel, B.D.; Westwood, A. WIN-PRPLOG. Programming Guide, Logic Programming As-sociates Ltd, 2021.
- Shalfield, R.; Spenser, C.; Steel, B.D.; Westwood, A. Flex Reference, Logic Programming Associates Ltd, 2021.
- Shalfield, R.; Spenser, C.; Steel, B.D.; Westwood, A. VisiRule, User Guide, Logic Programming Associates Ltd, 2021.
- PostgreSQL. Available online: https://www.postgresql.org/ (accessed on 4 December 2023).
- MongoDB. Available online: https://www.mongodb.com/ (accessed on 4 December 2023).
- Boissier, O.; Bordini, R.; Hübner, J.; Ricci, A. Multi-Agent Oriented Programming Programming. Multi-Agent Systems Using JaCaMo, The MIT Press Cambridge, Massachusetts London, England. 2020.
- Bordini, R.H.; Huebner, J.F.; Wooldridge, M. Programming Multi-Agent Systems in AgentSpeak Using Jason, Wiley, 2007, p. 294.
- Ricci, A.; Piunti, M.; Viroli, M. Environment programming in multi-agent systems: an artifact-based perspective. Auton Agent Multi-Agent Syst 2011, 23, 158–192. [Google Scholar] [CrossRef]
- Wooldridge, M. (2009). An Introduction to MultiAgent Systems, Wiley, p.488.
- Node-RED, Low-code programming for event-driven applications. Available online: https://nodered.org/ (accessed on 4 December 2023).
- FROST-Server, Fraunhofer IOSB’s Server implementation of the OGC SensorThings API. Available online: https://fraunhoferiosb.github.io/FROST-Server/ (accessed on 4 December 2023).
- TimescaleDB, Time series database. Available online: https://www.timescale.com/ (accessed on 4 December 2023).
- Grafana, The open observability platform. Available online: https://grafana.com/ (accessed on 4 December 2023).
- IBM SPSS Statistics 26 Documentation, retrieved from: https://www.ibm.
- Lund Research Ltd. Testing for Normality using SPSS Statistics, retrieved from: http://www.statistics.laerd.
- Mishra, P.; Pandey, C.M.; Singh, U.; Gupta, A.; Sahu, C.; Keshri, A. Descriptive Statistics and Normality Tests for Statistical Data. Annals of Cardiac Anaesthesia 2019, 22, 67–72. [Google Scholar] [PubMed]
Figure 1.
ZEMELA Architecture.
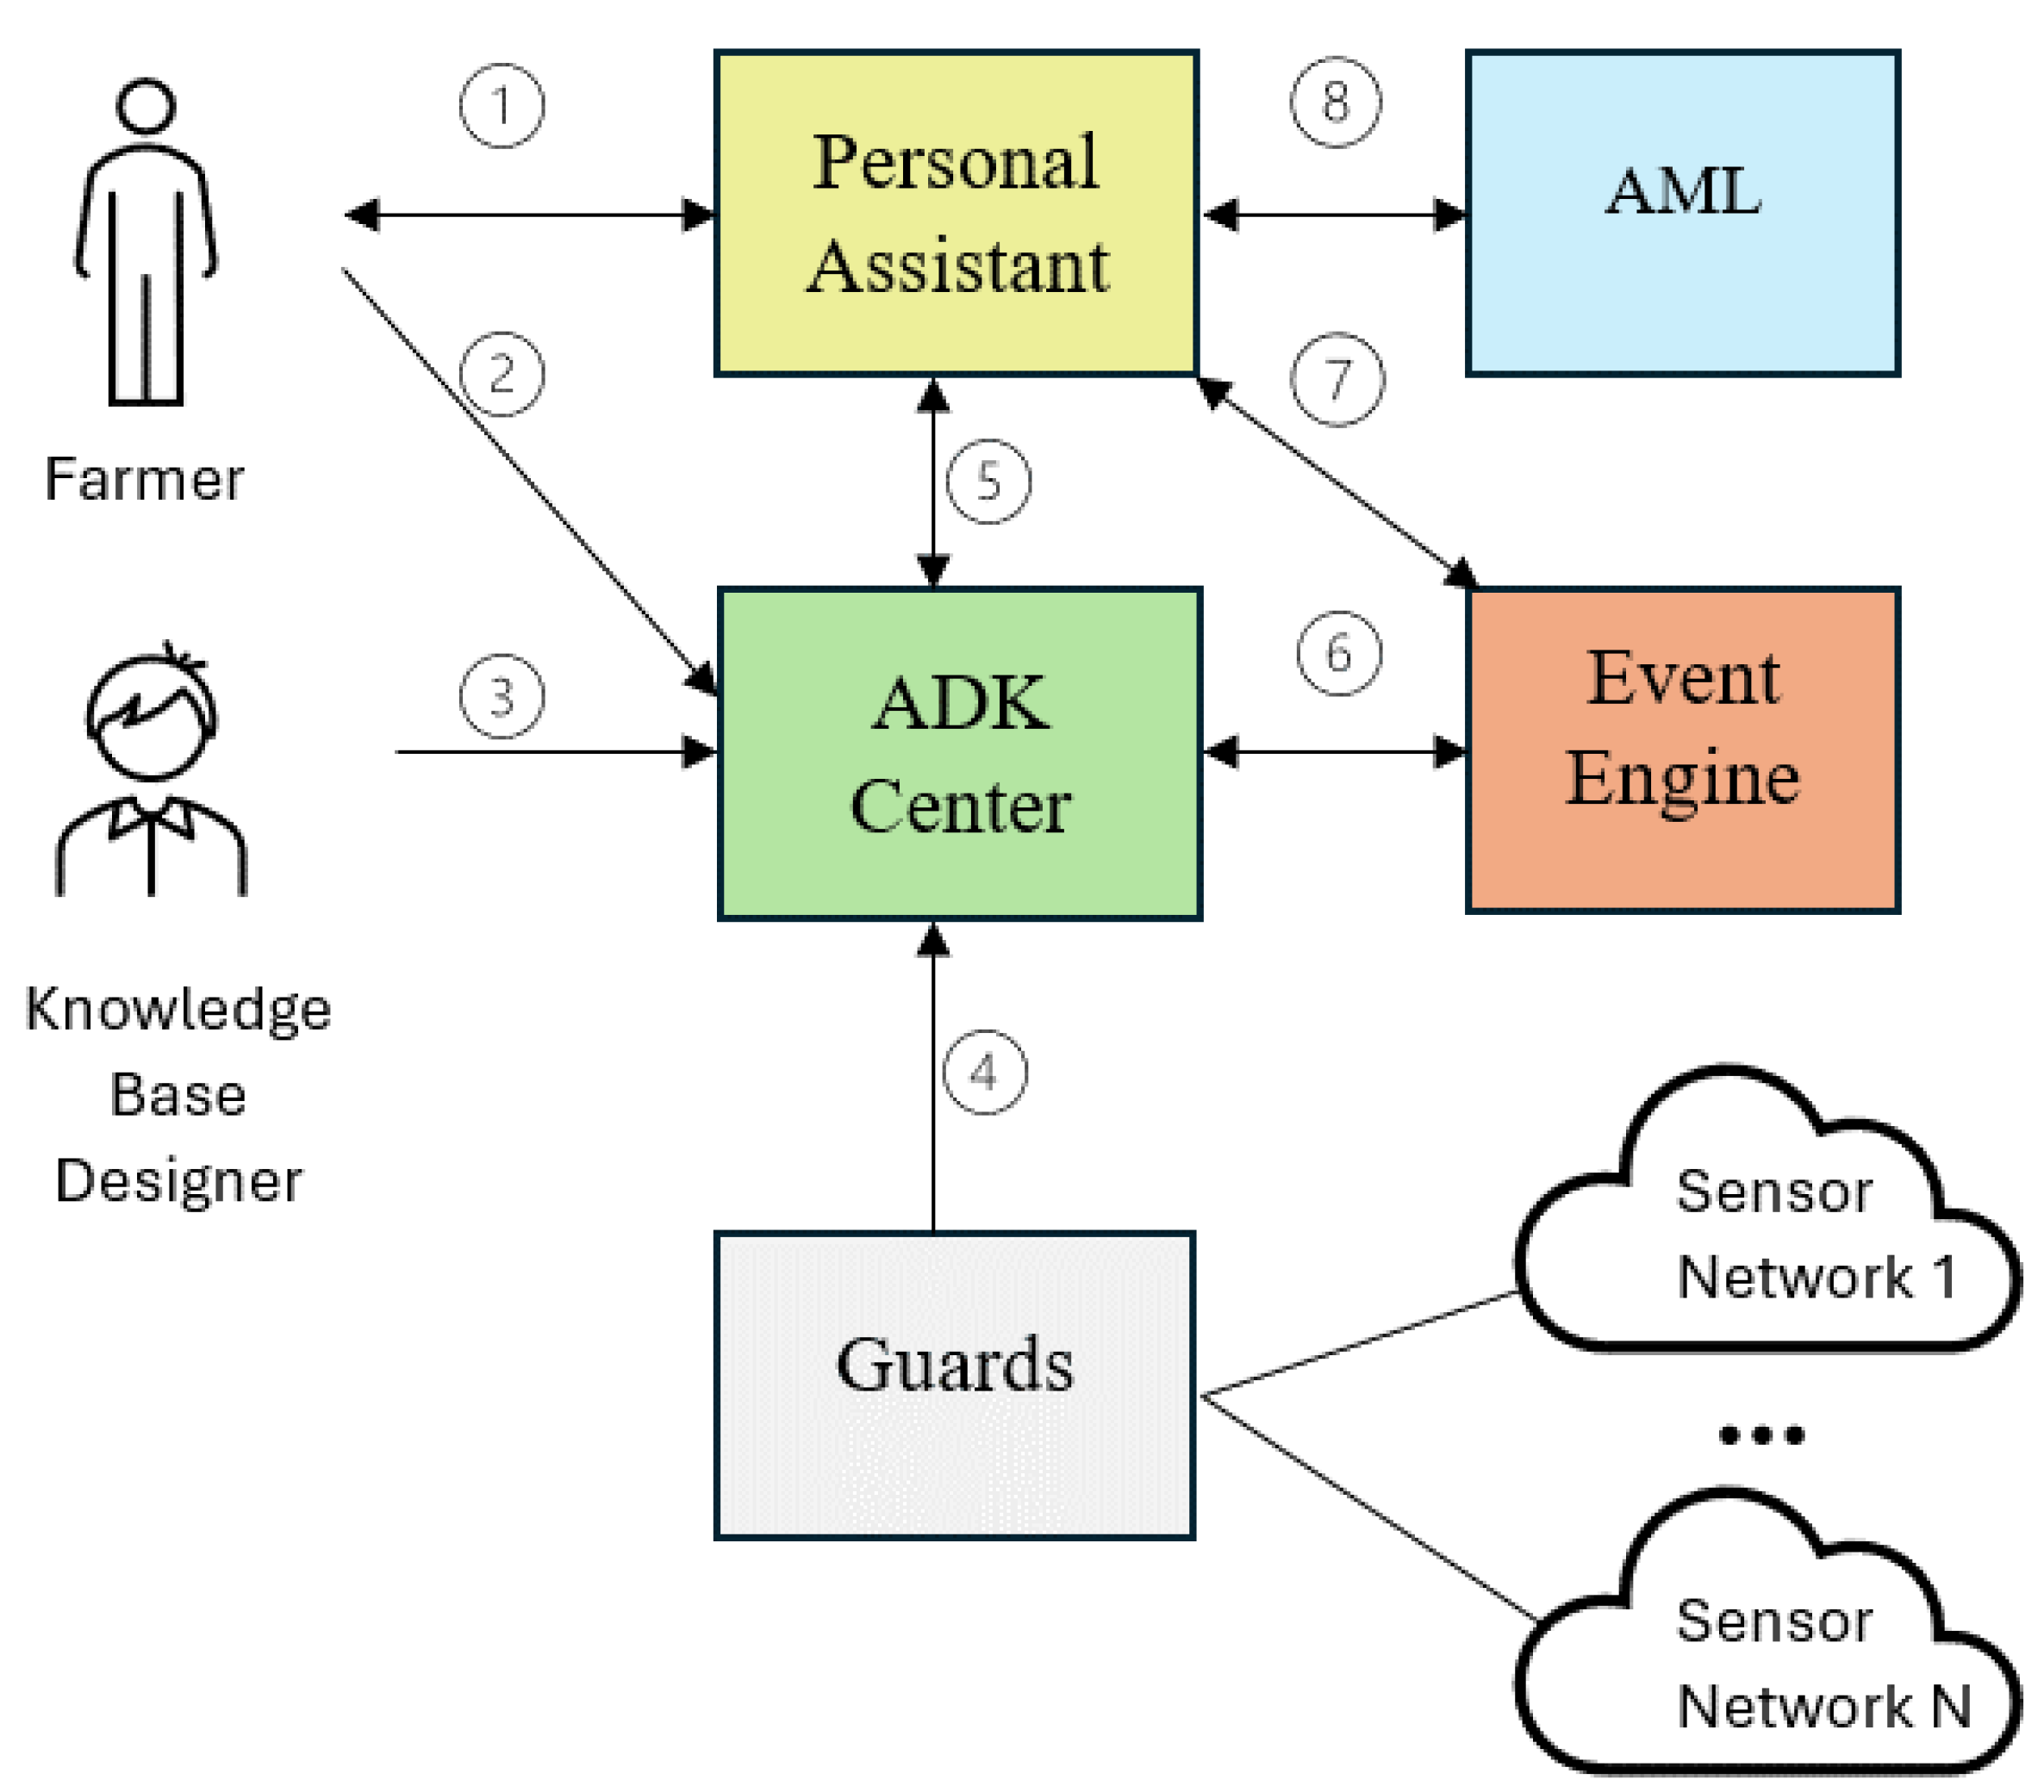
Figure 2.
Integrated technology.
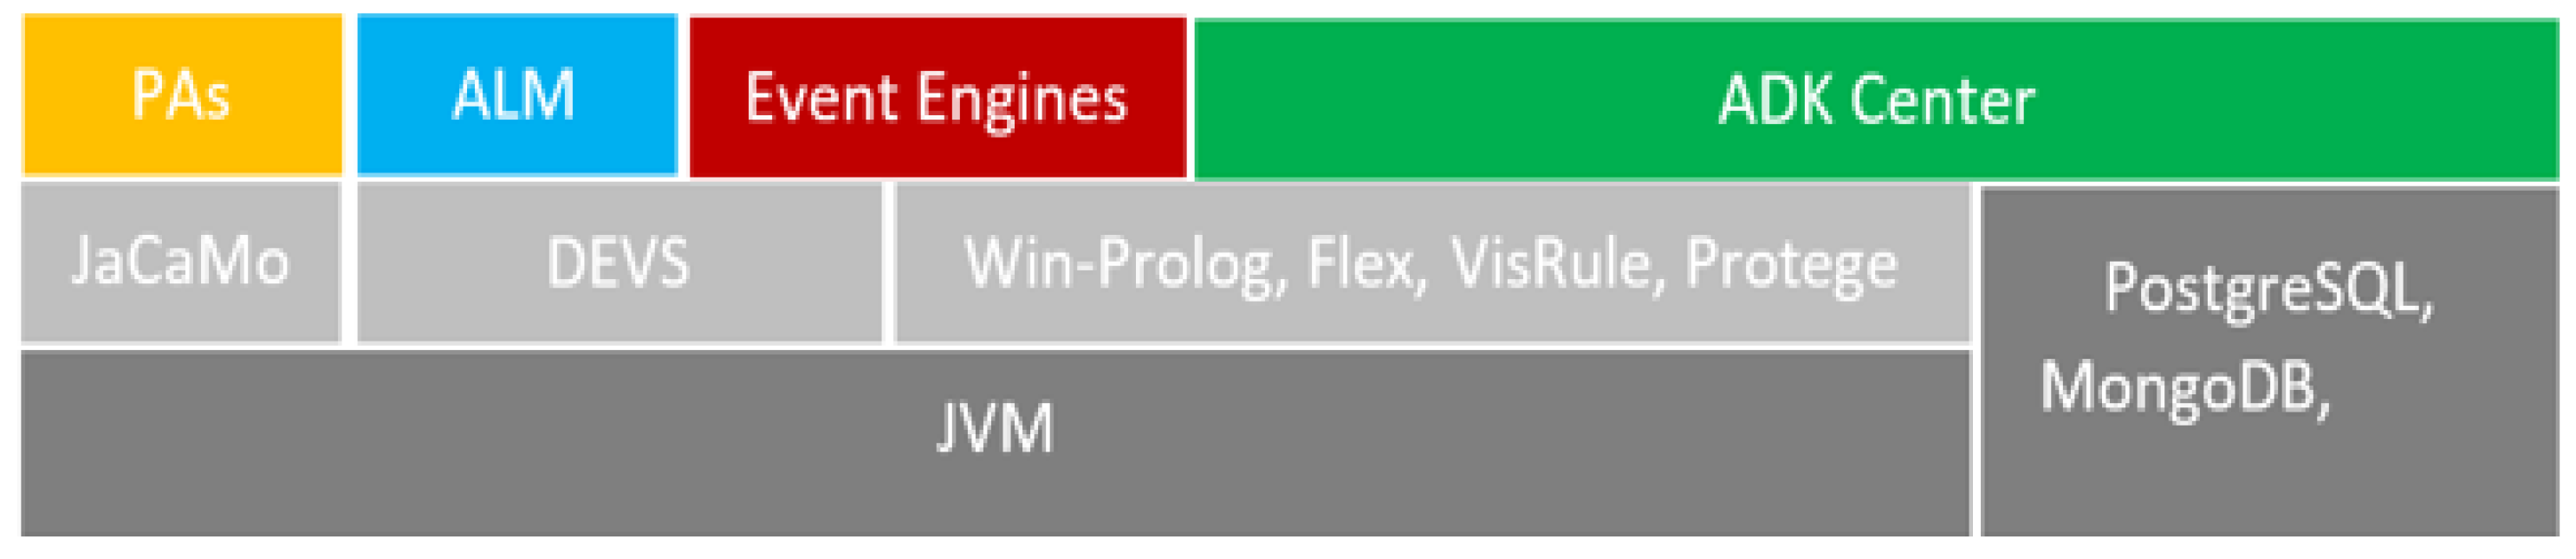
Figure 3.
The PA’s architecture.
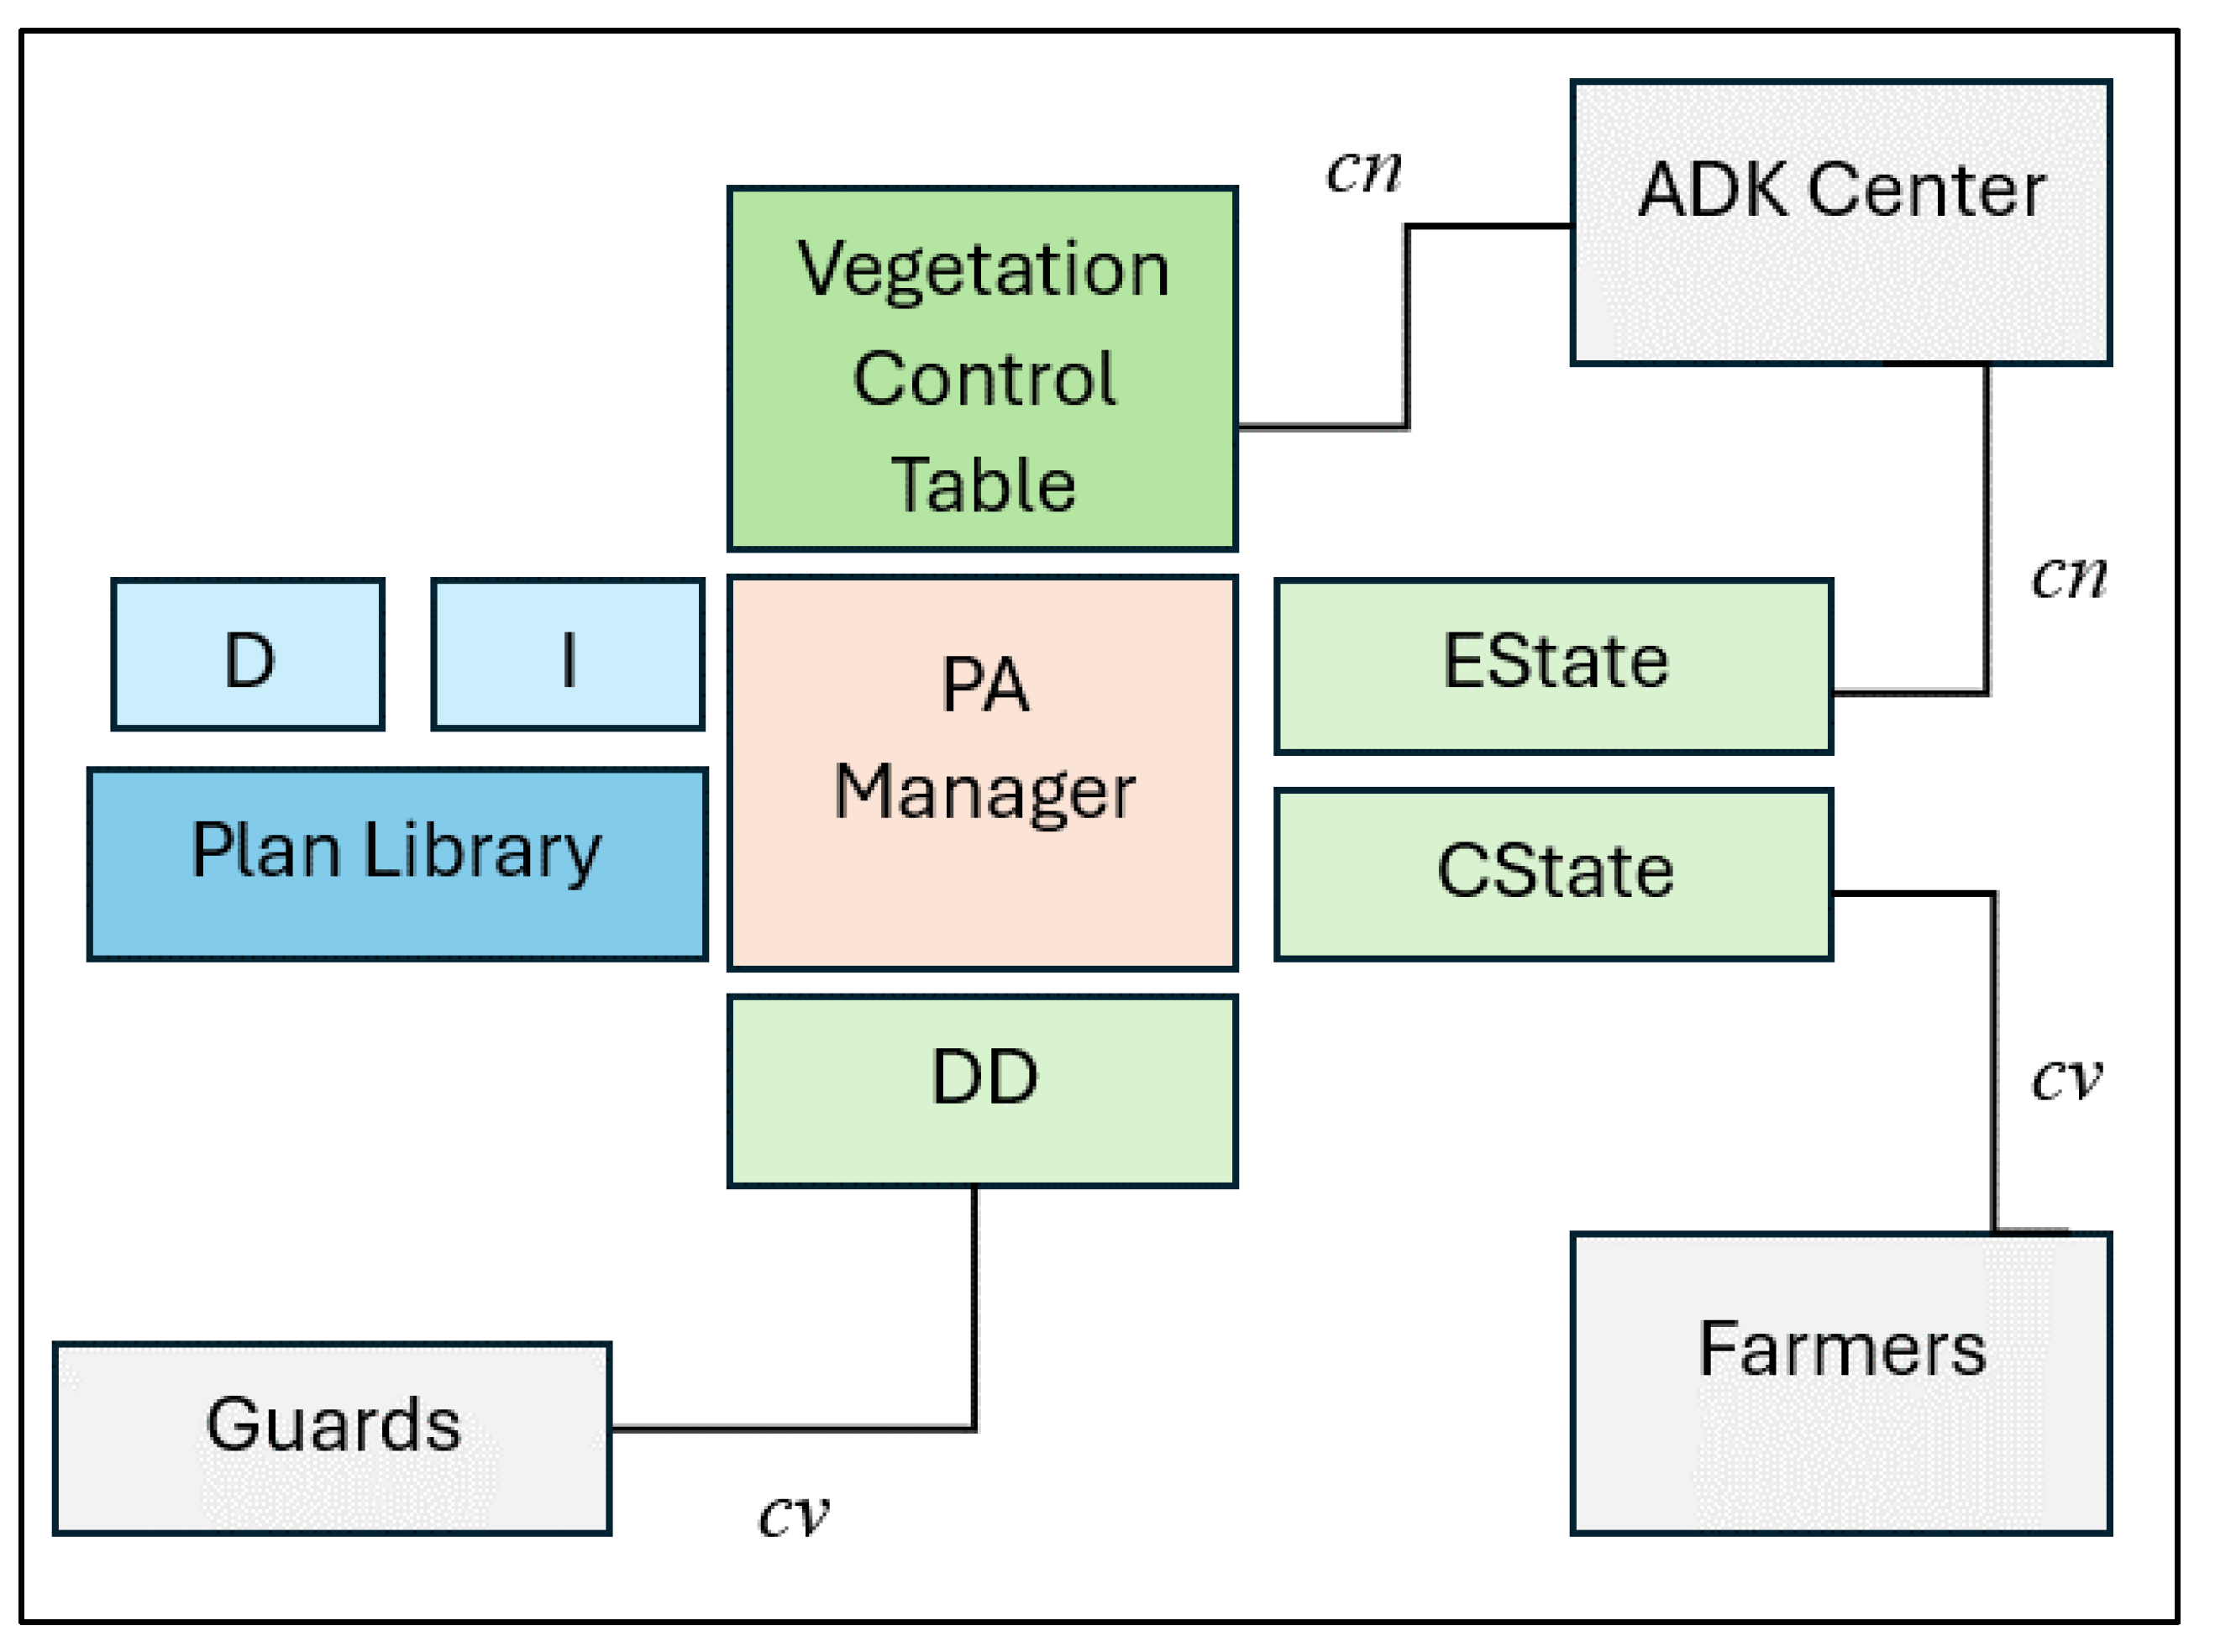
Figure 4.
The life cycle of the PA.
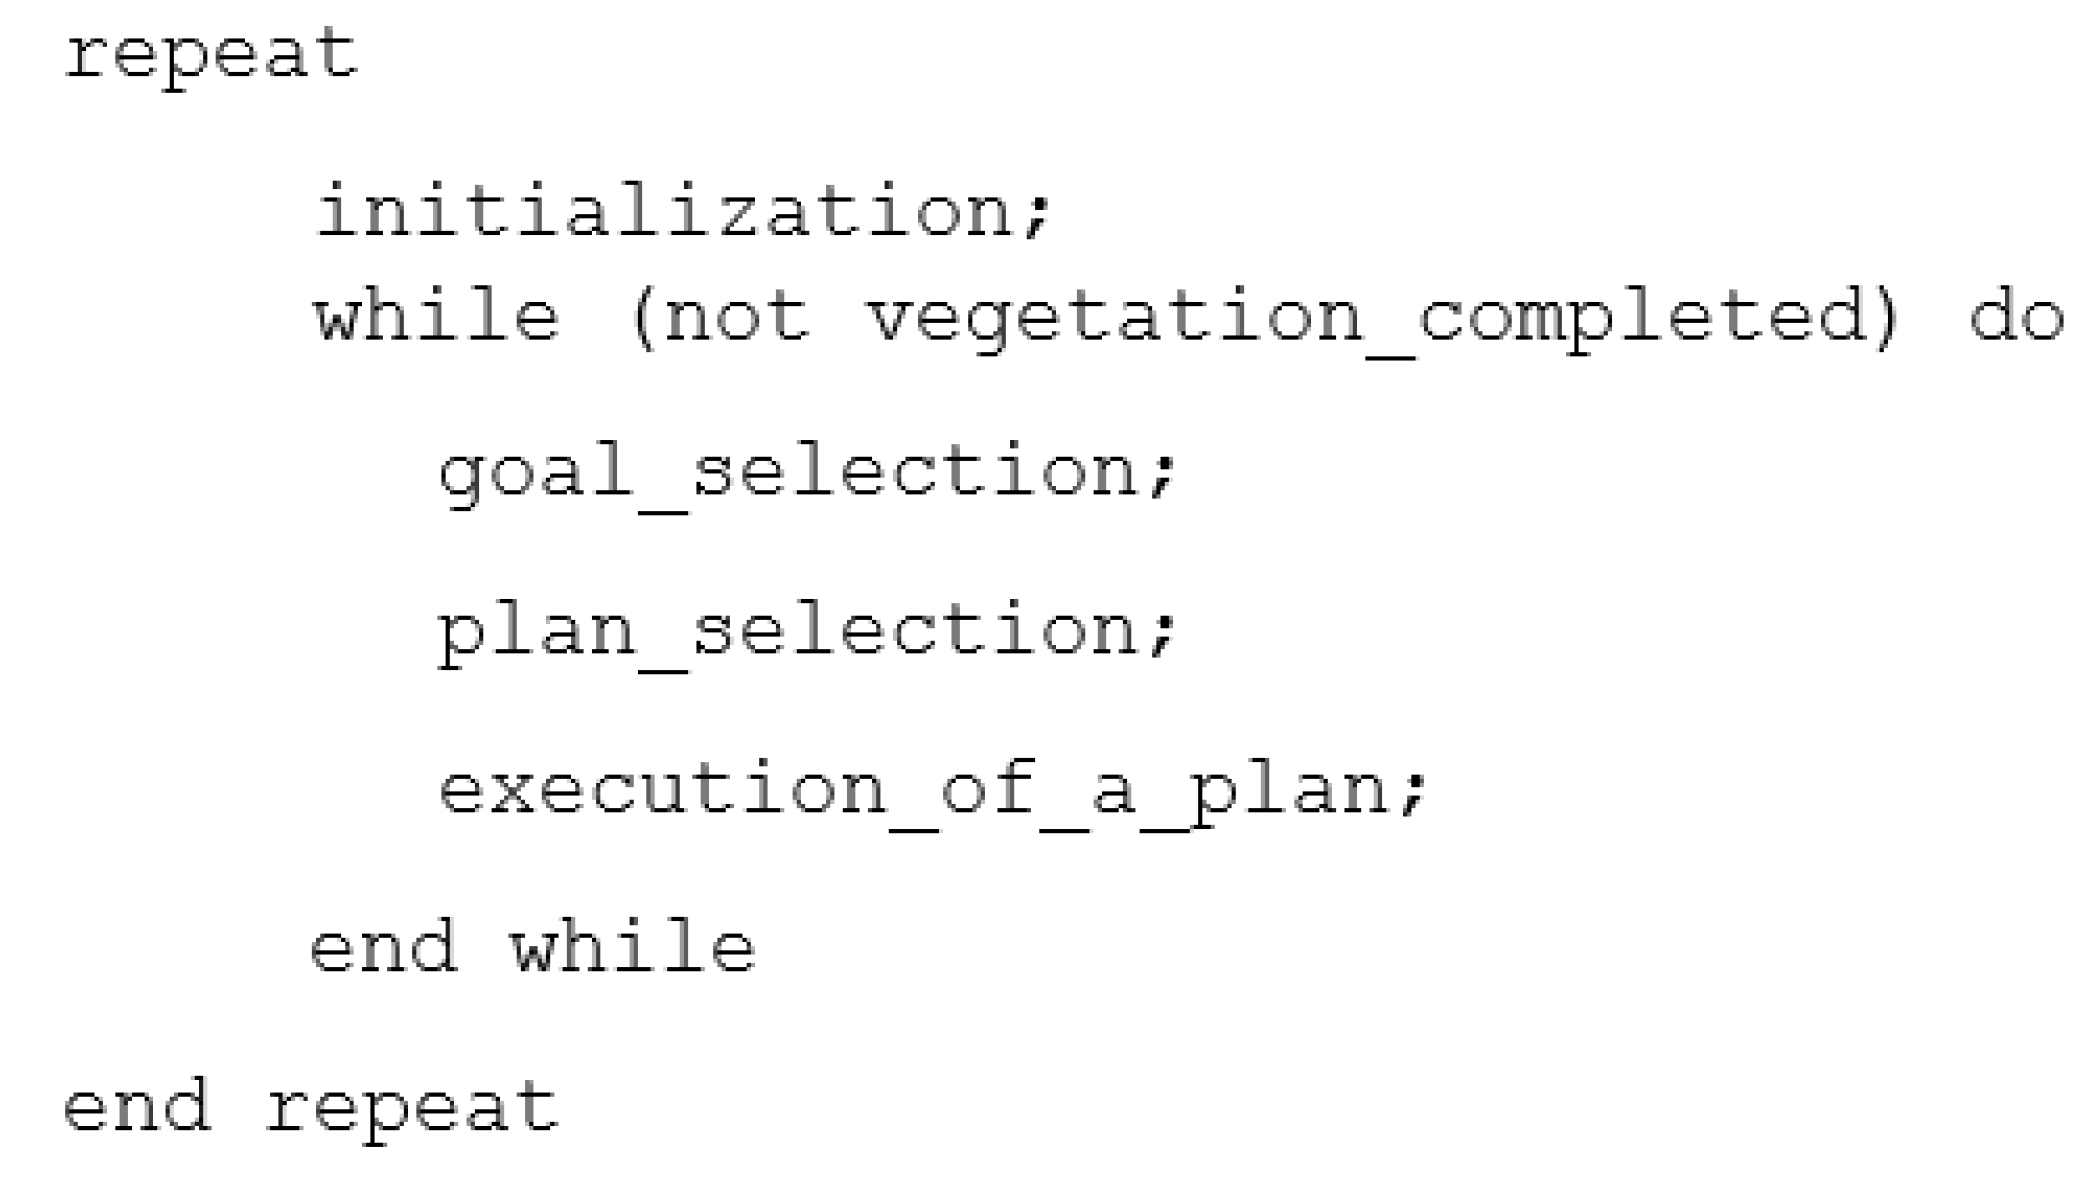
Figure 5.
Component architecture of the sensor group.
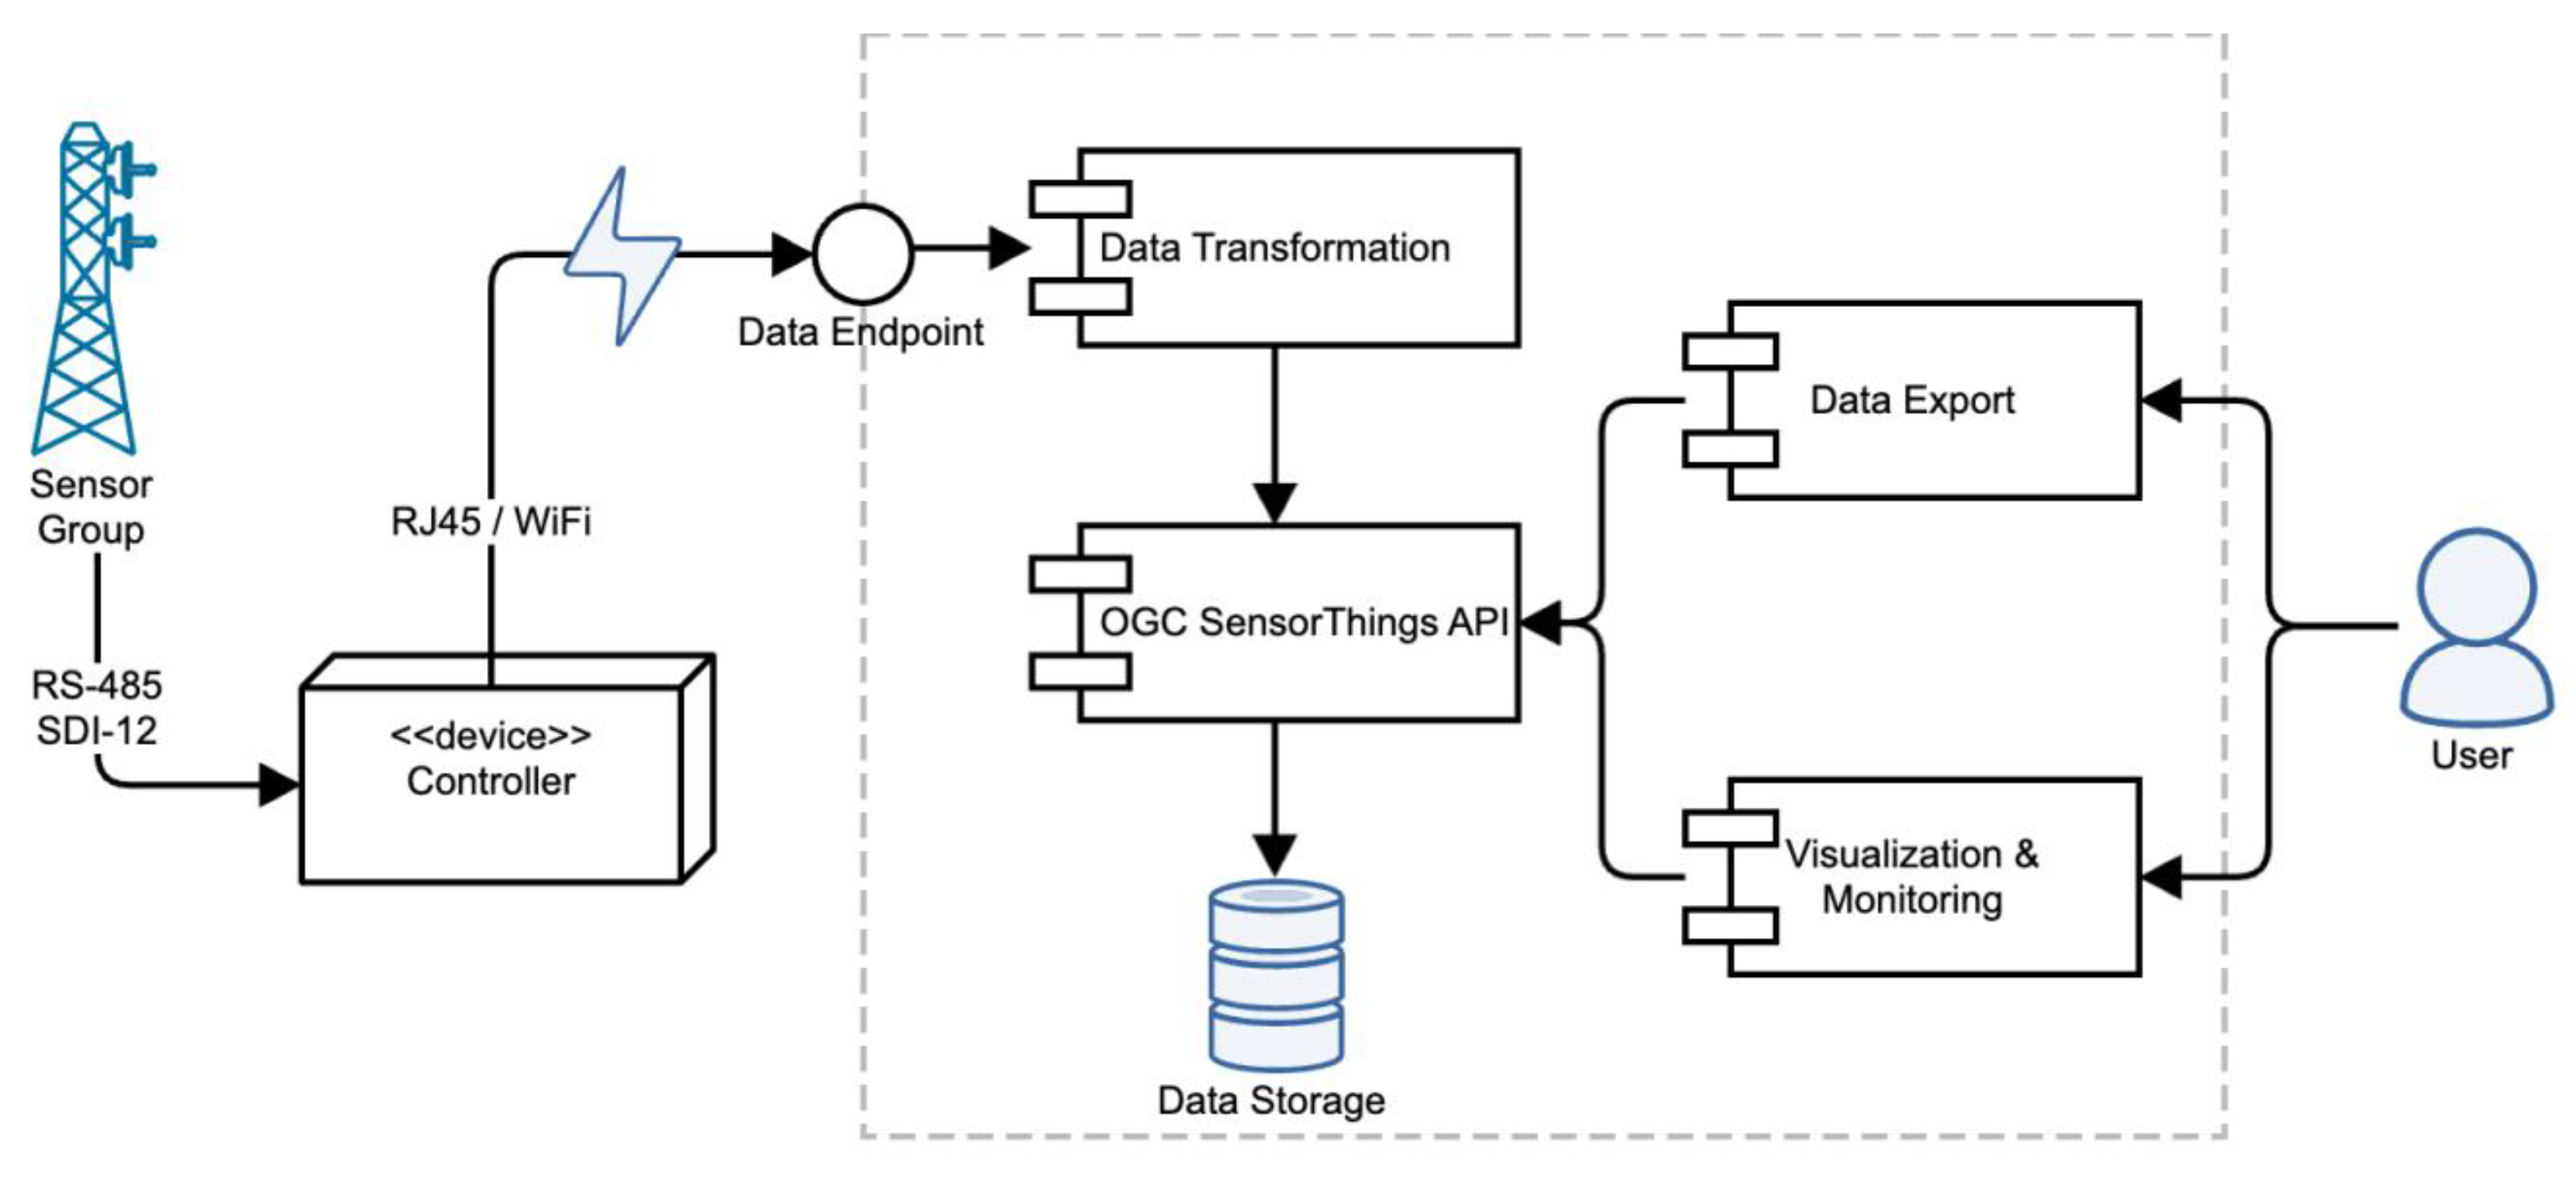
Figure 6.
“Aleno surce”: stem height.
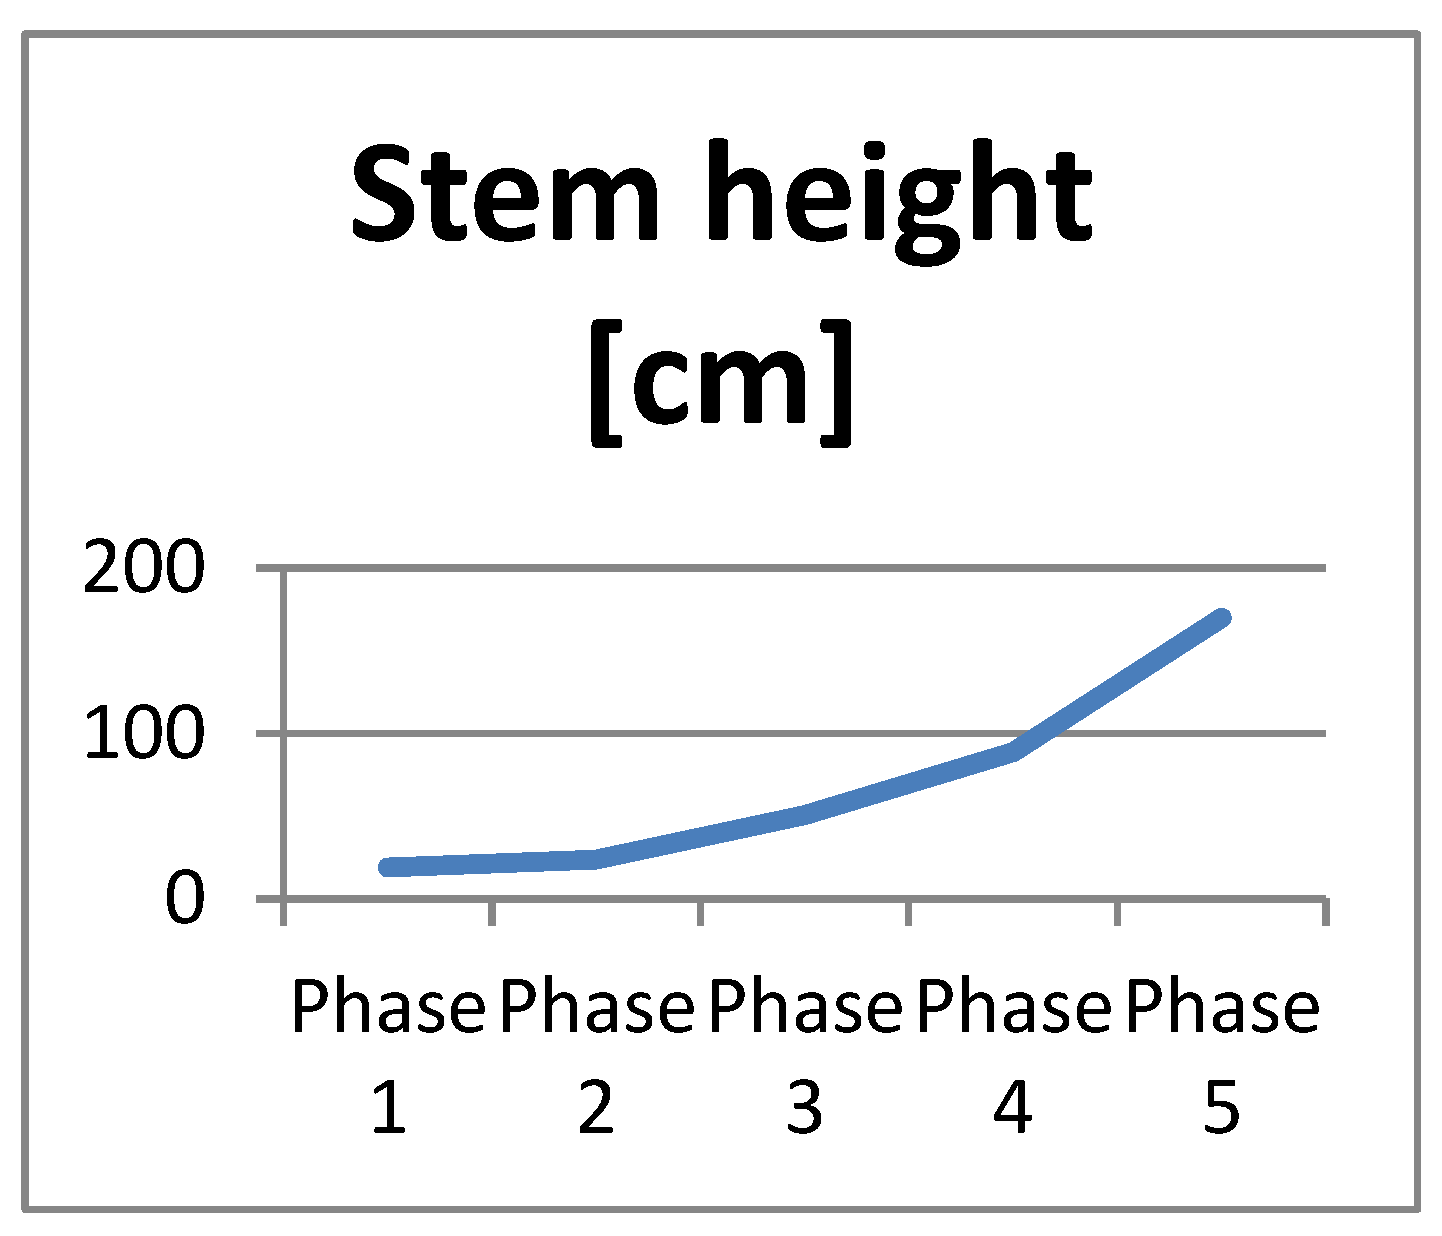
Figure 7.
“Aleno surce”: stem diameter.
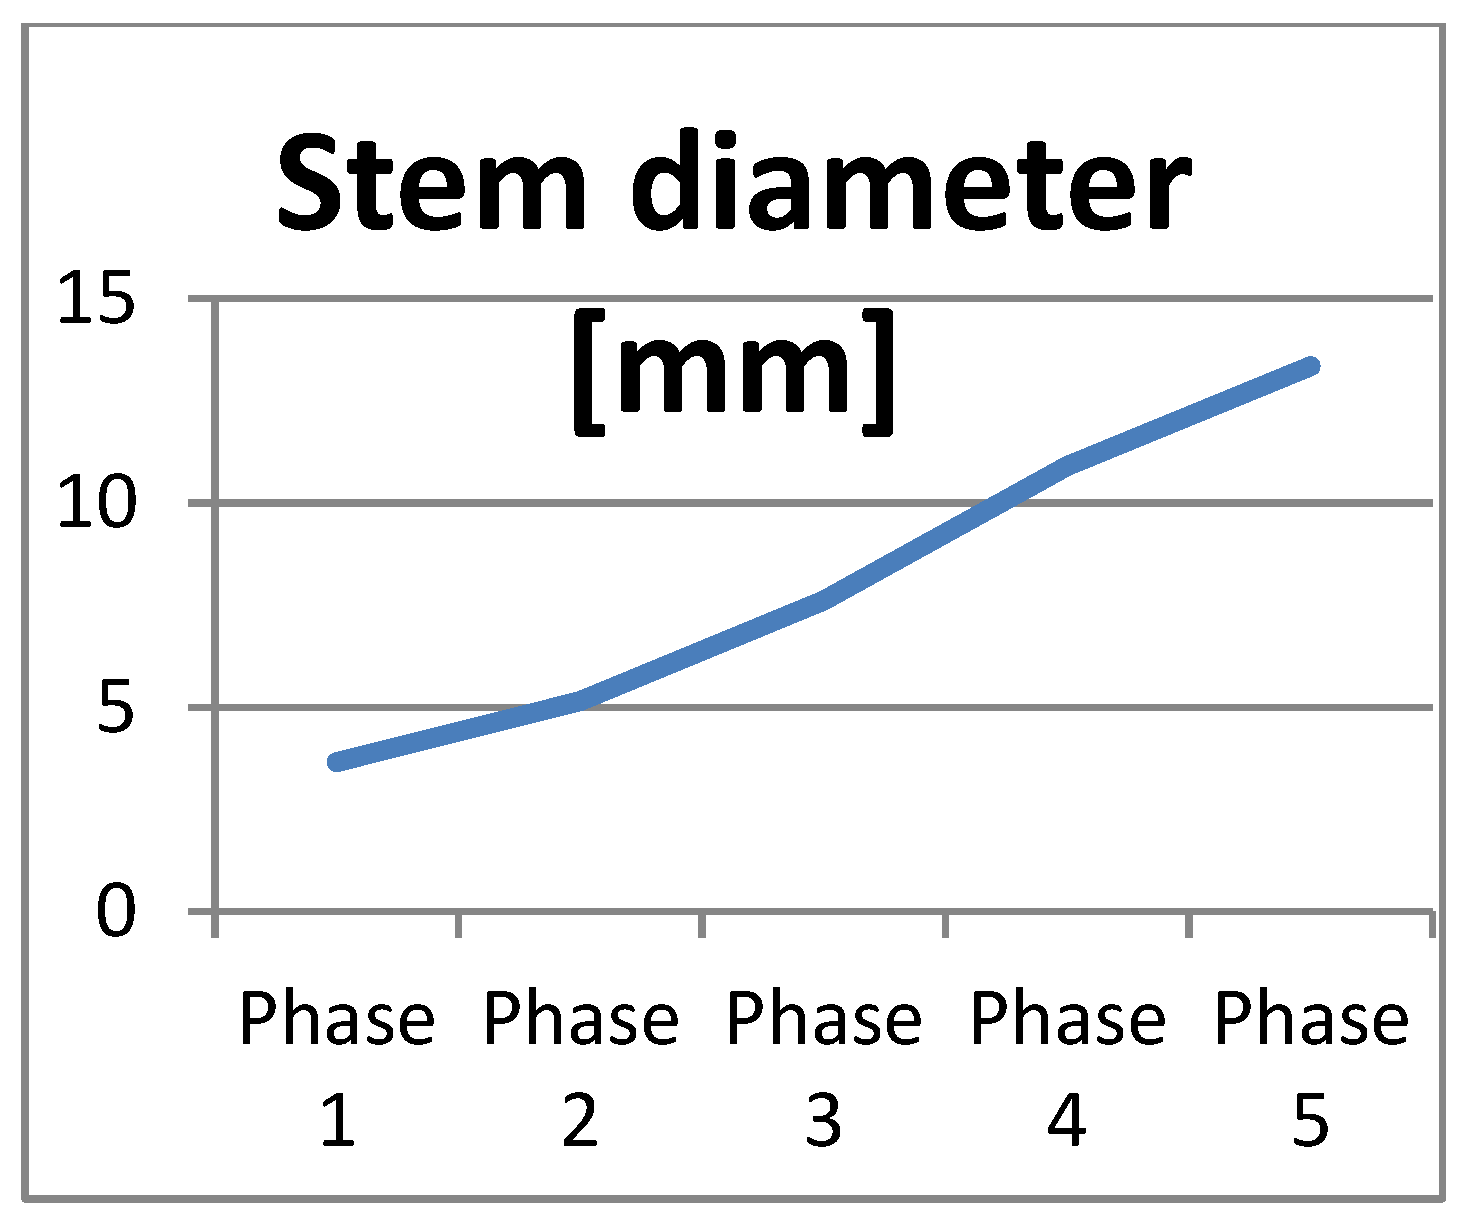
Figure 8.
“Aleno surce”: leaves number.
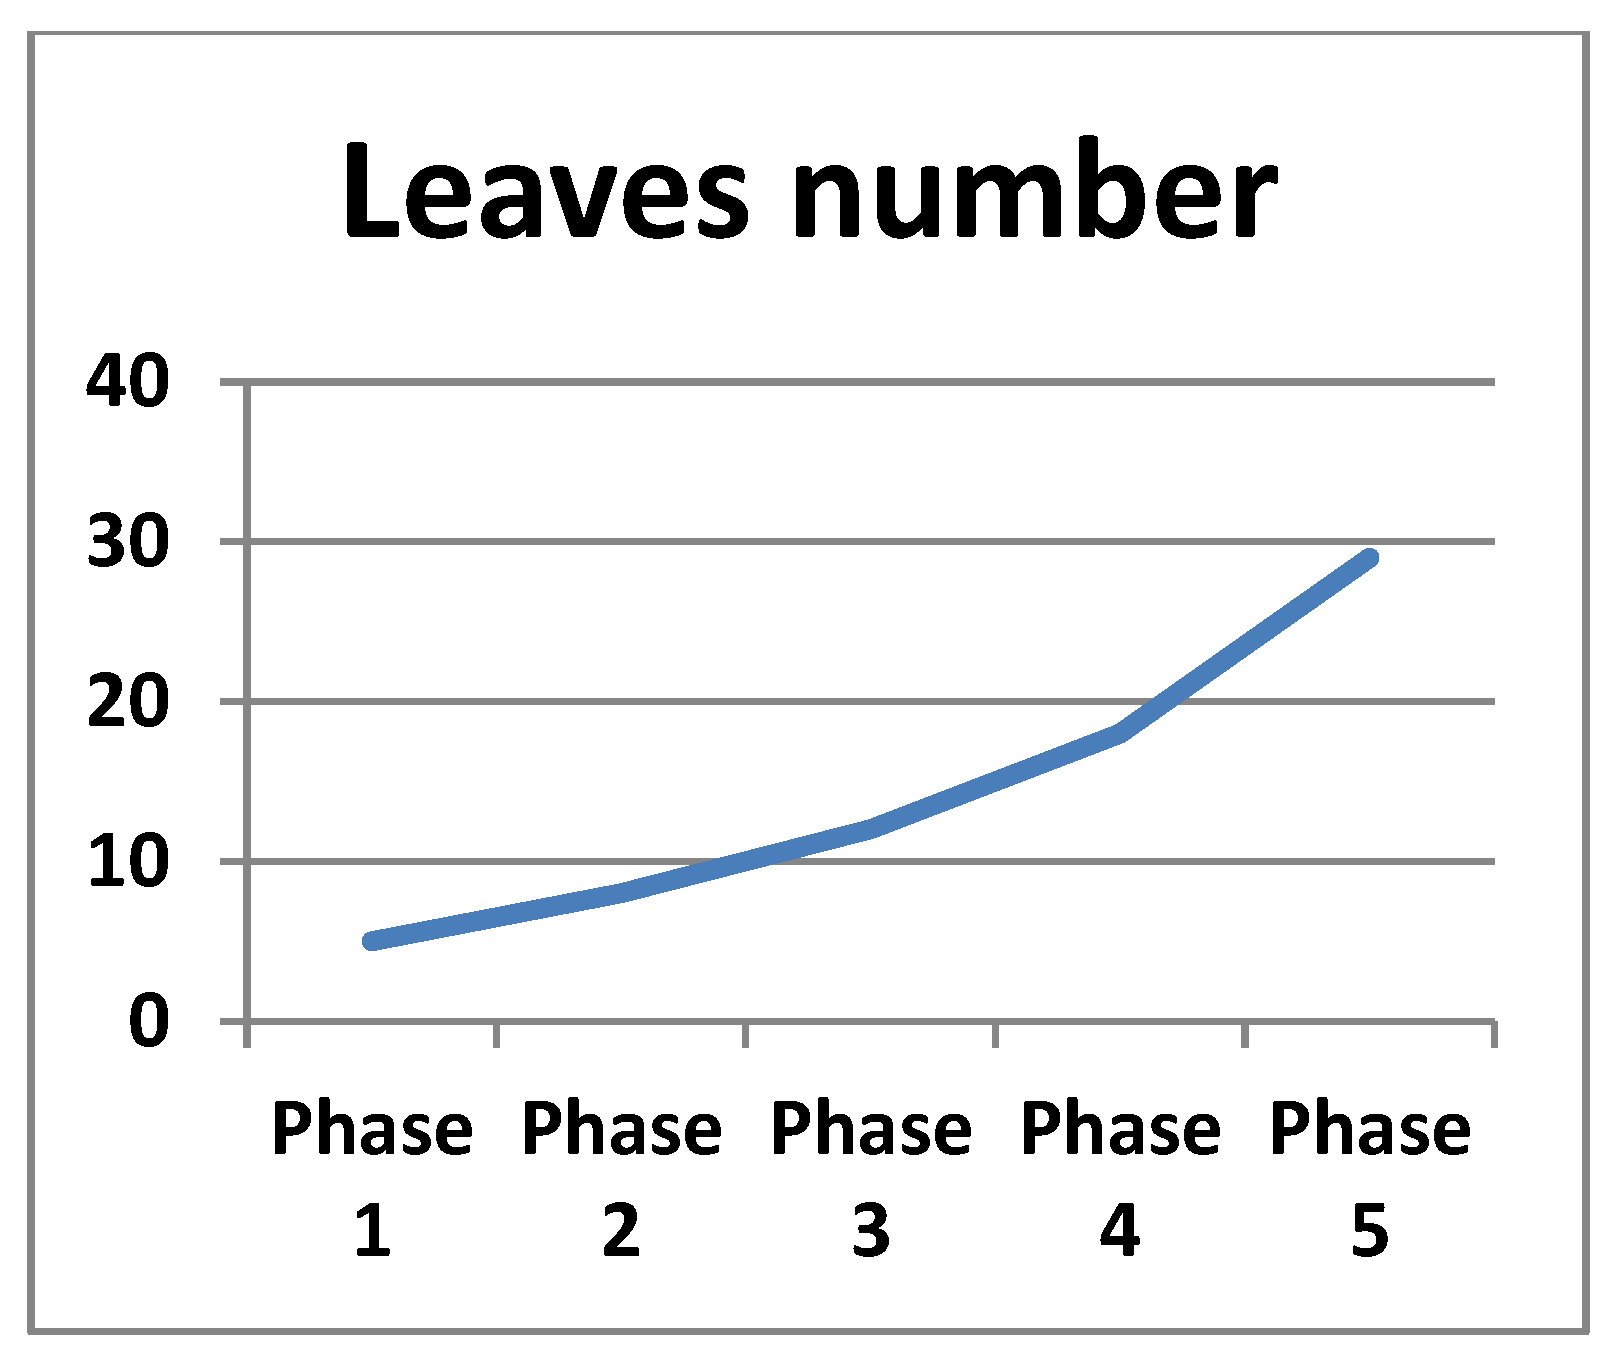

Table 1.
Мeasurements and the actual measured values.
| Phase | Varieties | PhED/ DDs | ADDs/DDs | FDDs/ DDs | ADu/ days | FDu/ days |
| Planting | 150-200 | 25-35 | ||||
| Rozovo surce | 45050 | 82 | 14 | |||
| Aleno surce | 45050 | 82 | 14 | |||
| Rozovo siyanie | 45050 | 82 | 14 | |||
| Dara | 45050 | 82 | 14 | |||
| Vegetative growth | 250-300 | 20-25 | ||||
| Rozovo surce | 45064 | 140 | 14 | |||
| Aleno surce | 45064 | 140 | 14 | |||
| Rozovo siyanie | 45064 | 140 | 14 | |||
| Dara | 45064 | 140 | 14 | |||
| Flowering | 600-800 | 20-30 | ||||
| Rozovo surce | 45076 | 247 | 12 | |||
| Aleno surce | 45076 | 247 | 12 | |||
| Rozovo siyanie | 45071 | 200 | 7 | |||
| Dara | 45079 | 278 | 14 | |||
| Fruit formation | 800-1000 | 20-30 | ||||
| Rozovo surce | 45092 | 414 | 15 | |||
| Aleno surce | 45092 | 414 | 15 | |||
| Rozovo siyanie | 45092 | 414 | 20 | |||
| Dara | 45092 | 414 | 13 | |||
| Ripening | 1400-1600 | 15-20 | ||||
| Rozovo surce | 45127 | 956 | 35 | |||
| Aleno surce | 45127 | 956 | 35 | |||
| Rozovo siyanie | 45127 | 956 | 35 | |||
| Dara | 45127 | 956 | 35 |
Table 2.
Results of the expected and measured parameters of the four varieties of tomatoes.
| Phase | Varieties | H/ cm | EH/cm | LN/number | ELN/number | SD/mm | ESD/mm |
| Planting | 10-15 | 2-4 | 1-3 | ||||
| Rozovo surce | 18 | 5 | 3.3 | ||||
| Aleno surce | 19 | 5 | 3.7 | ||||
| Rozovo siyanie | 16 | 4 | 3.5 | ||||
| Dara | 16 | 4 | 3.3 | ||||
| Vegetative growth | 60-90 | 5-7 | 3-5 | ||||
| Rozovo surce | 28 | 7.5 | 5 | ||||
| Aleno surce | 24 | 7.5 | 5 | ||||
| Rozovo siyanie | 21 | 6 | 4.5 | ||||
| Dara | 18 | 5.5 | 4.3 | ||||
| Flowering | 90-120 | 10-15 | 8-12 | ||||
| Rozovo surce | 54 | 12.5 | 7 | ||||
| Aleno surce | 51 | 12 | 7.6 | ||||
| Rozovo siyanie | 29 | 9 | 7 | ||||
| Dara | 47 | 10 | 8 | ||||
| Fruit formation | 90-120 | 10-15 | 15-20 | ||||
| Rozovo surce | 85 | 18 | 10 | ||||
| Aleno surce | 89 | 18 | 11 | ||||
| Rozovo siyanie | 81 | 18 | 12 | ||||
| Dara | 82 | 17 | 10 | ||||
| Ripening | 90-120 | 10-15 | 25-50 | ||||
| Rozovo surce | 181 | 27 | 11 | ||||
| Aleno surce | 170 | 29 | 13.5 | ||||
| Rozovo siyanie | 160 | 27 | 13 | ||||
| Dara | 159 | 28 | 13 |
Table 3.
Summary data: “Aleno surce”.
| Phase | Parameters | |||||||||||
|---|---|---|---|---|---|---|---|---|---|---|---|---|
| Stem height [cm] | Stem diameter, [mm] | Leaves number | ||||||||||
| Mean Value | Min | Max | Std. Dev. | Mean Value | Min | Max | Std. Dev. | Mean Value | Min | Max | Std. Dev. | |
| 1 | 18.97 | 16.0 | 24.3 | 1.87 | 3.65 | 3.04 | 4.33 | 0.39 | 5 | 4 | 6 | 0.59 |
| 2 | 23.66 | 20.0 | 27.0 | 1.65 | 5.14 | 4.13 | 6.78 | 0.83 | 8 | 6 | 9 | 0.71 |
| 3 | 50.64 | 41.8 | 56.3 | 3.09 | 7.61 | 6.28 | 8.54 | 0.62 | 12 | 9 | 14 | 1.34 |
| 4 | 88.81 | 74.0 | 103.7 | 7.44 | 10.9 | 8.27 | 12.84 | 1.04 | 18 | 17 | 20 | 1.05 |
| 5 | 169.9 | 132.7 | 198.5 | 21.1 | 13.35 | 10.04 | 18.95 | 2.37 | 29 | 23 | 34 | 2.82 |
Table 4.
Summary data:”Rozovo surce”.
| Phase | Parameters | |||||||||||
|---|---|---|---|---|---|---|---|---|---|---|---|---|
| Stem height [cm] | Stem diameter, [mm] | Leaves number | ||||||||||
| Mean Value | Min | Max | Std. Dev. | Mean Value | Min | Max | Std. Dev. | Mean Value | Min | Max | Std. Dev. | |
| 1 | 17.83 | 15.40 | 20.0 | 1.25 | 3.27 | 2.52 | 3.93 | 0.36 | 5 | 4 | 6 | 0.49 |
| 2 | 27.64 | 22.0 | 33.7 | 3.33 | 4.98 | 3.80 | 6.27 | 0.53 | 7 | 6 | 9 | 0.71 |
| 3 | 54.44 | 49.4 | 59.8 | 2.71 | 7.13 | 5.90 | 8.52 | 0.59 | 12 | 11 | 14 | 1.15 |
| 4 | 85.13 | 72.80 | 98.70 | 6.43 | 9.93 | 8.73 | 11.75 | 0.72 | 18 | 15 | 20 | 1.26 |
| 5 | 181.23 | 162.2 | 194.0 | 9.29 | 11.32 | 9.60 | 14.69 | 1.24 | 27 | 15 | 30 | 3.90 |
Table 5.
Summary data:”Rozovo siyanie”.
| Phase | Parameters | ||||||||||||||
|---|---|---|---|---|---|---|---|---|---|---|---|---|---|---|---|
| Stem height [cm] | Stem diameter, [mm] | Leaves number | |||||||||||||
| Mean Value | Min | Max | Std. Dev. | Mean Value | Min | Max | Std. Dev. | Mean Value | Min | Max | Std. Dev. | ||||
| 1 | 15.78 | 14.0 | 18.80 | 1.44 | 3.53 | 2.97 | 4.14 | 0.37 | 4 | 3 | 5 | 0.41 | |||
| 2 | 20.63 | 14.0 | 30.20 | 4.55 | 4.53 | 3.47 | 5.64 | 0.52 | 6 | 5 | 8 | 0.72 | |||
| 3 | 28.84 | 23.0 | 37.10 | 3.86 | 6.94 | 5.86 | 8.80 | 0.78 | 9 | 8 | 10 | 0.68 | |||
| 4 | 80.71 | 69.8 | 86.10 | 4.33 | 11.74 | 10.04 | 13.04 | 0.77 | 18 | 16 | 20 | 1.12 | |||
| 5 | 160.4 | 135.0 | 190.1 | 17.88 | 12.82 | 10.19 | 19.99 | 2.03 | 26 | 23 | 28 | 1.50 | |||
Table 6.
Summary data:” Dara”.
| Phase | Parameters | |||||||||||
|---|---|---|---|---|---|---|---|---|---|---|---|---|
| Stem height [cm] | Stem diameter, [mm] | Leaves number | ||||||||||
| Mean Value | Min | Max | Std. Dev. | Mean Value | Min | Max | Std. Dev. | Mean Value | Min | Max | Std. Dev. | |
| 1 | 15.69 | 11.5 | 18.5 | 2.13 | 3.34 | 2.58 | 4.12 | 0.40 | 4 | 3 | 5 | 0.45 |
| 2 | 17.77 | 14.0 | 21.4 | 2.11 | 4.33 | 3.27 | 5.47 | 0.56 | 6 | 4 | 7 | 0.82 |
| 3 | 47.26 | 38.7 | 54.1 | 3.99 | 7.96 | 6.75 | 9.15 | 0.73 | 10 | 9 | 12 | 0.85 |
| 4 | 81.77 | 70.0 | 91.3 | 5.34 | 10.18 | 8.20 | 13.25 | 1.23 | 17 | 15 | 20 | 1.39 |
| 5 | 158.8 | 135.0 | 181.3 | 14.1 | 12.93 | 10.2 | 16.2 | 1.60 | 28 | 24 | 33 | 2.24 |
Disclaimer/Publisher’s Note: The statements, opinions and data contained in all publications are solely those of the individual author(s) and contributor(s) and not of MDPI and/or the editor(s). MDPI and/or the editor(s) disclaim responsibility for any injury to people or property resulting from any ideas, methods, instructions or products referred to in the content. |
© 2024 by the authors. Licensee MDPI, Basel, Switzerland. This article is an open access article distributed under the terms and conditions of the Creative Commons Attribution (CC BY) license (http://creativecommons.org/licenses/by/4.0/).
Copyright: This open access article is published under a Creative Commons CC BY 4.0 license, which permit the free download, distribution, and reuse, provided that the author and preprint are cited in any reuse.


