Submitted:
09 April 2024
Posted:
10 April 2024
You are already at the latest version
Abstract
Remote sensing technology is crucial for accurate rooftop detection, benefiting urban planning, disaster management, and solar resource estimation. This study employs Efficient Interactive Segmentation (EISEG) to enhance the efficiency of remote sensing image labeling, with a particular focus on rooftop detection. It is necessary to use modern technology because traditional manual labelling methods are labor-intensive and complicated. The study introduces a novel framework on deep learning semantic segmentation models, facilitating an efficient approach to rooftop identification using high-resolution UAV remote sensing datasets. Large dataset of labeled UAV rooftop building images, in which each superpixel region is assigned a binary label indicating rooftop presence. Advanced methods including Asymmetric Neural Network (ANN), Dual At-tention Network (DANet), PP-LiteSeg, and Deeplab3 are implemented for automatic rooftop detection due to their higher performance and advanced architectures. These models are executed on the Baidu deep learning platform PaddlePaddle, generating initial rooftop segmentation maps crucial for estimating photovoltaic resources. The ANN model emerges with the highest accuracy at 96%, followed by DANet at 95.09%, PP-LiteSeg at 94.54%, and Deeplab3 at 81.61%. The outcomes presenting efficient models for automated rooftop identification, and demonstrating the continuous need for improving deep learning techniques in smart and sustainable cities.
Keywords:
Deep Learning
; Remote Sensing
; PaddlePaddle
; Rooftop
; Semantic Segmentation
; EISeg
; Asymmetric Neural Network
; PP-LiteSeg
; Deeplab3
; Dual Attention Network
1. Introduction
Accurate extraction of rooftops from unmanned aerial vehicle (UAV) images plays a crucial role in various applications, such as automatic photovoltaic resources estimation on rooftop[1,2]. Many methods have been developed in recent years to deal with the rooftop extraction issue. Conventional methods frequently rely on manually processed data and created features, which can be inefficient and costly. Manual identification of rooftops across vast urban landscapes is a time-consuming and resource-intensive task. In response to this challenge, deep learning models have developed as powerful tools for automating building rooftop detection.
Using a comprehensive dataset comprising more than 14,000 UAV images with a resolution of 512 by 512 pixels. The labeling of UAV images in this extensive dataset posed challenges in data processing, involving tasks such as clipping, configuration, and partitioning to handle the large volume of data for training and validation.
EISeg tool helps to generate high-quality annotations images at a reduced cost and annotation process with geographical data. EISeg supports remote sensing data with GDAL and OGR are two software libraries. GDAL is used for translating raster spatial data formats, while OGR is used for vector spatial data formats. For building labeling, the static_hrnet18_ocr48_rsbuilding_instance model has been applied. Using different images allows for a comprehensive evaluation of each model across different criteria. It helps identify biases, overfitting, and strengths specific to different environments, facilitating a more accurate comparison and enhancing the reliability of building rooftop detection systems.
This study investigate of deep learning-based rooftop detection using semantic segmentation[3,4] models such as (ANN), (DANet), PP-LiteSeg, and Deeplab3p. The reason using this four model was determined by the performance, strength to identify rooftop detection . The open-source UAV dataset, obtained from AI studio Baidu, prepared with labeled images using EISeg, facilitating supervised learning. Each model is configured with distinct background architectures and configuration files, so contributing to the range of methods in rooftop detection. With each model showing different degrees of accuracy, which range from 81.61% to an impressive 96%, the research provides a comprehensive evaluation of their performance. The Outcomes are not only presented in conventional tables and graphs but also visualized through pseudo-color images and the effectiveness of the models. The study proposes to help urban planners in making informed decisions that promote environmental health and reduce carbon emissions.
1.1. Related work
This review explores using deep learning to find rooftops suitable for solar energy in urban planning. Introduced to simplify image and video annotation, EISeg is an Efficient Interactive Segmentation tool that generates precise masks with minimal user input[5]. To address energy and climate concerns, With an emphasis on the idea of a solar city, the paper investigates techniques of assessment for calculating rooftop solar electric potential a crucial resource for cities[6].
A novel salient detector that blends four RGB-D priors to address the difficulties associated with building rooftop extraction. Through multilevel segmentation, these cues are integrated into a high-order conditional random field (CRF) framework[7]. This study recommends using satellite/aerial photos to estimate PV installed capacity efficiently in response to the rapidly growing photovoltaic industry, semantic segmentation. The results offer insightful suggestions for model building [8]. Using SegNet and a deep learning technique, the algorithm detects buildings from high-resolution UAV photos in Chongqing with remarkable accuracy[9]. Using satellite/aerial photos to estimate PV installed capacity efficiently in response to the rapidly growing photovoltaic industry, taking into account certain semantic segmentation issues such as class imbalance and resolution threshold[10]. providing a flexible framework to incorporate different types of visual and structural information with adjustable spatial regularization using semantic segmentation[11]. These characteristics, when integrated into a Markov Random Field (MRF) framework, are appearance-based approaches for the segmentation and detection of different object classes in street scene photos[12]. PP_LiteSeg is a lightweight semantic image segmentation model that uses depth-wise separable convolution, short and long residual connections, and a deeper version of the Atreus Spatial Pyramid Pooling module for improved efficiency[13].
Researchers have proposed several methods to tackle roof top detection challenging task[8], many techniques ranging from traditional image processing to advanced deep learning algorithms. The possibilities for sub-building level interpretation of ultra-high-resolution remote sensing data using novel aerial sensors like UAVs present the Dual Morphology Top-Hat Profile[14]. Deep learning works well for high spatial resolution (HSR) land-cover mapping, city- or country-level mapping is hindered by its poor generalizability across various geographical regions[15]. These methods typically rely on color-based segmentation, texture analysis, edge detection, and morphological operations. Though these methods may produce reasonable results in certain scenarios, to address these limitations, researchers have turned to machine learning techniques, particularly convolutional neural networks (CNNs), which have revolutionized image analysis tasks. CNNs can automatically learn relevant features from large datasets, enabling the extraction of complex patterns and structures. The proposed methodology and experimental results validate the effectiveness of CNNs for accurate and efficient building extraction, contributing to the advancement of remote sensing analysis techniques. [16] proposed a rooftop extraction method using a CNN-based classification model trained on a labeled dataset of UAV images. Their results demonstrated the effectiveness of CNNs in unique rooftops from other image components.
2. Materials and Methods
2.1. Aerial Imagery and Dataset Labeling
Each image in the dataset has labeled, providing a supervised learning framework EISeg for training the deep learning models. Because of its batch processing capabilities, many images or regions can be annotated at once. The building rooftop dataset each set contains a representative distribution of building types, sizes, and geographical locations. The random split function is used to split the dataset into the desired proportions in PaddlePaddle. After the rooftop data splitting, it is separate data loaders for each split. These roof building datasets used for iterating over the data during training, validation, and testing stages.
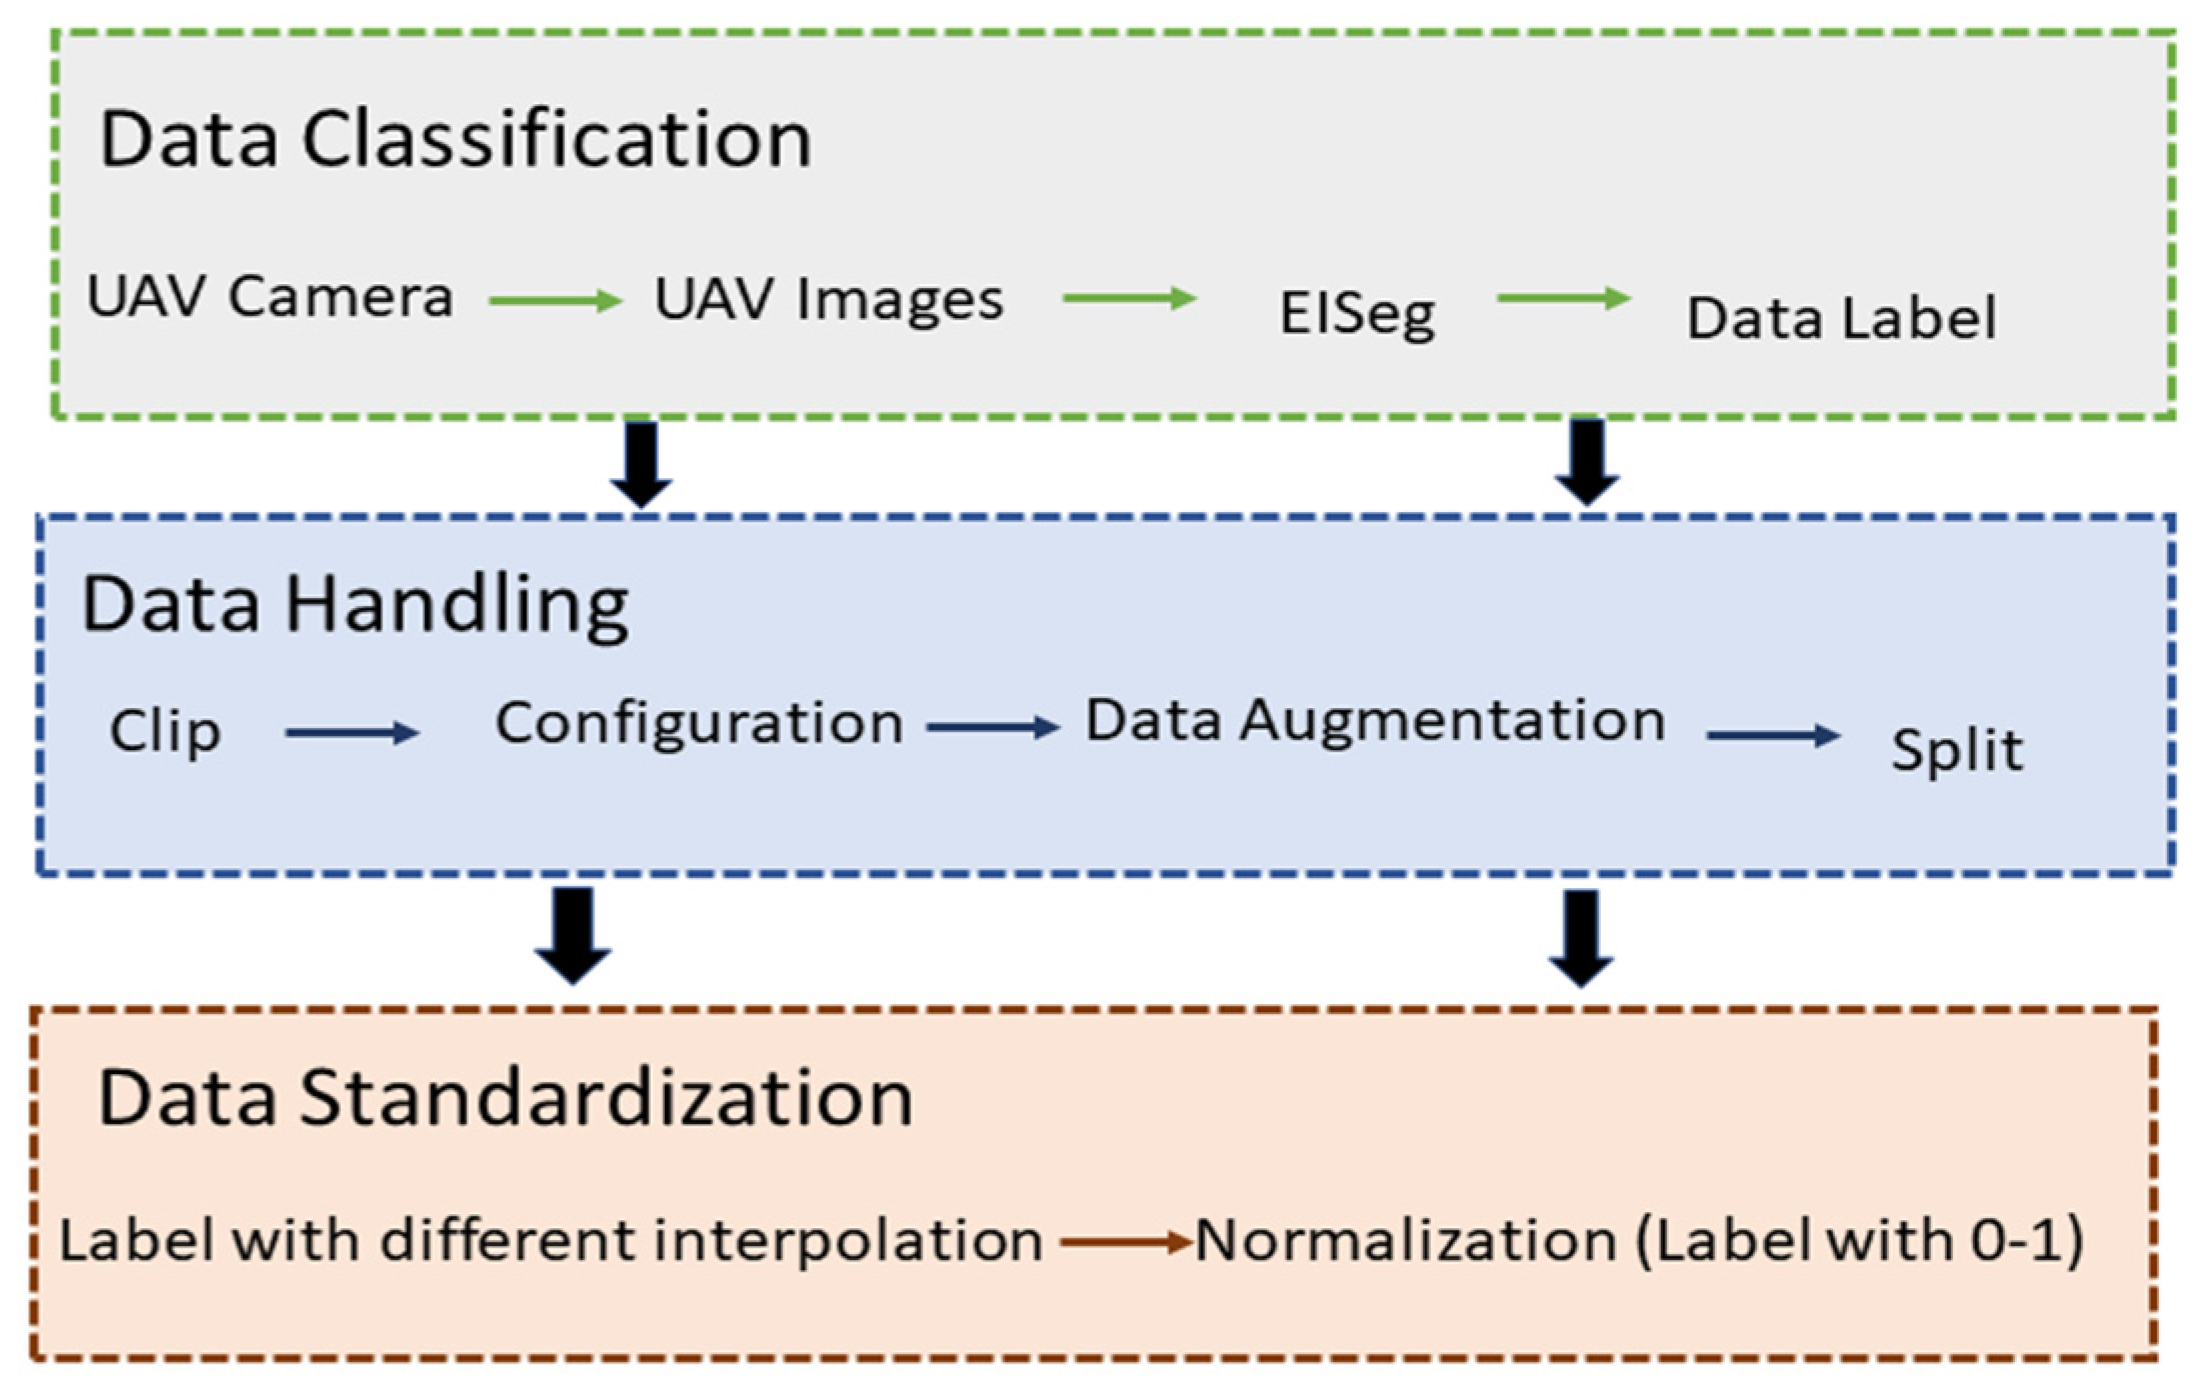
Figure 1.
UAV Data Processing.
In UAV annotation images for rooftop detection with two classes, building rooftops and bounding boxes, the process involves marking the rooftops themselves and outlining their boundaries with a white color in Figure 2. Additionally, bounding boxes are used to enclose the entire rooftop area, providing spatial information about their location and size within the image. This annotation approach enables precise identification and localization of rooftop structures, selection in the development of accurate detection algorithms.
2.2. Method of Roof-Top Detection
Data processing is important for Novel Architecture of Roof-Top Detection before inputting data into a deep learning models . This flowchart Figure 3 explains the step in which cleans and prepares the data, like cutting out relevant parts of an image and setting the format according to configuration. Firstly, manually label the dataset, annotating rooftops for supervised learning. Next stage Clip and configure the dataset, split into training and validation sets for model training. Normalize data to ensure consistency and improve model convergence during training. After that Apply normalization techniques to standardize features and enhance model performance. Create a comprehensive dataset for rooftop detection. Design the dataset structure for input into the deep learning model. Split the dataset into training and validation subsets for model training. Finally, normalization ensures all data points are on a similar scale for better learning by the model.
Data processing is important for Novel Architecture of Roof-Top Detection before inputting data into a deep learning models . Firstly, manually label the dataset, annotating rooftops for supervised learning. Next stage Clip and configure the dataset, split into training and validation sets for model training. Normalize data to ensure consistency and improve model convergence during training. After that Apply normalization techniques to standardize features and enhance model performance. Create a comprehensive dataset for rooftop detection. Design the dataset structure for input into the deep learning model. Split the dataset into training and validation subsets for model training. Finally, normalization ensures all data points are on a similar scale for better learning by the model.
Dataset Structure explains the folder structure of the rooftop building dataset, including separate folders for original images and annotations, as well as folders for resized images and annotations. Each original image has a corresponding annotation with the same name, and each resized image has a matching resized annotation. The python script under the anaconda navigator python “tools\data\split_dataset_list.py C:\Users \data images labels --split 0.6 0.2 0.2 --format jpg png” . Using this script images and annotations are split into separate folders for each set, such as training.txt, validation.txt, and testing.txt. This organization facilitates easy retrieval and pairing of images and annotations during training, validation, and testing phases.
Explanation of the design, setup, and training processes of each deep learning model given below.
2.3. Deep Learning Models
Subsequently, four deep learning models trained and compared for optimal rooftop detection performance are explained below
2.3.1. Asymmetric Neural Network (ANN):
ANN[17] A novel model is planned in this study, featuring an asymmetric encoder-decoder structure for improved performance and efficiency. It employs an asymmetric architecture modified for the task of rooftop detection. ANN architectures excel in scenarios where traditional symmetric architectures struggle, such as handling class imbalances or capturing complex spatial relationships .The Figure 4 architecture diagram illustrates the network's layers, highlighting the unique features designed to capture elaborate rooftop structures.
2.3.2. Dual Attention Network(DANET)
DANET[18] model that develops dual attention segments to focus on both spatial and channel-wise communications between pixels. DANet can effectively focus on relevant regions and features while suppressing irrelevant noise, which is particularly useful in tasks like semantic segmentation where precise localization is important. It is another prominent model, that shows a distinctive architecture used for rooftop identification. Figure 5 shows the model's architecture diagram and provides insights into its structure, emphasizing its ability to separate features within the UAV images.
2.3.3. DeeplabV3p
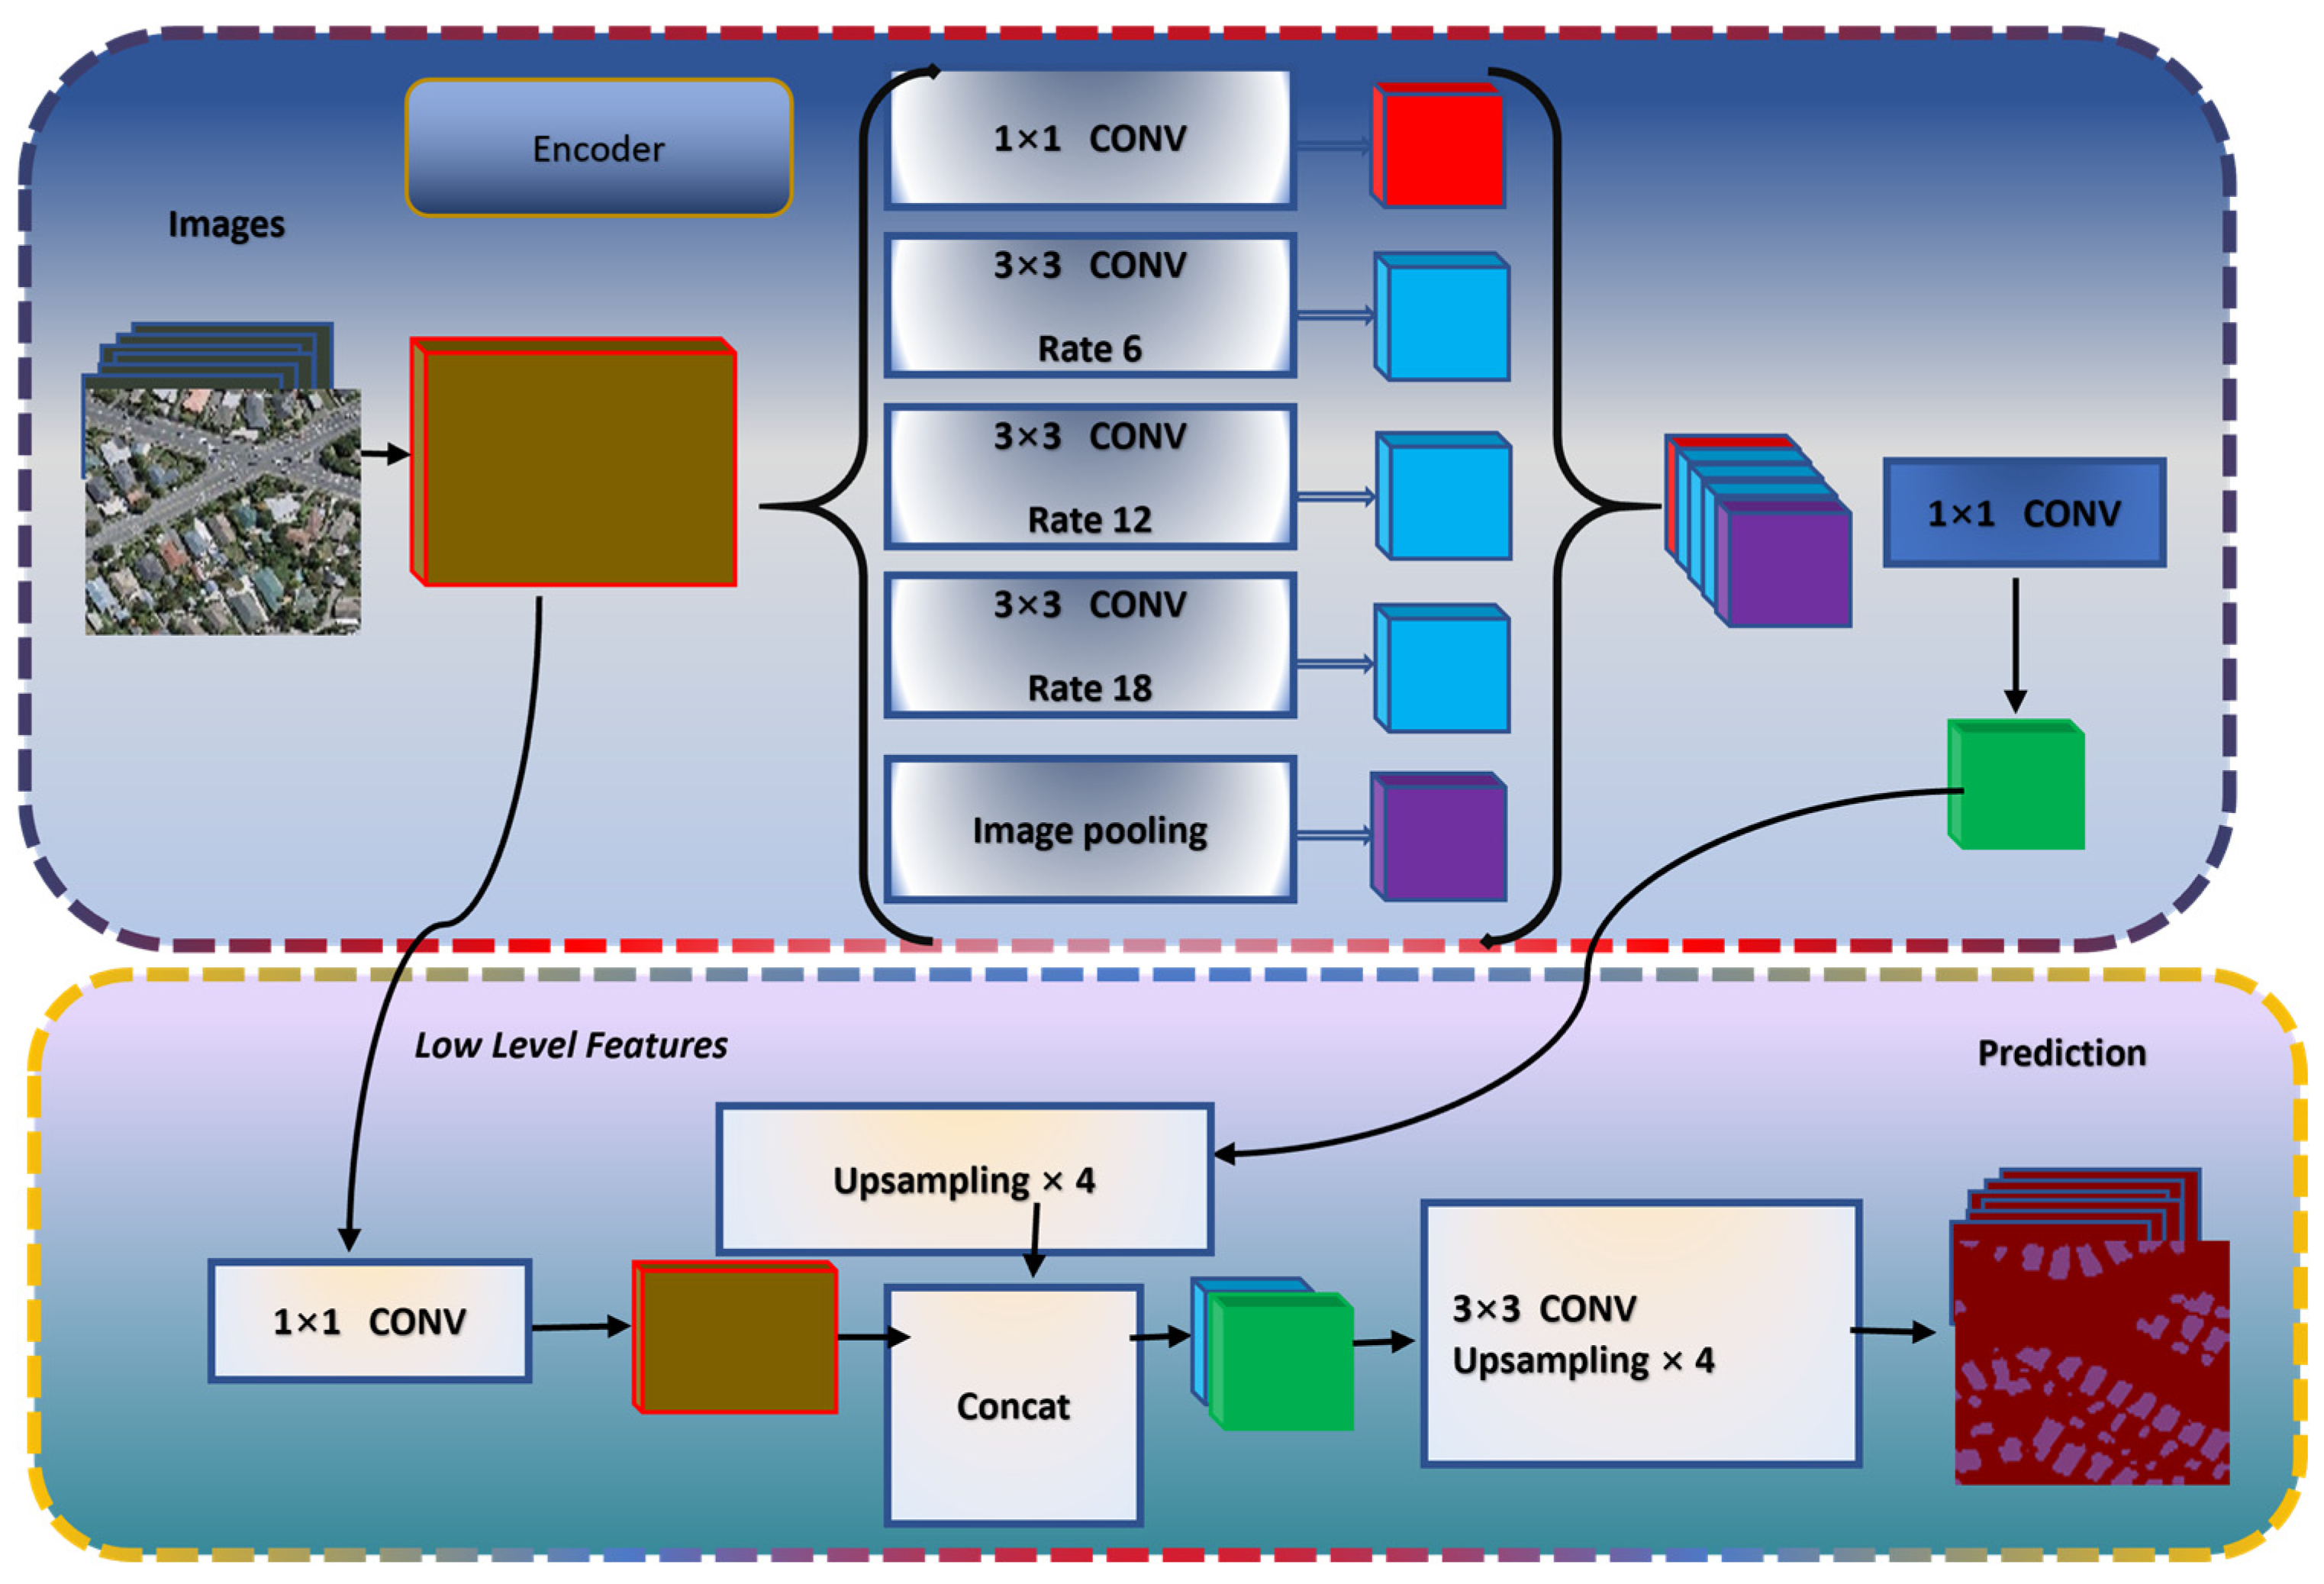
DeeplabV3p [19] A extensively used model with encoder-decoder style and spatial pyramid pooling for capturing a comprehensive framework. Down sampling extracts features, while up sampling uses those features to create a high-resolution segmentation map. This method helps capture both broad and detailed information from the image for accurate segmentation. It is employed to explore its capabilities in the context of rooftop identification. Figure 7 illustrates the architecture diagram of Deeplab3p illustrates the network's segmentation approach, crucial for parsing building structures.
Figure 6.
Architecture of DeeplabV3p.
2.3.4. PP-LiteSeg
PP-LiteSeg[20] A lightweight model with well-organized architecture intended for resource-constrained situations. Its unique architecture is integrated into the study for a comprehensive evaluation. Its streamlined design enables fast inference speeds without compromising much on segmentation accuracy, making it an ideal choice for rooftop segmentation. The Figure 7 architecture diagram showcases the model's segmentation strategy, highlighting its ability to determine rooftop features.
2.4. Matrix
2.4.1. Evaluation the Model
In assessing the performance of each models, a comprehensive set of evaluation metrics was employed. This evaluation was carried out on a diverse dataset of aerial images, ensuring representation across various scenarios. The primary metric utilized was Intersection over Union (IoU), which measures the overlap between predicted segmentation masks and ground truth masks. Additionally, precision, recall, dice score, and accuracy were computed to provide a thorough analysis of the model's performance. IoU quantifies the spatial agreement between predicted and ground truth masks, with a higher IoU value indicating better alignment. Precision measures the proportion of correctly classified rooftop building pixels out of all predicted rooftop building pixels, while recall quantifies the model's ability to identify all relevant building pixels. The dice score combines precision and recall to offer a balanced measure of performance, while accuracy evaluates the overall correctness of predicted segmentations. This research encountered challenges related to complex building structures, varying lighting conditions, and image occlusions. The evaluation methodology employed rigorous evaluation metrics, confirming the effectiveness of the PP-LiteSeg model in building segmentation.
2.4.2. Evaluation Metrices
The confusion matrix serves as an important tool for visually assessing the performance of supervised learning algorithms. It takes the form of a square matrix, typically denoted as (classes, classes), where classes denote the number of classes involved. Each row of the matrix corresponds to instances belonging to the true class, while each column represents instances categorized by the predictive class. Alternatively, the matrix may be oriented such that each row signifies instances classified by the predictive class, and each column corresponds to instances of the true class. The term "confusion matrix" originates from its ability to reveal instances where the system may confuse two classes. For a binary classification system, distinguishing instances into Positive (1) and Negative (0), the matrix typically presents four classification outcomes, as illustrated in Table 1.
TP (True Positive) : indicates a positive example. An instance is positive and is also judged to be positive (False Negative) : indicates a negative example. Underreporting. This is a positive class but judged false classify (False Positive) : indicates a positive example of an error. False alarm. This is a false class but judged to be a positive class.TN (True Negative) : indicates the correct negative example. An instance is a false class and is also determined to be a false class.
2.4.3. Calculation of Metrics
Accuracy Equation 1 represents the percentage of all predictions, both positive and negative, that are correct. While the accuracy rate provides an overall measure of correctness, it may become misleading in scenarios with unbalanced samples, rendering the obtained high accuracy rate meaningless and invalid. The Precision formula is explained in Equation 2. Recalls measures the extent to which the model accurately recollections all correct results. The denominator represents all actual correct results, while the numerator denotes the correctly retrieved results. A high recall rate indicates a higher likelihood of false positives. IoU Equation is the ratio of intersection and merging parts between the predicted region and the real region, which is used to evaluate the correlation between the predicted region and the real region. The higher the IoU, the more accurate the prediction of the model and the better the fitting. MIoU explain in Equation 5 is the average value of IoU in the whole test set, representing the overall performance of the model in the test set. It is used to judge the degree of target capture (to make the prediction label coincide with the annotation as much as possible) and the degree of model accuracy (to make the union coincide as much as possible). The Kappa in equation 6 coefficient serves as a consistency test and can also gauge classification accuracy. Its calculated result ranges from -1 to 1, although kappa typically falls between 0 and 1. It is commonly categorized into five groups to represent varying levels of consistency. Dice coefficient in equation 7 is a similarity measurement function of a set, which is twice the intersection of the predicted region and the real region divided by the predicted region plus the real region. It is usually used to calculate the similarity of two samples, and the value range is between [0,1].
Kappa coefficient (κ) Table 2 have five level of agreement from -1 indicate complete disagreement to +1 perfect agreement, with 0 indicating no better than random chance. Levels of agreement are described with terms like fair (0.21-0.40) or almost perfect(0.81-1.0). Kappa is better than just looking at percent agreement because it considers how much agreement could be due to chance.
3. Result
The ANN model reaches the highest accuracy in rooftop identification compared to the other models. It proves greater performance in terms of Mean Intersection over Union (mIoU). Furthermore, the ANN model shows lower reader and batch costs, making it computationally effective and suitable for large-scale applications. These segmentation evaluations provide a clear understanding of each deep learning model. The exceptional performance of the ANN Model and DANet suggests their suitability for accurate rooftop detection tasks while considering for the limitations of DeepLab3P. PP-LiteSeg, with its balanced metrics, emerges as a practical choice for scenarios requiring a compromise between precision and recall. The results contribute valuable insights for selecting the most appropriate model configuration for rooftop detection, paving the way for advancements in sustainable solar city planning and installation of photovoltaic resources.

Table 3.
Model evaluation metrics, encompass mean Intersection over Union (mIoU), Accuracy (ACC), Kappa, Dice coefficient, Class Precision, and Class.
Table 3.
Model evaluation metrics, encompass mean Intersection over Union (mIoU), Accuracy (ACC), Kappa, Dice coefficient, Class Precision, and Class.
| Model | mIoU | Acc | Kappa | Dice | Class Precision | Class Recall |
| ANN MODEL | 0.8796 | 0.9612 | 0.8686 | 0.934 | 0.9721 0.9104 | 0.9806 0.875 |
| DANet | 0.8504 | 0.9509 | 0.833 | 0.917 | 0.9668 0.8768 | 0.9735 0.8494 |
| Deep Lab 3 | 0.408 | 0.8161 | 0.08 | 0.449 | 0.8161 0. | 0.9951 |
| PP _LITE SEG | 0.8409 | 0.9454 | 0.8215 | 0.911 | 0.9664 0.8548 | 0.9662 0.8555 |
Segmentation performance of each four models enables an evaluation in the selection of models based on their diverse configurations. ANN Model Determines high performance across metrics with an mIoU of 0.8796, accuracy of 0.9612, and robust class precision and recall values. DANet Achieves commendable results, particularly in mIoU and accuracy, with class precision and recall values indicating effective segmentation.DeepLab3p Shows lower performance, particularly in mIoU and Dice coefficient, suggesting limitations in segmentation accuracy compared to other models. PP-LiteSeg Performs well across various metrics, a composed trade-off between precision and recall in class segmentation.
The significant performance metrics during the training phase for four deep-learning models indicate the number of images processed during training shown in Table 4. DANet deals with the largest dataset (8,444 images), while PP-LiteSeg uses 1,527 images that have been Represented in the time taken per training step. PP-LiteSeg stands out with a shorter duration (which reflects the computational cost of processing a batch of images during training. ANN Model has a moderate batch cost of 0.1098 which denotes the computational cost related to data reading during training, through DANet showing a slightly higher reader cost. This table explains each model's efficiency, dataset scale, and training dynamics, assisting in comparing four deep-learning models.
The values for Reader Cost are in scientific notation indicating a very low computational cost associated with the data reading process. A low reader cost is favorable, as it proposes efficient loading of training data, minimizing computational overhead. The Batch Cost values are provided for each model. Lower batch costs are generally desired as they signify efficient processing of image batches during training. For instance, the ANN Model exhibits a moderate batch cost of 0.1098, indicating a reasonable computational load associated with processing batches. Accuracy values represent the ratio of correctly predicted instances to the total instances during training. The ANN Model demonstrates a high accuracy of 0.9612, indicating a strong ability to make correct predictions’ values and provide insights into the model's segmentation performance. The ANN Model excels with a mIoU of 0.8796, suggesting robust delineation of object boundaries. On the other hand, Deep Lab Three exhibits a lower mIoU of 0.408, indicating potential limitations in segmentation accuracy.
Figure 8.
ANN train loss, train Learning rate, batch cost, Reader cost, Mean intersection of union(mIoU), Accuracy The training of ANN involves the optimization of model parameters to achieve a high accuracy shown in Figure 9 Emerges as a standout performer with a remarkable accuracy of 96%, reflecting its robust capabilities in rooftop segmentation.
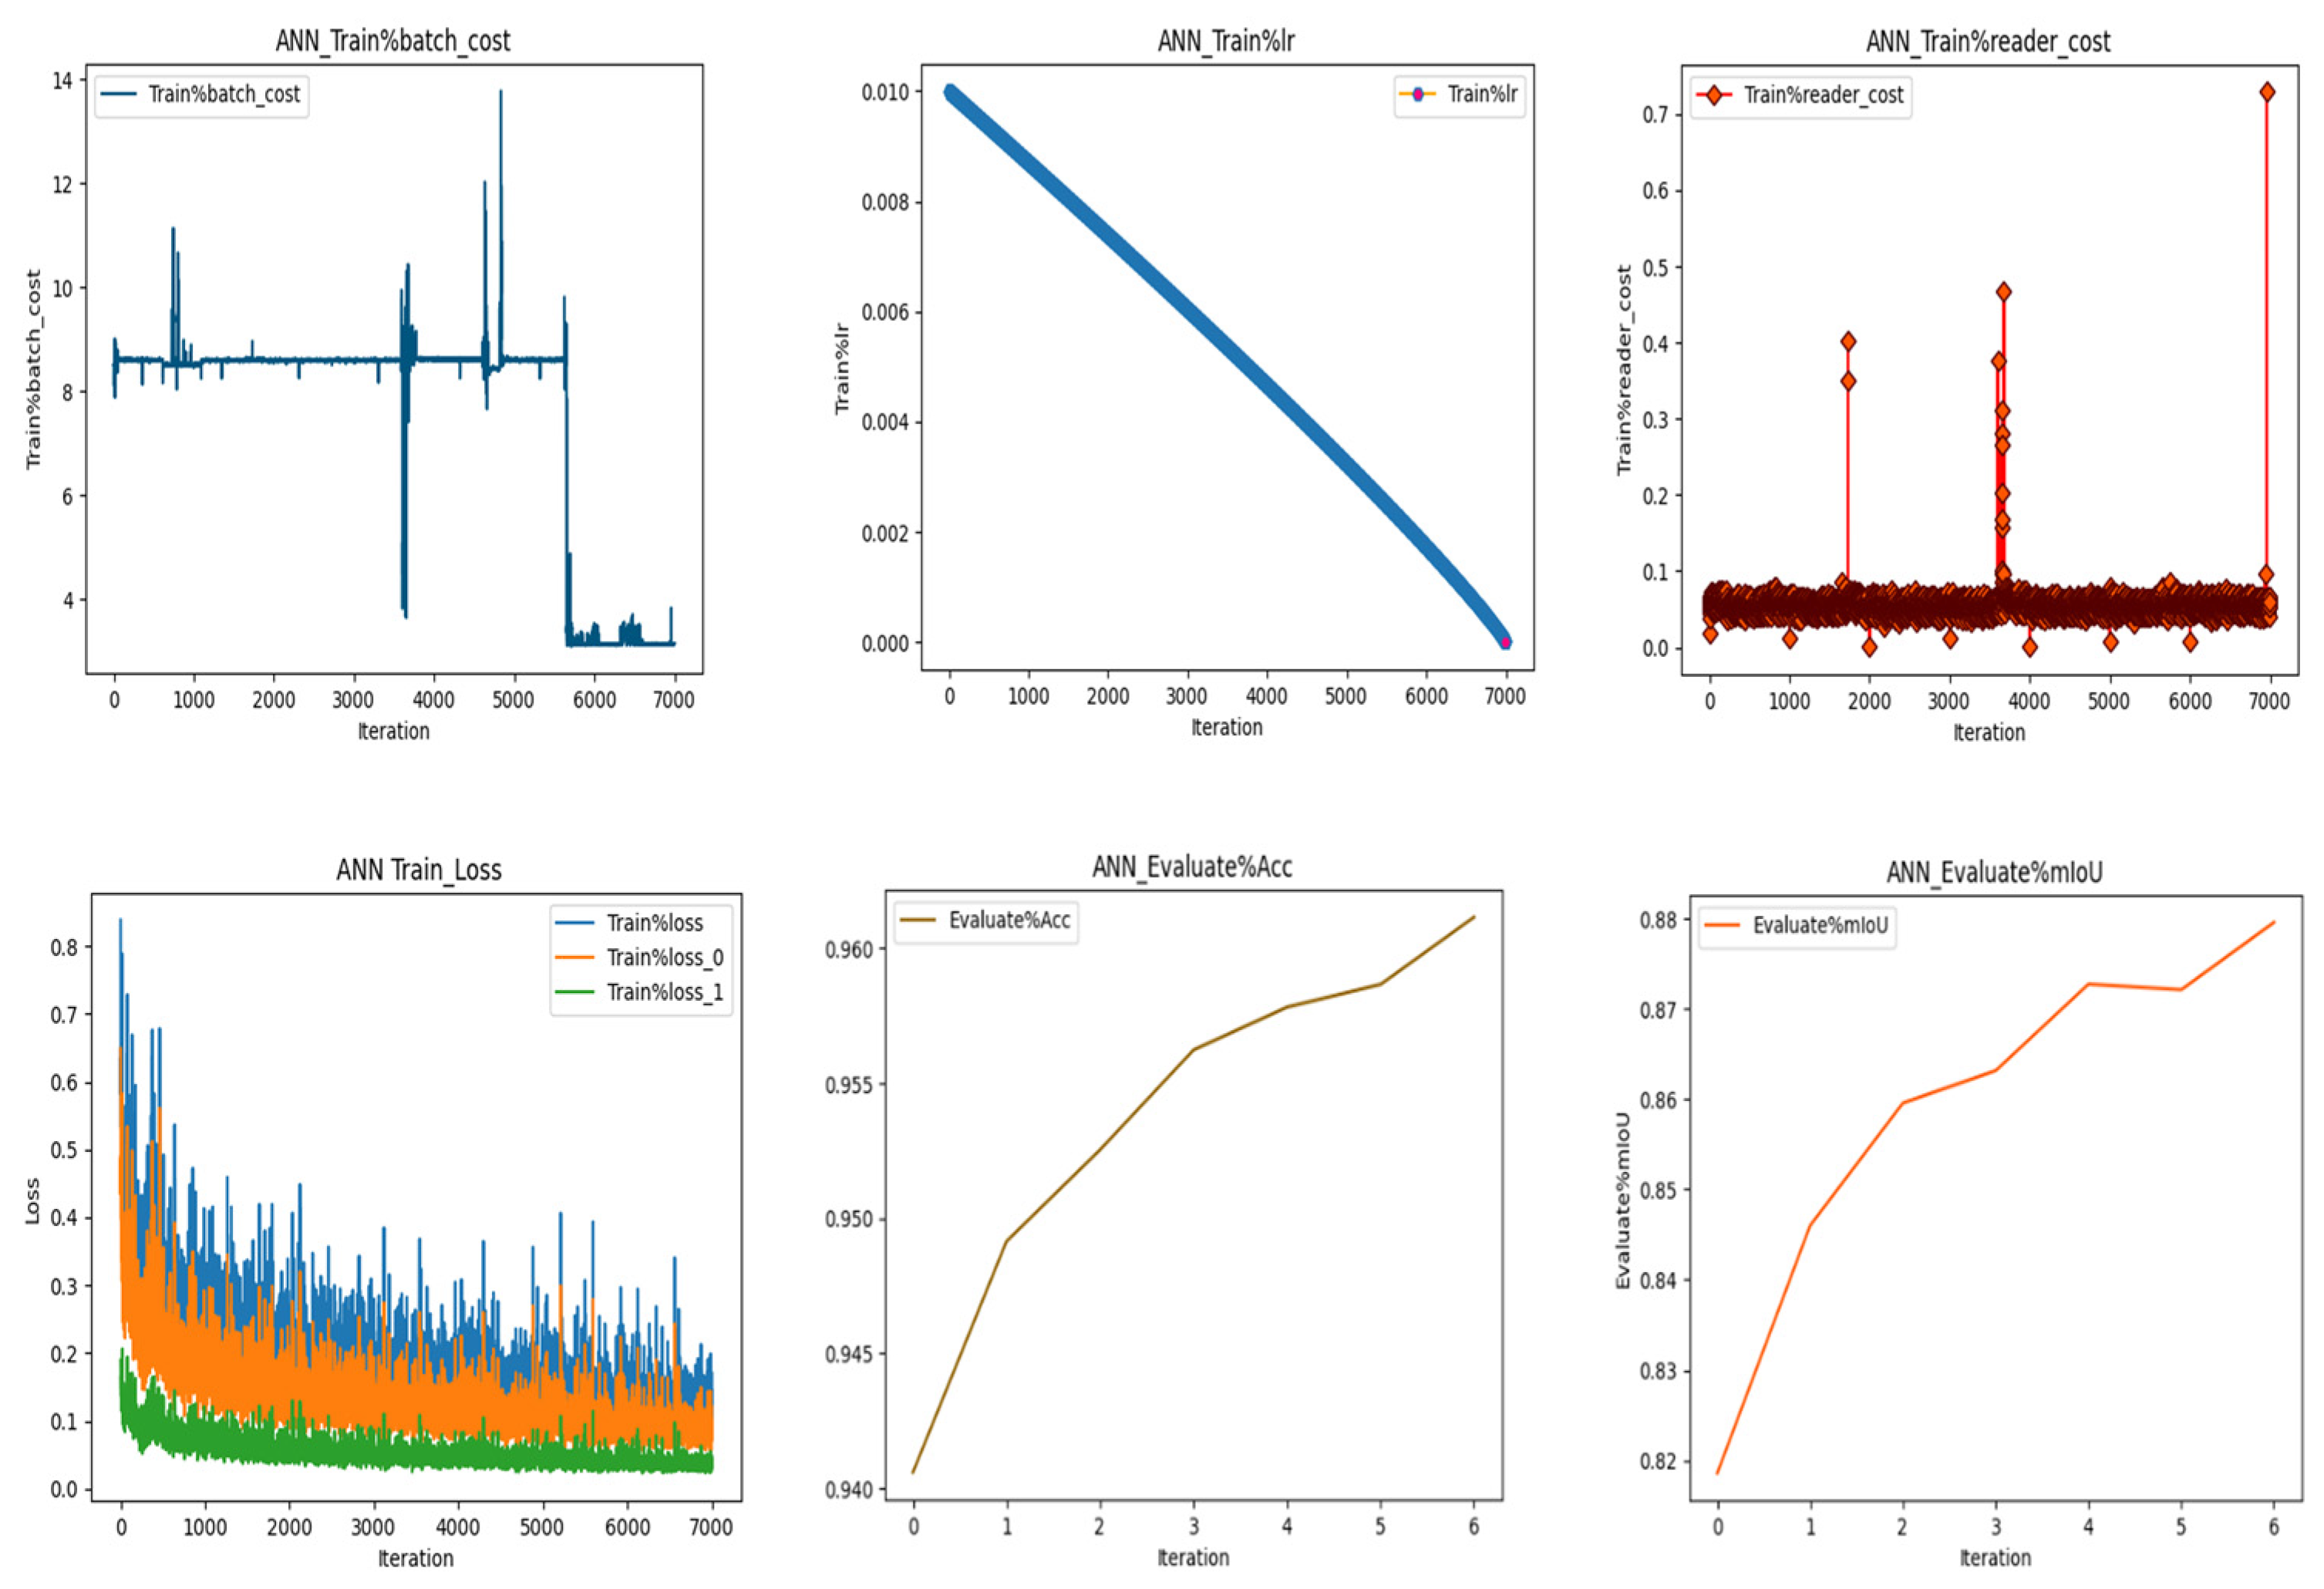
Figure 9.
DANet train loss, train Learning rate, batch cost, Reader cost, Mean intersection of union(mIoU), Accuracy. The find out of well accuracy at 95.09%, showing its efficiency in accurately identifying rooftops in diverse urban landscapes.
Figure 9.
DANet train loss, train Learning rate, batch cost, Reader cost, Mean intersection of union(mIoU), Accuracy. The find out of well accuracy at 95.09%, showing its efficiency in accurately identifying rooftops in diverse urban landscapes.
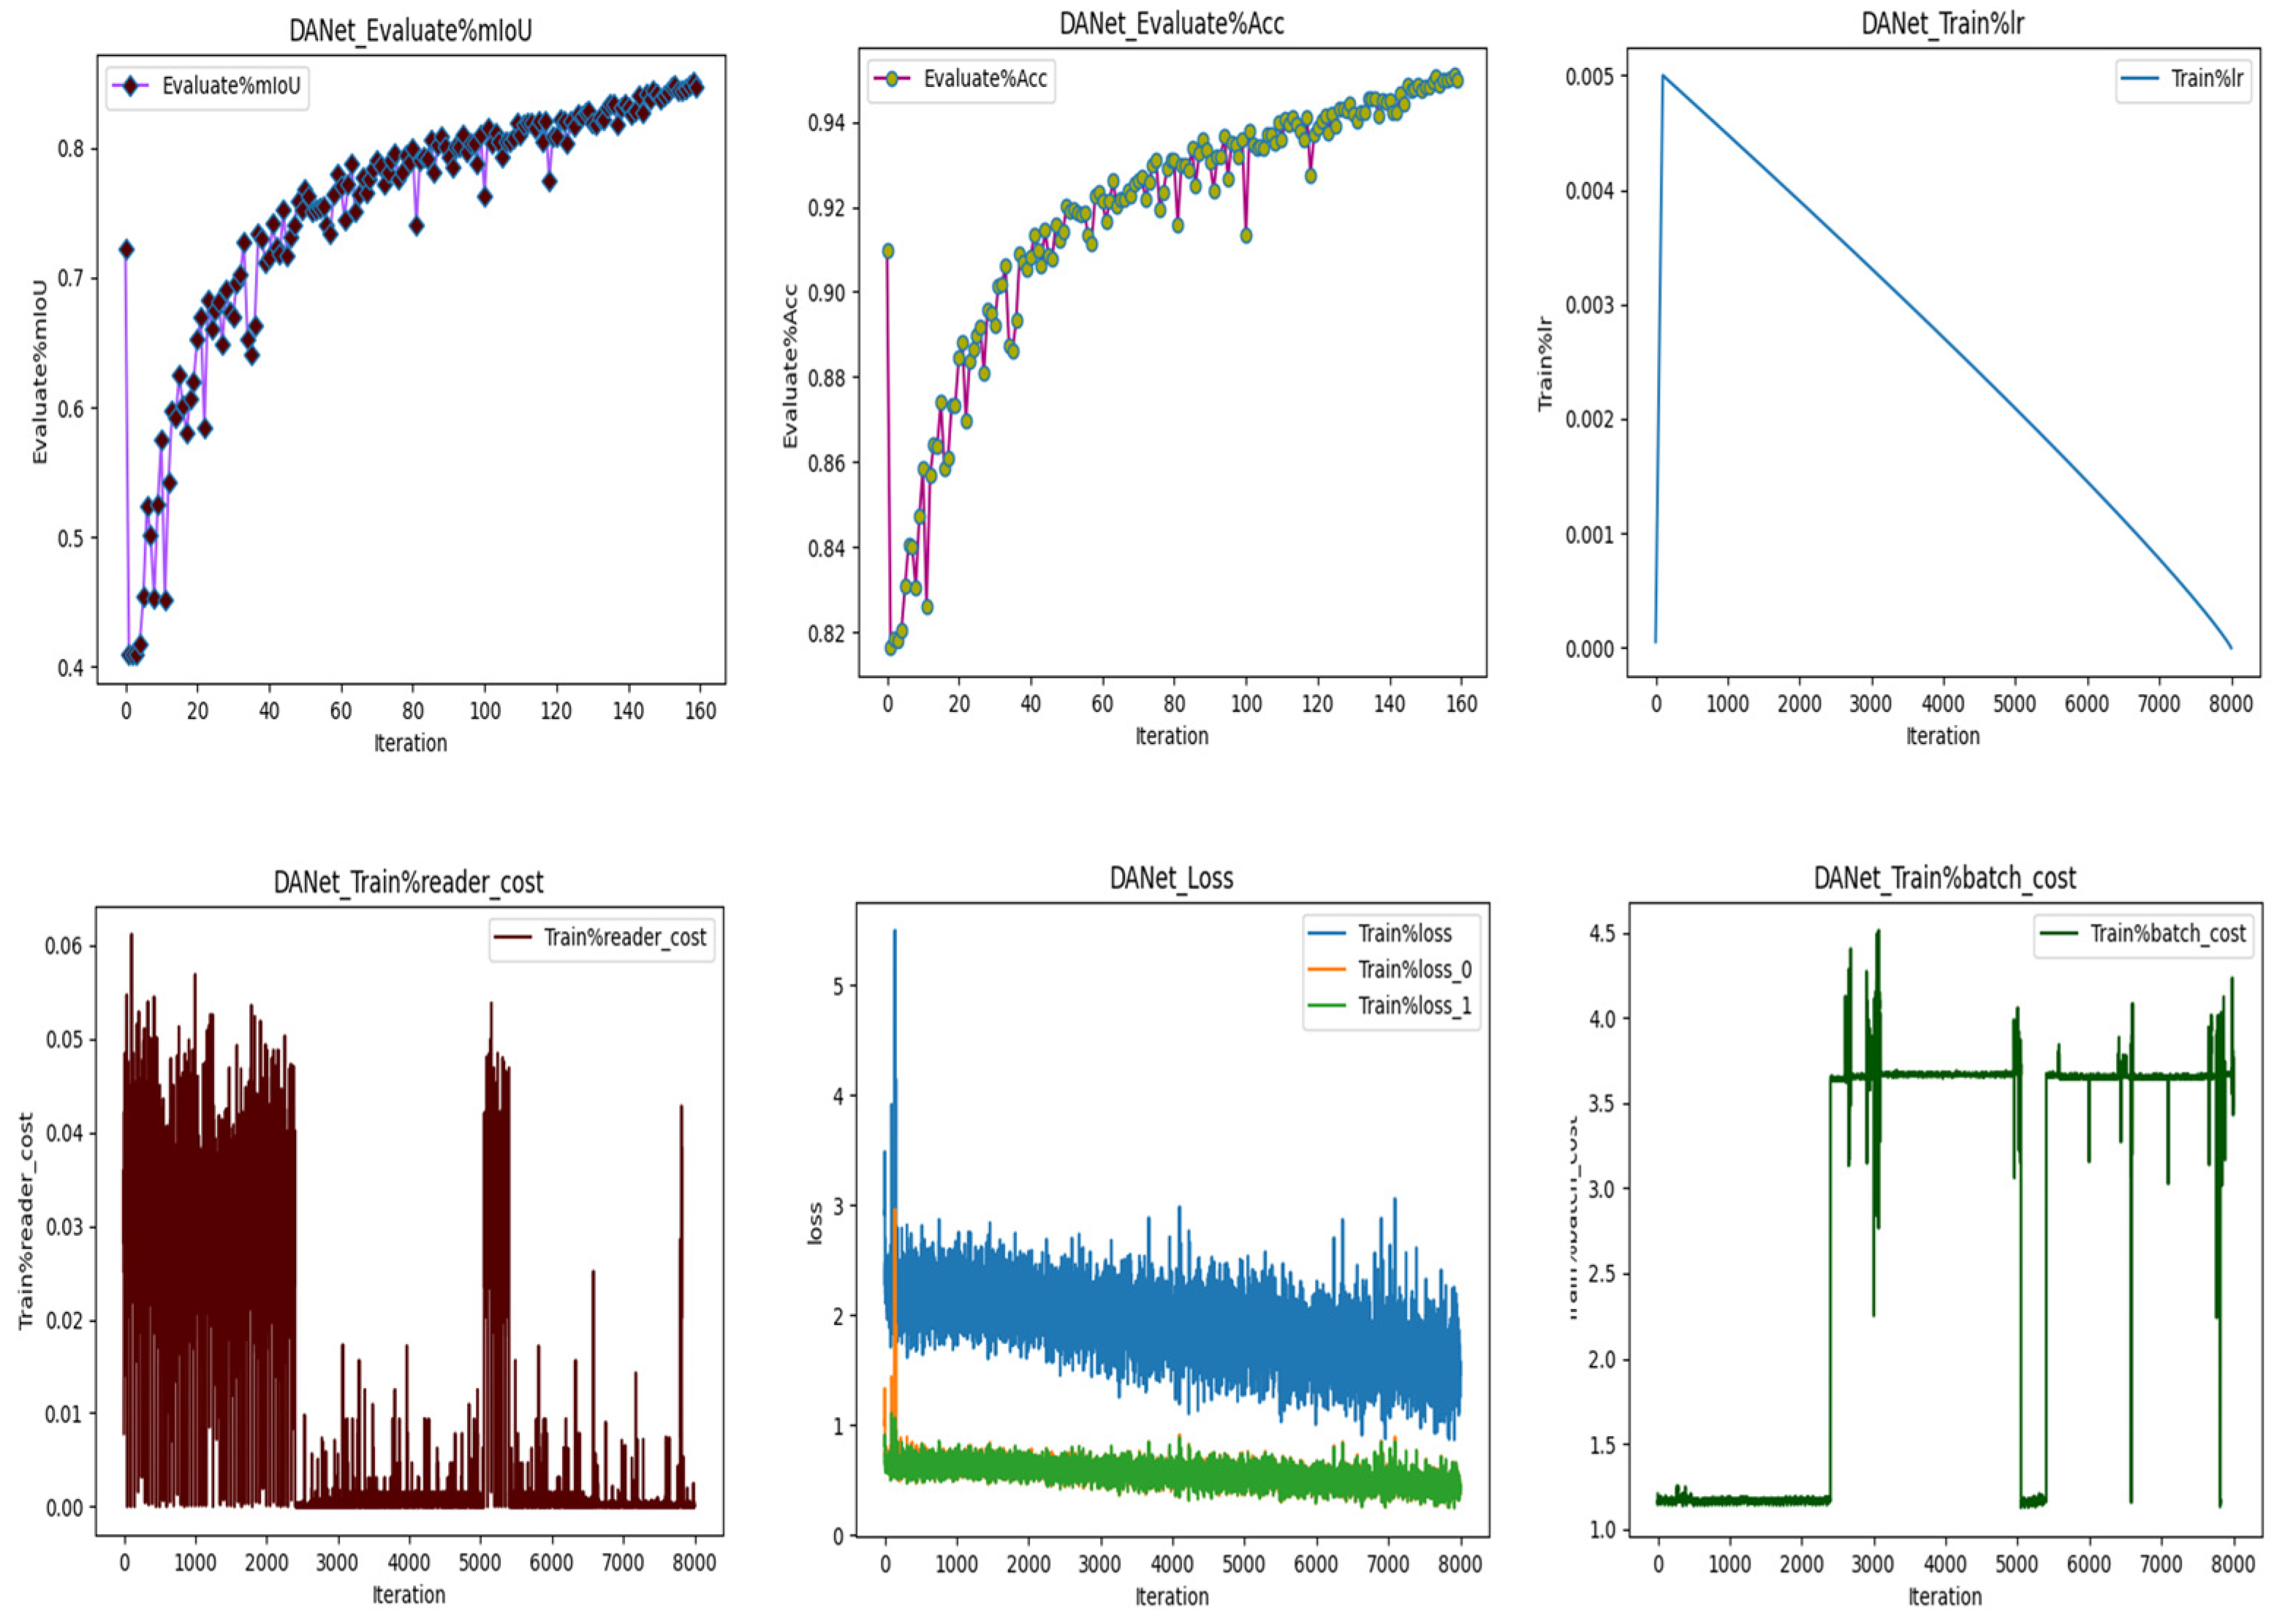
Figure 10.
DeepLabV3p train loss, train Learning rate, batch cost, Reader cost, Mean intersection of union(mIoU), Accuracy Presents challenges with a lower accuracy of 81.61%, indicating potential limitations in handling the intricacies of rooftop structures.
Figure 10.
DeepLabV3p train loss, train Learning rate, batch cost, Reader cost, Mean intersection of union(mIoU), Accuracy Presents challenges with a lower accuracy of 81.61%, indicating potential limitations in handling the intricacies of rooftop structures.
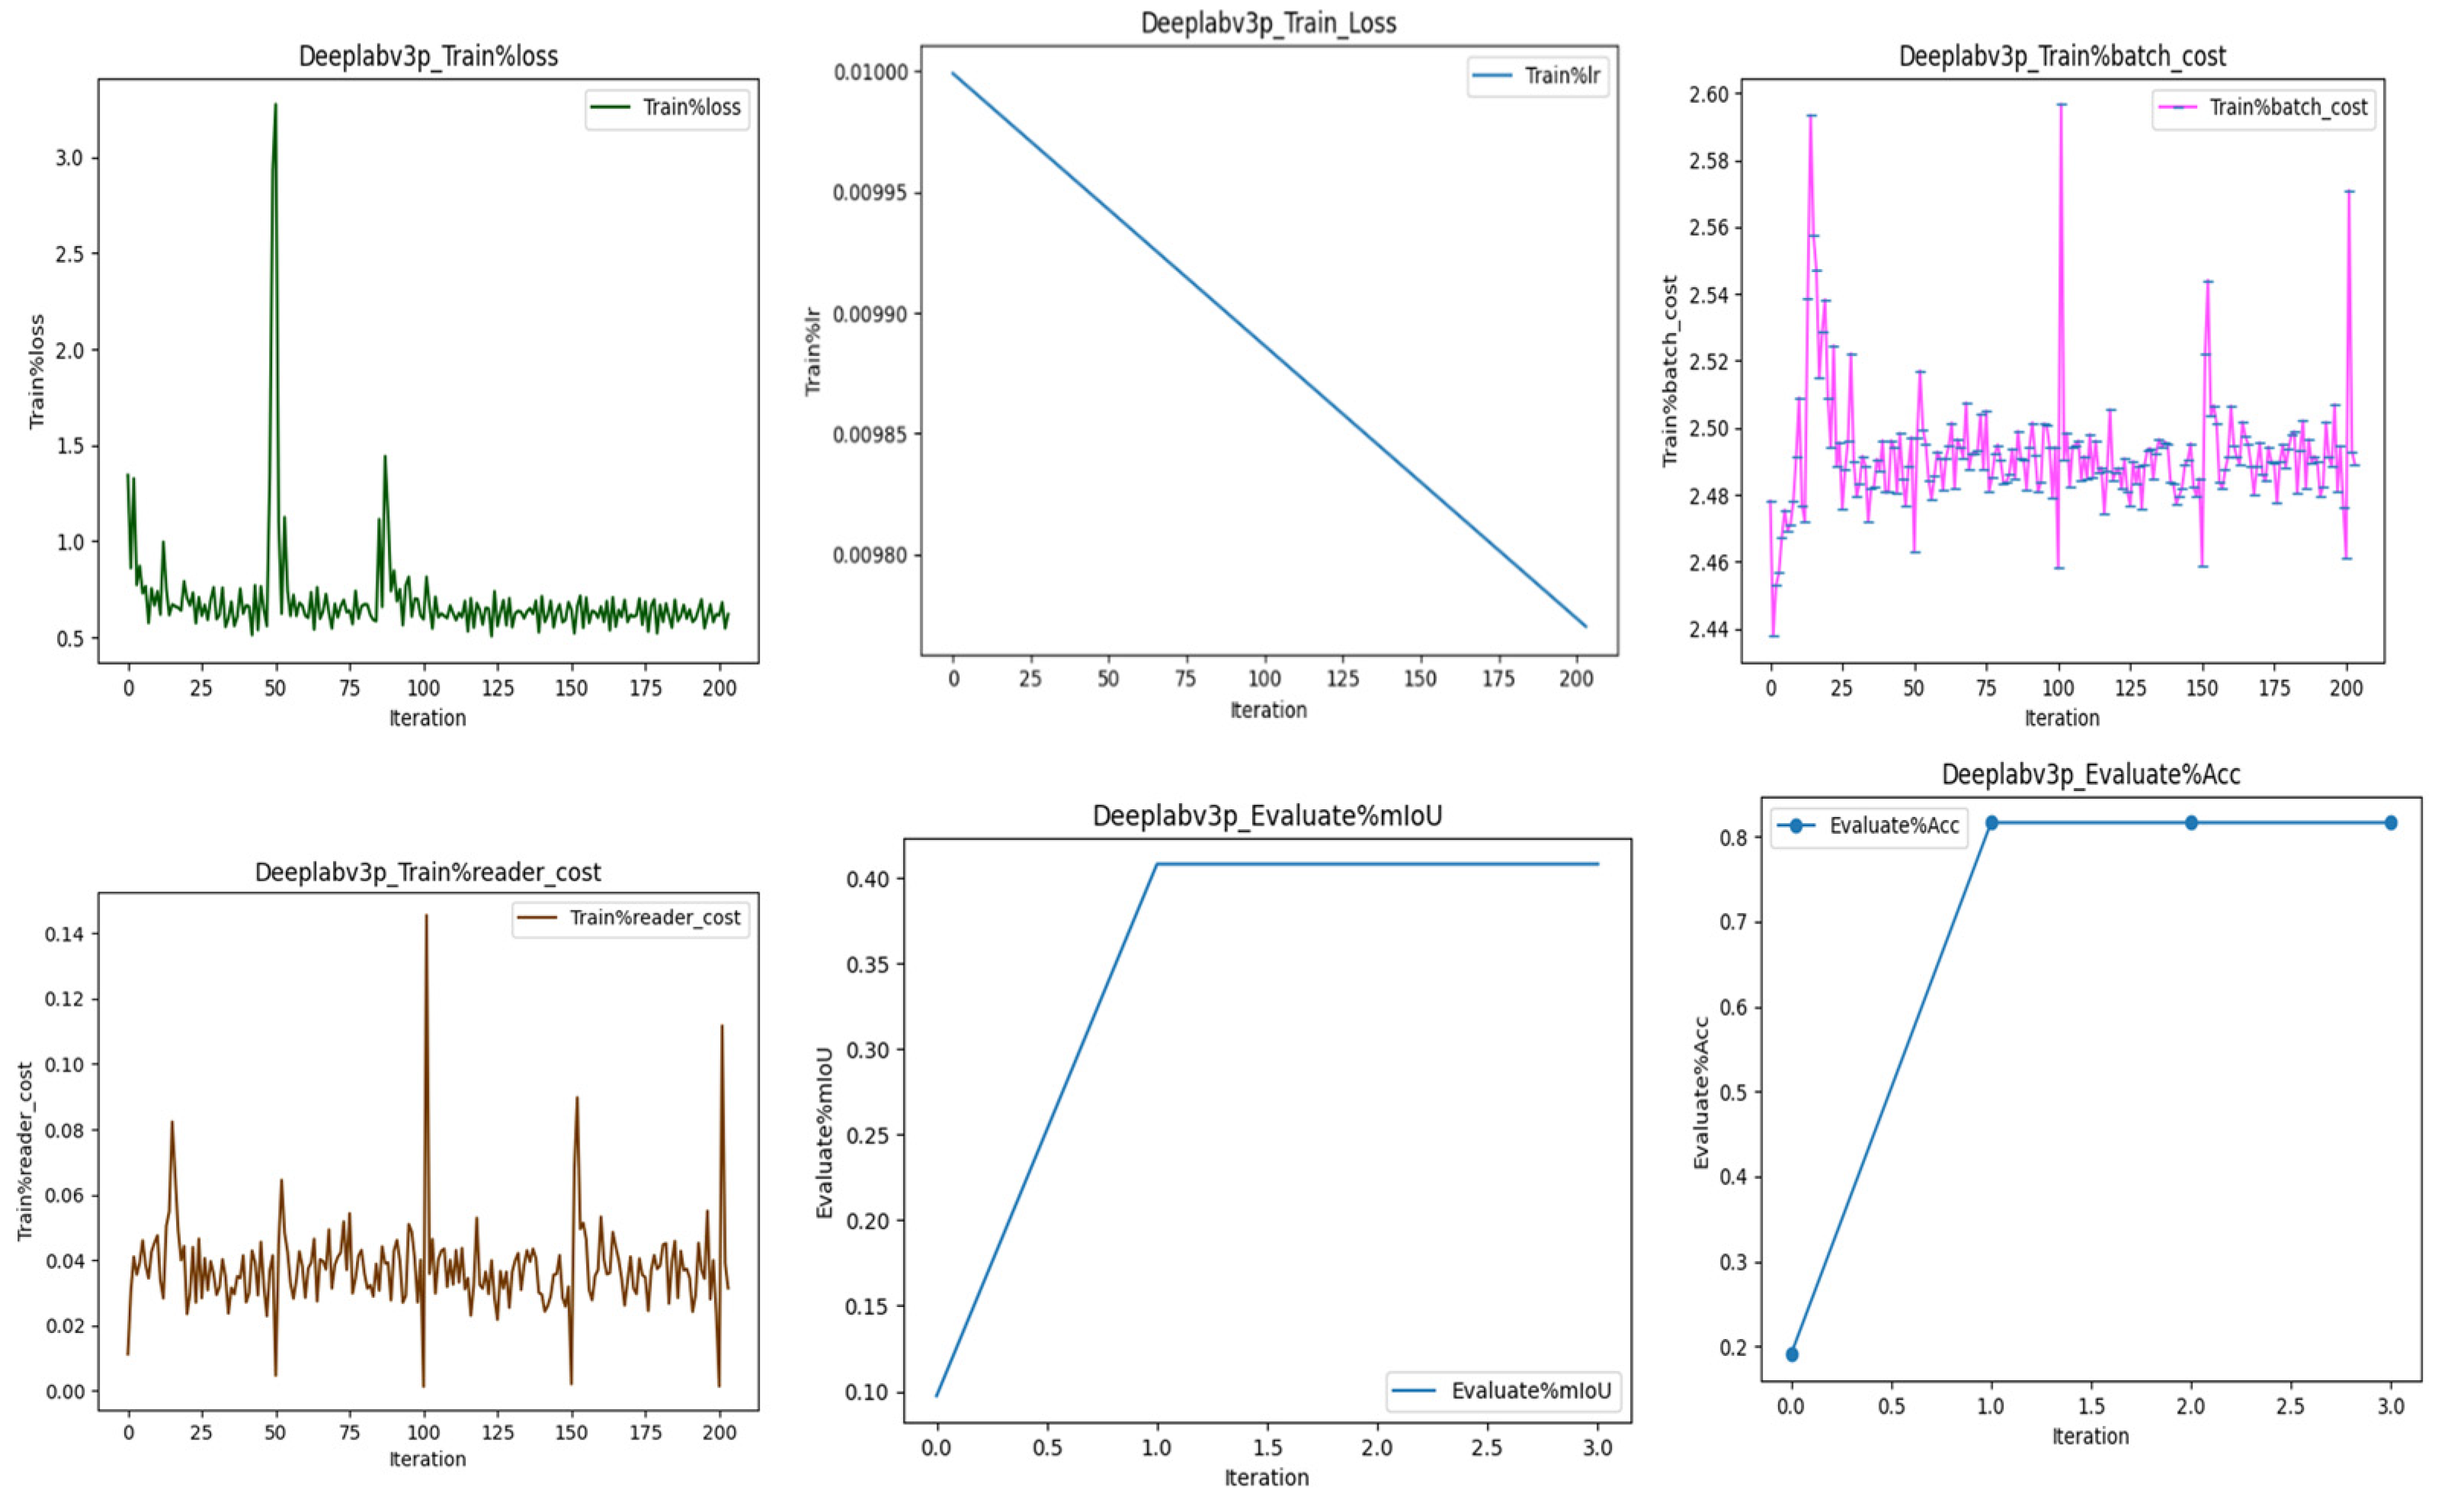
Figure 11.
PP-LiteSeg train loss, train Learning rate, batch cost, Reader cost, Mean intersection of union(mIoU), Accuracy demonstrations of competitive performance with an accuracy of 94.54%, striking a balance between precision and recall in rooftop detection .
Figure 11.
PP-LiteSeg train loss, train Learning rate, batch cost, Reader cost, Mean intersection of union(mIoU), Accuracy demonstrations of competitive performance with an accuracy of 94.54%, striking a balance between precision and recall in rooftop detection .
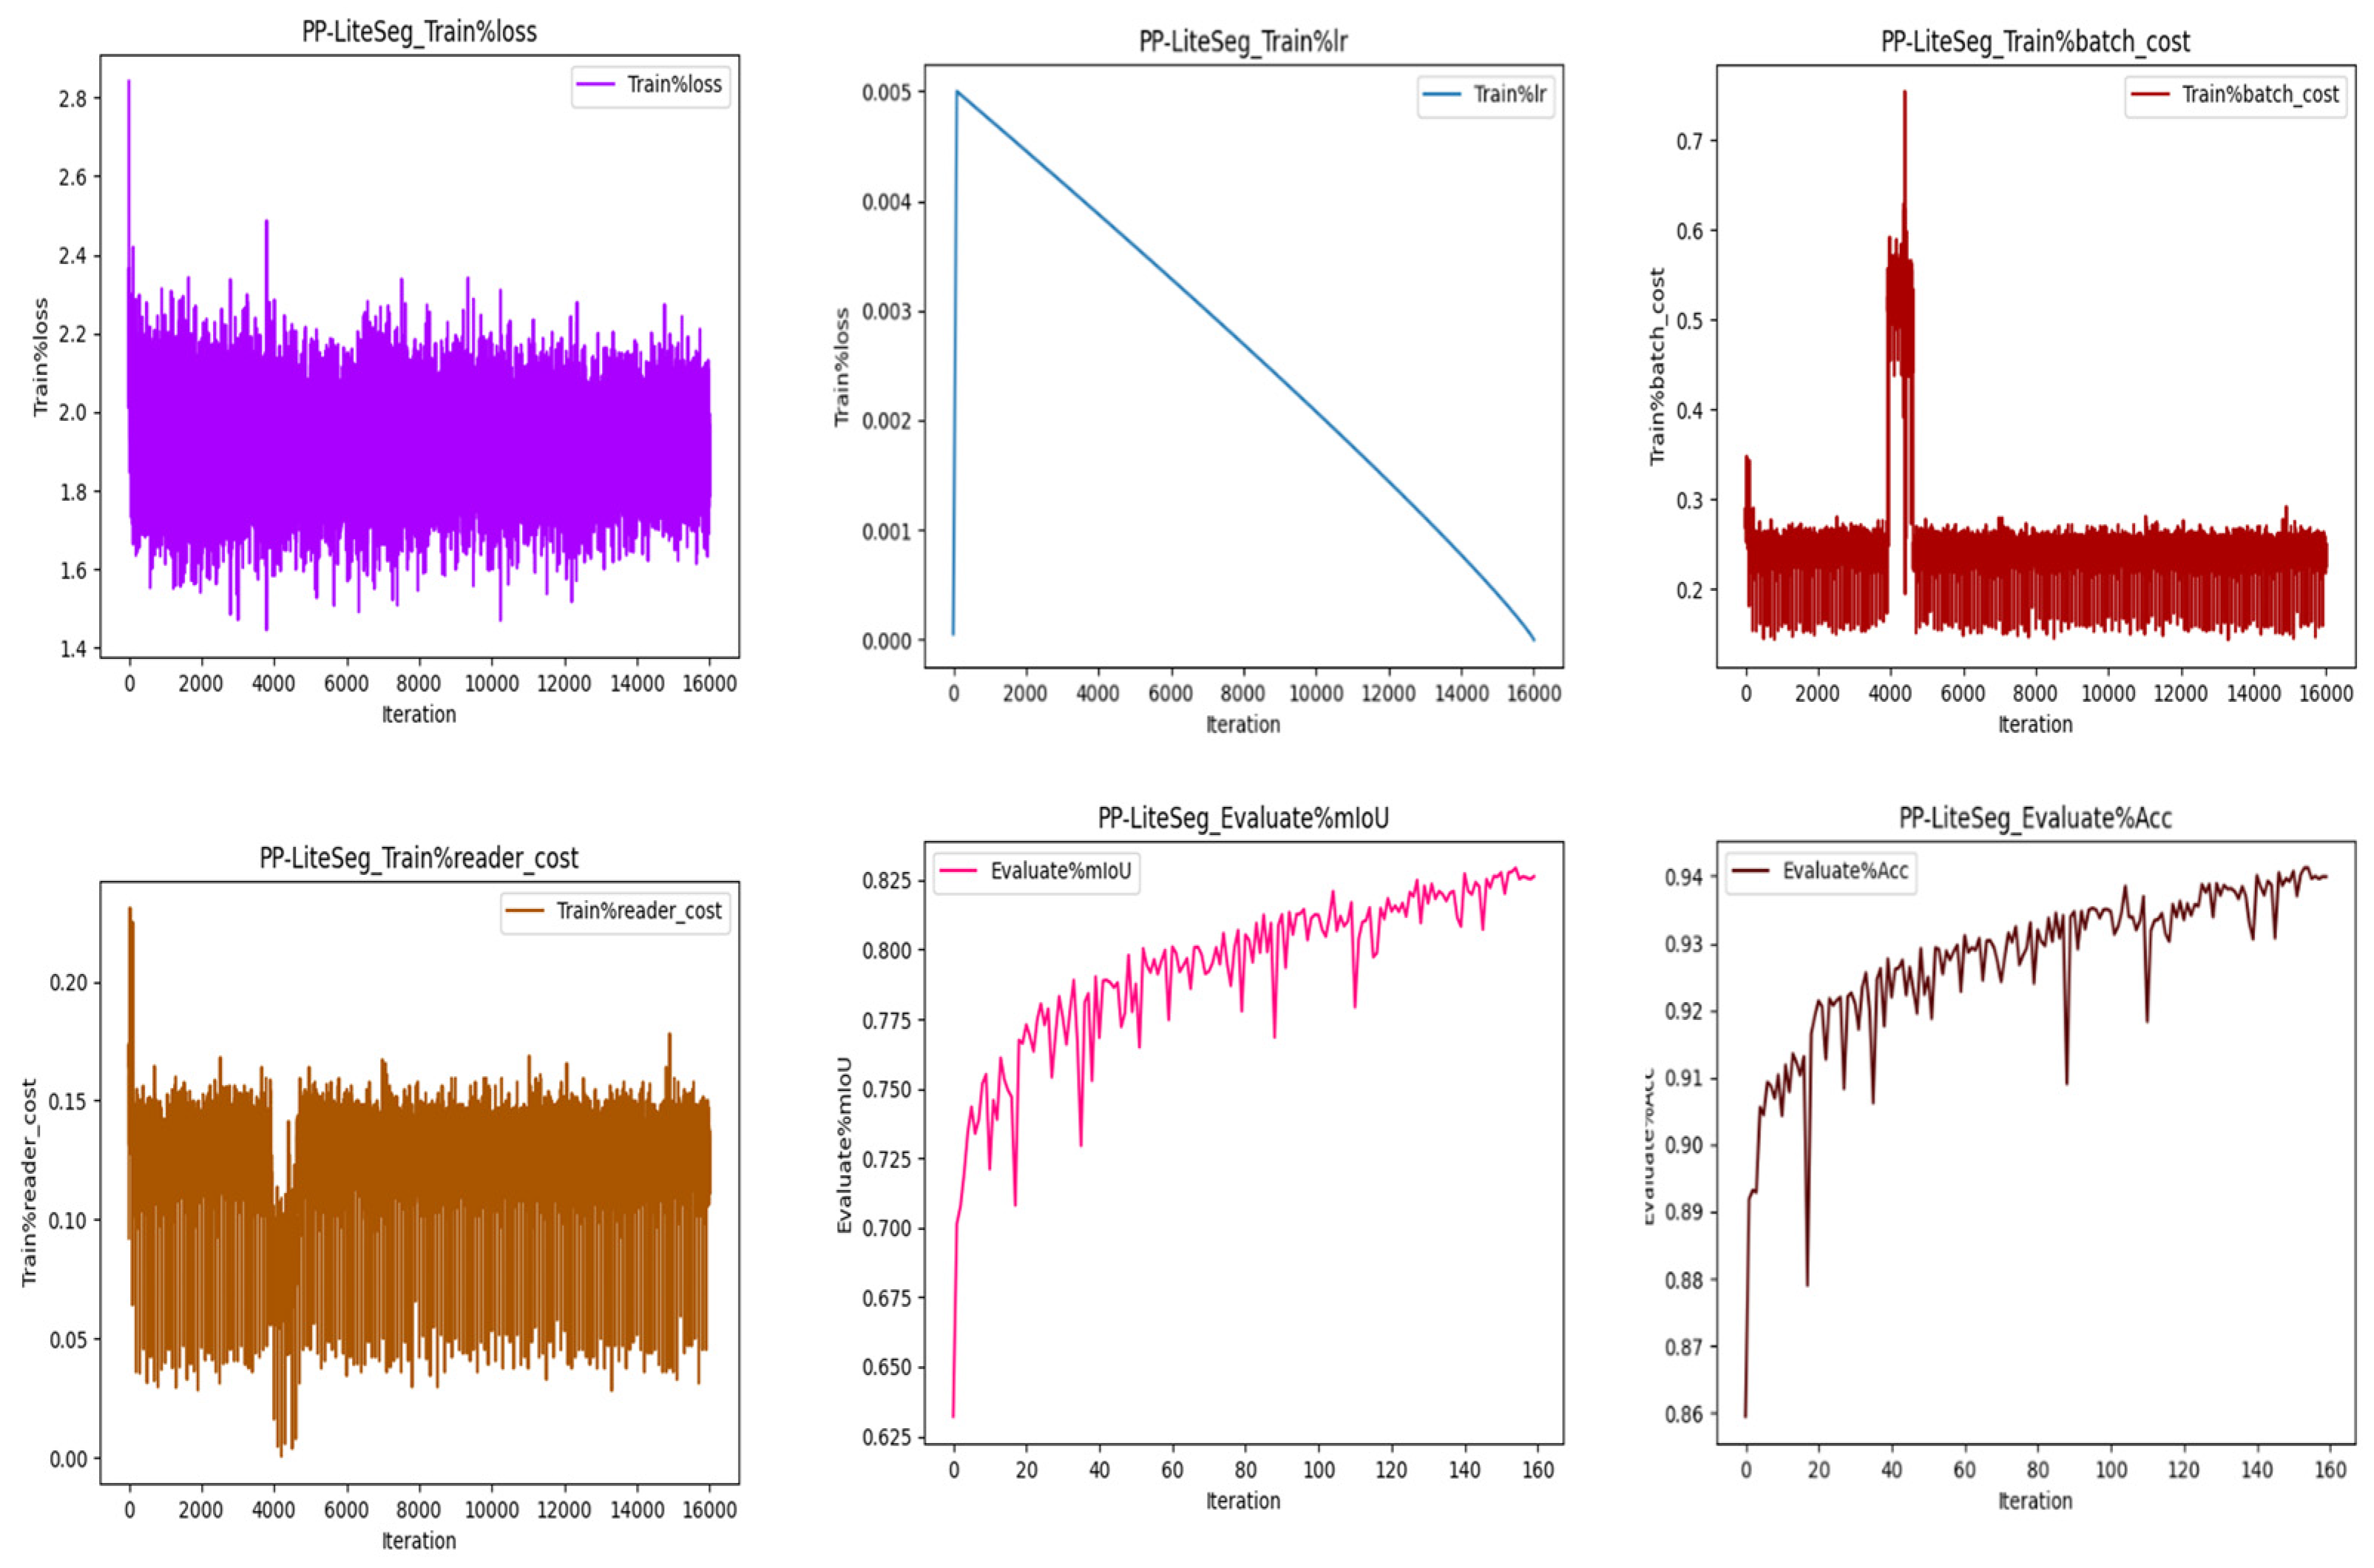
Figure 12.
Comparison of ANN, DANet, Deeplabp3, PPliteseg train loss, train Learning rate, batch cost, Reader cost, Mean intersection of union(mIoU), Accuracy .
Figure 12.
Comparison of ANN, DANet, Deeplabp3, PPliteseg train loss, train Learning rate, batch cost, Reader cost, Mean intersection of union(mIoU), Accuracy .
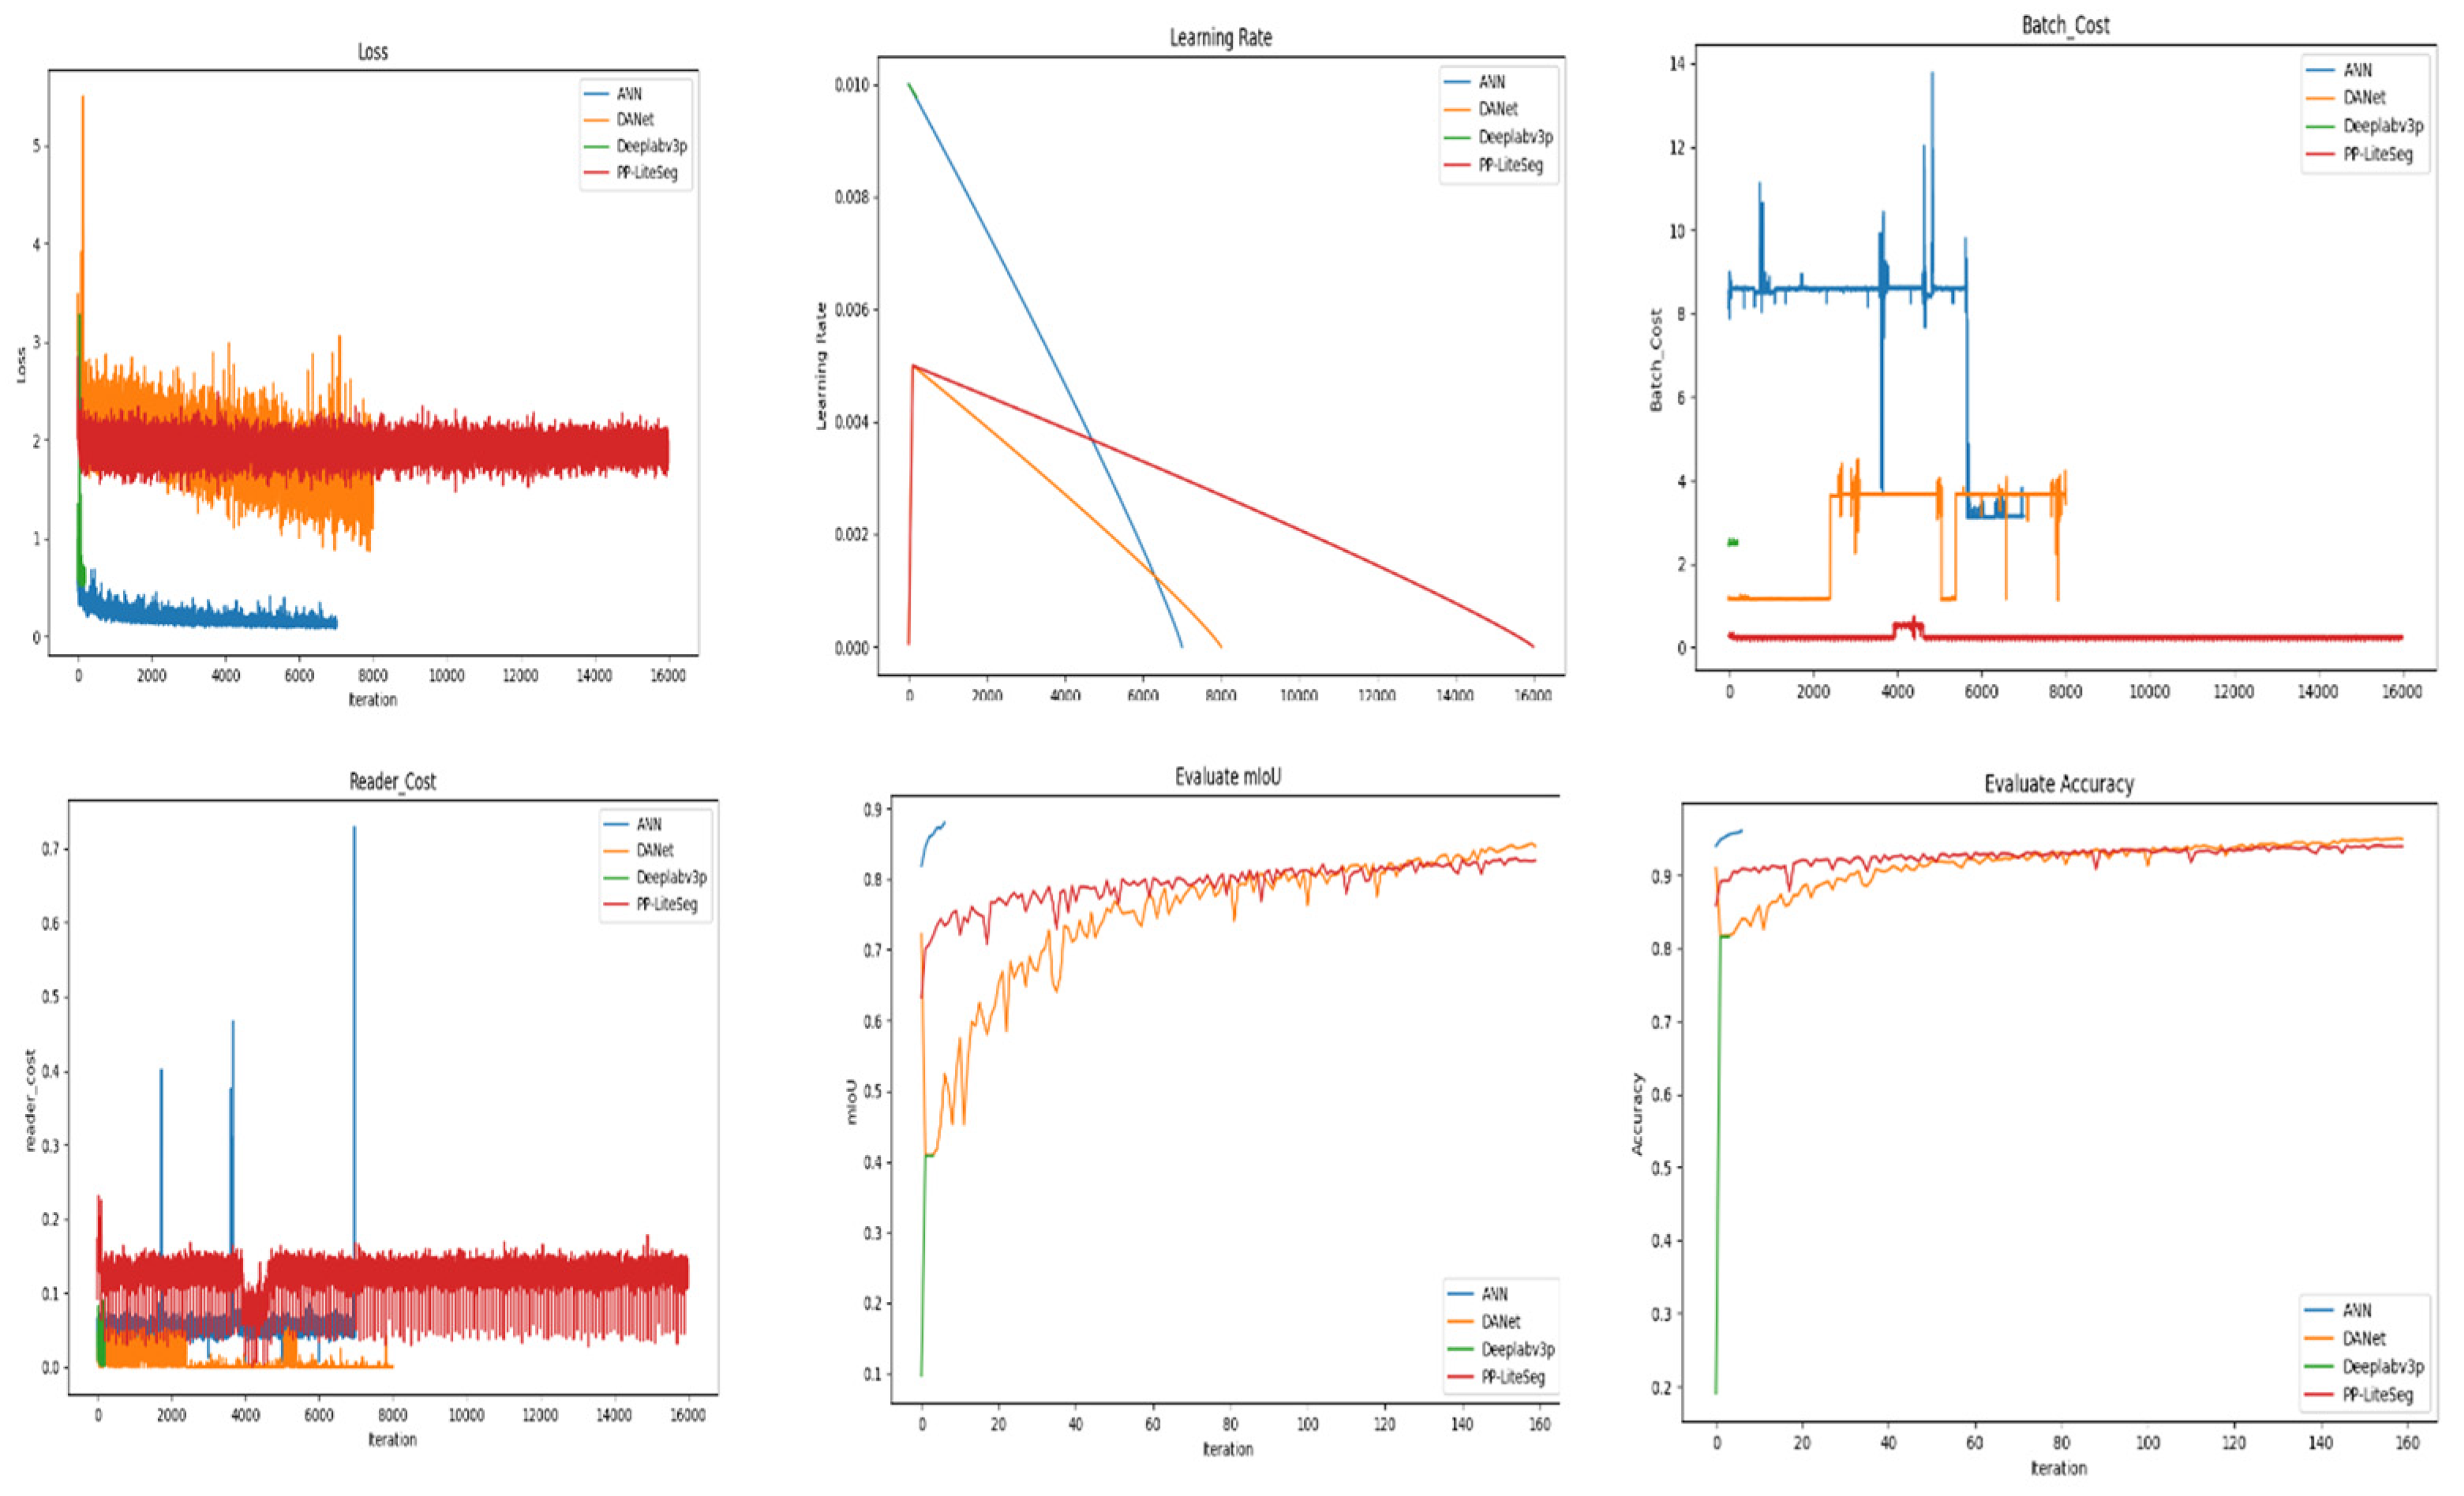
The comparison of ANN, DANet, Deeplab3P, and PP-LiteSeg models highlights differences in training loss, learning rate, batch cost, reader cost, mIoU, and accuracy shown in Figure 13. These metrics offer valuable insights into the models' convergence, computational efficiency, and segmentation performance throughout the training process. The UAV image represents the original aerial view capturing the rooftop landscape. The annotation image serves as the ground truth, highlighting the manually labeled rooftop regions. The prediction image showing the segmentation results produced by the four deep-learning Models. The pseudo-prediction image represents a visual representation of the model's segmentation output with color-coded differences. Consider overlaying Prediction and Annotation images for a direct visual comparison, highlighting areas of agreement and possible differences. Segmentation accuracy of each model by referring to specific instances where rooftops are accurately identified or instances where there may be misclassifications. Pseudo-color images in visualizing the model's segmentation output, emphasizing any visible patterns .
4. Discussion
The study presented a novel framework using deep learning semantic segmentation models to enhance rooftop detection efficiency using UAV remote sensing data. The EISEG technique mitigate the labor-intensive of traditional manual labeling processes. The framework incorporated advanced methods such as Asymmetric Neural Network (ANN), Dual Attention Network (DANet), PP-LiteSeg, and Deeplab3, chosen for their higher performance in automatic rooftop detection.
The results demonstrated significant improvements in automatic rooftop detection, with the ANN model achieving the highest accuracy of 96%, followed closely by DANet at 95.09%, PP-LiteSeg at 94.54%, and Deeplab3 at 81.61%. These findings emphasize the effectiveness of deep learning approaches in accurately identifying rooftop structures from high-resolution UAV images. Furthermore, the study importance of rooftop segmentation for various applications, including urban planning, disaster management, and estimating solar resources for rooftop installations.
The methodology offers a promising path for restructuring rooftop detection processes, thereby saving time and resources. The integration of advanced deep learning models not only enhances accuracy but also quickens processing speeds, reducing dependency on manual labeling efforts. This efficiency is particularly valuable in scenarios where timely rooftop identification is critical, such as disaster response or urban development planning.
5. Conclusions
In the study determines the efficacy of deep learning semantic segmentation models in enhancing rooftop detection accuracy using UAV remote sensing data. EISEG building annotation tool are used it provide User Interface to offers a graphical user interface (GUI) that allows to load geospatial imagery. In UAV annotation images for rooftop detection with two classes, building rooftops and bounding boxes, the process involves marking the rooftops themselves. The visual analysis of UAV images, annotation images, prediction images, and pseudo-prediction images has provided tangible insights into the models' outputs, facilitating a nuanced understanding of segmentation accuracy.
Deep learning models for rooftop dete in UAV images has been explaining individual performances across the Asymmetric Neural Network (ANN Model), DANet, DeepLab3p, and PP-LiteSeg. These models, each with its unique architectural points, have been evaluated based on a various set of metrics. Different datasets are used for verifying that every model is able to identify rooftops in a number of situations and image types. Using different datasets supports to test each model works in different situations. It benefits to see if the models are good at finding rooftops in different types of images and environments setting.
ANN Model Emerges as a standout performer with a remarkable accuracy of 96%, reflecting its robust capabilities in rooftop segmentation. Demonstrates commendable accuracy at 95.09%, showcasing its efficacy in accurately identifying rooftops in diverse urban landscapes.DeepLab3P Presents challenges with a lower accuracy of 81.61%, indicating potential limitations in handling the intricacies of rooftop structures. Exhibits competitive performance with an accuracy of 94.54%, striking a balance between precision and recall in rooftop detection.
The effective identification of rooftops holds profound implications for sustainable urban planning, specifically in strategically placing solar panels for optimal energy efficiency and reduced carbon emissions. Depending on specific application requirements, stakeholders must consider the trade-offs between accuracy and computational efficiency when selecting an appropriate model for rooftop detection in urban landscapes. This study contributes valuable insights to the field of deep learning for sustainable urban planning, with the models serving as tools for automated rooftop identification.
Future work should extend the exploration of model architectures, encompassing enhancements, and adaptations for different urban contexts, ensuring the continued advancement of rooftop detection methodologies.
As the field progresses, continuous improvements in deep learning techniques with remote sensing data will be essential for the refinement and widespread adoption of these models in the realm of smart and sustainable cities.
Author Contributions
Zeenat Khadim Hussain contributed to the conceptualization, methodology, validation, original draft preparation, review and editing of the manuscript throughout the research process. Jiang Congshi was involved in provided supervision and funding acquisition .Yuan Xin contributed to methodology, resourcing. Muhammad Raza e Mustafa and Syed Muhammad Faraz Raza contributed to manuscript review and editing.
Funding
This research was funded by Jiang Congshi.
Data Availability Statement
provide the data used in this study upon request.
Acknowledgments
We extend our gratitude to Wuhan University for providing the research environment. Special thanks to our colleagues for their valuable assistance and feedback during this project
Conflicts of Interest
There is no conflicts of interests
References
- C. He, Y. Liu, D. Wang, S. Liu, L. Yu, and Y. Ren, “Automatic Extraction of Bare Soil Land from High-Resolution Remote Sensing Images Based on Semantic Segmentation with Deep Learning,” Remote Sens. 2023, Vol. 15, Page 1646, vol. 15, no. 6, p. 1646, Mar. 2023. [CrossRef]
- Y. Wang, S. Li, F. Teng, Y. Lin, M. Wang, and H. Cai, “Improved Mask R-CNN for Rural Building Roof Type Recognition from UAV High-Resolution Images: A Case Study in Hunan Province, China,” Remote Sens. 2022, Vol. 14, Page 265, vol. 14, no. 2, p. 265, Jan. 2022. [CrossRef]
- C. M. Friedrich, S. Tian, G. Yao, and S. Chen, “Faster SCDNet: Real-Time Semantic Segmentation Network with Split Connection and Flexible Dilated Convolution,” Sensors 2023, Vol. 23, Page 3112, vol. 23, no. 6, p. 3112, Mar. 2023. [CrossRef]
- B. Yu, L. Yang, and F. Chen, “Semantic Segmentation for High Spatial Resolution Remote Sensing Images Based on Convolution Neural Network and Pyramid Pooling Module,” IEEE J. Sel. Top. Appl. Earth Obs. Remote Sens., vol. 11, no. 9, pp. 3252–3261, Sep. 2018. [CrossRef]
- Y. Hao et al., “EISeg: An Efficient Interactive Segmentation Tool based on PaddlePaddle,” no. October, 2022. [CrossRef]
- J. Byrne, J. Taminiau, L. Kurdgelashvili, and K. N. Kim, “A review of the solar city concept and methods to assess rooftop solar electric potential, with an illustrative application to the city of Seoul,” Renew. Sustain. Energy Rev., vol. 41, pp. 830–844, 2015. [CrossRef]
- S. Xu et al., “Automatic building rooftop extraction from aerial images via hierarchical RGB-D priors,” IEEE Trans. Geosci. Remote Sens., vol. 56, no. 12, pp. 7369–7387, Dec. 2018. [CrossRef]
- P. Li et al., “Understanding rooftop PV panel semantic segmentation of satellite and aerial images for better using machine learning,” Adv. Appl. Energy, vol. 4, p. 100057, Nov. 2021. [CrossRef]
- W. Boonpook, Y. Tan, Y. Ye, P. Torteeka, K. Torsri, and S. Dong, “A Deep Learning Approach on Building Detection from Unmanned Aerial Vehicle-Based Images in Riverbank Monitoring,” Sensors 2018, Vol. 18, Page 3921, vol. 18, no. 11, p. 3921, Nov. 2018. [CrossRef]
- Q. Zhu, Z. Li, Y. Zhang, and Q. Guan, “Building Extraction from High Spatial Resolution Remote Sensing Images via Multiscale-Aware and Segmentation-Prior Conditional Random Fields,” Remote Sens. 2020, Vol. 12, Page 3983, vol. 12, no. 23, p. 3983, Dec. 2020. [CrossRef]
- M. Volpi and D. Tuia, “Deep multi-task learning for a geographically-regularized semantic segmentation of aerial images,” ISPRS J. Photogramm. Remote Sens., vol. 144, pp. 48–60, Oct. 2018. [CrossRef]
- C. Zhang, L. Wang, and R. Yang, “Semantic segmentation of urban scenes using dense depth maps,” Lect. Notes Comput. Sci. (including Subser. Lect. Notes Artif. Intell. Lect. Notes Bioinformatics), vol. 6314 LNCS, no. PART 4, pp. 708–721, 2010. [CrossRef]
- T. Emara, H. E. A. El Munim, and H. M. Abbas, “LiteSeg: A Novel Lightweight ConvNet for Semantic Segmentation,” Dec. 2019. [CrossRef]
- Q. Zhang, R. Qin, X. Huang, Y. Fang, and L. Liu, “Classification of Ultra-High Resolution Orthophotos Combined with DSM Using a Dual Morphological Top Hat Profile,” Remote Sens. 2015, Vol. 7, Pages 16422-16440, vol. 7, no. 12, pp. 16422–16440, Dec. 2015. [CrossRef]
- B. Koonce, “EfficientNet,” Convolutional Neural Networks with Swift Tensorflow, pp. 109–123, 2021. [CrossRef]
- J. Kim, H. Bae, H. Kang, and S. G. Lee, “CNN Algorithm for Roof Detection and Material Classification in Satellite Images,” Electron. 2021, Vol. 10, Page 1592, vol. 10, no. 13, p. 1592, Jul. 2021. [CrossRef]
- Z. Zhu, M. Xu, S. Bai, T. Huang, and X. Bai, “Asymmetric non-local neural networks for semantic segmentation,” Proc. IEEE Int. Conf. Comput. Vis., vol. 2019-Octob, pp. 593–602, 2019. [CrossRef]
- T. J. et al James W, Elston D, “Dual Attention Network for Scene Segmentation,” Andrew’s Dis. Ski. Clin. Dermatology., pp. 3141–3149, 20AD, [Online]. Available: https://api.semanticscholar.org/CorpusID:52180375.
- L.-C. C. and Y. Z. and G. P. and F. S. and H. Adam, “Encoder-Decoder with Atrous Separable Convolution for Semantic Image Segmentation,” in European Conference on Computer Vision, 2018. [Online]. Available: https://api.semanticscholar.org/CorpusID:3638670.
- J. Peng et al., “PP-LiteSeg: A Superior Real-Time Semantic Segmentation Model,” 2022, [Online]. Available: http://arxiv.org/abs/2204.02681.
Figure 2.
UAV images Annotating of Rooftops.
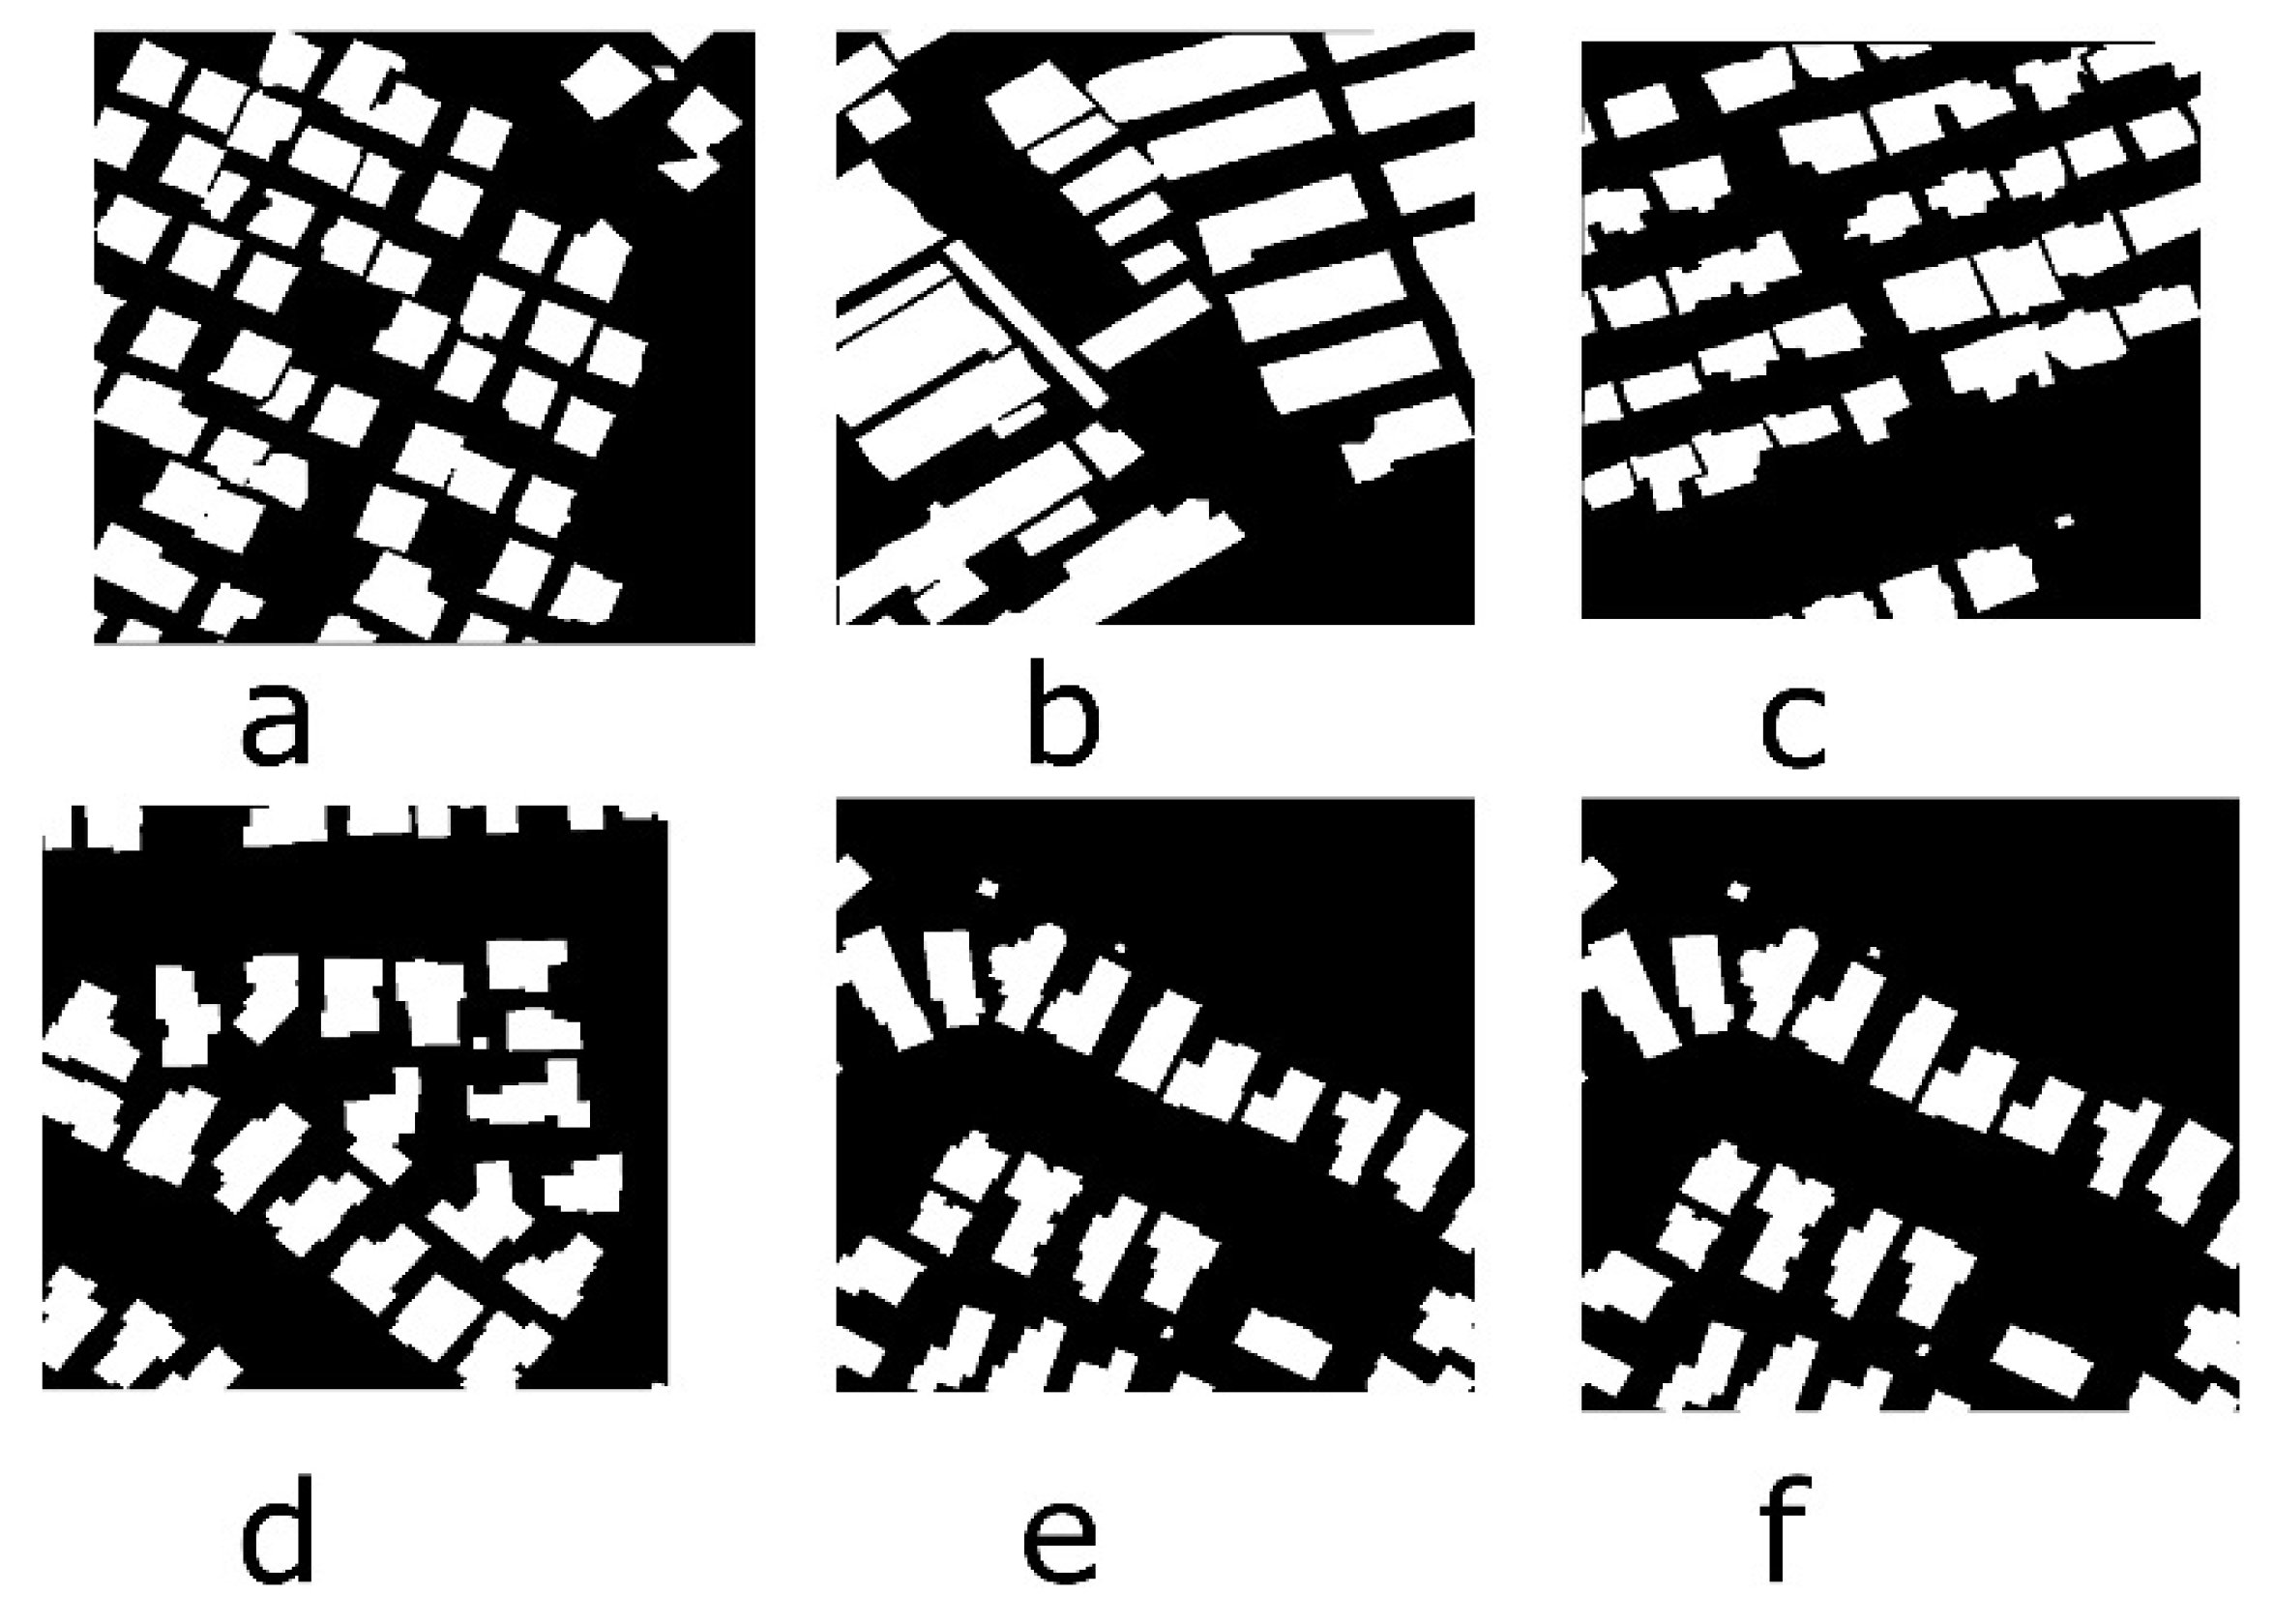
Figure 3.
Flowchart of Novel Architecture of Roof-Top Detection.
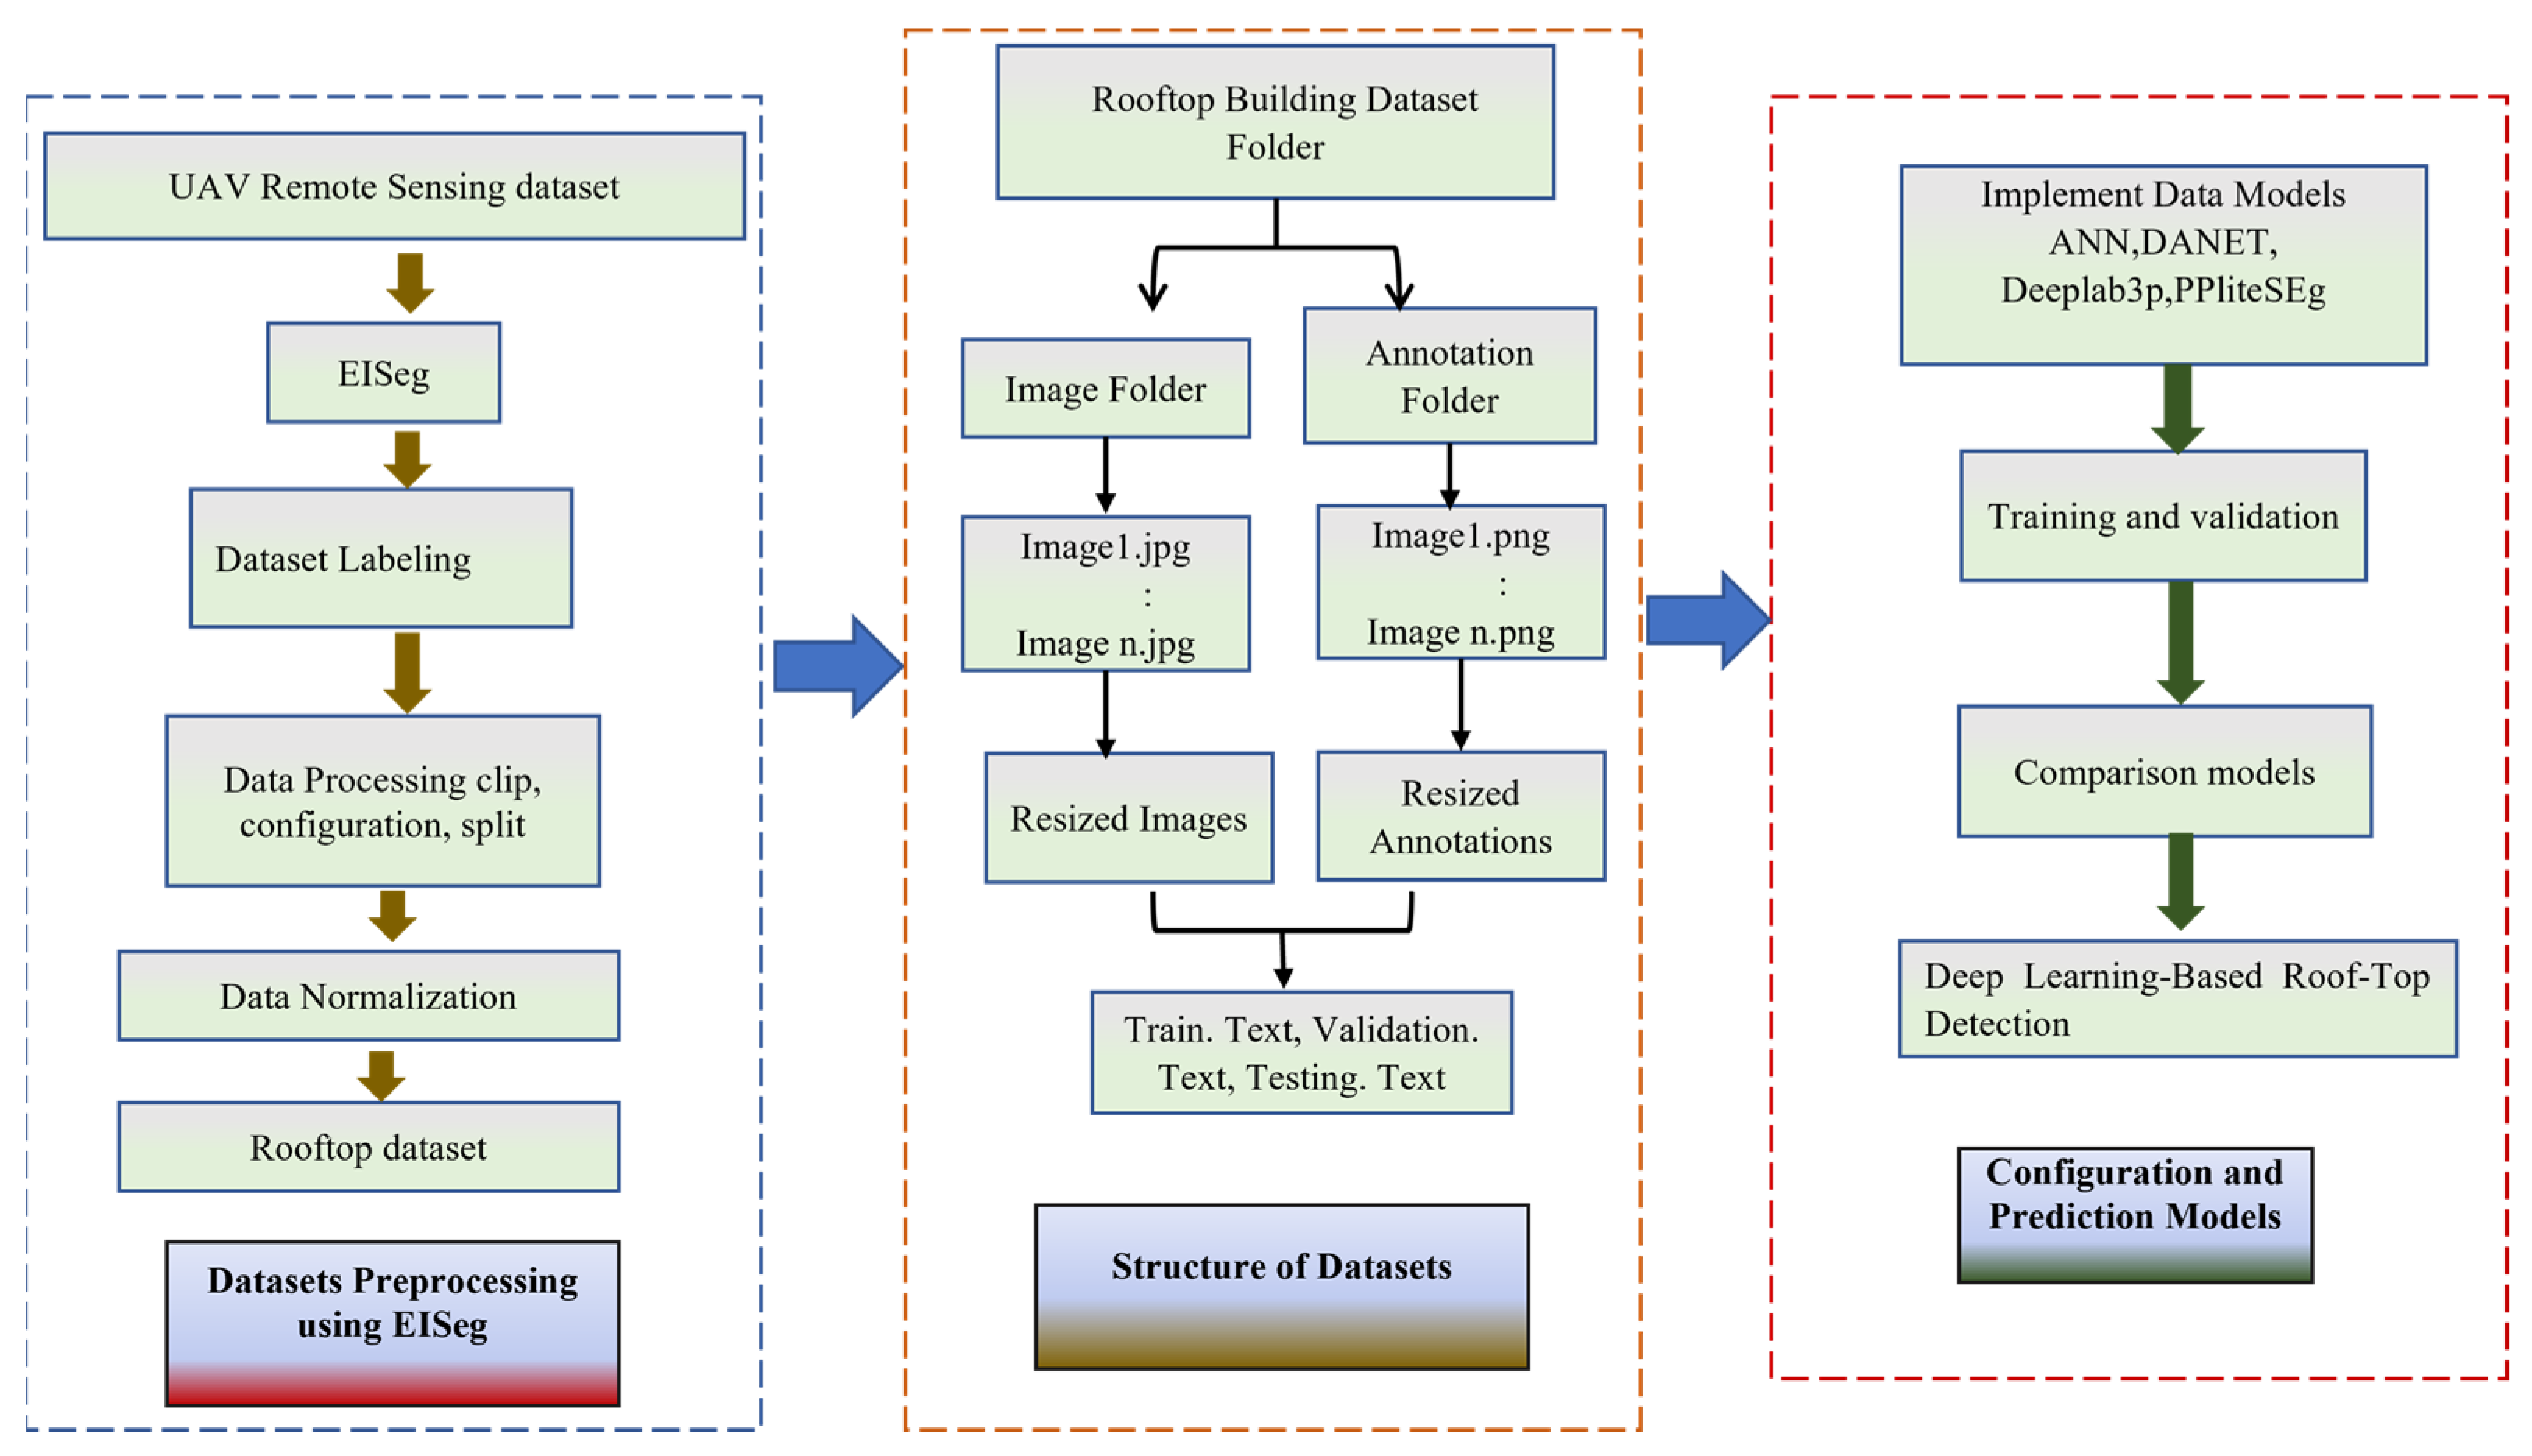
Figure 4.
Architecture of Asymmetric Neural Network (ANN).
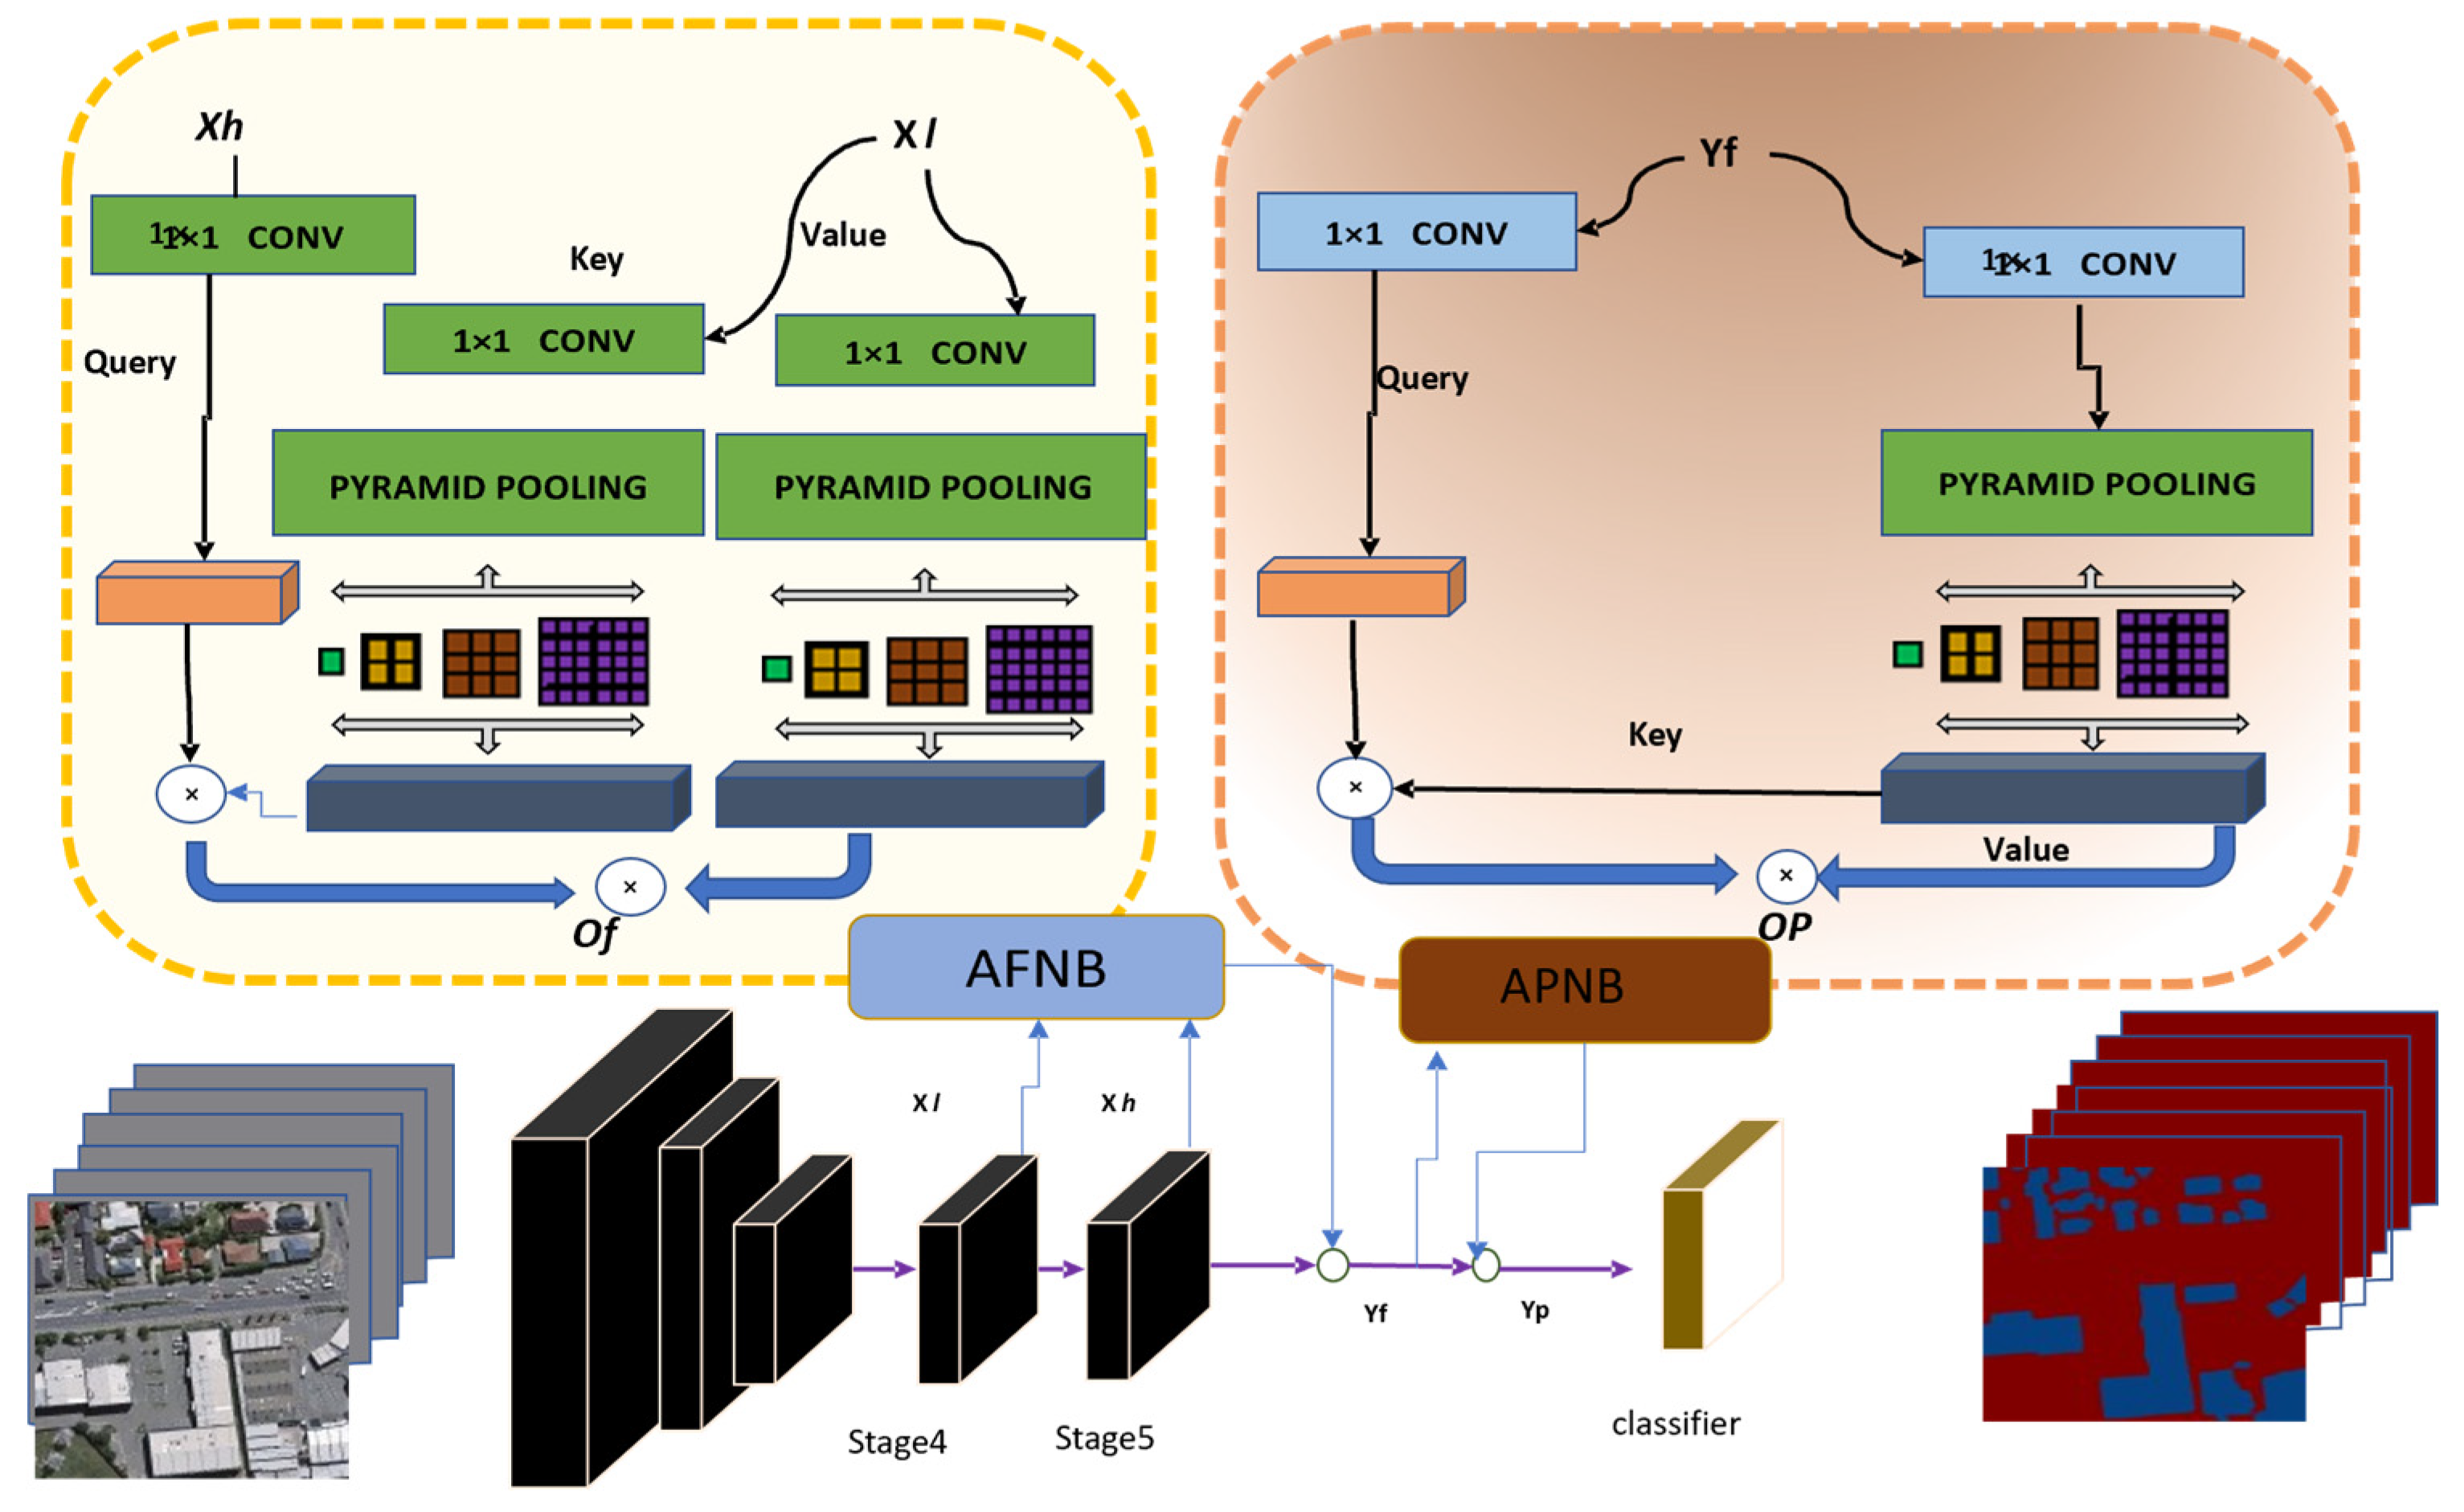
Figure 5.
Architecture of Dual Attention Network.
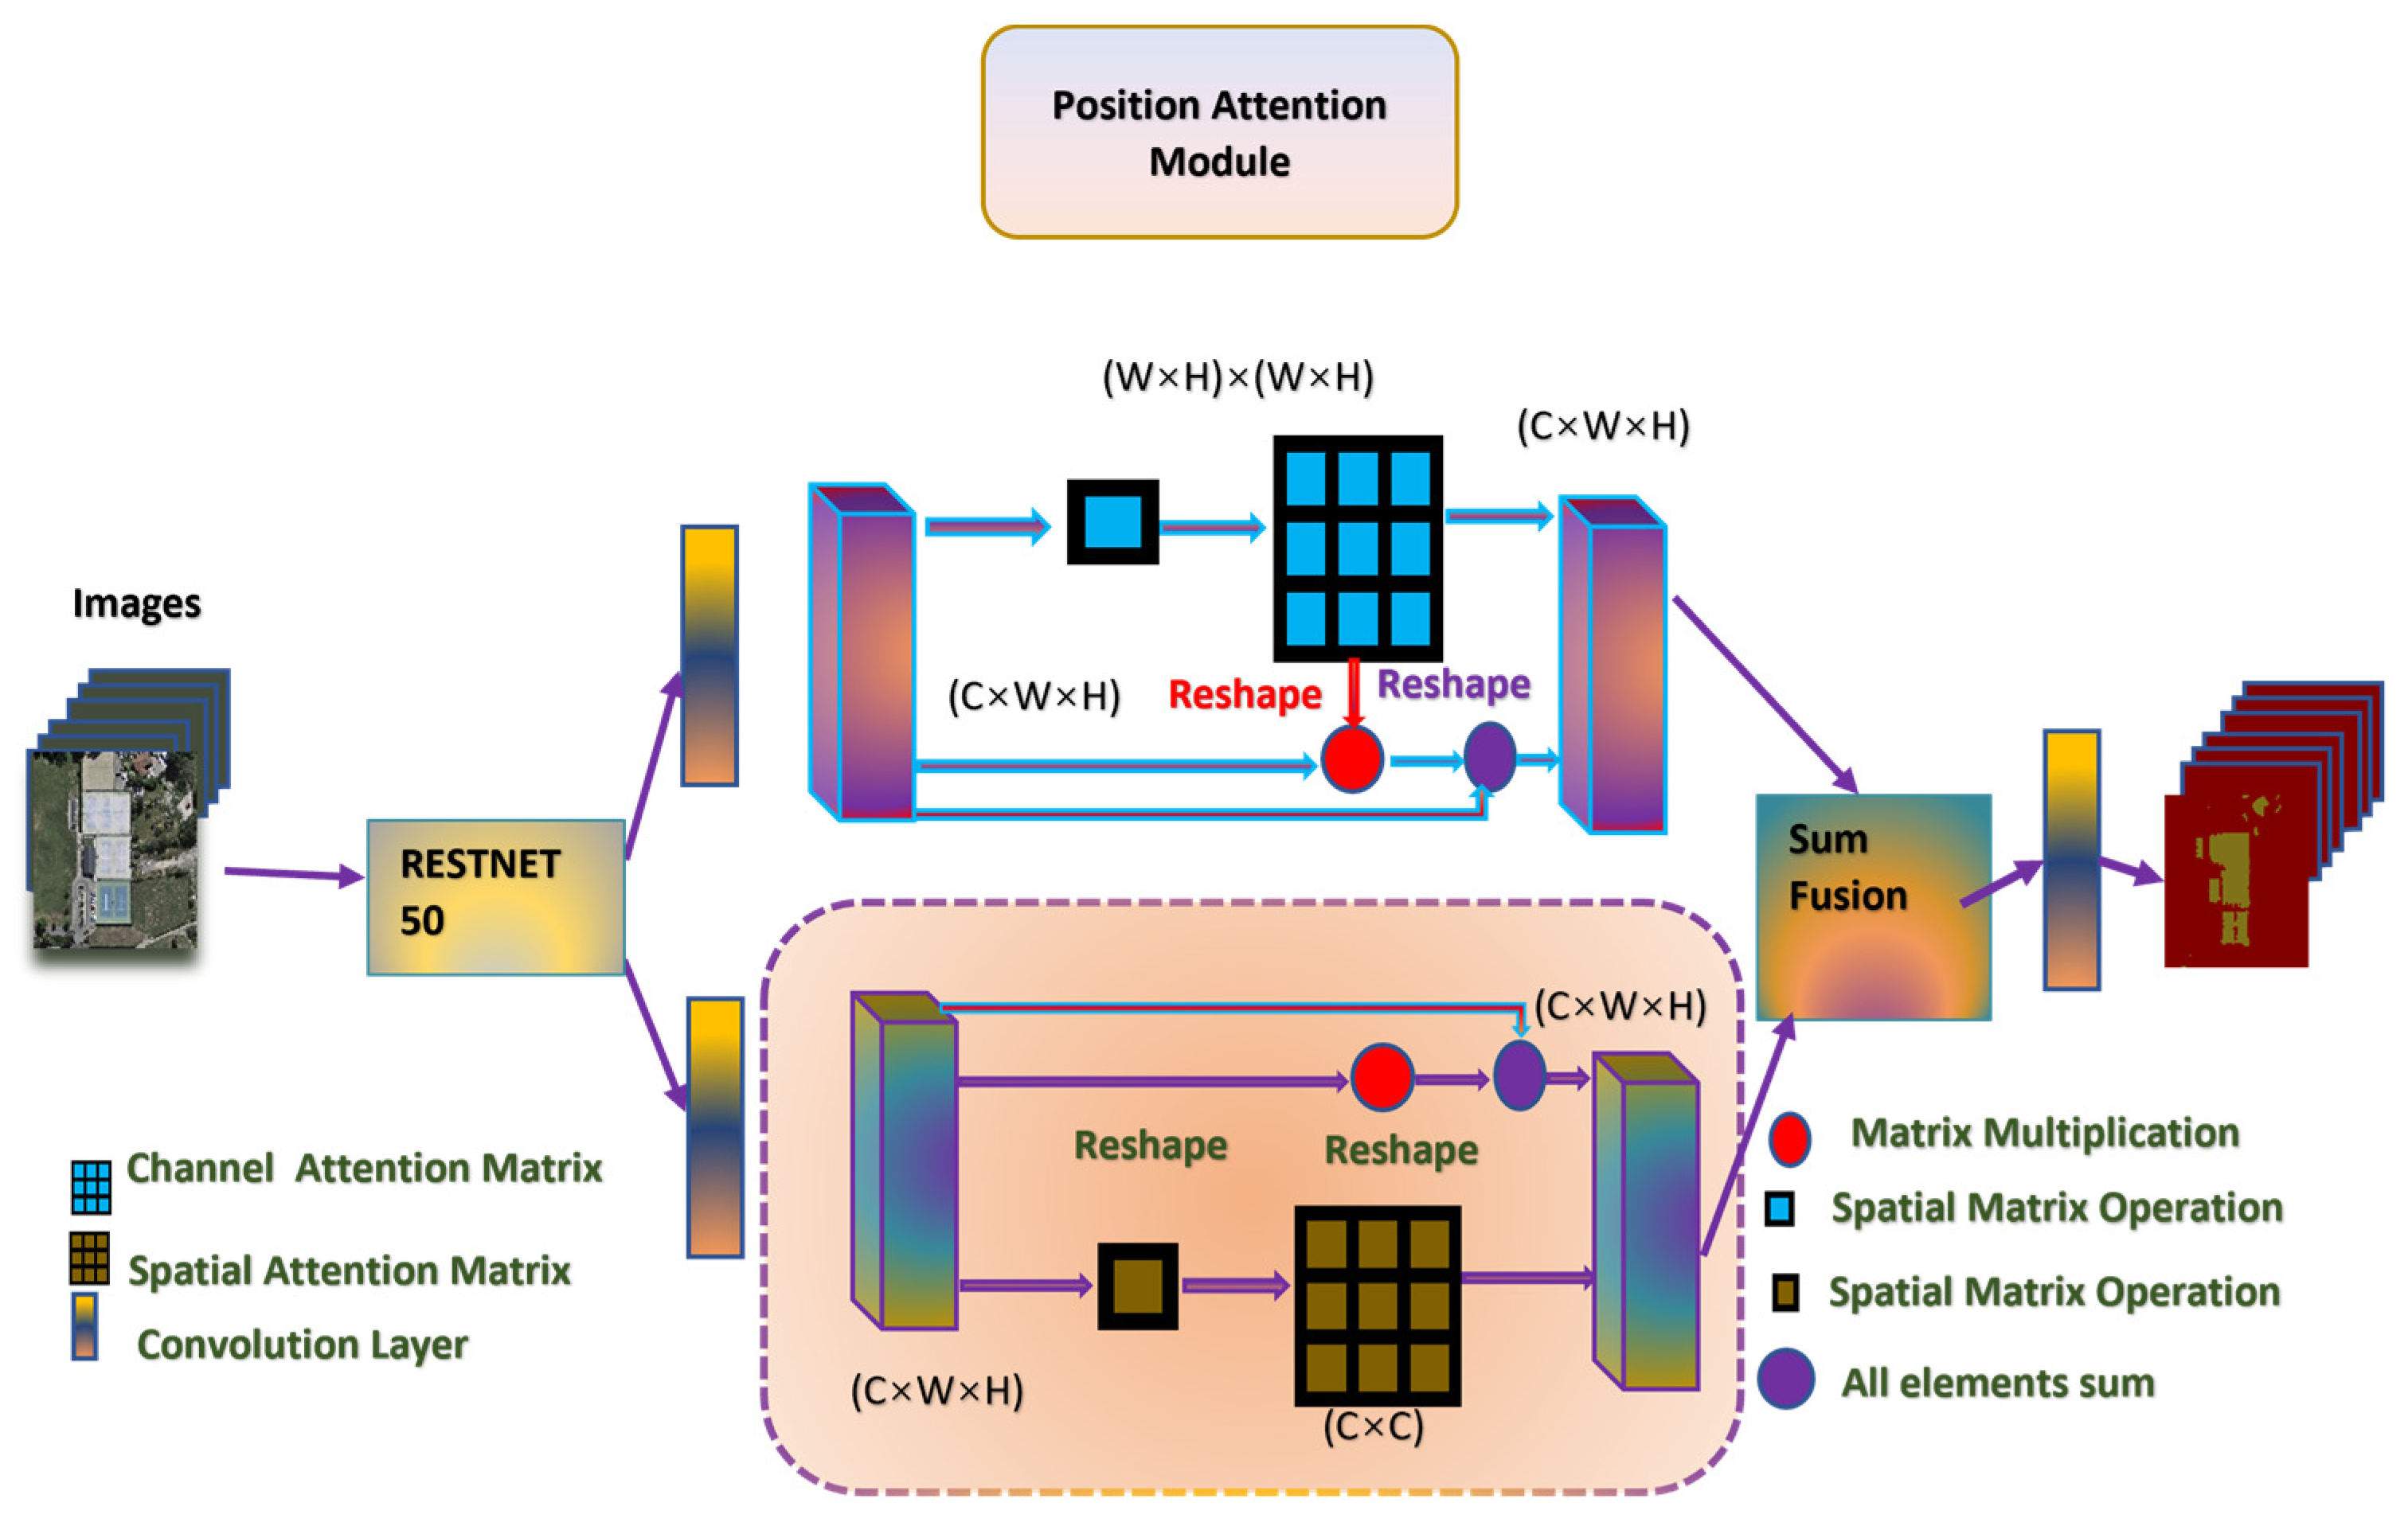
Figure 7.
Architecture of PP-LiteSeg.
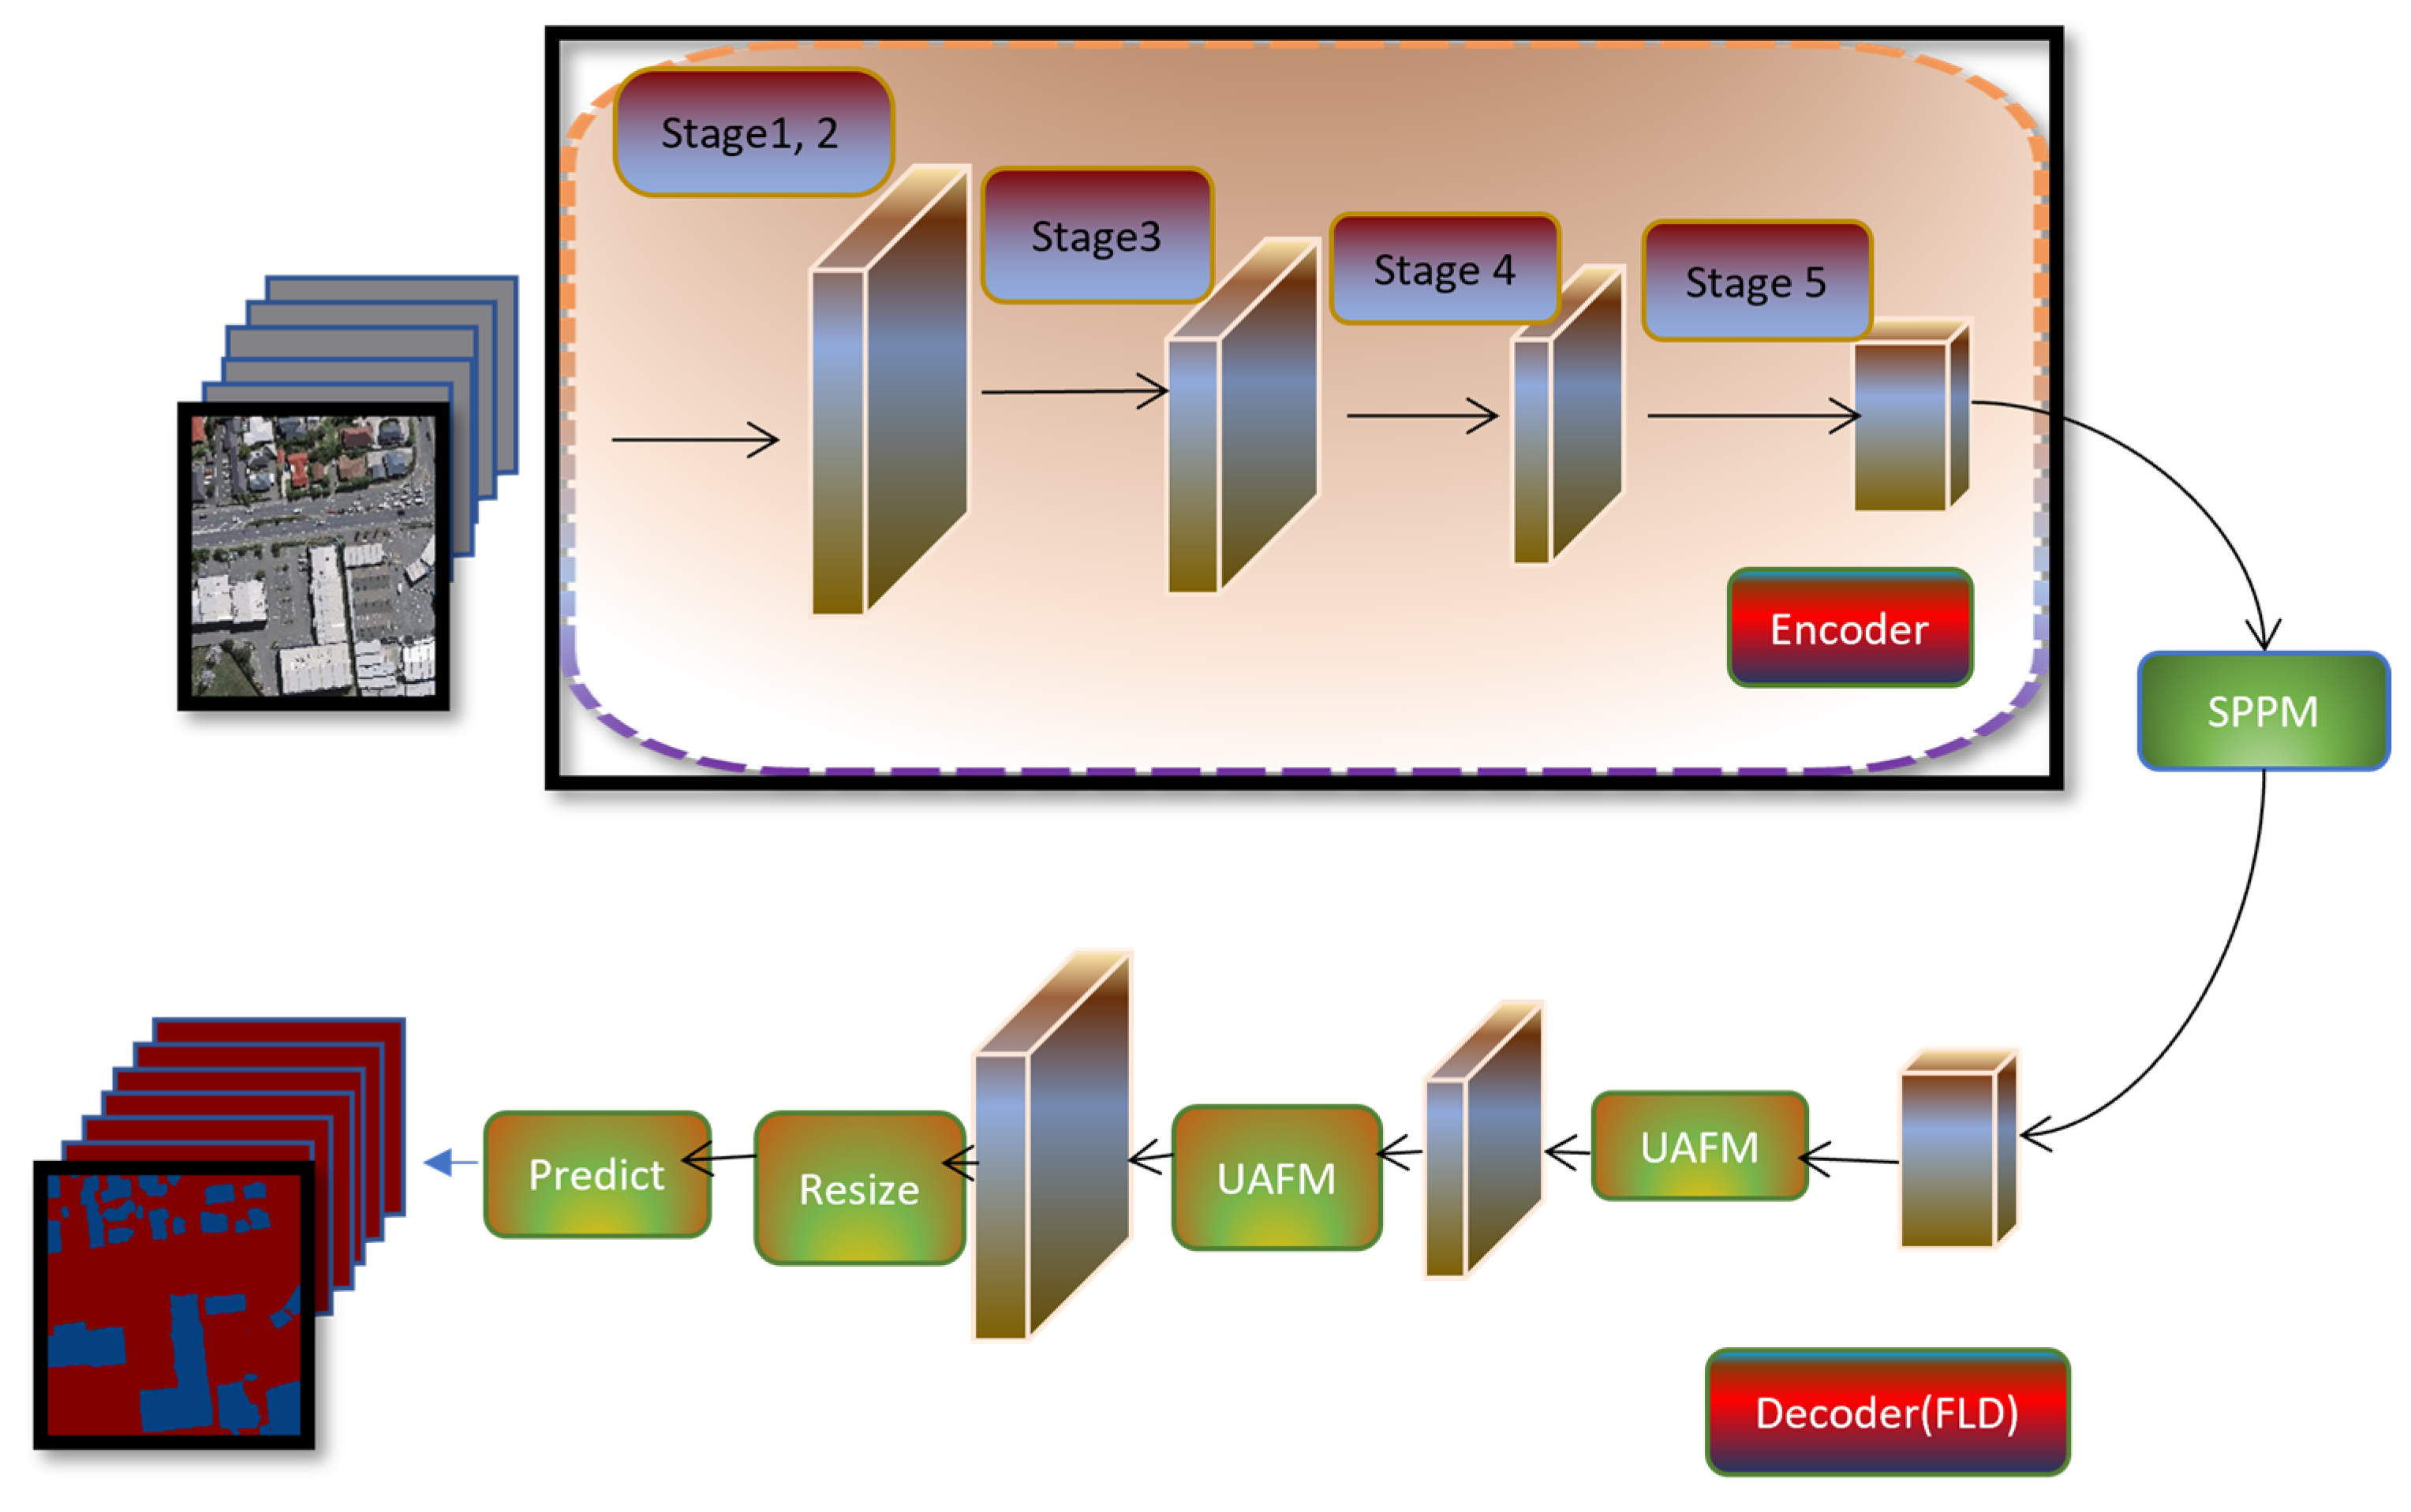
Figure 13.
Asymmetric Non-local Neural Networks for Semantic Segmentation.
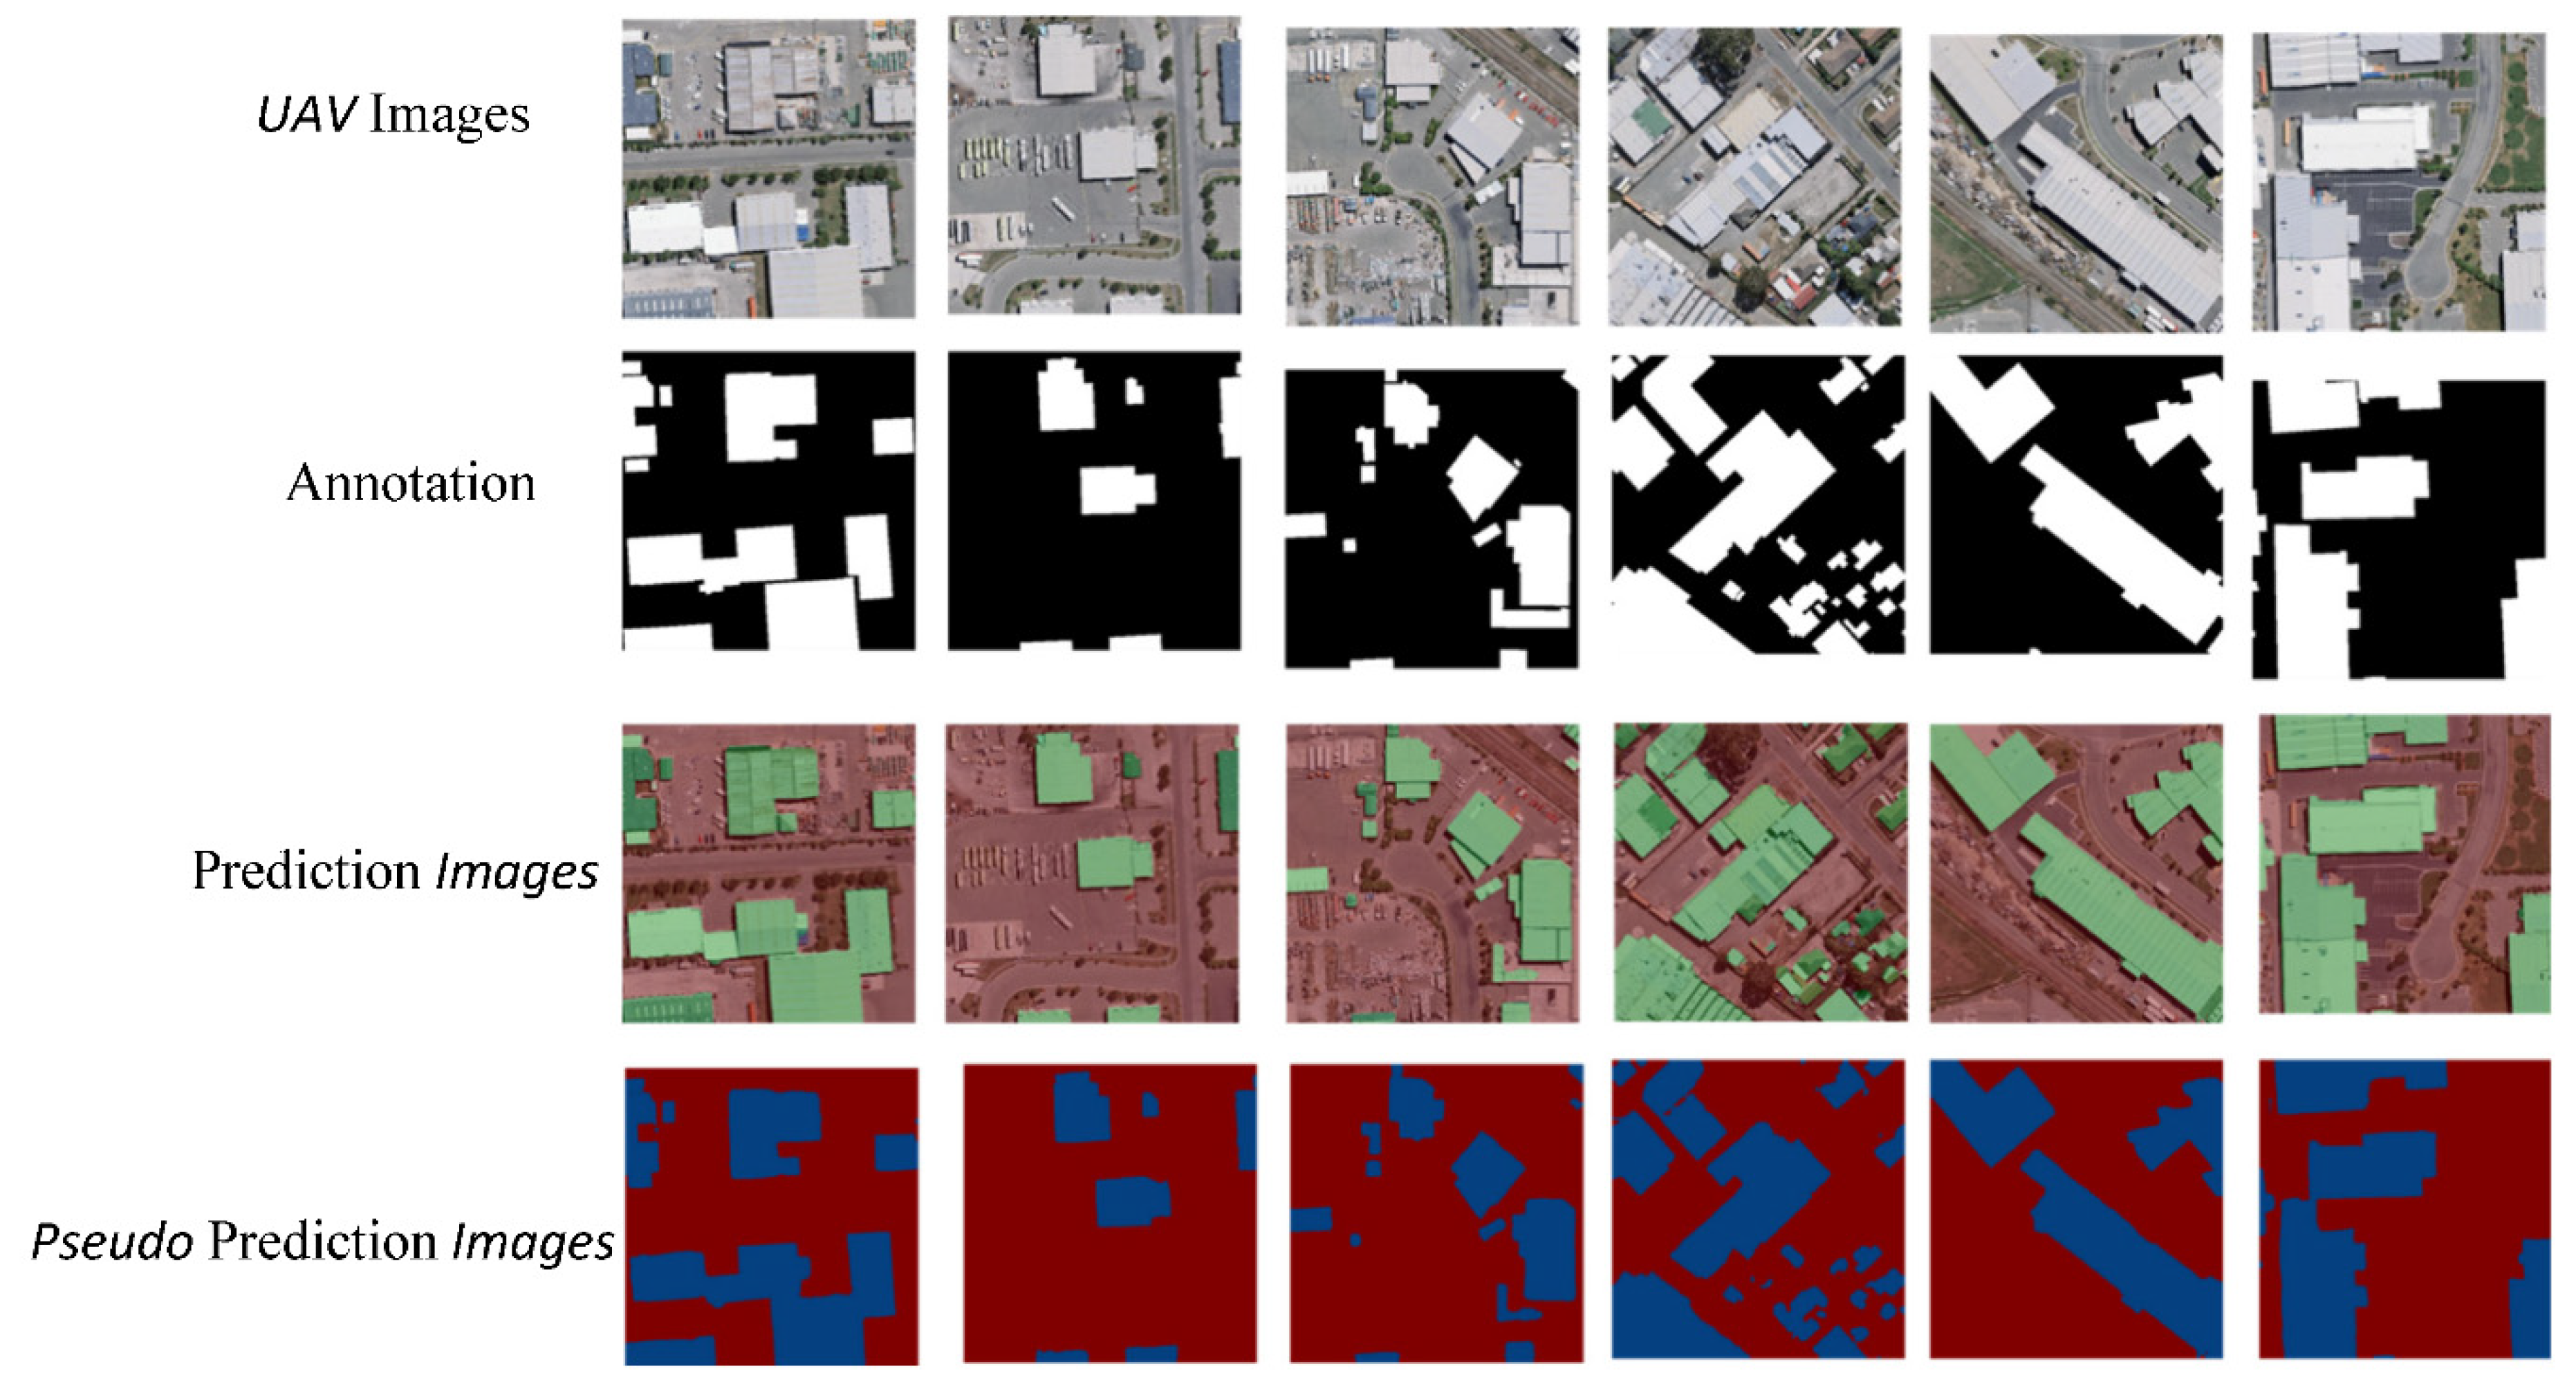
Figure 14.
DeepLabV3 Networks for Semantic Segmentation.
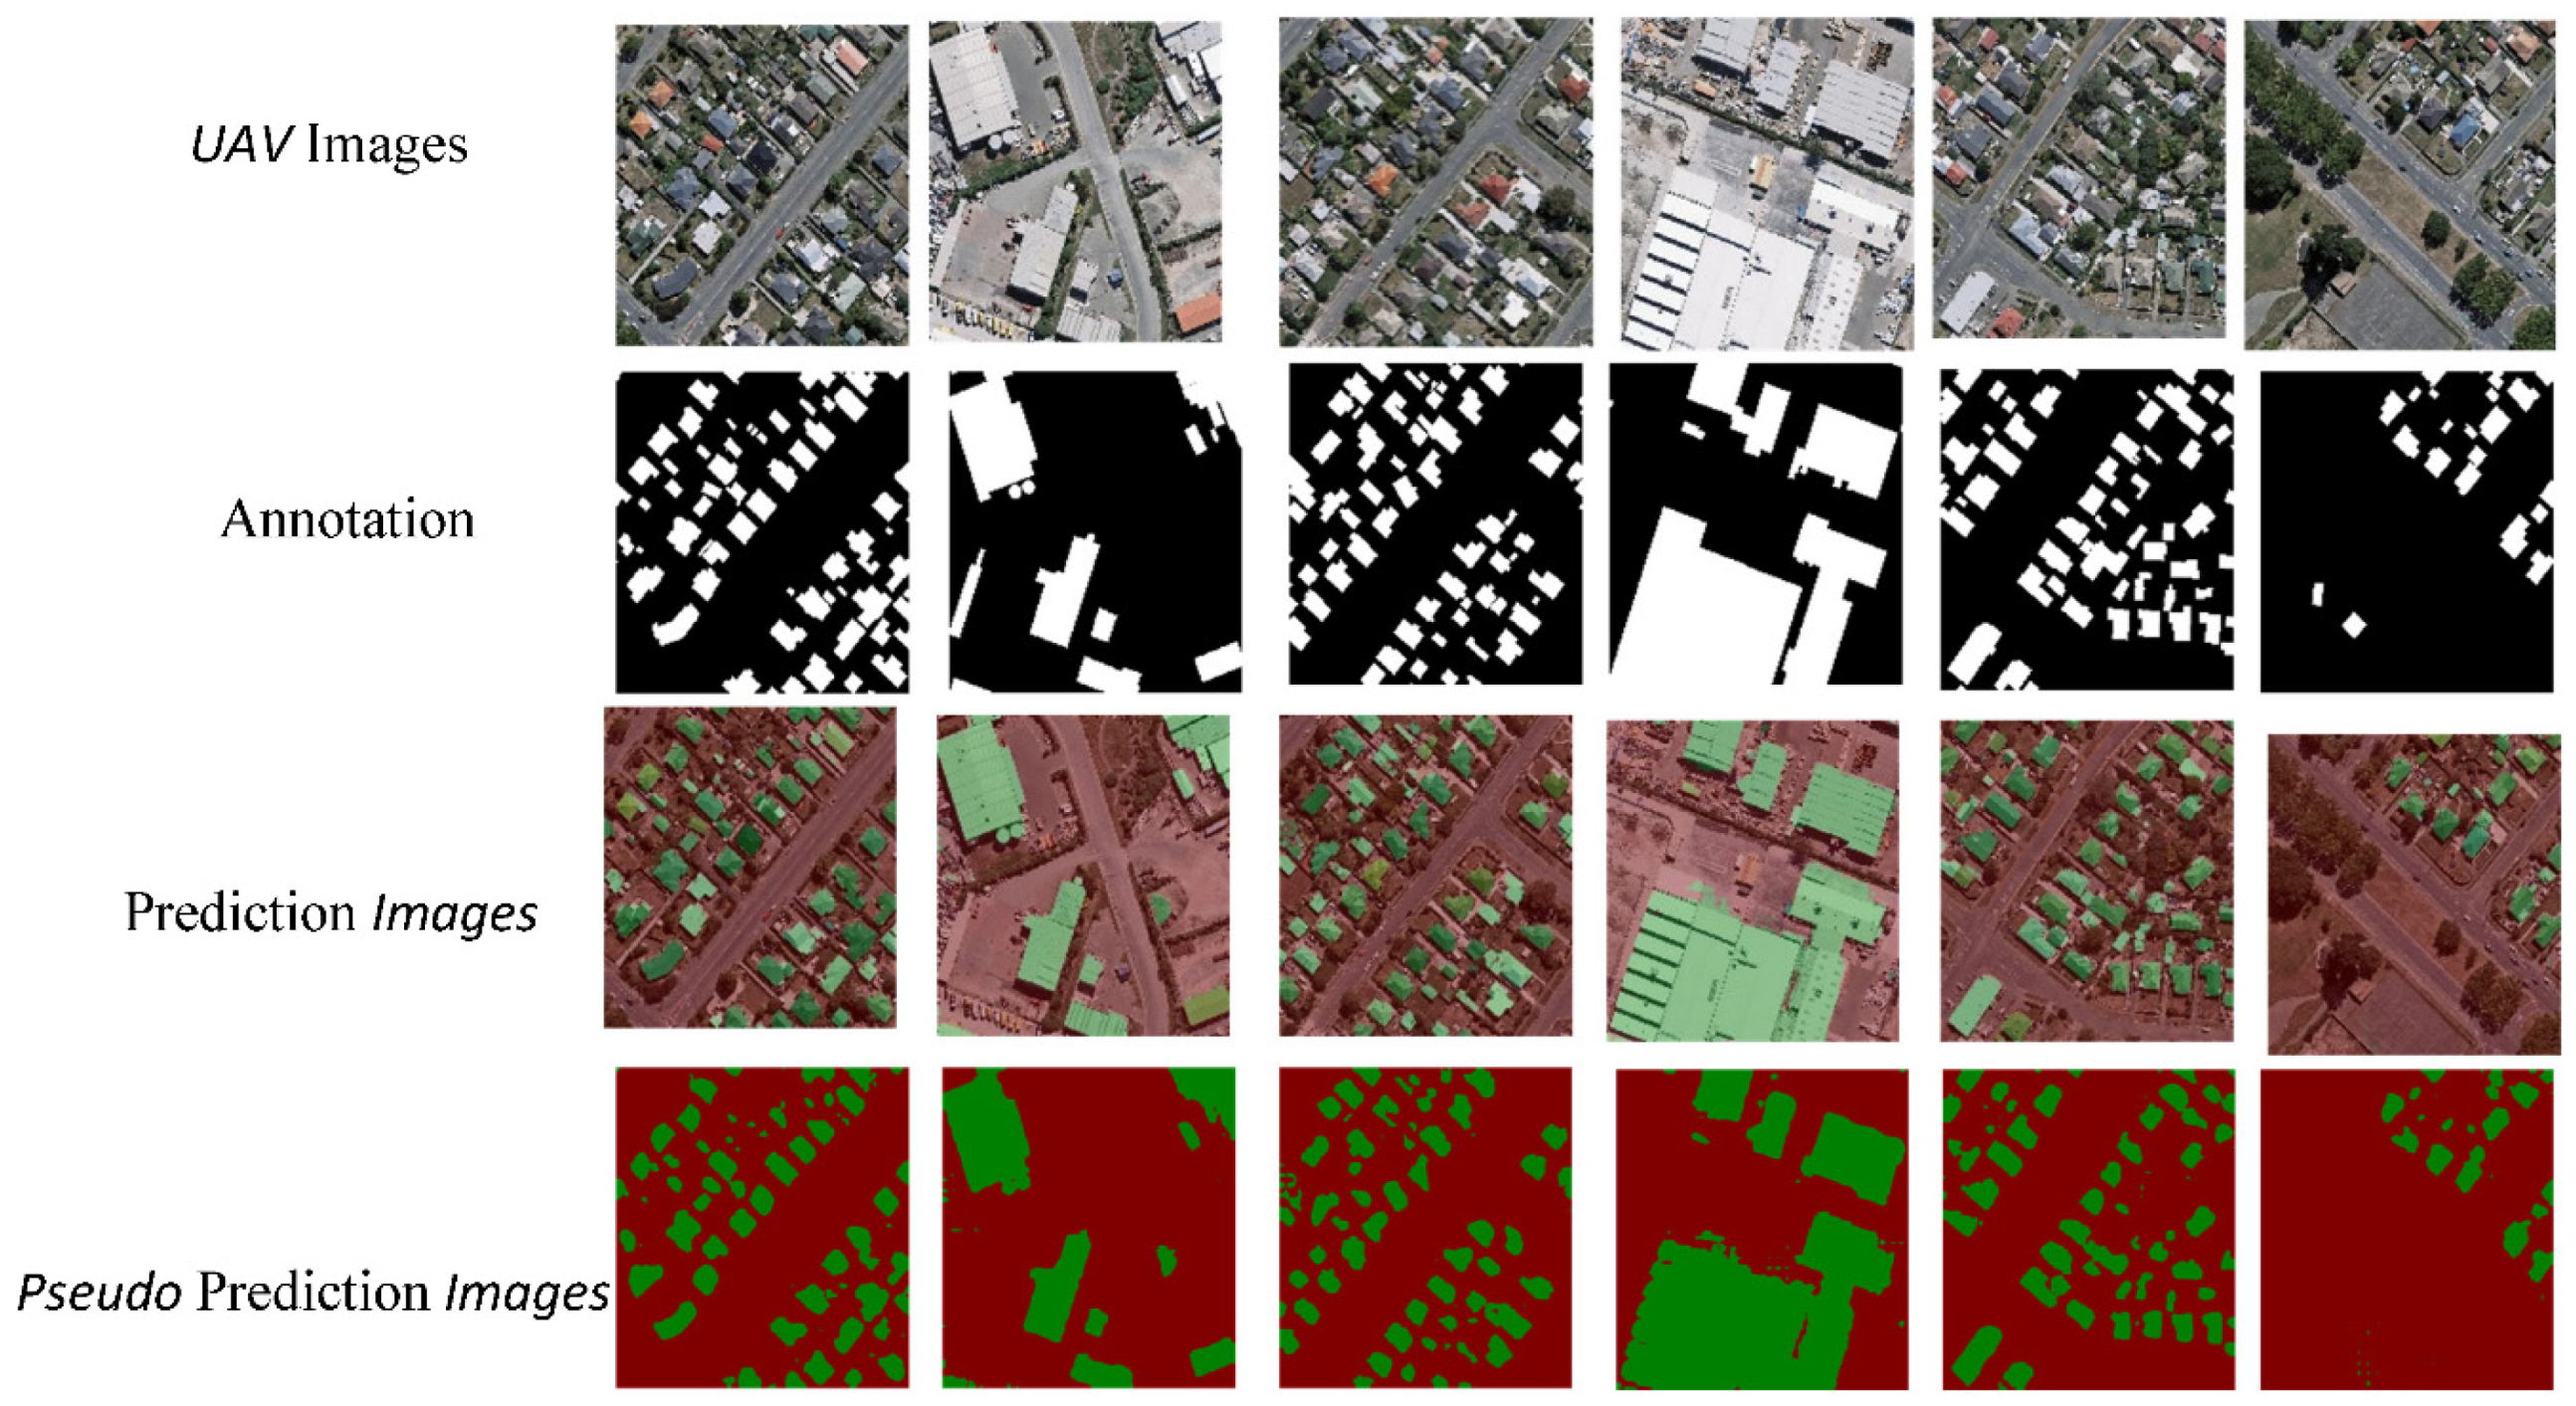
Figure 15.
PP-LiteSeg for Semantic Segmentation.
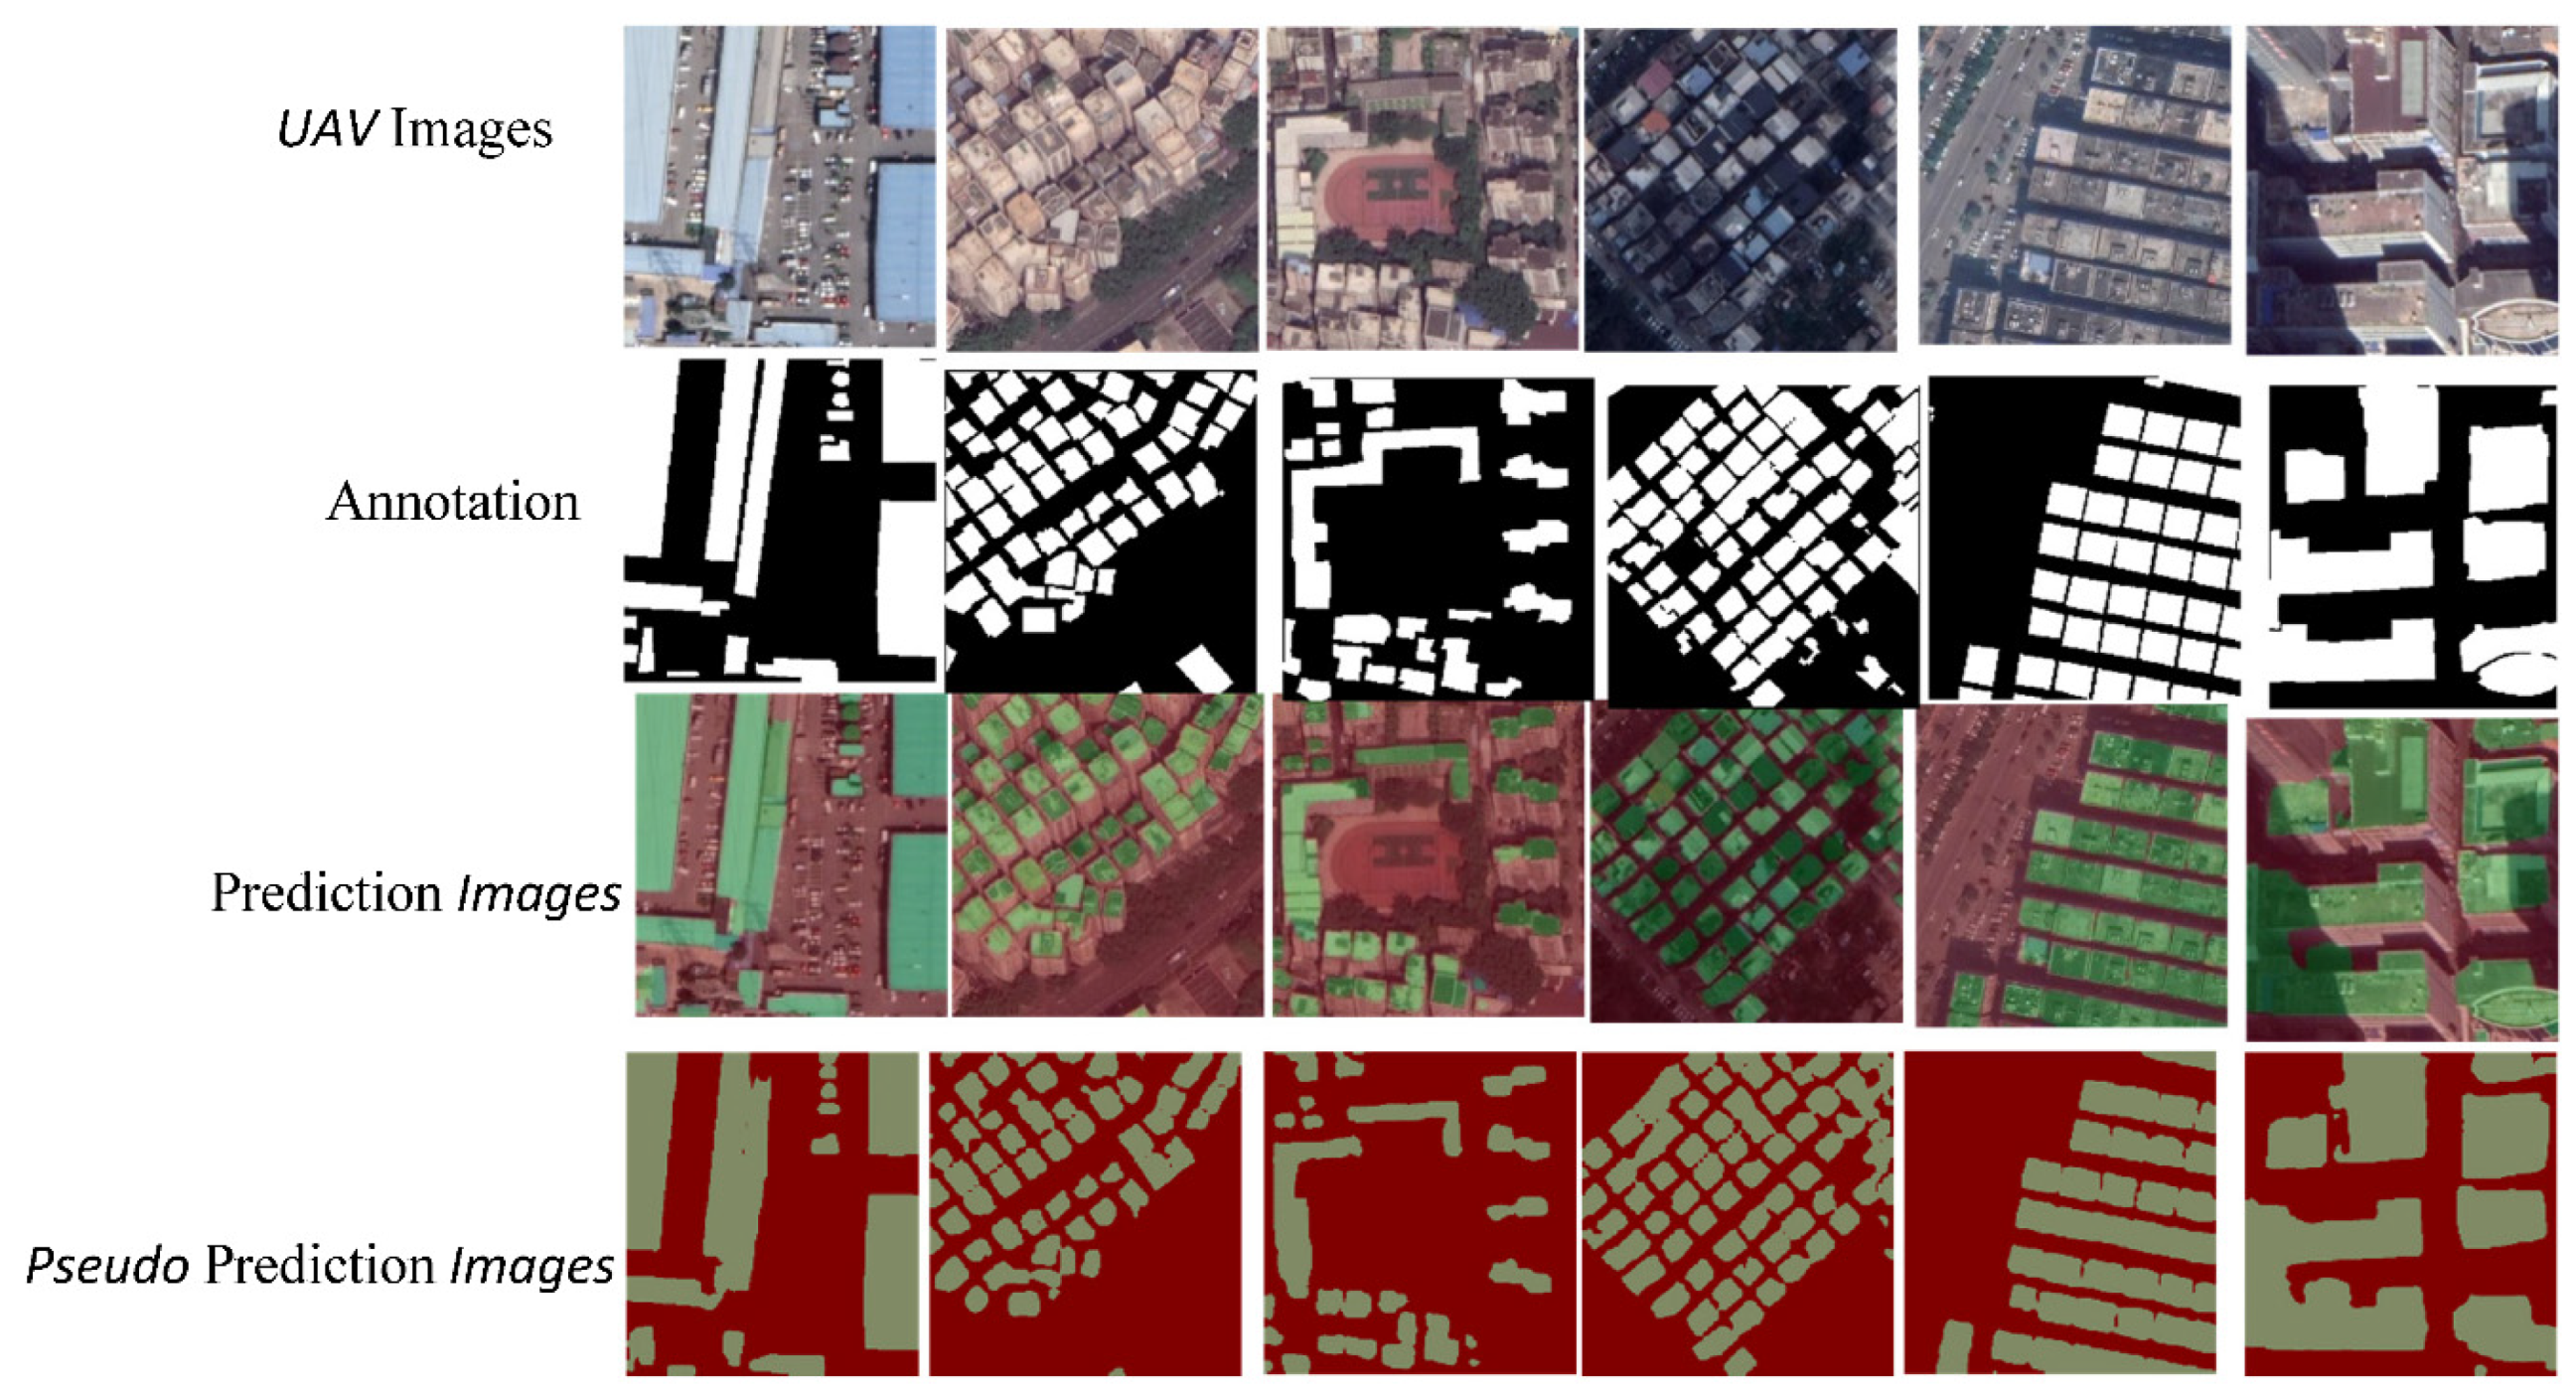
Figure 16.
DANet for Semantic Segmentation.
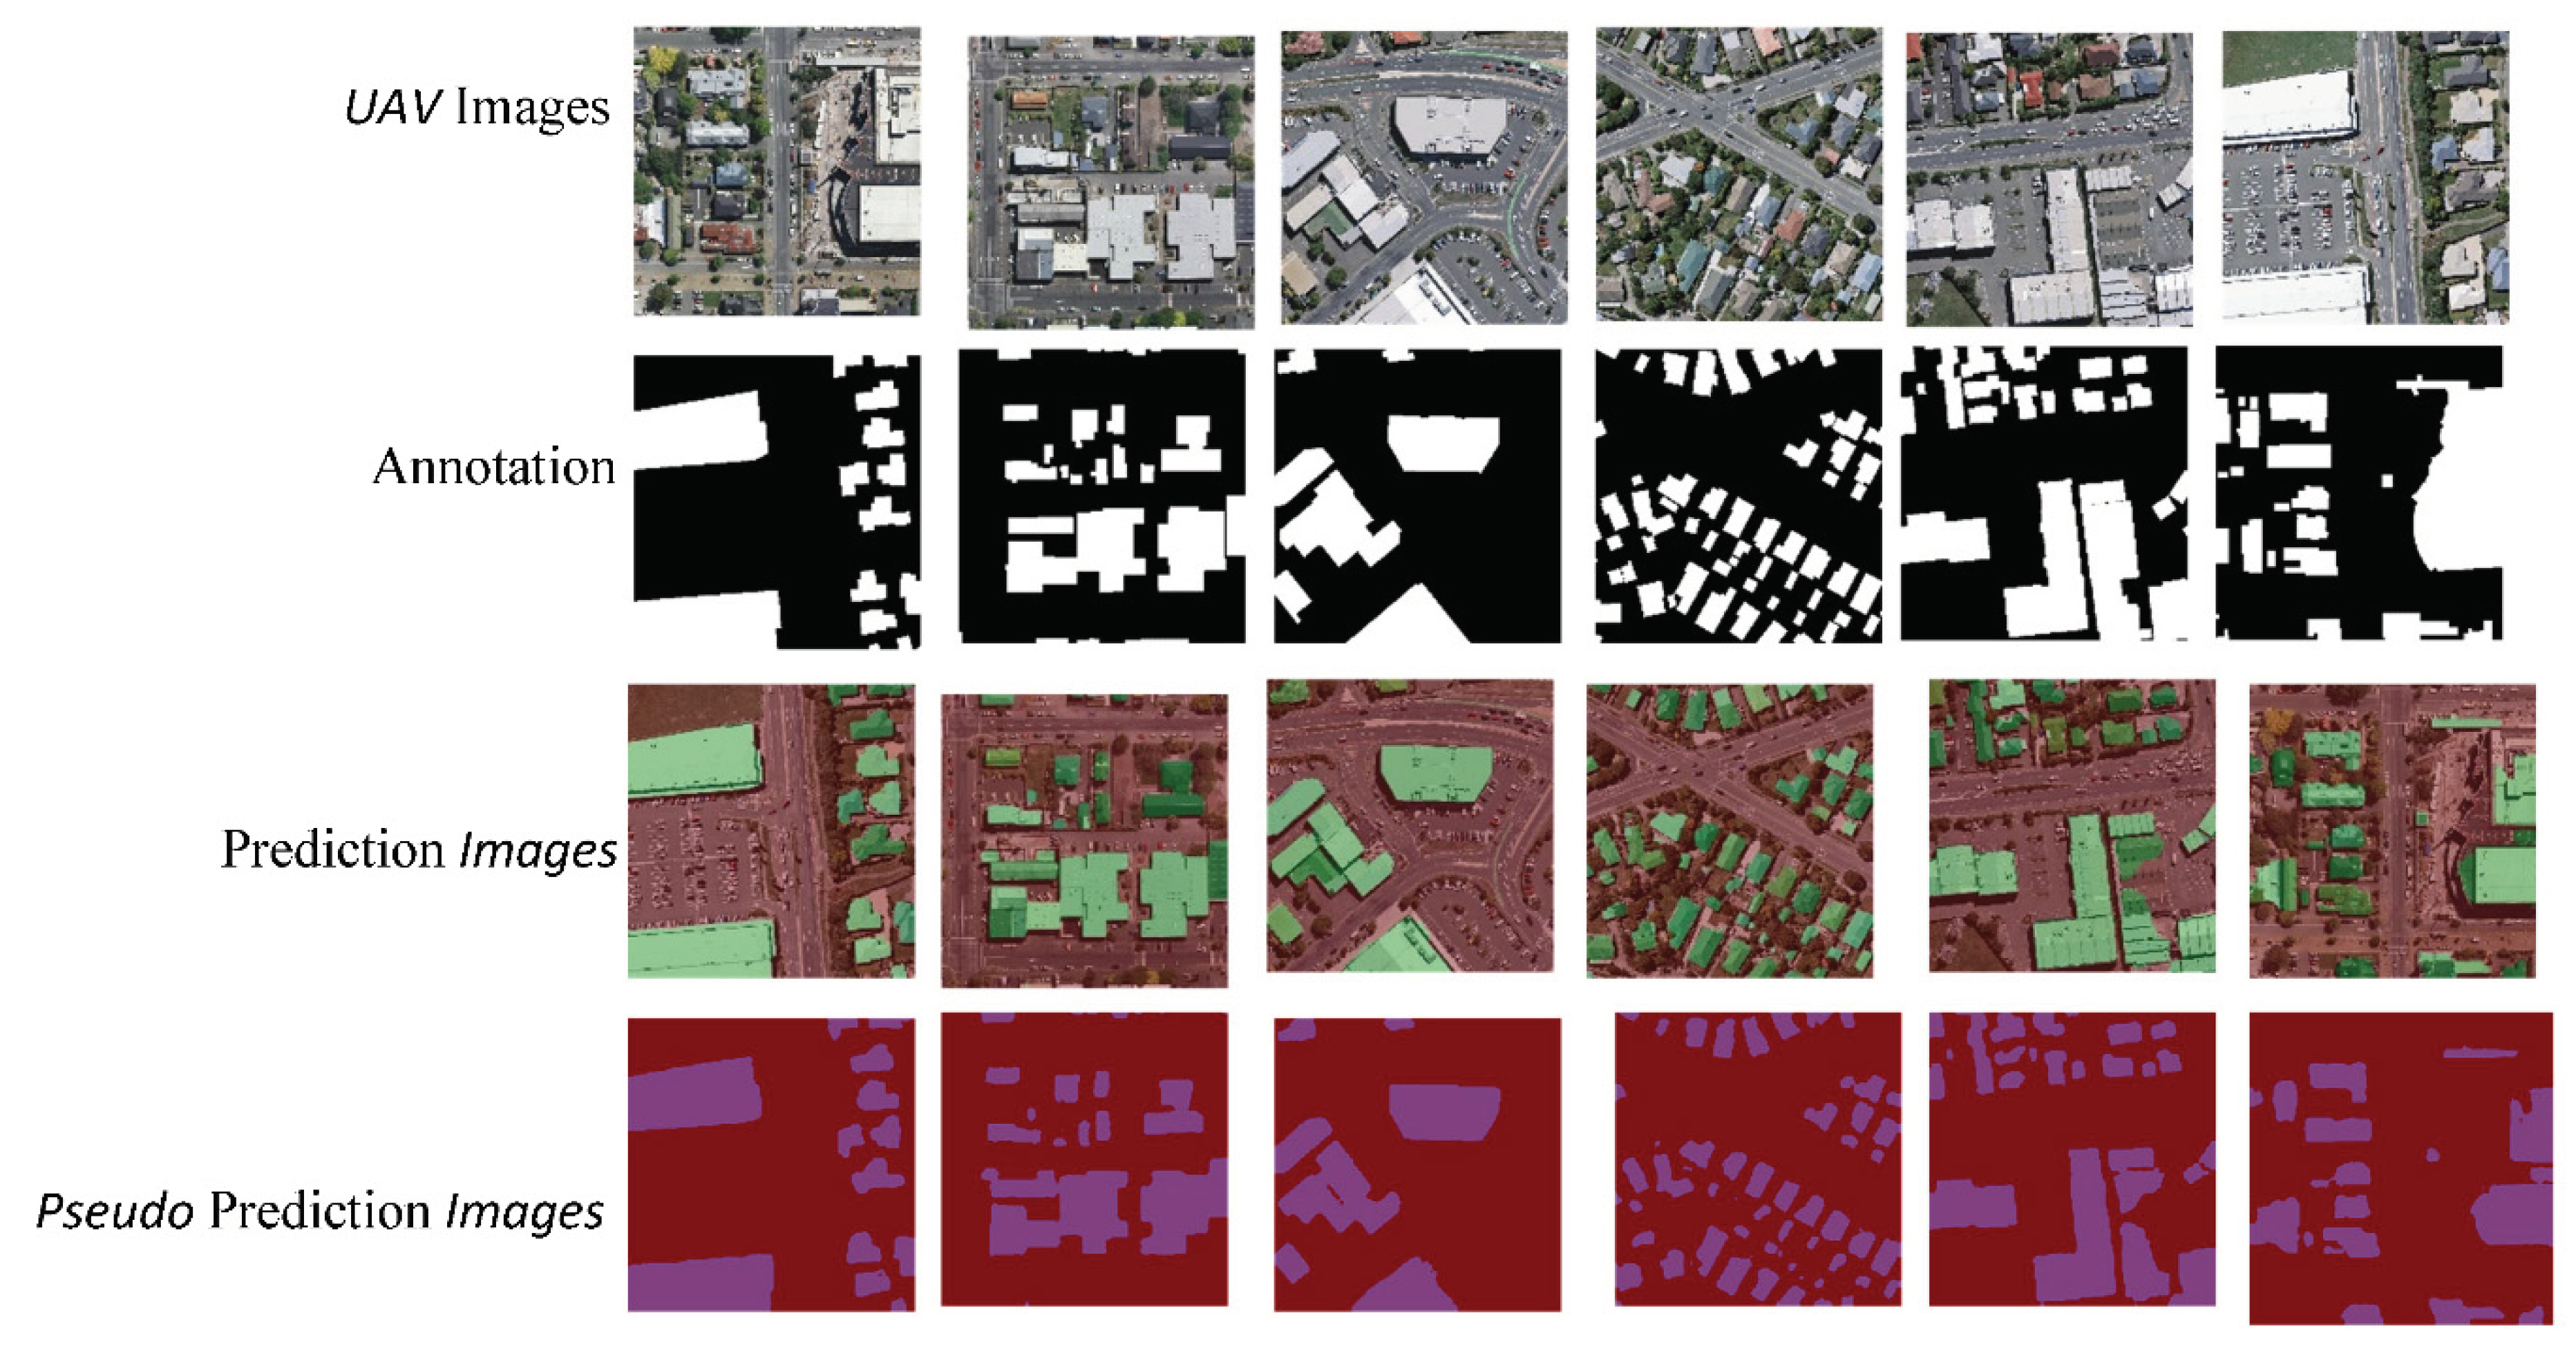
Table 1.
x confusion matrix.
| Actual | 0 | 1 |
| Predict | ||
| 0 | TN | FN |
| 1 | FP | TP |
Table 2.
Kappa coefficient Level.
| Kappa coefficient | Level of Agreement |
| 0.0–0.20 | slight |
| 0.21–0.40 | fair |
| 0.41–0.60 | moderate |
| 0.61–0.80 | substantial |
| 0.81–1 | almost perfect |
Table 4.
Metrics during the training phase for various deep learning models.
| Model | Images | Step | Batch cost | Reader cost |
| ANN MODEL | 2815 | 110ms | 0.1098 | 5.97E-05 |
| DANet | 8444 | 61ms | 0.06 | 7.22E-05 |
| DeepLab3 | 2815 | 100ms | 0.0992 | 4.46E-05 |
| PP_LITESEG | 1527 | 17ms | 0.0171 | 0.0057 |
Disclaimer/Publisher’s Note: The statements, opinions and data contained in all publications are solely those of the individual author(s) and contributor(s) and not of MDPI and/or the editor(s). MDPI and/or the editor(s) disclaim responsibility for any injury to people or property resulting from any ideas, methods, instructions or products referred to in the content. |
© 2024 by the authors. Licensee MDPI, Basel, Switzerland. This article is an open access article distributed under the terms and conditions of the Creative Commons Attribution (CC BY) license (http://creativecommons.org/licenses/by/4.0/).
Copyright: This open access article is published under a Creative Commons CC BY 4.0 license, which permit the free download, distribution, and reuse, provided that the author and preprint are cited in any reuse.


