Submitted:
08 April 2024
Posted:
09 April 2024
You are already at the latest version
Abstract
This paper reviews recent literature on Spatial Data Infrastructure (SDI) for remote sensing, aiming to provide a comprehensive analysis of the state-of-the-art practices, challenges, and future directions. It also tries to find out if current projects and initiatives involving the exploitation of satellite remote sensing are still framed in the SDI concepts.
Keywords:
spatial data infrastructure
; remote sensing
1. Introduction
Climate changes call for timely and constant monitoring of Earth's dynamic processes for better understanding them. With the increasing availability of open remote sensing data gathered at high revisiting time and medium-high spatial resolution, the effective use of these data for Earth Observation (EO) and monitoring has become feasible. Spatial Data Infrastructure (SDI) has emerged as a comprehensive framework for collecting, organizing, and sharing geospatial data, among which remote sensing data.
This paper reviews recent literature on SDI for remote sensing, aiming to provide a comprehensive analysis of the state-of-the-art practices, challenges, and future directions.
To this end, we followed the PRISMA guidelines 1, a standard procedure defined to document the steps of literature collection, and analysis to allow replicability.
On the selected articles we first perform a statistical and network analysis to identify the most relevant keywords that characterize the collection of articles; the goal is to identify long terms approaches and applications, as well as emerging fields.
Then, a semantic analysis of the most cited articles is performed manually, by classifying each article with respect to distinct semantic dimensions. These dimensions are introduced to categorize the various SDI implementations and architectures employed in the remote sensing domain, highlighting their strengths and limitations.
Among the relevant dimensions we consider interoperability aspects of SDI, emphasizing the importance of standardization and harmonization of data formats, metadata, and services by adoption of open geospatial standards and protocols, which facilitate seamless data exchange and integration across heterogeneous remote sensing platforms.
Furthermore, the challenges associated with data access, security, and privacy in SDI for remote sensing are analysed by exploring novel techniques for data discovery, access control, and secure transmission, considering the sensitive nature of certain remote sensing datasets. Moreover, emerging technologies, such as big data analytics, and artificial intelligence methods are analysed within SDI frameworks, by discussing their potential benefits and limitations for remote sensing applications, including real-time data processing, advanced analytics for decision support. Finally, scalability issues, enhancing data sharing and collaboration, and exploring innovative approaches to handle the increasing complexity and diversity of remote sensing data are considered.
This semantic analysis has been completed by reviewing also projects and initiatives that in recent times have been developed to host and manage satellite remote sensing imagery. This analysis seeks to determine whether these efforts have been implemented in compliance with the SDI framework 2, and thus aims to reveal if this framework remains a prevailing paradigm in the field of remote sensing.
The paper is organized as follows: section 2 describes the selection process of the literature review and its network and semantic analysis; section 3 describes the relevant platforms implemented by governmental and private organizations to manage and share remote sensing imagery. Finally, section 4 discusses the results and traces the future challenges.
2. Selection of Relevant Literature and Network and Semantic Analysis
2.1. Search Criteria and Meta-Sources
We decided to select the most relevant research articles within Scopus and Web of Science, which are deemed as the biggest electronic repositories. The search of the most relevant research articles was performed by submitting a set of queries.
To decide which keywords to use for searching publications, we first performed an exploratory analysis of the most common terms, relevant for the topic, by using Google’s Trends tool.
Among the keywords “spatial data infrastructures”, “remote sensing”, “earth observation”, “SDI”, “data lakes”, “spatial information systems”, “geospatial databases”, “satellite data” that we explored as possible representatives of the topic of interest, we finally selected the following:
“spatial data infrastructures”, “remote sensing”, “SDI”.
2.2. Identification of Articles by the Top-Down Analysis
The following query:
“spatial data infrastructure” and “remote Sensing” OR “SDI and “remote sensing”
submitted to Scopus on the 28th of November 2023, searching in the fields of the articles’ titles, abstract and keywords and selecting only the articles published in the last 20 years (since 2004), retrieved 283 articles.
By submitting the same query to Web of Science we retrieved 65 articles.
In total by removing duplicates, we obtained 334 articles.
2.3. Analysis of the Selected Literature
2.3.1. Network and Temporal Analysis
To investigate which keywords within the articles are the most relevant ones, and how the articles deal with common keywords we applied a network analysis by using the open software VOSviewer (downloaded from https://www.vosviewer.com/).
VOSviewer is a free software with a nice graphic user interface for the analysis of bibliographic data. It allows to perform a network analysis by applying clustering and text mining algorithms. In our context, we created maps of the most relevant keywords (i.e., most frequent and not in a stop-words list) extracted from the selected articles.
Between each pair of keywords, a weighted link (strength) is identified according to the co-occurrences of the keywords in the articles. The most relevant keywords were then grouped into clusters based on their link strength: a minimum strength of 10 was specified that allowed to select 62 keywords among the 2524 totally identified within the titles and abstracts of the articles.
Finally, we analysed the topics of the articles by exploring the three types of visualization provided by VOSviewer:
- the density map allows to visualize the relevant keywords and how these are clustered according to their co-occurrences in the articles;
- the network map allows to explore the most relevant linked keywords;
- the overlay map allows to analyse the temporal appearance of the keywords.
The network map in Figure 1 and the density map in Figure 2 display the top 62 most relevant keywords with their connections and density, respectively.
These keywords have been clustered according to their relevance score and link strength: three clusters of keywords were identified, containing 22, 22 and 18 keywords and depicted in the red, green and blue clusters, respectively.
What can be noticed in both the network map and the density map is the following:
- the red cluster focuses mainly on:
- “spatial data infrastructures” and related technologies like “metadata”, “standards” (see “inspire” and “open geospatial consortium”), “interoperability”, “data sharing”, “Web processing services”, “geo-spatial services”, in application for “disaster prevention” and “disaster management”;
- the green cluster is mainly about:
- “spatio temporal analysis”, “principal component analysis” and “environmental monitoring” by “remote sensing” and “space optics”. Sources like “landsat” and “modis” appear and keywords indicating application fields like “agriculture”, “climate change”, “crops”, “vegetation”, “droughts”, “ecosystems”, “land cover”, “land use”, “soil salinization”;
- the blue cluster is mainly related with:
- “decision support systems” exploiting “big data” and “database systems” for their “digital storage”, “artificial intelligence” for “data acquisition”, “data integration”, “decision making” and “semantic Web” techniques for global scale applications including “sustainable development”, “Earth science” and “Earth observation”.
By observing the overlay map (see Figure 3) we get an idea of the consolidated technologies and applications and of the emerging ones.
- Among the keywords that appeared just at the beginning of the considered period (up to 2012) we can find “geographic information systems”, “photogrammetry”, “metadata”, “decision support systems”;
- in the intermediate period of time, we have “spatial data infrastructures” and “remote sensing” and later “disasters”;
- while the most recent keywords are “big data”, “artificial intelligence”, “earth observation”, and applications to “agriculture”, “droughts”, “soil salinization”.
2.3.2. Semantic Analysis
Besides the network analysis described in the previous subsection, we also performed a semantic analysis, which was carried out manually. To this end, we further selected a manageable and significant subset of articles among the 334 already retrieved by considering those published either in journals or in conferences cited by both Web of Science and Scopus registers and having a minimum number of citations.
In order not to penalise recently published articles we computed a weighted citation score that rewards with one citation the articles for each year between their publication year and 2004. We thus obtained 46 articles.
These were further manually screened by reading their abstracts and 15 of them were eliminated since they were not on the topics; this is the case of papers that contain the term “SDI”, which is not the acronym of “Spatial Data Infrastructure” but of other sentences such as “Synthesized Drought Index”.
We remained with 31 articles that were manually classified with respect to several semantic dimensions. Their publication covers a temporal range from 2008 to 2023.
Table 1. were included in each paper (see for example metadata and standards); on the other side the choice is meant to verify if the papers consider also topics that are not strictly linked to SDIs, but characterize spatial information management in the recent evolutions (see for example AI and security/privacy concerns). Table 1 contains a short description or motivation of each dimension, and then comments about results of the papers analysis.
After defining the dimensions, values have been assigned to describe each of them; some values were integrated during papers analysis to obtain richer descriptions. Graphs in Figure 5 show percentage of values for each dimension in Table 1.
Figure 5 (a) shows that the main goal of SDIs in the considered papers is monitoring, followed by decision support and emergency. In most papers, the geographic coverage is local (mainly regional), but national SDIs play a good role, as illustrated in Figure 5 (b).
Data types include satellite and non-satellite remote sensing data, though in situ data and maps are also usually managed; there is a good presence of data coming from volunteers and/or crowdsourced (Figure 5 (c)). Data velocity (i.e., temporal resolution of data considered; Figure 5 (d)) is generally not described in the papers: only some of them declare explicitly that the goal is to treat near real-time data. Though most papers affirm that SDIs represent a preference framework for managing large quantities of data, in practice they rarely offer hints on data volumes managed (Figure 5 (e)). The same can be stated for the treatment of vagueness/quality/credibility of data (Figure 5 (f)).
It is difficult to know the target users (Figure 5 (g)): most papers do not give specifications for this dimension, listing generic and multiple target users; usually, when decision support is the main goal, target users are authorities. Besides discovery via metadata, papers seldom detail interacting functions offered to users (Figure 5 (h)); nevertheless, spatial and semantic query availability are reported in some cases.
Terms such as distribution, interoperability (also semantic interoperability), OGC (Open Geospatial Consortium) standards for web geo-services and geo-data coding, data and process sharing, data fusion and/or integration, are frequently present in all papers, so that Data management is a well described dimension (Figure 5 (i)). On the other hand, among tools for (geo-)data analysis only geometric operations are sometimes cited (Figure 5 (l)).
Rare descriptions about advanced modeling tools (Figure 5 (m)) and concerns related to security/privacy (Figure 5 (n)) are generally present; only data policy and data credibility receive some scores.
It is worth noticing that besides a statistical analysis based on a set of selected dimensions, whose results are summarized in Table 1 and Figure 5, some papers in the selected set deserve some more attention, as described here following (papers are listed in increasing chronological order).
The paper 3 underscores the significance of adopting service-oriented architectures in environmental modelling. The approach, fully compliant with SDI technologies, not only enhances data accessibility and service interoperability but also showcases tangible improvements in modelling workflows through the application of geospatial services. This contributes to a more efficient and collaborative environmental modelling process, aligning with the objectives of the European Earth Observation program.
The paper 4, framed in the development and deploy of SDIs, proposes a design and architectural approach for web applications based on open geospatial standards, encompassing geospatial processing and data acquisition services, essential when dealing with satellite images and applications of remote sensing. It unifies data and geo-processes in the Cloud, enabling the combination of services to address specific needs efficiently. The paper paves the path both to semantic specification of geospatial data and to cloud computing, providing on demand processing services via efficient computing resources.
The paper 5 presents a new approach to share, reuse, and possibly standardise geoprocessing logic in the field of remote sensing. It introduces moving-code packages as self-describing software components that contain code and machine-readable descriptions of the provided functionality, platform, and infrastructure, as well as basic information about exploitation rights. The paper aims at extending the scope of SDI technologies (manly OGC standards) beyond data exchange and interoperable discovery, access and viewing, towards better software reuse as well as an efficient use of scalable processing infrastructures. The paper copes with key aspects that are seldom found in other papers, i.e. exploitation rights and code reuse.
The paper 6 is a reviewing paper in its specific field, i.e. hydrological modelling and water management that require better integration of data, information and models. Though the development of Spatial Data Infrastructures (SDIs) improves data sharing at various scales, by promoting interoperability standards, gaps still exist in hydrological, agricultural, meteorological and climatological data access because of various issues.
The paper 7 focuses on geoprocessing workflows, which chain geospatial data and services discovered from SDIs, and whose results can be published as new resources in SDI. A Linked Data approach may improve the process, so that sensors, observations, data, services, workflows, and provenance can be linked and published into the Web of Data. This paper explores the integration of Linked Data and Web geoprocessing workflows by discovering geospatial resources in the Web of Data to build geoprocessing workflows. The results not only support semantic discovery and integration of heterogeneous geospatial resources, but also provide transparency in data sharing and processing.
The paper 8 presents an automatic metadata extraction approach that creates metadata information from different optical data deriving from various satellite missions of scientific interest. It also describes a real-world scenario used in the EURAC research group institute for Applied Remote Sensing (Bolzano, Italy) illustrating a workflow management for Earth observation data including data processing, metadata extraction, generation and distribution. This paper is focused on issues related to metadata in satellite remote sensing.
The paper 9 is another review paper that assesses the current status and future prospects of geospatial science in Australia, focusing on positioning, Earth Observation, and spatial infrastructures, addressing challenges and developments, including the national positioning infrastructure plan, the precise point positioning-real-time kinematic (PPP-RTK) capability, Australia's decadal Earth Observation strategy (published in 2016), and the evolution of a future spatial knowledge infrastructure. The paper discusses the evolution of EO data management in the continent and affirms that the next generation spatial infrastructure for Australia needs to shift emphasis from data discovery (SDI) to knowing (SKI): “Instead of downloading, reformatting, and manipulating data to answer a query, the end user will simply pose” questions that require complex spatial analysis; the challenge is to design ontologies and orchestrate analytics. It offers a precious, extensive discussion of the strategic transition from SDI to SKI, and the needed technologies (mainly based on semantics and users’ profiling).
The paper 10 describes an online system conceptualized and implemented to facilitate spatial data analysis and decision making specifically for environmental applications. It supports a dynamic search and binding of suitable geoprocessing functionality. The application scenario consists in quality assessment for water bodies, combining authoritative data, remote sensing imagery and citizen science data. The prototypical implementation makes use of open standards to facilitate the integration with existing spatial data infrastructures.
The paper 11 describes a drought-monitoring and forecasting system developed for the Tuscany region, Italy. It integrates ground and satellite data from different sources (regional meteorological stations network, MODIS Terra satellite and CHIRPS/CRU precipitation datasets) through an open-source, interoperable SDI to produce vegetation and precipitation indices that allow following of the occurrence and evolution of a drought event. Web services allow geospatial elaborations on the fly, and the geo-database can be increased with new input/output data to respond to specific requests or to increase the spatial resolution. This is a fine case of effective SDI dealing with satellite data.
The paper 12 exploits open-source software (i.e., GeoNetwork) to simultaneously organize in-situ measurements and radar sensor observations, located in high mountain regions distributed in the Alpines, Apennines, Pyrenees and Andes mountain chains, mainly focusing on active landslides. Based on the idea that geo-hydrological processes investigations require spatial data infrastructures, it presents a tool to manage data and metadata, both in-situ surface measurements, typically acquired during emergency, and satellite observations; it is able to share various information within the scientific community, allowing also reprocessing the raw data for other purposes and in other contexts.
The paper 13 is focused on using geospatial information and technology as a tool to help farmers reduce the adverse impacts of natural disasters on agriculture; in particular, Remote Sensing and GIS, due to recent advancements in spatial resolution, accessibility, and affordability. The paper presents a review of the FAIR agricultural disaster services. It observes that open standards, such as OGC, may facilitate the interoperability and integration of information between different organizations and systems, but various challenges pertaining to interoperability persist. One of the main challenges is guaranteeing the relevance, timeliness, and accessibility of information. Particularly worth reading is Section 4, which contributes to answering the question: how can GIS, cyberinfrastructure, or spatial data infrastructure (SDI) be used to enhance FAIR services.
This last paper introduces the concept of FAIR, which is the acronym of Fairness-Access-Interoperability- Reuse, a quadruple of fundamental principles 14 that can represent an umbrella for projects that have been previously labelled as SDI and initiatives. It is worth observing that, while SDI deployment overcome technological aspects (policy and resources are also required), FAIRness can be gained via techniques and methods, thus enlarging the arena of products that reach compliance.
3. Relevant Initiatives and Projects for Building SDI for Remote Sensing
While Section 2 has been devoted to review scientific literature on SDI for Remote Sensing, the present Section introduces tools specifically created to ease managing satellite remote sensing imagery by building on the review paper 15.
We recall that a Spatial Data Infrastructure (SDI) serves as a platform that streamlines the interaction between individuals and systems, fostering the exchange, sharing and manipulation of spatial data, which encompasses Earth Observation (EO) information. This is achieved by delivering essential resources, policies, technologies, and standards 15. Relaxing this definition, in this Section we overview some relevant efforts, projects and initiatives that developed platforms for Earth Observation (EO) data management and analysis that addressed the challenges posed by the increasing amounts of freely available geospatial data generated by EO satellites 15.
The platforms integrate various technologies, APIs, and web services to provide comprehensive solutions for EO data management and analysis, catering to the needs of researchers and users in the EO community.
The role of novel technologies, such as cloud computing and distributed systems, to store, process, disseminate, and analyse big EO data sets are discussed.
Table 2 summarizes the main features of the reviewed platforms for managing remote sensing data, developed by various projects and initiatives worldwide.
3.1. The European Initiatives for Environmental Research Infrastructures—ENVRI
The Environmental Research Infrastructures - ENVRI Community, comprehending 26 European Research Infrastructures (RIs), serves as a vital organization fostering collaborative research in various Earth system aspects. In particular, ENVRI-FAIR, a part of ENVRI, focuses on implementing FAIR principles and integrating them with the European Open Science Cloud (EOSC). This initiative aims for open access to interdisciplinary environmental research data in the European research area, fostering common policies, standards, and global cooperation. ENVRI-FAIR will contribute to capacity building, innovation, and collaboration within the environmental research sector and will work on the following:
- Common data policies for further development of the common standards and policies for data life cycle, cataloguing, curation, provenance and service provision within environmental research infrastructures;
- Open science to sharing data and software;
- Capacity building for improved skills of the research infrastructure (RI) personnel so they can develop and maintain the FAIR infrastructures;
- Innovation of each RI by establishing a specific ENVRI-FAIR service catalogue section in the EOSC catalogue;
- Global cooperation for a cohesive global RI, including other RI clusters, regional and international initiatives in the environmental sector;
- Exposure of thematic data services and tools from the RI catalogues to the EOSC catalogue of services, including COPERNICUS, GEO and other end-users.
In the context of ENVRI two initiatives are described hereafter for they integrate remote sensing data as major data.
3.1.1. The European Plate Observing System (EPOS)
The European Plate Observing System (EPOS) infrastructure [16] is designed to study and monitor the Earth's geodynamic processes and to serve as a long-term, pan-European infrastructure for solid Earth science, providing facilities, data, and services for researchers. It is founded on a multidisciplinary approach that integrates various geoscientific disciplines, including seismology, geodesy, and geology, fostering collaboration across different fields. This allows to integrate diverse datasets related to Earth's structure, dynamics, and hazards to provide a comprehensive understanding of geological processes. The infrastructure focuses on interoperability standards to ensure seamless data exchange and accessibility among different geoscientific communities. EPOS data and services are managed and used in ways that maximise public benefit following FAIR principles (Findability, Accessibility, Interoperability, and Reusability). International collaborations under the European Research Infrastructure Consortium (ERIC) are promoted with international initiatives, enhancing its global impact on Earth science research by establishing a network of observatories and monitoring stations across Europe, enabling continuous data collection. Based in Italy, EPOS ERIC has currently nineteen members, participating as an observer. The challenges that it faces are related with integration complexity posed by the diverse datasets with varying formats and standards, requiring harmonization efforts, the management of the legal and ethical policies with international collaborations related to data sharing and privacy. Finally, involving and engaging the scientific community, industry, and policymakers to maximize the utility of EPOS remains a challenge. Future directions impose further technological advancements by embracing emerging technologies such as artificial intelligence, machine learning, and advanced sensing techniques to enhance data collection and analysis. Also expanding geographic coverage beyond Europe to create a more global observatory network by incorporating new data sources. This involves integrating satellite observations, unmanned aerial vehicles, and citizen science projects to enrich the scope of observations. Finally, efforts are made for strengthening educational and outreach programs to raise awareness and interest in Earth science, fostering the next generation of geoscientists.
3.1.2. Sentinel Hub (ESA Copernicus Project)
The Sentinel Hub available on the Copernicus Data Space Ecosystem [17] is a key component of the Copernicus program [18], utilizing a constellation of Sentinel satellites to observe and monitor Earth's environment. It follows an open data policy, providing free and open access to a vast amount of Earth observation data from remote sensing collected by the Sentinel satellites. Its multispectral imaging capabilities allow for the capture of data across different wavelengths, enabling detailed analysis of land cover, vegetation, oceans, polar regions and other environmental features. To serve diverse tasks it offers customizable services for users to access, process, and analyse satellite imagery according to their specific needs and applications. To this end it applies cloud computing technologies, enabling efficient storage, processing, and access to large volumes of Earth observation data. The features of the platform are made available through OGC services and a RESTful API. A web interface is also available that allows the configuration of specific services. Ensuring the ongoing maintenance and scalability of the infrastructure to handle increasing data demands and technological advancements is a main concern. Also integrating data from multiple Sentinel satellites and ensuring compatibility with other Earth observation systems is still a feature that is delegated to the development of downstream services.
3.2. Google Earth Engine
While Google Earth Engine [19] (GEE) is not traditionally classified as an SDI, it shares some characteristics with an SDI, and we mention it for its widespread use in many countries to implement IT platforms managing remote sensing data. In fact, GEE is primarily known as a cloud-based platform for planetary-scale geospatial analysis that provides access to a vast amount of remote sensing data and other geospatial data. It focuses on processing and analyzing Earth Observation data rather than serving as a broader infrastructure for spatial data exchange and sharing. After the free availability of Landsat series in 2008, Google archived diverse datasets, including satellite data from Copernicus program, GIS-based vector datasets, social, demographic, weather, digital elevation models, and climate data.
The GEE platform is built from a collection of technologies available on Google’s infrastructure, such as the large-scale computer cluster management system (Borg), the distributed databases (Bigtable and Spanner), the distributed file system (Colossus) and the parallel pipeline execution framework FlumeJava. The user-friendly front-end facilitates interactive data and algorithm development, allowing users to add and curate their data. This accessibility empowers scientists, researchers, and nations globally for change detection, trend mapping, and resource quantification on Earth's surface. While GEE provides a platform for searching and sharing geospatial data within its ecosystem, it operates within its proprietary framework rather than conforming to widely recognized SDI standards. Users interact with GEE through its own programming interfaces and tools, which are specific to the platform's functionalities. Therefore, GEE does not guarantee that an analysis performed on the platform can be reproduced in the future, since its internal algorithms can be changed or discontinued by the platform at any time 15.
3.3. The Open Data Cube (ODC)
The Open Data Cube [20] (ODC), previously known as the Australian Geoscience Data Cube, is an analytical framework designed for organizing and analysing Earth observation (EO) data. Supported by organizations like Analytical Mechanics Associates (AMA), and US Geological Survey (USGS), ODC enables cataloguing massive EO datasets, providing access and manipulation through command line tools and a Python API. Its architecture includes data acquisition, a core infrastructure for data indexing, storage, and delivery, and auxiliary modules for applications like job management. ODC's source code and tools are open and distributed through various git repositories. It indexes data in Products and Datasets, with metadata extraction scripts for instruments like Landsat and Sentinel. The data loading process involves registering products, extracting metadata, cataloguing datasets, and optional data ingestion for optimization. ODC's Python API facilitates application development, while it provides OGC web services and tools for deployment, data access, and statistics extraction. Despite operational use in multiple institutions, ODC lacks tools for easy data and application sharing between researchers, requiring manual efforts. For a user to be able to reproduce results in another instance of ODC, it is necessary to manually share and index the data and applications used.
3.4. The System for Earth Observation Data Access, Processing and Analysis for Land Monitoring (SEPAL)
The System for Earth Observation Data Access, Processing, and Analysis for Land Monitoring (SEPAL) [21] is a cloud computing platform developed for automatic land cover monitoring by several private and governmental organizations, among which ESA, Google, NASA, ETHZurich, Formin.Finland, etc. Combining cloud services like Google Earth Engine (GEE) and Amazon Web Services (AWS) with free software, SEPAL focuses on creating a pre-configured environment to manage computational resources in the cloud. Initiated by the UN FAO Forestry Department and financed by Norway, SEPAL's source code is available under the MIT license and is still under development. It acts as an interface, providing a web-based user interface for dataset search and retrieval and the initiation of cloud-based machines for analysis. SEPAL uses Google Cloud Storage, Google Drive, GEE, and AWS for data storage and processing. Accessible through a web portal (https://sepal.io), it divides functionalities into Process, Files, Terminal, and Apps areas, offering tools for image search, storage browsing, machine initiation, and various applications like RStudio and Jupyter Notebook. However, SEPAL lacks web services for data access and processing requests, and users are responsible for developing applications to utilize available computational resources. Additionally, it lacks tools for sharing analyses between users.
3.5. The Big Data Analytic Platform (BADP) of the Joint Research Center (JRC)
The Big Data Analytic Platform [22] is the successor of the Joint Research Center (JRC) Earth Observation Data and Processing Platform (JEODPP), already supporting a variety of projects in agriculture, forestry, environment, disaster risk management, development, health, and energy, by widening the scope of the JEODPP platform towards any type of Big Data analytics. It is mainly built on Open-source software to serve JRC users and designed to handle large-scale geospatial data streams, offering a scalable solution to multi-petabyte data volumes. To this end the system employs distributed storage and a cluster of computing nodes using commodity hardware for both storage and processing. Three main services are available to different user needs: batch processing, legacy environment provision, and interactive visualization and processing, all accessible through a web browser. Its architecture consists of three layers: resources, service, and client. In the hardware layer, a distributed file system (DFS) based on EOS is utilized for scalable storage. EOS, developed by CERN, runs on commodity hardware and ensures low latency, high availability, and cost-effectiveness. The data representation retains raster data in flat files with accompanying pyramid representations for interactive visualization. The platform employs lightweight virtualization using Docker for managing various services with different library and software requirements. Batch processing is a key feature that allows the orchestration of a high number of single-threaded jobs. The platform supports legacy scientific software environments, providing access to a web-based remote desktop environment for Linux. Users can access all services through a web browser, eliminating the need for dedicated client software installations on their devices. The platform incorporates an interactive visualization environment based on Jupyter notebooks that allows users to visually explore and analyse geospatial data using a web browser interface. Furthermore, it employs a deferred execution pattern, allowing users to interactively modify processing parameters on the fly. This enables effective and efficient data analysis by applying processing only when needed at the specific extent and scale the user is focusing on. Finally, the Jupyter notebook environment, IPyLeaflet map viewer, and other tools are chosen for their user-friendly interfaces, supporting users in writing Python code for processing and visualization without the need for extensive expertise.
3.6. The OpenEO project
The OpenEO project 23 was developed as a collaborative initiative involving multiple contributors and institutions around the world. It addresses the challenge of consolidating technologies for storing and processing Earth Observation (EO) data in the cloud. It aims to alleviate concerns about vendor dependency by offering a standardized, open-source application programming interface (API) for EO data and Copernicus applications. The three-tier architecture comprises Client APIs (R, Python, JavaScript), Core API (standardizing requests), and Driver APIs (connecting to back-end services). With such an API, each client can work with every back-end, and it becomes possible to compare back-ends in terms of capacity, cost, and results (validation, reproducibility).
However, OpenEO does not impose restrictions on back-end technologies, potentially leading to variations in functionality and posing challenges for reproducibility. Despite these considerations, the project significantly contributes to reducing barriers for the EO community in adopting cloud computing technologies and big EO data analysis platforms. There are services that implement the specifications of the OpenEO project, such as the ESA openEO platform (https://openeo.cloud/), that provides intuitive programming libraries to process a wide variety of earth observation datasets. This large-scale data access and processing is performed on multiple infrastructures, which all support the openEO API. This enables use cases ranging from explorative research to large-scale production of EO-derived products.
In December 2023 openEO has been submitted to OGC for consideration as an OGC community standard. Several members of the OCG already endorsed the OCG submission of openEO, among which ESA and Eurac Research.
3.7. The High Performance Cloud Computing for Remote Sensing Big Data Management and Processing (pipsCloud)
PipsCloud 24 is a proprietary solution developed by Chinese research institutions for managing and processing extensive EO data through cloud computing. It utilizes a proprietary file system, developed exclusively by Chinese institutions. The cloud environment is built on an internal infrastructure using OpenStack technology, an open-source cloud computing platform that provides a set of software tools for building and managing both public and private cloud infrastructure. The architecture employs a Hilbert-R+ tree, a spatial index structure used in database systems for efficient spatial data retrieval and queries, and a virtual file catalog for efficient file indexing. Users can request specific data through queries, mounting only the necessary data on their processing machines. On the server-side, pipsCloud provides C++ code templates for application development, abstracting data reading and process submission using MPI, a standardized and portable message-passing system for parallel processing. However, the platform lacks functionalities for exporting data using OGC standards, hinders science reproducibility, and is restricted for internal use by participating institutions.
3.8. The U.S. GeoPlatform of the National Spatial Data Infrastructure (NSDI)
The National Geospatial Data Asset (NGDA) 25refers to a dataset identified by the U.S. Federal Geographic Data Committee (FGDC) as a critical dataset for the United States. These datasets, organized into various themes, are considered fundamental for supporting government functions, providing a foundation for spatial data infrastructure, and meeting the needs of diverse user communities.
The Geospatial Platform 26 is a national resource aligned with the U.S. Administration's Open Government strategies, embodying principles of transparency and collaboration. It focuses on making federal geospatial data assets more accessible, interoperable, and reusable, serving as the authorized source for the NGDA across 18 themes. The GeoPlatform team collaborates with data suppliers to increase FAIR data qualities, generating derivatives and assisting with metadata publishing. Value-added derivatives aid understanding FGDC compliance, navigate metadata challenges, and support Esri ArcGIS Online managers.
Upcoming roadmap includes more data incorporation, streamlined access for Esri users, search improvements, additional OGC OpenAPI support, and improved statistics on data use. A concept in progress is Semantic feature generation, linking the feature registry to the semantic web to support schema.org tagging, data science ontological extension, and feature change subscription for major consumers and map vendors.
3.9. The EarthExplorer of the United States Geological Survey USGS (EE)
The United States Geological Survey (USGS) 27 brings an array of earth, water, biological, and mapping data and expertise to bear in support of decision-making on environmental, resource, and public safety issues. It provides a number of high-quality products to the public among which data, maps, web tools and software 28. Among the Web tools an alert and notification service is available upon registration, a data and maps access tool with search functionalities, a data analysis tools, data visualizations, digital repositories, and interactive maps provision.
In 2008, USGS has democratized the use of Landsat data by making all new and archived Landsat imagery accessible over the Internet under a free and open data policy. Since then, the USGS Earth Resources Observation and Science (EROS) Center operates the Landsat satellite program with NASA and maintains the largest civilian collection of images of the Earth’s land surface in existence, including tens of millions of satellite images, besides other remote sensing data.
To this end it has developed the USGS EarthExplorer (EE) tool, a web-based platform that provides users the ability to query, search, and order satellite images, aerial photographs, and cartographic products from several sources. In addition to data from the Landsat missions and a variety of other data providers, EE now provides access to MODIS land data products from the NASA Terra and Aqua missions, and ASTER level-1B data products over the U.S. and Territories from the NASA ASTER mission. It provides several facilities among which advanced search and query capabilities, allowing users to specify criteria such as geographic extent, time range, and specific sensors; an ordering system that enables users to request and download the selected data products; integration with data providers, such as NASA for MODIS and ASTER data, requires establishing connections and protocols for accessing and retrieving data. Given the sensitive nature of some geospatial data, the platform incorporates security measures to protect user data and ensure proper authentication and authorization processes. Finally, it is continuously updated to incorporate new datasets, features, and improvements.
3.10. Earthdata from NASA
NASA’s Earthdata website 29 is one of the access points of the planet’s largest repositories of Earth observation data. These data, along with the tools for analysing and working with them, are available fully, openly, and without restrictions. The Data Pathfinders module assists users in selecting datasets tailored to their applications and guide them in using intuitive tools, promoting equitable and unrestricted access to NASA Earth science data. These guides aim to acquaint users with and offer direct links to relevant, frequently utilized datasets within NASA's Earth science data collections. Image services are made available to process and share collections of imagery. These flexible and robust services can be comprised of a variety of data types, both large and small, and can be multiband or multidimensional.
They leverage a powerful server backend to perform the required processing on-the-fly and dynamic mosaicking of images. These applications can access the imagery as a seamless mosaic or query into the metadata of each image to display only a selection of the data or apply processing across datasets to find differences or perform classification. These processes can include reprojection, orthorectification, clipping, the application of complex image processing algorithms, and more. Clients can connect to image services using an ArcGIS Server connection or via REST. Additionally, image services can be published with the OGC Web Map Service (WMS) or Web Coverage Service (WCS) capabilities. ArcGIS Image Services can also be accessed and used inside open-source tools such as QGIS and Jupyter Notebooks.
4. Discussion and Conclusions
In the literature, a certain number of papers face and offer solutions to the challenge of managing remote sensing data via SDIs. In the papers analyzed in Section 2, the two topics are not dealt with at the same level of detail: usually, issues linked to SDI technologies are better described and there is a generic declaration about their utility in the field of remote sensing data exploitation. Results in Section 2 also show that some interesting dimensions emerging in (spatial) information systems are not included in the considered papers. We have explicitly reported some few examples that either include important topics, such as the relevance of reusable geospatial services, the interest of semantic-based approaches, cloud computing, and service orchestration, exploitation rights in code reuse, Linked Data and the Web of Data, or deserve particular attention to an application/regional case (drought-monitoring, ground deformation emergencies, hydro-climatological observations, the Australian geospatial strategy). The last example 14 described in Section 2 regards a very recent paper that explicitly paves the path to FAIR principles, that seem to provide a more flexible environment to frame fundamental SDI concepts, such as data discovery and interoperability.
Indeed, the literature review does not highlight well recognized (set of) tools that are used to develop and deploy SDIs in remote sensing. In Section 3 we have then reviewed efforts, projects and initiatives that developed platforms for Earth Observation (EO) data management and analysis, addressing the challenges posed by the increasing amounts of freely available geospatial data generated by EO satellites. The analysis lets emerge that the majority of the platforms manage both remote sensing data and data from different sources. More than half of the reviewed platforms either adopt or offer (besides proprietary tools) OCG compliant interoperable standards for data sharing, while the remaining offer proprietary tools only. This is somewhat in accordance with the temporal analysis of the selected literature (see Figure 4) where “OCG standard” appears in the middle of the time range analysed, showing that this is currently an issue to pursue. Besides, half of the platforms offer open APIs fostering an Open data and processing policy. As far as the functionalities, more than half of the platforms enable a catalogue service plus processing. Nevertheless, the kind of processing is limited and does not include complex spatio-temporal analysis functions, which is in accordance with the temporal analysis of the literature, where the keyword “spatio-temporal analysis” appears in the most recent of the analysed time range (in yellow in Figure 4). Finally, cloud computing is adopted for achieving scalability to manage big data by half of the platforms, which is also in line with the temporal analysis of the literature, where the keyword “big data” appears in yellow, as a recent notion for the time range (Figure 4). While the SDI framework is still a reference for many of the implemented solutions, what is still a challenge is the implementation of FAIR principles which are advocated only by a quarter of the platforms, mainly those managed by governmental organizations.
From this review we can conclude that in the near future the SDI paradigm will leave its place to more flexible paradigms implementing the FAIR principles. This is exactly an explicit objective of some platforms such as those in ENVRI and US GeoPlatform.
Author Contributions
All authors authored or reviewed drafts of the paper and approved the final draft. Gloria Bordogna and Giacomo De Carolis conceived the paper topic. Gloria Bordogna and Paola Carrara designed and performed the experiments, analyzed the data, and prepared figures and/or tables.
References
- Page, M.J., McKenzie, J.E., Bossuyt, P.M., Boutron, I., Hoffmann, T.C., Mulrow, C.D., Shamseer, L.,Tetzlaff, J.M., Akl, E.A., Brennan, S.E., Chou, R., Glanville, J., Grimshaw, J.M.,Hr´objartsson, A., Lalu, M.M., Li, T., Loder, E.W., Mayo-Wilson,E., McDonald, S., McGuinness, L.A., Stewart, L.A., Thomas, J., Tricco, A.C., Welch, V.A., Whiting, P., Moher, D., 2021. The PRISMA 2020 statement: an updated guideline for reporting systematic reviews. BMJ 372. doi:10.1136/bmj.n71, arXiv:https://www.bmj.com/content/372/bmj.n71.full.pdf.
- Nebert DD (ed) (2004) Developing spatial data infrastructures: the SDI cookbook. Global Spatial Data Infrastructures Association (Online: Spatial Data Infrastructure Cookbook v2.0 (PDF) January 2004).
- Granell, C., Díaz, L., Gould, M. (2010). Service-oriented applications for environmental models: Reusable geospatial services. Environmental Modelling & Software, 25(2), 182-198, ISSN 1364-8152. [CrossRef]
- Evangelidis, K., Ntouros, K., Makridis, S., & Papatheodorou, C. (2014). Geospatial services in the Cloud. Computers & Geosciences, 63, 116-122.
- Müller, M., Bernard, L., & Kadner, D. (2013). Moving code–Sharing geoprocessing logic on the Web. ISPRS Journal of Photogrammetry and Remote Sensing, 83, 193-203.
- Lehmann, A., Giuliani, G., Ray, N., Rahman, K., Abbaspour, K. C., Nativi, S., ... & Beniston, M. (2014). Reviewing innovative Earth observation solutions for filling science-policy gaps in hydrology. Journal of Hydrology, 518, 267-277.
- Yue, P., Guo, X., Zhang, M., Jiang, L., & Zhai, X. (2016). Linked Data and SDI: The case on Web geoprocessing workflows. ISPRS Journal of Photogrammetry and Remote Sensing, 114, 245-257.
- Innerebner, M., Costa, A., Chuprikova, E., Monsorno, R., & Ventura, B. (2017). Organizing earth observation data inside a spatial data infrastructure. Earth Science Informatics, 10, 55-68.
- Woodgate, P., Coppa, I., Choy, S., Phinn, S., Arnold, L., & Duckham, M. (2017). The Australian approach to geospatial capabilities; positioning, earth observation, infrastructure and analytics: issues, trends and perspectives. Geo-spatial information science, 20(2), 109-125.
- Wiemann, S., Karrasch, P., & Bernard, L. (2018). Ad-hoc combination and analysis of heterogeneous and distributed spatial data for environmental monitoring–design and prototype of a web-based solution. International journal of digital earth, 11(1), 79-94.
- Magno, R., De Filippis, T., Di Giuseppe, E., Pasqui, M., Rocchi, L., & Gozzini, B. (2018). Semi-automatic operational service for drought monitoring and forecasting in the Tuscany region. Geosciences, 8(2), 49.
- Cignetti, M., Guenzi, D., Ardizzone, F., Allasia, P., & Giordan, D. (2019). An open-source web platform to share multisource, multisensor geospatial data and measurements of ground deformation in mountain areas. ISPRS International Journal of Geo-Information, 9(1), 4.
- Hu, L., Zhang, C., Zhang, M., Shi, Y., Lu, J., & Fang, Z. (2023). Enhancing FAIR data services in agricultural disaster: A review. Remote Sensing, 15(8), 2024.
- Wilkinson MD, Dumontier M, Aalbersberg IJ, Appleton G, Axton M, Baak A, Blomberg N, Boiten J-W, Da Silva Santos LB, Bourne PE+43 more. 2016. The FAIR guiding principles for scientific data management and stewardship. Nature 3:160018.
- Gomes, V.C.F.; Queiroz, G.R.; Ferreira, K.R. An Overview of Platforms for Big Earth Observation Data Management and Analysis. Remote Sens. 2020, 12, 1253. [CrossRef]
- https://www.epos-eu.org/.
- https://dataspace.copernicus.eu/.
- https://scihub.copernicus.eu/.
- https://earthengine.google.com/.
- https://www.opendatacube.org/.
- https://sepal.io/.
- https://jeodpp.jrc.ec.europa.eu/bdap/.
- https://openeo.org.
- http://www.pipscloud.net/index.asp.
- https://ngda-themes-dev-geoplatform.hub.arcgis.com/.
- https://www.fgdc.gov/initiatives/geospatial-platform.
- https://www.usgs.gov/.
- https://www.usgs.gov/products.
- https://www.earthdata.nasa.gov.
Figure 1.
Network map of the most relevant cooccurring keywords extracted from the selected articles.
Figure 1.
Network map of the most relevant cooccurring keywords extracted from the selected articles.
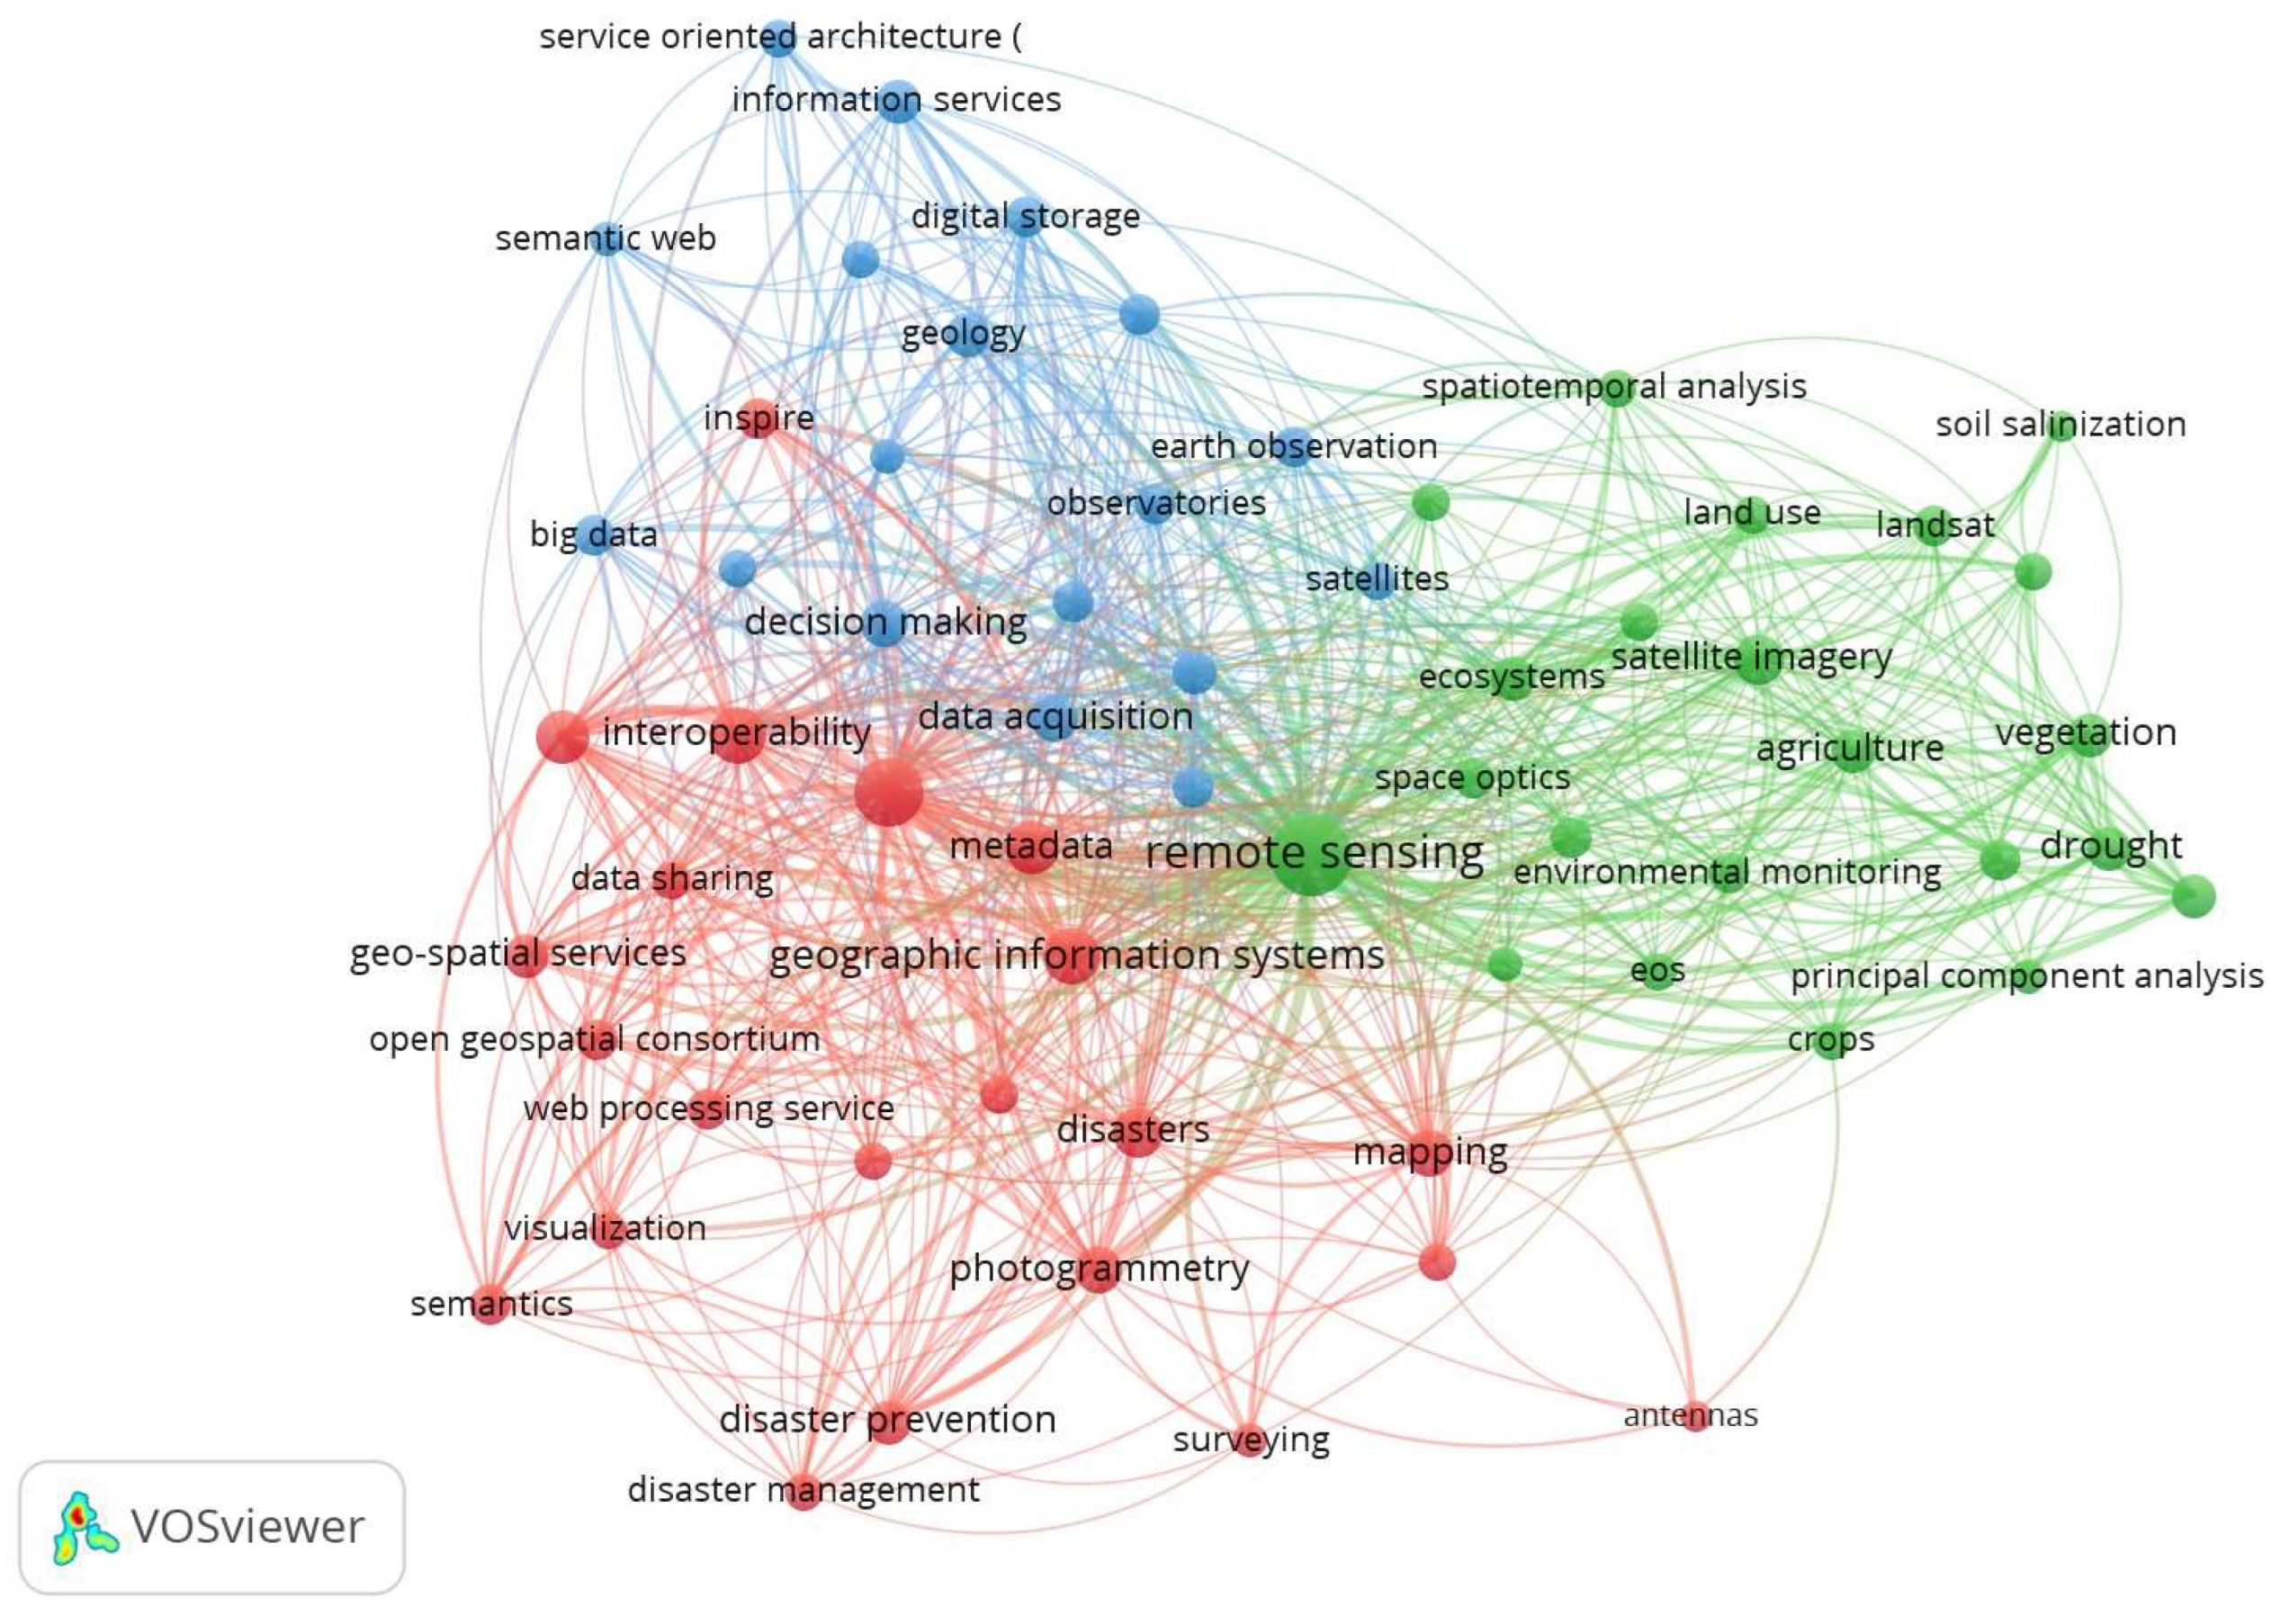
Figure 2.
Density of the most frequent keywords selected from the 334 articles.
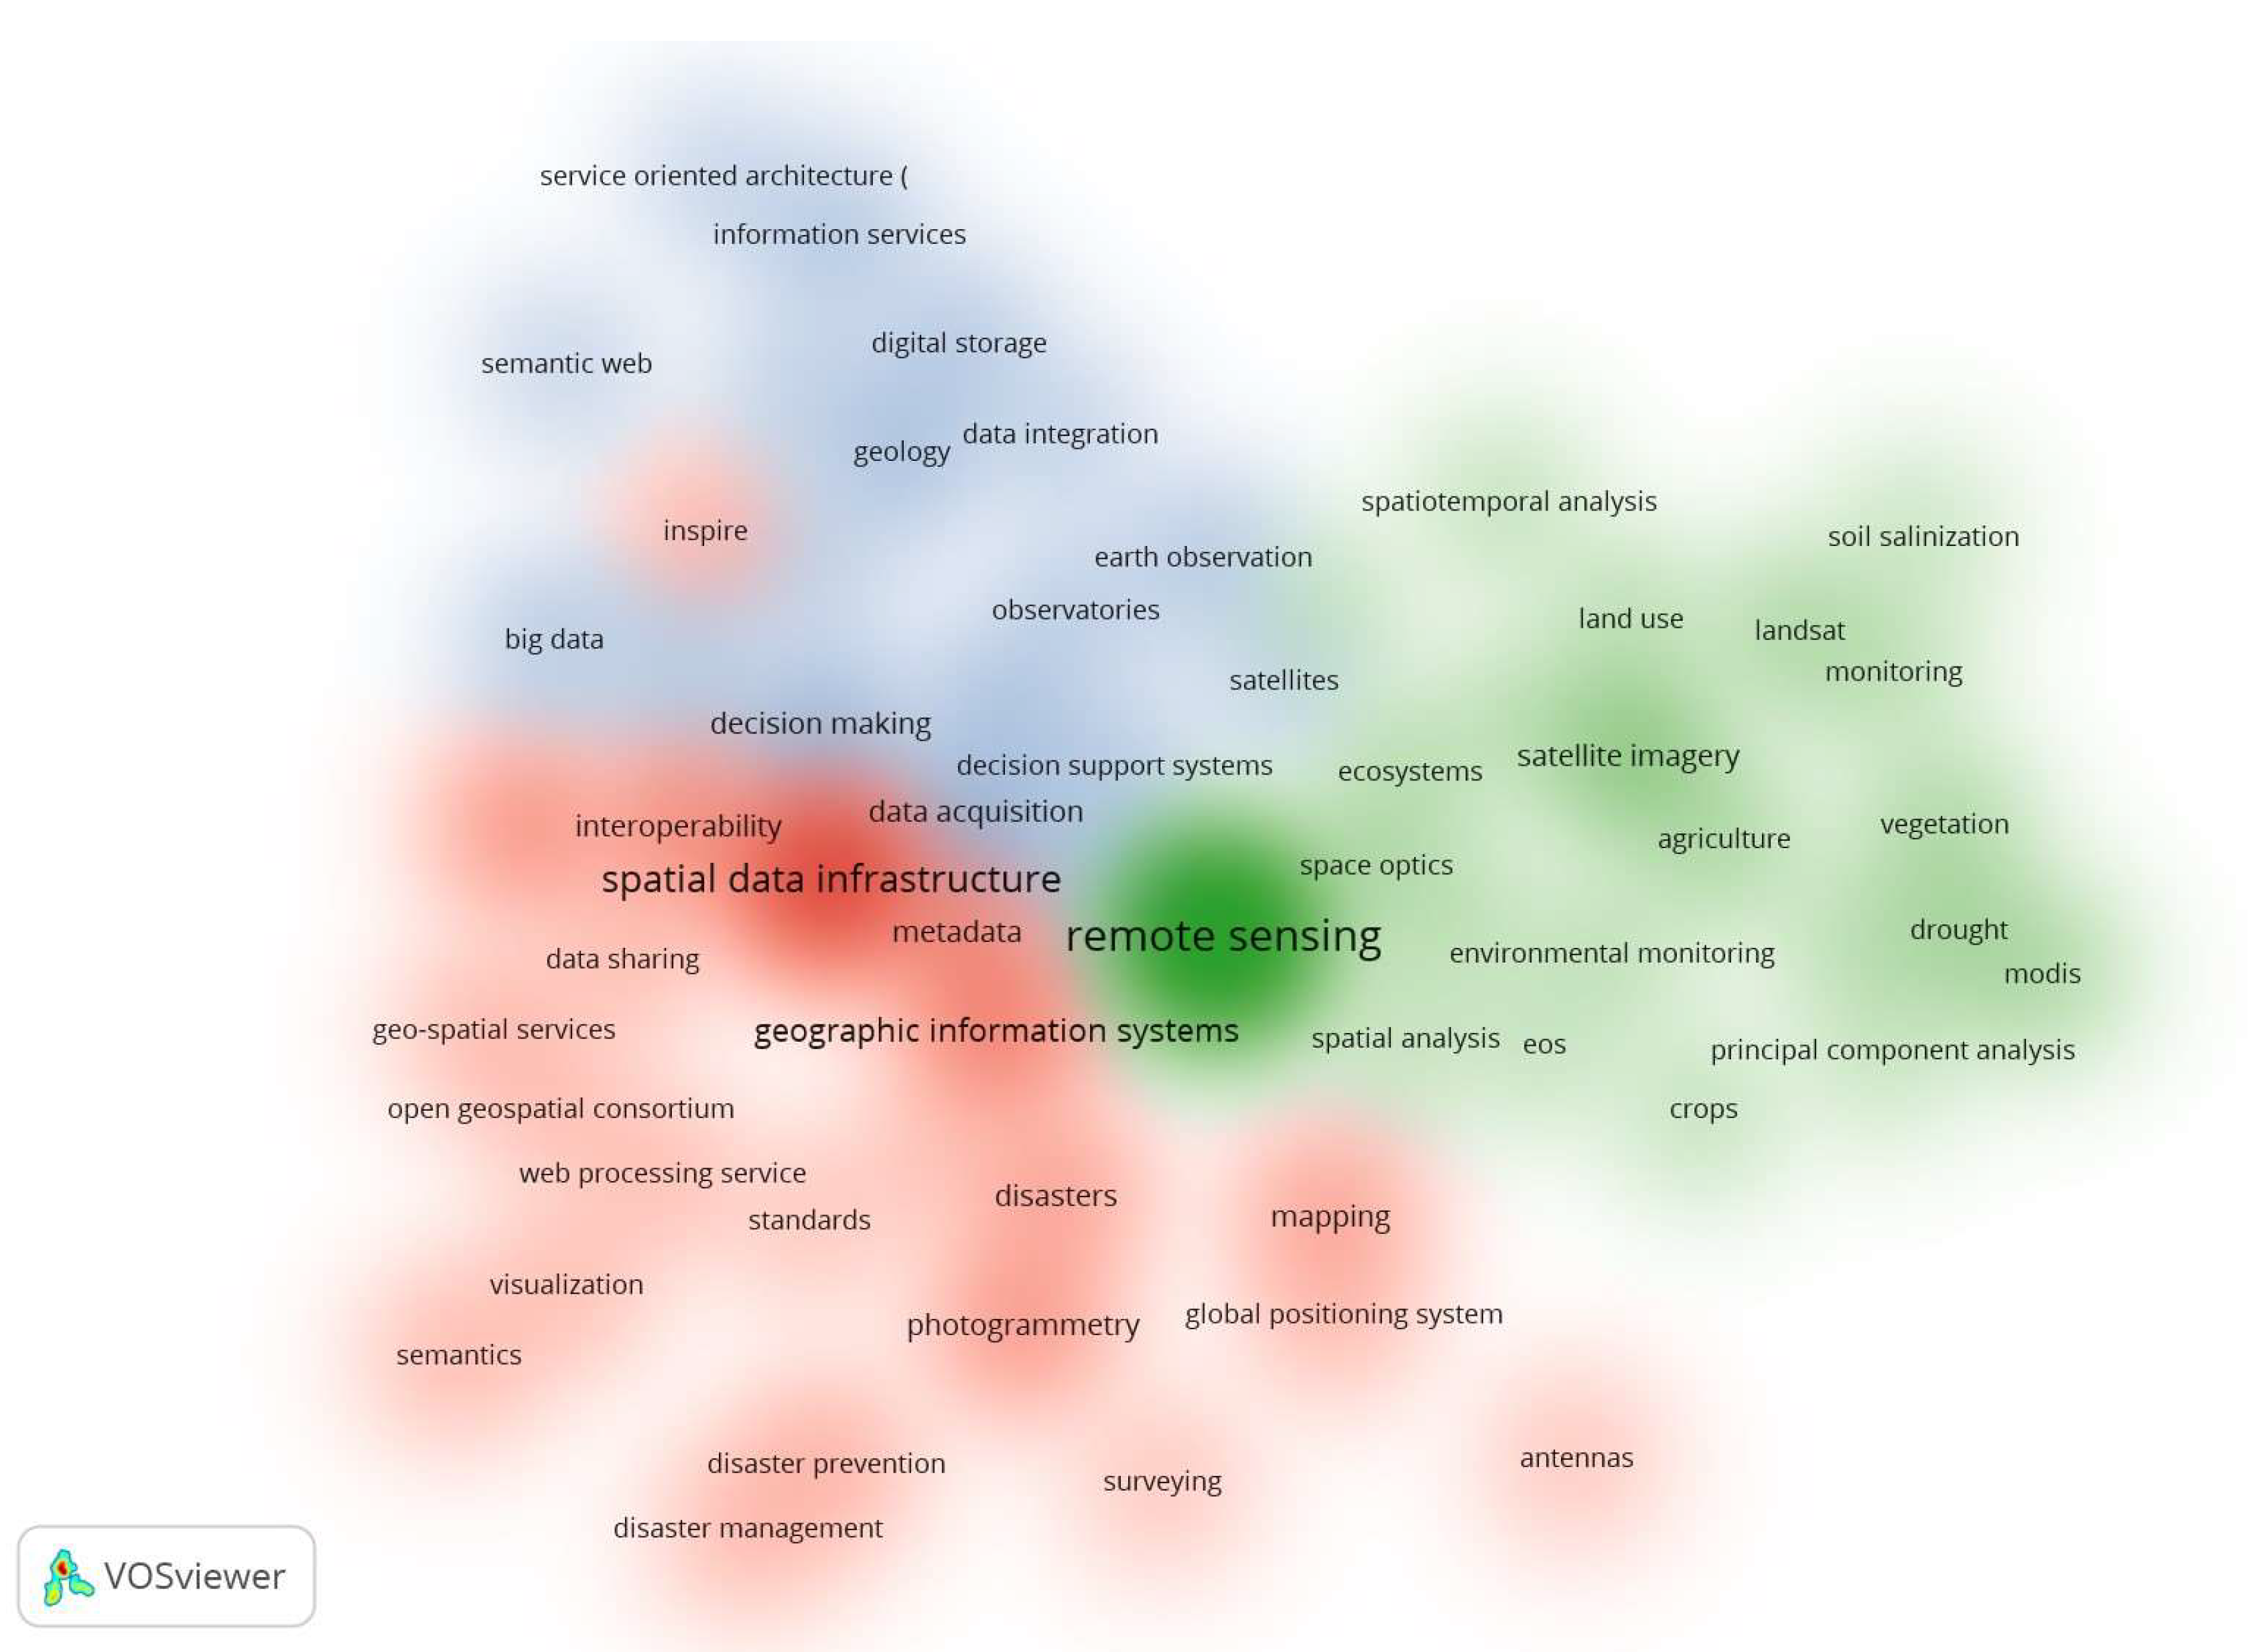
Figure 3.
First occurrence in time of the most relevant keywords selected from the 334 articles according to their most frequent publication dates.
Figure 3.
First occurrence in time of the most relevant keywords selected from the 334 articles according to their most frequent publication dates.
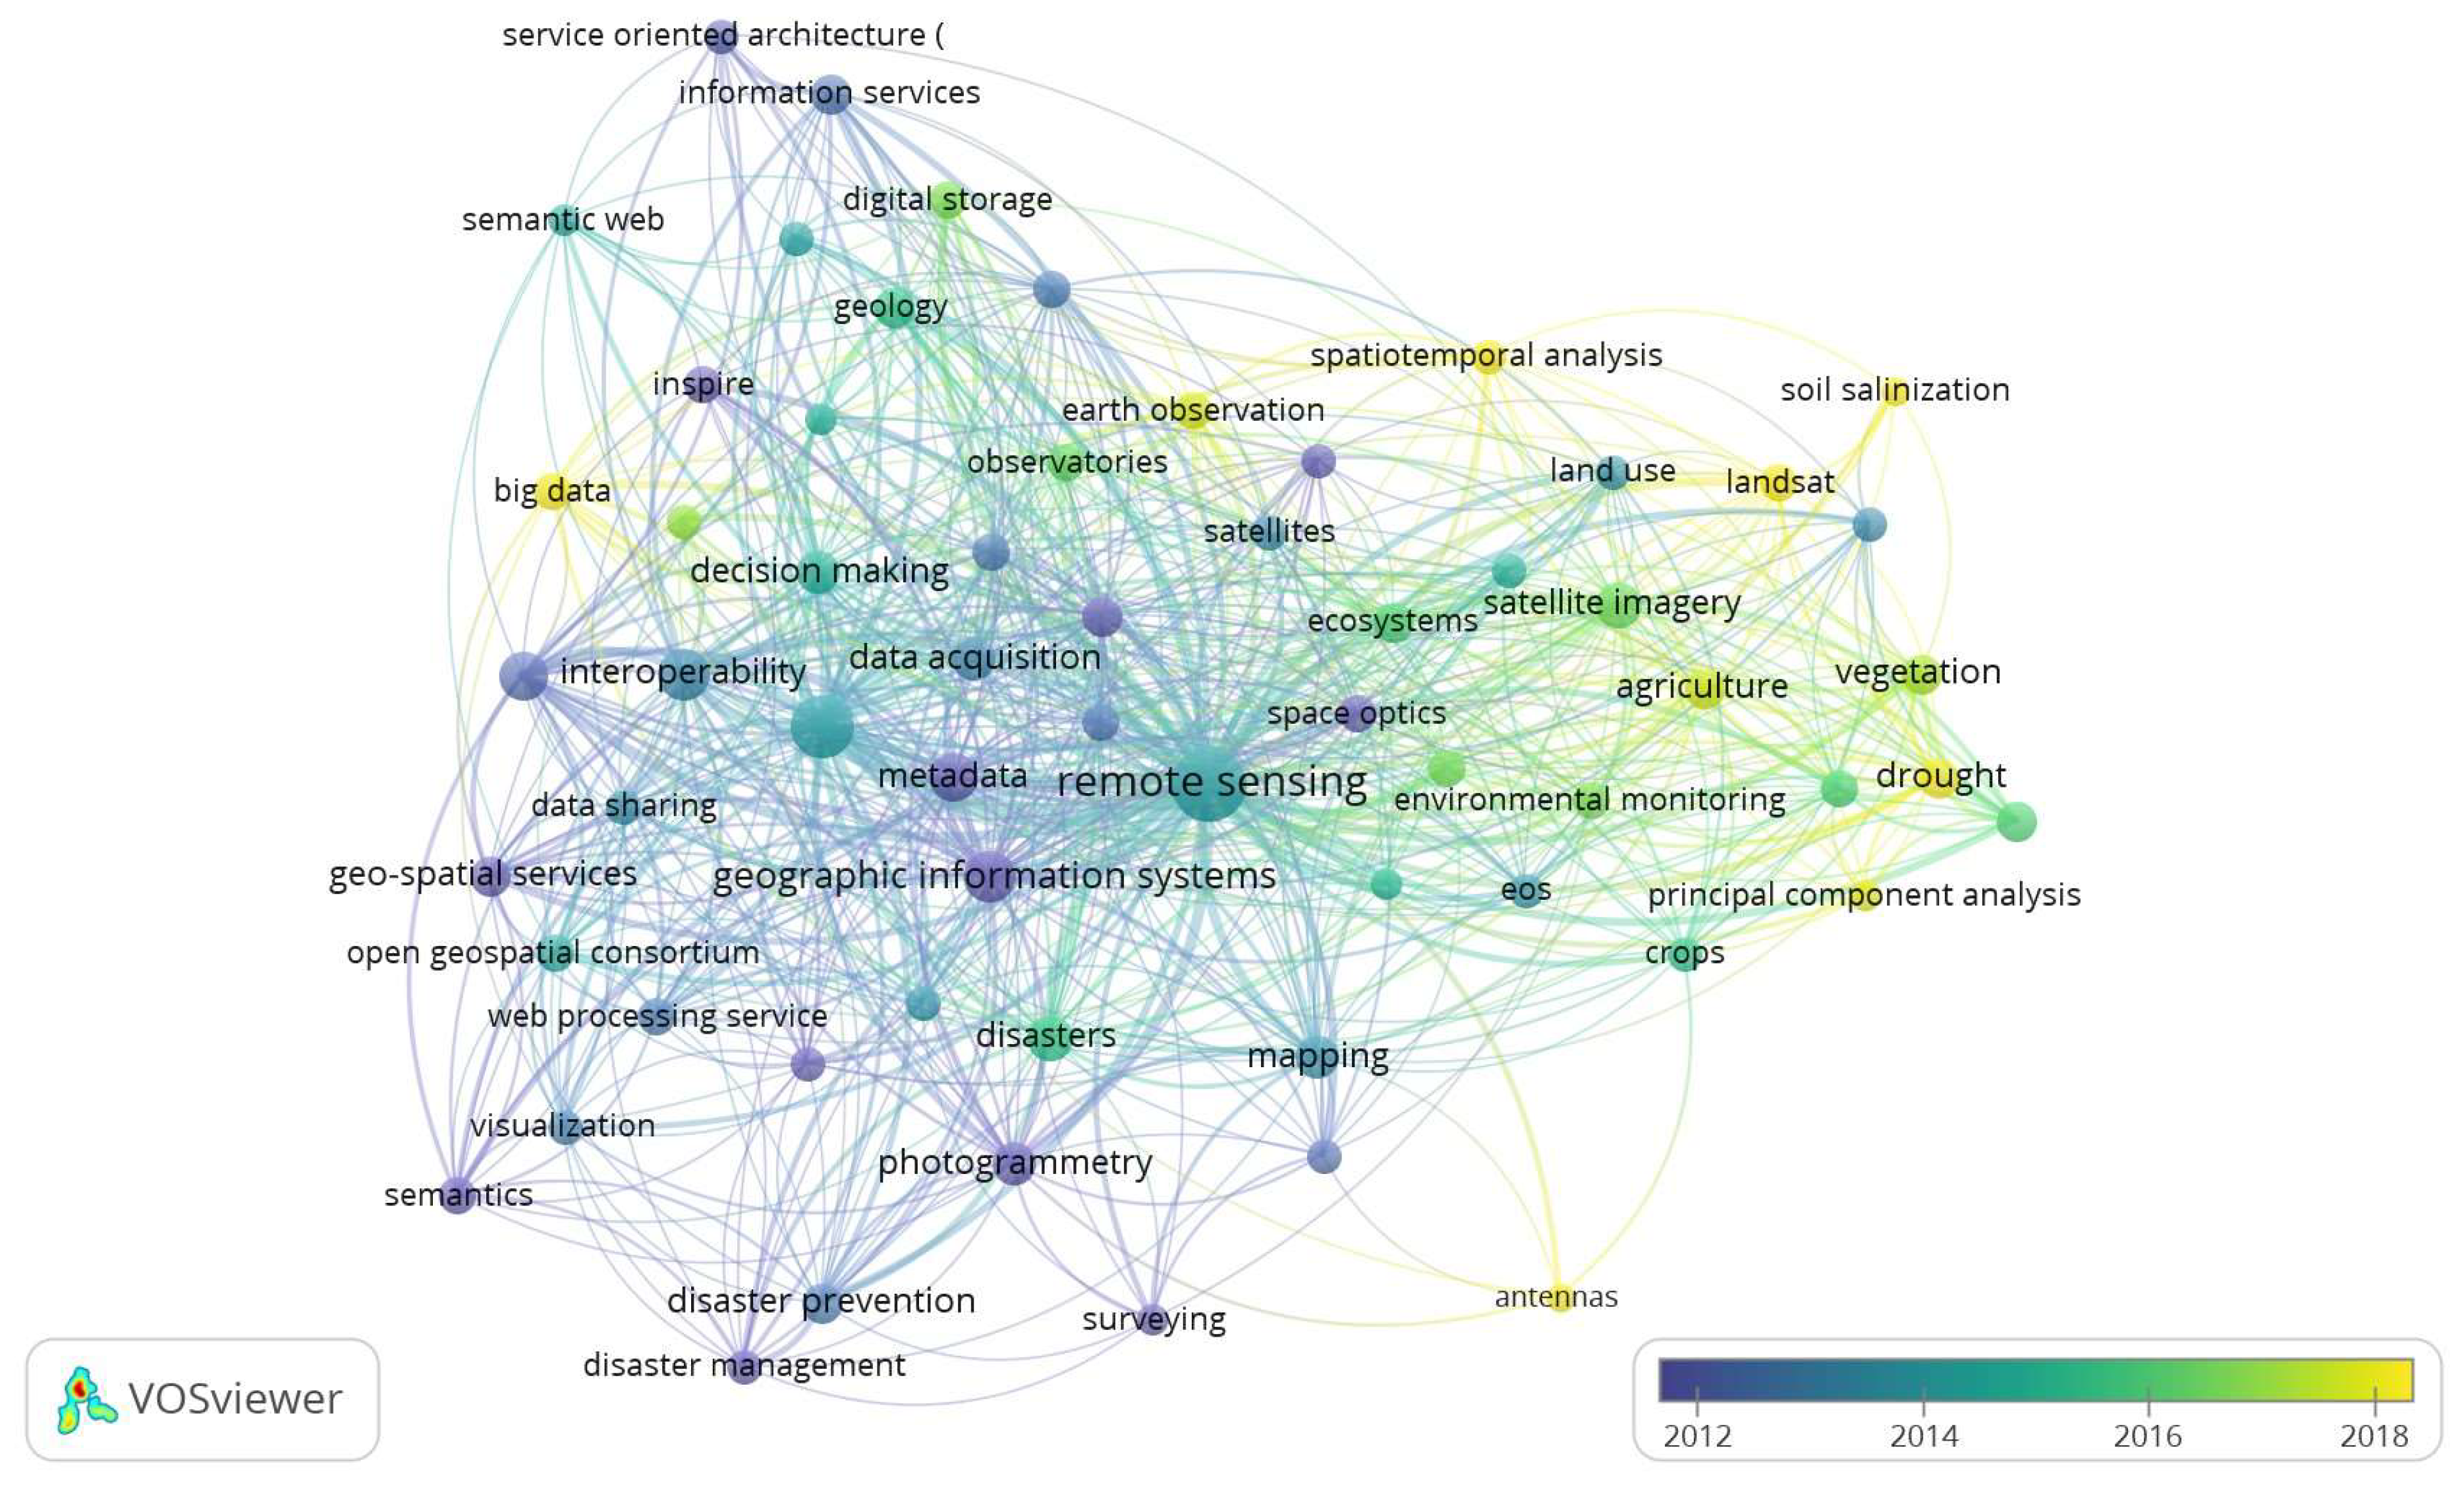
Figure 5.
Graphs showing value abundance (in \) for each dimension in Table 1.
Figure 5.
Graphs showing value abundance (in \) for each dimension in Table 1.
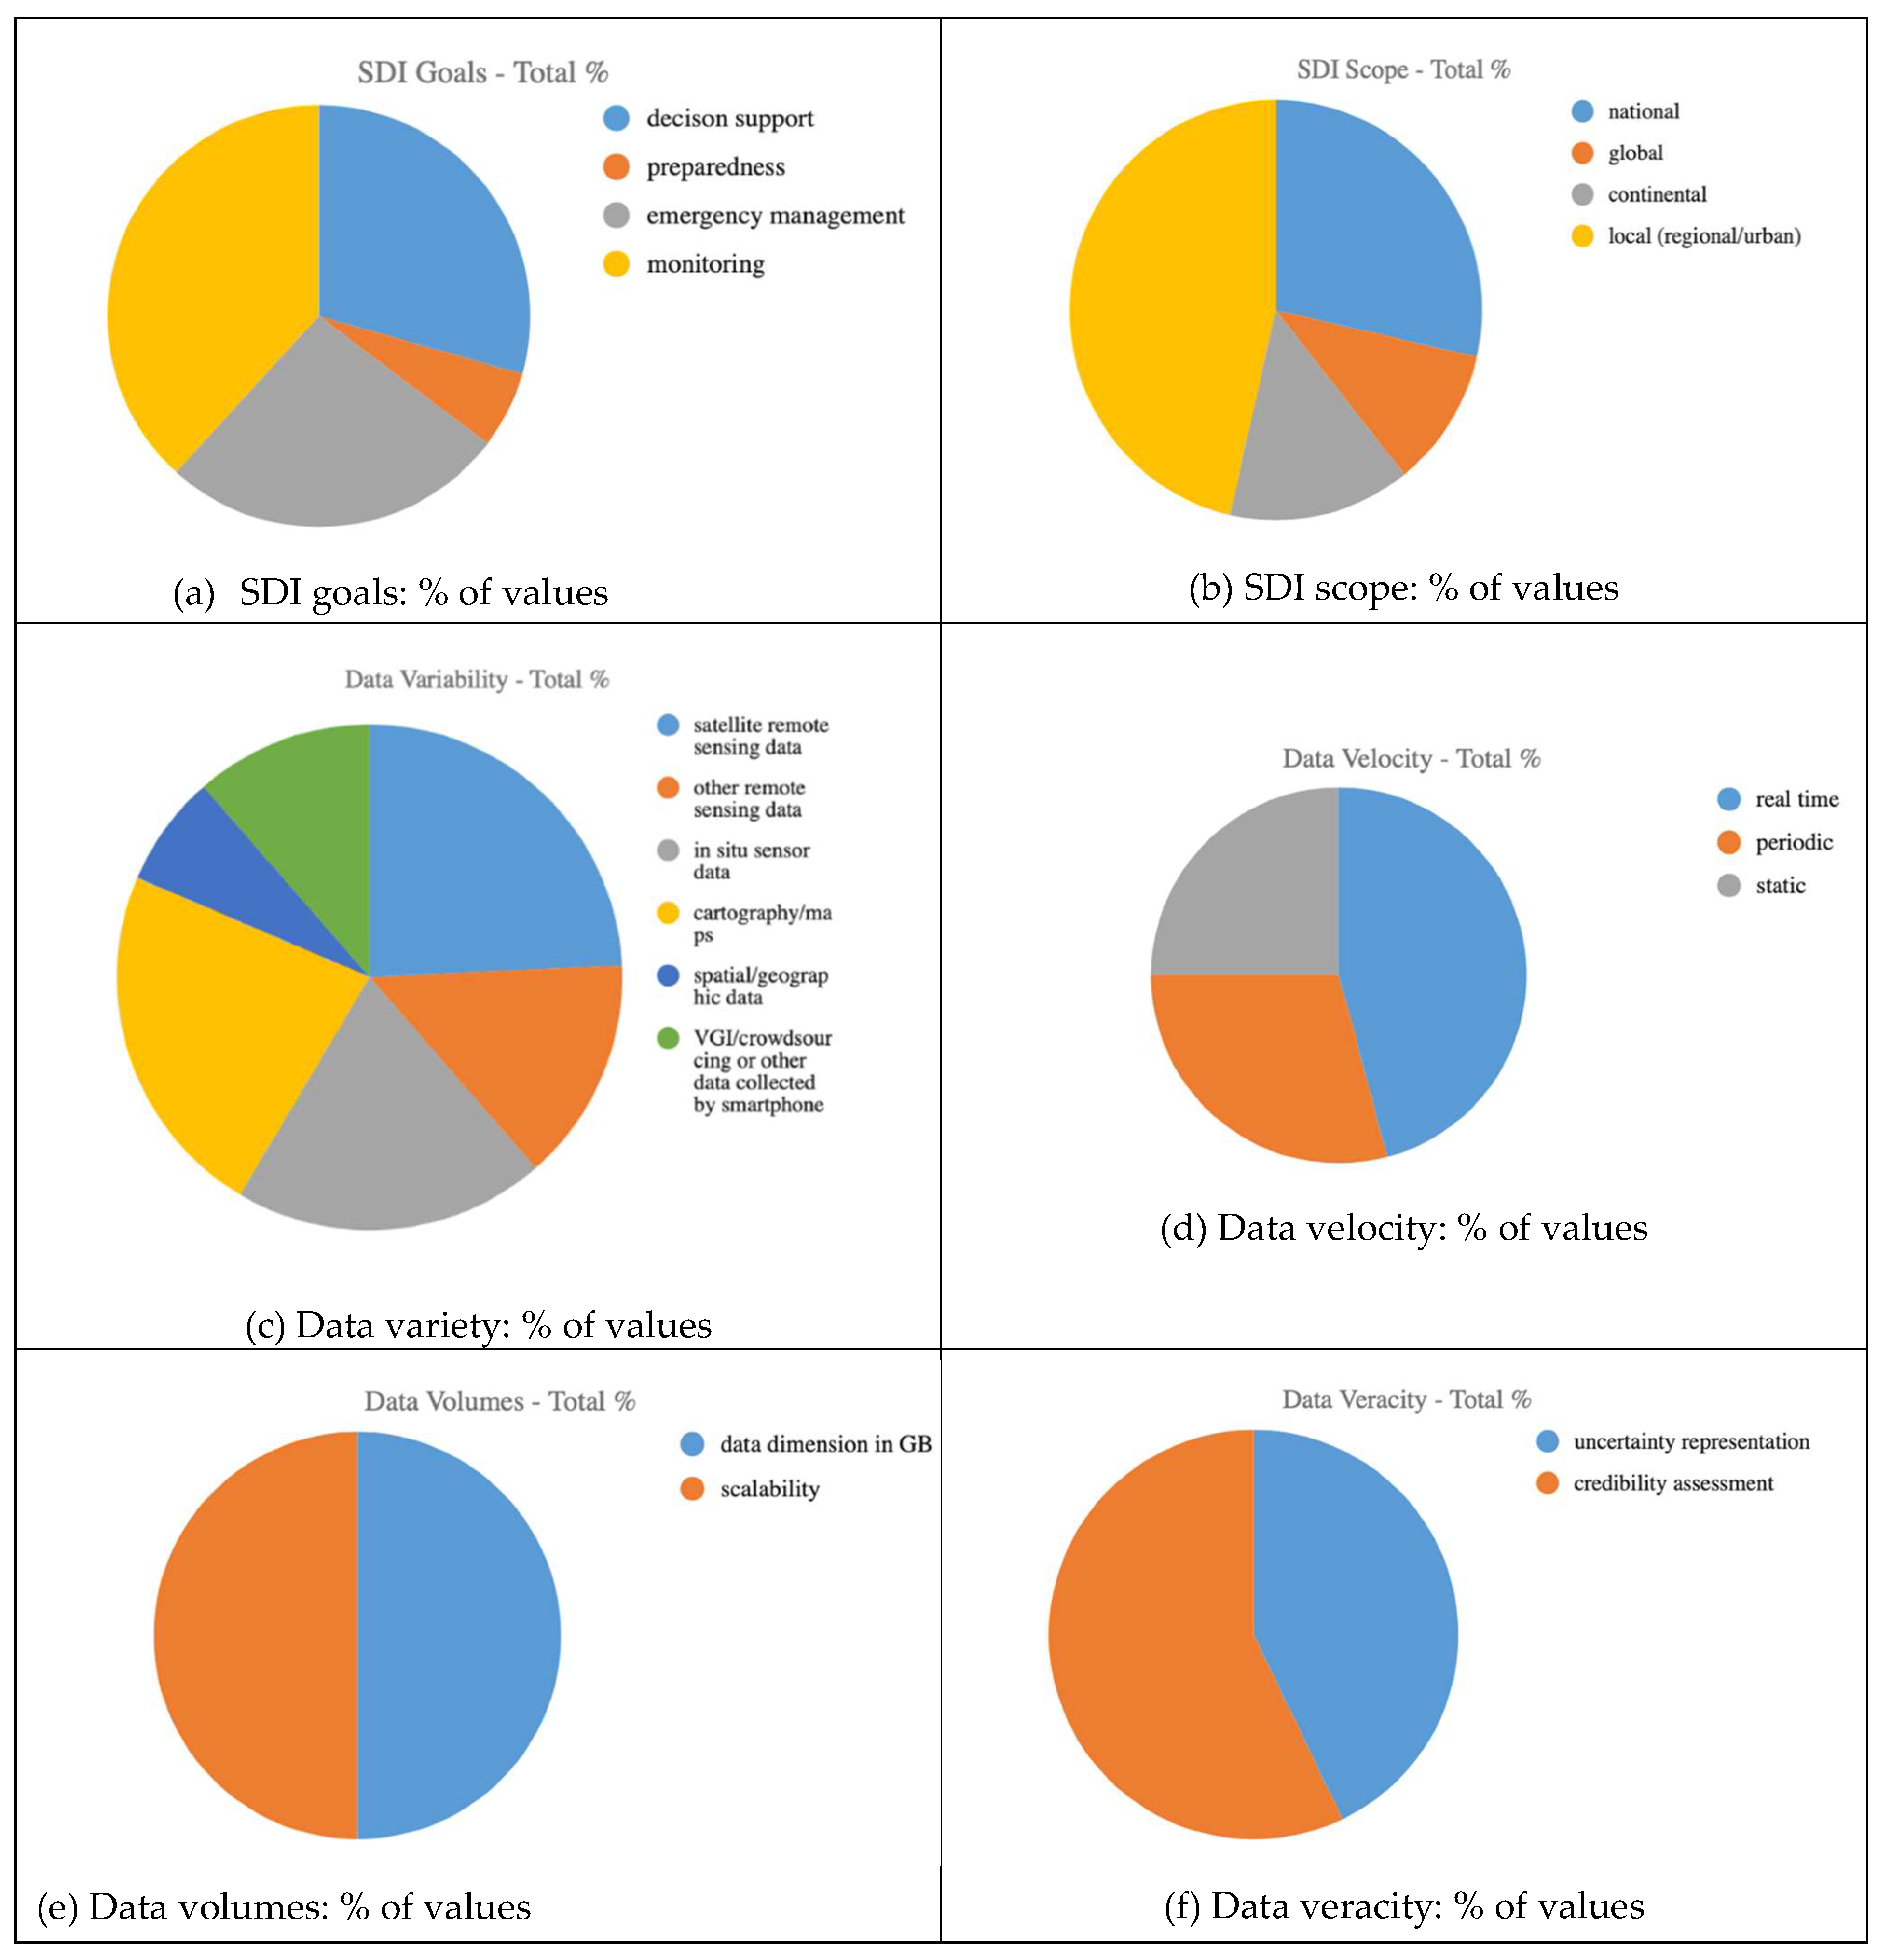
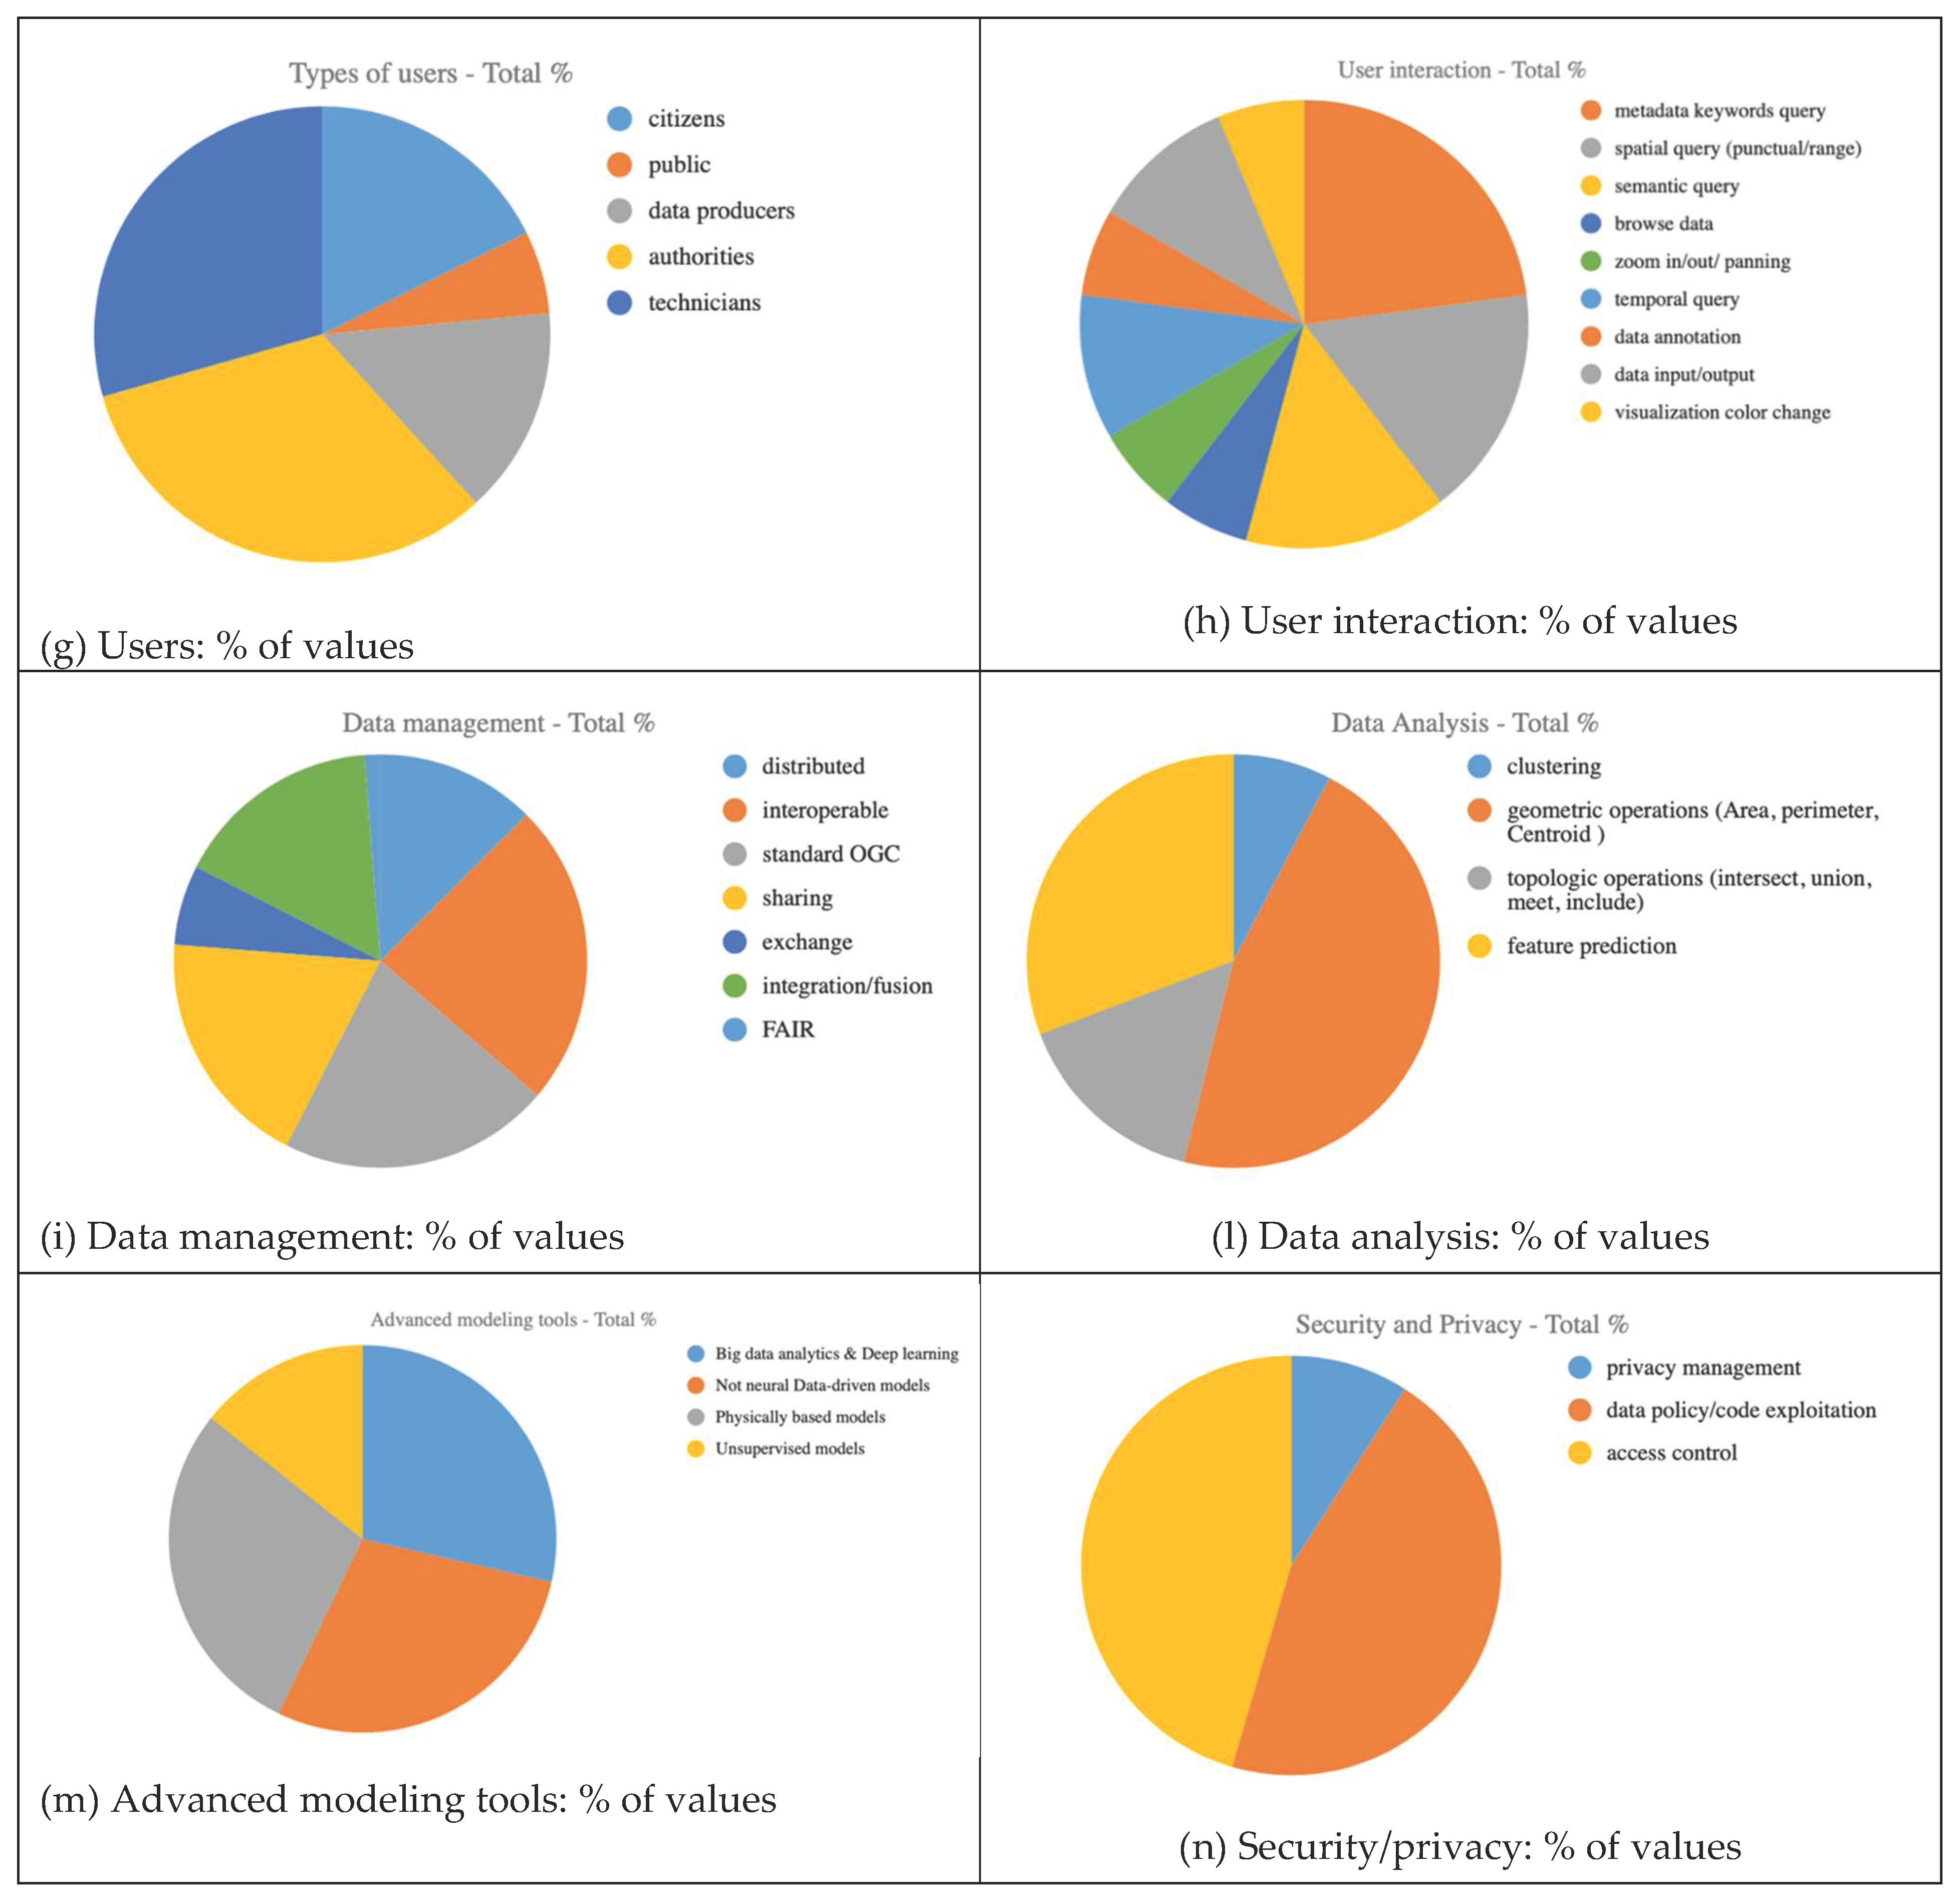

Table 1.
List of the semantic dimensions defined to characterize the selected papers, with a short description of each dimension and comments related to the results of analysis.
Table 1.
List of the semantic dimensions defined to characterize the selected papers, with a short description of each dimension and comments related to the results of analysis.
| Dimension | Choice Description/Motivation | Comments |
|---|---|---|
| SDI goal | Aimed at specifying main goal(s) of the SDI | This dimension is usually described in the papers |
| SDI scope | Aimed at reporting the geographic coverage of data in the SDI | It is usually described in the papers, though some of them deal with methodological aspects and do not explicit data coverage |
| Data variety | Fundamental to define data types that are dealt with in each paper | This dimension is usually described in the papers |
| Data velocity | Meant to understand time resolution of data considered | Papers do not describe accurately this dimension; only some papers explicit the goal to deal with near real-time data |
| Data volumes | Meant to define the volume of the data managed | Usually, papers do not describe this dimension |
| Data veracity | Meant to understand if data credibility/trust is represented, for example by quality indicators, or is implicitly modeled by data uncertainty/vagueness | Usually, papers do not describe this dimension |
| Users | It details target users of the SDI | Most papers do not specify values for this dimension; aside when decision support is the main goal |
| User interaction | Aimed at detailing functions offered for user interaction | Besides discovery via metadata, papers do not describe accurately this dimension |
| Data management | Main architectural/technical pillars of data management | This dimension is usually well described in the papers |
| Data analysis | Meant to understand if SDI provides also analysis tools, typical of geographic information systems | Papers do not describe accurately this dimension |
| Advanced modeling tools | Meant to understand if SDI provides AI modeling facilities, typical of recent information systems | Usually, papers do not describe this dimension |
| Security/privacy | Meant to understand if specific policies or related concerns are considered in papers | Usually, papers do not describe this dimension |
Table 2.
summary of the features of platform for managing remote sensing data developed by various projects and initiatives worldwide.
Table 2.
summary of the features of platform for managing remote sensing data developed by various projects and initiatives worldwide.
| Platform | Description | Scope | Data and Interoperability | Functionalities |
|---|---|---|---|---|
| 3.1.1 EPOS (European Plate Observing System) | Pan-European infrastructure for solid Earth science, providing facilities, data, and services for researchers; it focuses on interoperability standards to ensure seamless data exchange and accessibility among different geoscientific communities. | European Research Infrastructure. | Use only OGC standards and target FAIR principles Integration of diverse datasets related to Earth's structure, dynamics, and hazards. It includes satellite observations, unmanned aerial vehicles, and citizen science projects. |
Data storage and catalogue service plus processing. Open policy. Maximize public benefit following FAIR principles. Future directions: embracing emerging technologies such as artificial intelligence, machine learning, and advanced sensing techniques; expanding geographic coverage beyond Europe. |
| 3.1.2 Sentinel Hub (component of the Copernicus European space Program) | It provides free and open access to Earth observation data from remote sensing collected by the satellites of Sentinel fleet. It offers customizable services for users to access, process, and analyze satellite imagery. | Developed in the framework of Copernicus (ESA and European Community). | Only RS data and derived products Use only OGC standards Multispectral imagery: data across different wavelengths, enabling detailed analysis of land cover, vegetation, and other environmental features. |
Data storage and catalogue service plus processing. Open policy It applies cloud computing technologies, for efficient storage, processing, and access to large volumes of Earth observation data. Features are made available through OGC services and a RESTful API. Compatibility with other Earth observation systems is delegated to downstream services. |
| 3.2 Google Earth Engine (GEE) | A cloud-based platform for planetary-scale geospatial analysis that provides access to a vast amount of remote sensing data and other geospatial data. | Built from a collection of technologies made available by Google. It operates within its proprietary framework rather than conforming to widely recognized SDI standards. | Only proprietary tools After the free availability of Landsat series in 2008, Google archived diverse datasets, including satellite data from Copernicus program, GIS-based vector datasets, social, demographic, weather, digital elevation models, and climate data. |
Data storage and catalogue service plus processing. GEE focuses on processing and analyzing Earth Observation data rather than serving as a broader infrastructure for spatial data exchange and sharing. Its user-friendly front-end facilitates interactive algorithm development, allowing users to add and curate their data. |
| 3.3 Open Data Cube (ODC), past Australian Geoscience Data Cube |
It enables cataloguing massive EO datasets, providing access and manipulation through command line tools and a Python API. It provides OGC web services and tools for deployment, data access, and statistics extraction. | Supported by organizations like Analytical Mechanics Associates (AMA), and US Geological Survey (USGS) | Proprietary tools and OGC standards Mainly satellite data management. |
Data storage and catalogue service plus processing. Open policy (API available) ODC's source code and tools are open and distributed through various git repositories. ODC lacks tools for easy data and application sharing, requiring manual efforts. |
| 3.4 System for Earth Observation Data Access, Processing, and Analysis for Land Monitoring (SEPAL) | A cloud computing platform for automatic land cover monitoring. It combines cloud services like Google Earth Engine (GEE) and Amazon Web Services (AWS) with free software. SEPAL focuses on creating a pre-configured environment to manage computational resources in the cloud. | Developed by several private and governamental organizations among which ESA, Google, NASA, ETH Zurich, etc. Initiated by the UN FAO Forestry Department and financed by Norway. | Only proprietary tools Mainly EO data for land monitoring |
Open policy (API available) SEPAL's source code is available under the MIT license. It offers tools for image search, storage browsing, machine initiation, and applications like RStudio and Jupyter Notebook. SEPAL lacks web services for data access and processing requests, and users are responsible for developing applications to utilize available computational resources. |
| 3.5 Big Data Analytic Platform (BADP) | Built on Open source software to serve JRC users and designed to handle large-scale geospatial data streams, offering a scalable solution to multi-petabyte data volumes. The system employs distributed storage and a cluster of computing nodes using commodity hardware for both storage and processing. | Successor of the European Joint Research Center (JRC) Earth Observation Data and Processing Platform (JEODPP). It supports a variety of projects in agriculture, forestry, environment, disaster risk management, development, health, and energy. | EO and geospatial data | Data storage and catalogue service plus processing. |
| 3.6 OpenEO | A project consolidating technologies for storing and processing Earth Observation (EO) data in the cloud. It aims to alleviate concerns about vendor dependency by offering a standardized, open-source application programming interface (API) for EO data and Copernicus applications. | A collaborative initiative involving multiple contributors and institutions around the world. ESA openEO platform implements the specifications of OpenEO project and provides intuitive programming libraries to process a wide variety of EO datasets. | Only RS data and derived products Target OGC standards EO data |
Open policy (API available) The project significantly contributes to reducing barriers for the EO community in adopting cloud computing technologies and big EO data analysis platforms. In December 2023 openEO has been submitted to OGC for consideration as an OGC community standard. Several members of the OCG already endorsed the OCG submission of openEO, among which ESA and Eurac Research. |
| 3.7 High performance cloud computing for remote sensing big data management and processing (pipsCloud) | Solution for managing and processing extensive EO data through cloud computing. | Proprietary solution developed by Chinese research institutions, with a proprietary file system, developed exclusively by Chinese institutions. | Only proprietary tools Remote sensing data. |
Data storage and catalogue service plus processing. The platform lacks functionalities for exporting data using OGC standards, hinders science reproducibility, and is restricted for internal use by participating institutions. |
| 3.8 U.S. GeoPlatform of the National Spatial Data Infrastructure (NSDI) | A platform making more FAIR all U.S. federal official National Geospatial Data Assets (NGDAs ). | The Geospatial Platform is a U.S. cross-agency collaborative Open Government effort, emphasizing government-to-citizen communication, accountability, and transparency. | Only OGC standards and target FAIR principles Remote Sensing data and geospatial data |
Only data storage and catalogue service. |
| 3.9 EarthExplorer of the United States Geological Survey USGS (EE) | A web-based platform that provides users the ability to query, search, and order satellite images, aerial photographs, and cartographic products from several sources. | In 2008, USGS has democratized the use of Landsat data by making all new and archived Landsat imagery accessible over the Internet under a free and open data policy. | Only proprietary tools. The world’s largest civilian collection of images of the Earth’s surface, including LANDSAT images, aerial photography, elevation and land cover datasets, digitized maps, MODIS land data products from the NASA Terra and Aqua missions, ASTER level-1B data products over the U.S. and Territories from the NASA ASTER mission. |
Only data storage and catalogue service. It provides several facilities among which advanced search and query capabilities, allowing users to specify criteria such as geographic extent, time range, and specific sensors; an ordering system that enables users to request and download the selected data products. The platform incorporates security measures to protect user data and ensure proper authentication and authorization processes. |
| 3.10 NASA Earthdata website | NASA gateway providing full and open access to NASA’s collection of Earth science data | NASA worldwide imagery | Only RS data and derived products Proprietary tools and OGC standards |
Data storage and catalogue service plus processing |
Disclaimer/Publisher’s Note: The statements, opinions and data contained in all publications are solely those of the individual author(s) and contributor(s) and not of MDPI and/or the editor(s). MDPI and/or the editor(s) disclaim responsibility for any injury to people or property resulting from any ideas, methods, instructions or products referred to in the content. |
© 2024 by the authors. Licensee MDPI, Basel, Switzerland. This article is an open access article distributed under the terms and conditions of the Creative Commons Attribution (CC BY) license (http://creativecommons.org/licenses/by/4.0/).
Copyright: This open access article is published under a Creative Commons CC BY 4.0 license, which permit the free download, distribution, and reuse, provided that the author and preprint are cited in any reuse.


