Submitted:
04 April 2024
Posted:
08 April 2024
You are already at the latest version
Abstract
We present an integrated omnichannel framework designed for coordinating and improving shopping experience in the Health and Pharma (H&P) sector. The architecture of this unified purchasing system is composed by macros and subsystems designed for the scalability and flexibility of the framework in the specific context of H&P. In addition, we introduce an optimization algorithm specifically designed for the storage operations in a dark-store, with the aim of optimizing operational efficiency and reducing related costs. In the present study we propose two product allocation strategies in a vertical carousel warehouse, based on correlations between products. We show that the proposed optimized allocation strategy significantly reduces picking times compared to the random allocation strategy. Moreover, these results indicate that taking into account the correlation between products in past orders and the optimization of product arrangements within the warehouse can significantly improve the efficiency of the picking process.
Keywords:
Omnichannel
; Optimization
; Warehouse
; SLAP
1. Introduction
Evolving shopping habits and the growing online presence of consumers has raised a new challenge in customer management: the creation of a customer-centric and seamless omnichannel selling experience across all business touchpoints. Omnichannel emerges as a fundamental prerequisite for establishing robust relationships between consumers and brands [1], offering companies the opportunity to expand their business in an increasingly interconnected digital environment characterized by rising customer expectations [2].
Recently, the growing focus on the implementation of omnichannel architectural systems has fostered the interest of the expert community by generating several research and application studies. These investigations have improved the development of a broader understanding of omnichannel effects on business efficiency, customer shopping experience and evolution of markets [1,2,3,4,5,6,7,8,9,10]. Despite the aforementioned achievements, some gaps persist in the application of omnichannel approaches in the domain of health and pharma. As a matter of fact, these sectors, characterized by a wide and complex network of stakeholders and digital technologies, have experienced a steady growth of expectations from customers and business operators [11,12]. In such a challenging environment, the need of providing a personalized and efficient shopping and service experience is an emergent issue, representing an area of growing interest and relevance [13].
In recent years, the implementation of omnichannel systems has attracted significant attention in a variety of domains outside the "Health & Pharma" sector. This surge of interest has triggered numerous studies and research exploring the omnichannel approach in different contexts. These investigations have contributed to an enhanced comprehension of how omnichanneling can impact business efficacy, customer interactions, and the dynamics of evolving markets [1,2,3,4,5,6,7,8,9,10,14]. Although these surveys did not specifically address the "Health& Pharma" (H&P) sector, they still provided essential reference points for understanding the basic principles of omnichanneling. In particular, the following key points have emerged from these studies:
- A pivotal aspect of omnichanneling is the capacity to personalize interactions and offerings for individual customers, thereby enhancing customer satisfaction and brand loyalty. [1].
To date, the Health & Pharma (H&P) sector has been characterized by a continuous customer service, a large distribution and logistics network, and the adoption of emerging technologies such as artificial intelligence and telemedicine. In this sector, the adoption of omnichannel systems is strongly related to the evolution of digital technologies and changes in industry dynamics, highlighting the H&P responsiveness to contemporary technological advancements [11,12]. The need to deal with the technological evolutions represents a challenge and an important opportunity to improve operational efficiency and to address customer requirements.
The emergence of e-commerce and the surge in online shopping have spurred the establishment of warehouses, including dark stores, strategically located in urban centers [16,17]. The dark stores, conceived in the UK in 2009, facilitate ultra-fast delivery of online orders through instant delivery systems [18,19]. They optimize order preparation by reconfiguring shelf layouts based on logistical efficiency rather than consumer-facing logic [19]. Leveraging software and hardware tools, dark stores enhance operational efficiency and customer service by implementing advanced technologies such as Machine Learning Algorithms, Data Mining, and Warehouse Management Software [20,21]. These technologies enable real-time inventory synchronization, demand forecasting, and efficient space management [22]. Vertical Lift Modules (VLMs) are commonly utilized as Automated Storage and Retrieval Systems (AS/RS) in dark stores, offering space optimization and quick access to stored items [23]. Several methodologies exist for product classification and storage location assignment, commonly known as the Storage Location Assignment Problem (SLAP), which aim to minimize material handling costs and optimize space utilization [24]. In the present work, we explore SLAP approaches and propose an optimized allocation strategy, offering insights through a comparative case study. Moreover, we present the framework “ReDiT” (A new strategy ofRetail inDigitalTransformation era) designed to orchestrate and unify business processes to deliver an omnichannel shopping experience through a series of interconnected macros and subsystems. After a description of the logic, architecture, and key flows of the proposed omnichannel system, we introduce an efficient product allocation strategy based on product correlations inferred from an analysis of past orders, aiming to significantly enhance the efficiency of allocation and retrieval processes within Dark Stores. The paper is organized as follows. Section 2 introduces the ReDiT proposal with the architectural overview and the optimization approach for the storage phase in dark stores. In Section 3, after a description of the operational processes and data flows as a result of the development of the omnichannel spider, a perfomance analysis of the automatic warehouse optimization algorithm is detailed. Finally, Section 4 discusses the main results.
2. Materials and Methods
2.1. ReDiT Proposal
In this study, the challenge of implementing an omnichannel approach in the Health and Pharma sector is addressed by defining, designing, and implementing an integrated framework, termed as "ReDiT." The proposed architecture aims to optimize the shopping experience by creating a more unified business management framework, customized to fulfill the sector’s specific contextual requirements.
The ReDiT solution comprises multiple macro-systems and subsystems that cooperate to improve context-specific flows and processes. The technical proposal outlined in this study consists of two macro-systems (see Figure 1).
- The "ReDiT Omnichannel Spider" (ReDiT-OS) macro-system is designed to deploy a stand-alone architecture supporting a "unified commerce" sales solution capable of managing cross-channel transactions;
- The "ReDiT Automatic Warehouse" (ReDiT-AW) macro-system is tailored to implement a dedicated solution for dark-store picking in e-commerce. The framework consists of an automated system comprising a picking warehouse and conveyor belts for package handling, designed for streamlining and automating the process of picking and order fulfillment.
2.1.1. Architectural Overview of the "ReDiT" Solution
ReDiT Omnichannel Spider
The "ReDiT Omnichannel Spider" macro-system consists of several subsystems including (see Figure 2):
- ReDiT Middleware. The central component driving the system and serving as the pivotal orchestrator for facilitating communication among different units of the framework. This architectural unit enables efficient automation of processes, reducing human error and ensuring optimal connectivity between different components.
- ReDiT Product, Order and Warehouse Management (ReDiT-POW). This subsystem has the ability to autonomously and centrally manage: product, order and warehouse data in the specific context. Core modules include the Product Information Management (PIM) dedicated to a structured and organized aggregation of product information, the Order Management System (OMS) for centralized order processing, and the Warehouse Management System (WMS) dedicated to the operational management of physical flows in warehouses.
-
ReDiT Customer and Resource Management (ReDiT-CARM). Implementing omnichannel approaches in the "Health & Pharma" industry requires rigorous integration and synchronization of data across various communication and distribution channels. In order to ensure a seamless and personalized shopping experience across all channels, the adoption of centralized data management becomes mandatory. Data centralization, particularly within the health and pharmaceutical sectors, is acknowledged as a crucial requirement for enhancing operational efficiency, guaranteeing personalized customer experiences, ensuring regulatory compliance and protecting data security and integrity. In this scenario, the ReDiT-CARM subsystem is designed to synchronize and centralize relevant data, including customer data, with the aim of enabling automatic customer recognition and optimizing administrative, accounting, and customer service activities. This subsystem includes:
- -
- the Customer Relationship Management (CRM) to manage customer interactions across various channels;
- -
- the Enterprise Resource Planning (ERP) for centralized management of inventory engagement, accounting, and administrative tasks;
- -
- the Retail Omnichannel (RO) dedicated to recording transactions at checkout, facilitating omnichannel sales processes, improving inventory management, and elevating both in-store operational efficiency and the overall customer shopping experience. The inclusion of the RO module constitutes a significant transformation of the traditional point-of-sale paradigm.
- ReDiT Marketing Management (ReDiT-MM). This module supports advanced omnichannel marketing management, by incorporating other submodules, such as the Loyalty Engine dedicated to omnichannel customer recognition and retention. Additionally, the ReDiT-MM includes the Marketing Automation and Marketing Intelligence modules designed to automate and analyze marketing campaigns across multiple distribution channels.
Figure 2.
Component Diagram.
ReDiT Automatic Warehouse
The "ReDiT Automatic Warehouse" macro-system consists of the following subsystems:
- ReDiT Automatic Pick&Place System (ReDiT-APEPS). This component includes a vision system able to identify the precise location of individual products within the handling area in order to pick them up and create the order cart. In addition, this system includes a robotic arm equipped with the capability to receive commands for picking and positioning products associated with a specific order.
- ReDiT Dark Store Optimization (ReDiT-DSO). This subsystem is critical for the long-term optimization of the time associated with the order fulfillment process. This module is also equipped with an artificial intelligence system that identifies the best configuration to store individual products based on customers’ preferences and their typical spending patterns. Warehouse optimization constitutes an essential element of the ReDiT system because it directly affects the speed of order fulfillment and total service costs.
-
ReDiT Warehouse Orchestrator (ReDiT-WO). As the core of the entire ReDiT Automatic Warehouse, it is responsible for coordinating the actions of the ReDiT-DSO and ReDiT-APEPS according to the requests communicated by the ReDiT Middleware. In particular, two basic tasks are in charge to the ReDiT-WO:
- -
- Receiving orders from the ReDiT-Middleware module and coordinating the picking operations from warehouse and the order preparation by means of the ReDiT-APEPS subsystem.
- -
- Defining product pickup and storage schedules by coordinating ReDiT-APEPS and ReDiT-DSO.
According to the architecture of aforementioned solution, the ReDiT-Middleware and the ReDiT-WO subsystems represent the core nodes of the ReDiT system architecture as they provide the integration and coordination of diverse modules regardless of the type of product to be handled and the channels used. The proper development of these two subsystems allows the entire framework to handle with different volumes of orders/goods and different product families (e.g., belonging to the pharmaceutical, electronic, and food fields). Therefore, a well-designed architecture for these modules provides the ReDiT system with flexible and scalable characteristics.
2.1.2. Integrated Technical Architecture of the "ReDiT Omnichannel Spider"
The architecture of the "Omnichannel Spider" macro-system has been designed in order to ensure an effective integration among the various components. Specifically, the technology of each component has been selected according to its technical characteristics and functionalities, in order to optimize the performance and ensure efficient management of information and operations.
The PIM (Product Information Management) component is implemented by means of the open source software "Pimcore." This platform offers a modular component-based architecture and leverages the PHP Symfony framework to handle HTTP requests, database interactions, and adoption of the Model-View-Controller (MVC) framework. The presence of RESTful APIs enables seamless external integrations, offering significant advantages such as centralized information management, task automation, tailored customization, integration with enterprise solutions, and strong support from the developer community.
The CRM component relies on the "Salesforce" platform and, in particular, on the "Service Cloud" module. This cloud-based solution provides scalable database, advanced customization, APIs for integrations, multitenant architecture, and a "Lightning Experience" interface. Furthermore, Service Cloud provides a complete customer service management experience, integrating advanced technologies and flexible features to improve operational efficiency.
For the omnichannel e-commerce / fidelity app component, "Magento 2" technology is adopted with an interface developed through Progressive Web App (PWA). "Magento 2" is open-source, flexible and customizable platform whose functionality can be extended through plugins. PWA integration provides a mobile app-like user experience characterized by speed, responsive design, and support for modern features.
The e-commerce component, on one hand furnishes a wide range of functionality for omnichannel online commerce, on the other hand is responsible for providing the main operational functioning expected for the Order Management System (OMS) component. Therefore, the resulting system facilitates unified and optimized order management, ensuring a consistent and efficient workflow within the Omnichannel Spider ecosystem. The integration of OMS functionality into the e-commerce platform aims to maximize operational consistency and to improve the overall system efficiency.
The Loyalty Engine component is developed in PHP, an open-source language widely used for complex web applications.
The "Salesforce Marketing Cloud" platform is implemented to realize the Marketing Automation component, offering advanced features for creating, planning and executing automated and customized marketing campaigns. Modules such as "Email Studio" and "Journey Builder" are implemented to support the sending of personalized emails and the creation of customized marketing pathways.
The "Marketing Intelligence" component is based on "Tableau Server" for marketing data analysis. This cloud-based platform offers advanced functionality such as the ingestion and connection of different data sources, the creation of interactive visualizations and a real-time monitoring.
In order to ensure an efficient integration of the WMS, ERP, Retail omnichannel components, ad hoc connectors are developed within the Middleware, by following a communication protocol well-calibrated according to the specific integration flow.
Finally, the Middleware, implemented in Java via the Spring Boot framework, orchestrates the data integration flows. This technology offers a comprehensive standard library, automatic memory management and multithreading support. Moreover, the T3 large virtual machine on Amazon EC2 provides flexibility and scalability, ensuring optimal performance and security for the Spring Boot-based application within the Omnichannel Spider project.
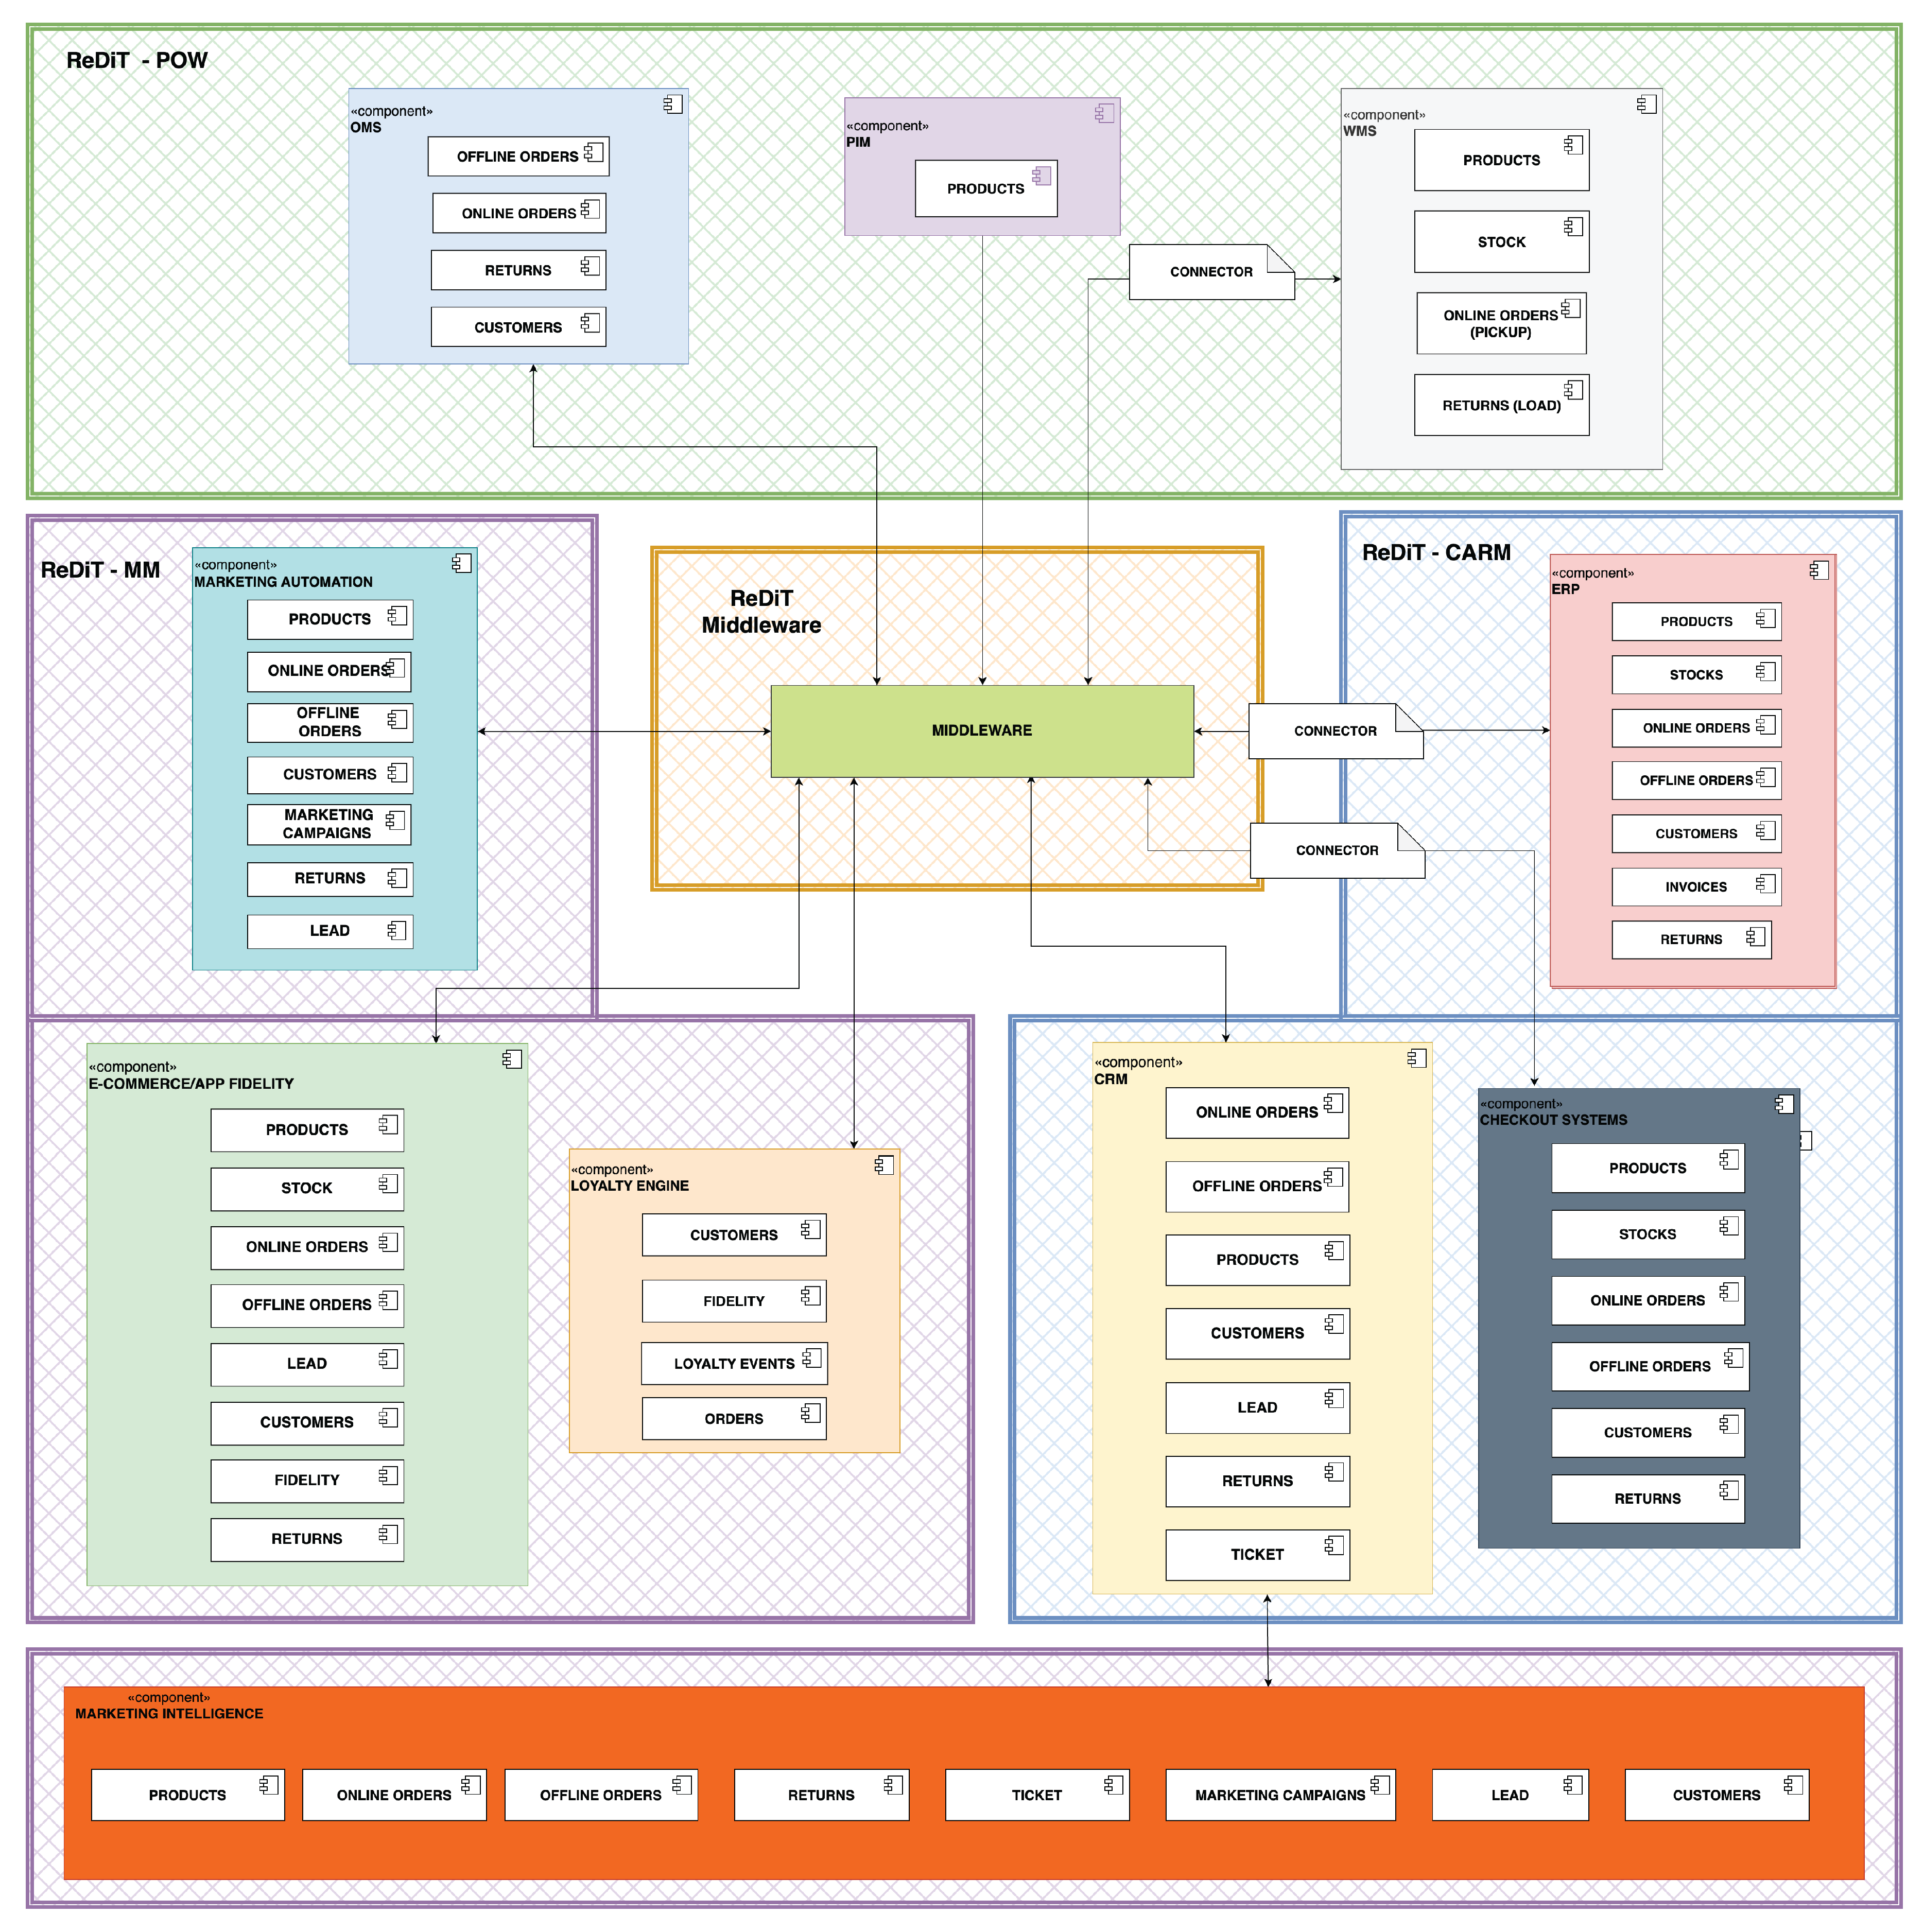
2.1.3. Component Diagram
The Component Diagram (Figure 2) offers a comprehensive view of the diverse entities engaged in the system and illustrates the pivotal function of the Middleware orchestrator in enabling communication between the modular units.
The system consists of the following flows:
- Unidirectional flow from the PIM. In the proposed omnichannel system, the PIM establishes a unidirectional flow of communication with the Middleware. This one-way communication enables the PIM to consistently transmit product data, facilitating efficient product lifecycle management across all relevant business components.
- Two-way flow from/to the WMS. This flow enables a two-way exchange of data which is critical for efficient management of warehouse operations. The Warehouse Management System (WMS) receives relevant information concerning availability, inventory, and goods movements. It also sends inventory updates, thereby ensuring synchronized and streamlined warehouse management.
- Two-way flow to/from ERP. This two-way communication enables automatic stock updates as a response to sales or returns. This synchronism aims to prevent undesirable scenarios, such as out-of-stock sales or overstocking. Two-way flow to/from ERP also includes the communication of pivotal aspects such as internal movement of goods and synchronization of accounting/administrative documents, contributing to an optimized management of business activities.
- Two-way flow to/from the cash system. Bidirectional communication between the cash system and other components is essential for delivering an omnichannel shopping experience and for optimizing business operations. This communication allows both online and offline sales data (including returns) and customer master records to be synchronized between the components in charge.
- Two-way flow to/from e-commerce. The flow to/from e-commerce allows for automatic sharing of customer data, leads, orders, and returns made online. This data sharing facilitates customer service in accessing up-to-date information, making it easier to handle inquiries, resolve problems, and provide personalized customer service. Moreover, this communication is crucial for implementing omnichannel loyalty programs and effectively managing loyalty activities. Synchronizing this data with analytics and monitoring tools is also essencial for obtaining comprehensive insights into system performance and user experience on e-commerce platforms. Furthermore, sharing this data is important for crafting targeted campaigns, enhancing customer engagement, and optimizing online sales strategies.
- Two-way flow to/from the Loyalty Engine. Two-way communication with the Loyalty Engine system plays a crucial role in the effective creation and management of loyalty programs. Indeed, the Loyalty Engine imports and synchronizes customer data as it enables the creation of detailed customer profiles and the implementation of loyalty programs. On the other hand, the Loyalty Engine provides the data needed to create interactive reports and dashboards in the Marketing Intelligence system. These reports include key metrics such as program participation, points earned and redeemed, popular rewards, and purchase trends. Such two-way communication facilitates analysis of customer purchasing activities, segmentation, identification of effective loyalty models, and evaluation of loyalty program performance.
- Two-way flow to/from CRM. Automatic data sharing to/from CRM includes detailed information on customer contacts, interactions, purchase history, and leads generated by marketing activities. This communication also facilitates the automation of marketing campaigns, empowering the creation of lead nurturing campaigns that automatically send personalized emails tailored to the actions and attributes of contacts registered in the CRM, thereby improving the generation of qualified leads and enhancing campaign effectiveness. Additionally, the streamlining of lead scoring management enables the assessment of lead quality derived from marketing initiatives. Data on leads collected within the Marketing Automation system can be seamlessly transferred to the CRM, where it undergoes scoring. This approach assists in identifying the most promising leads and improving sales opportunity management processes.
- Two-way flow to/from marketing intelligence system and marketing automation tool. The Marketing Automation platform collects data on customer behaviors and interactions, such as email opens, link clicks, site visits, and conversions. This data are then used to construct comprehensive contact profiles, enriching the understanding of individual customers. Marketing Intelligence leverages the acquired data to conduct in-depth analysis, identify behavior trends, analyze the customer journey, identify customer segments and discover cross-selling and upselling opportunities. Data communication between the Marketing Automation system and the Marketing Intelligence system enables the personalization of communications based on the acquired data and insights. Targeted messages and offers can be created to improve engagement, increase conversions and develop deeper customer relationships. The integration also enables automated data-driven decision making, such as sending follow-up messages, scoring leads, and launching specific campaigns in response to customer behavior. Finally, communication between the two components enables accurate measurement of the performance of marketing activities. Data collected is used to calculate crucial KPIs such as conversion rate and ROI of campaigns, providing clear evidence of the effectiveness of marketing strategies and guiding future decisions.
A proper management of these flows is paramount to guarantee streamlined operations, an optimal customer experience, and a robust groundwork for sales and marketing strategies.
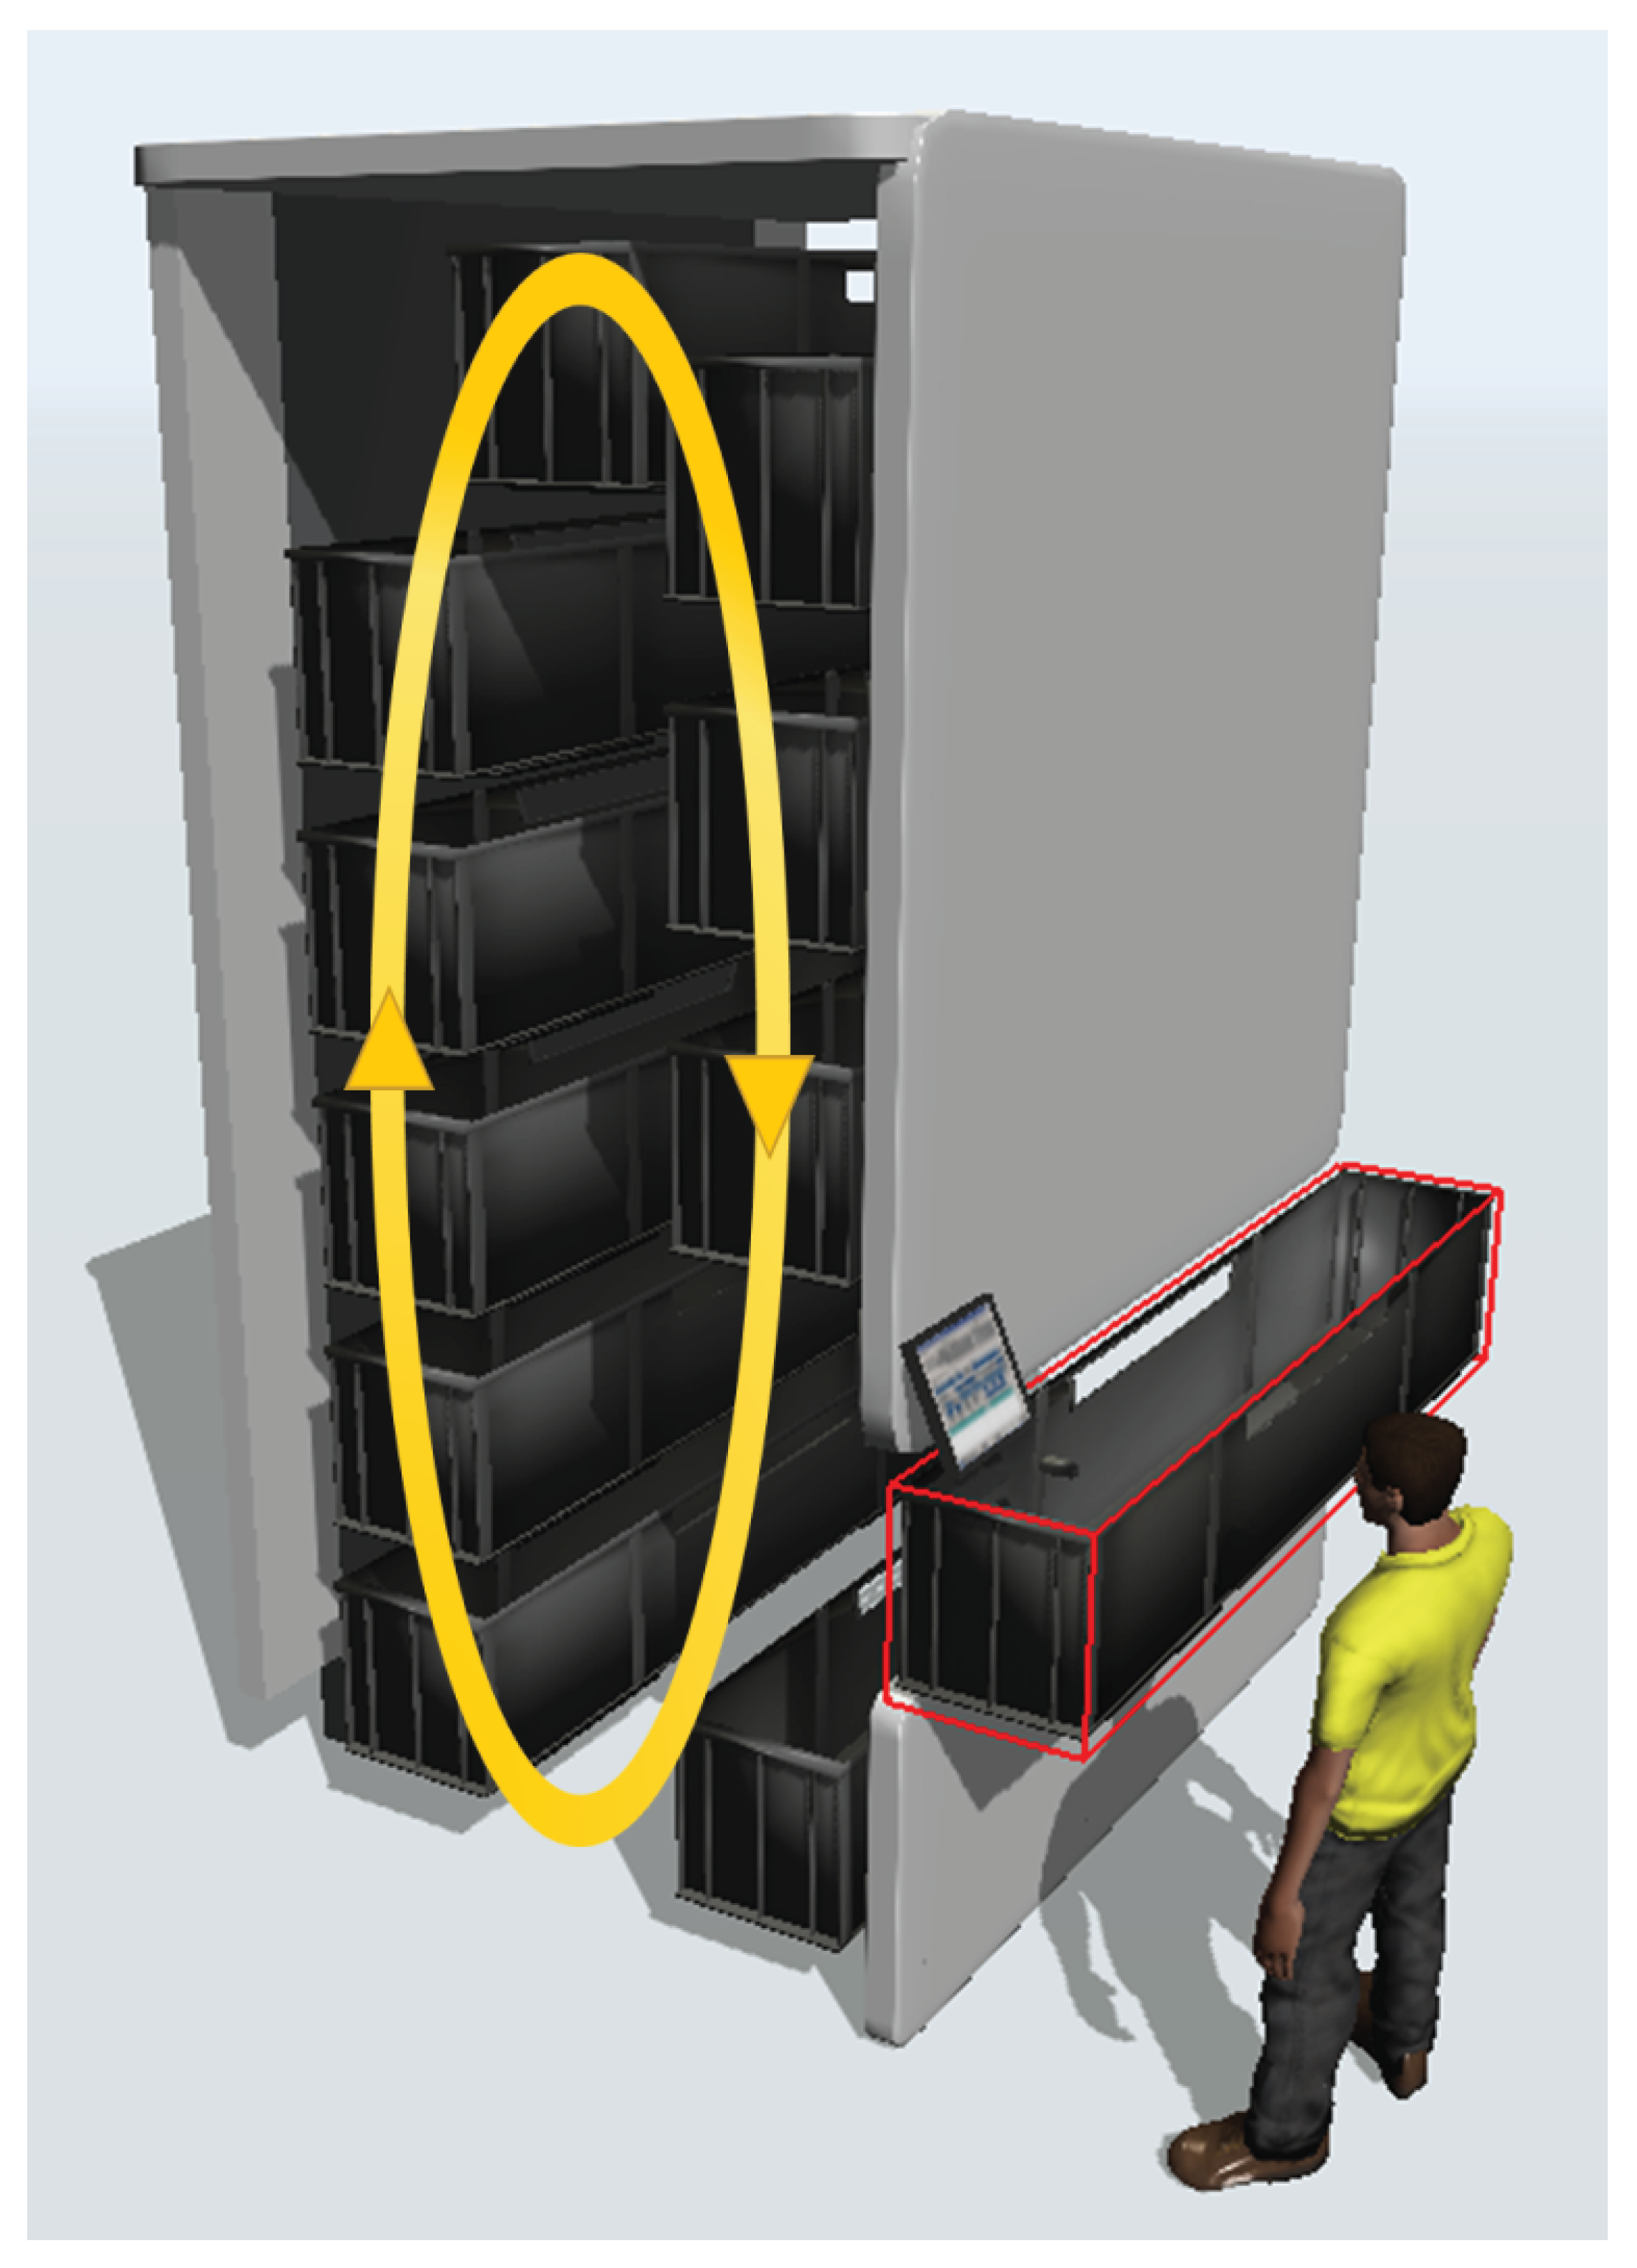
Figure 3.
Representation of the vertical carousel.
2.1.4. Analysis of the Technical Architecture and operational processes within the "ReDiT Automatic Warehouse"
As part of the project "ReDiT," a novel algorithm was developed to optimize the storage phase in the dark-store, a facility dedicated to handling e-commerce orders. This dark-store is characterized by a mechanized system comprising an automatic picking warehouse and conveyor belts to facilitate the handling of packages. The pick station, served by this system, allows the picker to assemble orders, which are then fulfilled.
In this study, we refer to an automated vertical warehouse. Based on previous research regarding optimization according to product characteristics (weight and size) [25,26,27,28], optimization by picking distance [29,30,31], demand-based optimization [32,33,34,35,36,37], multi-criteria optimization [38,39] and dynamic or chaotic storage (also known as random storage) allocation [40,41,42,43] the goal is to define a scenario representative of real industrial picking processes. This will allow a problem to be addressed that is meaningful in operational terms and fully reflects the complexity of the industrial environments under consideration. The study considered a vertical rotating warehouse, called “Vertical Carousel”, schematized in Figure 1. The warehouse’s storage capacity is set at 1200 SKUs, as the warehouse consists of 40 levels, each containing a tray with a maximum capacity of 30 SKUs. Picking uses an "order-to-order" strategy, in which the picker reads the order, the software identifies the trays containing the required products, and a conveyor belt transports the trays to the opening point. Once the tray reaches the opening point, the operator picks the product from the tray and proceeds to the next tray as necessary to complete the order.
The background assumption is that the products to be allocated have the same picking frequency and, therefore, the same turnover rate. The turnover rate of products within a warehouse is a measure that indicates how often and how quickly products are picked and subsequently sold. The approach for developing and implementing the optimization algorithm in the scenario involves three distinct phases, illustrated in Figure 4.
The first phase of the analysis encompasses the preliminary steps. These include generating a set of customer orders and establishing the allocation and picking strategy, which remains consistent throughout the process. The subsequent steps involve developing the optimized and random algorithms for allocation and picking. The algorithms are executed using a randomly generated dataset, and the outcomes are compared and evaluated. The entire analysis was conducted using Python 3.0 and Microsoft Excel™ for support.
2.2. Algorithmic Approach
The core aim of the analyzed algorithm is to enhance operational efficiency and reduce the costs related to picking drawers/pallets from the warehouse. This approach involves assessing the layout of materials within the warehouse and, when determining the allocation of different products within the same drawer/pallet, identifying the optimal combination of products to be stored together. In the context of the "ReDiT" project, the traditional arrangement logic based on product rotation index is expanded by attempting to consolidate products frequently purchased together into the same container. This aspect constitutes an innovation in the reference scenario, as it represents an improvement on current systems.
The practical implementation of this algorithm faces challenges related to data availability and requires the development of a Machine Learning methodology. This methodology must balance customer preferences with the product turnover index, ensuring an efficient system that can improve warehouse management in the omnichannel context proposed by the "ReDiT project." The experiment conducted with this algorithm aims to empirically evaluate the application of the "ReDiT solution," thereby contributing to the consolidation of existing scientific literature and offering practical insights into the efficacy of the proposed solution within a real-world business setting.
Methodology
The process starts with generating a dataset containing a list of past orders and a list of pending orders to be picked. To generate orders consistent with past orders, a Python script is developed. This script creates a random list of 1000 orders, with 800 of them constituting the dataset of past orders, and the remaining 200 forming the dataset of orders to be picked. Product correlations have been randomly defined, determining which products were commonly purchased together. Each order is generated based on these defined correlations, allowing for the random addition or removal of products. A 20% probability is considered for a product to be added to the group, while a 10% probability is considered for a product to be removed from the group. It is assumed that there are 13 types of products denoted by letters from A to M in the alphabet.
Allocation phase
After order generation, allocation and picking strategies and constraints are defined. For the allocation phase, the following rules are established:
- A maximum of 3 types of products can be placed in each tray.
- A maximum of 10 units can be inserted for each product type.
Two methodologies will be discussed, with the first one involving random allocation, whilst the second one involves optimized allocation. An initial assumption is that the warehouse starts empty, and that all types of product have to be allocated with defined, random quantities as shown in Table 1.
Before proceeding with the definition of the two methodologies, the constraints to be respected, which are used in both cases, are defined:
- tray_capacity: 30 (maximum capacity of a single tray)
- products_per_type: 10 (number of products per type in a single tray)
- types_per_tray: 3 (number of product types in a single tray)
- num_trays: 40 (number of trays)
The random product allocation logic is outlined in Figure 5.
For each product type, in the products_to_allocate dictionary, a loop is triggered. Different variables are initialized at the beginning of the loop, such as the total number of units to be allocated for the current product type. Subsequently, the loop enters a while loop, which will continue as long as units of this product type are allocated. Within this while loop, another for loop iterates through the available trays (1 through num_trays). The algorithm calculates the number of units to be allocated for this product type in each tray. This calculation is based on several conditions, including the maximum number of units allowed for that product type, the remaining units to be allocated, and the tray’s capacity. If it is possible to allocate units within that tray, the program proceeds to distribute the units of that product type in that tray. After the allocation of products, the program updates the relevant variables. This involves reducing the total number of units to be allocated and keeping track of the last tray allocated for the following calculation. The while loop continues until all units for this product type have been allocated or until no more units can be allocated in the trays. After all units for this product type have been allocated, the loop repeats for the following product type in the products_to_allocate dictionary. In summary, the loop for each product type ensures that all product types are allocated in the trays according to the conditions specified in the algorithm.
The allocation generated by the algorythm is shown in Figure 6
In the case of optimized allocation, subsequent to parsing the constants and quantities of products slated for allocation, a dataset comprising past orders is analyzed to discern product correlations. Thus, the algorithm takes into account the occurrence count between pairs of products within orders. The algorithm selects the tray with the fewest products allocated and space left, starting with the first product to be allocated. It then calculates the number of units to be allocated based on various criteria, such as the maximum capacity of the tray and the remaining amount of product to be allocated. If the defined conditions are met, it assigns the units to the selected tray and updates the remaining quantity accordingly. If the tray can still allocate additional products, the algorithm assigns related products based on the correlations retrieved from the file. The same criteria used for allocating the primary product are applied to the correlated products. The loop continues until all units of the selected product type have been allocated, and then it moves on to the next product type. The final configuration of products in the trays is printed at the end of the algorithm. The algorithm is schematized in Figure 7.
The logic of the implemented code is as follows:
- Initialization of Trays: An array of strings representing the trays is created using list comprehension. Each element has the form "Tray[i]", where i is the tray index. This initialization is based on the variable num_trays.
- A dictionary named allocated_products is created with keys representing the trays and initially empty values (empty lists) representing the products assigned to each tray.
- A while loop is used to assign products to trays until there are still products to allocate. The tray chosen for allocation is determined using the min function, which selects the tray with the fewest products already assigned.
- The remaining space in the tray (space_left) is calculated, which is the maximum capacity of the tray minus the length of the list of products already assigned to the tray. The number of products to allocate (to_allocate) is then calculated as the minimum between the maximum quantity of products per type, the remaining quantity of that type of product, and the remaining space in the tray. If to_allocate is equal to the maximum quantity of products per type, the allocation is made, and the remaining quantity of that type of product is updated.
- If there are correlated products defined in the correlations variable, a similar check is made to allocate correlated products if there is available space in the tray.
- The final arrangement of products in the trays is printed, showing the products assigned to each tray.
- A dictionary named initial_configuration is created to represent the initial configuration by copying the allocated_products dictionary.
In practice, this phase involves the creation of a list of orders and a correlations dictionary that tracks correlations between products based on their frequency of being purchased together. It utilizes an "orders" list to store all orders as lists of products and employs a "correlations" dictionary where the keys are main products, and the values are "Counter" objects. For each line in the file, all products in the order are added to the "orders" list. Then, all possible combinations of products within each order are examined using "combinations." For each combined pair of products, the correlation count is incremented in their respective Counter objects. For example, if the order contains "A, B, C, D," the combinations (A, B), (A, C), (A, D), (B, C), (B, D), and (C, D) are computed. For each product pair within the order, the count is incremented in their respective Counter objects based on the correlation principle. For instance, if the pair (A, B) is found in an order, the count for both (A, B) and (B, A) is increased by 1 in their respective Counter objects. This keeps track of the fact that products A and B have been ordered together in an order. At the end of this process, the correlations dictionary will contain all correlations between pairs of products along with the count of how many times they have been ordered together. This is useful for identifying products that are often correlated and can be allocated together to optimize the picking process or other order management activities.
The final configuration generated in the case of an optimized solution is depicted in Figure 8, where products are arranged based on the defined correlations.
The assumption is that products commonly bought together are:
commonly\_bought\_together = [
[’A’, ’F’, ’C’],
[’D’, ’E’, ’B’],
[’G’, ’H’],
[’I’, ’J’],
[’K’, ’L’, ’M’],
[’B’, ’G’, ’H’],
[’E’, ’I’, ’M’]
]
Thus, products A, F, and C are placed together in trays 1 through 3; similarly, products D, E, and B are allocated in the same trays, and so forth.
Figure 9 depicts the final configuration, highlighting correlated products. This configuration reveals that nearly all products are paired with related items.
After defining the allocation of products in both the random and optimized solutions, the allocation times were calculated by means of an algorythm with the following logic:
- Definition of he function "calculate_tray_time": this function computes the total movement time between trays, considering the round-trip time as well. If the previous tray_index is None, it indicates the first tray, and the round-trip time is calculated solely based on the tray_index. If the previous tray_index is not None, it calculates the movement time between the two trays and adds the round-trip time.
- Use of defaultdict for allocation_times: defaultdict is employed to manage the allocation_times dictionary, which automatically initializes values to zero for new keys.
- Iteration over products in unique_products_list: Iteration is based on the sorted list unique_products_list, which contains all the products present in the trays.
- Calculation of allocation times for each product: The code iterates through the trays, and for each product, it calculates the allocation time using the calculate_tray_time function and adds the cobot time (cobot_time). Cobot_time is the time to perform the product allocation task, assumed to be carried out by a cobot. The total time for each product is then added to the allocation_times dictionary.
The variables considered in the code are "allocation_times," which is a defaultdict with values initialized to zero. It is used to track the allocation time for each product type; "unique_products" is a set used to collect all product types present in the trays. The set "unique_products" is converted into a sorted list "unique_products_list" to facilitate accessing products in order. The defined function "calculate_tray_time" takes as input tray_index (the index of the current tray) and tray_index_previous (the index of the previous tray). If tray_index_previous is None, the code returns the round-trip time for the first tray, calculated as the product of the tray index by 5. Otherwise, the code calculates the total movement time between the two trays, considering also the round-trip time. The one-way time is set to 5 if there is movement between trays, otherwise it is set to 0. For each product type, the code iterates through the trays in initial_configuration to determine if the product is present in each tray. If the product is present in a tray, the code calculates the allocation time using the calculate_tray_time function and adds the cobot time (cobot_time). The variable tray_index_previous is updated each time the tray changes. The allocation_times dictionary is updated with the allocation time for each product type, and the variable total_time with the total allocation time for all products, printing the final results.
As described above, two different configurations are generated by applying these algorithms to a randomly generated dataset. Figure 10 shows an example of the tray 1 configuration. On the left side, the "Random Allocation" solution displays products placed sequentially in Tray 1. On the right side, the "Optimized Allocation" solution showcases a configuration where products A, C, and F are grouped in Tray 1. This optimized arrangement leverages correlations between frequently purchased products, enhancing efficiency and order fulfillment.
Picking Phase
In a vertical carousel warehouse, the picking process starts with reading the order. This step involves scanning the products specified in the order and identifying all the required trays. Subsequently, it checks the presence of the products in these trays and determines the optimal tray through an optimization function. After defining the allocation of products and calculating the time required for all products to be arranged in the warehouse, the code for product retrieval was defined. The picking algorithm remains consistent in both the configurations shown in Figure 10, with the difference being the placement of products within the warehouse. Figure 11 shows the flowchart of the picking algorithm.
To define the logic of the picking algorythm, the first step is to enstablish essential variables that encompass product details, tray assignments, and corresponding quantities. Thus, three maps are initialized whith the following variables:
- all_products: a set of all products present in the trays.
- product_to_trays: a dictionary mapping each product to the trays where it is present.
- tray_to_quantities: a dictionary mapping each tray to a Counter object that tracks the quantities of each product in the tray.
Subsequently, orders are read from an external file, and the loop that iterates over each order is started. A list of trays is created for each product in the order. A Counter object (tray_ranking) is also created to keep track of how many times each tray appears. Subsequently, the function that calculates the distance between trays is defined, using the tray indices. Two variables representing the current and next trays are initialized. current_tray is modified during the execution of the algorithm. The available trays for the product are obtained, sorted based on tray ranking and distance from the current tray. The best tray is selected through the get_optimal_tray function, and the value of current_tray is updated. The quantity of the product in the tray is reduced, and the association is removed if the quantity is less than or equal to zero. The get_optimal_tray(product) function is responsible for finding the optimal tray for a given product. The available trays for the current product are obtained using the product_to_trays dictionary. If the product is not present in the warehouse, available_trays will be an empty list.
The list of available trays (available_trays) is sorted based on two key criteria:
- tray_ranking: this sorts the trays in descending order according to their tray ranking (tray_ranking). Essentially, trays with higher rankings, which have been frequently selected in the past, are positioned at the top of the list.
- tray_distance: in cases where there is a tie in the ranking, trays are organized based on the distance between the current tray (current_tray_force_low) and the tray under consideration (x). This preference is designed to select the tray that is closest to the current tray.
The first tray from the sorted list (ranked_trays) is assigned. If the list is empty (no available trays), optimal is set to None. Finally, the optimal tray (optimal) is assigned to the global variable current_tray. This will be the tray used as "current" for the next allocation. If no tray is available, current_tray is set to None. Thus, once the optimal tray has been determined, it moves toward the picking point (where, in a real scenario, an operator retrieves the required products). If the tray is emptied of all products, it is removed from the list of available trays. A subsequent check is performed to verify if all the products specified in the order have been picked. If additional products are to be collected, the same picking logic is applied iteratively. On the other hand, if all products in the order have been successfully picked, the process proceeds to the following order. If a product is not available, a message is printed.
After defining the logic for product retrieval, the retrieval time is calculated. The first step of the algorythm is the initialization of the necessary variables:
- total_time: A variable to track the total time spent in order picking.
- current_tray: The current tray from which the picking sequence starts.
- visited_trays: A set to keep track of the trays already visited during picking.
- sequence: A list to record the picking sequence, containing tuples with information about the tray and associated products.
Next, a loop is defined that continues as long as there are trays (tray_to_products) from which to pick products. The next tray (next_tray) from which picking initiates is selected. The choice is based on the distance between the current tray and the remaining trays. Subsequently, the time to move between the current tray and the next tray (time_to_move) and the time to pick the products from the next tray (time_to_pick) are calculated. The total_time variable is then updated with the time taken to move and the time taken to pick, current_tray is updated with the next tray and visited_trays is updated with the next visited tray. The next tray is removed from tray_to_products since it has been visited. Then, the total picking time is printed for the current order, signaling whether all products have been successfully retrieved. The total picking time for the current order is added to the total picking time across all orders, which is then finally printed.
3. Results
3.1. Operational Processes and Data Flows in the "ReDiT Omnichannel Spider" Corporate Macro-System
Within the ReDiT Omnichannel Spider Macro-System, data flows have been implemented to manage all phases of the omnichannel shopping experience, from order to delivery and potential return management. Data Flows of the "ReDiT Omnichannel Spider" are composed of several operational processes that can be represented by UML diagrams. Through a comprehensive examination of UML diagrams, it is possible to explore the complex operational dynamics involved in the centralized management of product master data, orders, marketing campaigns, customer service, and inventory within the Health and Pharma sector’s omnichannel framework. As a result of the "ReDiT Omnichannel Spider" realization, the following subsection is devoted to the discussion of operational processes implemented in this macro system together with the detailed UML diagrams of the most relevant ones.
Creating Product Master Data
The product master data creation process is depicted in the UML diagram in Figure 12. In this phase, the operator initiates the procedure within the PIM system, where products destined for both online and offline sales are inputted and saved. Then, this data is shared via the Middleware orchestrator to the sales channels and to the ERP system for efficient stock management.
Creating Omnichannel Customer Master Data
The UML diagram in Figure 13 provides an overview of the customer master data creation process within the omnichannel system. When customers register on the e-commerce platform, they are automatically enrolled in the loyalty program. This action triggers the generation of customer master data across multiple components, including the Business-to-Consumer (B2C) module, the omnichannel checkout system, the loyalty engine for managing loyalty rewards, and the CRM system. The CRM system serves as a central repository for compiling all pertinent information related to individual customers, facilitating a comprehensive understanding of their preferences and interactions across various touchpoints.
Online Order Generation, fulfillment and delivery
The sequential stages of online order generation and fulfillment are outlined in the UML diagrams in Figure 14 and Figure 15. Beginning with a loyal customer’s order placement on the e-commerce platform, these diagrams illustrate the transmission of order data via Middleware to key business components including the checkout system, the CRM platform, the ERP system, and the WMS system. By showcasing this interconnected flow of information, the diagrams offer insights into how orders are processed and managed seamlessly across multiple channels within the omnichannel framework.
Offline Order Creation and Management
This process concerns the in-store purchase by a loyalty customer, from order processing by the checkout system to communication with the loyalty engine. All the interactions between different business components are orchestrated by the Middleware.
Return Request Management.
The process of managing a return request, initiated by a loyal customer for a purchase made on e-commerce, can be delineated into two distinct subprocesses.
-
Authorization of the return request The flow is composed by the following steps:
- The loyal customer submits a return request directly from their e-commerce private area.
- The e-commerce handles the request.
- The request data is transmitted to the components responsible for handling it, including the loyalty engine, so that the the loyalty data associated with that order are updated; to the cash system in order to achieve omnichannelity; to the ERP in order to update stocks and process accounting documents; to the CRM for updating the customer file.
- The e-commerce platform sends the data of the return order to the courier software which is responsible for generating the shipping label.
- The shipping label is transmitted to the e-commerce platform, and it becomes available in the customer’s private area where the customer can access and print the label to be used for preparing the pakage to be consigned to the designated shipper. This process simplifies the return procedure, allowing customers to facilitate return shipping without additional complexity.
-
Receiving the returned goods in the warehouse and generating the refund:
- After the loyal customer entrusts the returned items to the courier, the courier takes care of delivering them to the destination, which typically is the warehouse of the company that originally fulfilled the order.
- Once the goods are back at the warehouse, a company operator verifies their condition and suitability.
- Subsequently, the goods are loaded into the WMS for proper inventory management.
- Next, the operator accesses the ERP system to initiate the refund process for the customer.
- The return status is updated to "completed" and is notified to the pertinent component, such as the e-commerce platform, the cash system, and the CRM platform, ensuring that all systems are updated to the latest status of the return transaction.
Creating and Analyzing Marketing Campaigns
This operational process delineates the flow of information required to develop and evaluate a successful omnichannel marketing campaign, including both the campaign preparation and the marketing automation tool responsible for gathering data from the CRM system.
Service Ticket Creation and Management
This process involves the creation and management of support tickets. The flow is based on the interaction between customer, CRM and operator in the whole process including customer contact, customer service and ticket resolution.
Inventory generation and update
This operational process concerns the flow that includes: arrival of goods at the warehouse, updating of quantities, communication with the ERP system, cash system, and e-commerce platform.
3.2. Performance Analysis of the "ReDiT Automatic Warehouse" Optimization Algorithm
To assess the effectiveness and efficiency of the proposed model, a case study was conducted using a randomly generated dataset using Python. The performance metric under consideration is the time. Consequently, the time needed for product allocation and picking was computed for both solutions. The total time for each product to be allocated or picked is the sum of time required to move between two trays, time to get the tray out (outward), time to get the tray back in (return), and cobot time. The time calculation is expressed in the following algorythm:
time_total = time_moved_between_trays + time_ outward + time_return + cobot_time
where
cobot_time= (num_products) * T
time_moved_between_trays = abs(tray_index - tray_index_previous) * T
if abs(tray_index - tray_index_previous) > 0:
time_outward = T
else:
time_outward = 0
time_outward = time_return
Cobot_time refers to the time for allocating or picking a product, which can be done by a cobot or manually by an operator. In the conducted case study, T was set to 5 seconds. The algorithms were iterated 10 times. This repetition is related to the nature of the input data. Dealing with a randomly generated dataset, the results may exhibit variations between different runs because of the inherent stochastic nature of the dataset. For a more precise evaluation of the algorithms’ performance and to reduce the influence of the stochastic nature of input data, it is recommended to run the algorithms multiple times. This allows for calculating an average from the results obtained in different runs, providing a more reliable estimate of the algorithms’ performance. The results obtained after the 10 iterations of the two solutions are presented in Table 2 for the random solution and in Table 3 for the optimized solution, which allows a comparison of the allocation and picking times of the two solutions. Figure 16 shows a cumulative column chart comparing the total times of the two solutions for each iteration.
In the case of the optimized solution, the allocation time is slightly longer than that of the random solution, but the difference is not significant. In contrast, the optimized picking time is significantly shorter than the random picking time. The optimized solution consistently results in a lower overall time, which is the sum of allocation and picking times, than the random solution. Therefore, the optimized solution results in an average efficiency improvement of 10.76% compared to the random allocation solution.
4. Discussion
In this study an advanced, integrated, omnichannel framework has been designed and implemented for improving the shopping experience in the Health and Pharma sector, by establishing a more cohesive business infrastructure. This solution comprises multiple interconnected macro-systems and subsystems, working in synergy to enhance specific processes and flows in order to: (i) provide effective communications among different units; (ii) improve product, order and warehouse efficient management; (iii) offer personalized shopping experience through customer data and resource management; (iv) optimize marketing management, automatic pick&place and dark store. This well-designed architecture allows the entire framework to handle with different volumes of orders across diverse product categories and provides the ReDiT system with flexible and scalable attributes, ensuring its capability to accommodate evolving demands and market dynamics. Notably, two key macro-systems have been developed: the "ReDiT Omnichannel Spider" (ReDiT-OS) and the "ReDiT Automatic Warehouse" (ReDiT-AW). While ReDiT-OS focuses on creating a unified commerce platform capable of seamlessly managing transactions across various channels, ReDiT-AW is dedicated to optimizing e-commerce operations through automated dark-store picking. This involves deploying a cutting-edge system equipped with a picking warehouse and conveyor belts, specifically designed to streamline and automate the process of order fulfillment. Within the ReDiT-AW, a novel algorithm has been designed and developed to enhance the storage phase in the dark-store. This algorithm optimizes the allocation and picking of products swiftly and efficiently, ensuring rapid processing times. Indeed, travel time represents a substantial portion of the time required for order picking operations, and its reduction brings clear benefits to warehouse operations cost and order fulfillment time. The research and analysis conducted during this study have contributed to a comprehensive understanding of the importance of optimal product allocation within vertical carousel warehouses, particularly in Dark Stores contexts. Adopting advanced product allocation strategies can significantly improve operational efficiency, aiding in optimizing picking times and maximizing customer satisfaction. This study proposes two product allocation strategies in a vertical carousel warehouse. Based on correlations between products, the optimized allocation strategy significantly reduced picking times compared to the random allocation strategy. These results indicate that considering the relationships between products and optimizing the arrangement of products within the warehouse can significantly improve the efficiency of the picking process. This can be particularly important when picking times directly affect customer satisfaction and overall operational efficiency. Future research could explore more advanced approaches to optimizing product layout and consider additional factors that influence the picking process.
Author Contributions
Conceptualization, F.L., D.F., M.P. and E.Z; methodology, M.C., F.L., M.P and E.D.; software, M.C., D.F., F.L., L.L. and S.P.; validation, M.P. and L.L.; formal analysis, M.C. and L.L.; investigation, L.L. and E.Z.; data curation, M.C. and L.L.; writing—original draft preparation, M.C., E.D., L.L. and S.P.; writing—review and editing, D.F., E.D., F.L. and M.P.; visualization, F.L.; supervision, D.F.; All authors have read and agreed to the published version of the manuscript.
Funding
This research was funded by Regione Puglia - Progetto ReDiT - P.O. FESR 2014 - 2020 - Grant number: OYNIVY9.
Institutional Review Board Statement
Not applicable.
Informed Consent Statement
Not applicable.
Data Availability Statement
Dataset available on request from the authors.
Conflicts of Interest
The authors declare no conflicts of interest.
Abbreviations
The following abbreviations are used in this manuscript:
| SLAP | Storage Location Assignment Problem |
| WMS | Warehouse Management System |
| ERP | Enterprise Resource Planning |
References
- Cotarelo, M.; Fayos, T.; Calderón, H.; Mollá, A. Omni-channel intensity and shopping value as key drivers of customer satisfaction and loyalty. Sustainability 2021, 13, 5961. [Google Scholar] [CrossRef]
- Tiberi, S. Impresa digitale: gestire contenuti, dati, tecnologia, organizzazione nell’era del cliente omnicanale; HOEPLI EDITORE, 2019.
- Akter, S.; Hossain, T.M.T.; Strong, C. What omnichannel really means? Journal of Strategic Marketing 2021, 29, 567–573. [Google Scholar] [CrossRef]
- Hübner, A.; Holzapfel, A.; Kuhn, H. Distribution systems in omni-channel retailing. Business Research 2016, 9, 255–296. [Google Scholar] [CrossRef]
- Hong, J.m.; Shin, S.y. Effects of omni channel characteristics on consumers’ perceived risk, attitude, and intention. The Research Journal of the Costume Culture 2018, 26, 346–359. [Google Scholar]
- Shin, J.K.; Oh, M.O. Effects of omni-channel service characteristics on utilitarian/hedonic shopping value and reuse intention. Journal of Digital Convergence 2017, 15, 183–191. [Google Scholar]
- Caiazzo, G. Verso l’omnicanalità: la sfida all’integrazione tra lo shop online ed il punto vendita fisico. PhD thesis, Scuola universitaria professionale della Svizzera italiana, 2018.
- Simone, A.; Sabbadin, E. The new paradigm of the omnichannel retailing: key drivers, new challenges and potential outcomes resulting from the adoption of an omnichannel approach. International Journal of Business and Management 2018, 13, 85–109. [Google Scholar] [CrossRef]
- Cristiano, M. Omnichannel Marketing: Lo sviluppo di una piattaforma digitale nel fashion retail. PhD thesis, Scuola universitaria professionale della Svizzera italiana, 2019.
- Vianelli, D.; de Luca, P.; Pegan, G. ; others. La gestione della complessità nelle strategie omnicanale dell’impresa internazionale. In Contributi in onore di Gaetano Maria Golinelli; Rogiosi Editore, 2020; pp. 1299–1308.
- Bruzzi, S. Innovazione scientifica e innovazione imprenditoriale nel settore farmaceutico. Impresa Progetto-Electronic Journal of Management, 2009. [Google Scholar]
- Mennini, F.S.; Gianfrate, F.; Spandonaro, F. Dinamiche determinanti del settore farmaceutico in Europa. L’industria 2005, 26, 103–118. [Google Scholar]
- Asmare, A.; Zewdie, S. Omnichannel retailing strategy: a systematic review. The International Review of Retail, Distribution and Consumer Research 2022, 32, 59–79. [Google Scholar] [CrossRef]
- Bettucci, M.; D’Amato, I.; Perego, A.; Pozzoli, E. Omnicanalità: Assicurare continuità all’esperienza del cliente; Leading Management SDA, Egea, 2016.
- Saghiri, S.; Mirzabeiki, V. Omni-channel integration: the matter of information and digital technology. International Journal of Operations & Production Management 2021, 41, 1660–1710. [Google Scholar]
- Nobre, J.; Vita, J. Analysis of the dark store from the perspective of urban law. Rev. Direito Cid. 2021, 13, 1373–1392. [Google Scholar]
- Capital, V. Grocery Fulfillment and Dark Stores—Clear Aisles, Full Carts, Can’t Lose? WWW Document, 2020.
- Dablanc, L.; Morganti, E.; Arvidsson, N.; Woxenius, J.; Browne, M.; Saidi, N. The rise of on-demand ‘Instant Deliveries’ in European cities. Supply Chain Forum Int. J. 2017, 18, 203–217. [Google Scholar] [CrossRef]
- Gallo, F.M. Tutto sui dark store: cosa sono e a cosa servono. LogisticaIT 2020. [Google Scholar]
- Makarchuk, M. The “dark side” of retail: industry challenges and specifics of inventory management for dark stores. https://www.leafio.ai/blog/the-dark-side-of-retail-industry-challenges-and-specifics-of-inventory-management-for-dark-stores/, 2023. Accessed: 2024-03-27.
- Deagor. Cos’è il Dark Store e perché sta prendendo piede? https://www.deagor.io/it/cose-il-dark-store-e-perche-sta-prendendo-piede/, 2021. Accessed: 2024-03-27.
- Uskonen, J. What’s the Key to Dark Store Profitability? https://www.relexsolutions.com/resources/the-keys-to-dark-store-profitability/, 2021. Accessed: 2024-03-27.
- Dukic, G.; Opetuk, T.; Lerher, T. A throughput model for a dual-tray Vertical Lift Module with a human order-picker. Int. J. Prod. Econ. 2015, 170, 874–881. [Google Scholar] [CrossRef]
- Gu, J.; Goetschalckx, M.; McGinnis, L. Research on warehouse operation: A comprehensive review. Eur. J. Oper. Res. 2007, 177, 1–21. [Google Scholar] [CrossRef]
- Bolaños Zuñiga, J.; Saucedo Martínez, J.; Salais Fierro, T.; Marmolejo Saucedo, J. Optimization of the Storage Location Assignment and the Picker-Routing Problem Using Mathematical Programming. Appl. Sci. 2020, 10, 534. [Google Scholar] [CrossRef]
- Yang, D.; Wu, Y.; Ma, W. Optimization of storage location assignment in an automated warehouse. Microprocess. Microsyst. 2021, 80, 103356. [Google Scholar] [CrossRef]
- Li, Y.; Méndez-Mediavilla, F.; Temponi, C.; Kim, J.; Jimenez, J. A Heuristic Storage Location Assignment Based on Frequent Itemset Classes to Improve Order Picking Operations. Appl. Sci. 2021, 11, 1839. [Google Scholar] [CrossRef]
- Leng, J.; Yan, D.; Liu, Q.; Zhang, H.; Zhao, G.; Wei, L.; Zhang, D.; Yu, A.; Chen, X. Digital twin-driven joint optimisation of packing and storage assignment in large-scale automated high-rise warehouse product-service system. Int. J. Comput. Integr. Manuf. 2021, 34, 783–800. [Google Scholar] [CrossRef]
- Muppani (Muppant), V.; Adil, G. Efficient formation of storage classes for warehouse storage location assignment: A simulated annealing approach. Omega, Special Issue on Logistics: New Perspectives and Challenges 2008, 36, 609–618. [Google Scholar]
- Leon, J.; Li, Y.; Peyman, M.; Calvet, L.; Juan, A. A Discrete-Event Simheuristic for Solving a Realistic Storage Location Assignment Problem. Mathematics 2023, 11, 1577. [Google Scholar] [CrossRef]
- Keung, K.; Lee, C.; Ji, P. Data-driven order correlation pattern and storage location assignment in robotic mobile fulfillment and process automation system. Adv. Eng. Inform. 2021, 50, 101369. [Google Scholar] [CrossRef]
- Mirzaei, M.; Zaerpour, N.; de Koster, R. The impact of integrated cluster-based storage allocation on parts-to-picker warehouse performance. Transp. Res. Part E Logist. Transp. Rev. 2021, 146, 102207. [Google Scholar] [CrossRef]
- Zhou, L.; Sun, L.; Li, Z.; Li, W.; Cao, N.; Higgs, R. Study on a storage location strategy based on clustering and association algorithms. Soft Comput. 2020, 24, 5499–5516. [Google Scholar] [CrossRef]
- Wang, M.; Zhang, R.Q.; Fan, K. Improving order-picking operation through efficient storage location assignment: A new approach. Comput. Ind. Eng. 2020, 139, 106186. [Google Scholar] [CrossRef]
- Pang, K.W.; Chan, H.L. Data mining-based algorithm for storage location assignment in a randomised warehouse. Int. J. Prod. Res. 2017, 55, 4035–4052. [Google Scholar] [CrossRef]
- Lorenc, A.; Lerher, T. PickupSimulo–Prototype of Intelligent Software to Support Warehouse Managers Decisions for Product Allocation Problems. Appl. Sci. 2020, 10, 8683. [Google Scholar] [CrossRef]
- Ansari, M.; Smith, J. Gravity Clustering: A Correlated Storage Location Assignment Problem Approach. 2020 Winter Simulation Conference (WSC), 2020, pp. 1288–1299.
- Micale, R.; La Fata, C.; La Scalia, G. A combined interval-valued ELECTRE TRI and TOPSIS approach for solving the storage location assignment problem. Comput. Ind. Eng. 2019, 135, 199–210. [Google Scholar] [CrossRef]
- Tinelli, L.; Vivaldini, K.; Becker, M. Intelligent warehouse product position optimization by applying a multi-criteria tool. International Workshop on Robotics in Smart Manufacturing. Springer, 2013, pp. 137–145.
- Papcun, P. ; others. Augmented Reality for Humans-Robots Interaction in Dynamic Slotting “Chaotic Storage” Smart Warehouses. Advances in Production Management Systems. Production Management for the Factory of the Future. APMS 2019; Ameri, F.; Stecke, K.; von Cieminski, G.; Kiritsis, D., Eds. Springer, Cham, 2019, Vol. 566.
- Liu, J.; Liao, X.; Zhao, W.; Yang, N. A classification approach based on the outranking model for multiple criteria ABC analysis. Omega 2016, 61, 19–34. [Google Scholar] [CrossRef]
- Sacramento Quintanilla, Ángeles Pérez, F.B.; Lino, P. Heuristic algorithms for a storage location assignment problem in a chaotic warehouse. Engineering Optimization 2015, 47, 1405–1422. [CrossRef]
- Amir Foroughi, Nils Boysen, S.E.; Schneider, M. High-density storage with mobile racks: Picker routing and product location. Journal of the Operational Research Society 2021, 72, 535–553. [CrossRef]
Figure 1.
ReDiT Framework
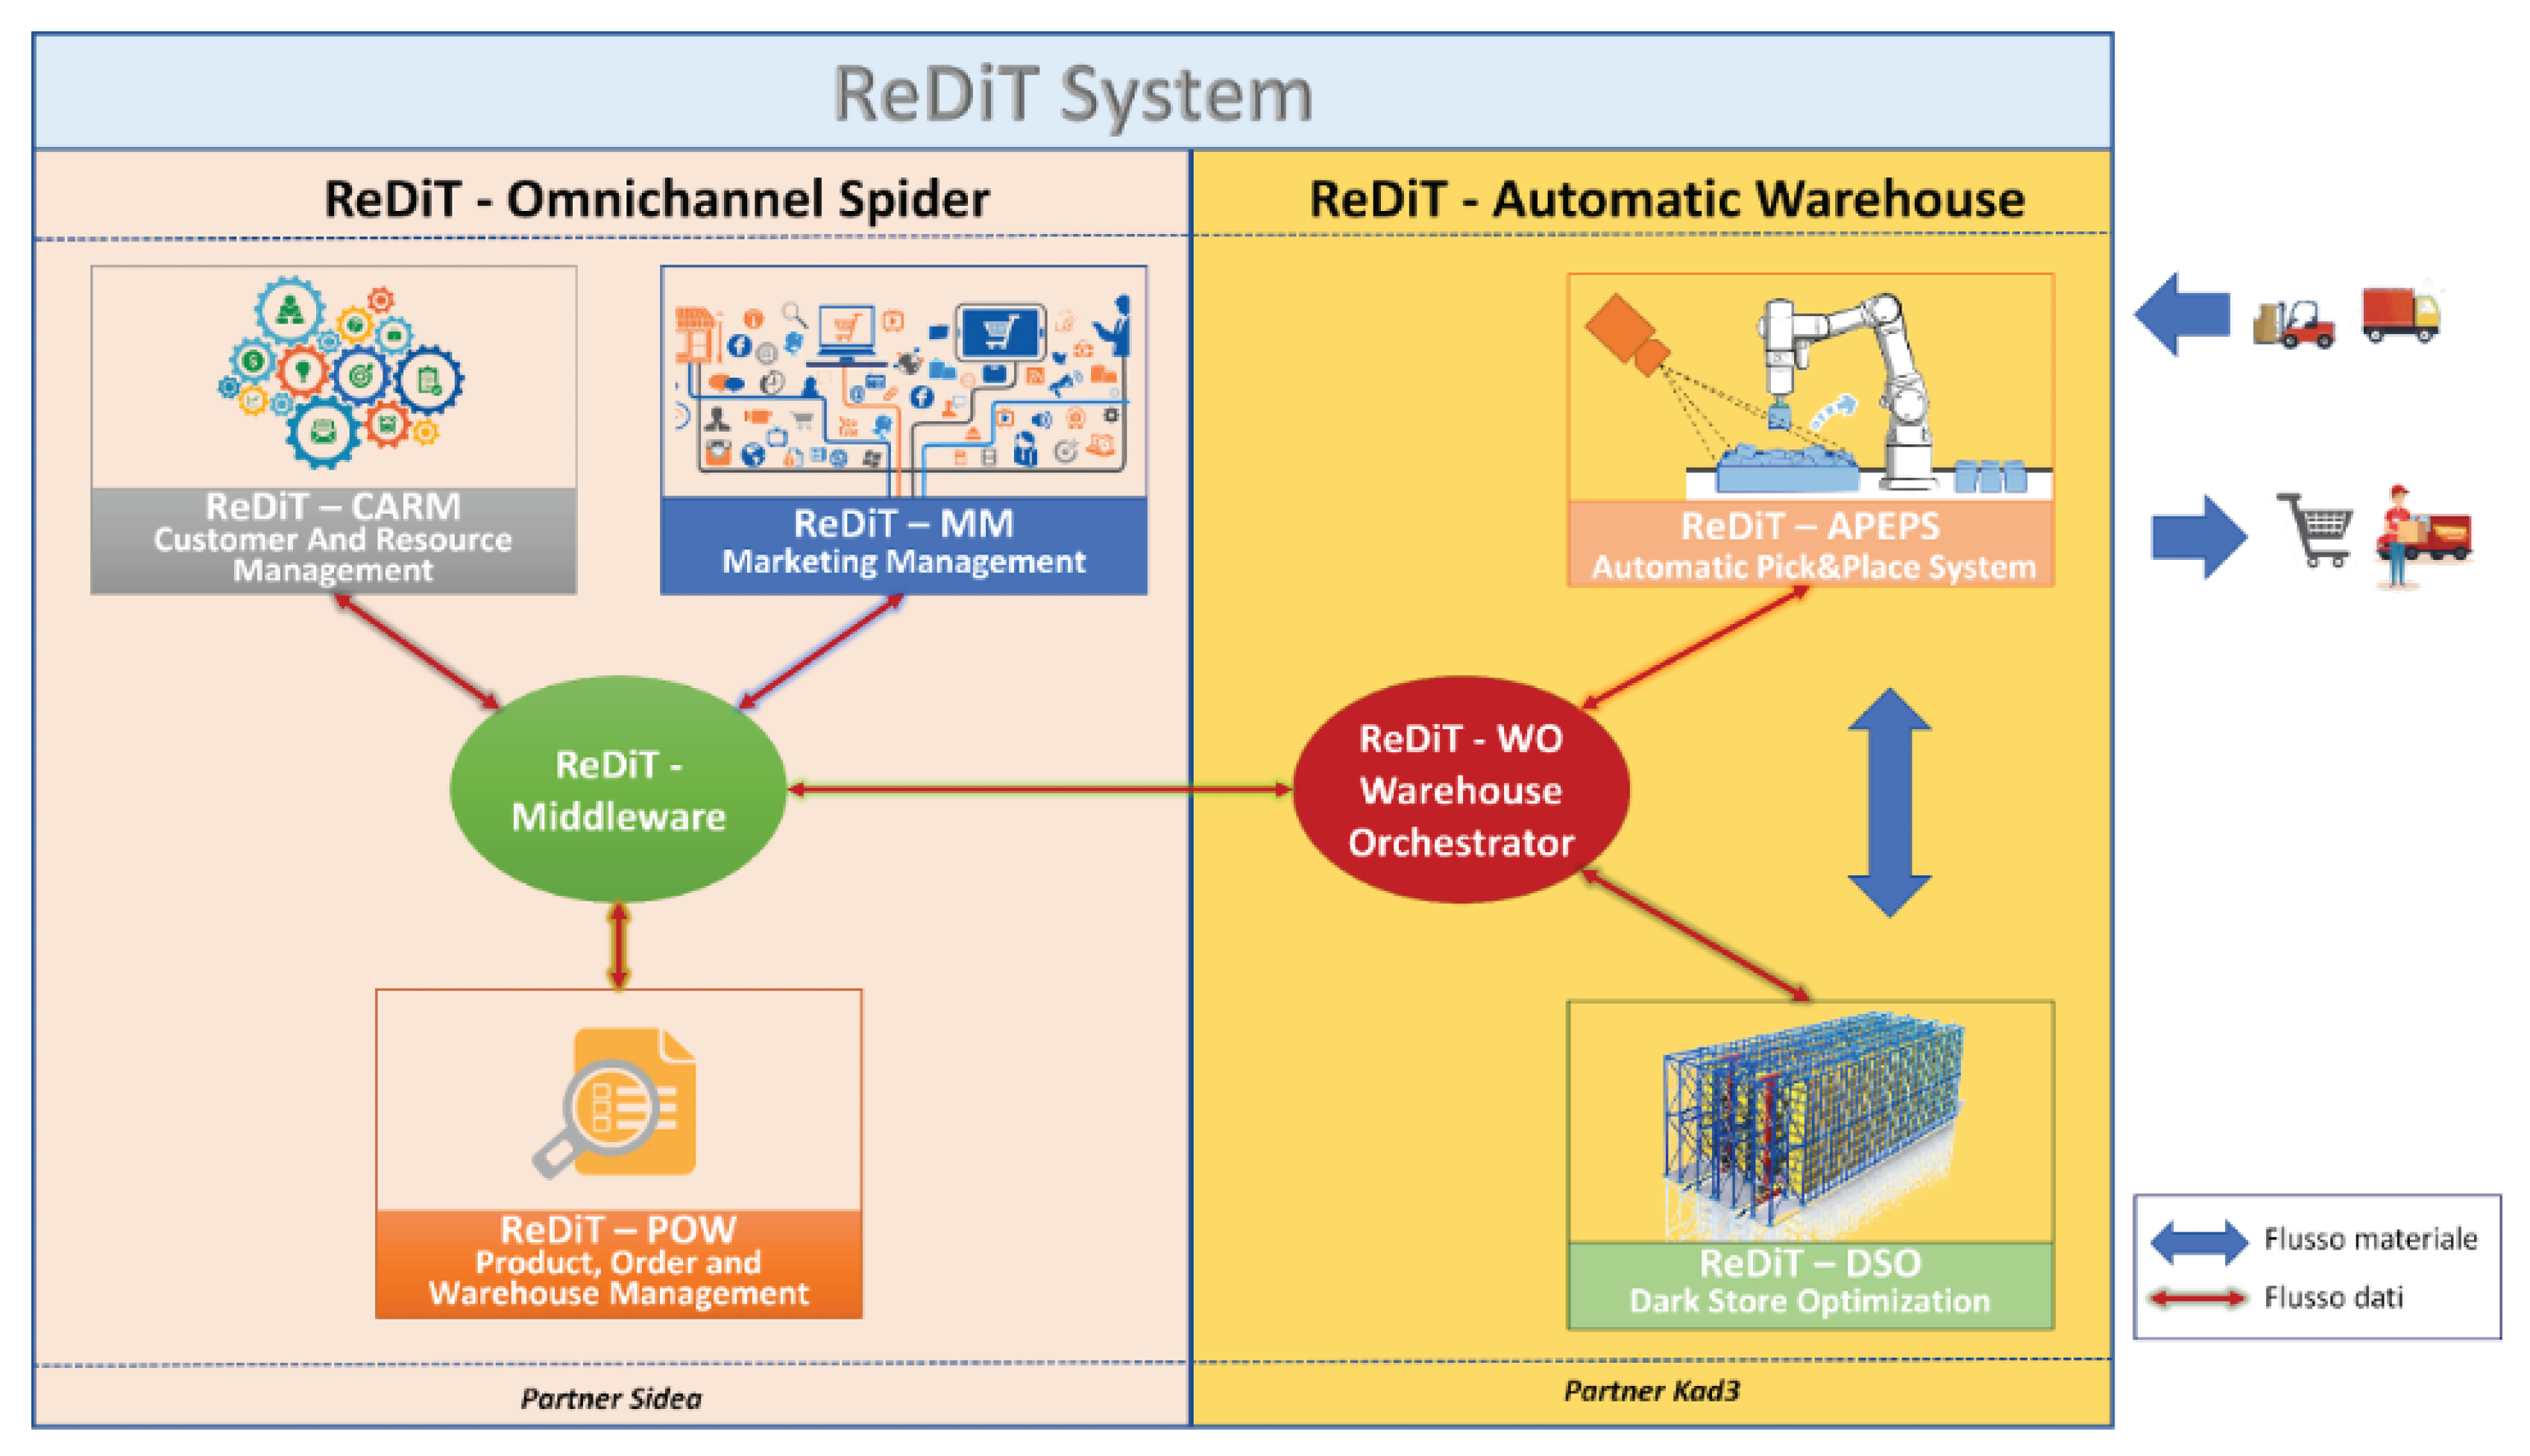
Figure 4.
The methodological approach.
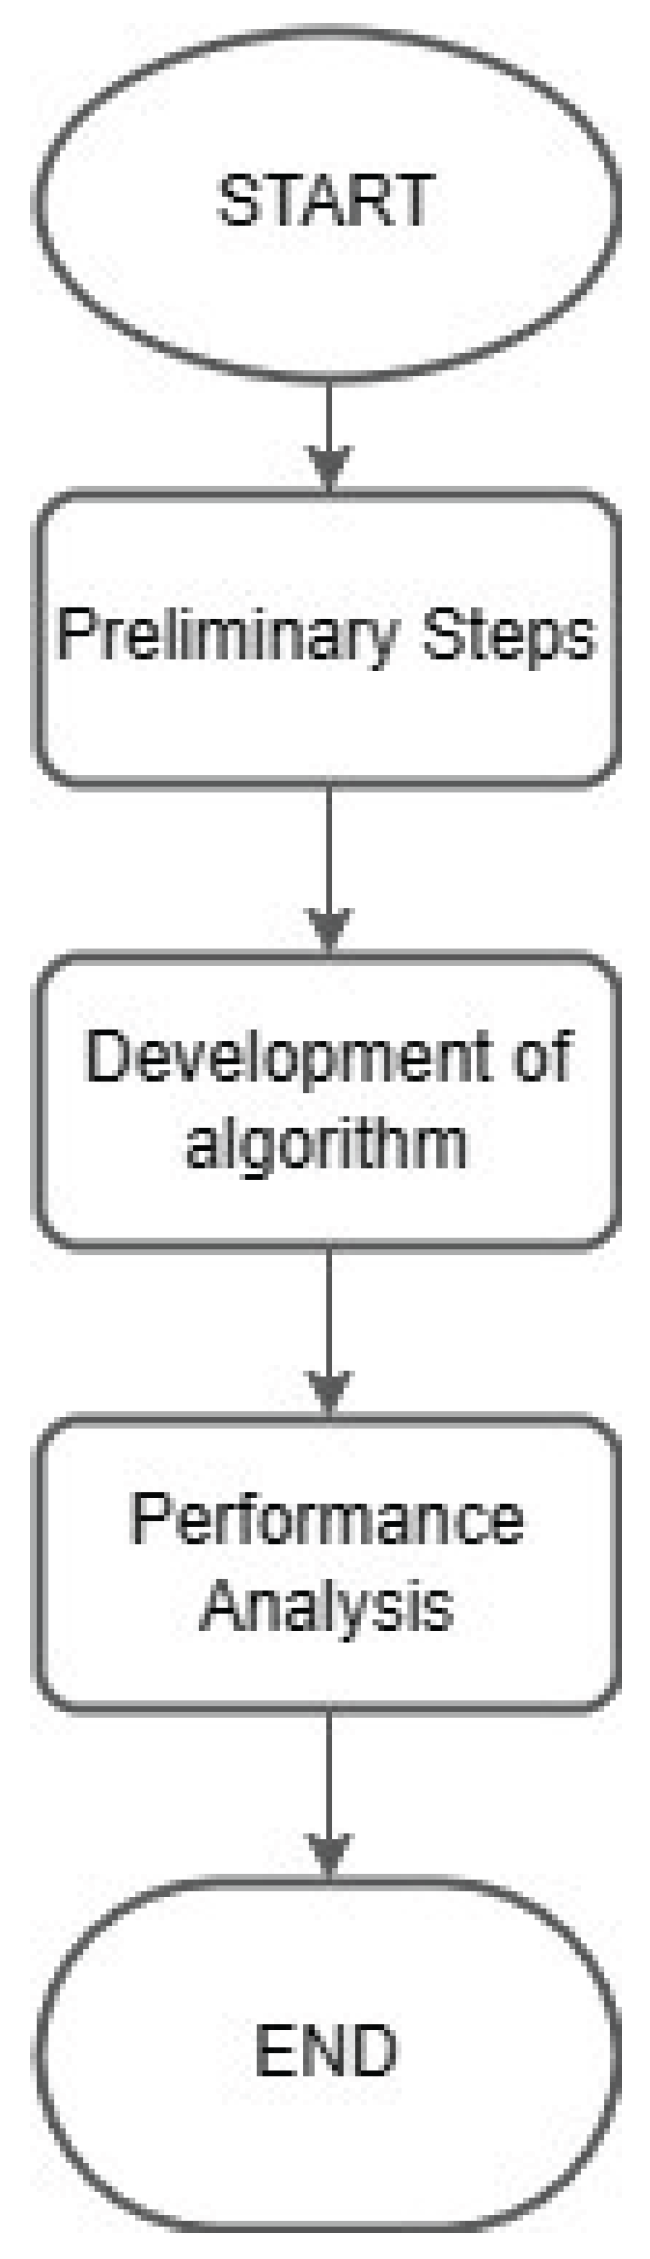
Figure 5.
Flowchart of the random allocation algorithm.
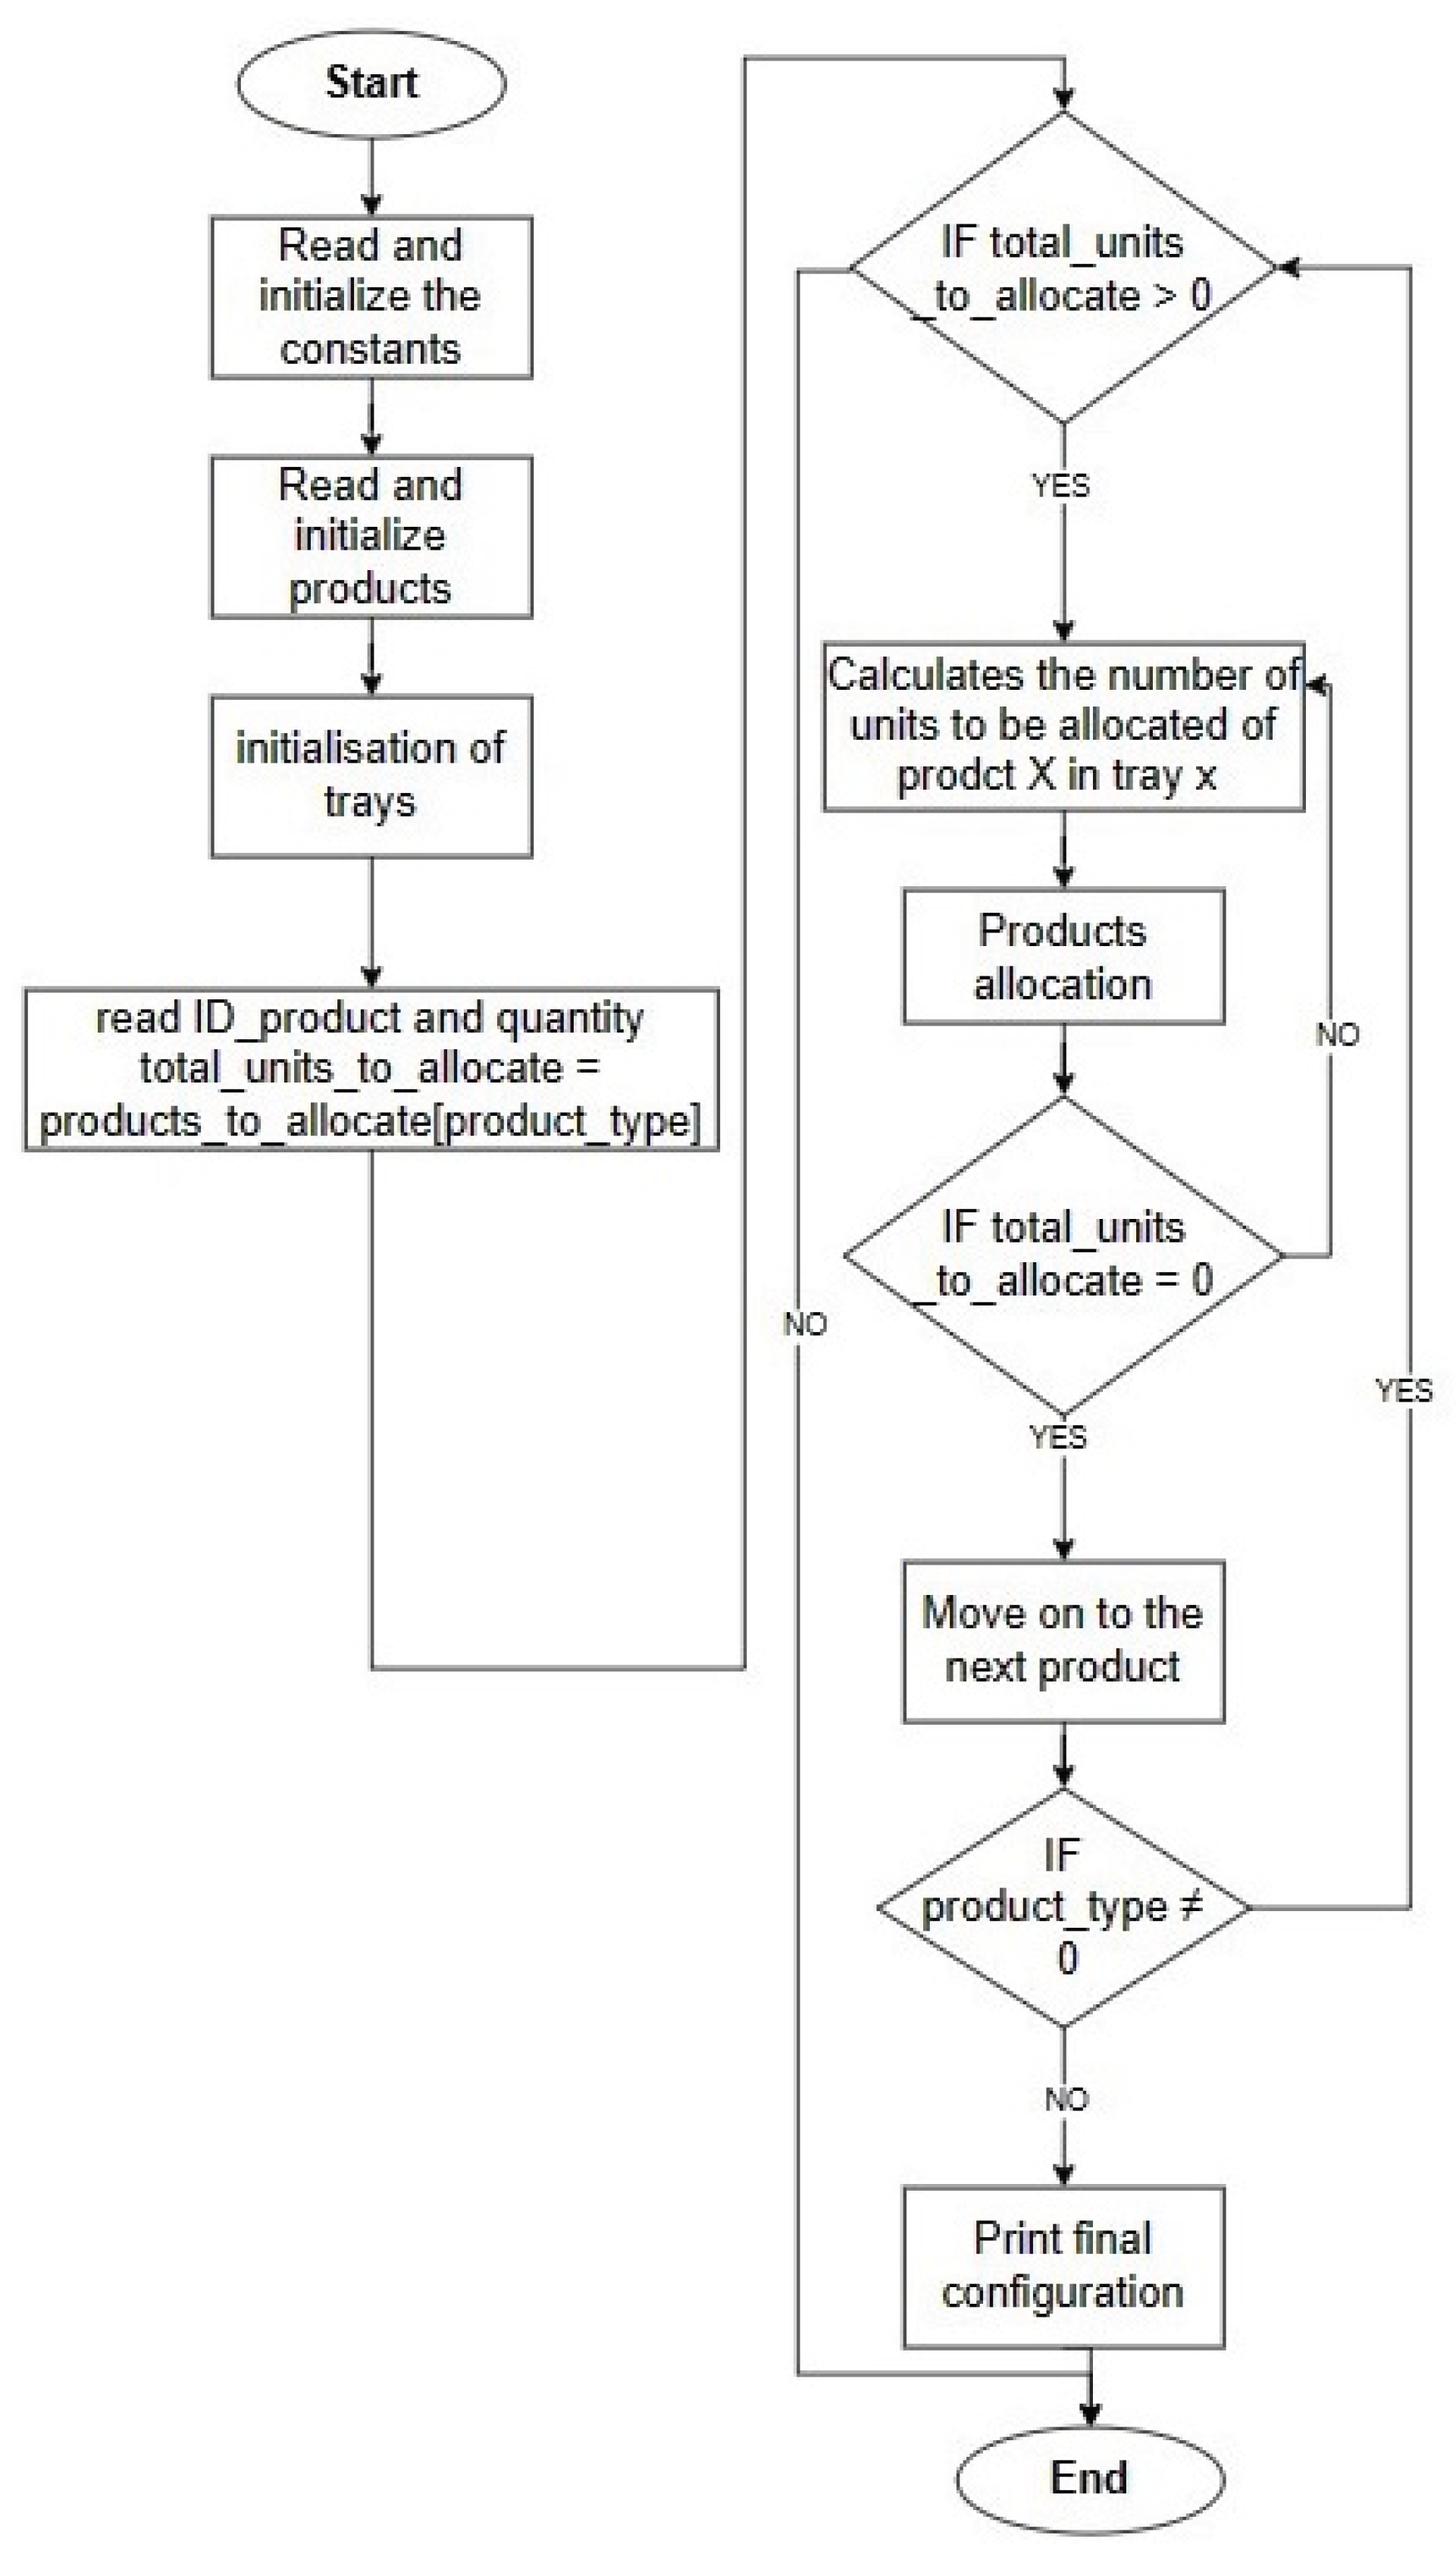
Figure 6.
Final configuration after random allocation of products, where "vassoio" stands for "tray".
Figure 6.
Final configuration after random allocation of products, where "vassoio" stands for "tray".
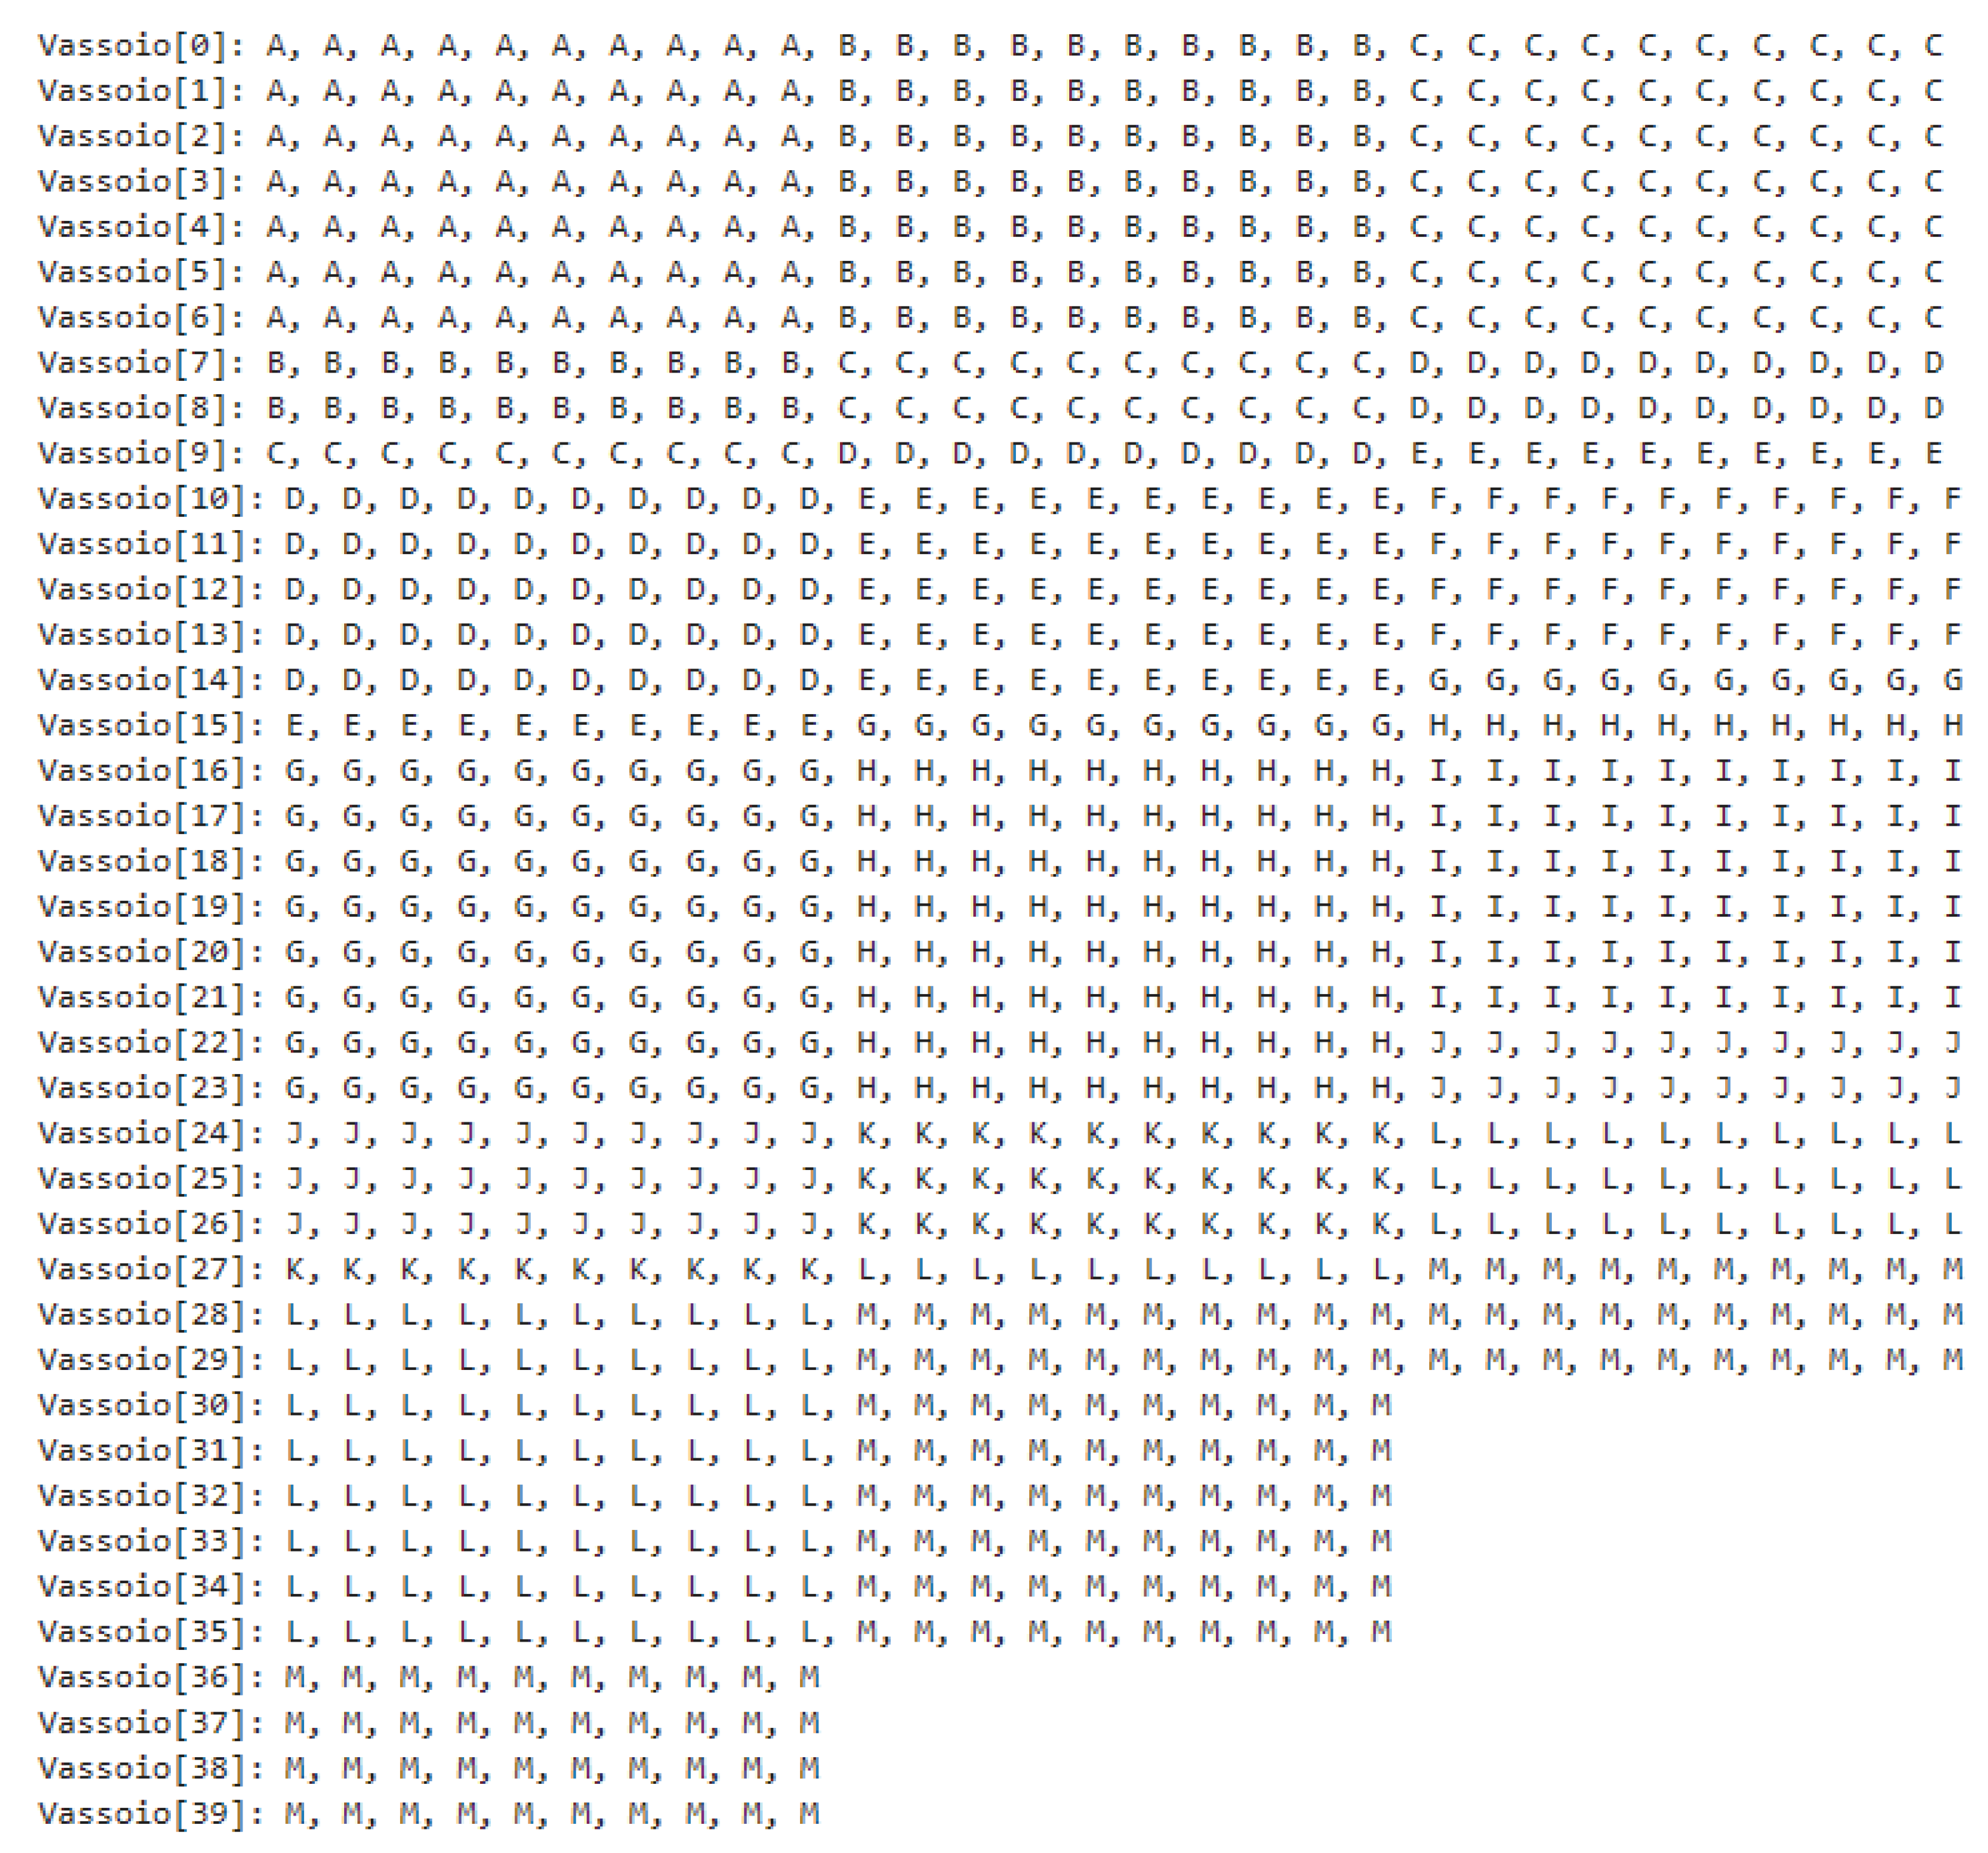
Figure 7.
Flowchart of the optimized allocation algorithm.
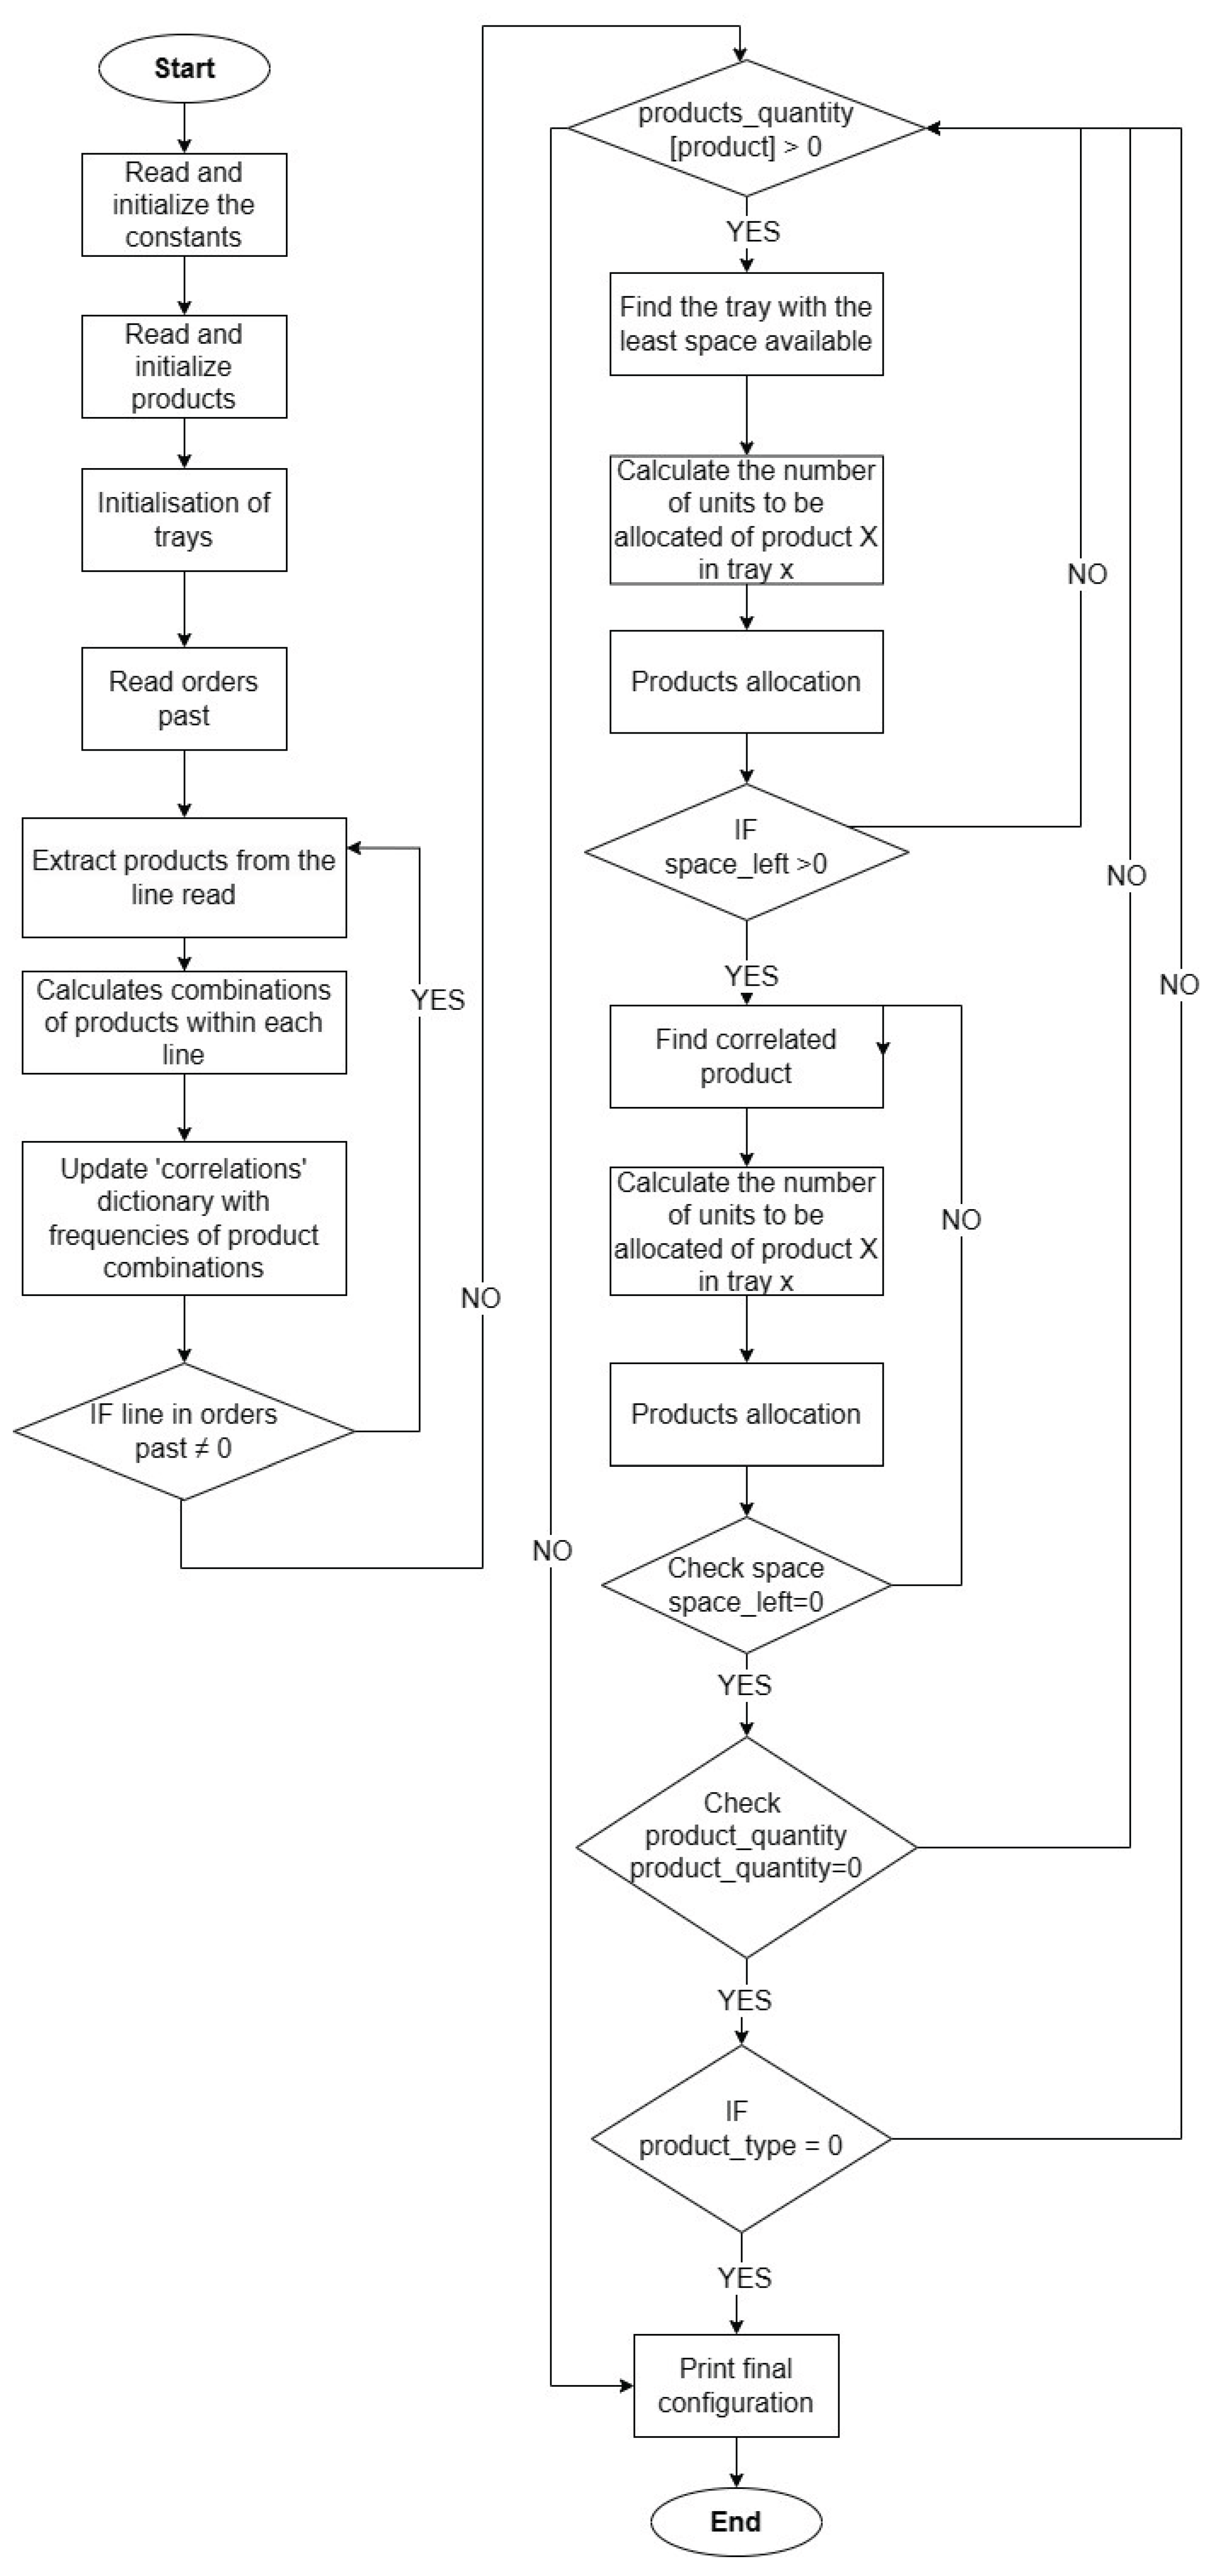
Figure 8.
Resulting configuration from the optimized allocation of products.

Figure 9.
Correlations among the products in the configuration obtained after optimized allocation.
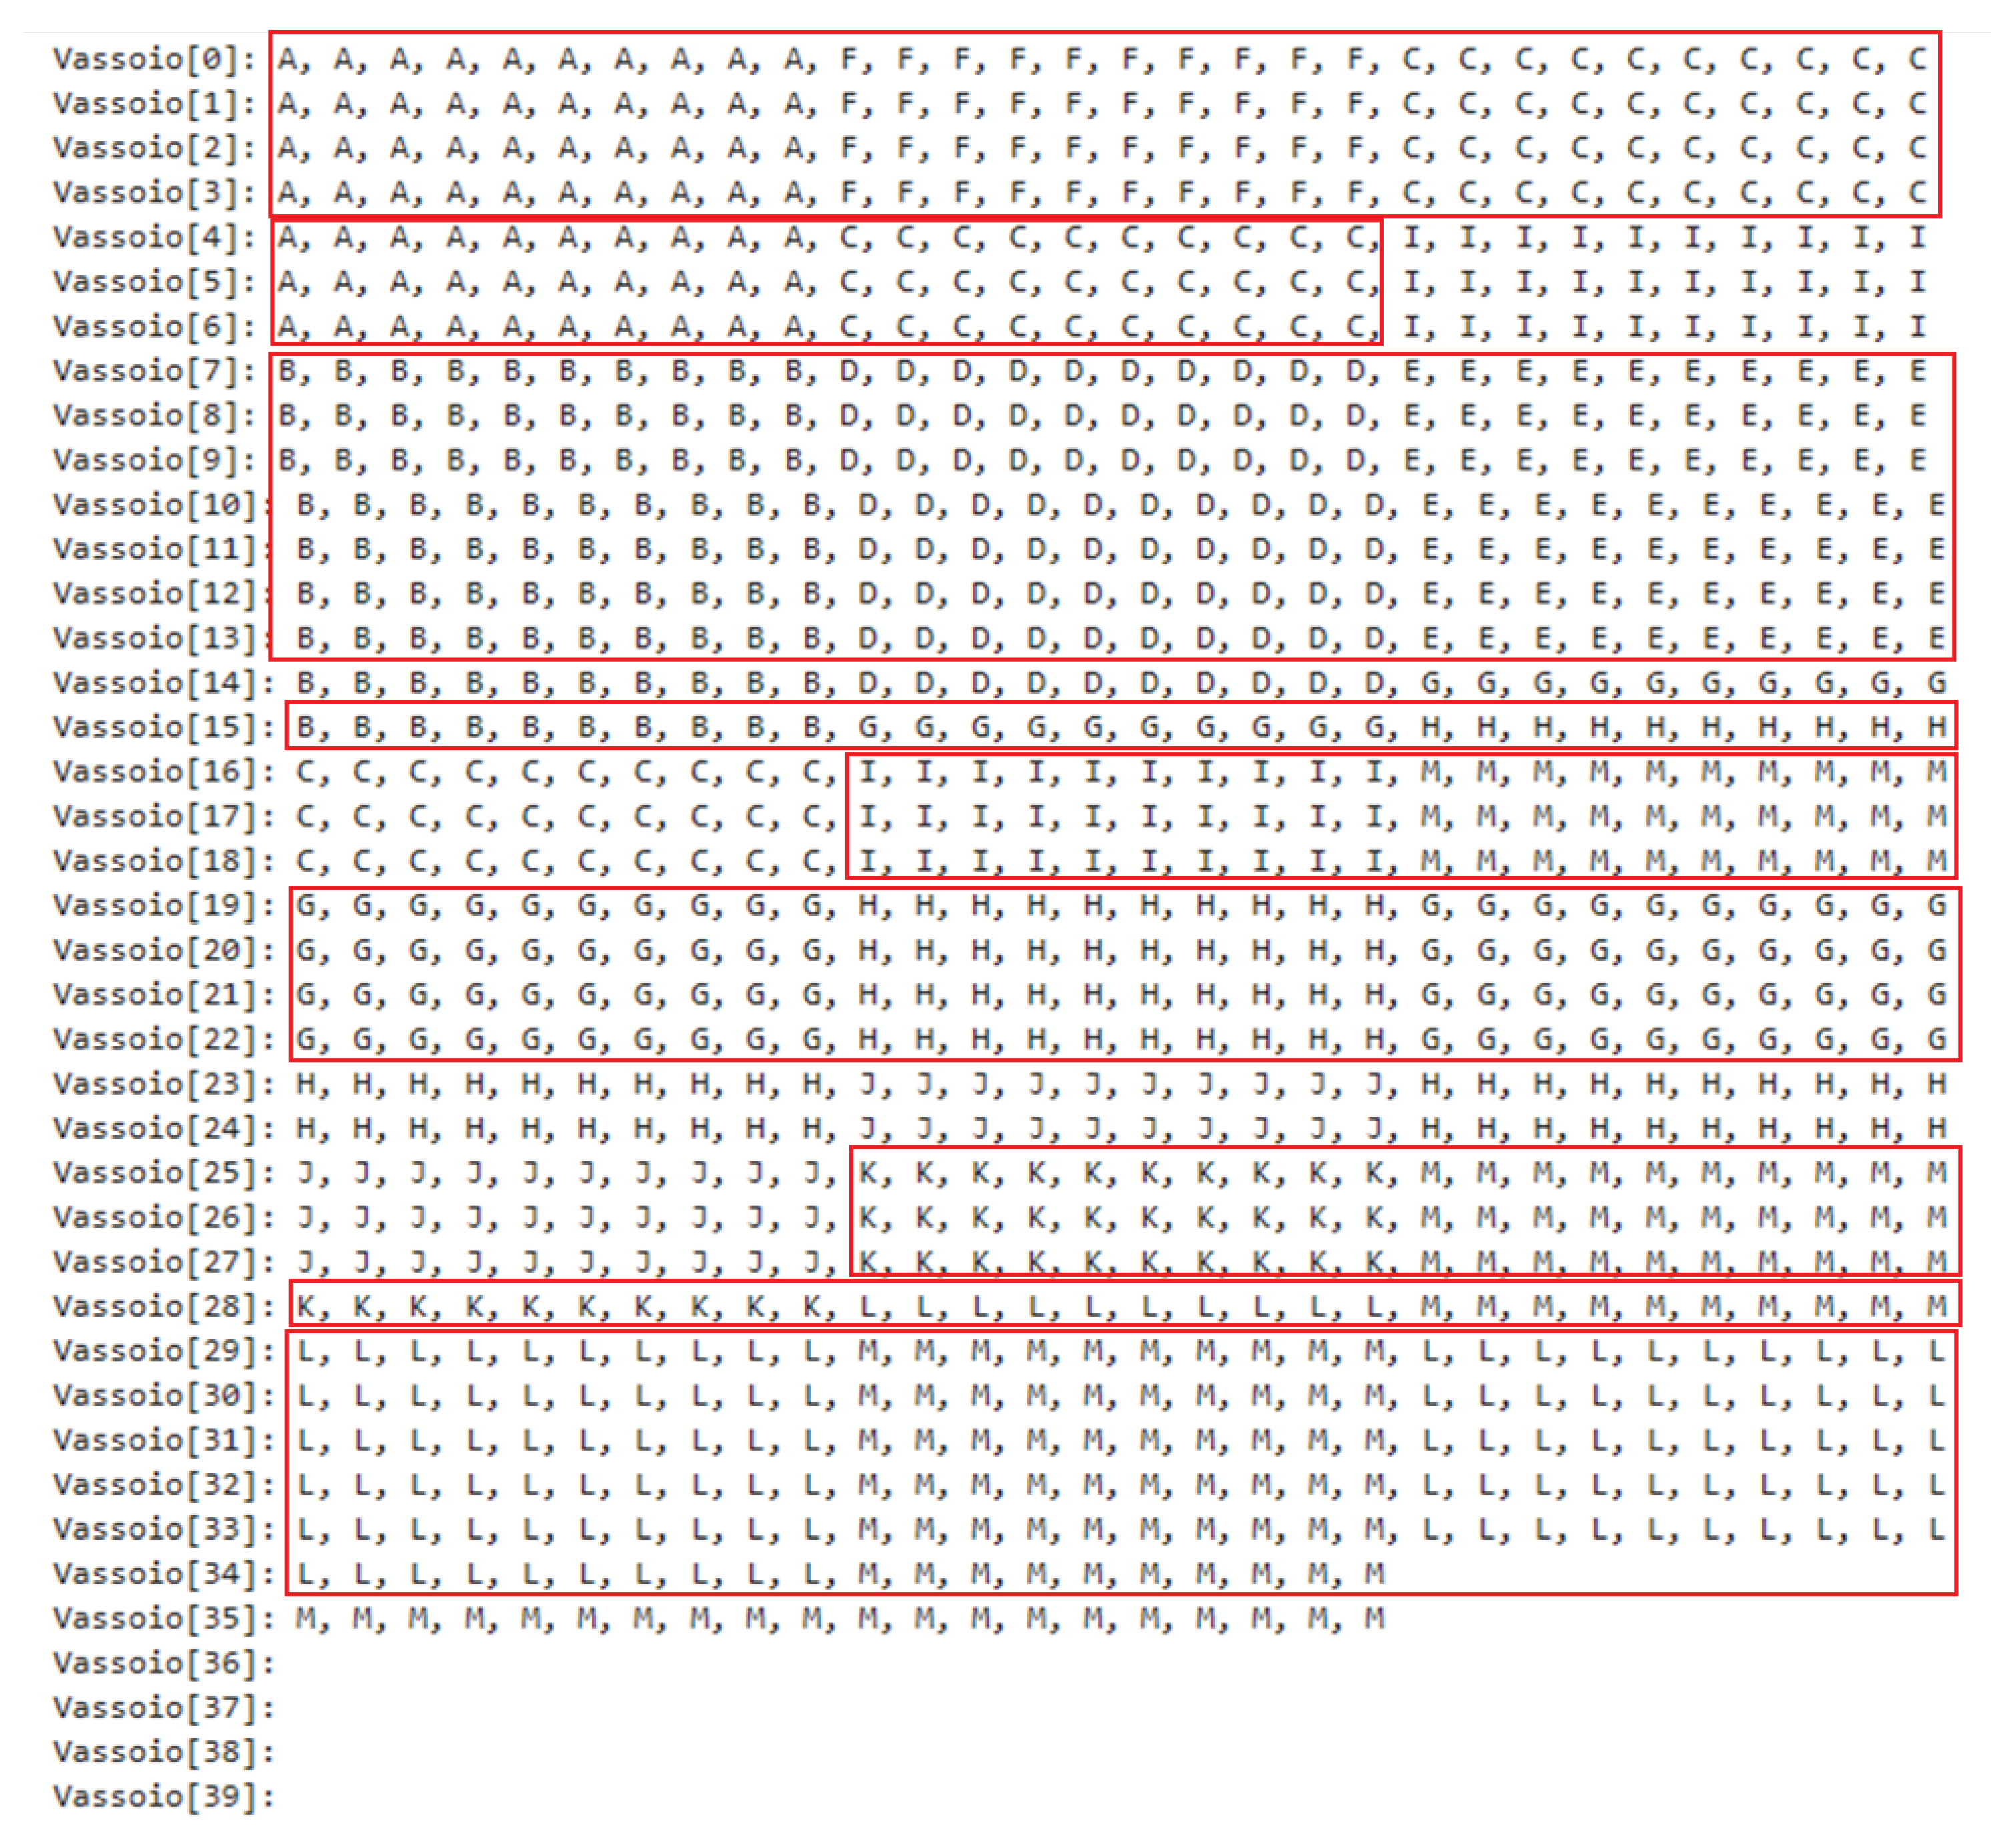
Figure 10.
Comparison of Tray Configurations.
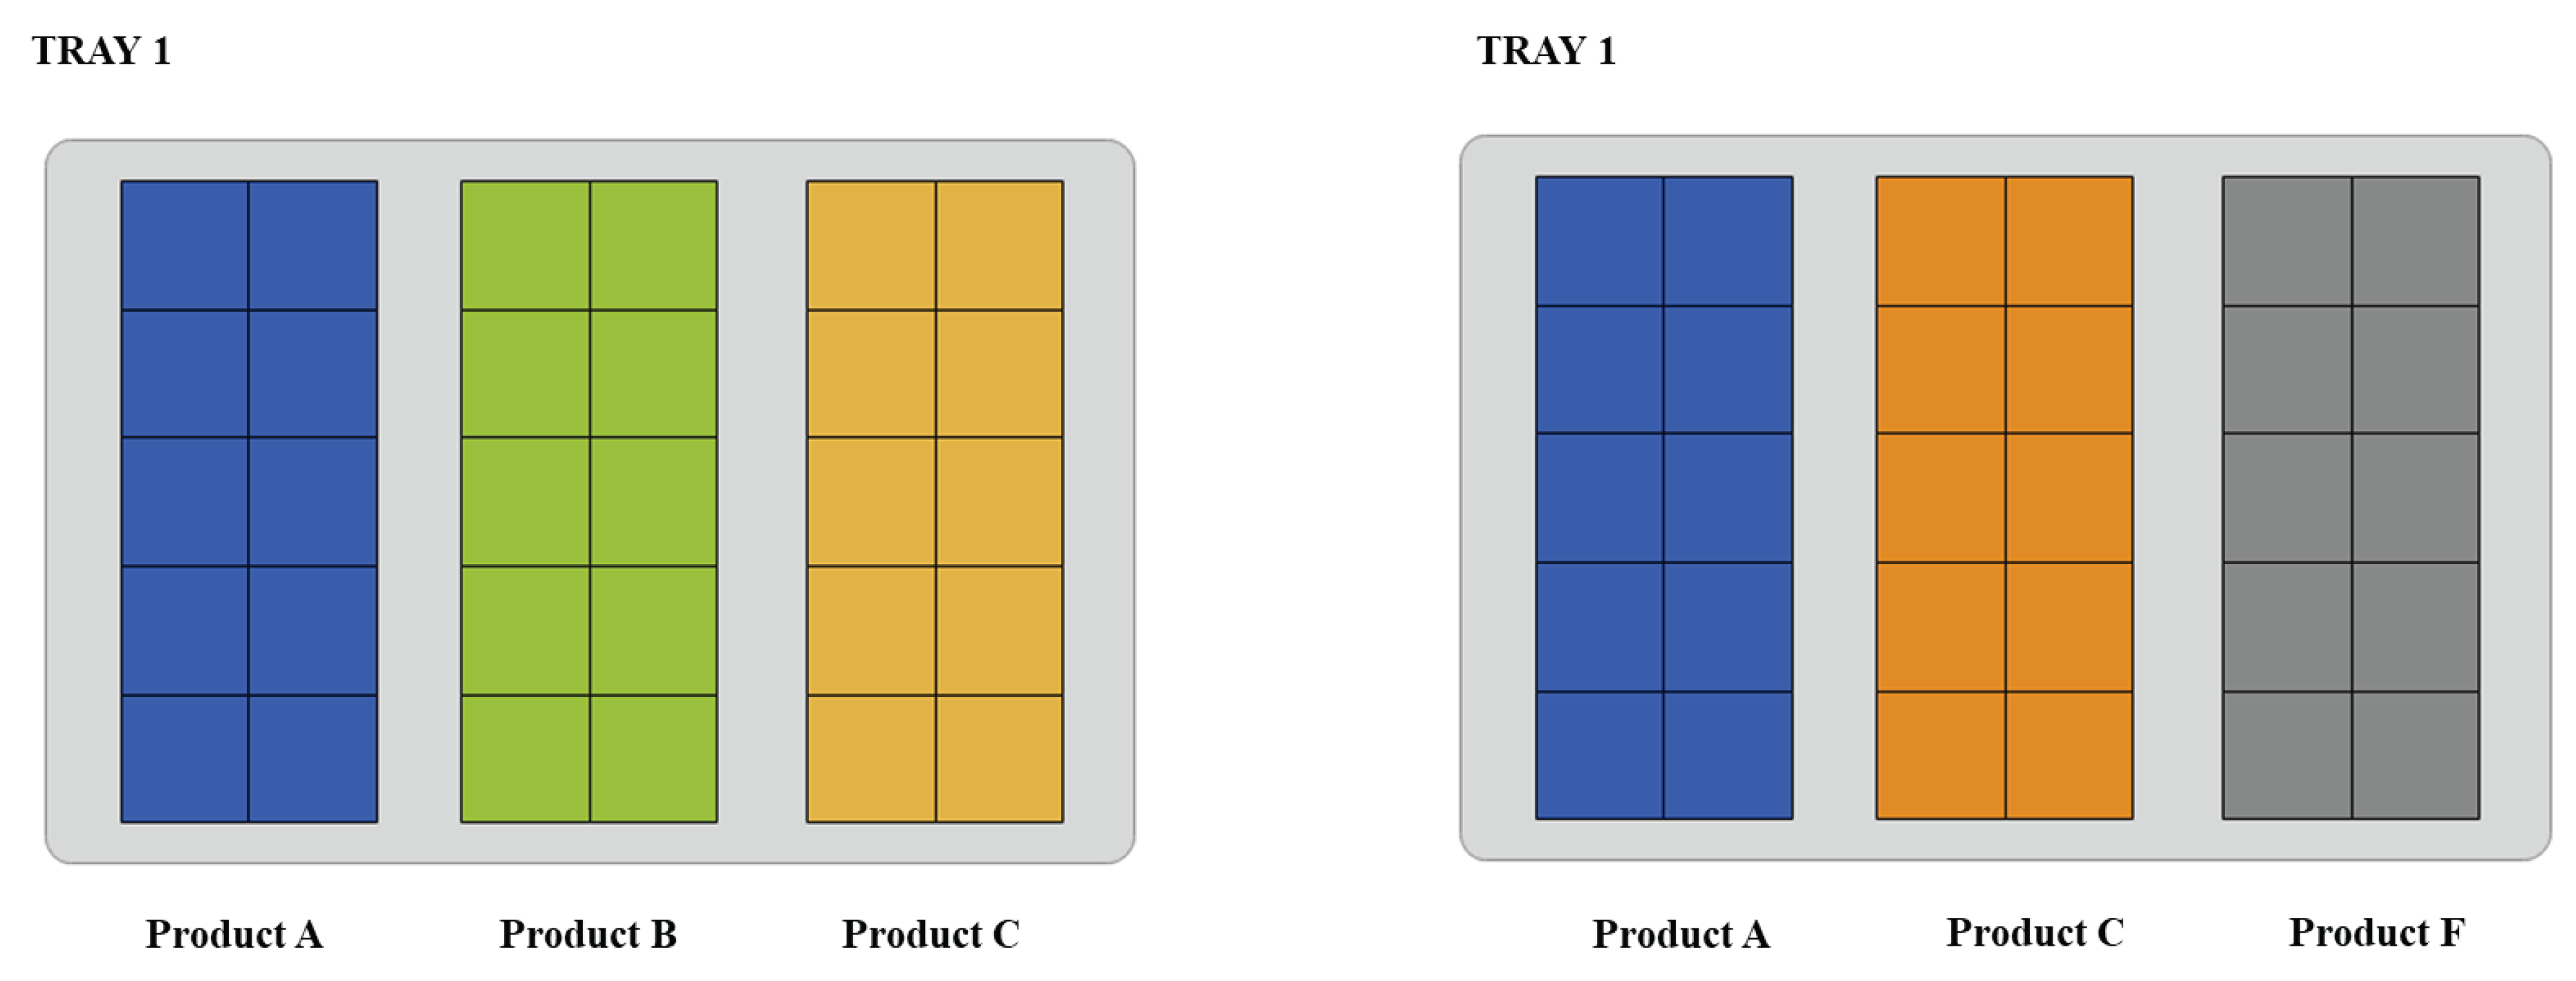
Figure 11.
Flowchart of the algorithm for picking products.
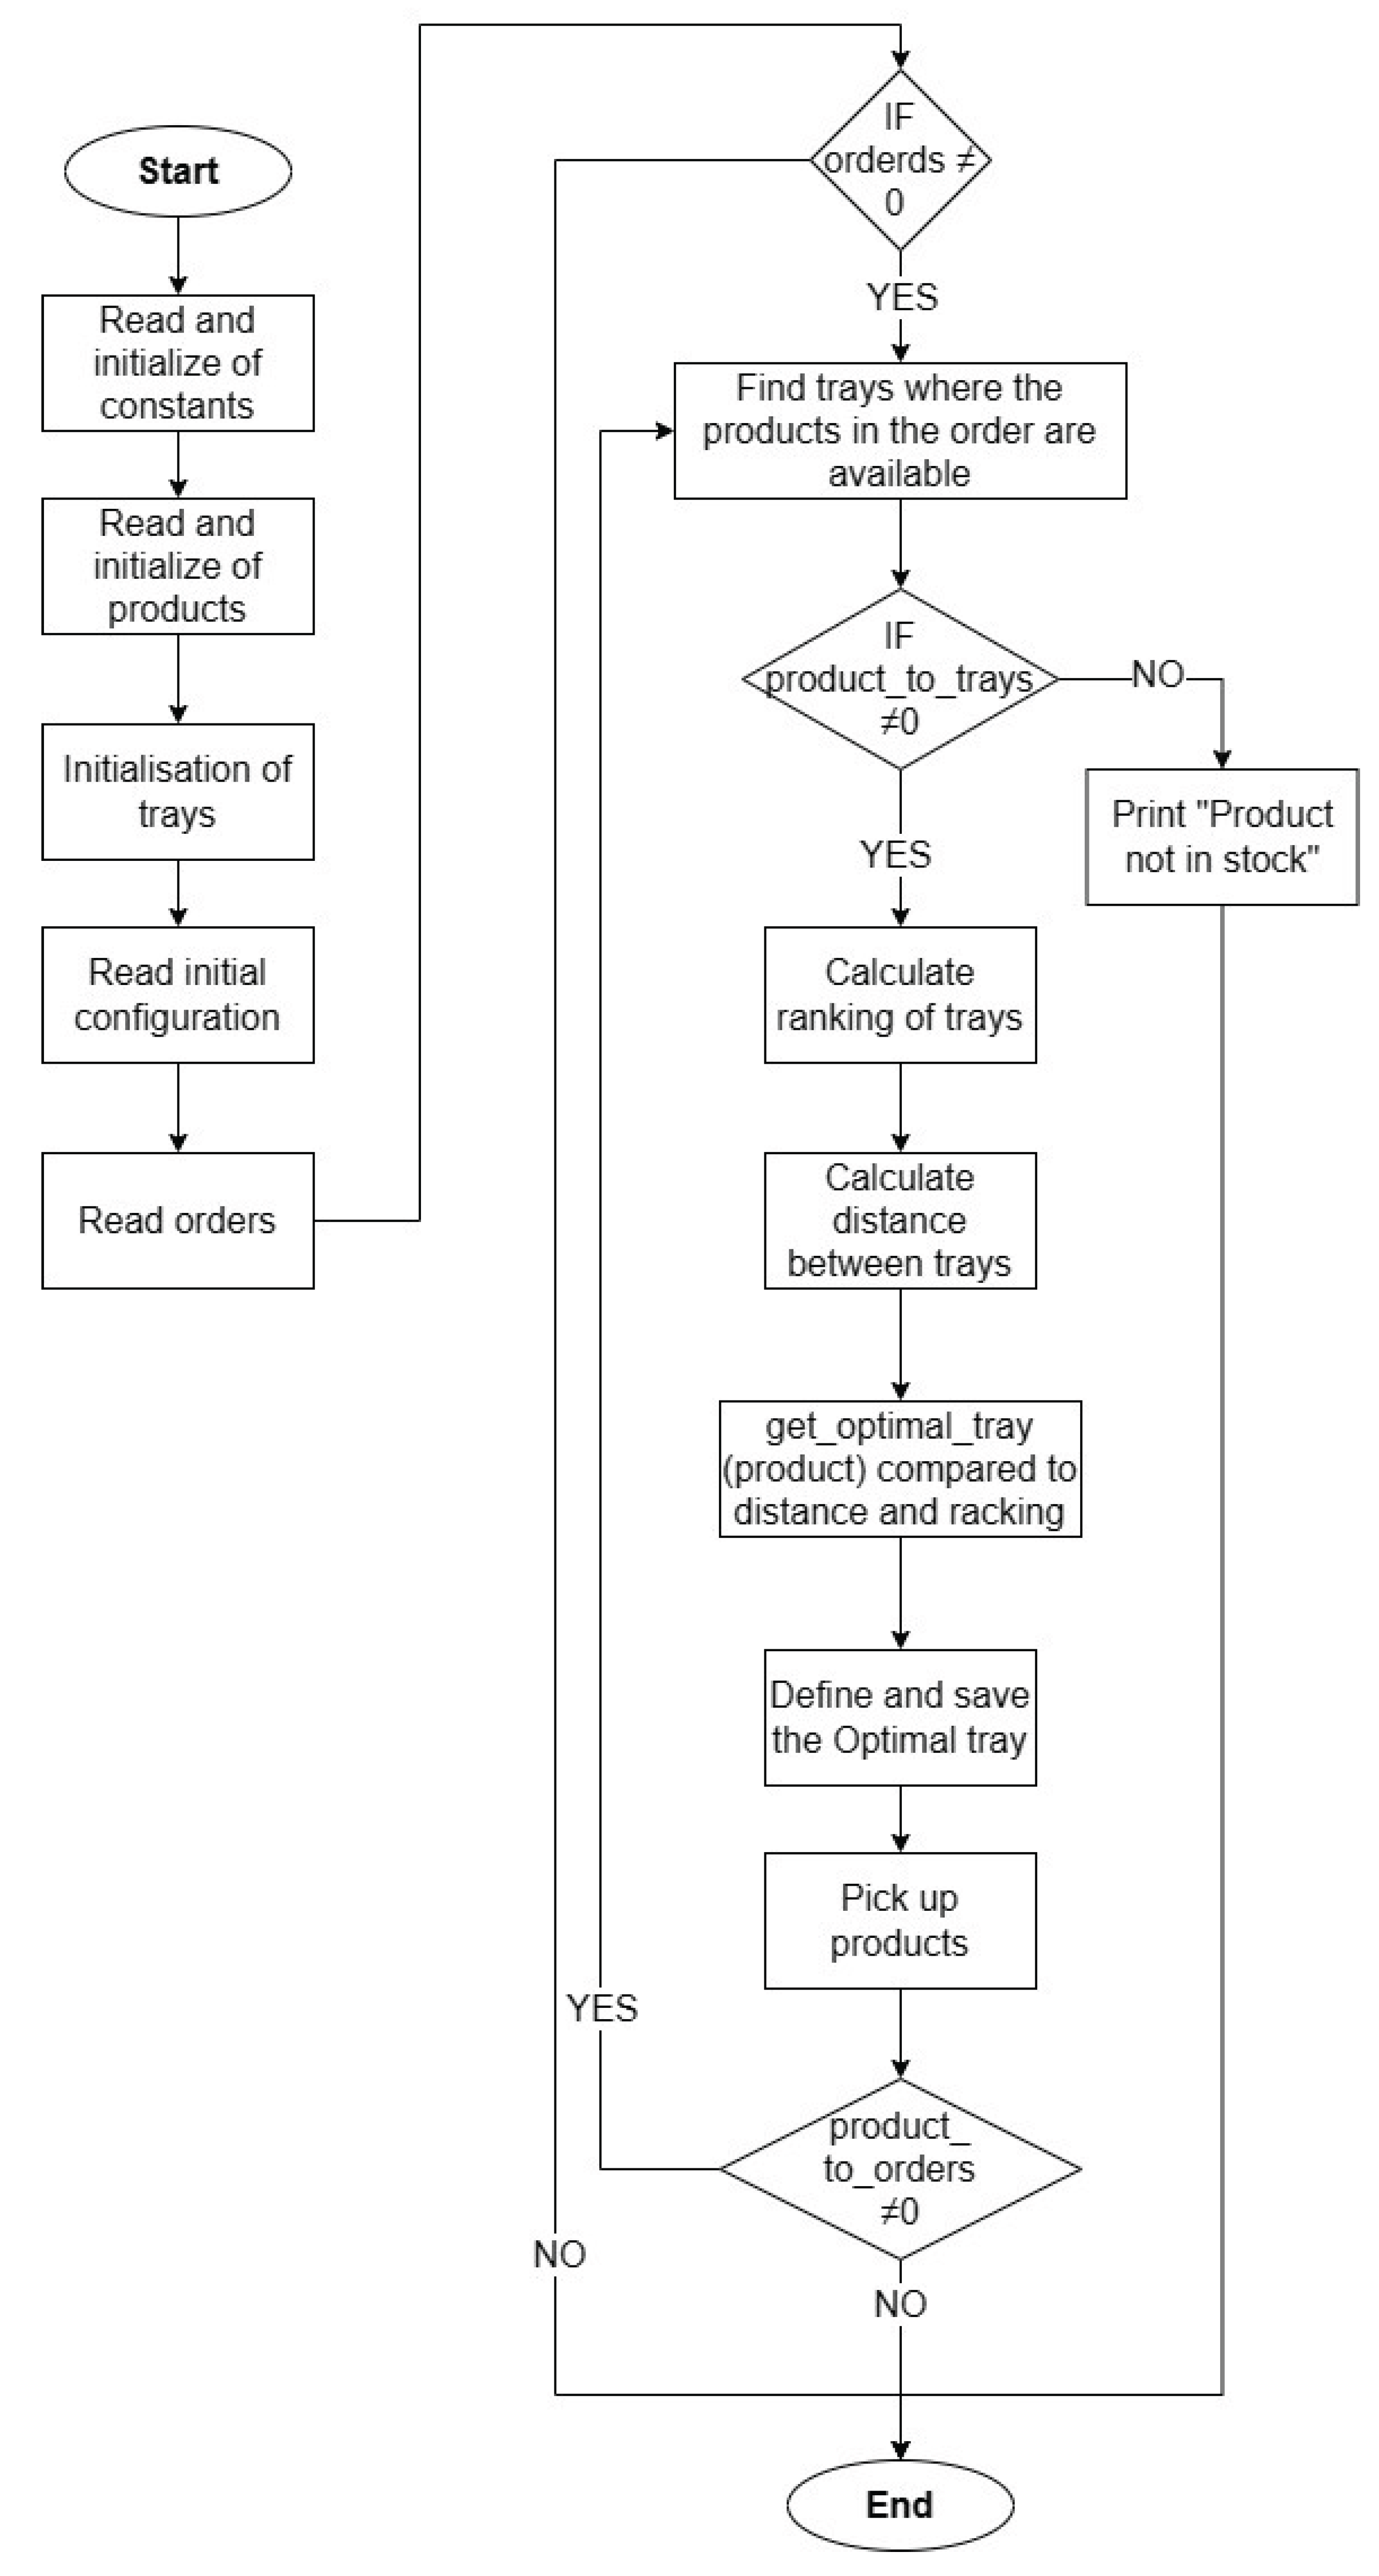
Figure 12.
Product Master Data UML
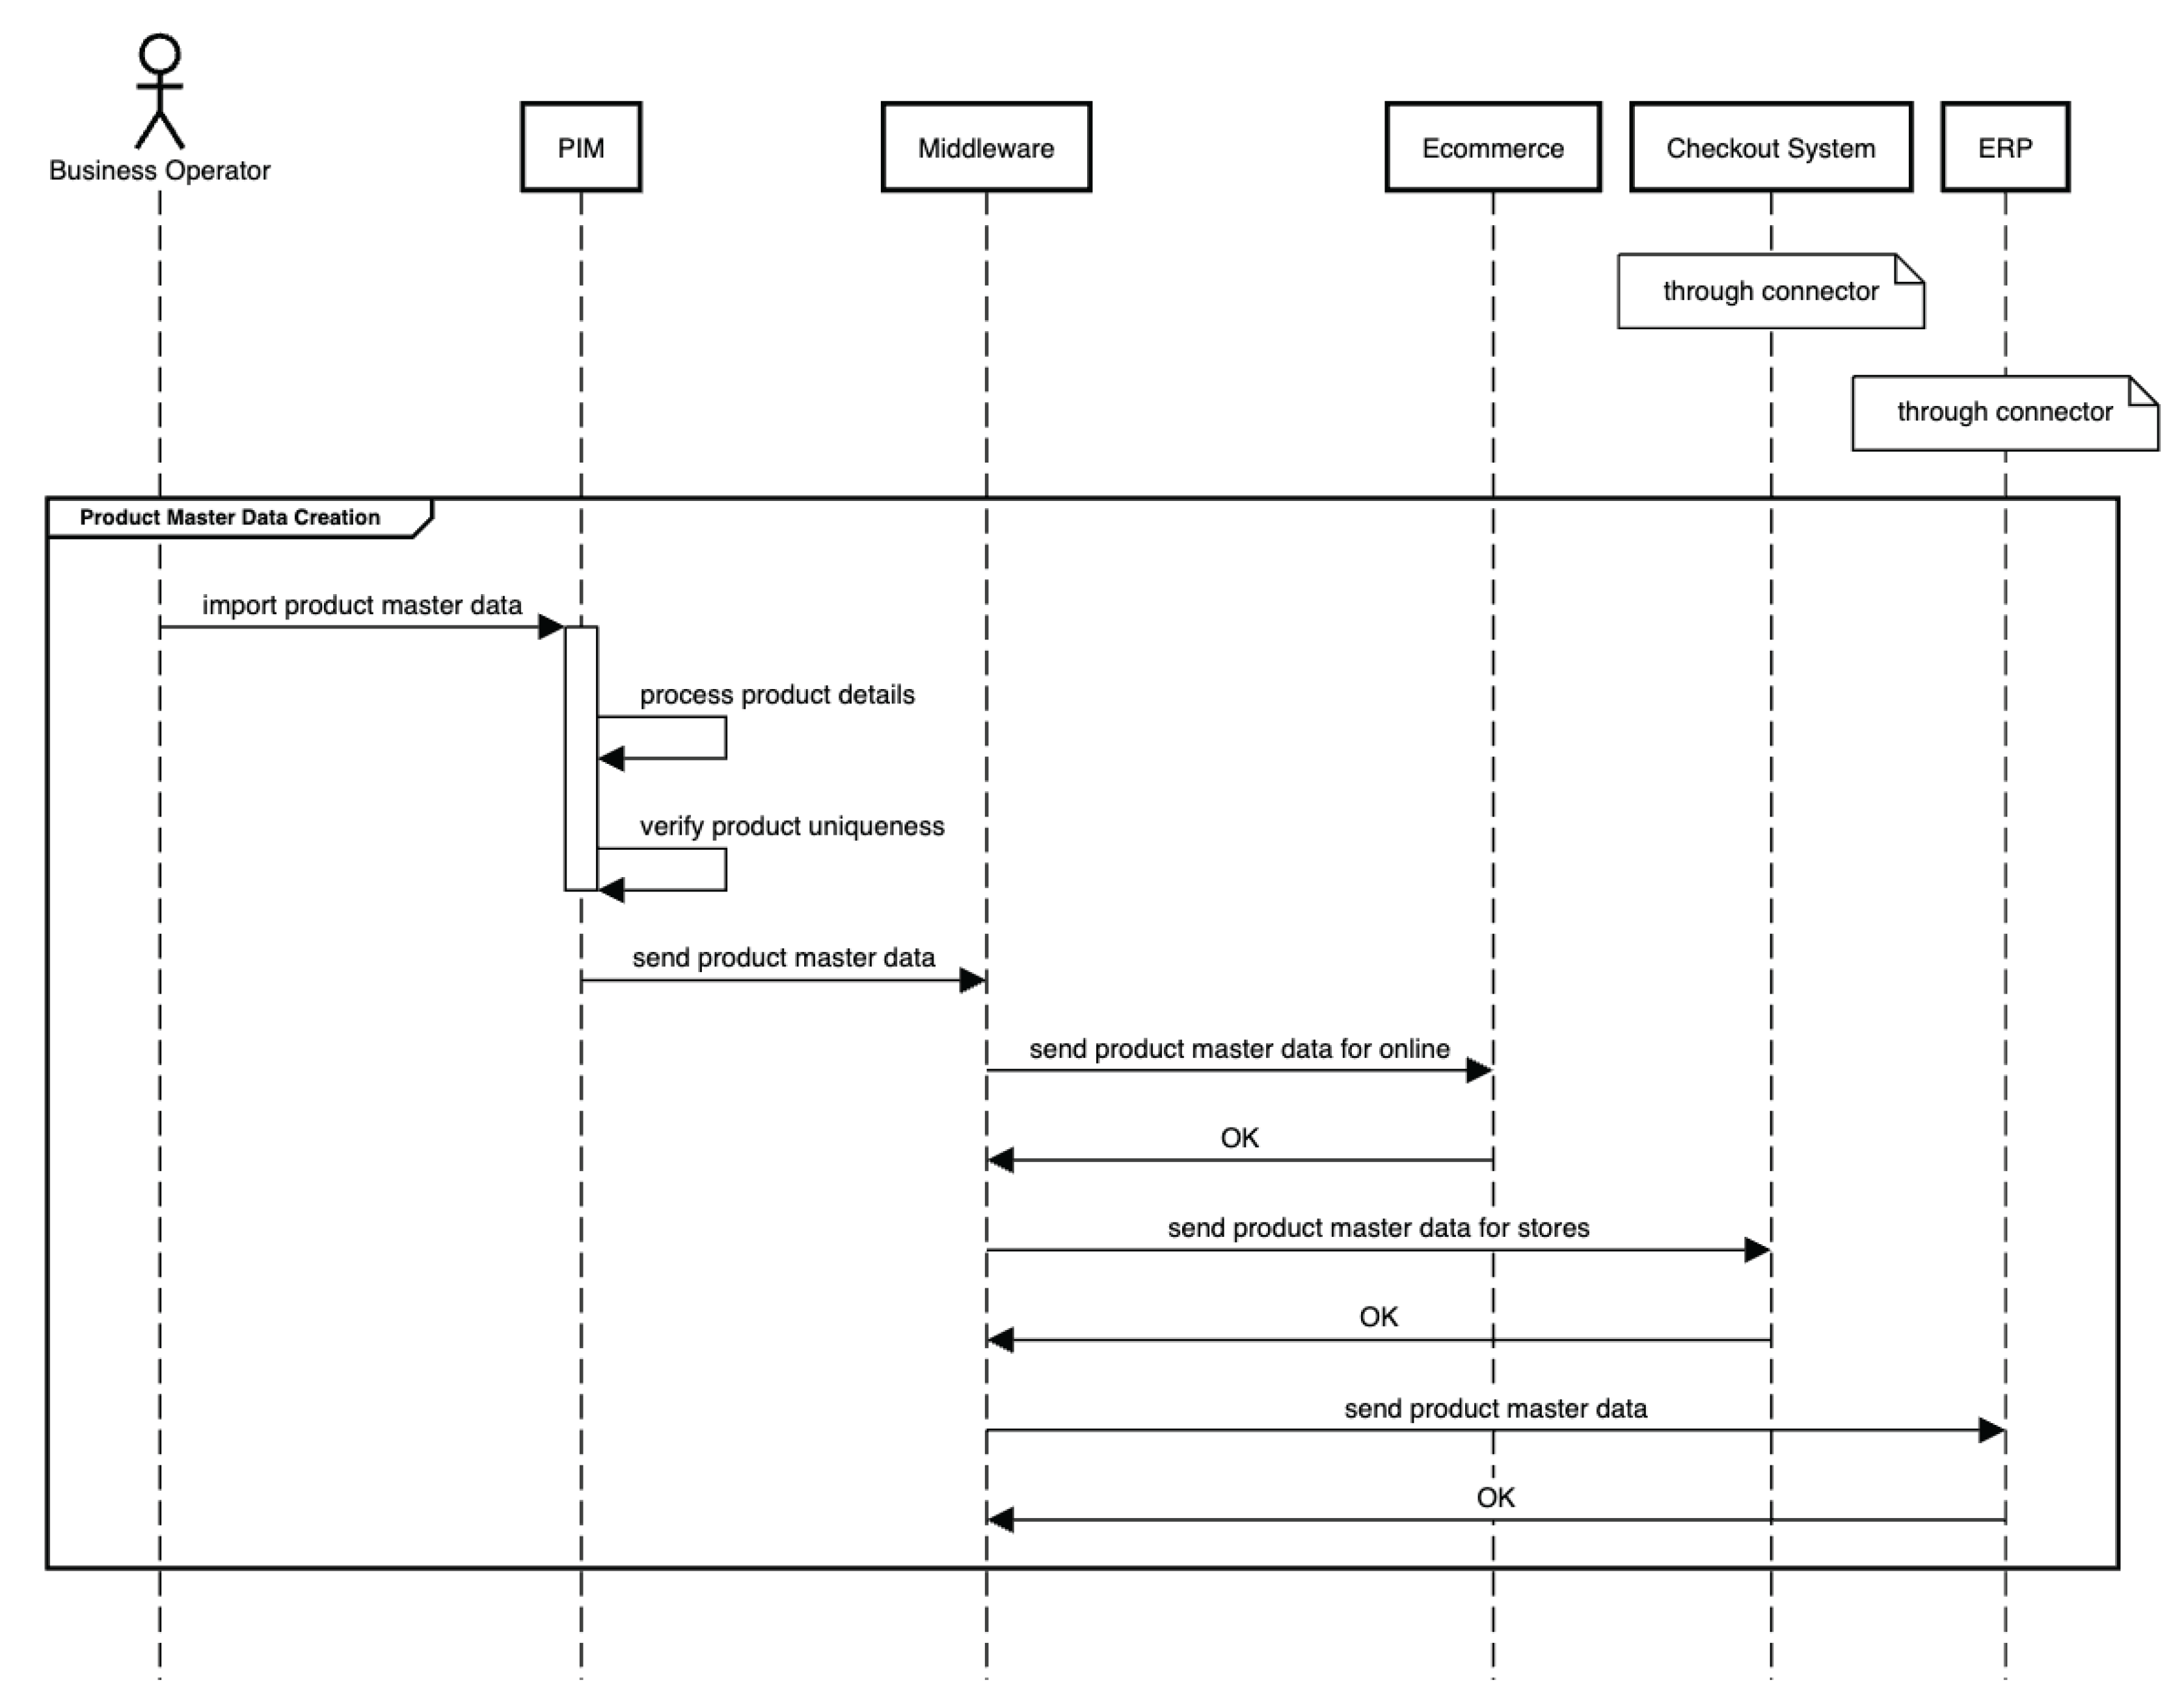
Figure 13.
Customer Master Data UML
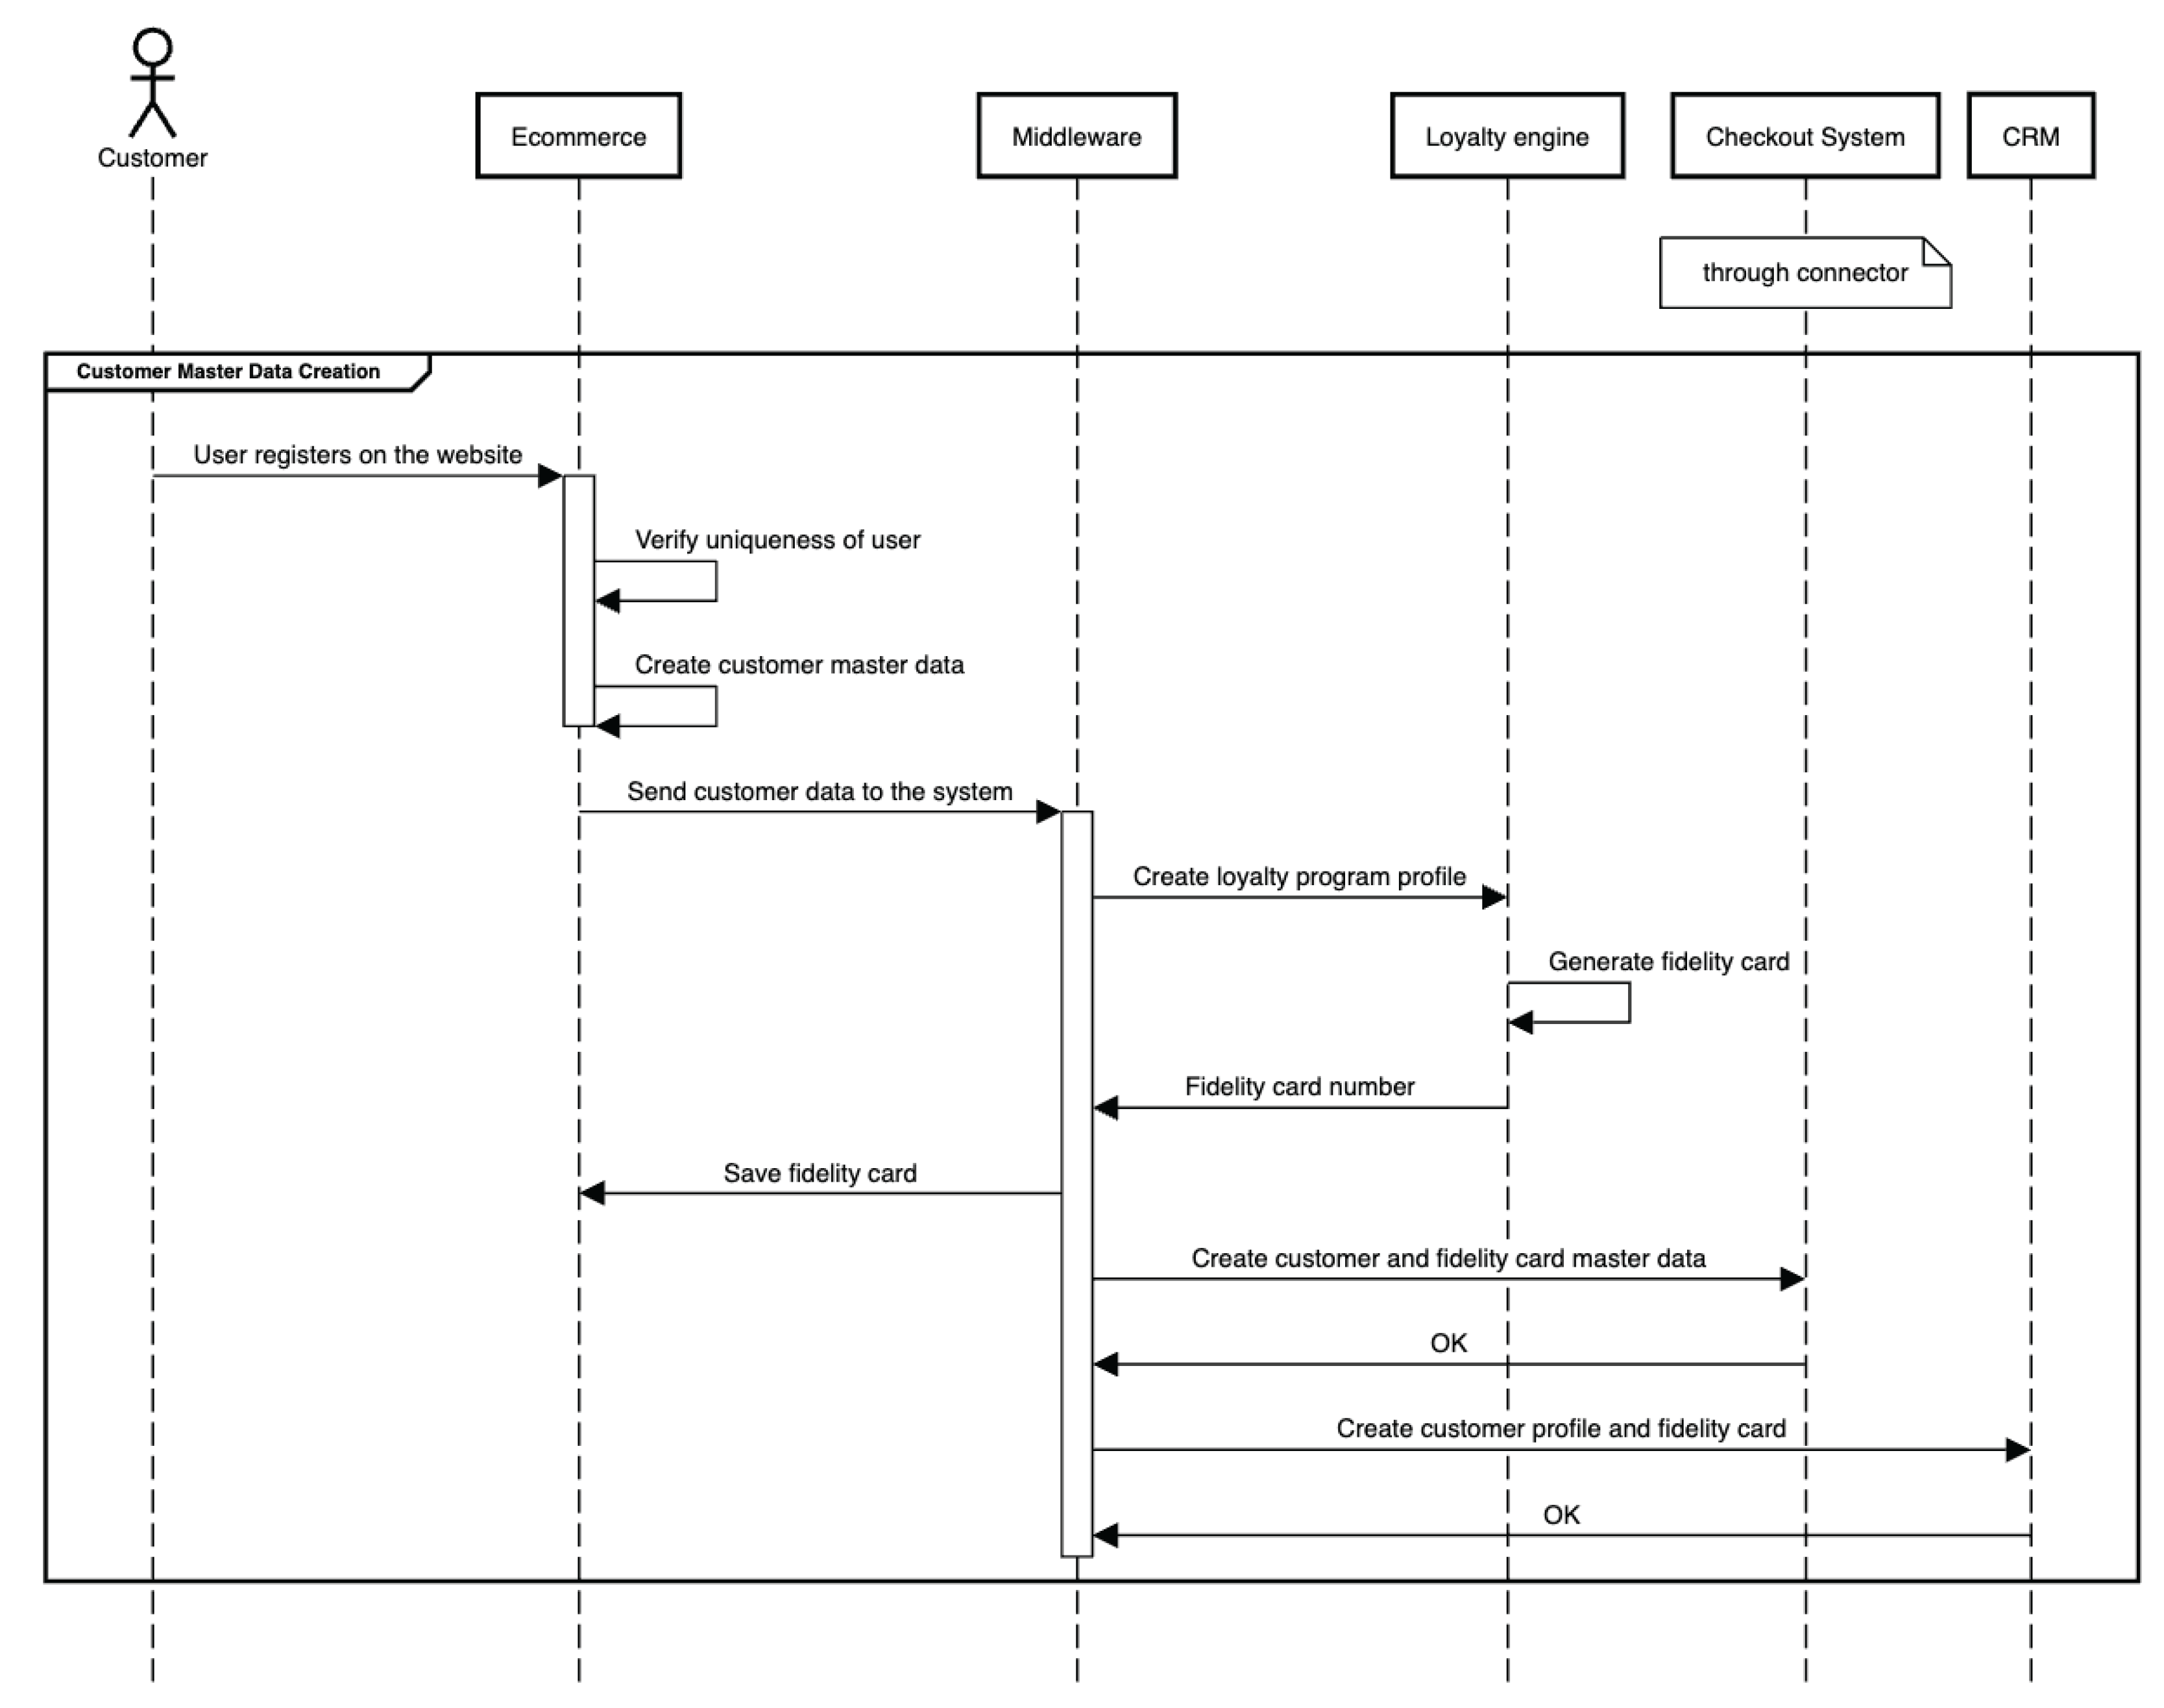
Figure 14.
Online Order Generation UML
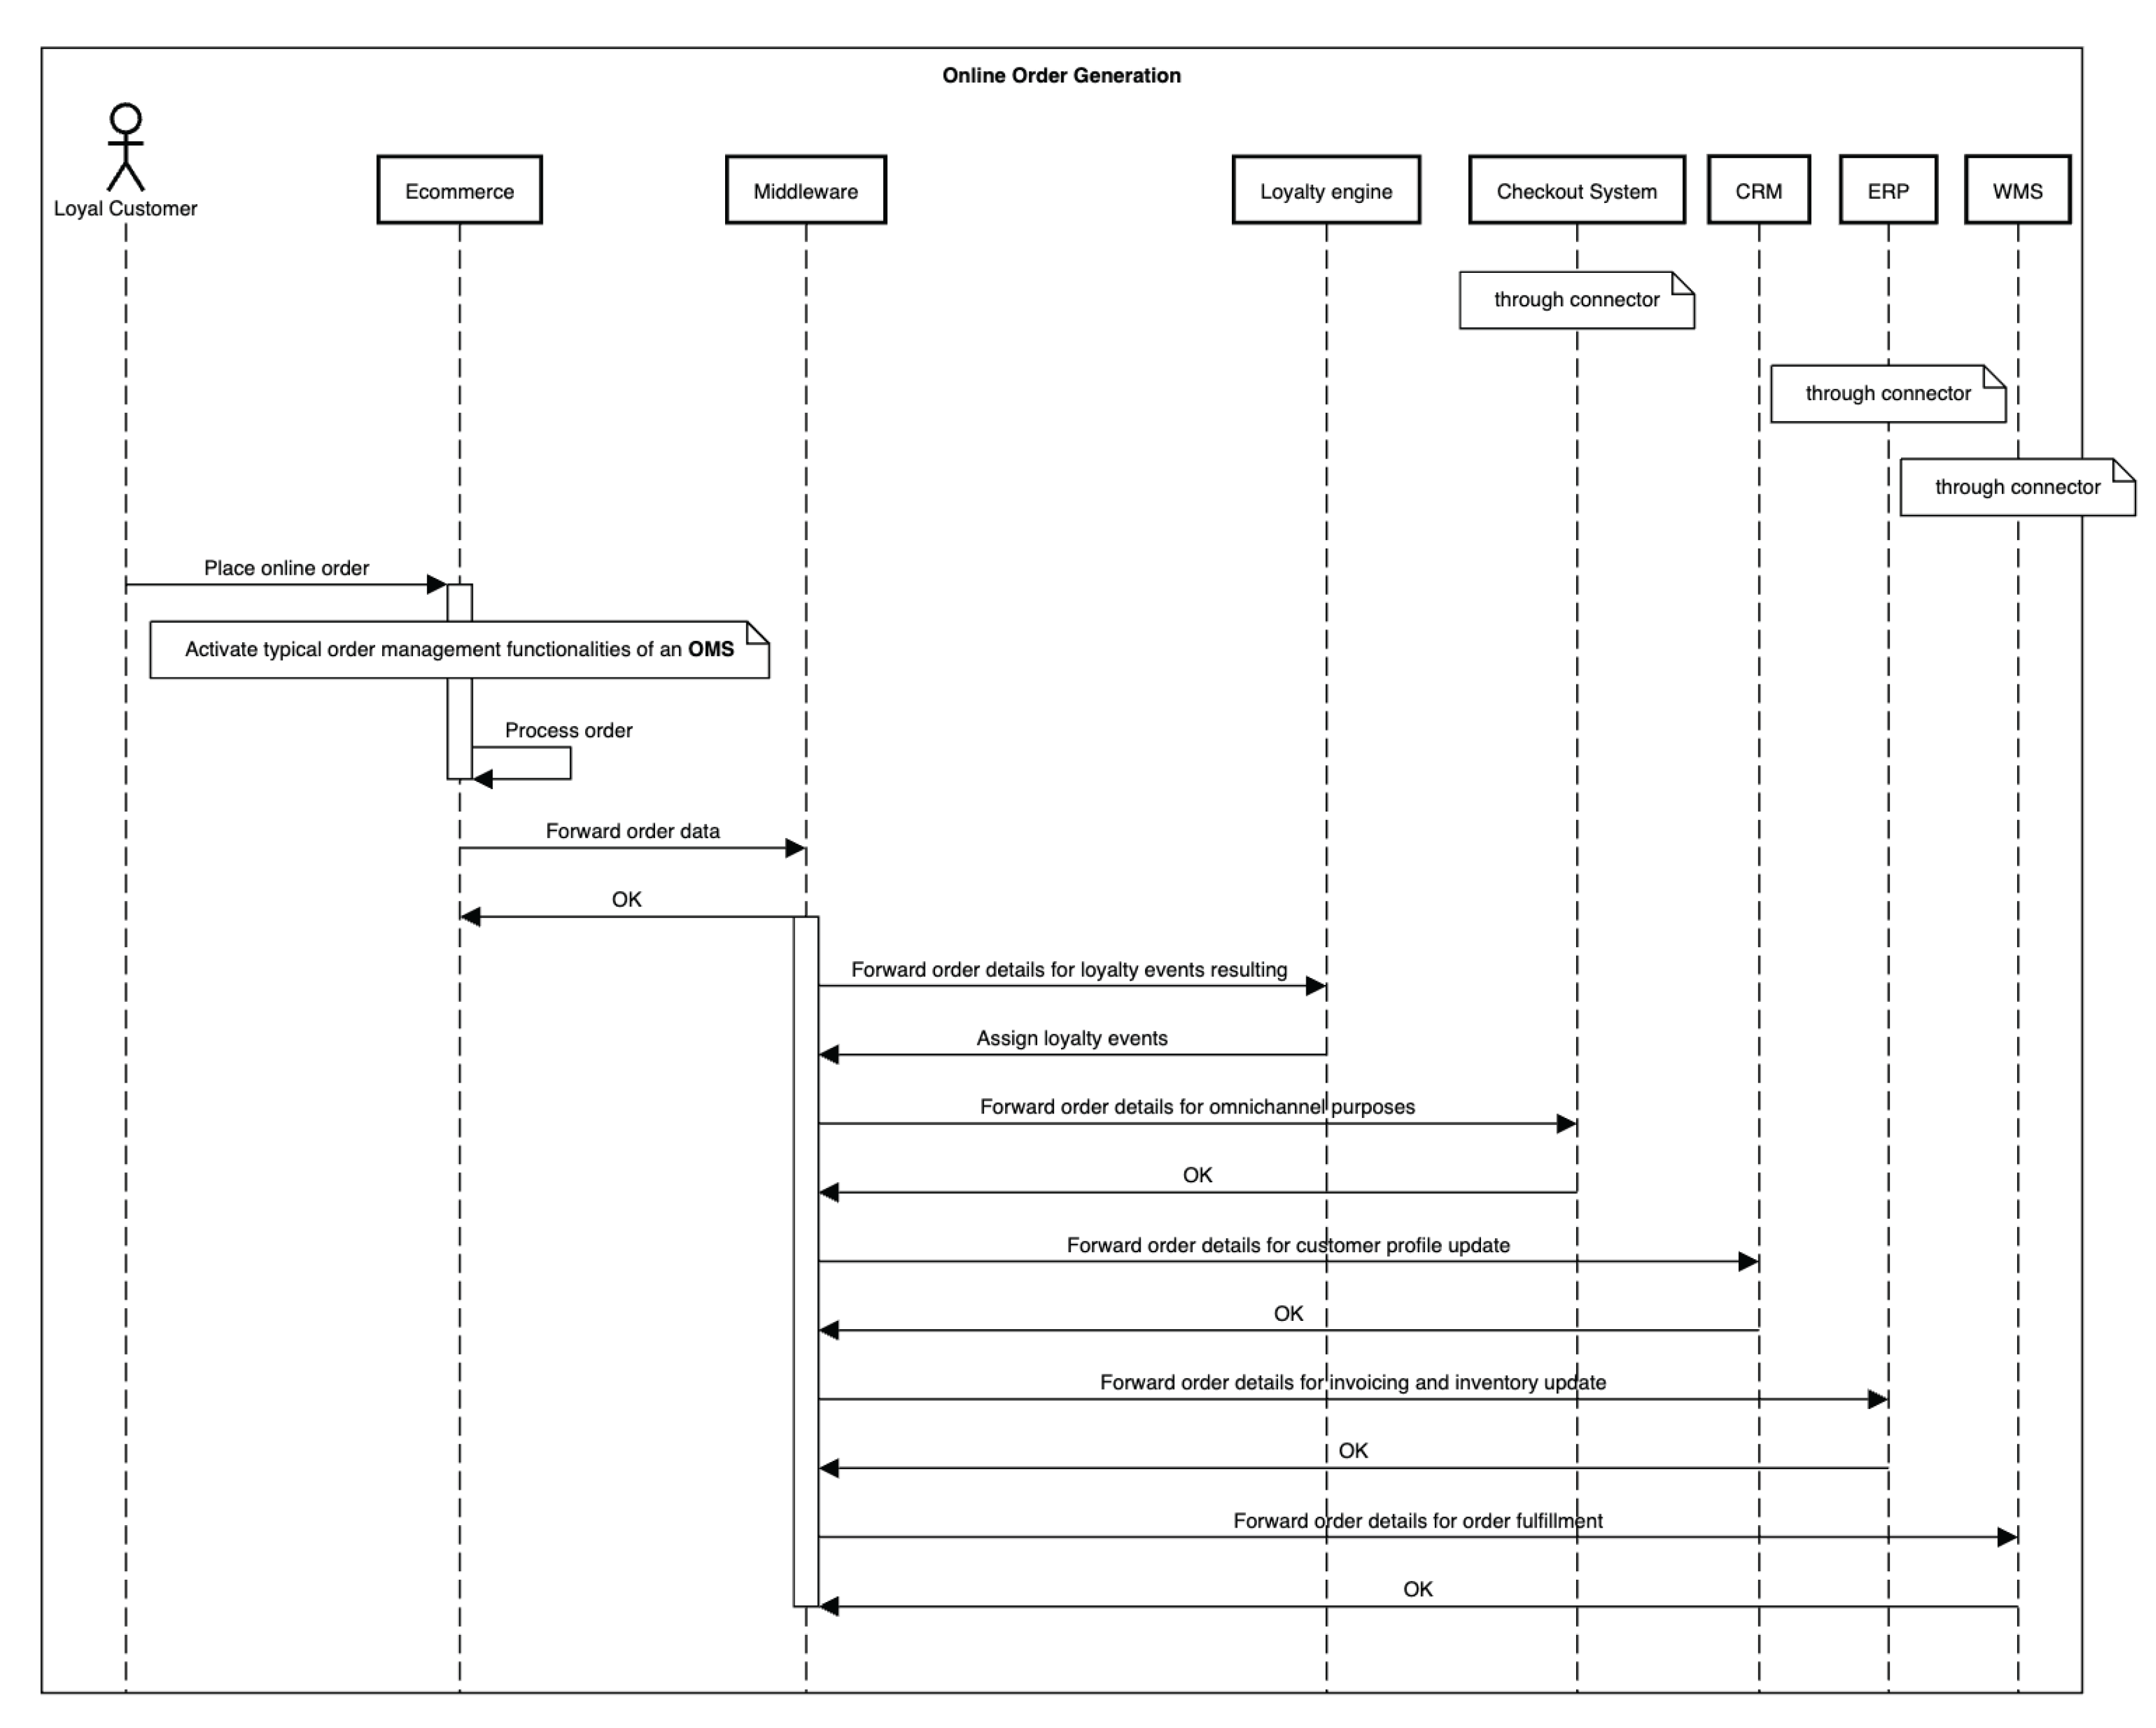
Figure 15.
Online order fulfillment UML.
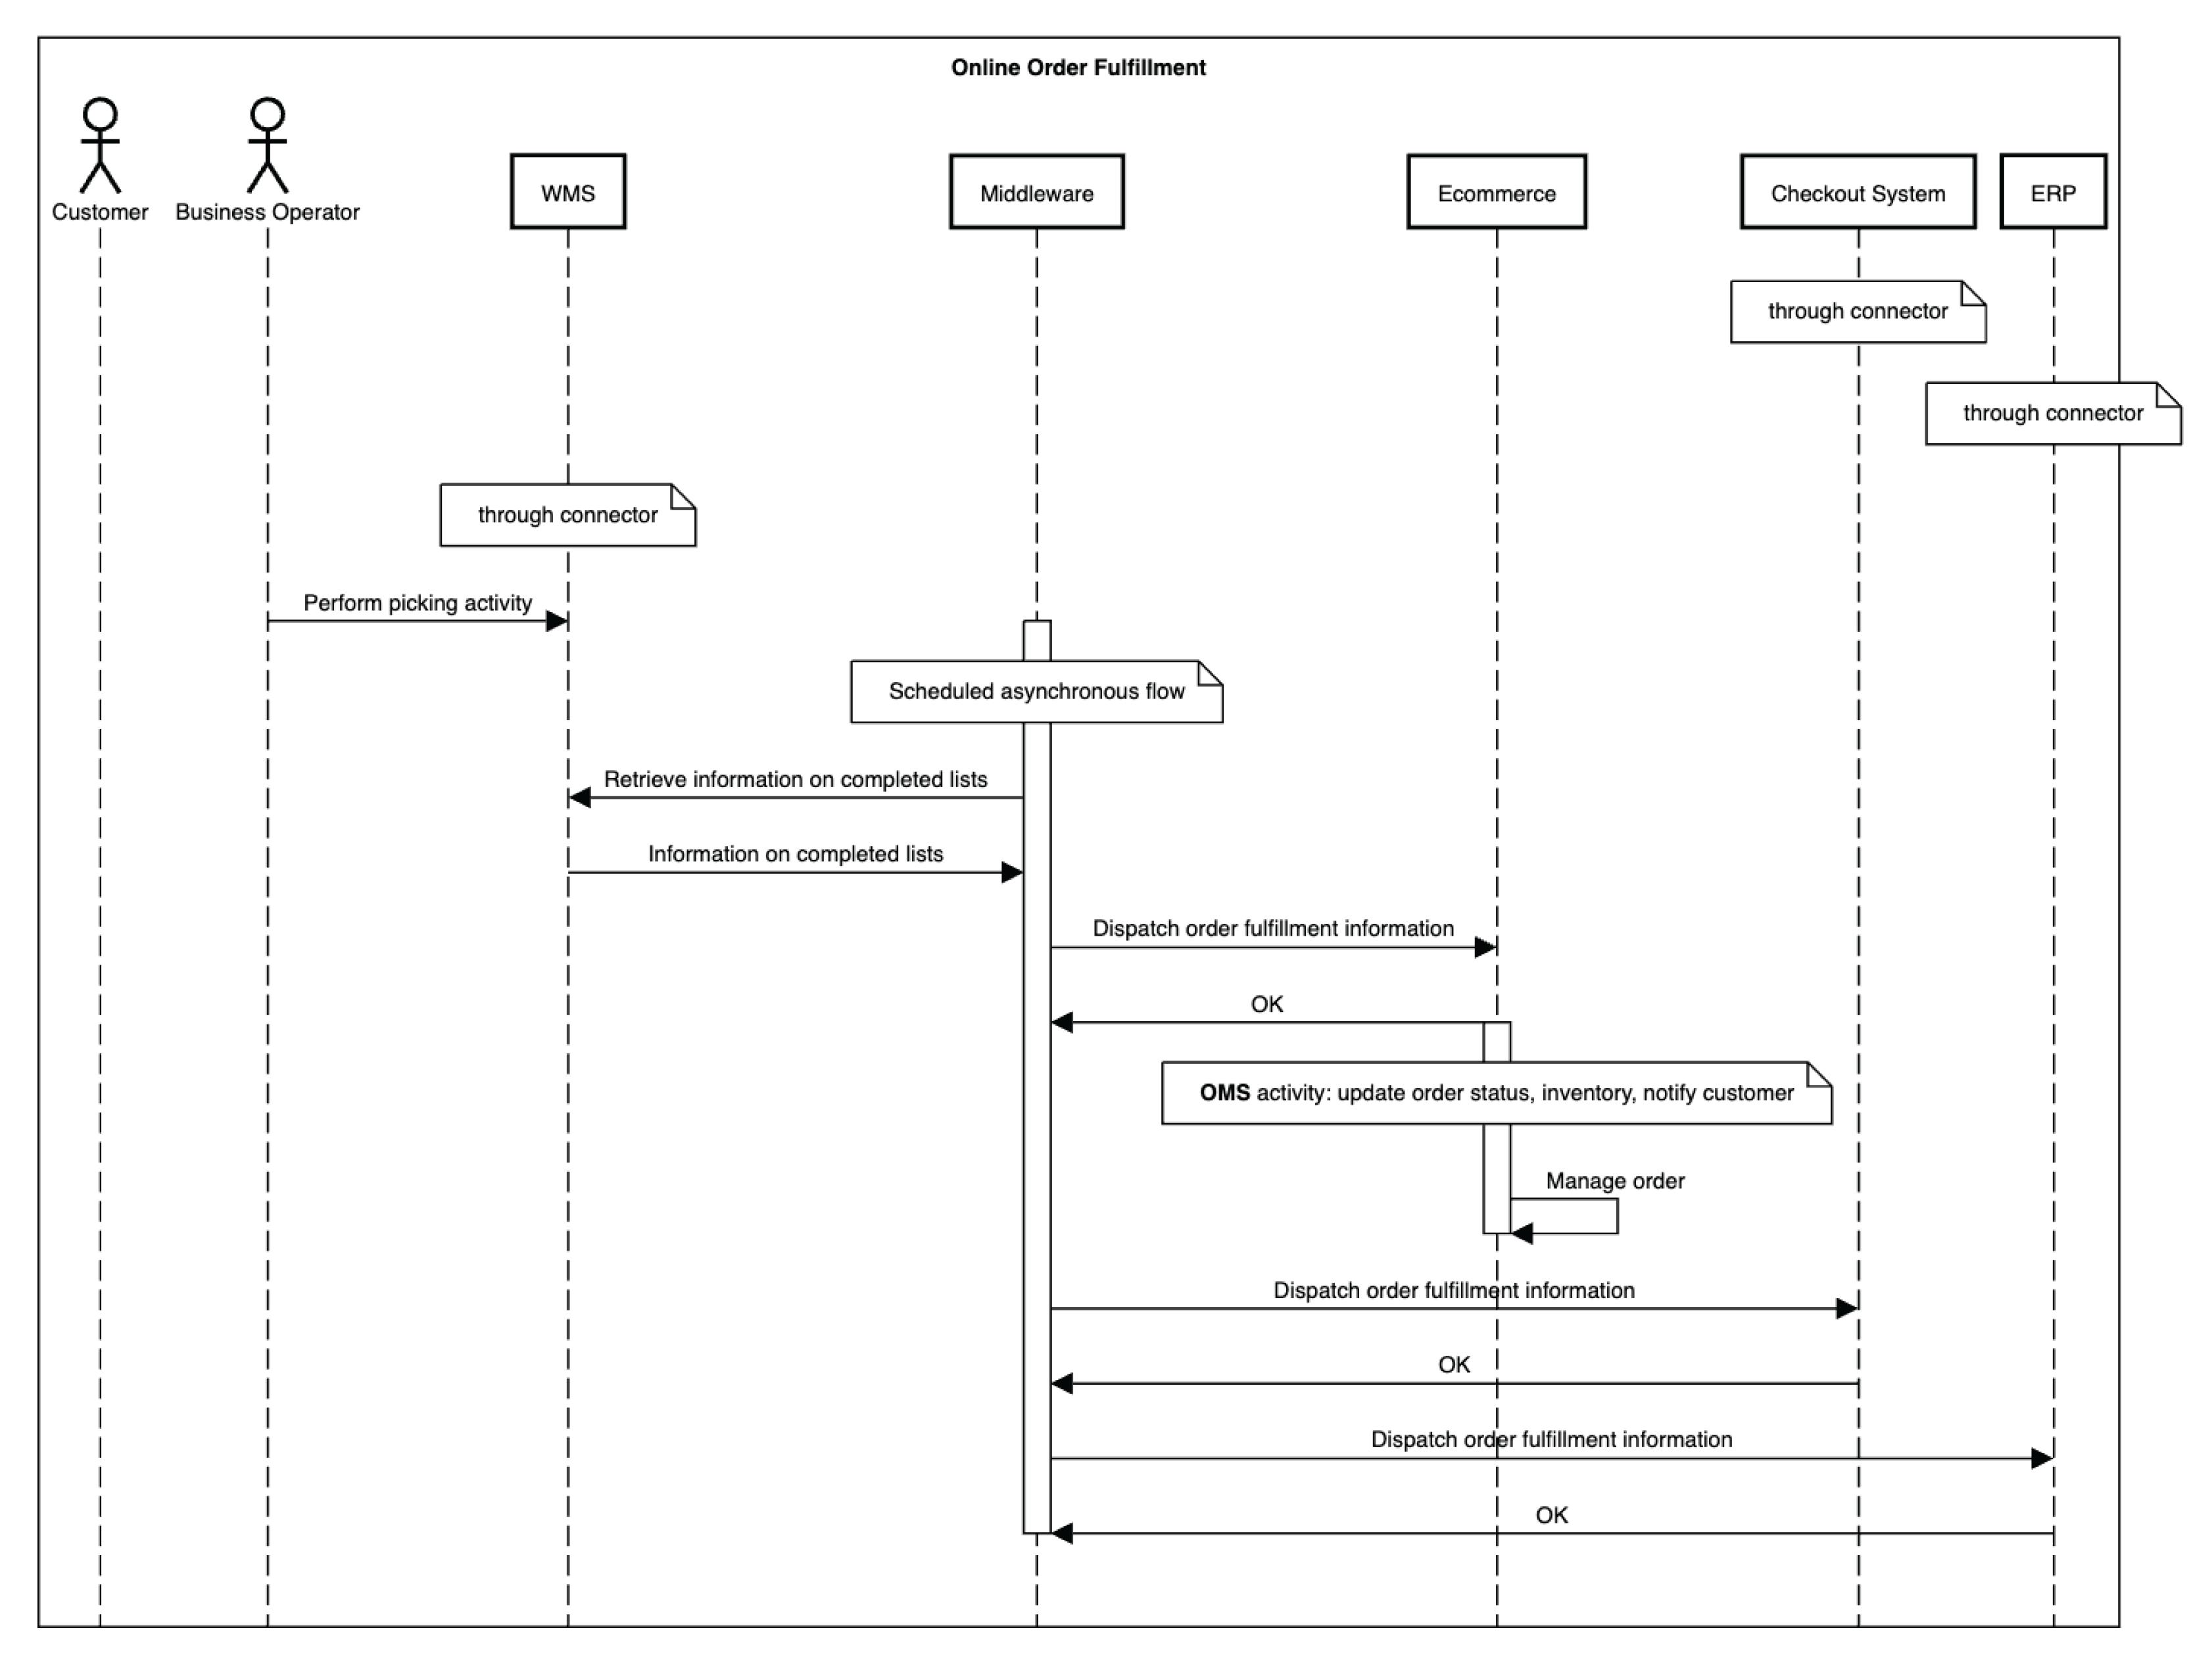
Figure 16.
Comparison of total times for the two solutions for each iteration.
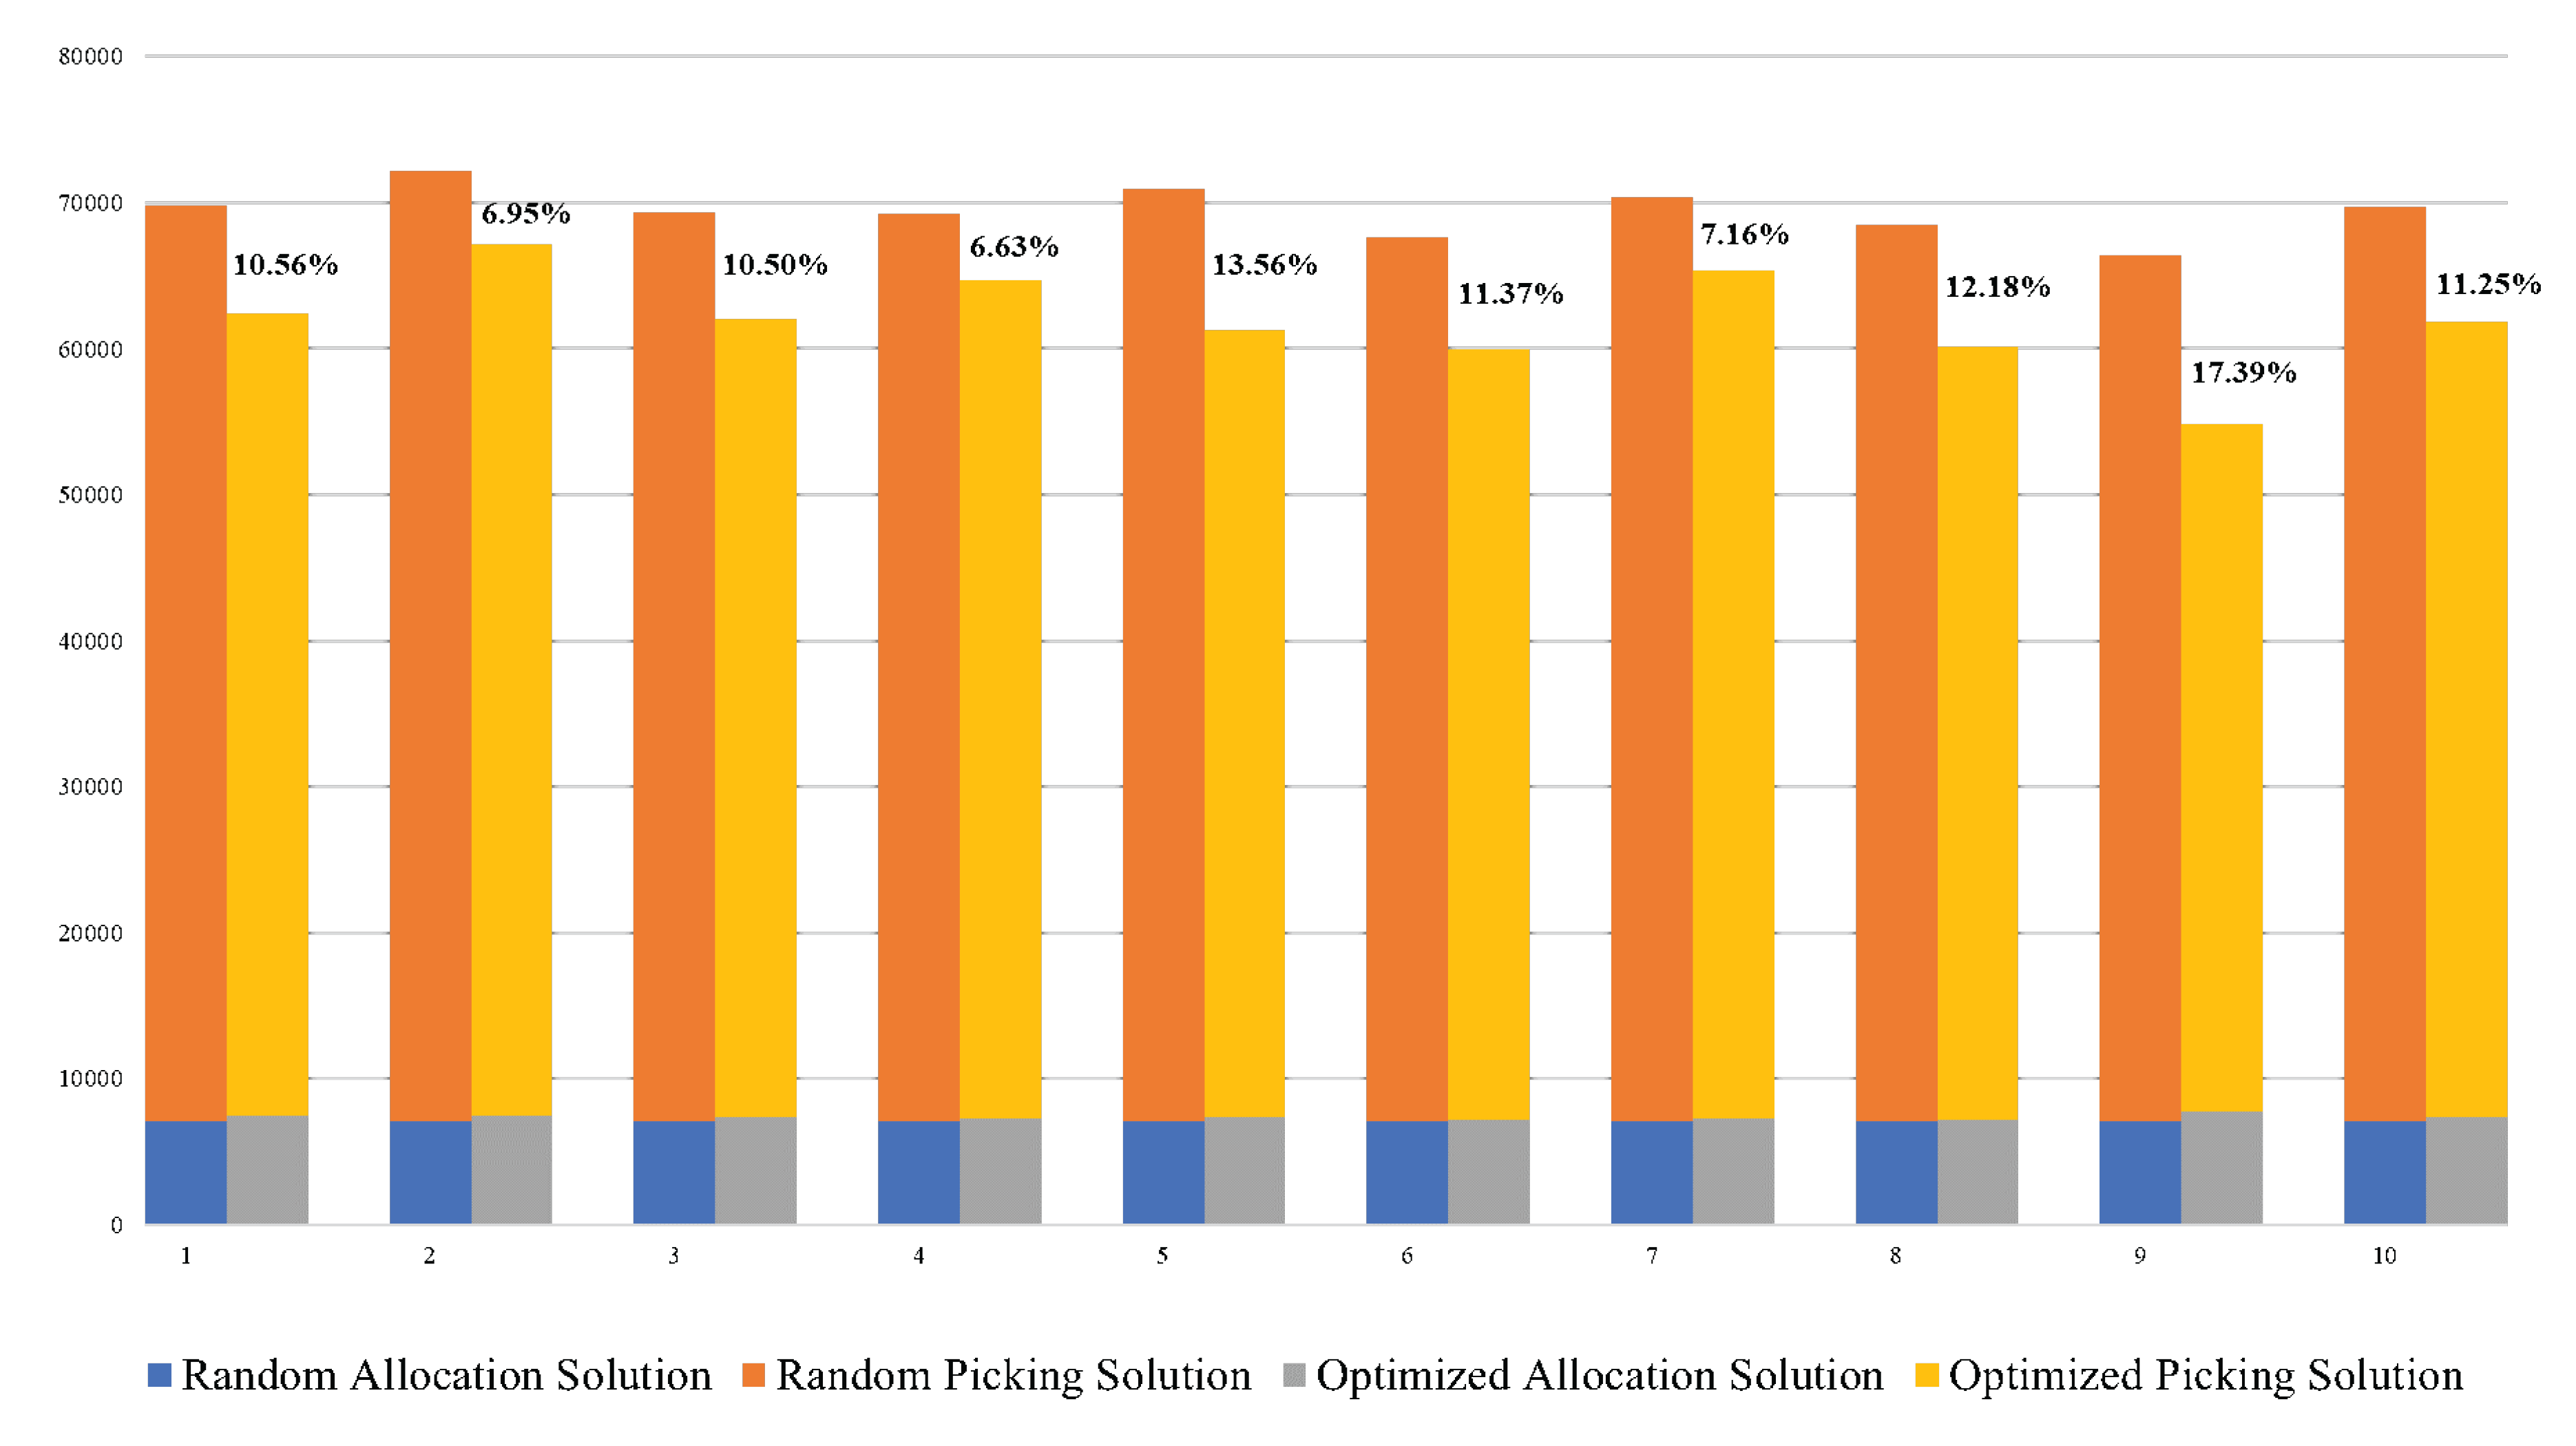

Table 1.
Products to be allocated.
| ID-product | Quantity |
|---|---|
| A | 70 |
| B | 90 |
| C | 100 |
| D | 80 |
| E | 70 |
| F | 40 |
| G | 100 |
| H | 90 |
| I | 6 |
| J | 50 |
| K | 40 |
| L | 120 |
| M | 150 |
Table 2.
Allocation times and picking times for the random solution.
| Iterations | Allocation time (sec) | Picking time (sec) |
|---|---|---|
| 1 | 7080 | 62675 |
| 2 | 7080 | 65115 |
| 3 | 7080 | 62280 |
| 4 | 7080 | 62175 |
| 5 | 7080 | 63850 |
| 6 | 7080 | 60535 |
| 7 | 7080 | 63310 |
| 8 | 7080 | 61420 |
| 9 | 7080 | 59320 |
| 10 | 7080 | 62600 |
Table 3.
Allocation times and picking times for the optimized solution.
| Iterations | Allocation time (sec) | Picking time (sec) |
|---|---|---|
| 1 | 7485 | 54905 |
| 2 | 7490 | 59685 |
| 3 | 7330 | 54750 |
| 4 | 7300 | 57360 |
| 5 | 7375 | 53935 |
| 6 | 7195 | 52735 |
| 7 | 7260 | 58090 |
| 8 | 7195 | 52960 |
| 9 | 7730 | 47125 |
| 10 | 7325 | 54515 |
Disclaimer/Publisher’s Note: The statements, opinions and data contained in all publications are solely those of the individual author(s) and contributor(s) and not of MDPI and/or the editor(s). MDPI and/or the editor(s) disclaim responsibility for any injury to people or property resulting from any ideas, methods, instructions or products referred to in the content. |
© 2024 by the authors. Licensee MDPI, Basel, Switzerland. This article is an open access article distributed under the terms and conditions of the Creative Commons Attribution (CC BY) license (http://creativecommons.org/licenses/by/4.0/).
Copyright: This open access article is published under a Creative Commons CC BY 4.0 license, which permit the free download, distribution, and reuse, provided that the author and preprint are cited in any reuse.


