
Submitted:
06 April 2024
Posted:
08 April 2024
You are already at the latest version
Abstract
This research aimed to synthesize Polyvinyl fluoride (PVDF) membranes and coat them with Tannic acid (TA) nanoparticles and Polyethylene glycol (PEG) additives so that the membrane's removal efficacy for humic acid (HA) pollutant from agricultural wastewater was investigated. Thus, six membranes with PEG:TA ratios of 0:0, 1:0, 0:1, 1:1, 4:1 and 1:4 were synthesized. Then the membranes' characteristics were identified by FT-IR ATR, FESEM, and AFM analysis, and HA's particle size and zeta potential were also investigated. Based on optimizing effective parameters, the operating pressure of 1.5 bar and HA concentration of 80 ppm were selected as optimal values. The membrane with PEG:TA=4:1, as the optimally modified membrane, had a pure water flux of 446.03 L/m2.h, effluent flux of 72.43 L/m2.h and pollutant removal rate of 86.62% at pH=7 After 60 min had passed. These values for the pristine membrane (PEG:TA=0:0) were 265.64 L/m2.h, 89.39 L/m2.h, and 75.59%, respectively. The results showed that although the effluent flux was lower in the optimized modified membrane than in the pristine membrane, HA removal percentage was increased.
Keywords:
wastewater treatment
; tannic acid coating
; polyvinylidene fluoride membrane
; hydrophilicity
; Humic acid separation.
1. Introduction
Humic acid (HA) with carbonyl, quinone, carboxyl, and hydroxyl functional groups in aromatic and organic ring frameworks, as one of the main components of organic substances soluble in natural waters, plays an influential role in improving soil fertility. However, its presence in the environment due to the formation of HA-metal complex ions leads to the displacement of the metal during diffusion in the soil [1,2]. Also, the conventional treatment of water contaminated with HA causes chlorine to interact with HA, producing a series of carcinogenic substances for humans. Therefore, it is necessary to remove HA before the chlorination process in wastewater treatment plants. Among several purification methods, including coagulation, electrocoagulation, flotation, oxidation, and membrane separation, membrane separation acts as an innovative technology to separate water from pollutants such as water/oil mixture, microorganisms, proteins, and humic substances [3,4], and advantages such as compact design, easy operation, environmental friendliness, low energy consumption, no need for chemicals, selectivity, and operation at room temperature have increased this process in recent decades [5,6]. However, fouling and, consequently, the high operating cost of the membrane is a subject that deserves discussion, and much research has been done on it. In fact, when the membrane surface is contaminated, not only does it reduce the flux, but it also increases the operation and maintenance costs [7]. Improving the characteristics of the membrane surface with a hydrophilic modifier (including polymer materials and inorganic nanoparticles) can significantly increase the anti-fouling performance of the membrane. Hydrophilic polymers such as polyvinyl alcohol, Polyethylene glycol (PEG) derivatives, and zwitterionic polymers have been used to increase membrane flux and reduce membrane fouling [8].
Polyvinyl fluoride (PVDF) membrane is known as the most widely used material among all existing polymeric membranes due to its outstanding properties. Nevertheless, PVDF polymer has a profoundly high fouling due to its inherent hydrophobic property. Therefore, various techniques have been reported to make the membrane surface hydrophilic, including mixing hydrophilic polymers or embedding inorganic nanoparticles, chemical modification, and stabilization of Polymers with hydrophilic moieties on the surface of membranes by coating [9,10,11].
Tannic acid (TA) is a low-cost, safe, and environmentally friendly polyphenol extracted from plants, such as tea leaves, oak wood, nettle, and Chinese gall. HA has anti-carcinogenic, anti-mutagenic, and antioxidant properties with the ability to form macromolecules and metal ions and is widely used as a coagulant or polymeric coagulant for water and cationic dyes purification [12,13]. PEG is also a polyether with two functional groups, hydroxyl, and ether, which consists of repeated units of ethylene glycol [-(CH2CH2O)n] and is known as macrogol as well [14].
Much research has been done on PVDF polymeric membranes integrated with nanoparticles such as TA, graphene oxide (GO), and Titanium dioxide (TiO2) to remove various pollutants; some examples are mentioned below. In Zhao et al.'s (2019) studies, a PVDF membrane was coated with graphene oxide nanoparticles, which caused water permeability to be reduced from 1845 L/m2.h to 375 L/m2.h, hydrophilicity, and negative surface area to be increased from -23.4 to -46.8 (the water contact angle was reduced from 73° to 56°) [15]. In the research of Li et al. (2019), PVDF membrane coating was done by TA nanoparticles and polyvinyl pyrrolidone additive, which increased pure water flux (>16000 L/m2.h), anti-fouling properties (FRR>99.5% and emulsion rejection>99%) and hydrophilicity (54°) in the modified membrane [16]. In the studies of Teow et al. (2020), the PVDF X500 TiO2 membrane was presented for the removal of HA due to its smooth surface and reactive surface layer, good anti-fouling properties (FRR=78.24%) and initial water flux of 58.81 L/m2.h [17]. In the research of Jiang et al. (2021), with a single-step coating of HA/sodium periodate solution on the PVDF hydrophobic membrane, increased permeability flux (>2400 LMH/bar) and oil removal >98% for the Hydrophilic and underwater superoleophobic modified PVDF membrane (water contact angle reduction from 121 to 32) was observed [18]. Sun et al. (2021) coated dopamine on PVDF/TiO2 membrane and observed high removal efficiency (99%) and permeate flux (1389 L/m2.h) for oily wastewater [19]. According to the research of Karimi et al. (2021), the synthesis of PVDF membrane and its modification by Cu2S 0.2wt% to remove reactive blue dye was obtained, which had a high water flux of 248.25 L/m2.h and FRR=92.4% [20]. Yan et al. (2022) coated the hydrogel on the PVDF membrane surface, which reduced the oil pollutant fouling on the membrane surface. Also, pure water flux increased by 214%, permeability increased by 127%, and oil recovery was observed by 99.6% [21]. Recently, Ren et al. (2022), by surface modification of PVDF membrane with propyl sulfated chitosan, witnessed high hydrophilicity (39°) and anti-fouling properties (FRR=90.4%) after two cycles [22]. In the studies of Abdulazeez et al. (2023), a PVDF membrane was incorporated with iron in order to remove oil. It indeed increased the pure water permeance from 59.9 L/m2.h in the pristine membrane to 300.5 L/m2.h, and oil rejection was more than 99% [23].
In this research, the surface modification of the PVDF pristine membrane was done by coating TA nanoparticles and PEG additives to remove HA. TA and PEG are both environmentally friendly and non-toxic, able to form hydrogen bonds. In this vein, the -OH present in TA communicate with the -O- present in PEG and form a hydrogen bond, which, by coating the membrane surface, improves the anti-fouling properties of the membrane, hydrophilicity, and permeability flux of pure water. Effective parameters in the test include operating pressure (0.5, 1, 1.5, 1.8, and 2 bar), pollutant concentration (30, 50, 80, and 100 ppm), PEG: TA ratio (0:0, 1: 0, 0:1, 4:1, and 1:4) and pH (5, 7 and 9) were optimized. Also, the separation performance and removal efficiency, membrane properties, morphology, roughness, hydrophilicity, and membrane anti-fouling properties were investigated in detail.
2. Experimental
2.1. Materials
HA was purchased from Sigma-Aldrich to prepare synthetic wastewater. PVDF polymer and dimethylformamide (DMF) solvent for membrane synthesis and TA, PEG 4000, DMAc solvent, and ethanol for membrane surface modification were obtained from Merck. HCl and NaOH, obtained from Merck, were used for pH adjustment. Deionized water was used in all stages of the research.
2.2. Synthesis of PVDF Polymeric Membrane
The membrane synthesis was done by the phase inversion method [24]; initially, 16%wt PVDF polymer and DMF solvent in a wholly sealed McCarthy glass were stirred in a stirrer for 20 hr and at a temperature of 50 °C. Then, to remove the homogeneous solution air bubbles, it was placed in a vacuum oven for 5 hr at room temperature. In the next step, a layer of the solution with a thickness of 180 micrometers was drawn on the polyester paper by a manual film puller. After 30 seconds, it was immersed in the coagulation bath of distilled water for 24 hr, and in this regard, the phase inversion between solvent and non-solvent occurred. In the last step, it was dried between filter paper in a clean environment.
2.3. PVDF UF Membrane Modification
At first, the synthesized PVDF membranes were cut in a circular shape with a diameter of 5 cm, according to the membrane cells in the membrane filtration system. They were immersed in ethanol solution for 30 min and kept in deionized water until use. Simultaneously, DMAc and deionized water were poured into a beaker to form a solvent formulation. Then TA nanoparticles and PEG additive were added to the solvent with different weight percentages, stirred for 30 min in a stirrer at 25 °C using a magnet, and brought to pH=8.5. Then the membranes were placed in a container containing this solution for 14 hr at room temperature and finally washed several times with deionized water to clean the impurities on the surface [16].
2.4. Membrane Characterization
Fourier transform infrared spectroscopy (FTIR-ATR) (PerkinElmer Frontier model) was performed to identify the functional groups on the surface of the membranes. Membrane morphology and roughness were respectively identified by scanning electron microscope TESCAN model manufactured by Mira 3-XMU company and atomic force microscope manufactured by NT-MDT company and model TS-150. EDS spectroscopic analysis was used by scanning electron microscope TESCAN model manufactured by Mira 3-XMU company to observe the elements on the surface of the membrane. The water contact angle test (manufactured by CAG-20 company, Jikan model) was performed to determine the hydrophilicity of the membrane surface. As a matter of fact, for its measurement, the membrane was placed on a smooth surface. Water drops with a volume of approximately ten microliters was released on the membrane's surface, and photos were taken after reaching the equilibrium state. For each sample, the average contact angle at different points was considered. A dynamic light scattering device manufactured by Horiba Jobin Jyovin company, the SZ-100z model, was used to measure the particle size and zeta potential of HA particles. The porosity and average diameter of membrane pores were obtained to identify the effect of additives and nanoparticles on membrane morphology and permeability.
To obtain the porosity of the membranes, the wet and dry weight of a specific area of each membrane after 24 hr of staying in deionized water and oven at 60 °C, respectively, were measured and obtained according to equation (1) [25]. Due to the small number of nanoparticles, the insignificant effect of its density was ignored in the calculation of the membrane density, and only the density of water was considered.
According to equation (2), Gorot Leford-Ferry equation, the average pore diameter was estimated [26].
where η is the water viscosity (8.9*10-4 Pa.s), Q is the water flow rate (m3/s), P is the applied pressure (Pa), and Dm is the average diameter of the pore.
2.5. Preparation of Synthetic Wastewater and Determination of Effective Parameters
First, 1 gr of HA pollutant (C9H9NO6) was dried at 105 °C for 2 hr to prepare synthetic wastewater. Then, it was dissolved in 100 ml of 0.1 M NaOH, made up to volume with deionized water, and placed on the stirrer for 4 hr. Then it was placed in an ultrasonic bath for better homogenization, and finally, pH=7 was reached with 4 M HCl. From the 1000 ppm stock solution, the desired concentrations of synthetic HA solution were prepared by dissolving the stock solution in specific amounts of deionized water [3].
In order to find the optimal mode, the performance of HA separation from wastewater by the pristine and modified membranes was checked using the OFAT method with three repetitions. In this regard, at first, according to the permeate flux and pollutant removal percentage, the optimal initial pressure and concentration were respectively obtained for the M0 membrane. Based on that, these parameters were measured for all membranes. Finally, the optimum pH for the final selected membrane was investigated. Table 1 shows the parameters examined in this research and their ranges. The range of parameters was selected based on the references of Singh and Purkait (2016) and Shi et al. (2018) [27,28].
2.6. Filtration Test
The filtration test was carried out in the dead-end laboratory pilot, according to Figure 1, with an effective separation area of 11.34 cm2 and an effective volume of 250 ccs. The required operating pressure was applied by a nitrogen capsule.
The mass of pure water and HA was measured to obtain the membrane flux. The filtration test was continued until the flux reached at least 50% of the initial flux. The total duration of the test was 135 min, in which pure water was passed in the first 30 min and the last 15 min. The output mass of HA was measured every 3 min in the first 15 min and then every 15 min until it reached a stable value in about 90 min. To ensure the accuracy of the data, the information on each membrane was obtained after three tests, and the flux of the tests performed was calculated according to equation (3) [29].
where M is the mass of wastewater (g), t is the duration of the solution penetration (h), A is the active area of the membrane (m2), ρ is the density of water (g/L), and J is the flux of wastewater (L/h.m2).
The pollutant removal rate in the samples was calculated using equation (4) [30].
where Cp and Cf are the HA concentration of the permeate and feed solutions, respectively, and R is the percentage of pollutant removal (the absorbance of the solution was read by spectrophotometer at λmax=254 nm).
2.7. Fouling and Resistances Measurements of Membranes
The pure water flux was measured before and after the HA flux measurement to determine the antifouling ability of the membranes. FRR(%) is membrane recovery ratio, Rr (%) is reversible resistance, Rir (%) is irreversible resistance, and Rt (%) is the total resistance of the membrane, which are obtained from relations (5), (6), (7) and (8) were respectively calculated. RFR(%) is also the sum of reversible and irreversible resistances [31,32].
In equations (5) to (8), Jw1 is the pure water flux in the first min of the test before the effluent filtration test, Jw2 is the pure water flux in the final min of the test after the effluent filtration test, and Jp is the effluent flux.
3. Results and Discussion
3.1. Membrane Separation Performance
At first, the pure water flux was measured by passing the pure water before and after the wastewater passed through the membrane in order to investigate the operating pressure for the optimal M0 membrane, the fouling, and membrane resistances (Figure 2). As can be seen in Figure 2 a and b, the amount of flux decreased slightly at pressures of 0.5 and 1 bar with the passage of time; however, with increasing pressure at pressures of 1.5, 1.8, and 2 times, the flux reduction has been significantly reduced in the first 15 min of the experiment. In fact, in the first min, the sharp and sudden decrease in the observed flux was due to membrane fouling and pollutant absorption on the clean surface of the membrane. Interestingly, among the particles that passed through the membrane pores, some of which had diameters almost equal to the membrane pores, were absorbed by the membrane wall, which resulted in a remarkable decrease in the flux in the first min. As it is evident, the increase in pressure is associated with the increase in flux. However, due to the higher pressure and also the rate of permeability, there is no room for pollutant absorption on the surface of the membrane, and a dense cake layer is formed on the surface of the membrane. As a result, the chance of membrane rejection and, subsequently, the removal percentage has decreased with increasing pressure. Alpatova et al.'s research (2015) also mentioned similar results [33].
Figure 2c, and d, respectively, show the total flux passing through the membrane in terms of time and the values of Jw1, Jw2, and Jp passing through the M0 membrane at different pressures. According to these two forms, as expected, the pure water flux also increased with the increase of the applied pressure. This increase in flux was low at low pressures and more tangible at pressures higher than 1.5 bar, as in the research of Singh and Purkait (2016), similar results were presented [27]. According to the results, the pressure of 1.5 bar, in which the increase in flux (117.38 L/m2.h) and adequate rejection (77.63%) was observed, was chosen as the optimal pressure to continue the research.
After choosing the optimal operating pressure, the pollutant concentration was optimized for the M0 membrane (Figure 3). As can be seen in Figure 3a and b, in all concentrations, both the amount of flux and the percentage of removal have decreased over time, and also, the sudden drop of flux has happened in the first 15 min of pollutant passage. According to what was observed, increasing the concentration of HA means forming a thicker cake layer on the membrane, which reduces the flux. On the other hand, in high pollutant concentrations, the formation of the HA cake layer on the membrane surface was faster, which reduced the membrane absorption ability. It, in turn, led to the removal percentage decrease, which was also mentioned in the research of Singh and Purkait (2016) [27]. According to the investigation of the membrane flux and the pollutant removal percentage at different concentrations, the permeate flux and membrane rejection decreased slightly at higher pollutant concentrations.
Figure 3c, and d, respectively, show the total flux passing through the membrane in terms of time and the values of Jw1, Jw2, and Jp passing through the M0 membrane at different pollutant concentrations. As can be seen that with the increase in pollutant concentration (from 30 ppm to 80 ppm), the total flux (from 153.56 L/m2.h to 58.74 L/m2.h), and the final net water flux (from 227.72 L/m2.h to 127.74 L/m2.h) has decreased due to the increased membrane surface fouling; although, the amount of initial pure water flow before passing the pollutant with different concentrations was the same due to the similarity of the conditions. According to the results, to continue the research, the concentration of 80 ppm with the permeate flux of 89.39 L/m2.h and HA removal of 75.59% was chosen as the optimal concentration.
In order to select the optimal membrane, flux, removal efficiency, water contact angle, membrane properties, porosity and pore size, and anti-fouling properties were investigated for all modified membranes at 1.5 bar pressure and 80 ppm pollutant concentration. As seen in Figure 4a, with the increase in PEG additive percentage, the membrane's permeability increased due to the hydrophilicity of the membrane surface by PEG hydroxyl bonds, although this trend has not had a significant impact on rejection. On the other hand, with an increase in the percentage of TA nanoparticles, the amount of membrane rejection increased. However, it did not significantly affect the membrane permeability, which was probably due to the decrease in the number and size of the membrane pores. In other words, increasing the concentration of nanoparticles has increased the viscosity of the membrane, which has led to a decrease in the permeability mass transfer of the membrane [16]. All the membranes had relatively high rejection and approximately good permeability. As observed, the M1 membrane, covered only with PEG additive, had the highest permeability (131.21 L/m2.h), and the M2 membrane, which was covered only with TA nanoparticles, had the highest rejection (88.38%). Therefore, the optimal membrane is the membrane that has the least fouling and the highest removal percentage. Among the membranes M3, M4, and M5, which included nanoparticles and additives, the M3 membrane, although it had a high flux (127.62 L/m2.h), had a lower rejection (81.49%) than the two. Among M4 and M5 membranes, the M4 membrane had higher permeability (72.43 L/m2.h) and rejection (86.62%).
Figure 4b shows Jw1, Jw2 and, Jp values for modified membranes. According to this Figure, the membranes modified by nanoparticles and additives have higher pure water fluxes than the pristine M0 membrane, due to the increased hydrophilicity of the membranes modified by nanoparticles and additives. As can be seen, the M1 membrane had the highest pure water flux (1303.65 L/m2.h). The M1 membrane was modified by PEG, which contained a hydroxyl bond. The membrane's high hydrophilic properties increased in pure water flux in this vein. The M5 membrane, which included PEG and TA, had a high hydrophilic effect (735.24 L/m2.h) compared to other membranes. The relatively low flux of the pristine membrane was due to its superhydrophobic property; these results were also reported in the research of Liu et al. (2021) [34]. Furthermore, the flux drop in the last 15 min (313.69 L/m2.h) compared to the first 30 min of pure water flux (463.75 L/m2.h) indicates membrane fouling; indeed, a decrease in the flux drop in the M3 membrane indicated a lower level of fouling in this membrane in comparison to other membranes.
The water contact angle was measured to determine the hydrophilicity of the membrane surface. According to Figure 5, the contact angle of the water droplet with the membrane surface decreased by modifying the membrane surface, which can be attributed to the presence of hydrophilic hydroxyl (OH) and carboxyl (COOH) groups present in TA and PEG. The hydrophilicity of the membrane also meant a decrease in the membrane surface fouling and an increase in flux (for example, M3 membrane), indicating the presence of nanoparticles on the membrane surface. On the other hand, the nanoparticles that were equal to or smaller than the membrane pores caused the walls of these pores to close, which led to a decrease in the membrane flux (for example, M4 membrane). Therefore, by coating the membranes with the nanoparticles and creating a surface layer, although the membrane surface became hydrophilic, no continuous trend was observed in the membrane flux. Khezraqa et al. (2022) also reported similar results [35].
The permeability fluxes of HA and pure water were measured to check the anti-fouling characteristics of the membranes. According to Figure 6a, FRR and Rr for all modified membranes were higher than the original pristine membrane, and Rir was the opposite. Figure 6b also shows the total membrane resistances. The M2 membrane coated with TA nanoparticles had high hydrophilicity and low water contact angle, which reduced the ability to absorb sediment on the membrane surface; in a way that the presence of water on the surface of the membrane acts like a layer that did not allow the pollutant to enter the membrane pores. Therefore, it had the highest FRR (72.39%). According to Figure 6a and b, the increase in Rr by modifying the membranes was due to the reduction of surface hydrophobicity caused by the hydrogen bonding of TA nanoparticles and PEG additive on the membrane polymer surface. In modified membranes, M1 (57.92%) and M2 (56.86%) coated with PEG and TA, respectively, had higher Rr than other membranes. Also, M4 (47.93%) and M5 (53.81%) had more suitable reversible resistances than the M0 membrane (28.47%). In Kumar et al.’s (2016) studies, an Increase In %FRR and Rr in the polysulfone membrane with GO-TiO2 nanoparticles in regard to the separation of HA has been reported. In general, the reduction of Rir and the increase of Rr in the coated membranes compared to the pristine membrane indicates the reusability of the membranes by hydraulic washing [36].
In order to better compare the membranes and choose the optimal membrane, porosity was also investigated. Membrane porosity is measured according to the number and size of pores in the surface layer of the membrane. An increase in the number and size of holes in the surface layer of the membrane means an increase in porosity and, as a result, an increase in the permeate flux. Coating membranes with nanoparticles and additives improve their hydrophilicity, which also positively improves porosity. According to Table 2, the modified membranes M2 (49.38%), M4 (46.62%) and M5 (37.03%) had lower porosity than the M0 pristine membrane (56.98%). Membrane M1 (73.46%), covered merely with additives, had the highest porosity, which was the justification for the high flux of this membrane. M3 membrane (65.74%), which had an equal ratio of nanoparticles and additives, also had high porosity. Similar results have been presented in the studies of Kumar et al. (2016) and Krishnan et al. (2022) [3,37]. Further, by coating nanoparticles on the membrane surface, the average diameter of the pores increases, which is due to the improvement of hydrophilic properties of membranes by coating nanoparticles. As can be seen in Table 2, M5 (48.48 nm) and M1 (44.59 nm) had the highest average diameter, followed by M2 (40.92 nm), M4 (34.24 nm), and M3 (29.89 nm). Needless to say, they all had higher average diameters than M0 (21.59 nm) [26].
According to the experiments conducted in this research, a significant increase in pure water permeability flux (446.03 L/m2.h), membrane rejection (86.62%), and recovery ratio (64.17%) the M4 membrane compared to pure water permeability flux (265.64 L/m2.h), membrane rejection (75.59%) and recovery ratio (62.12%) of the M0 membrane. Furthermore, an increase in reversible resistance (47.93%) and a decrease in irreversible resistance (35.82%) was observed in the M4 membrane compared to reversible (28.47%), and irreversible resistance (37.87%) of the primary membrane have been observed. On the other hand, with the coating of TA nanoparticles on the membrane surface, the membrane pores were closed with a coating of nanoparticles, which reduced the porosity in the M4 membrane (46.62%) and also the effluent flux (72.43 L/m2.h) compared to the porosity (56.98%) and the effluent flux (89.39 L/m2.h) of M0 membrane, and the average particle diameter in M4 membrane (34.24 nm) after M5 and M1 membranes, is more favorable than M0 membrane (21.59 nm). With these in mind, the M4 membrane was finally chosen as the optimal membrane for further research.
Finally, the effect of pH on the flux and removal efficiency of the selected membrane M4 was investigated (Figure 7a, b, and c). According to Figure 7a and b, with the increase in pH from 5 to 9, the flux decreased from 167.96 L/m2.h to 27.08 L/m2.h and the increase in membrane rejection from 80.79% to 96.26% was observed. It was justified according to dynamic light diffraction analysis (Figure 7c). Dynamic light diffraction analysis was performed to measure zeta potential and particle size to determine the chemical properties and surface charge created on the membrane surface at pH 5, 7, and 9. In fact, with the increase in pH from 5 to 9, the decrease in the zeta potential (at pHs 5, 7, and 9 -14.56 mV, -21.93 mV, and -23.86 mV, respectively) and the increase in particle size (at pH 5, 7 and 9 respectively, 126.3 nm, 142.1 nm, and 160.3 nm) were observed, in a way that the more acidic the condition, the steeper the slope, and with the increase in pH, the slope decreased to the point where an almost flat line was observed in the alkaline condition. With the increase in the size of the particles and the zeta potential becoming more negative, it can be concluded that at low pH, the solution has little stability and settles in a viscous and bulky form in the solution. In fact, the functional groups of carboxyl (-COOH) and hydroxyl of HA are protonated, which causes a decrease in density, a decrease in electrostatic repulsion, shrinking of the polymer, and a decrease in the size of the particles, which leads to an increase in the average pore size and ultimately an increase in permeability. At high pHs, the opposite of this situation occurs; that is, the carboxyl groups are separated into carboxyl ions (-COO-), which causes electrostatic repulsion, increase in density, enlargement of polymer, increase in particle size, and as a result, decrease in average pore size and ultimately decrease in permeability. In other words, pH has an influential role in particle size and membrane surface charge according to the type of membrane and pollutant. In the studies of Mondal et al. (2019), the water flux has decreased in pH 3 to 12 for the glucose pollutant [38].
Figure 8a and b, respectively, show the total permeate flux through the membrane in terms of time and the values of Jw1, Jw2, and Jp permeating the optimal membrane M4 at different pHs. According to these two Figures and according to what was said in the previous part, it can be seen that with the increase in pH, the flux through the membrane, including the initial and the final pure water flux, has decreased. According to the results, pH=5 had the highest total flux (167.96 L/m2.h), the initial pure water flux (512.70 L/m2.h), and the lowest amount of HA removal (80.79%) and vice versa pH=9 had the lowest total flux (27.08 L/m2.h) and initial pure water flux (373.24 L/m2.h), and the highest amount of HA removal (96.26%). Thus, pH = 7, which had a favorable total flux (72.43 L/m2.h), initial pure water flux (446.03 L/m2.h), and HA removal rate (86.62%), was selected as pH Optimum.
3.2. Membrane Characterization
ATR-FTIR spectrum was used to examine the structure and chemical bonding of the surface of all membranes. Figure 9 shows the spectra of all membranes. Compared to the prime pristine membrane, the M4 membrane had an absorption peak at 1729.81 cm-1 due to the stretching vibration of C=O related to the hydrophilic carboxyl group (COOH) present in TA, indicates the proper coverage of TA on the membrane surface. These numbers were observed in the other four modified membranes with a slight change caused by the effect of coated nanoparticles and additives on the membrane surface with different percentages. Based on all the spectra of the modified membranes, it can be concluded that TA and PEG are uniformly dispersed on the PVDF membrane, which has also indicated similar results in the studies of Shi et al. (2018) and Turk et al. (2021) [28,39].
Surface morphology and topography were investigated by FESEM and AFM analysis of the pristine membrane (M0) and the selected modified membrane (M4), respectively. As can be seen in the cross-sectional images in Figure 10a, the M0 membrane (PEG: TA=0:0) has a smooth and uniform surface, indicating the polymer membrane’s uniformity and homogeneity. The number of pores in this membrane is less but bigger. The cross-sectional images of the M0 membrane show high membrane density. In the modified M4 membrane (PEG: TA=4:1), the number of pores has increased, but their size has become smaller, which ensures the coating of nanoparticles and additives on the surface of the membrane. Due to the hydrogen bond created between TA and PEG in the initial casting solution, masses have been made, which made the distribution of pores on the surface of the coated membrane not homogeneous. According to the FESEM images shown in Figure 10b, in the cross-sectional images of the membrane, two porous and dense spongy parts can be seen, the porous part has asymmetric finger-shaped pores, and the spongy part determines the permeability rate [18,40]. The M4 membrane has more regular pores and spongy parts, more porosity, and larger finger pores compared to the M0 membrane. In fact, with the increase in the percentage of nanoparticles and the hydrophilicity of the polymer matrix, the number of coarse pores decreased, and the finger-shaped holes became more regular in the M4 membrane. The formation of more pores in the finger-shaped part and fewer in the spongy part of the membrane indicates an increase in hydrophilicity and, consequently, membrane flux. Similar results have been presented in the studies of Li et al. (2019) [16].
Surface roughness is effective on membrane permeability, fouling, and, ultimately, rejection. Therefore, AFM analysis was performed for the M0 membrane, which was the pristine membrane, and the M4 membrane, which was more suitable in terms of membrane properties, hydrophilicity, and surface morphology than other modified membranes. As can be seen in Figure 10c, with the coating of the membrane surface in the M4 membrane, Ra increased from 30.98 to 37.10, which can be attributed to the porosity improvement. The highest points of the membrane surface are lighter than depressions and pores. The higher the coefficient of the membrane surface area means the creation of more bumps and depressions on the surface and, indeed, a higher surface roughness. Root mean square roughness can have very different results depending on the occurrence and distribution of surface roughness. The higher the Rq, the more uniform the surface roughness, which in the modified M4 membrane had a value of 48.83, which indicated the proper distribution of TA on the membrane surface and was also higher than the M0 membrane (39.24). In fact, it can be concluded that the membrane polymer solution creates a denser structure and a softer surface. By increasing the amount of nanocomposite and simultaneously with its migration to the membrane surface, the anionic interactions related to the polymer strands cause wrinkles in the modified membrane; accordingly, the roughness of the membrane surface increases [41].
According to Figure 11a, the elemental composition of M0 and M4 membrane surfaces was determined by EDS. As can be seen, by covering the surface of the membrane, the amount of carbon elements (from 51.27 to 75.14), oxygen (from 1.05 to 16.11), and nitrogen (from 0.81 to 1.05) in the modified M4 membrane compared to the pristine M0 membrane has increased, and the amount of fluorine (from 46.86 to 7.7) has decreased, which is due to the hydroxyl and ether functional groups present in TA nanoparticles and PEG additive. Similar results have been reported in the studies of Fahrina et al. (2022) [42]. These results are also observed in the EDS mapping images, according to Figure 11b, the nanoparticles and additives are uniformly and homogeneously dispersed on the M4 membrane surface. In fact, the fluorine element in the M0 membrane was high due to the PVDF polymer in the pristine membrane. Additionally, the increase in the carbon element in the modified membrane (M4) compared to the M0 membrane was due to the coating of the membrane with TA and PEG.
4. Conclusion
The modified membranes showed a better performance than the pristine PVDF membrane (M0) in terms of pure water membrane permeability and HA pollutant rejection. Although due to the phenomenon of membrane pores fouling because of sediments caused by the wastewater, the wastewater permeability increase has not always been observed in the modified membranes. Compared to the unmodified pristine membrane, an improvement in pollutant absorption was observed in the membrane modified with HA nanoparticles. Still, an increase in the percentage of nanoparticles did not mean an increase in pollutant absorption. The results showed that by increasing the pressure, the weight percentage of PEG, and decreasing the weight percentage of TA, permeability increased and rejection decreased. Also, with the increase of the pollutant concentration, permeability and rejection both decreased. Furthermore, at alkaline pHs, a decrease in permeability and an increase in rejection were observed. According to the analyses performed for different membrane types, the M4 membrane provided the best performance. Reducing the water contact angle with the coating of nanoparticles and additive on the membrane surface due to the increase of hydrophilic hydroxyl (OH) and carboxyl (COOH) groups, as well as the increase and regularization of pores in the finger-shaped part- so that the coarse pores decreased, but the number of pores increased, causing an increase in pure water flux, which can be related to the coating of these pores by TA nanoparticles. According to the results of this research, the membrane coating method, by affecting the morphology and surface properties of the membrane, causes changes in the flux and removal efficiency of the membrane, as well as the anti-fouling properties of the membrane.
Author Contributions
All authors participated in designing the experiment, wrote, read and approved the final manuscript. Bita Ayati analyzed the data as well, Leila Emadinezhad performed the experiments.
Funding
This study was supported by an M.SC. grant from Tarbiat Modares University.
Credit Author Statement
All authors read and approved the final manuscript. Leila Emadinezhad: Investigation, Data curation, Writing- Original draft preparation. Bita Ayati: Conceptualization, Supervision, Writing- Reviewing and Editing.
Consent for publication
The authors give their consent for the publication of identifiable details, which can details within the text (material) to be published in the above Journal and Article.
Financial interests
The authors have no relevant financial or non-financial interests to disclose.
Ethical approval and consent to participate
This material is the authors' own original work, which has not been previously published elsewhere.
Availability of data and materials
The authors declare that the data supporting the findings of this study are available within the article.
Acknowledgments
The authors would like to gratefully acknowledge the financial support from the M.SC. grant from Tarbiat Modares University and also, thank our colleagues who provided insight and expertise that greatly assisted the research.
Competing interests
The authors declare that they have no known competing financial interests or personal relationships that could have appeared to influence the work reported in this paper.
References
- Y. H. Teow, B. S. Ooi, and A. L. Ahmad, “Study on PVDF-TiO2 mixed-matrix membrane behaviour towards humic acid adsorption,” J. Water Process Eng., vol. 15, pp. 99–106, Feb. 2017. [CrossRef]
- I. Nazri, A. L. Ahmad, and M. H. Hussin, “Microcrystalline cellulose-blended polyethersulfone membranes for enhanced water permeability and humic acid removal,” Membranes, vol. 11, no. 9. 2021. [CrossRef]
- M. Kumar, Z. Gholamvand, A. Morrissey, K. Nolan, M. Ulbricht, and J. Lawler, “Preparation and characterization of low fouling novel hybrid ultrafiltration membranes based on the blends of GO−TiO2 nanocomposite and polysulfone for humic acid removal,” J. Memb. Sci., vol. 506, pp. 38–49, May 2016. [CrossRef]
- M. S. Algamdi, I. H. Alsohaimi, J. Lawler, H. M. Ali, A. M. Aldawsari, and H. M. A. Hassan, “Fabrication of graphene oxide incorporated polyethersulfone hybrid ultrafiltration membranes for humic acid removal,” Sep. Purif. Technol., vol. 223, pp. 17–23, Sep. 2019. [CrossRef]
- Li et al., “High-performance electrocatalytic microfiltration CuO/Carbon membrane by facile dynamic electrodeposition for small-sized organic pollutants removal,” J. Memb. Sci., vol. 601, p. 117913, Mar. 2020. [CrossRef]
- P. Y. He, Y. J. Zhang, H. Chen, Z. C. Han, and L. C. Liu, “Low-cost and facile synthesis of geopolymer-zeolite composite membrane for chromium(VI) separation from aqueous solution,” J. Hazard. Mater., vol. 392, p. 122359, Jun. 2020. [CrossRef]
- T. D. Kusworo, N. Ariyanti, and D. P. Utomo, “Effect of nano-TiO2 loading in polysulfone membranes on the removal of pollutant following natural-rubber wastewater treatment,” J. Water Process Eng., vol. 35, p. 101190, Jun. 2020. [CrossRef]
- J. Luo, W. Chen, H. Song, and J. Liu, “Antifouling behaviour of a photocatalytic modified membrane in a moving bed bioreactor for wastewater treatment,” J. Clean. Prod., vol. 256, p. 120381, May 2020. [CrossRef]
- T. A. Makhetha and R. M. Moutloali, “Antifouling properties of Cu(tpa)@GO/PES composite membranes and selective dye rejection,” J. Memb. Sci., vol. 554, pp. 195–210, May 2018. [CrossRef]
- M. Yong, Y. Zhang, S. Sun, and W. Liu, “Properties of polyvinyl chloride (PVC) ultrafiltration membrane improved by lignin: Hydrophilicity and antifouling,” J. Memb. Sci., vol. 575, pp. 50–59, Apr. 2019. [CrossRef]
- N. I. Mat Nawi et al., “Development of Hydrophilic PVDF Membrane Using Vapour Induced Phase Separation Method for Produced Water Treatment,” Membranes (Basel)., vol. 10, no. 6, p. 121, Jun. 2020. [CrossRef]
- L. Xu et al., “A comprehensive description of the threshold flux during oil/water emulsion filtration to identify sustainable flux regimes for tannic acid (TA) dip-coated poly(vinylidene fluoride) (PVDF) membranes,” J. Memb. Sci., vol. 563, pp. 43–53, Oct. 2018. [CrossRef]
- F. Oulad, S. Zinadini, A. A. Zinatizadeh, and A. A. Derakhshan, “Fabrication and characterization of a novel tannic acid coated boehmite/PES high performance antifouling NF membrane and application for licorice dye removal,” Chem. Eng. J., vol. 397, p. 125105, Oct. 2020. [CrossRef]
- A. D’souza and R. Shegokar, “Polyethylene glycol (PEG): A versatile polymer for pharmaceutical applications,” Expert Opin. Drug Deliv., vol. 13, no. 9, pp. 1257–1275, Sep. 2016. [CrossRef]
- J. Zhao, Y. Yang, C. Li, and L. Hou, “Fabrication of GO modified PVDF membrane for dissolved organic matter removal: Removal mechanism and antifouling property,” Sep. Purif. Technol., vol. 209, pp. 482–490, Jan. 2019. [CrossRef]
- M. Li, L. Wu, C. Zhang, W. Chen, and C. Liu, “Applied Surface Science Hydrophilic and antifouling modi fi cation of PVDF membranes by one-step assembly of tannic acid and polyvinylpyrrolidone,” vol. 483, no. April, pp. 967–978, 2019. [CrossRef]
- Y. H. Teow, B. S. Ooi, A. L. Ahmad, and J. K. Lim, “Investigation of Anti-fouling and UV-Cleaning Properties of PVDF/TiO2 Mixed-Matrix Membrane for Humic Acid Removal,” Membranes (Basel)., vol. 11, no. 1, p. 16, Dec. 2020. [CrossRef]
- B. Jiang, K. Cheng, N. Zhang, N. Yang, L. Zhang, and Y. Sun, “One-step modification of PVDF membrane with tannin-inspired highly hydrophilic and underwater superoleophobic coating for effective oil-in-water emulsion separation,” vol. 255, no. August 2020, 2021.
- F. Sun et al., “Dopamine-decorated lotus leaf-like PVDF/TiO2 membrane with underwater superoleophobic for highly efficient oil-water separation,” Process Saf. Environ. Prot., vol. 147, pp. 788–797, Mar. 2021. [CrossRef]
- Karimi, A. Khataee, A. Ghadimi, and V. Vatanpour, “Ball-milled Cu2S nanoparticles as an efficient additive for modification of the PVDF ultrafiltration membranes: Application to separation of protein and dyes,” J. Environ. Chem. Eng., vol. 9, no. 2, p. 105115, Apr. 2021. [CrossRef]
- L. Yan et al., “Bio-inspired mineral-hydrogel hybrid coating on hydrophobic PVDF membrane boosting oil/water emulsion separation,” Sep. Purif. Technol., vol. 285, p. 120383, Mar. 2022. [CrossRef]
- J. Ren, W. Xia, X. Feng, and Y. Zhao, “Surface modification of PVDF membrane by sulfonated chitosan for enhanced anti-fouling property via PDA coating layer,” Mater. Lett., vol. 307, p. 130981, Jan. 2022. [CrossRef]
- Abdulazeez, B. Salhi, A. M. Elsharif, M. S. Ahmad, N. Baig, and M. M. Abdelnaby, “Hemin-Modified Multi-Walled Carbon Nanotube-Incorporated PVDF Membranes: Computational and Experimental Studies on Oil–Water Emulsion Separations,” Molecules, vol. 28, no. 1, p. 391, Jan. 2023. [CrossRef]
- C. Ho, Y. H. Teow, W. L. Ang, and A. W. Mohammad, “Novel GO/OMWCNTs mixed-matrix membrane with enhanced antifouling property for palm oil mill effluent treatment,” Sep. Purif. Technol., vol. 177, pp. 337–349, Apr. 2017. [CrossRef]
- C. Ni, X. Zheng, Y. Zhang, X. Zhang, and Y. Li, “Multifunctional porous materials with simultaneous high water flux, antifouling and antibacterial performances from ionic liquid grafted polyethersulfone,” Polymer (Guildf)., vol. 212, p. 123183, Jan. 2021. [CrossRef]
- S. Sakarkar, S. Muthukumaran, and V. Jegatheesan, “Evaluation of polyvinyl alcohol (PVA) loading in the PVA/titanium dioxide (TiO2) thin film coating on polyvinylidene fluoride (PVDF) membrane for the removal of textile dyes,” Chemosphere, vol. 257, p. 127144, Oct. 2020. [CrossRef]
- R. Singh and M. K. Purkait, “Evaluation of mPEG effect on the hydrophilicity and antifouling nature of the PVDF-co-HFP flat sheet polymeric membranes for humic acid removal,” J. Water Process Eng., vol. 14, pp. 9–18, Dec. 2016. [CrossRef]
- P. Shi, X. Hu, Y. Wang, M. Duan, S. Fang, and W. Chen, “A PEG-tannic acid decorated microfiltration membrane for the fast removal of Rhodamine B from water,” Sep. Purif. Technol., vol. 207, pp. 443–450, Dec. 2018. [CrossRef]
- N. S. M. Yatim, O. B. Seng, and K. A. Karim, “Fluorosilaned-TiO 2 /PVDF membrane distillation with improved wetting resistance for water recovery from high solid loading wastewater,” J. Membr. Sci. Res., vol. 5, no. 1, pp. 55–64, 2019. [CrossRef]
- S. Xu et al., “Polyphenol engineered membranes with dually charged sandwich structure for low-pressure molecular separation,” J. Memb. Sci., vol. 601, p. 117885, Mar. 2020. [CrossRef]
- Y. S. Khoo, W. J. Lau, Y. Y. Liang, M. Karaman, M. Gürsoy, and A. F. Ismail, “Eco-friendly surface modification approach to develop thin film nanocomposite membrane with improved desalination and antifouling properties,” J. Adv. Res., vol. 36, pp. 39–49, Feb. 2022. [CrossRef]
- G. Fan et al., “Enhancing the antifouling and rejection properties of PVDF membrane by Ag3PO4-GO modification,” Sci. Total Environ., vol. 801, p. 149611, Dec. 2021. [CrossRef]
- Alpatova, M. Meshref, K. N. McPhedran, and M. Gamal El-Din, “Composite polyvinylidene fluoride (PVDF) membrane impregnated with Fe2O3 nanoparticles and multiwalled carbon nanotubes for catalytic degradation of organic contaminants,” J. Memb. Sci., vol. 490, pp. 227–235, Sep. 2015. [CrossRef]
- S. Liu et al., “Multi-functional tannic acid (TA)-Ferric complex coating for forward osmosis membrane with enhanced micropollutant removal and antifouling property,” J. Memb. Sci., vol. 626, p. 119171, May 2021. [CrossRef]
- H. Khezraqa, H. Etemadi, H. Qazvini, and M. Salami-Kalajahi, “Novel polycarbonate membrane embedded with multi-walled carbon nanotube for water treatment: A comparative study between bovine serum albumin and humic acid removal,” Polym. Bull., vol. 79, no. 3, pp. 1467–1484, Mar. 2022. [CrossRef]
- P. Kallem, I. Othman, M. Ouda, S. W. Hasan, I. AlNashef, and F. Banat, “Polyethersulfone hybrid ultrafiltration membranes fabricated with polydopamine modified ZnFe2O4 nanocomposites: Applications in humic acid removal and oil/water emulsion separation,” Process Saf. Environ. Prot., vol. 148, pp. 813–824, Apr. 2021. [CrossRef]
- S. A. G. Krishnan, S. Abinaya, G. Arthanareeswaran, S. Govindaraju, and K. Yun, “Surface-constructing of visible-light Bi2WO6/CeO2 nanophotocatalyst grafted PVDF membrane for degradation of tetracycline and humic acid,” J. Hazard. Mater., vol. 421, p. 126747, Jan. 2022. [CrossRef]
- P. Mondal, N. S. Samanta, V. Meghnani, and M. K. Purkait, “Selective glucose permeability in presence of various salts through tunable pore size of pH responsive PVDF-co-HFP membrane,” Sep. Purif. Technol., vol. 221, pp. 249–260, Aug. 2019. [CrossRef]
- S. Türk, B. Ünlu, and M. S. Mustapa, “Preparation of Innovative PEG/Tannic Acid/TiO2 Hydrogels and Effect of Tannic Acid Concentration on Their Hydrophilicity,” Int. J. Integr. Eng., vol. 13, no. 5, pp. 266–273, 2021. [CrossRef]
- Yang, L. Wang, A. Xie, X. Dai, Y. Yan, and J. Dai, “Facile surface coating of metal-tannin complex onto PVDF membrane with underwater Superoleophobicity for oil-water emulsion separation,” Surf. Coatings Technol., vol. 389, p. 125630, May 2020. [CrossRef]
- N. Zhang, X. Song, Y. Chen, B. Jiang, L. Zhang, and H. Jiang, “A facile and economic route assisted by trace tannic acid to construct a high-performance thin film composite NF membrane for desalination,” Environ. Sci. Water Res. Technol., vol. 7, no. 5, pp. 956–968, 2021. [CrossRef]
- Fahrina et al., “Functionalization of PEG-AgNPs Hybrid Material to Alleviate Biofouling Tendency of Polyethersulfone Membrane,” Polymers, vol. 14, no. 9. 2022. [CrossRef]
Figure 1.
Schematic of the dead-end membrane filtration system 1) Nitrogen tank 2) Nitrogen tank pressure gauge 3) Gas inlet valve 4) Pilot pressure gauge 5) Feed solution 6) Membrane 7) Metal mesh 8) Magnet 9) Feed inlet valve 10) Stirrer 11) feed solution 12) scales.
Figure 1.
Schematic of the dead-end membrane filtration system 1) Nitrogen tank 2) Nitrogen tank pressure gauge 3) Gas inlet valve 4) Pilot pressure gauge 5) Feed solution 6) Membrane 7) Metal mesh 8) Magnet 9) Feed inlet valve 10) Stirrer 11) feed solution 12) scales.
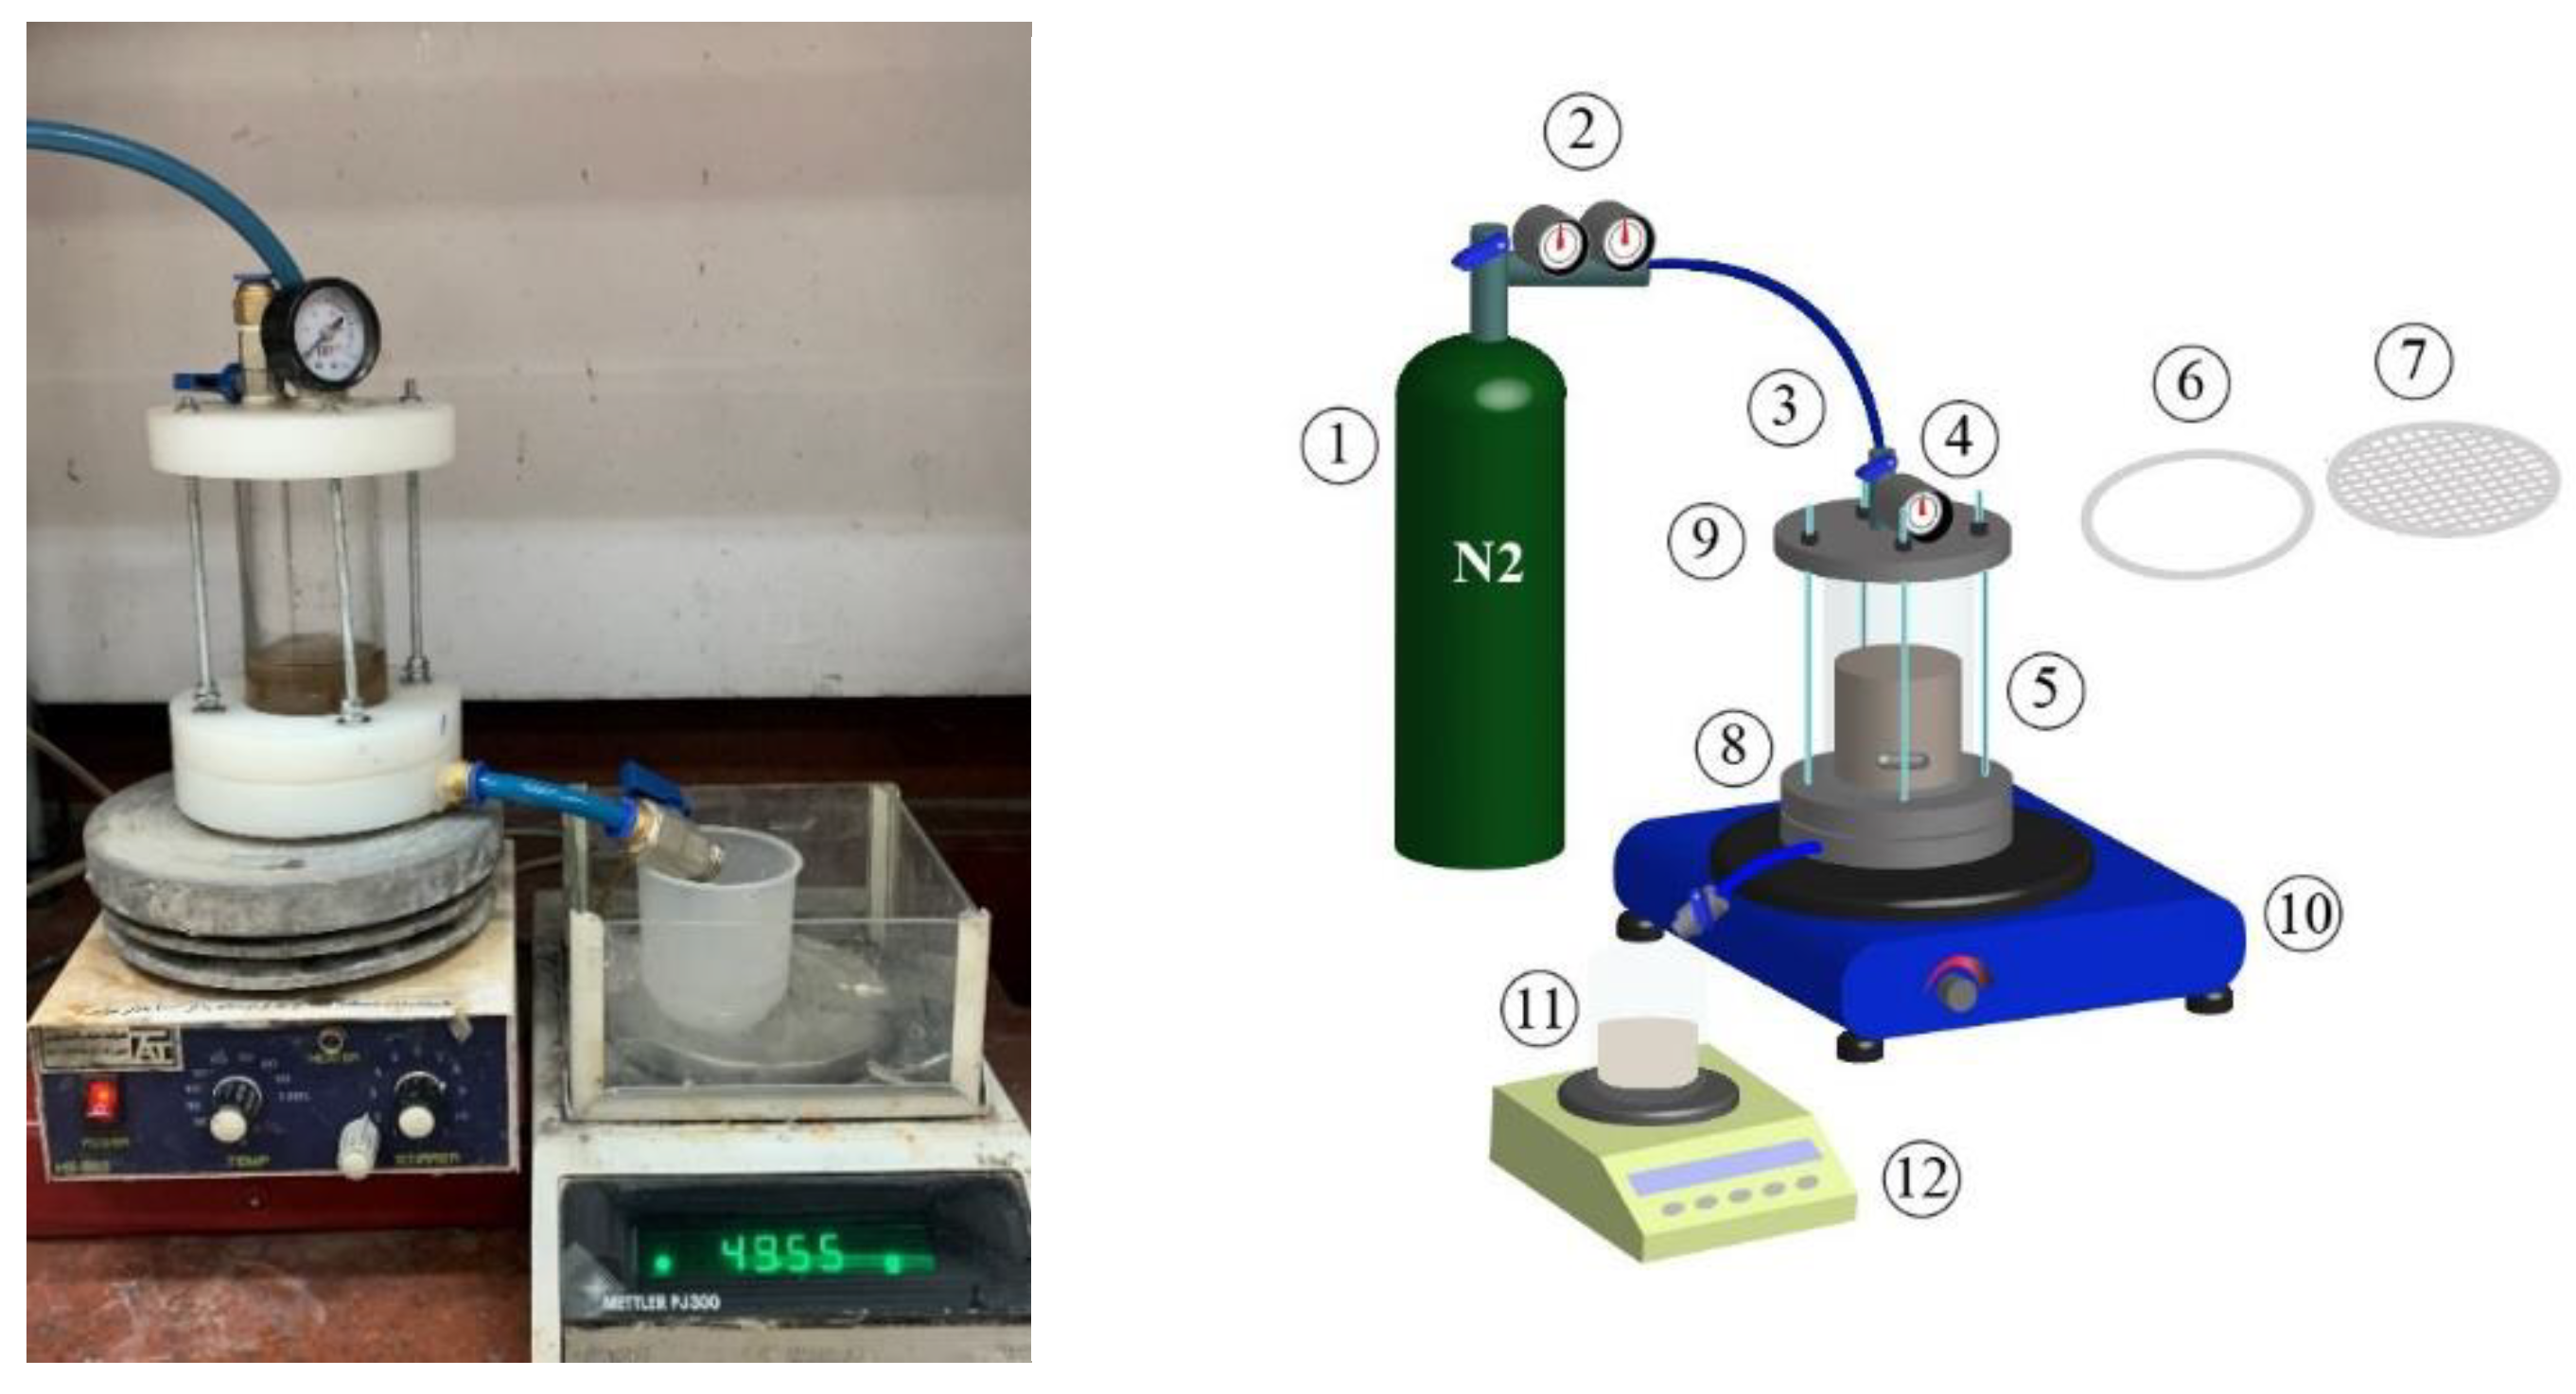
Figure 2.
a) Flux-time, b) Rejection, c) General flux, d) Jw1, Jw2 and Jp Flux changes passing through the M0 membrane at different pressures during 90 min ([HA]=50 ppm, pH=7).
Figure 2.
a) Flux-time, b) Rejection, c) General flux, d) Jw1, Jw2 and Jp Flux changes passing through the M0 membrane at different pressures during 90 min ([HA]=50 ppm, pH=7).
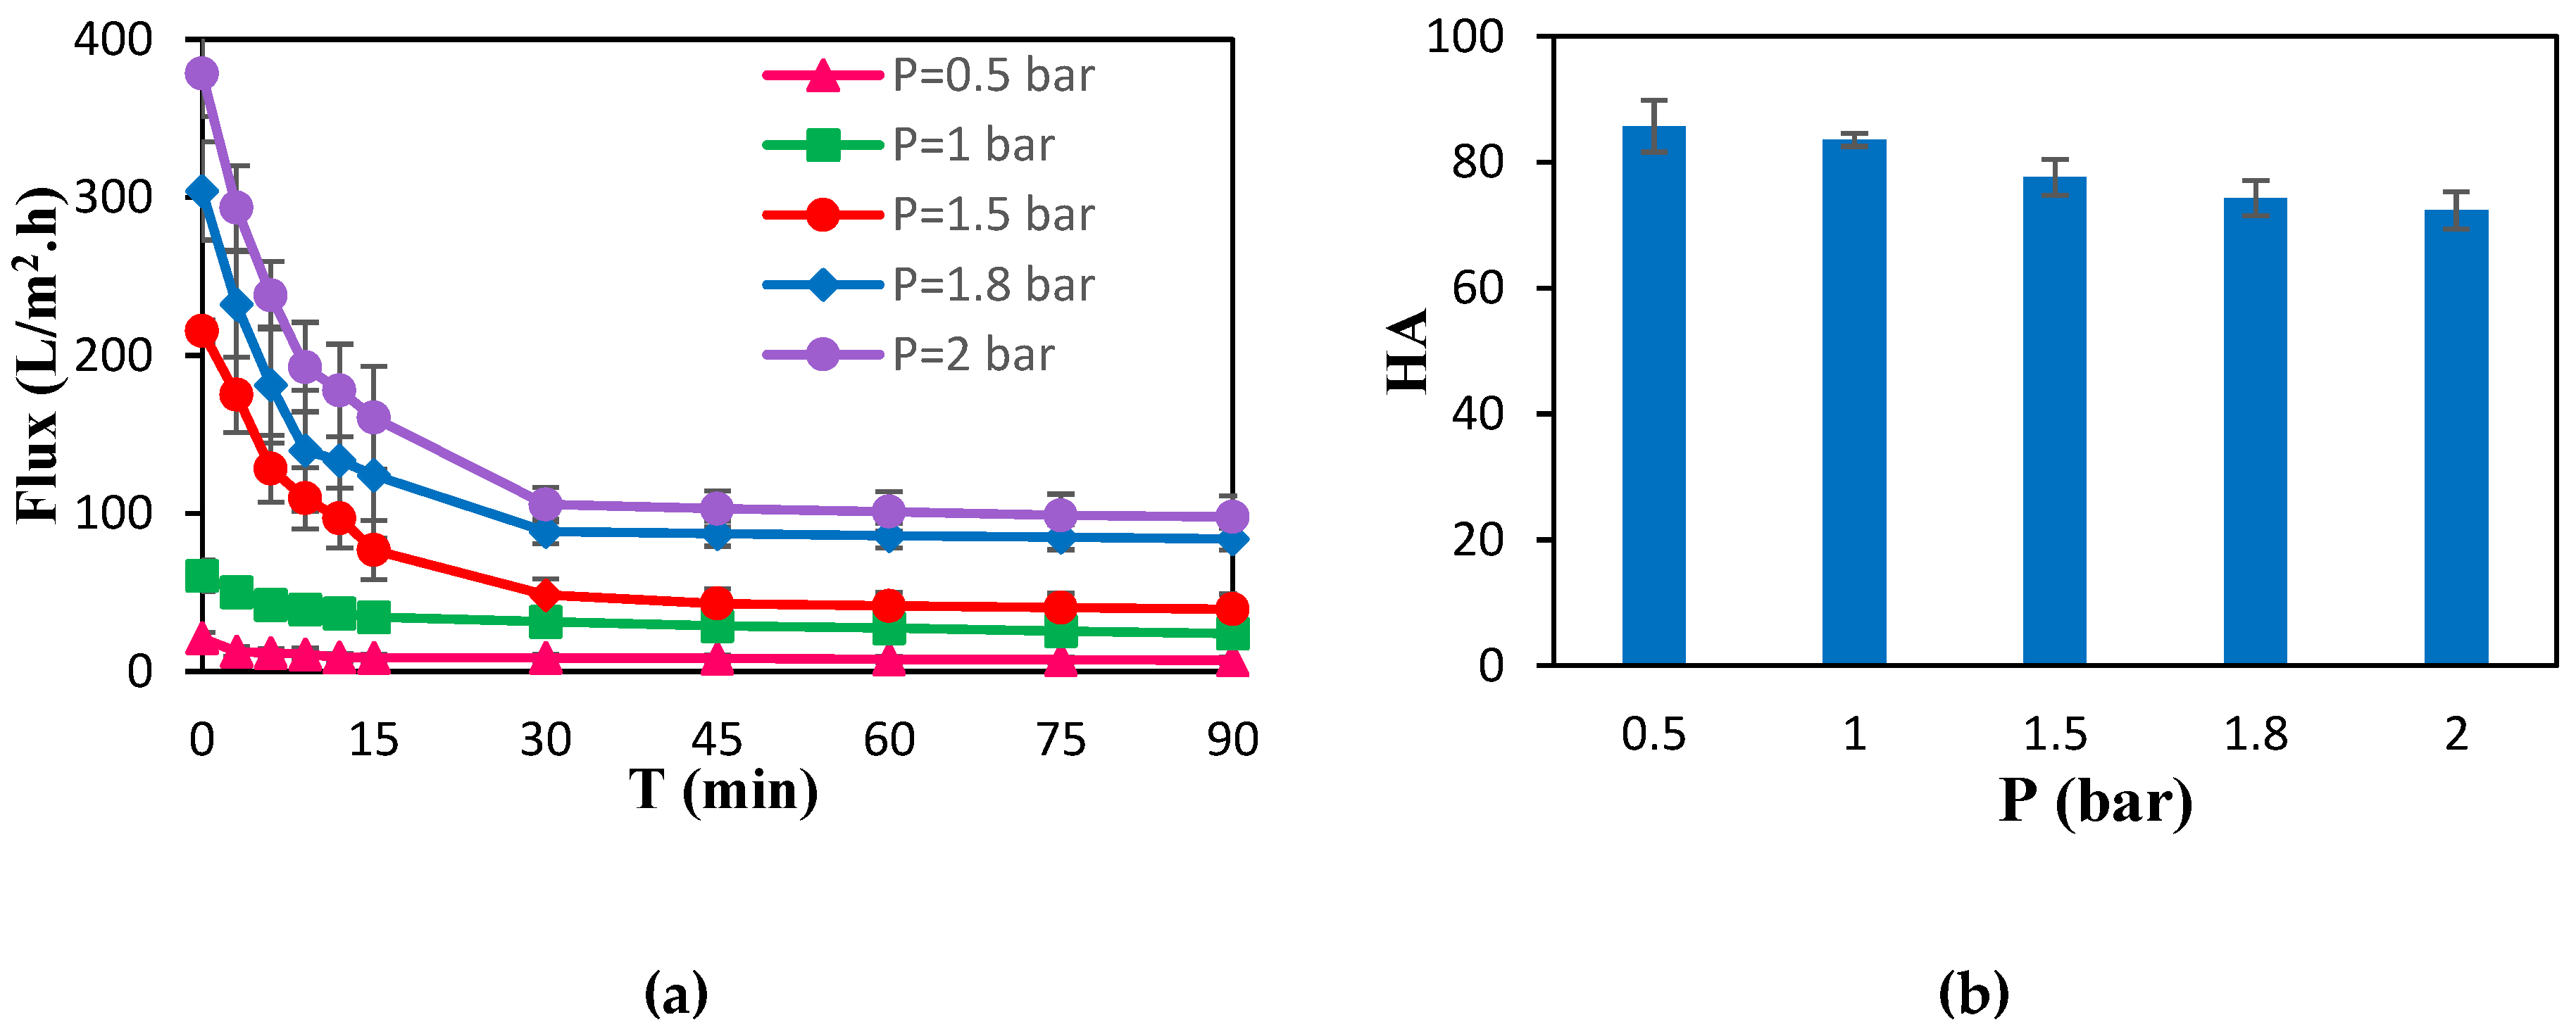
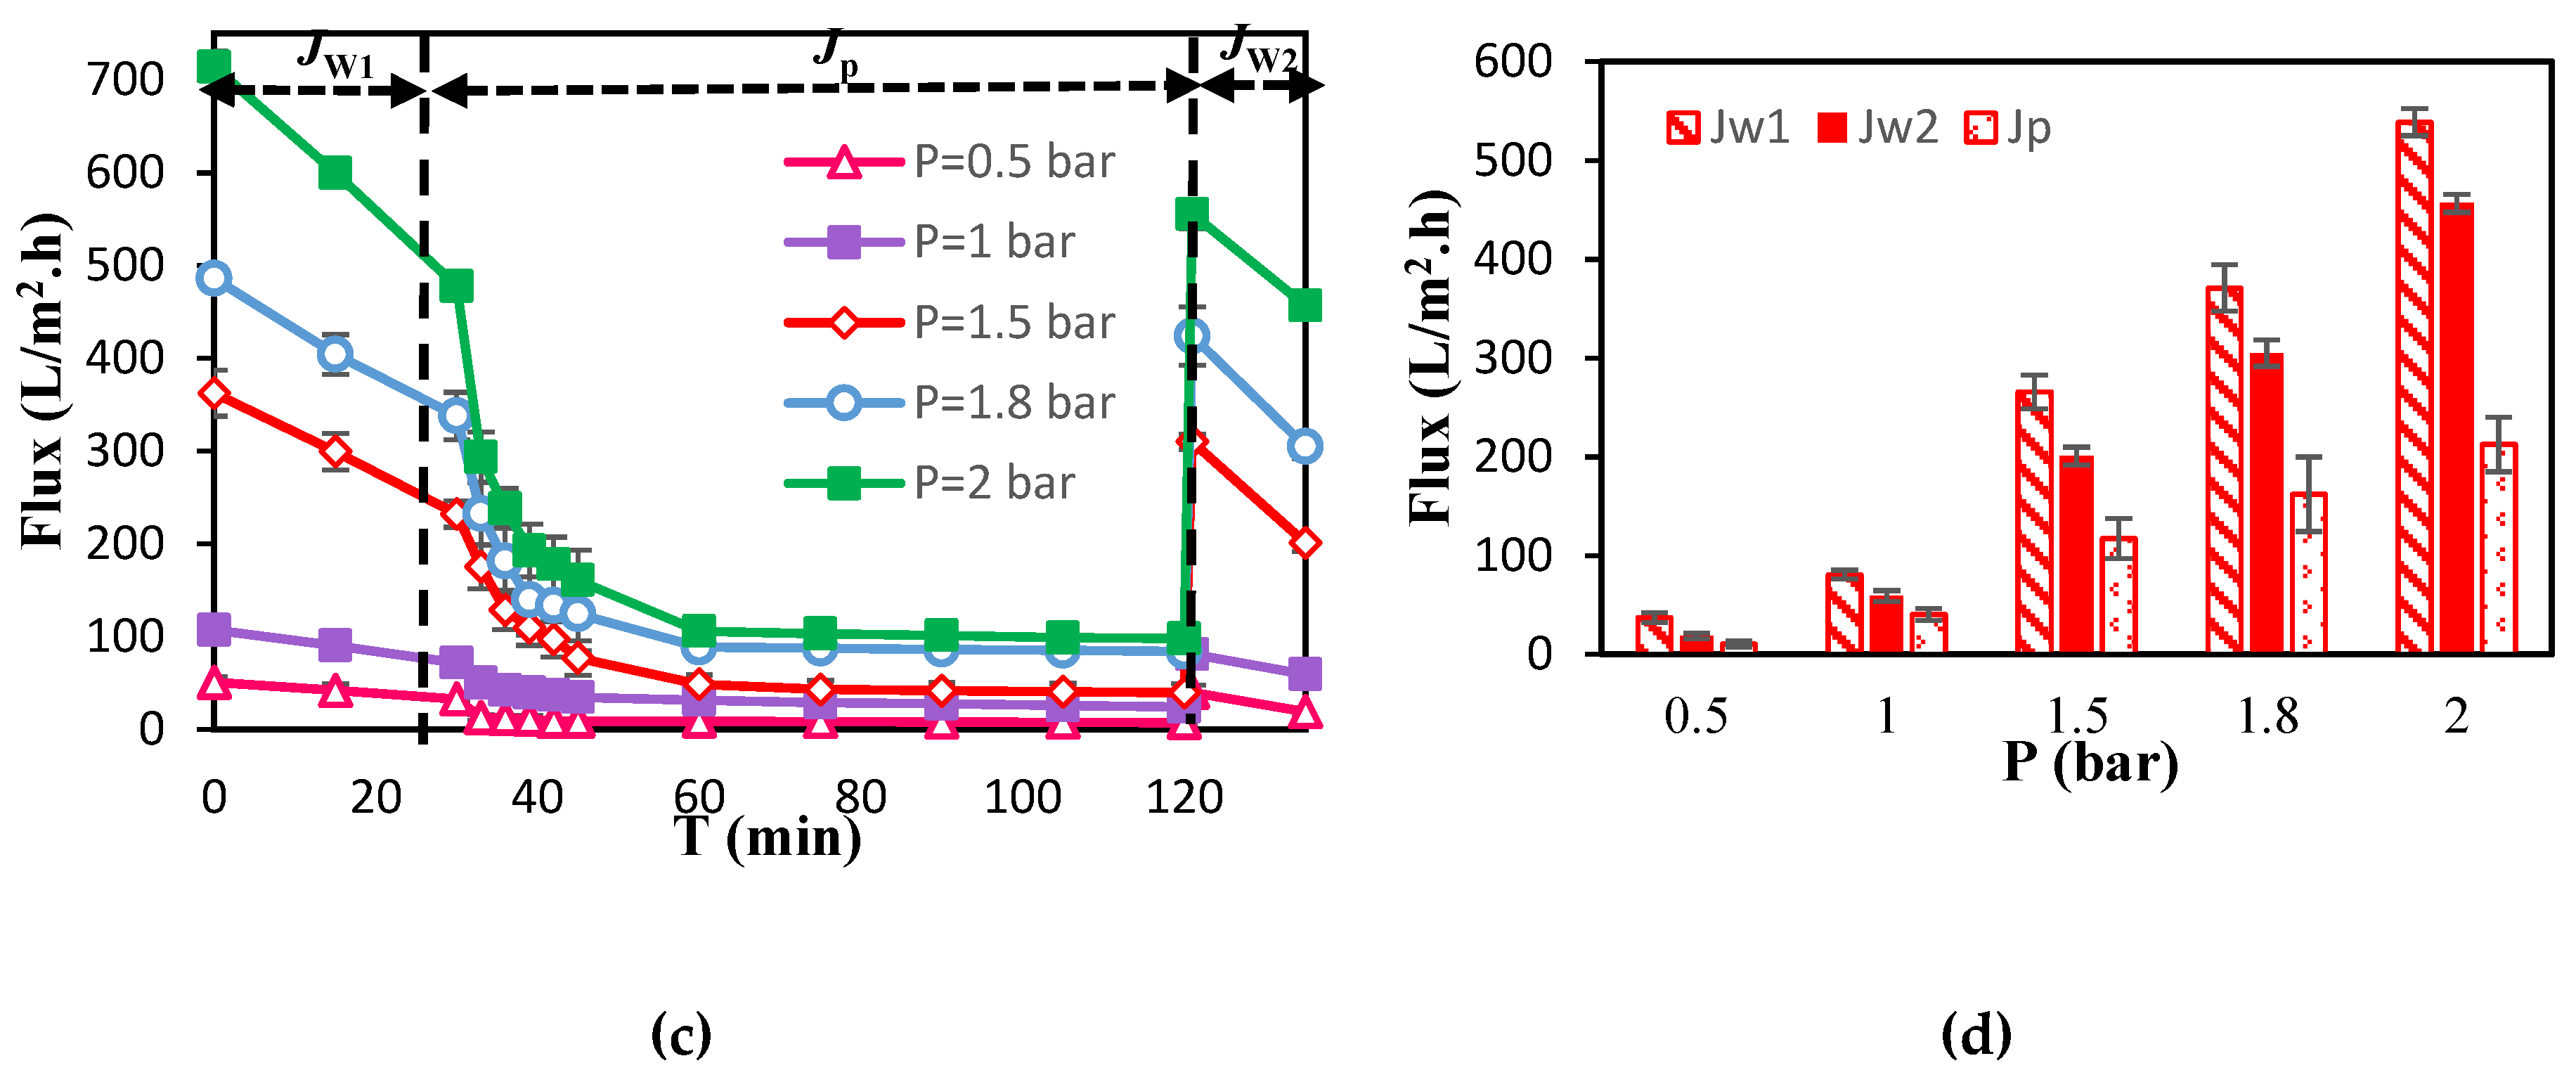
Figure 3.
a) Flux-time, b) Rejection, c) General flux, d) Jw1, Jw2 and Jp Flux changes passing through the M0 membrane at different concentrations of HA during 90 min. (P=1.5 bar, pH=7).
Figure 3.
a) Flux-time, b) Rejection, c) General flux, d) Jw1, Jw2 and Jp Flux changes passing through the M0 membrane at different concentrations of HA during 90 min. (P=1.5 bar, pH=7).
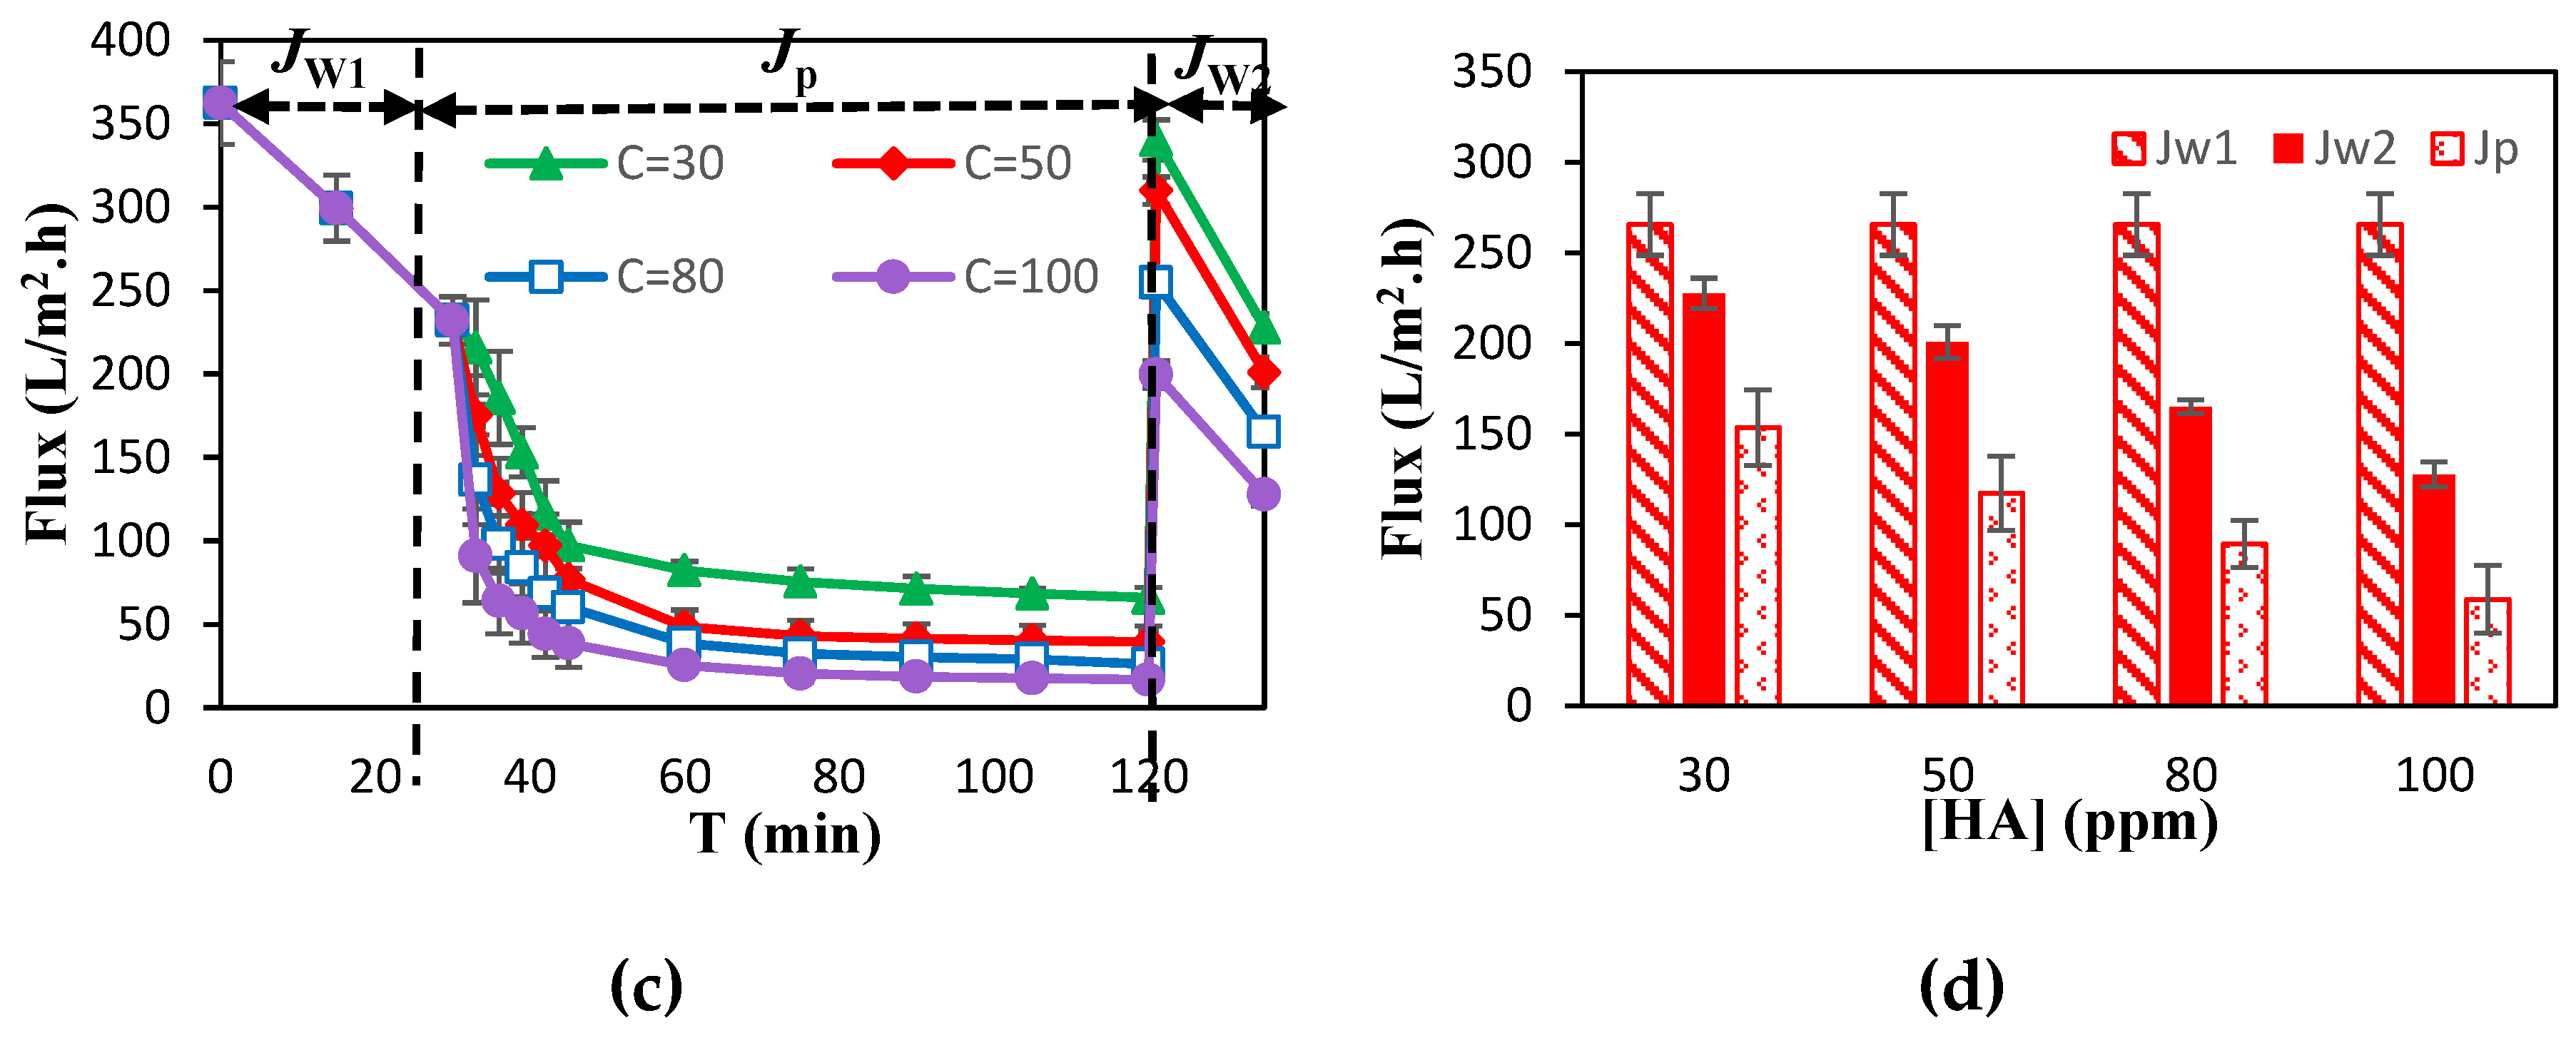
Figure 4.
a) Separation performance, b) Jw1, Jw2 and Jp Flux changes passing through all kinds of membranes during 90 min (P=1.5 bar, [HA]=80 ppm, pH=7).
Figure 4.
a) Separation performance, b) Jw1, Jw2 and Jp Flux changes passing through all kinds of membranes during 90 min (P=1.5 bar, [HA]=80 ppm, pH=7).
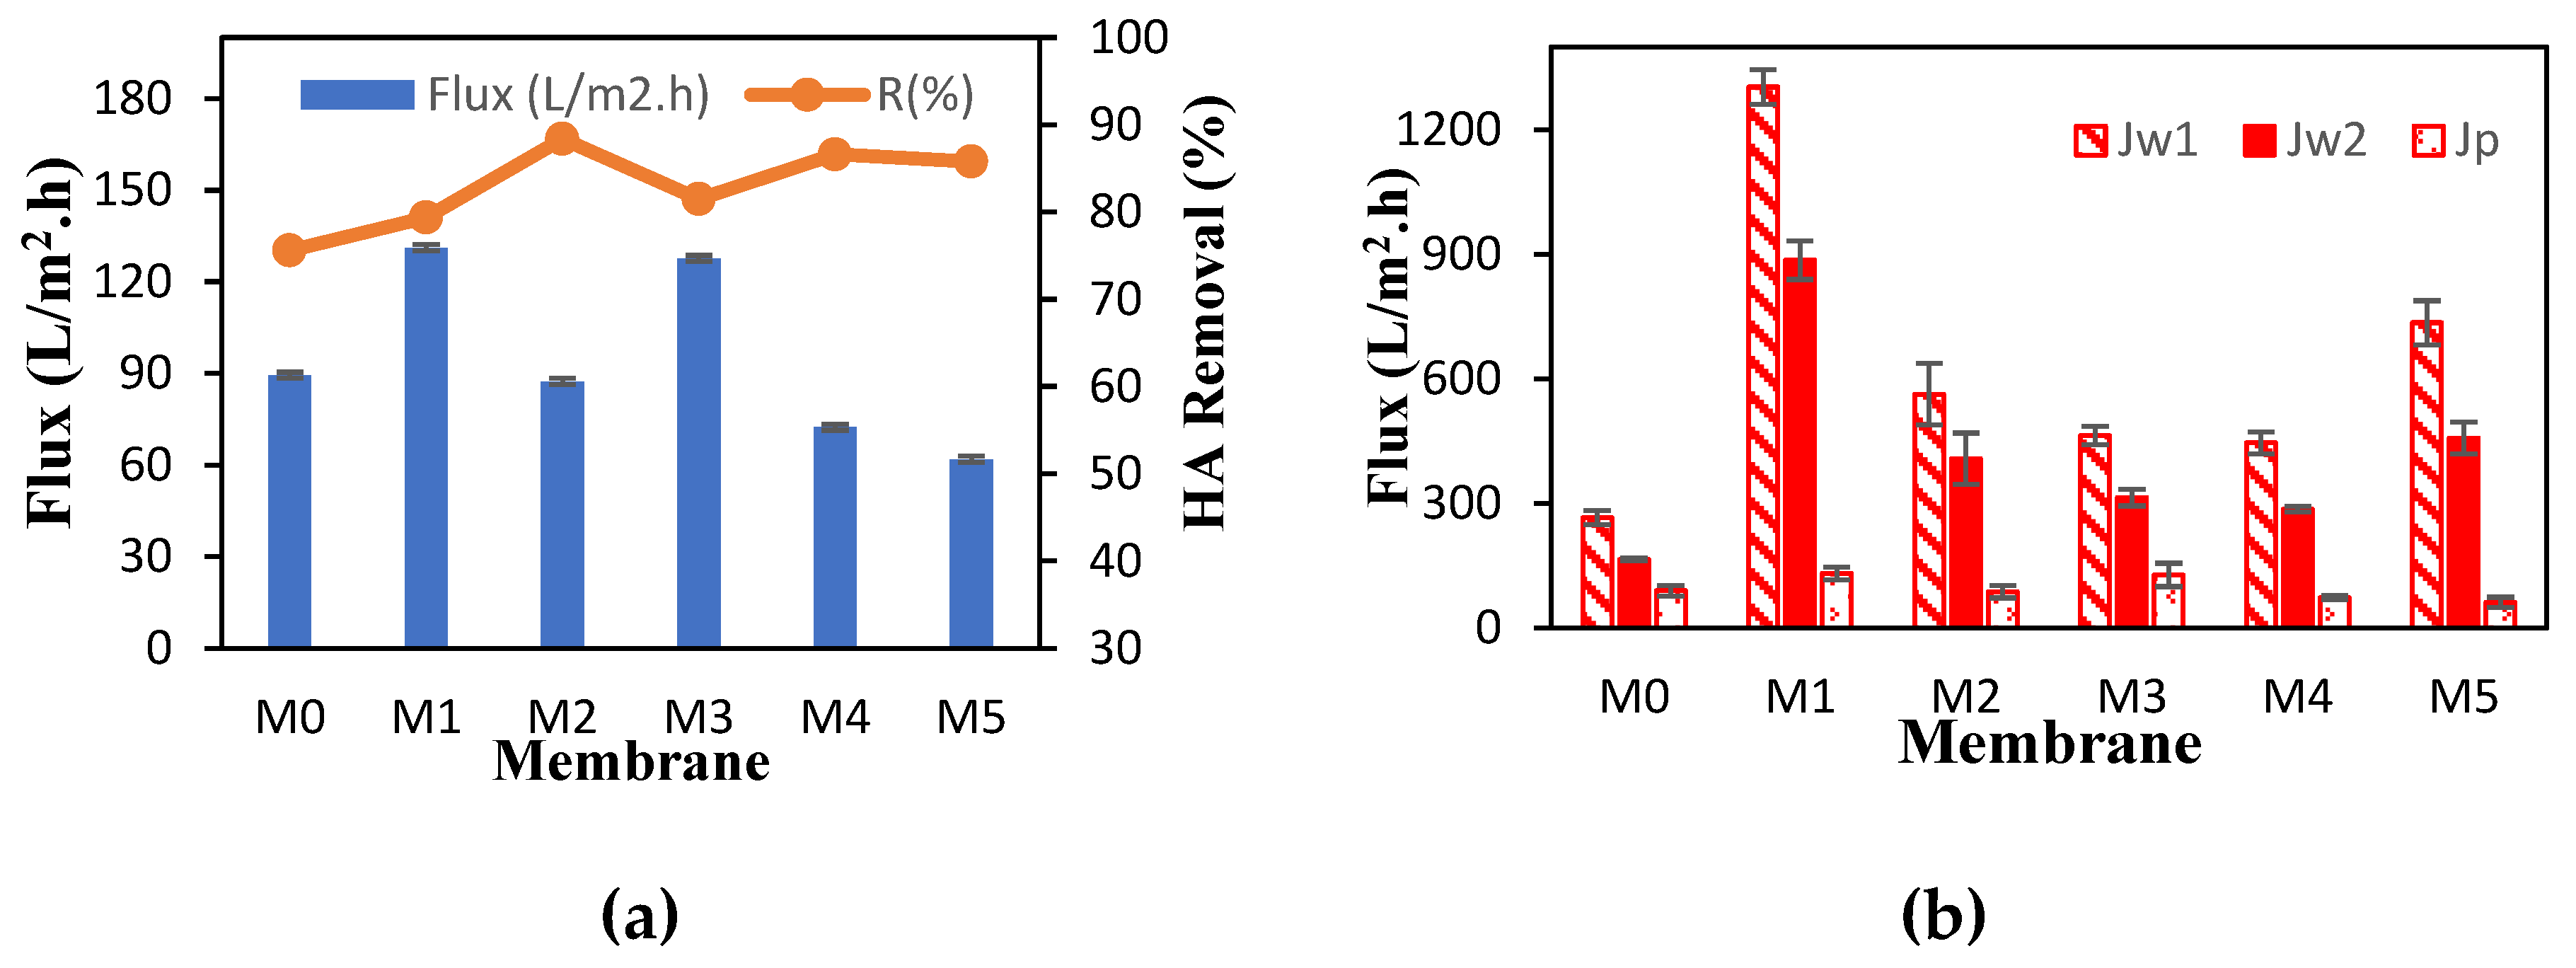
Figure 5.
Contact angle of all membranes.
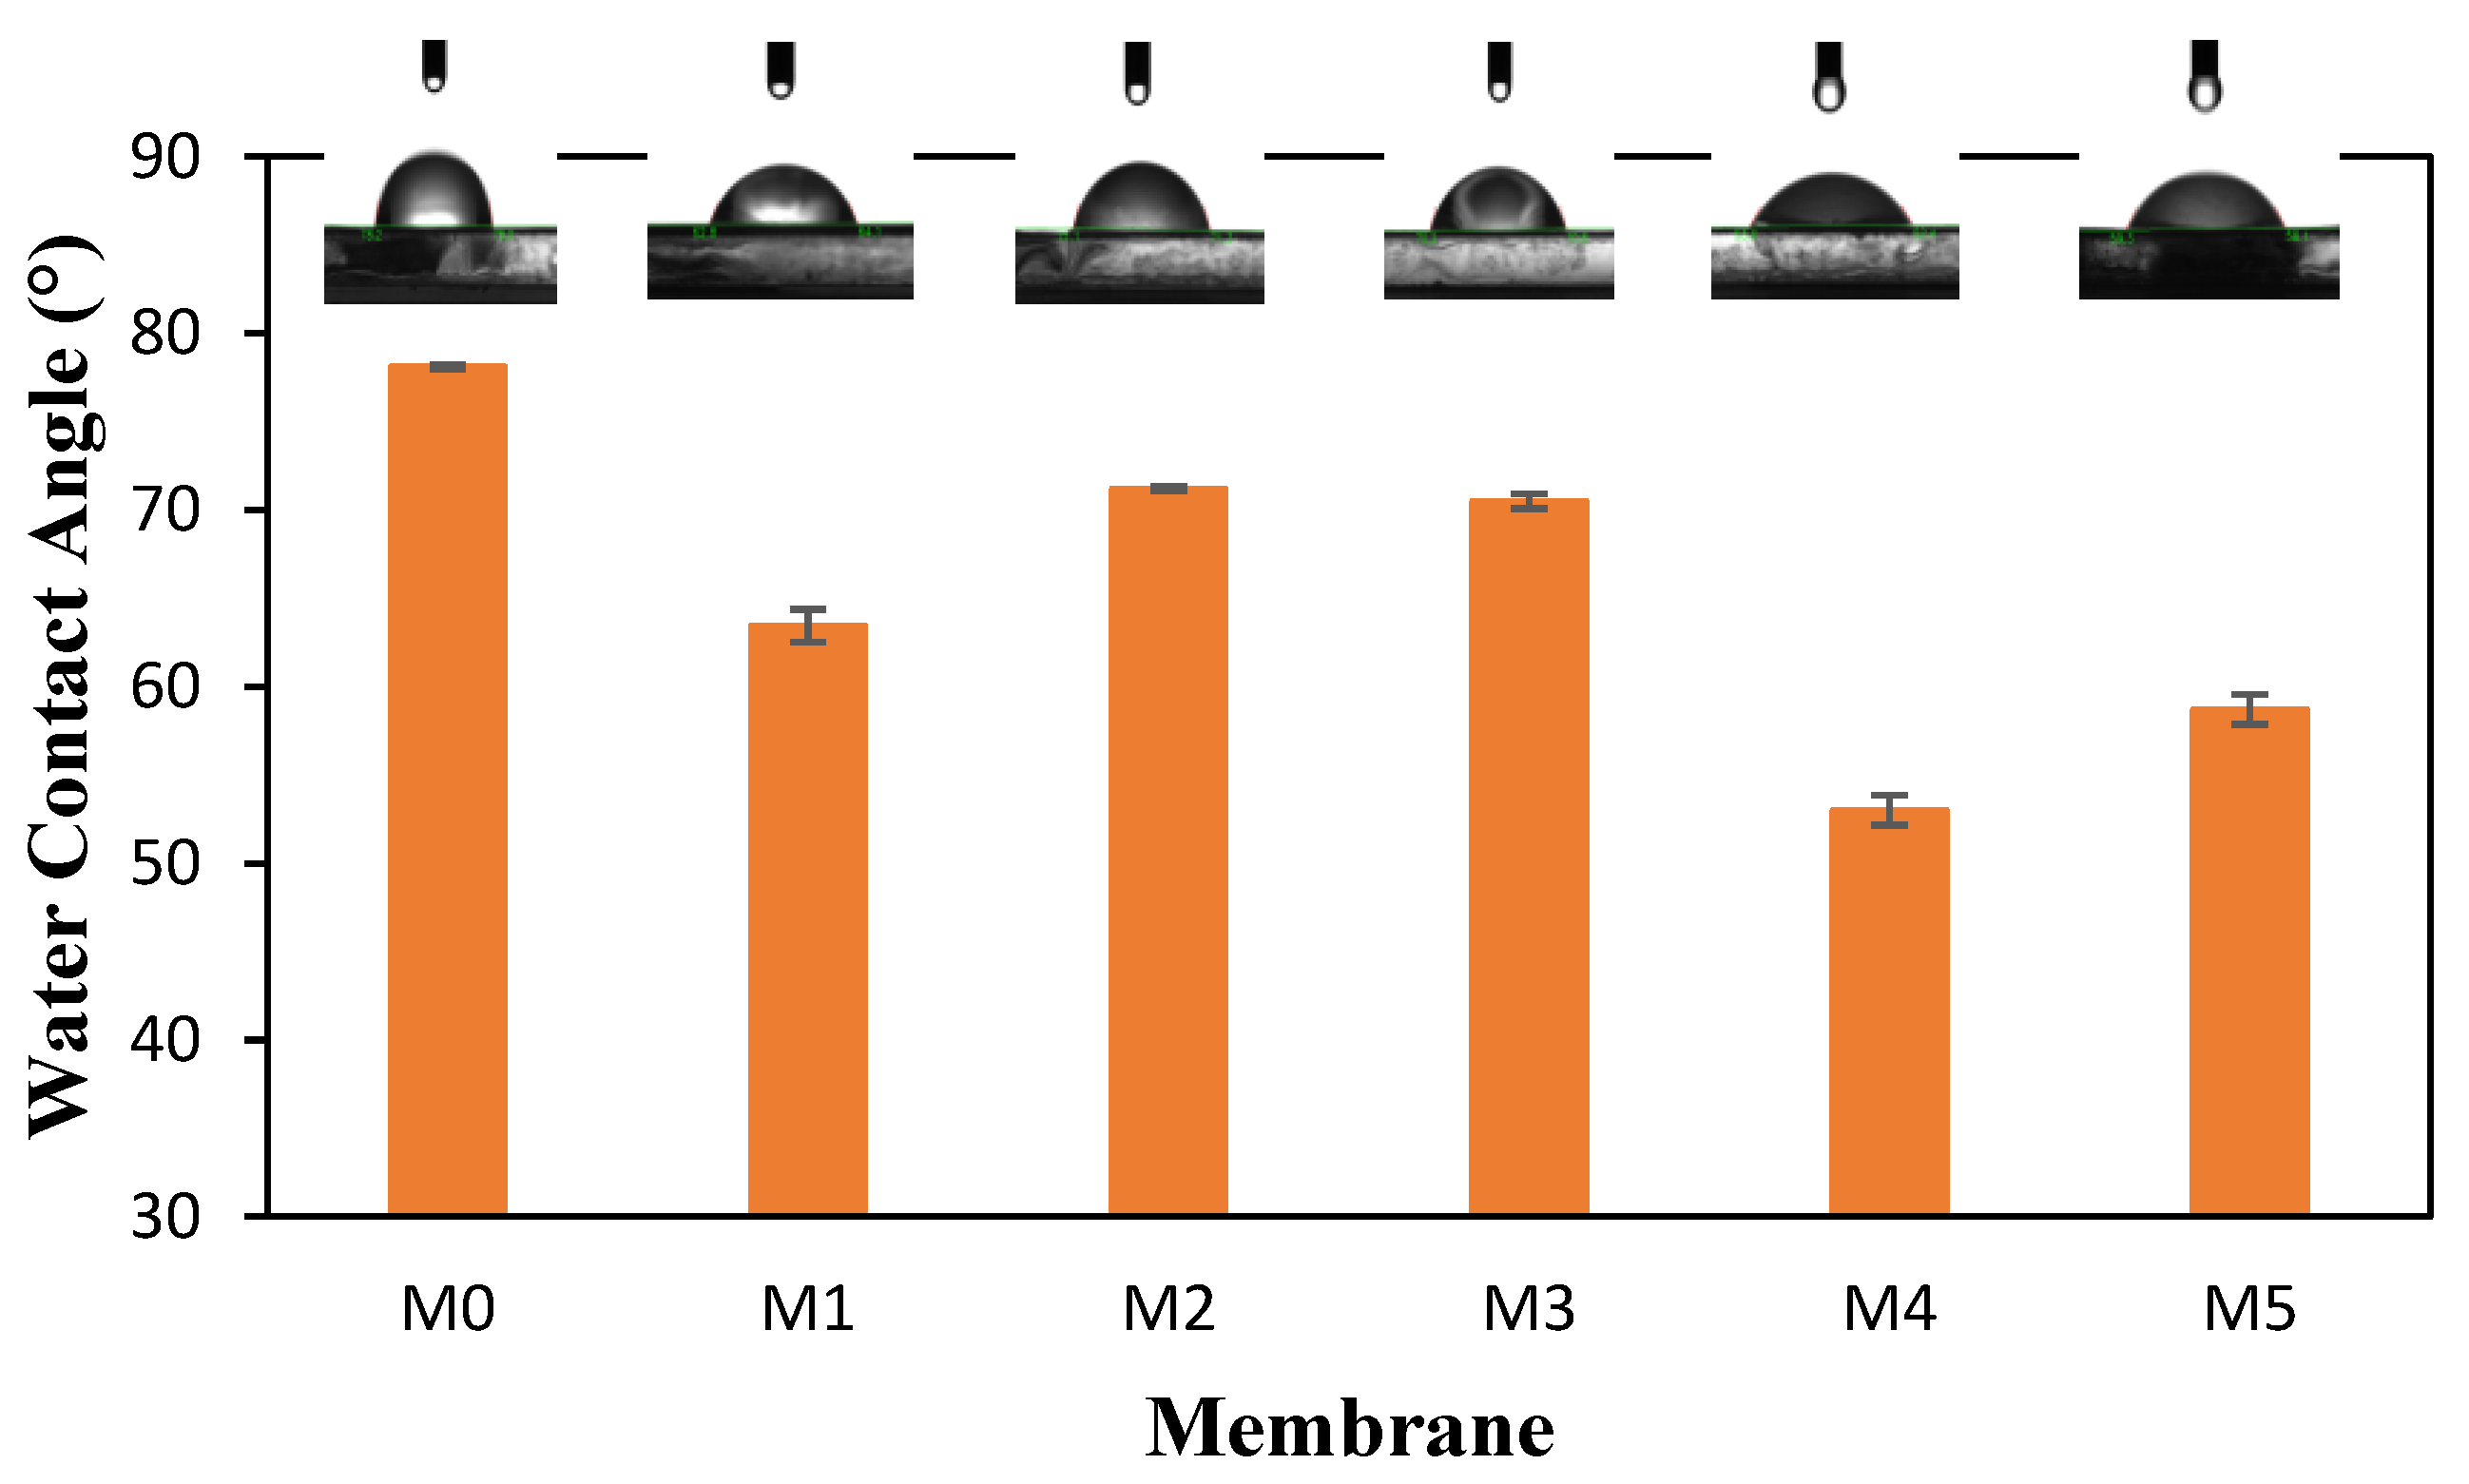
Figure 6.
a) Membrane resistances, b) total membrane resistance during 90 min (P=1.5 bar, [HA]=80 ppm, pH=7).
Figure 6.
a) Membrane resistances, b) total membrane resistance during 90 min (P=1.5 bar, [HA]=80 ppm, pH=7).
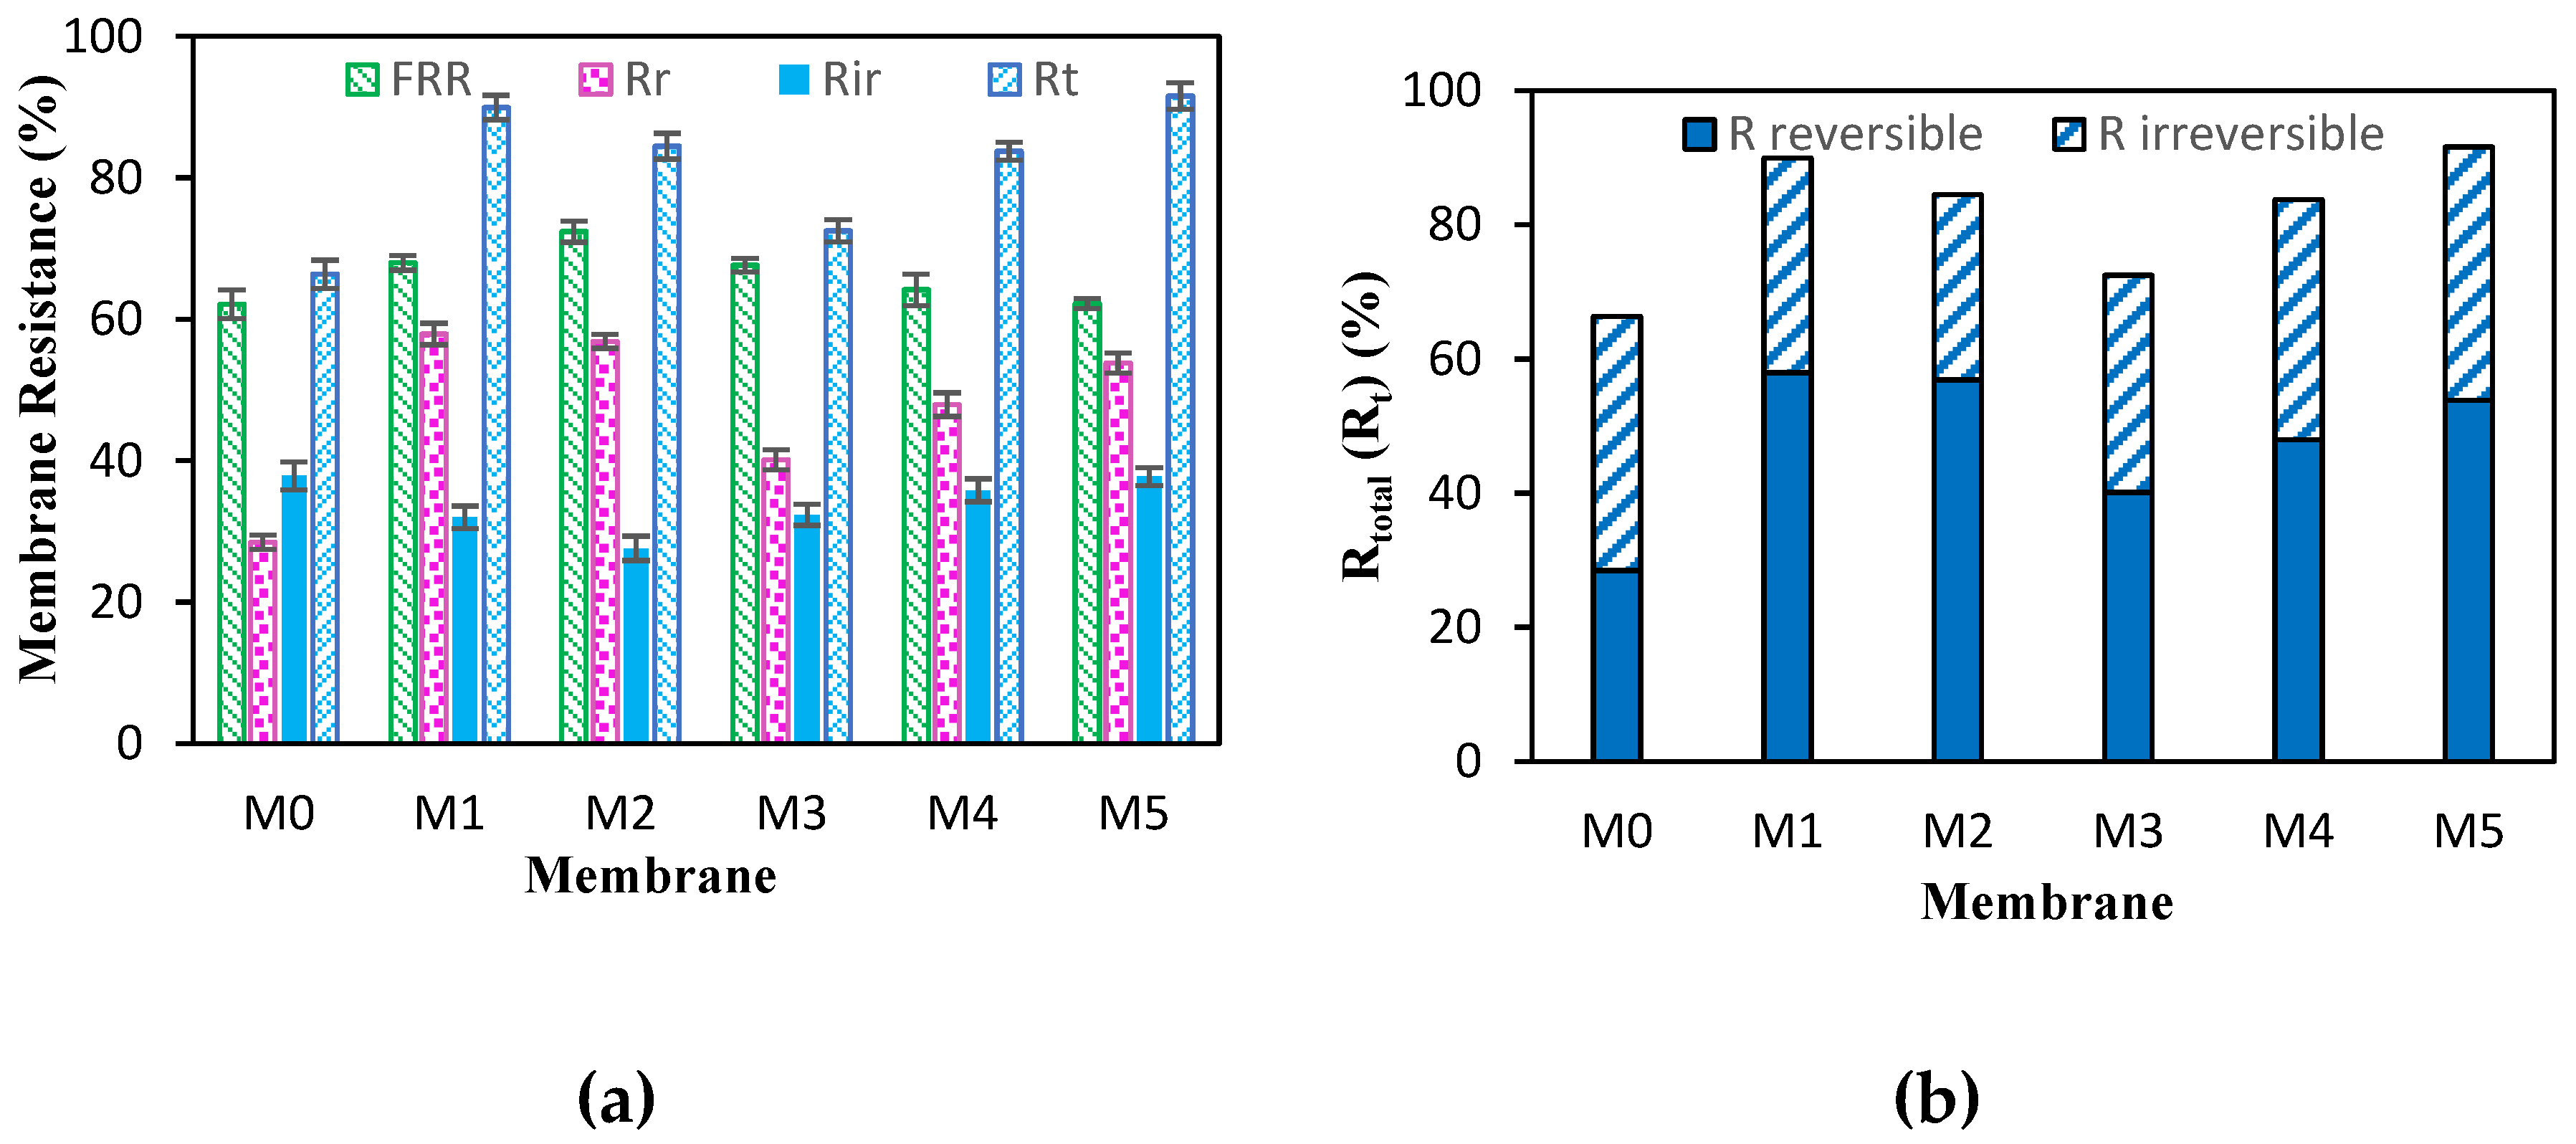
Figure 7.
a) Flux-time, b) Particle size and Zeta potential, c) separation performance of M4 membrane at Different pH of HA during 60 min (P=1.5 bar, [HA]=80 ppm).
Figure 7.
a) Flux-time, b) Particle size and Zeta potential, c) separation performance of M4 membrane at Different pH of HA during 60 min (P=1.5 bar, [HA]=80 ppm).
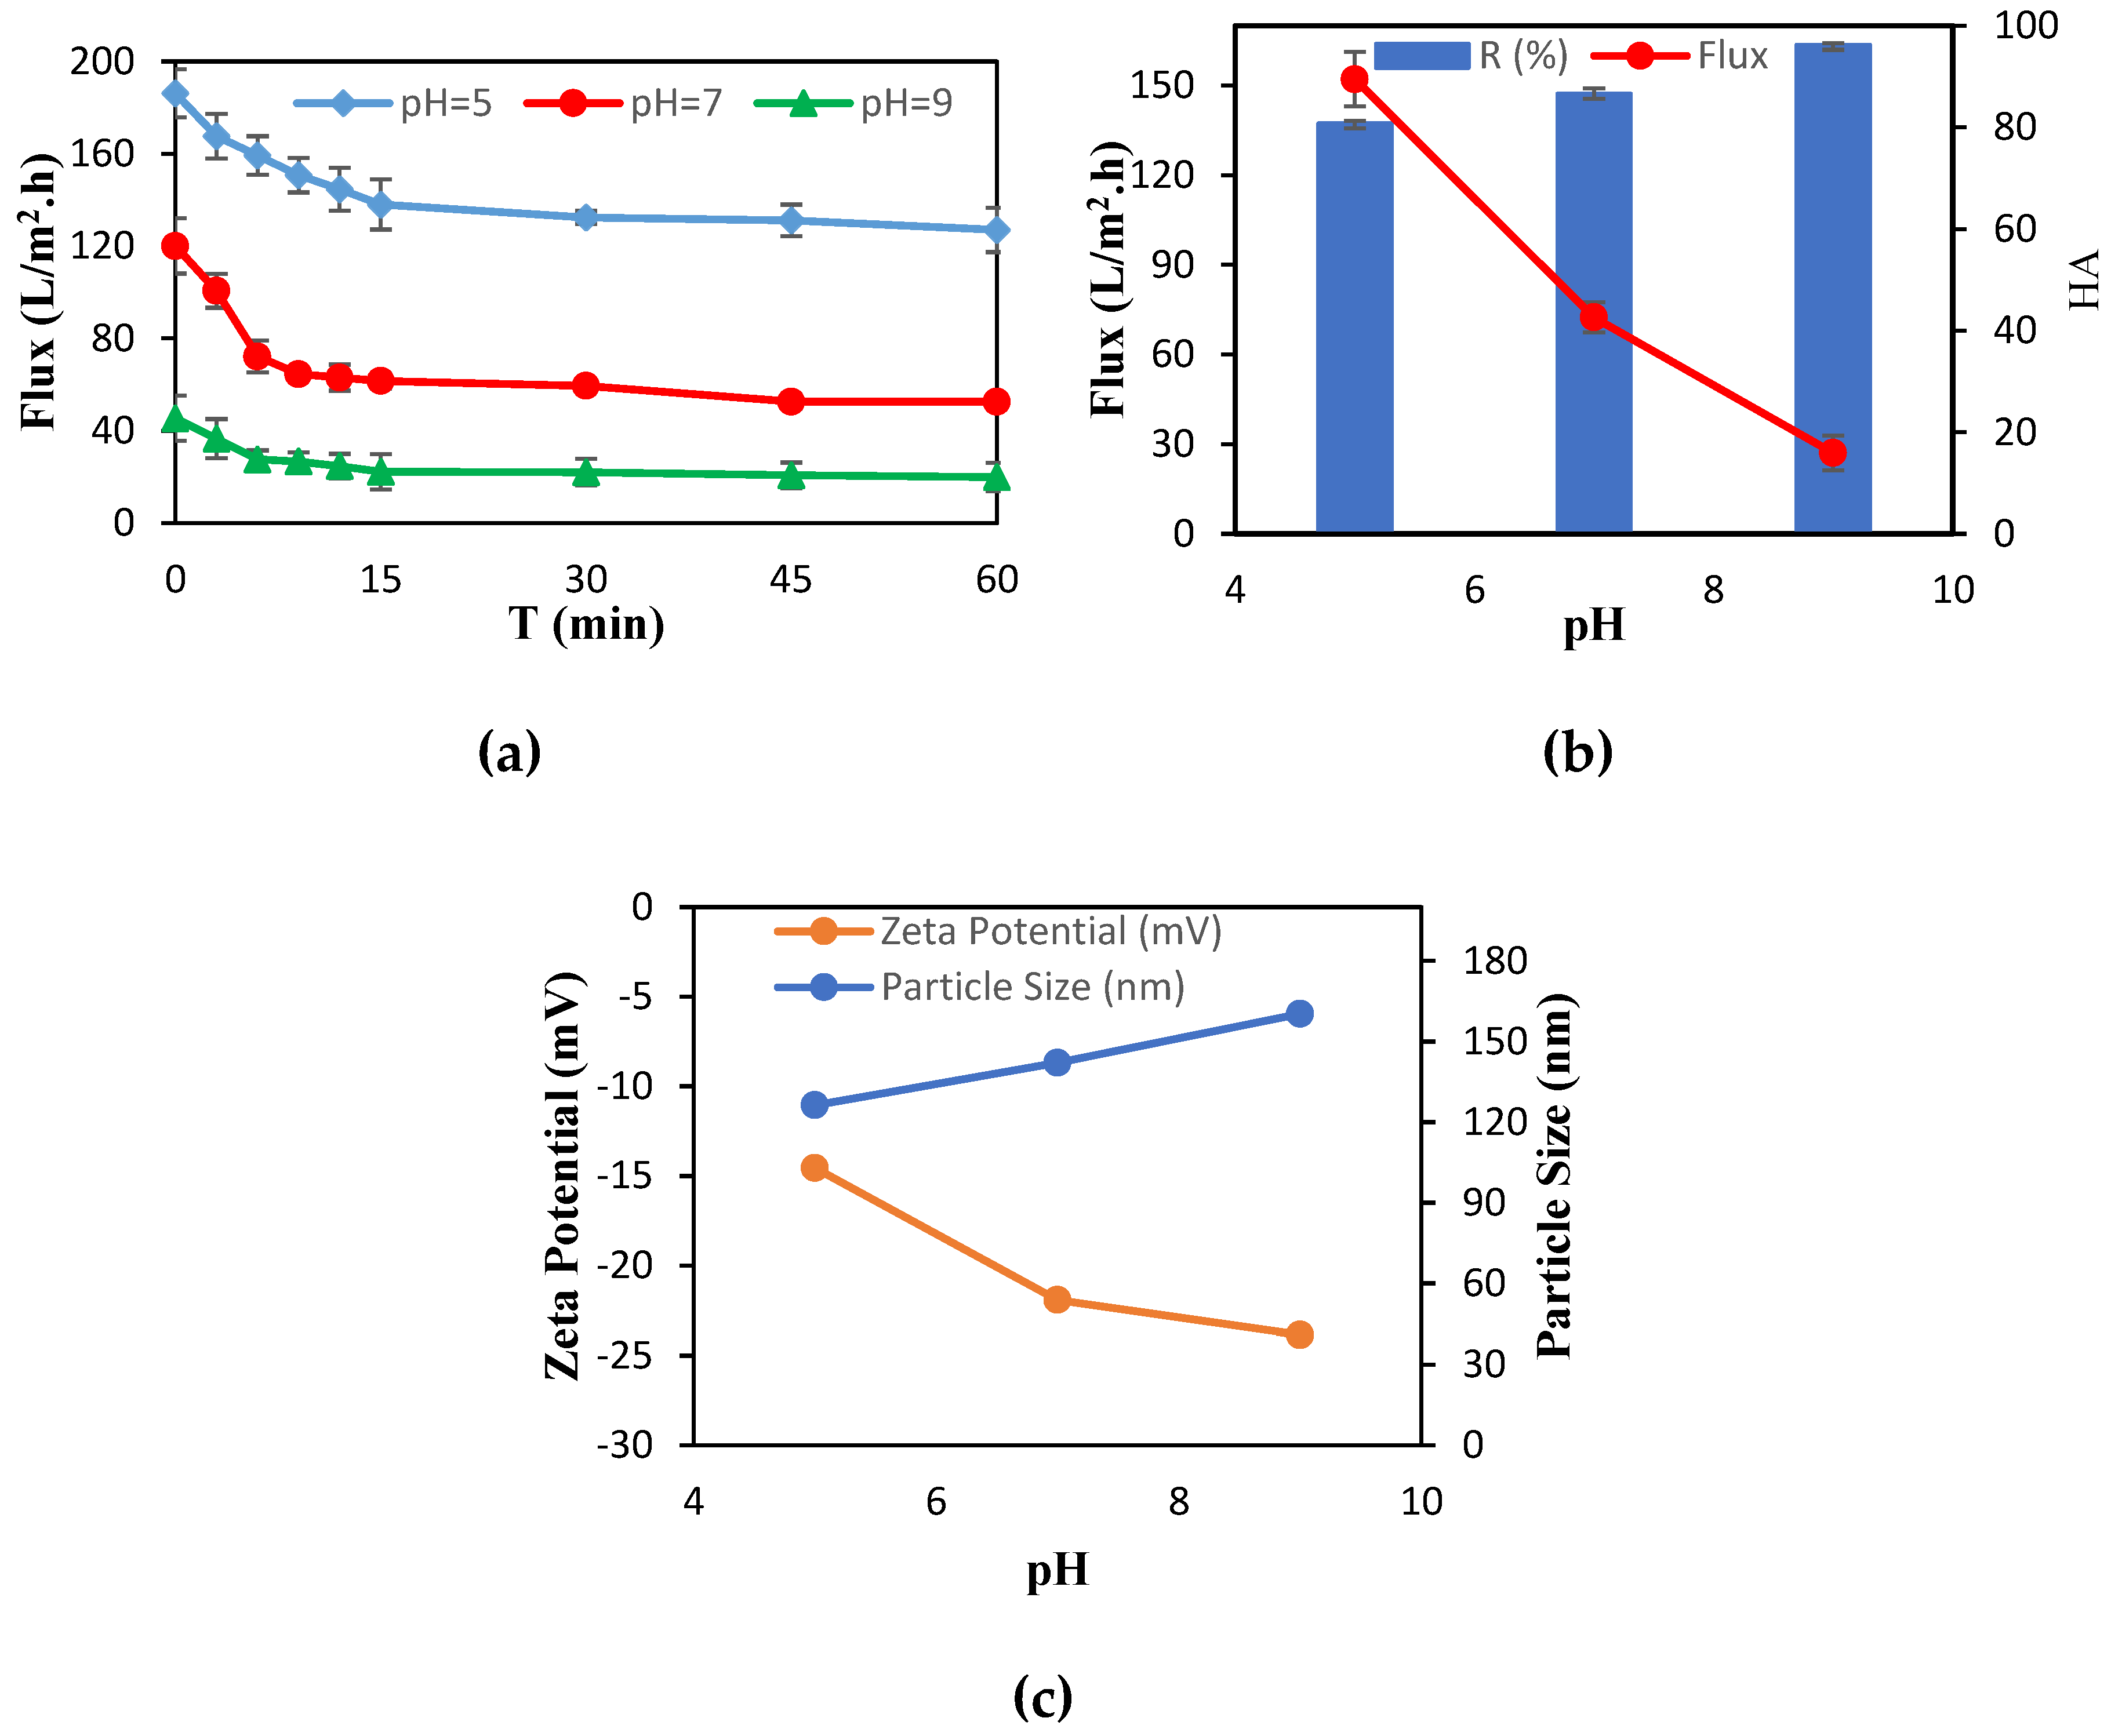
Figure 8.
a) General flux, b) Jw1, Jw2 and Jp Flux changes passing through the M4 membrane at Different pH of HA during 60 min (P=1.5 bar, [HA]=80 ppm).
Figure 8.
a) General flux, b) Jw1, Jw2 and Jp Flux changes passing through the M4 membrane at Different pH of HA during 60 min (P=1.5 bar, [HA]=80 ppm).
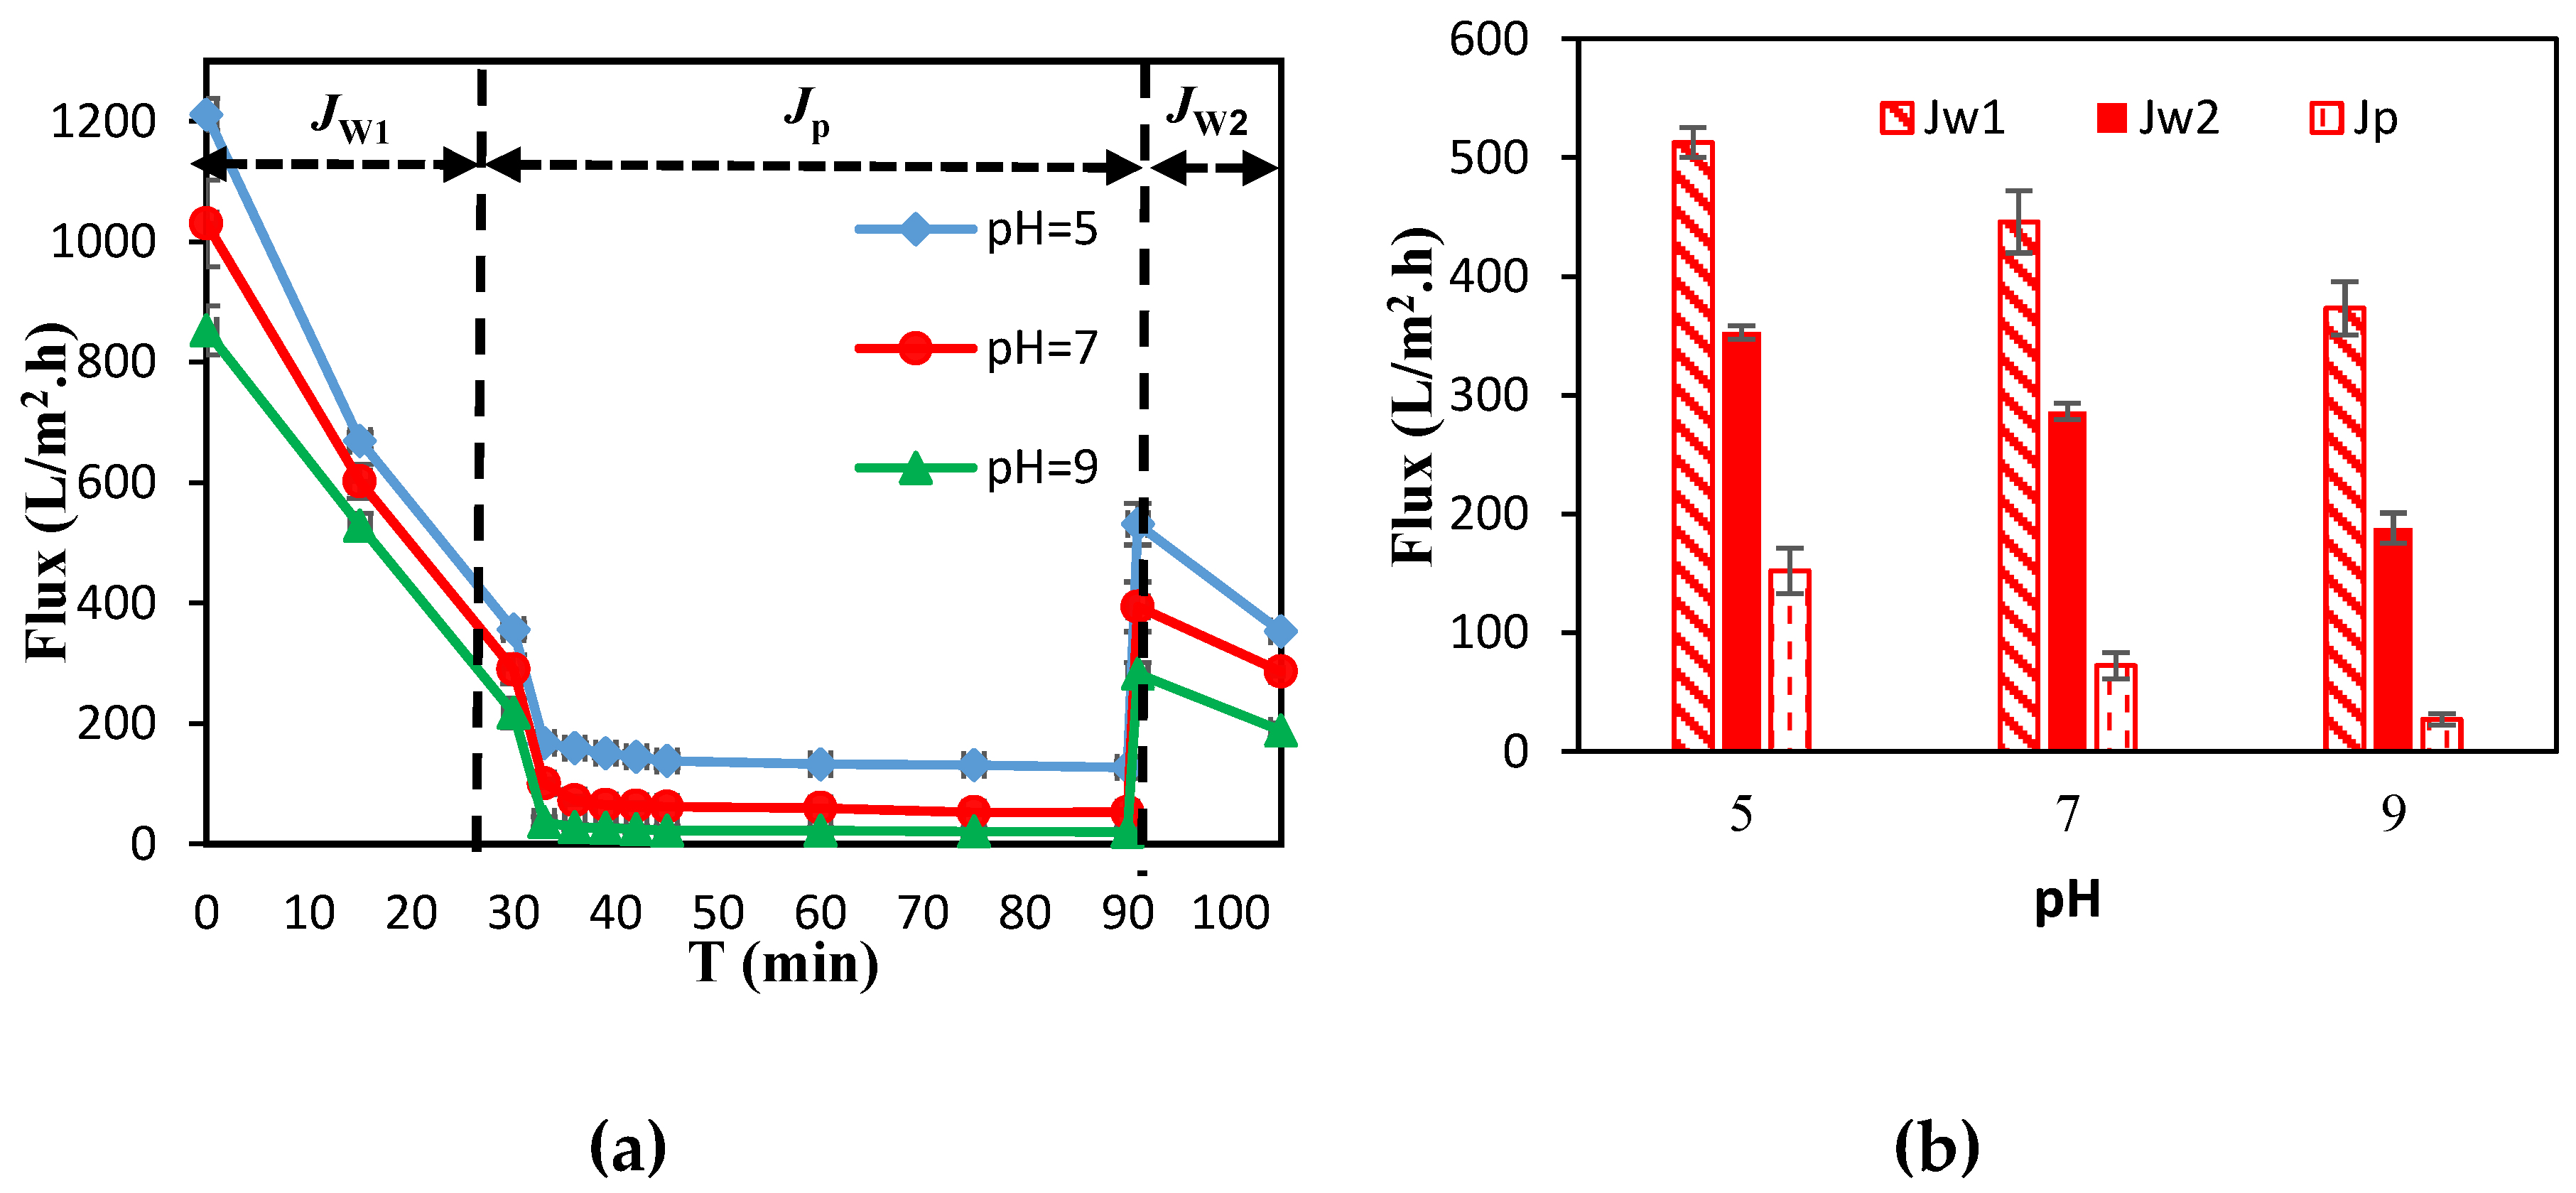
Figure 9.
ATR-FTIR spectra of all membranes.
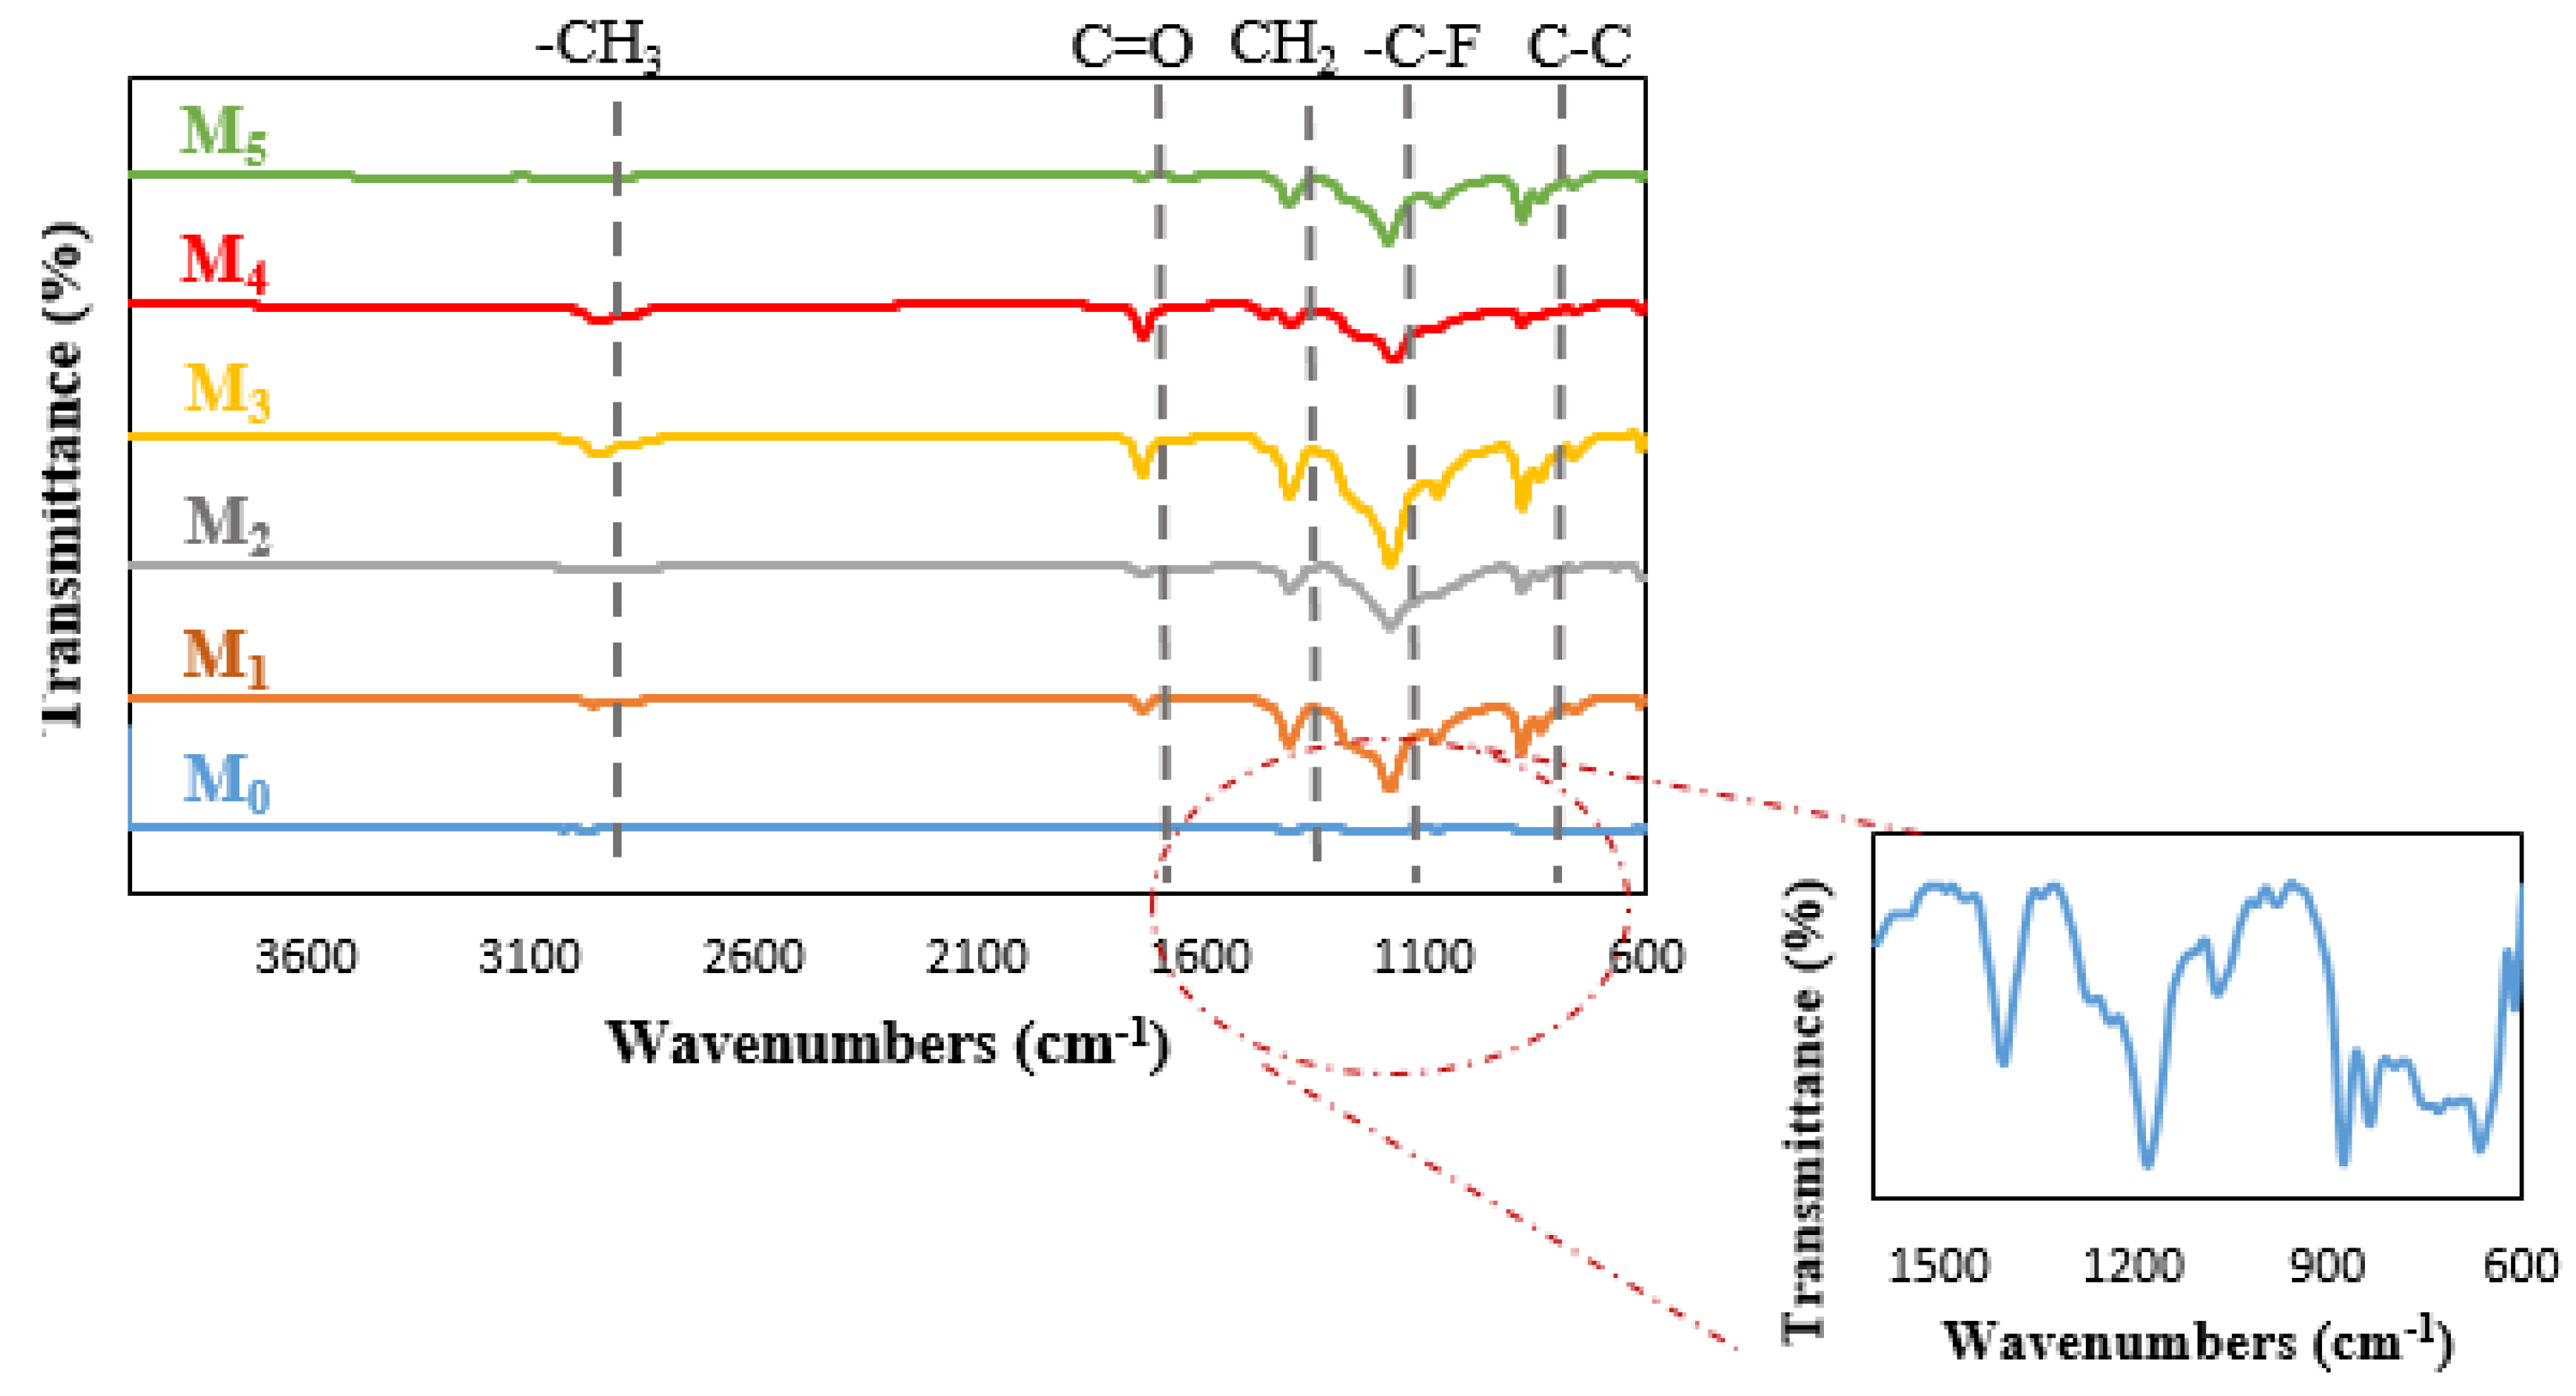
Figure 10.
Images of the M0 and M4 membranes a) FESEM top surface (500 nm) b) FESEM cross section (20 µm) c) AFM (10 µm 10 µm).
Figure 10.
Images of the M0 and M4 membranes a) FESEM top surface (500 nm) b) FESEM cross section (20 µm) c) AFM (10 µm 10 µm).
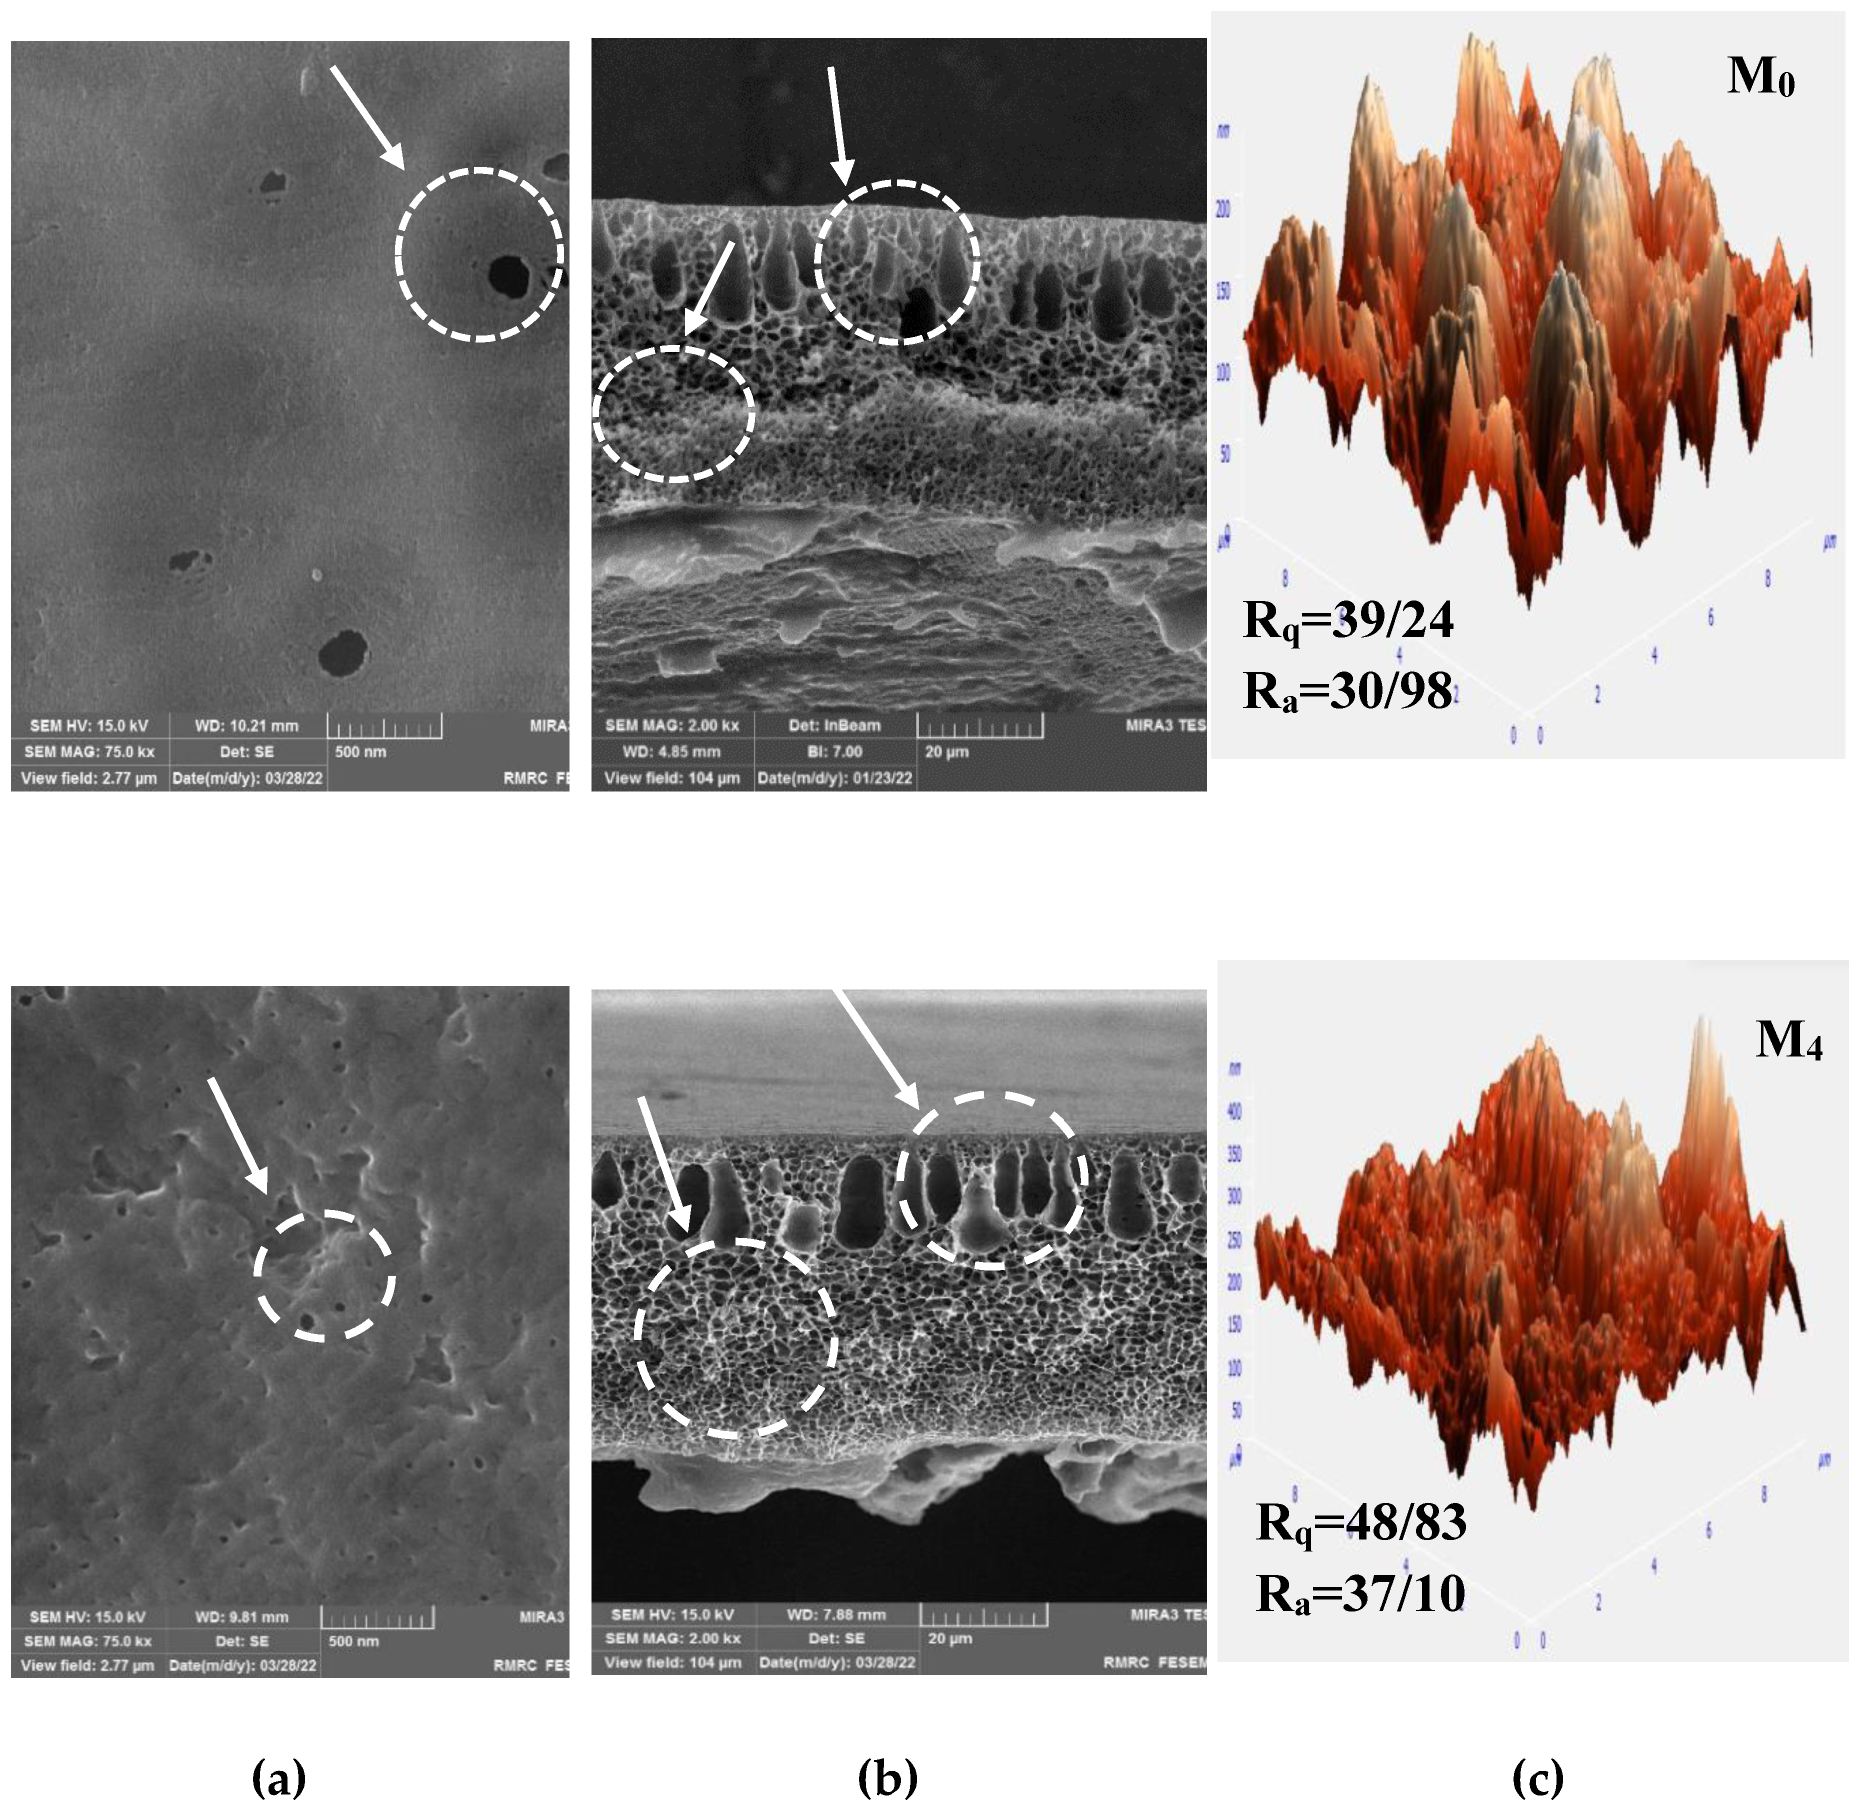
Figure 11.
a) EDS spectra b) EDX mappings of the membrane surface of (1) M0, and (2) M4 membranes and total mappings of (3) M0 and (4) M4 membranes.
Figure 11.
a) EDS spectra b) EDX mappings of the membrane surface of (1) M0, and (2) M4 membranes and total mappings of (3) M0 and (4) M4 membranes.
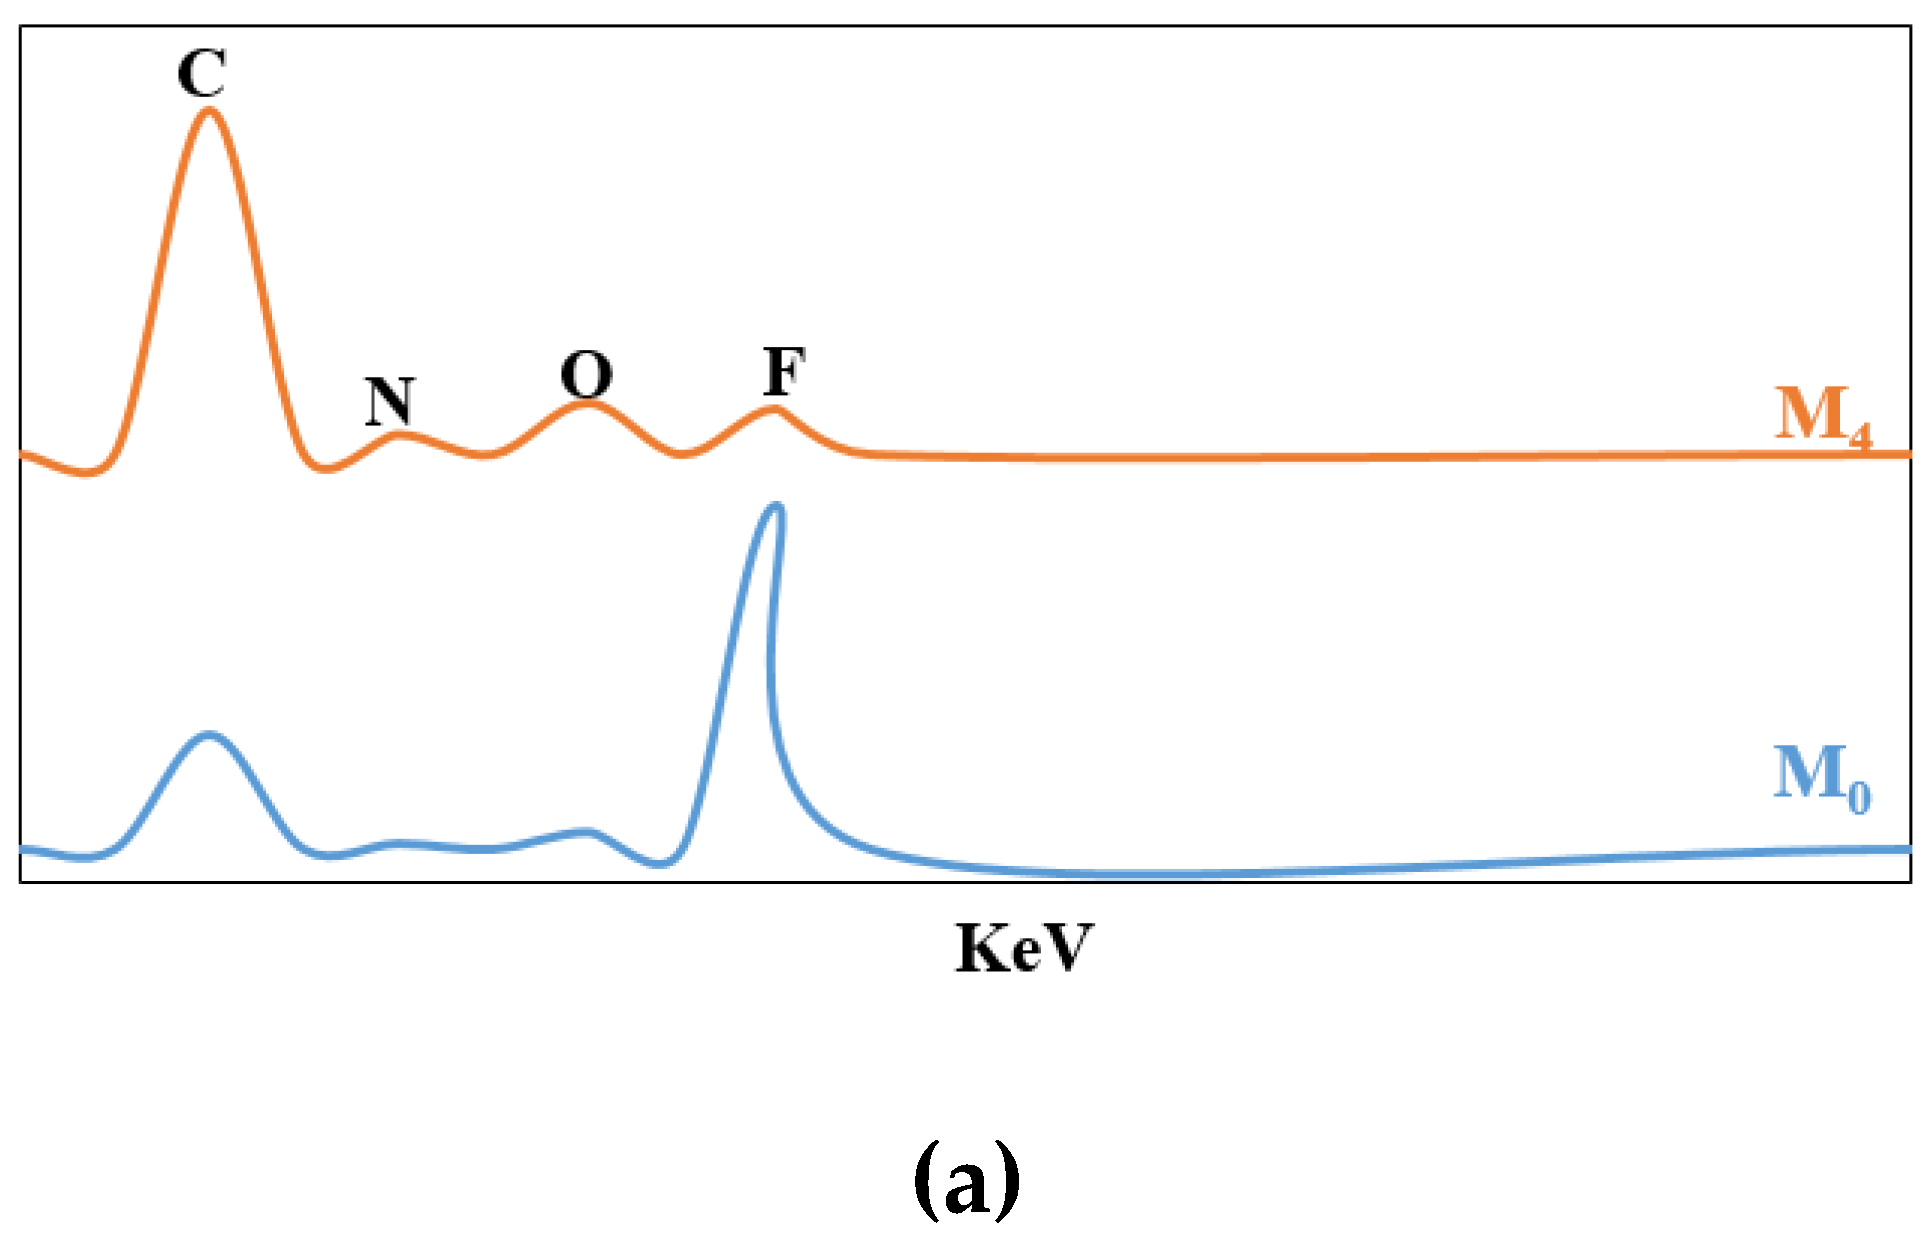
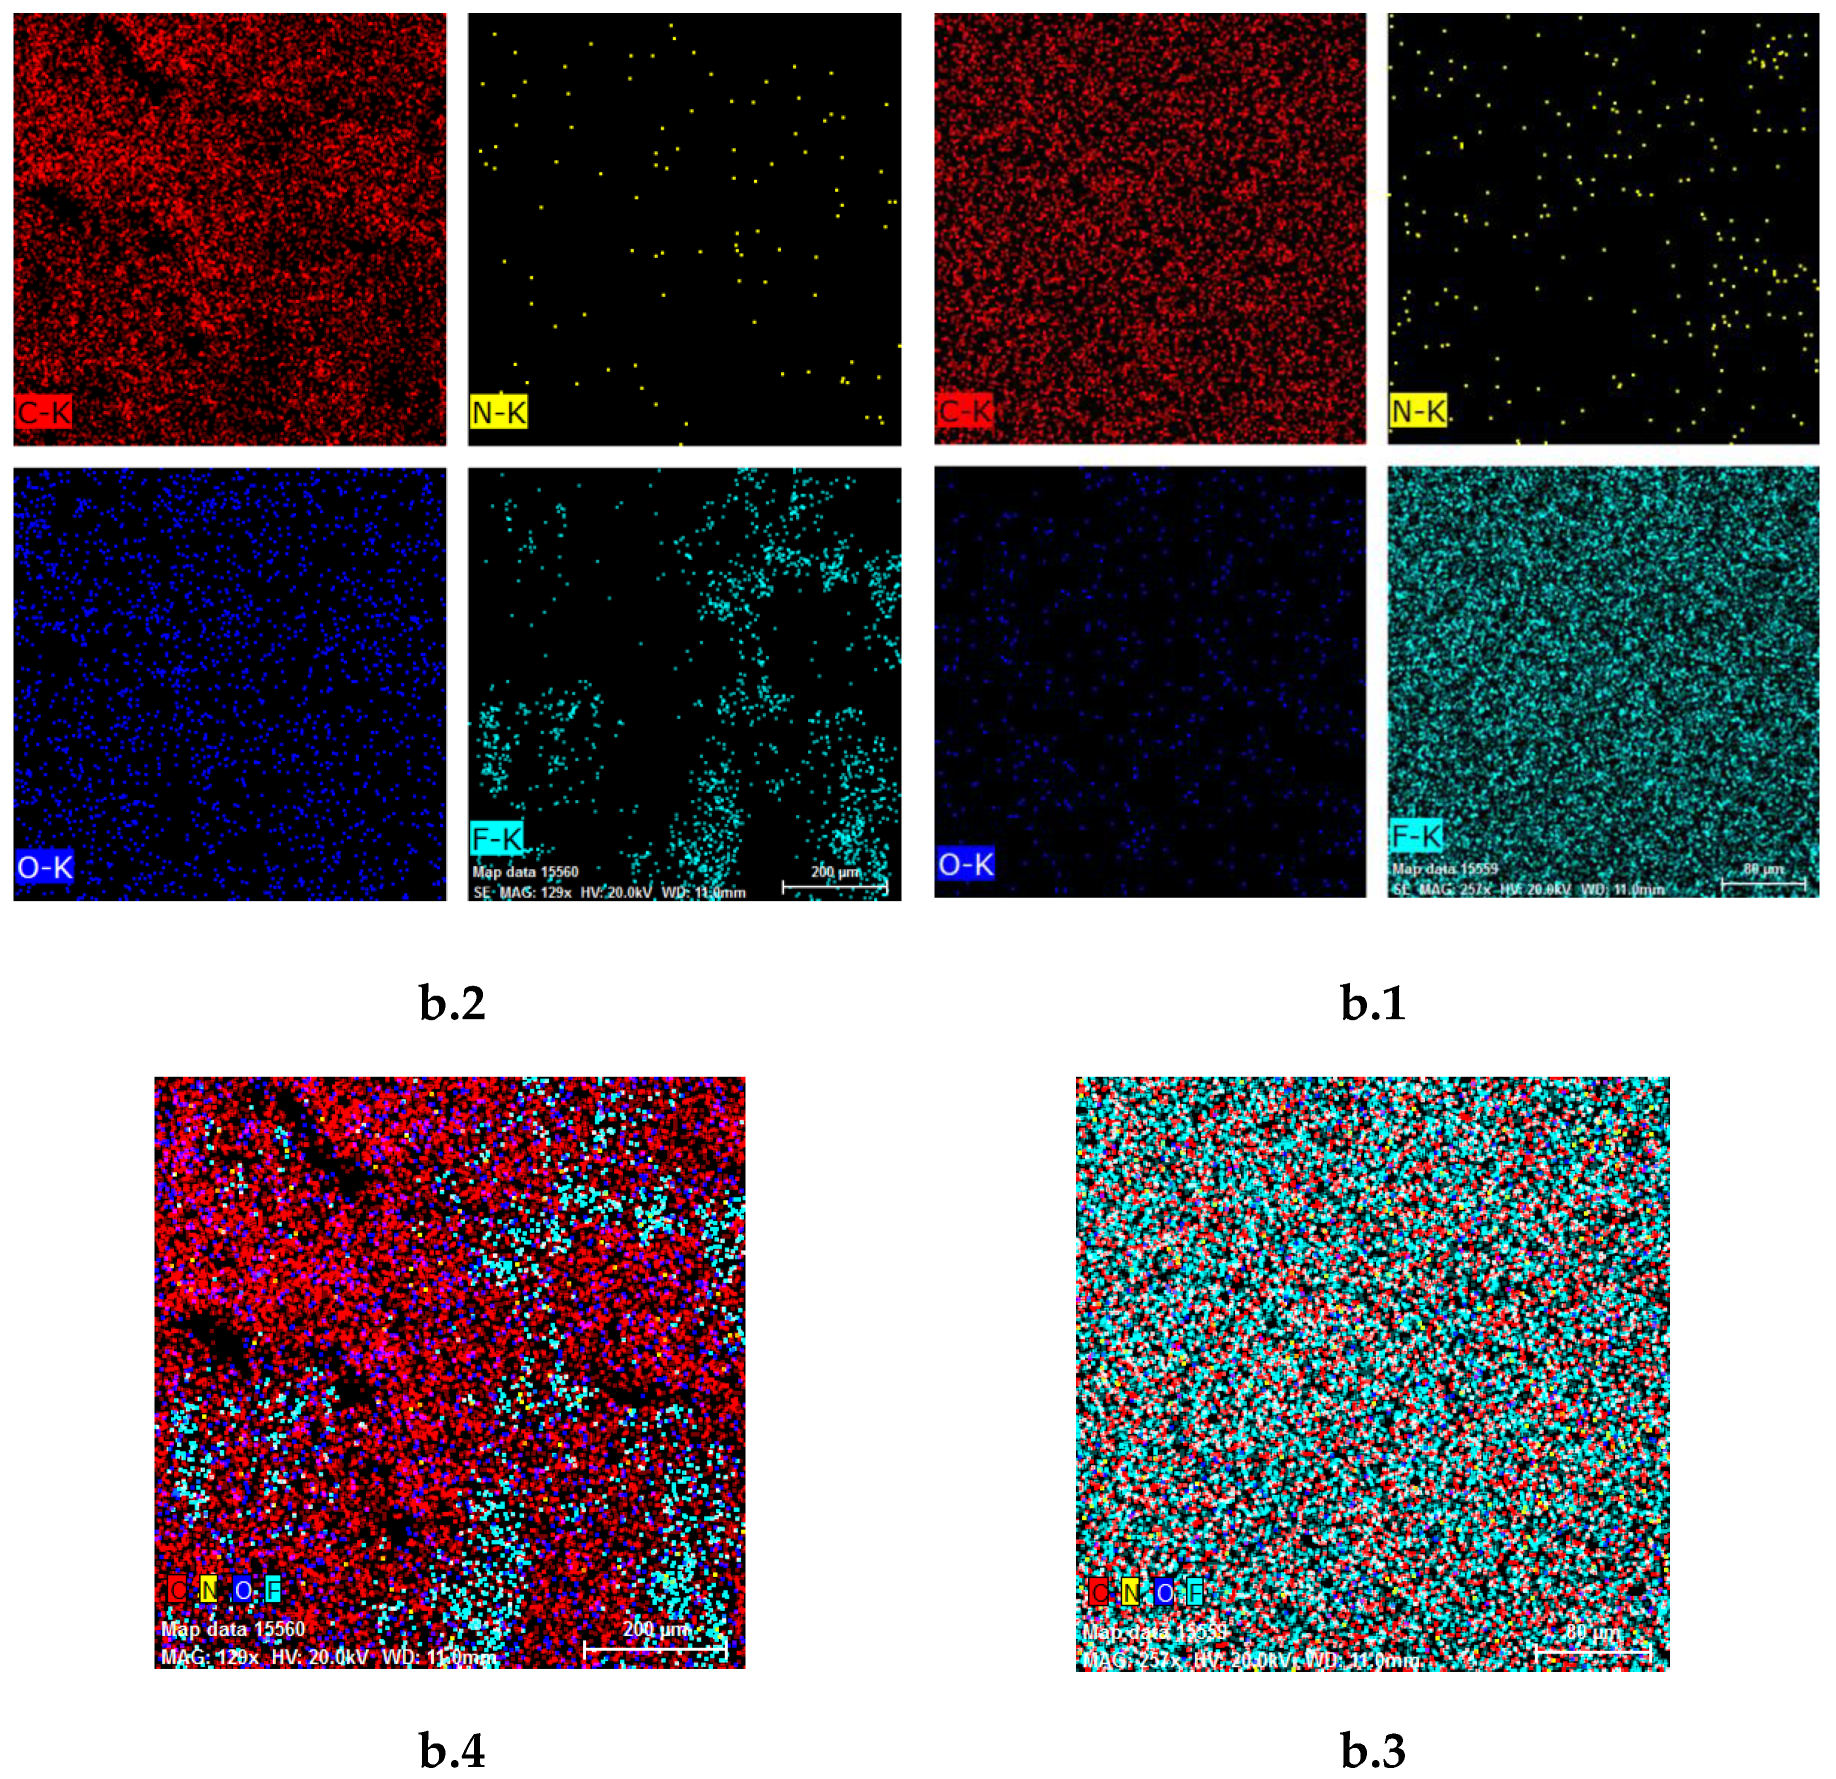

Table 1.
Effective Parameters.
| Parameter | Range |
|---|---|
| Pollutant Concentration (ppm) | 30, 50, 80, 100 |
| Additive to Nanoparticles Weigh Percentage Ratio )w%( (PEG:TA) | 0:0 (M0), 1:0 (M1), 0:1 (M2), 1:1 (M3), 4:1 (M4), 1:4 (M5) |
| pH | 5, 7, 9 |
| Pressure (bar) | 0.5. 1, 1.5, 1.8, 2 |
Table 2.
Membrane characterization.
| Membrane | PEG:TA | Jp (L/m2.h) | R (%) | FRR (%) | Rr (%) | Rir (%) | Rt (%) | ε (%) | Dm (nm) |
|---|---|---|---|---|---|---|---|---|---|
| M0 | 0:0 | 89.39 | 75.59 | 62.12 | 28.47 | 37.87 | 66.34 | 56.98 | 21.59 |
| M1 | 1:0 | 131.21 | 79.37 | 67.98 | 57.92 | 32.01 | 89.93 | 73.46 | 44.59 |
| M2 | 0:1 | 87.4 | 88.38 | 72.39 | 56.86 | 27.6 | 84.47 | 49.38 | 40.92 |
| M3 | 1:1 | 127.62 | 81.49 | 67.64 | 40.12 | 32.35 | 72.48 | 65.74 | 29.89 |
| M4 | 4:1 | 72.43 | 86.62 | 64.17 | 47.93 | 35.82 | 83.76 | 46.62 | 34.24 |
| M5 | 1:4 | 61.9 | 85.79 | 62.23 | 53.81 | 37.76 | 91.58 | 37.03 | 48.48 |
Disclaimer/Publisher’s Note: The statements, opinions and data contained in all publications are solely those of the individual author(s) and contributor(s) and not of MDPI and/or the editor(s). MDPI and/or the editor(s) disclaim responsibility for any injury to people or property resulting from any ideas, methods, instructions or products referred to in the content. |
© 2024 by the authors. Licensee MDPI, Basel, Switzerland. This article is an open access article distributed under the terms and conditions of the Creative Commons Attribution (CC BY) license (https://creativecommons.org/licenses/by/4.0/).
Copyright: This open access article is published under a Creative Commons CC BY 4.0 license, which permit the free download, distribution, and reuse, provided that the author and preprint are cited in any reuse.


