Submitted:
07 April 2024
Posted:
08 April 2024
You are already at the latest version
Abstract
Rising organic charge in northern freshwaters is attributed to increasing levels of Dissolved Natural Organic Matter (DNOM) and shifts in water chemistry. Organic charge concentration may be determined by charge balance calculations (Org.-) or modelled (OAN-) using the conceptual Oliver and Hruška models based on the density of weak acid functional sites (SD) present in DNOM. The charge density (CD) is governed by the SD and protonation and complexation reactions on the functional groups. The models use this SD as a key parameter in empirically fitting the model to Org.-. Utilizing extensive datasets of water chemistry, this study shows that spatial and temporal differences in SD and CD are influenced by variations in the humic-to-fulvic ratio of DNOM and the organic aluminum (Al) complexation, as well as the mole fraction of CD to SD governed by the acidity. Site median SD obtained for 44 long-term monitored acid-sensitive lakes was 11.1 and 13.9 µEq/mg C for the Oliver and the Hruška model, respectively. During the 34 years of monitoring the CD increased by 70%, likely due to rising pH and declining Al complexation with DNOM. Present-day median SD values for the Oliver and Hruška models in 16 low-order streams are 13.8 and 15.8 µEq/mg C, respectively, and 10.8 and 12.5 µEq/mg C, respectively, in 10 high order rivers.
Keywords:
Dissolved Natural Organic Matter
; Organic charge
; Site density
; Charge density
; Oliver model
; Hruška model
1. Introduction
The concentrations of dissolved natural organic matter (DNOM) have increased in most northern freshwaters. This is attributed to several factors including the reduced impact of acid rain [1,2], a warmer and wetter climate [3,4], and growing biomass [5,6]. Many acid-sensitive surface waters recovering from acid deposition show a return from anthropogenic acidification to natural acidity, where increased anionic charge from DNOM contributes considerably to the total anionic charge. This decline in acid rain, alongside the other contributing factors, has heightened the relative and absolute significance of the organic charge stemming from the corresponding bases of weak acid functional groups present on DNOM.
Organic charge density (CD), which in this study refers to the concentration of calculated organic charge (Org.-) normalized to the concentration of total organic carbon (TOC), is a conceptually important factor in understanding the solubility of DNOM and its function as a counter ion in the leaching of base cations, and thus recovery from acid rain, as well as its complexation and detoxification of heavy meals and aluminum (Al). Additionally, organic charge plays an important role in the quality control of major anions and cations data, as it contributes significantly to the charge balance control, especially in dystrophic waters.
A modelled estimate of the organic charge concentration (OAN-) can be derived through conceptually formulated and empirically fitted models based on TOC, pH, and an estimate of the density of weak acid functional groups on the DNOM (SD). However, a challenge arises as this SD is hypothesized to differ in space and vary with time, influenced by changes in the quality of DNOM as well as trends in the concentration of organically complexed aluminum. Consequently, there is a pressing need to elucidate the factors governing SD and CD and to gain a deeper understanding of their influence on these variables in space and time.
2. Theory
2.1. Charge and Site Densities
Charge Density (CD) is determined by normalizing Org.- to the TOC concentration (i.e., ). The Org.- is determined through ion balance calculations involving the molar equivalent charge of major cations and anions (i.e., calcium (Ca2+), magnesium (Mg2+), sodium (Na+), potassium (K+), ammonium (NH4+), protons (H+), labile aluminum (LAln+), sulphate (SO42-), nitrate (NO3-), chloride (Cl-), and bicarbonate (HCO3-)). In cases where concentrations of K+, NH4+, LAln+ and HCO3- are absent and negligible, they may be excluded. However, if the sample pH exceeds 5.5, a bicarbonate measure based on alkalinity readings must be factored into the calculation.
Brakke et al. [7], analyzing ion balance in water chemistry data from 94 dystrophic lakes across two regions of Norway (i.e., Gulsvik and Nord-Trøndelag), proposed the empirically fitted linear Eqn. 1 for estimating organic charge.
Org.- = CD ∙ TOC – 0.96
They stated the CD value as 4.06 µEq/mg C. This straightforward equation accounted for 55% of the variance in Org.-. Similarly, Henriksen and Seip [8] reported a CD of 5.5 µEq/mg C based on extensive observations in lakes across Norway and Scotland in the late seventies, while Kortelainen [9] found a median CD of 7.5 µEq/mg C studying 955 Finnish lakes sampled in 1987.
The Site Density (SD) is employed in conceptual organic acid models to characterize the relative abundance of weak organic acid functional groups (i.e., mainly carboxylic and phenolic acids) within the DNOM. SD can be determined through advanced measurements of the content of these acids in DNOM. Alternatively, as undertaken in this study, it can be empirically calibrated within the models by optimizing the model simulation of OAN- relative to calculated Org.- across extensive datasets.
Based on Gran titration of ion-exchanged samples Hruška et al. [13] observed SD to be 10.2 µEq/mg C for Swedish sites and 8.8 µEq/mg C for the more acidified Czech sites. Oliver et al. [12] proposed an SD of 10.5 µEq/mg C (± 1.0). This was derived from a weighted carboxylic content in humic and fulvic DNOM fractions in a limited number of XAD-8 isolated Canadian samples. Perdue and Richie [14], in a literature review of direct titrations of carboxylic and phenolic acid content in DNOM fractions, found lower mean densities of 4.0 and 1.8 µEq/mg C for carboxylic and phenolic acid groups in humic acids, respectively, compared to 5.1 and 1.7 µEq/mg C for fulvic acids, respectively. Given DNOM’s blend of humic and fulvic acids, the concentration of carboxylic and phenolic acid of the DNOM was measured at 5.2 and 1.9 µEq/mg C, respectively.
Within the fulvic DNOM fraction Perdue and Richie [14] suggested a higher SD of weak acid functional groups, such as carboxylic, and phenolic acids, compared to the humic fraction. Additionally, they documented a greater level of aromaticity in the humic fraction compared to the fulvic fraction. Aromatic compounds, rich in conjugated double bonds, absorb UV light and wavelengths (λ) into the visible (VIS) light spectrum. λ of 254 and 410nm are thus widely used as proxies for DNOM, and their specific absorbencies (sUVa and sVISa) are positively correlated to DNOM aromaticity and, consequently, to the ratio of humic to fulvic fractions in the DNOM ([15] and references therein). Based on this conceptual framework, one could hypothesize that the SD of DNOM decreases with increasing sUVa and sVISa.
In summary, SD and CD of DNOM exhibit significant spatial and temporal variability and their estimates depend on the methodology employed for their determination.
2.2. Organic Charge Models
Assuming a triprotic model, Lydersen et al. [10] proposed the Eqn. 2 for OAN- by simply assuming one-third of the SD as strong acid anions.
This equation has been utilized in critical load assessments [11] to improve the ecological relevance of the acid-neutralizing capacity (ANC) using organic acid-adjusted ANC (ANCOAA = ANC – OAN-). Still, the actual mole fraction (α) of charged functional groups hinges on the protonation level of the organic acids and their complexation with aluminum and partly iron (Fe). Consequently, the CD is governed by the SD and influenced by factors such as pH and metal complexation. SD is thus higher than or equal to CD due to the presence of protonated sites or complexes with Al and Fe.
Prominent models accounting for the effect of pH variations on CD include the Oliver model [12] and the Hruška model [13]. These conceptual frameworks simulate the concentration of organic charge (OAN-) based on TOC, pH, and a selected SD. The Olivers model [10] is given in Eqn. 3.
Here the fraction expression denotes the mole fraction (α) for the overall protolysation ratio (i.e., CD/SD). Spatial disparities and temporal changes in SD may be accommodated by adjusting this parameter within the models.
The Hruška model is based on the definitions of mole fractions (α) of the protonated acids considering the organic acids on the DNOM as triprotic (Eqns. 4-7).
Here α0, α1, α2, and α3 denote the relative fraction of H3A, H2A-, HA2- and A3-, respectively. For Swedish sites, the following constants were calibrated: pKa1 = 3.04, pKa2 = 4.51, and pKa3 = 6.46, while the constants for Czech sites were pKa1 = 2.5, pKa2 = 4.42, and pKa3 = 6.7. The median difference in fitted SD values using the two different pKa sets is negligible, e.g., only a median of 0.88 µEq/mg C (2.7%) in the ICP Waters data set (i.e., introduced below). For consistency, we have therefore in this study only used the pKa values for the Swedish sites.
The OAN- is then calculated as given in Eqn. 8.
Other useful models for estimating the charge on organic matter, as documented in the scientific literature, include those proposed by Driscoll et al. [16], the ALCHEMY di- and triprotic model by Schecher and Driscoll [17], the DOM fraction model by Kortelainen [18], and the chemical equilibrium models WHAM and NICA-Donnan by Tipping [19,20] and Kinniburgh et al. [21], respectively.
3. Materials and Methods
3.1. Data Mining
The data utilized in this study are derived from several extensive monitoring programs, encompassing the ICP Waters data [22], along with the Norwegian ØkoFersk Trend [23], Reference Streams [24], and the Norwegian River monitoring program [25], as well as the 1000 Lakes study [4], commissioned by the Norwegian Environment Agency. The ICP Waters monitoring dataset, available on GitHub [26], consists of 73 656 samples collected between 1990 and 2020 from 430 sites across Europe and Northeastern America. The ØkoFersk Trend program has been conducting annual water chemistry monitoring at 78 acid sensitive Trend lakes since 1986 and weekly water chemistry monitoring, including alkalinity, at six research sites since 2001. Data from the Reference Streams monitoring program includes observations from 80 streams with different land uses sampled monthly and bi-annually since 2017. The Norwegian River monitoring program, including alkalinity since 2021, monitors monthly 22 rivers along the Norwegian coast for physical and chemical parameters. The 1000 Lakes study, conducted in the fall of 2019, sampled 2.5% of all lakes in Norway with a surface area larger than 0.04 km2. The sampled lakes were distributed in a ratio of 3:2:1 among lakes from southern, middle, and northern Norway, respectively. All data for the Norwegian sites are available from the Norwegian Environment Agency [27].
3.2. Calculation of Organic Charge
The concentration of Org.- is calculated based on charge balance principles. Below a pH of 5.5, it is assumed that there is a negligible carbonate alkalinity. However, above this threshold, HCO3- significantly contributes to alkalinity (i.e., α1 > 0.15). Total Alkalinity data are then utilized to estimate the concentration of weak acids, primarily HCO3- and Org.-. Still, distinguishing between bicarbonate alkalinity and organic alkalinity in alkalinity measurements is challenging. In samples with pH above 5.5, the HCO3- concentration is calculated using Eqn. 9, derived from [28] referencing model ALK02 in [29].
In this context, “Alkalinity” refers to the measured total alkalinity (EN ISO 9963-1:1995), “OAN-Sample pH” represents the modelled organic charge using either the Oliver or Hruška models at the sample pH, and “ OAN-pH4.5” indicates the respective modelled organic charge at pH 4.5. The value 31.62 signifies the concentration of H+ ions at the titration endpoint (pH 4.5). All concentrations are expressed in µEq/L. The contribution of organic alkalinity to total alkalinity measurements is usually minor, encompassing solely the protonation of organic charge from sample pH to pH 4.5 [28]. Nevertheless, determining the OAN- at sample pH and pH 4.5 to calculate the difference and thus its contribution to measured alkalinity entails a somewhat circular argument in our deductions. Additionally, it is necessary to subtract the contribution to alkalinity caused by the addition of acid to adjust the sample pH from the equivalence pH to pH 4.5.
When aiming to determine an optimal SD that establishes a 1:1 relationship between modelled OAN- and calculated Org.-, conceived as true value, the circular argument mentioned above poses a significant challenge. This is because increasing the SD concurrently elevates both the OAN- and Org.- in scenarios with carbonate alkalinity. To circumvent this issue in calculations using Eqn. 9 we fixed the SD values in the Oliver (Eqn. 3) and Hruška models (Eqn. 8) at their literature values 10.5 and 10.2 µEq/mg C, respectively. This approach ensures that the circular argument is mitigated when calculating the difference between in Equation 9, thereby accounting for the contribution of organic charge to measured Alkalinity.
By estimating a concentration of bicarbonate using Eqn. 9, the Org.- concentration can be deduced based on the anion deficit in the charge balance. If there is no anion deficit the concentration of Org.- is assumed to be negligible and the value for Org.- is set to zero and omitted in the regressions.
The sUVa and sVISa are the absorbency at λ254 and λ410 nm, respectively, normalized to the TOC concentration. In the Reference stream data set the sVISa is based on the Color number (i.e., Platinum number) linearly converted to absorbency at λ410 nm. The quantity of aluminum (Al) complexed to the DNOM is indirectly assessed by the concentration ratio of reactive (RAl) or directly by the ratio of non-labile Al (ILAl) to the TOC.
All calculations were conducted using Microsoft Excel, while statistical analysis was performed using MINITAB (2021).
3.3. Determining Site Density through Model Optimization
The models are calibrated by fitting the SD to achieve an optimum accuracy (i.e., OAN- = Org.-) by finding the SD that gives a 1:1 linear correlation anchored through origo (i.e., slope of 1) between OAN- and Org.-. Forcing the linear slope through origo minimizes the effect of poor model accuracy at low Org.-.
3.4. Limitations in the Conceptual Approach
Calculation of Org.- entails considerable uncertainties, given that it represents a small difference between the substantial sums of major cations and anions, compounded by inherent propagation of analytical errors in their constituents and in Alkalinity measurements. Furthermore, uncertainties also arise from assumptions employed to calculate HCO3- from alkalinity (Eqn. 9) and in the approach for assessing the protonation of organic charge from sample pH to pH 4.5. Consequently, calculated HCO3- concentrations can be somewhat overestimated in samples with low DNOM concentrations and may hence lead to a calculated apparent cation deficiency. In this study the concentration of Org.- is then omitted from the regression assessment, as their concentrations are assumed insignificant and irrelevant. In assessments of median Org.- and CD values the Org.- concentrations were set to zero in samples with a positive charge balance.
In addition to uncertainties in Org.- calculation, there are inherent limitations to the modelled OAN-, as the model solely relies on a pH-governed mole fraction (α) of the CD to SD ratio, without accounting for the effects of Al and Fe complexation. Furthermore, analytical uncertainties in determining TOC and pH add to the overall uncertainty. Generally, the models are found to generate too high OAN- at calculated Org.- values less than 20 µEq/L.
4. Results and Discussion
4.1. Comparison of OAN- Based on Oliver and Hruška Models
The ICP Waters dataset [22] serves as an invaluable resource for evaluating model performance across a broad spectrum of parameter values, as well as temporal and spatial dimensions. The model-derived organic charge concentrations (OAN-) based on the Oliver (Eqn. 3) and Hruška models (Eqn. 8) are strongly correlated (R2 = 0.9948, Figure 1). When employing a SD of 10.5 and 10.2 µEq/mg C, as proposed by Oliver et al. [12] and Hruška et al. [13], respectively, the regression slope is 0.80. This indicates that although the precision among these models is excellent, the accuracy is poor with the OAN- simulated by the Oliver model being approximately 20% higher than that of the Hruška model. Decreasing the Oliver model’s SD to 8.43 µEq/mg C yields a 1:1 relationship with the Hruška model set at SD = 10.2 µEq/mg C (Figure 1). From this we infer that these models demonstrate strong compatibility, despite notable disparities in the SD values utilized to calibrate them. In this study the estimated SD for both models are therefore assessed.
4.2. Comparison of Modelled OAN- with Calculated Org.-
For the 1000 lakes samples [4] with total organic carbon (TOC) concentrations above 1 mg C/L the optimized SD for the Oliver and Hruška models, giving a 1:1 relationship between OAN- and Org.-, (Figure 2), were 19.0 and 29.0 µEq/mg C, respectively. However, these overall SD values, assessed across sites with varying SDs, appear notably high compared to the calculated average charge density (CD) values of 11.2 and 11.9 µEq/mg C. This discrepancy arises from the inclusion of many sites where the models fail to accurately simulate the data, indicated by a coefficient of determination (R2) below 0.75. Moreover, 63% of the samples had no or insignificant organic charge and thus Org.- values were set to zero. Nevertheless, despite these discrepancies, it’s noteworthy that 71% of the Org.- in these 1000 lakes remains unprotonated at pH 4.5. Consequently, this discrepancy does not significantly impede the comparison between the modelled organic acid anion (OAN-) and calculated Org.- based on charge balance, which includes HCO3- calculated from alkalinity using Eqn. 9.
Although the Oliver and Hruška models, when optimized for the 1000 Lakes data, yield reasonably acceptable simulations of OAN- concentrations, explaining 65% and 72% of the variation in Org.-, respectively, it is evident from
Figure 2
that there exist subsets of sites with markedly different SDs, leading to varying OAN- to Org.- ratios. Clusters exhibiting high ratios likely correspond to sites where the models fail to perform effectively. To establish a more accurate estimate for SDs to be used in the Oliver and Hruška models, it becomes vital to optimize the SD based on temporal variations in TOC concentrations and pH relative to Org.- at individual sites.
4.3. Governing Factors for Site- and Charge -Densities
Site optimized SD in the models using data from 78 Trend Lakes and 80 Reference Streams reveals an exponential increase in SD with declining TOC (Figure 3). This trend is partly mechanistically sound, as the proportion of humic to fulvic fraction generally decreases with decreasing TOC, leading to an increase in the SD of the DNOM. However, sites with a coefficient of determination (R2) dropping below 0.75 for the correlation between modelled OAN- and calculated Org.- exhibit large scatter in the SD with some unrealistically high SDs (e.g., > 20 µEq/mg C), particularly evident at sites with low TOC concentrations (Figure 3). Furthermore, the relationship between hydrogen ion concentration (H+) and SD demonstrates that at pH levels above 5.5 (i.e., H+ < 3.2 µEq/L), the SD in the model varies significantly. At these pH levels the levels of HCO3- constitutes a substantial contribution to the charge balance and, consequently, on the expense of Org.-. Thus, the steep increase in SD at low TOC concentrations likely reflects limitations in the adopted conceptual approach. Total reactive aluminum concentrations (RAl) follow similar trends with SD as H+ (Figure 3), partly due to the covariance between H+ and RAl resulting from the pH dependence on aluminum solubility, as well as reflecting a dependence of organic-Al complexation. These anomalies lead to that the models generally tend to overestimate the OAN- at low concentrations of Org.- (< 20 µEq/L).
In summary, sites with low TOC concentrations inherently exhibit low OAN-. Coupled with relatively high uncertainty in calculating low Org.- concentrations, this results in highly uncertain optimization of Site Density (SD). Consequently, in the subsequent optimization of SDs, we have excluded sites in the linear correlations where the median TOC concentration is below 1 mg C/L and/or where the R2 fails to exceed 0.75.
4.4. Spatiotemporal Variations in Functional Site Density
To establish site-specific SDs the values were optimized within the Oliver and Hruška models by fitting OAN- to Org.- using long-term variations in data for explanatory variables, including Alkalinity, sourced from the 78 Trend Lakes and the 6 Research Monitoring Sites in the ØkoFersk Trend monitoring program (data from [23]), as well as the 80 Reference Streams [24] and 22 major rivers draining into coastal waters [25].
After excluding sites with median TOC concentrations less than 1 mg C/L and coefficient of determination (R2) values below 0.75 in the ØkoFersk Trend lakes and Reference Stream datasets, 44 and 35 sites were retained, respectively. In Trend Lake sites where the models failed to achieve an explanatory value greater than 75%, the acid neutralizing capacity (ANC) was low or negative, indicating low or negligible Org.- content. Conversely, Reference Stream sites where the models failed were characterized by significantly higher Alkalinity values and base cation concentrations, indicating water with high levels of bicarbonate and hard water. The median SD achieved during model optimization was 11.1 µEq/mg C for the Oliver model and 13.9 µEq/mg C for the Hruška model in the acid-sensitive Trend lakes, and 14.4 µEq/mg C for the Oliver model and 16.3 µEq/mg C for the Hruška model in Reference Streams. Over time, these SD values have however shown an increase during the monitoring period for the Trend lakes, as further assessed below. Hence, these SD values represent median spatiotemporal values.
Spatial variations in SD in the cleaned long-term dataset from Trend Lake and Reference Streams sites are primarily governed by differences in site average TOC, H+, and reactive aluminum (RAl) concentrations (
Figure 4
). Data generated by the Hruška model yields similar results (not displayed). The observed increase in SD with decreasing TOC and H+ concentration is likely attributed to the relatively higher fraction of fulvic compared to humic moieties in the DNOM at sites with lower TOC concentrations, as elaborated below. The increase in apparent SD with decreasing RAl may partly be explained by reduced organic complexation with Al.
The spatial disparity in Oliver SD is predominantly elucidated by variations in site-specific factors such as average H+, RAl, and TOC concentration which reflect differences in the quality of DNOM. A multiple linear regression model incorporating H+ and TOC accounts for 74% and 41% of the SD variance across the 44 Trend lakes (Eqn. 10) and 35 Reference Streams (Eqn. 11), respectively.
Here the H+ concentration is denoted in µEq/L, while TOC is measured in mg C/L. The p-value associated with TOC in Eqn. 10 exceeds 0.05, indicating its poor significance. This equation fails to effectively model SD beyond the threshold of 12 µEq/mg C, a limitation evident from Figs. 3 and 4. By substituting TOC with the less commonly measured RAl in the multiple linear regression analysis for the Trend lakes, a stronger equation (Eqn. 12) emerges, explaining a slightly higher proportion (78%) of the variance. Notably, all parameters exhibit significance, with p-values < 0.000. However, when applying this substitution to the data from Reference Streams, which encompass less acid-sensitive sites with a median pH of 6.4, the model’s performance does not improve.
The spatial variability in SD, as derived from data collected at the 6 Research Monitoring Sites, which contain Alkalinity data since 2001, is detailed in Table 1. Among these sites, the SD was mainly governed by pH and TOC, rather than RAl. Notably, there exists a robust positive correlation between SD and the average pH of the sites (R2 = 0.8295), alongside a negative correlation with average TOC concentrations (R2 = 0.5964). Conversely, sulphate (SO42-) concentrations demonstrate negligible explanatory power. This can be attributed to the limited number of research monitoring sites, which encompass a broad range of acid sensitivities. For instance, the Dalelva site, despite exhibiting high sulphate levels due to acid oxide pollution from nearby metal smelters in Nikel, Russia, is well-buffered, displaying high pH values and low RAl concentrations. Still, Kårvatn, having the highest SD (19.1 µEq/mg C) is a less acid-sensitive site and is exposed to the lowest levels of acid rain, reflected by high pH and low RAl, as well as low TOC (Table 1). This is in line with the fact that acid rain along with DNOM levels are important drivers for the SD.
Optimizing the SD for the modelled OAN- to Org.- data obtained from each of the Research Monitoring Stations yields a range of values spanning from 5 to 19 µEq/mg C (Table 1). Inherently, the Oliver model tends to exhibit limited explanatory power at Research Monitoring Sites characterized by low Org.- levels, such as Øygardsbekken and Kårvatn (Table 1). Conversely, stronger explanatory values (R2) are observed at dystrophic sites boasting high TOC concentrations, such as Langtjern and Storgama. However, at Birkenes, despite relatively high TOC levels, the correlation remains relatively poor due to the low CD of the organic matter (2.5 µEq/mg C).
4.5. Spatial Differences in Contemporary Site Density
The SD based on recent seasonal fluctuation in monthly samples collected in 2022 from 37 Reference Streams [24] are devoid long-term temporal trends in the SD. Twenty-one streams were excluded from this analysis due to TOC concentrations less than 1 mg C/L and/or R2 poorer than 0.75. Within this dataset, the median SD for the remaining 16 Reference streams, when employing the Oliver and Hruška models, stands at 13.8 µEq/mg C (STD: 4.5 µEq/mg C) and 15.8 µEq/mg C (STD: 4.8 µEq/mg C), respectively. The relatively high SD observed in this 2022 dataset, compared to the time-averaged SD from long-term monitoring data collected from the Trend lakes, aligns with a trend of increasing CD over time as assessed below. Spatial differences in SD are significantly correlated with the site-average concentrations of TOC and RAl, explaining 21% and 17% of the variation in SD, respectively (Figure 5). The explanatory power of H+ for spatial variation in SD is limited due to the higher pH (ranging in median values from 5.2 to 7.3) observed among these Reference Streams, which exhibit varying land use, compared to the more consistently acid-sensitive Trend lakes characterized by a median pH ranging from 4.7 to 6.6.
Among the 22 high-order rivers in the River Monitoring Program [25], coefficients of determination (R2) between OAN- and Org.- exceeding 0.75 were only achieved in 10 sites. Rivers that failed to fit the model generally exhibited higher pH levels (median 7.36) and lower TOC concentrations (median 2.1 mg C/L) compared to rivers that demonstrated good explanatory values (median pH 6.84 and 3.2 mg C/L). The median SD values for the Oliver and Hruška models, fitted to monthly data from 2021 to 2023, were 11.0 and 12.6 µEq/mg C, respectively. These median contemporary values are lower than those observed in the upstream Reference Streams (13.8 and 15.8 µEq/mg C for Oliver and Hruška models, respectively). Notably, as discussed below, the main difference lies in the CD, which exhibits considerably lower values in the high-order rivers compared to lower order streams, despite higher pH levels.
Samples with specific color of DNOM (sVISa) less than 0.003 are typically associated with TOC concentrations of less than 5 mg C/L [26]. Consequently, the higher SD observed at sites with low TOC concentrations (Figure 5) can be conceptually explained by the relatively lower proportion of humic compared to fulvic fractions within the DNOM. The humic fraction, characterized by a lower SD, is more susceptible to changes in solubility compared to the hydrophilic fulvic fraction as explained above. Consequently, the level of this fraction tends to be lower at sites exhibiting high ionic strength, low pH, and elevated RAl levels, commonly observed in acid sensitive regions impacted by acid rain. This conceptual framework is supported by the observation that the optimized SD decreases with increasing sVISa, indicative of a greater relative proportion of humic compared to fulvic moieties in the DNOM, within the Reference Streams dataset (Figure 6). On the other hand, a spatial Nordic study by Vogt et al. [32] noted that the specific UV absorbency (sUVa) tends to be lower in regions with heavy acid rain loading compared to less affected regions. This observation conflicts with our findings of lower medium SD at sites impacted by acid rain (conf. H+ and RAl vs. SD in Figure 4, and Eqns. 10 and 12, and SO42- relative to SD in Table 1,) as a low sUVa implies DNOM with a relatively high fulvic acid fraction, which in turn entails a higher SD. This difference in spatial and temporal trends may partly be explained by regional differences in DNOM quality relative to temporal changes in organic Al complexation, as discussed below.
4.6. Temporal Trends in Charge Density
Conceptually, the decline in acid rain loading has an antagonistic effect on the CD, as it leads to a decrease in SD due to an increase in humic moieties, while concurrent increase in pH raises the relative protolysis (α) of the weak acid functional sites. Consequently, we would anticipate decreasing SD, while CD increases over time as acid rain diminishes. However, the decline in organic complexation of Al, an unaccounted factor in the OAN- models, serves as a confounding factor in assessing the impact of decreasing acid rain. The significance of this is highlighted by modelling the Al complexation to fulvic acids in the Birkenes stream water using the WHAM Model VII [33]. This model gave a linear decline in organically complexed Al (NU) of 7.2 µmol Al/mg C/yr.
Simple linear temporal regression trends in CD of the DNOM at the 78 Trend Lake sites reveal a median yearly increase (slope) of 0.23 µEq/mg C/yr. Over the 34-year monitoring period, this translates to a cumulative rise of 7.81 µEq/mg C, signifying a doubling of the CD over time. In contrast, the H+ decreased by a median of 5.26 µEq/L from a median of 5.62 µEq/L in 1982 (equivalent to a change in pH from 5.25 in 1986 to 6.45 in 2020) in Norwegian Trend lakes. Based on the Oliver model this decrease of 5.26 µEq H+/L results in a median CD increase of only 0.761 µEq/mg C. Hence, the observed increase in CD cannot be attributed to enhanced deprotonation of weak acid functional groups. Since an increase in the humic to fulvic moieties of DNOM would mechanistically lead to a decrease in SD, the observed temporal rise in CD must, as also indicated above by the WHAM model, instead be attributed to reduced Al complexation with DNOM not accounted for in the model.
Spatial variations in the temporal CD slope, including samples with Org.- set to 0, exhibit an exponential increase with decreasing ANC and TOC (Figure 7).
The pronounced temporal increases in the CD slope, exceeding 2 µEq/mg C/yr, observed at Trend Lake sites characterized by low TOC concentrations (mainly < 1 mg C/L) and negative ANC (Figure 7), may as discussed above for SD partly stem from limitations inherent in the conceptual approach. Nonetheless, uncertainties in Org.- calculations remains low in these acidic waters, given the negligible levels of bicarbonate. The notably higher increasing slope in CD observed in lakes with negative average ANC can be largely be mechanistically explained by a temporal decrease in organic complexation with Al, as these waters with negative ANC tend to exhibit high LAl levels. Additionally, some deprotonation of weak acid functional groups with increasing pH could also contribute to these high slopes. Still, the increases in CD at these acid-sensitive sites are thus likely more substantial than those observed at more well-buffered sites. It is noteworthy that this reduced organic Al complexation, which is not accounted for in the models, implies that also the apparent SD would likewise increase significantly over time.
The intensively monitored Research Stations provide insights into both seasonal fluctuations and long-term trends at sites exhibiting variable acid sensitivity. A detailed summary of the simple temporal linear regression slopes in CD and key explanatory factors are presented in Table 2.
Changes in CD over two decades (Table 2) are at these Research monitoring sites significant relative to their average levels given in Table 1. Particularly noteworthy is the increasing trend in CD observed at the most acid rain-affected acid-sensitive sites, with the a pronounced increases noted at locations such as Birkenes, Øygardsbekken, and Storgama, which have experienced the a substantial declines in H+ concentrations. Interestingly, these sites also demonstrate the largest decreases in Al complexation density on the DNOM, indicated by declining ILAl/TOC ratios. Moreover, a strong negative correlation exists between the trends in CD and H+, explaining 58% of the variation, and the Al complexation density, which accounts for 71% of the variation in CD among the 6 Research Monitoring Stations. This increase in CD is therefore likely attributable to heightened deprotonation and reduced Al complexation resulting from the concurrent decrease in H+ concentrations and decline in ILAl/TOC, driven by the reduction in strong mineral acid loading (i.e., acid rain). Although the models account for the effect of changes in pH, they do not incorporate the impact of decreased Al complexation. This diminished complexation’s effect on the charged functional sites may contribute to some of the disparities between modelled OAN- and calculated Org.- values.
On the other hand, there has been a general concurrent temporal increase in the color of the DNOM [33], indicating a rise in the humic fraction relative to the fulvic acid fraction. This trend is likely constraining the increase in CD. Changes in climate may have had a similar effect by enhancing the influx of humic rich allochthonous DNOM to surface waters. Terrestrial material typically exhibits a higher humic character than autochthonous material [15]. This shift is likely the cause for the strong decline in CD observed at the less acid-sensitive and acid rain loaded site of Kårvatn in mid-Norway. Dalelva, a non-acid-sensitive site, received heavy acid rain loading from the now decommissioned metal smelter at Nikel in Russia. The temporal decline in CD at this site (Table 2) may be attributed to uncertainties in calculations due to low TOC concentrations and high pH, allowing for elevated bicarbonate concentrations. This is in line with the fact that the CD at both sites are positively correlated to ANC, explaining 29% of the variation.
In summary, the CD of DNOM has significantly increased over the past 20 to 40 years, especially in acid-sensitive sites experiencing a reduction in acid deposition. Moreover, the primary governing parameters for the slope in CD differ between sites. In the acid-sensitive Trend lakes, the main explanatory factors were ANC and TOC, whereas at the Research Monitoring Stations, which include both acid-sensitive and less acid-sensitive sites, the trends in CD were primarily explained by changes in acid rain loading, site acid sensitivity, and the density of Al complexed to the DNOM.
These findings have bearings for the expected future development of CD. The sUVa has been found to increase not only with decreasing acid deposition but also due to climate change [33]. This suggests that in areas where the influence of acid rain has been minimal, the SD and thus the CD has decreased with increasing DNOM, as observed in Kårvatn with low median sulphate levels (Table 1). Additionally, runoff from catchments with high biomass (forests) tends to have higher sUVa [21,31], resulting in lower SD. Furthermore, there is an effect of increasing amount and intensity of runoff, as there is more runoff through the forest floor containing DNOM with higher sUVa [31]. Consequently, it is reasonable to anticipate that the SD and thus the CD may decrease in the future due to the predicted climate change.
5. Conclusions
The Oliver and Hruška organic charge models exhibit strong explanatory value with calculated organic charge (Org.-) based on anion deficit. Still, it is noteworthy that SD differs significantly in space and time (Table 3). This is due to disparities in the quality of the DNOM arising from differences in the relative fractions of humic and fulvic moieties. Furthermore, the charge neutralization of the anion base of these weak acid functional groups is influenced not only by pH but also by the density of aluminum (Al) complexed to the DNOM. Although the impact of pH is relatively small and is predominantly accounted for by the models, the effect of decreased metal complexation is not addressed in these models. The influence of Al complexation on the charge density (CD) of the DNOM may thus explain some of the spatial differences in SD, as well as the temporal increasing trends observed in acid-sensitive regions experiencing a decline in acid rain (Table 2).
This study highlights the complementary nature and practical utility of the conceptually grounded and empirically calibrated Oliver and Hruška models for estimating the charge concentration (OAN-) attributable to organic anions in dystrophic freshwaters. However, calibrating and testing these models encounter limitations in sites where the concentration of organic charge (Org.-) is low (i.e., < 20 µEq/L), such as in waters with low TOC (< 1 mg C/L), negative or low ANC, and in hard waters enriched with base cations and bicarbonate. In cases where Org.- significantly contributes to the IB, both the site density (SD), used for model fitting, and the organic charge density (CD) values exhibit temporal changes and spatial variations.
Author Contributions
Conceptualization, R.D.V. and Ø.A.G.; methodology, R.D.V and Ø.A.G.; validation, R.D.V.; formal analysis, R.D.V. and Ø.A.G.; investigation, R.D.V., Ø.K., J.-E.T., K.A. and H.A.W.; data curation, L.B.S., J.E.S. and G.B.G.; writing—original draft preparation, R.D.V.; writing—review and editing, R.D.V., S.H., Ø.K., Ø.A.G., H.A.W., C.B.G, K.A.; visualization, R.D.V.; project administration, R.D.V.; funding acquisition, R.D.V., H.A.W. and J.-E.T.. All authors have read and agreed to the published version of the manuscript.
Funding
This research was funded by Royal Norwegian Ministry of Climate and Environment (project number 65007603I (ICP-Waters) and the Norwegian Environment Agency project number 21087345) including the programs: ThousandLake survey, Monitoring long-range transboundary air pollution – Water chemical effects, the Norwegian River Monitoring Program, and the Surveillance monitoring of reference rivers.
Data Availability Statement
The data used in this analysis consist of historical records from 1986 to 2020, sourced from https://github.com/JamesSample/icpw2/tree/master/thematic_report_2023 and https://vannmiljo.miljodirektoratet.no/. 1000 lakes data are available at zenodo.org with the DOI: https://doi.org/10.5281/zenodo.7298477.
Acknowledgments
Numerous individuals, too many to list here, have dedicated considerable time and effort over two decades to carry out water sampling, meticulously manage laboratory procedures and analyses, as well as oversee database management. Their collective contributions have been instrumental in generating the high-quality monitoring data upon which this work depends.
Conflicts of Interest
The authors declare no conflicts of interest. The funders had no role in the design of the study; in the collection, analyses, or interpretation of data; in the writing of the manuscript; or in the decision to publish the results.
References
- de Wit, H.A.; Mulder, J.; Hindar, A.; Hole, L. Long-term increase in dissolved organic carbon in streamwaters in Norway is response to reduced acid deposition. Environ. Sci. Technol. 2007, 41, 7706–7713. [Google Scholar] [CrossRef] [PubMed]
- Monteith, D.T.; Henrys, P.A.; Hruška, J.; de Wit, H.A.; Krám, P.; Moldan, F.; Posch, M.; Räike, A.; Stoddard, J.L.; Shilland, E.M.; et al. Long-term rise in riverine dissolved organic carbon concentration is predicted by electrolyte solubility theory. Sci. Adv. 2023, 9, eade3491. [Google Scholar] [CrossRef] [PubMed]
- Madsen, H.; Lawrence, D.; Lang, M.; Martinkova, M.; Kjeldsen, T.R. Review of trend analysis and climate change projections of extreme precipitation and floods in Europe. J. Hydrol. 2014, 519, 3634–3650. [Google Scholar] [CrossRef]
- De Wit, H.A.; Garmo, Ø.A.; Jackson-Blake, L.; Clayer, F.; Vogt, R.D.; Kaste, Ø.; Gundersen, C.B.; Guerrerro, J.L.; Hindar, A. Changing Water Chemistry in One Thousand Norwegian Lakes During Three Decades of Cleaner Air and Climate Change. Glob. Biogeochem. Cycles 2023, 37, e2022GB007509. [Google Scholar] [CrossRef]
- Kritzberg, E. S.; Hasselquist, E.M.; Škerlep, M.; Löfgren, S.; Olsson, O.; Stadmark, J.; Valinia, S.; Hansson, L-A.; Laudon, H. Browning of freshwaters: Consequences to ecosystem services, underlying drivers, and potential mitigation measures. Ambio 2020, 49, 375–390. [Google Scholar] [CrossRef] [PubMed]
- Vogt, R.D.; de Wit, H.; Koponen, K. Case Study on Impacts of Large-Scale Re-/Afforestation on Ecosystem Services in Nordic Regions. Report Series Quantifying and Deploying Responsible Negative Emissions in Climate Resilient Pathways. Horizon 2020, Grant Agreement no. 869192. 2022. Available online: https://www.negemproject.eu/wp-content/uploads/2022/06/NEGEM_D3.6_Case-study-on-impacts-of-large-scale-re-afforestation-on-ecosystem-services-in-Nordic-regions.pdf.
- Brakke, D.; Henriksen, A.; Norton, S. The relative importance of acidity sources for humic lakes in Norway. Nature 1987, 329, 432–434. [Google Scholar] [CrossRef]
- Henriksen, A.; Seip, H. M. Strong and weak acids in surface waters of southern Norway and southwestern Scotland. Water Research 1980, 14, 809–813. [Google Scholar] [CrossRef]
- Kortelainen, P. Charge-density of total organic carbon in Finnish lakes. Environmental Pollution 1992, 77:2-3, 107-113. [CrossRef]
- Lydersen, E.; Larssen, T.; Fjeld, E. The influence of total organic carbon (TOC) on the relationship between acid neutralizing capacity (ANC) and fish status in Norwegian lakes. Sci. total Environ. 2004, 326, 63–69. [Google Scholar] [CrossRef] [PubMed]
- Hindar, A.; Larssen, T. Modification of ANC- and critical load assessments by including strong organic acids. (In Norwegian). Naturens Tålegrenser, fagrapport No. 119, 2005, NIVA-rapport 5030.
- Oliver, B. G., Thurman; Malcolm, R. L. The contribution of humic substances to the acidity of colored natural waters. Geochim. et Cosmochim. Acta 1983, 47, 2031–2035. [Google Scholar] [CrossRef]
- Hruška, J.; Köhler, S.; Laudon, H.; Bishop, K. Is a Universal Model of Organic Acidity Possible: Comparison of the Acid/Base Properties of Dissolved Organic Carbon in the Boreal and Temperate Zones. Environ. Sci. Technol 2003, 37, 1726–1730. [Google Scholar] [CrossRef] [PubMed]
- Perdue, E. M.; Ritchie, J. D. Treatise on Geochemistry (eds D. H. Heinrich & K.T. Karl) Pergamon, Oxford UK, 2003, Ch. 5.10, 273-318.
- Vogt, R. D.; Porcal, P.; Hejzlar, J.; Paule-Mercado, M.C.; Haaland, S.; Gundersen, C.B.; Orderud, G.I.; Eikebrokk, B. Distinguishing between Sources of Natural Dissolved Organic Matter (DOM) Based on Its Characteristics. Water 2023, 15, 3006. [Google Scholar] [CrossRef]
- Driscoll, C. T.; Lehtinen, M. D.; Sullivan, T. J. . Modelling the acid-base chemistry of organic solutes in Adirondack, New York, lakes, Water Resour. Res. 1994, 30(2), 297–306. [CrossRef]
- Schecher, W. D.; Driscoll, C. T. An evaluation of uncertainty associated with aluminum equilibrium calculations. Water Resour. Res. 1987, 23, 525–534. [Google Scholar] [CrossRef]
- Kortelainen, P. Content of Total Organic Carbon in Finnish Lakes and Its Relationship to Catchment. Characteristics. Can. J. Fish. Aquat. Sci. 1993, 50, 1477–1483. [Google Scholar] [CrossRef]
- Tipping, E. WHAMC- A chemical equilibrium model and computer code for waters, sediments, and soils incorporating a discrete site/electrostatic model of ion-binding by humic substances. Comput. Geosci. 1994, 20, 973–1023. [Google Scholar] [CrossRef]
- Tipping, E. Cation Binding by Humic Substances. Cambridge University Press: Cambridge, UK. 2002.
- Kinniburgh, D. G.; van Riemsdijk, W. H.; Koopal, L. K.; Borkovec, M.; Benedetti, M. F.; Avena, M. J. Ion binding to natural organic matter: competition, heterogeneity, stoichiometry, and thermodynamic consistency. Colloid Surf. A. 1999, 151:1-2, 147-166. [CrossRef]
- Vogt, R. D.; Agnieszka, K.; Arle, J.; Austnes, K.; Van Dam, H.; Futter, M.; Fölster, J.; Gundersen, C.B.; Higgins, S.N.; Houle, D.; Hruska, J.; Monteith, D.; Paterson, A.; Rogora, M.; Sample, J.E.; Stoddard, J.; Steingruber, S.; Ulanczyk, R.; Vuorenmaa, J.; de Wit, H.A. Trends and patterns in surface water chemistry in Europe and North America between 1990 and 2020, with a focus on calcium. Report No. ICP Waters Report 156/2024, 65. Norwegian institute for Water Research, Oslo, Norway, 2024.
- Vogt, R. D.; Skancke, L. B. Monitoring long-range transboundary air pollution. Water chemical effects 2022. (In Norwegian). 98. Norwegian Environment Agency, 2023. 99p.
- 24. Sandin, L.; Thrane, J.-E.; Persson, J.; Kile, M. R.; Bækkelie, K. A.; Myrvold, K. M.; Garmo, Ø. Aa.; Grung, M.; Calidonio, J.-L.; de Wit; H., Moe, T. F. Monitoring of reference rivers - Testing of the classification system for basic monitoring in reference watercourses (In Norwegian). 243/2021. Norwegian Institute for Water Research, Oslo, Norway, 2021.
- Kaste, Ø.; Gundersen, C. B.; Sample, J. E.; Mcgovern, M.; Skancke, L. B.; Allan, I.; Jenssen, M. T. S.; Bæk, K; Skogan, O. A. S. The Norwegian River Monitoring Programme 2022 – water quality status and trends. Elveovervåkningsprogrammet 2022 – vannkvalitetstilstand og -trender. (NIVA-rapport 7903-2023). Norwegian Institute for Water Research, Oslo, Norway. 2023.
- Kaste, Ø., Skarbøvik, E.; Vogt, R. D. Investigation on parameters for suspended matter and organic material that can be included in the water classification system (In Norwegian). Report 58 (NIVA Report 7860-2023), Norwegian Institute for Water Research, 2023.
- GitHub. ICP Waters monitoring data available @ https://github.com/JamesSample/icpw2/tree/master/thematic_report_2023.
- Norwegian Environment Agency. Vannmiljø database available @ https://vannmiljo.miljodirektoratet.
- Vogt, R. D.; Garmo, Ø. A.; Schartau, A. K.; Haaland, S. L. Methods for calculating the water acid neutralizing capacity (ANC) for classification of acidification status. (In Norwegian). Vann 2023, 02/58, 105–117. [Google Scholar]
- Enge, E.; Garmo, Ø. A. Estimation of low-level carbonate alkalinity from single endpoint acidimetric titration to pH = 4.5. Fund. Appl. Limnol. 2021, 195, 1–7. [Google Scholar] [CrossRef]
- Minitab, LLC. Minitab. Data Analysis Software, Statistical Software Package. 2021. https://www.minitab.
- Vogt, R. D.; Akkanen, J.; Andersen, D. O.; Bruggemann, R.; Chatterjee, B.; Gjessing, E.; Kukkonen, J. V. K.; Larsen, H. E.; Luster, J.; Paul, A.; Pflugmacher, S.; Starr, M.; Steinberg, C. E. W.; Schmitt-Kopplin, P.; Zsolnay, A. Key site variables governing the functional characteristics of dissolved natural organic matter (DNOM) in Nordic forested catchments. Aquat. Sci. 2004, 66, 195–210. [Google Scholar]
- Lofts, S. User’s Guide to WHAM7. NERC Centre for Ecology and Hydrology. Natural Environment Research Council. 2012. [Google Scholar]
- Hongve, D.; Riise, G.; Kristiansen, J. Increased colour and organic acid concentrations in Norwegian forest lakes and drinking water – a result of increased precipitation? Aquat. Sci. 2004, 66, 231–238. [Google Scholar] [CrossRef]
Figure 1.
Correlation between the OAN- estimated using the Oliver model (Eqn. 3) with a adjusted SD of 8.43 µEq/mg C, vs. the Hruška model (Eqn. 8) with a SD = 10.2 µEq/mg C, on the ICP Waters data.
Figure 1.
Correlation between the OAN- estimated using the Oliver model (Eqn. 3) with a adjusted SD of 8.43 µEq/mg C, vs. the Hruška model (Eqn. 8) with a SD = 10.2 µEq/mg C, on the ICP Waters data.
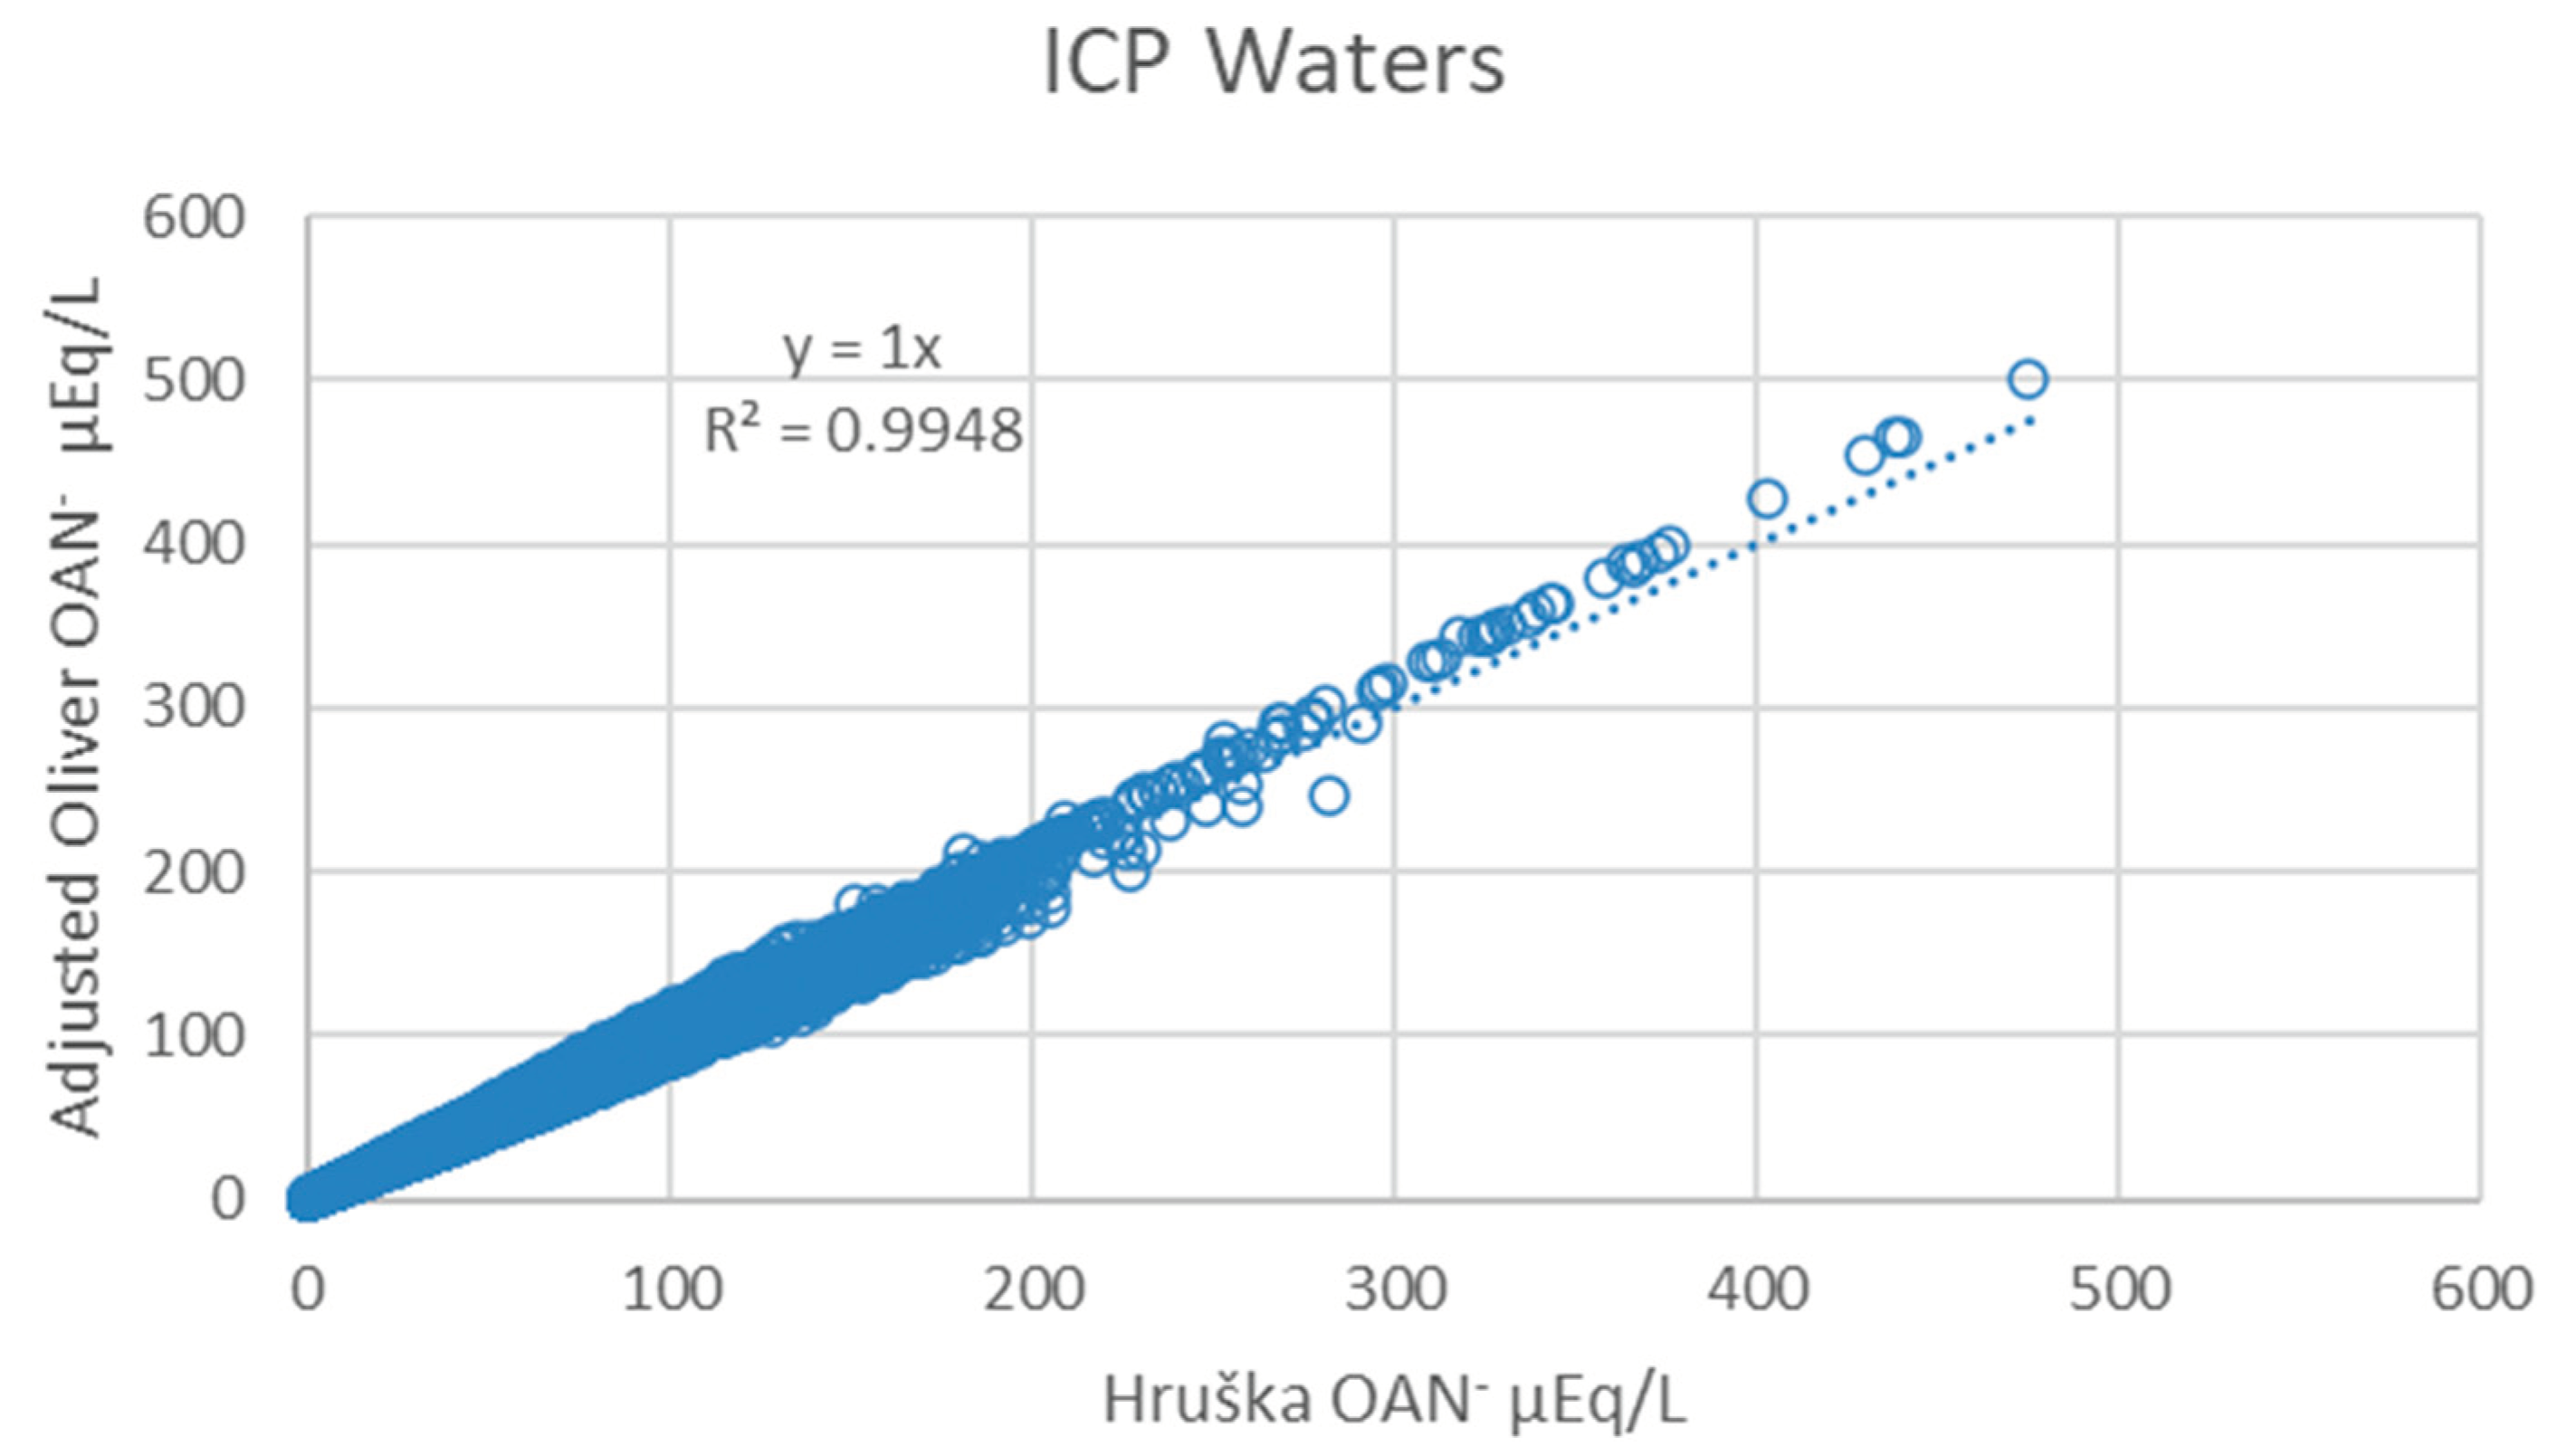
Figure 2.
Modelled OAN- by Oliver and Hruška models vs. “true” Org.- calculated on the 1000 Lakes samples, with TOC concentrations higher than 1 mg C/L, with an optimized SD rendering a 1:1 relationship (line) anchored through origo. The Org.- is based on charge balance incl. bicarbonate (from Eqn. 9).
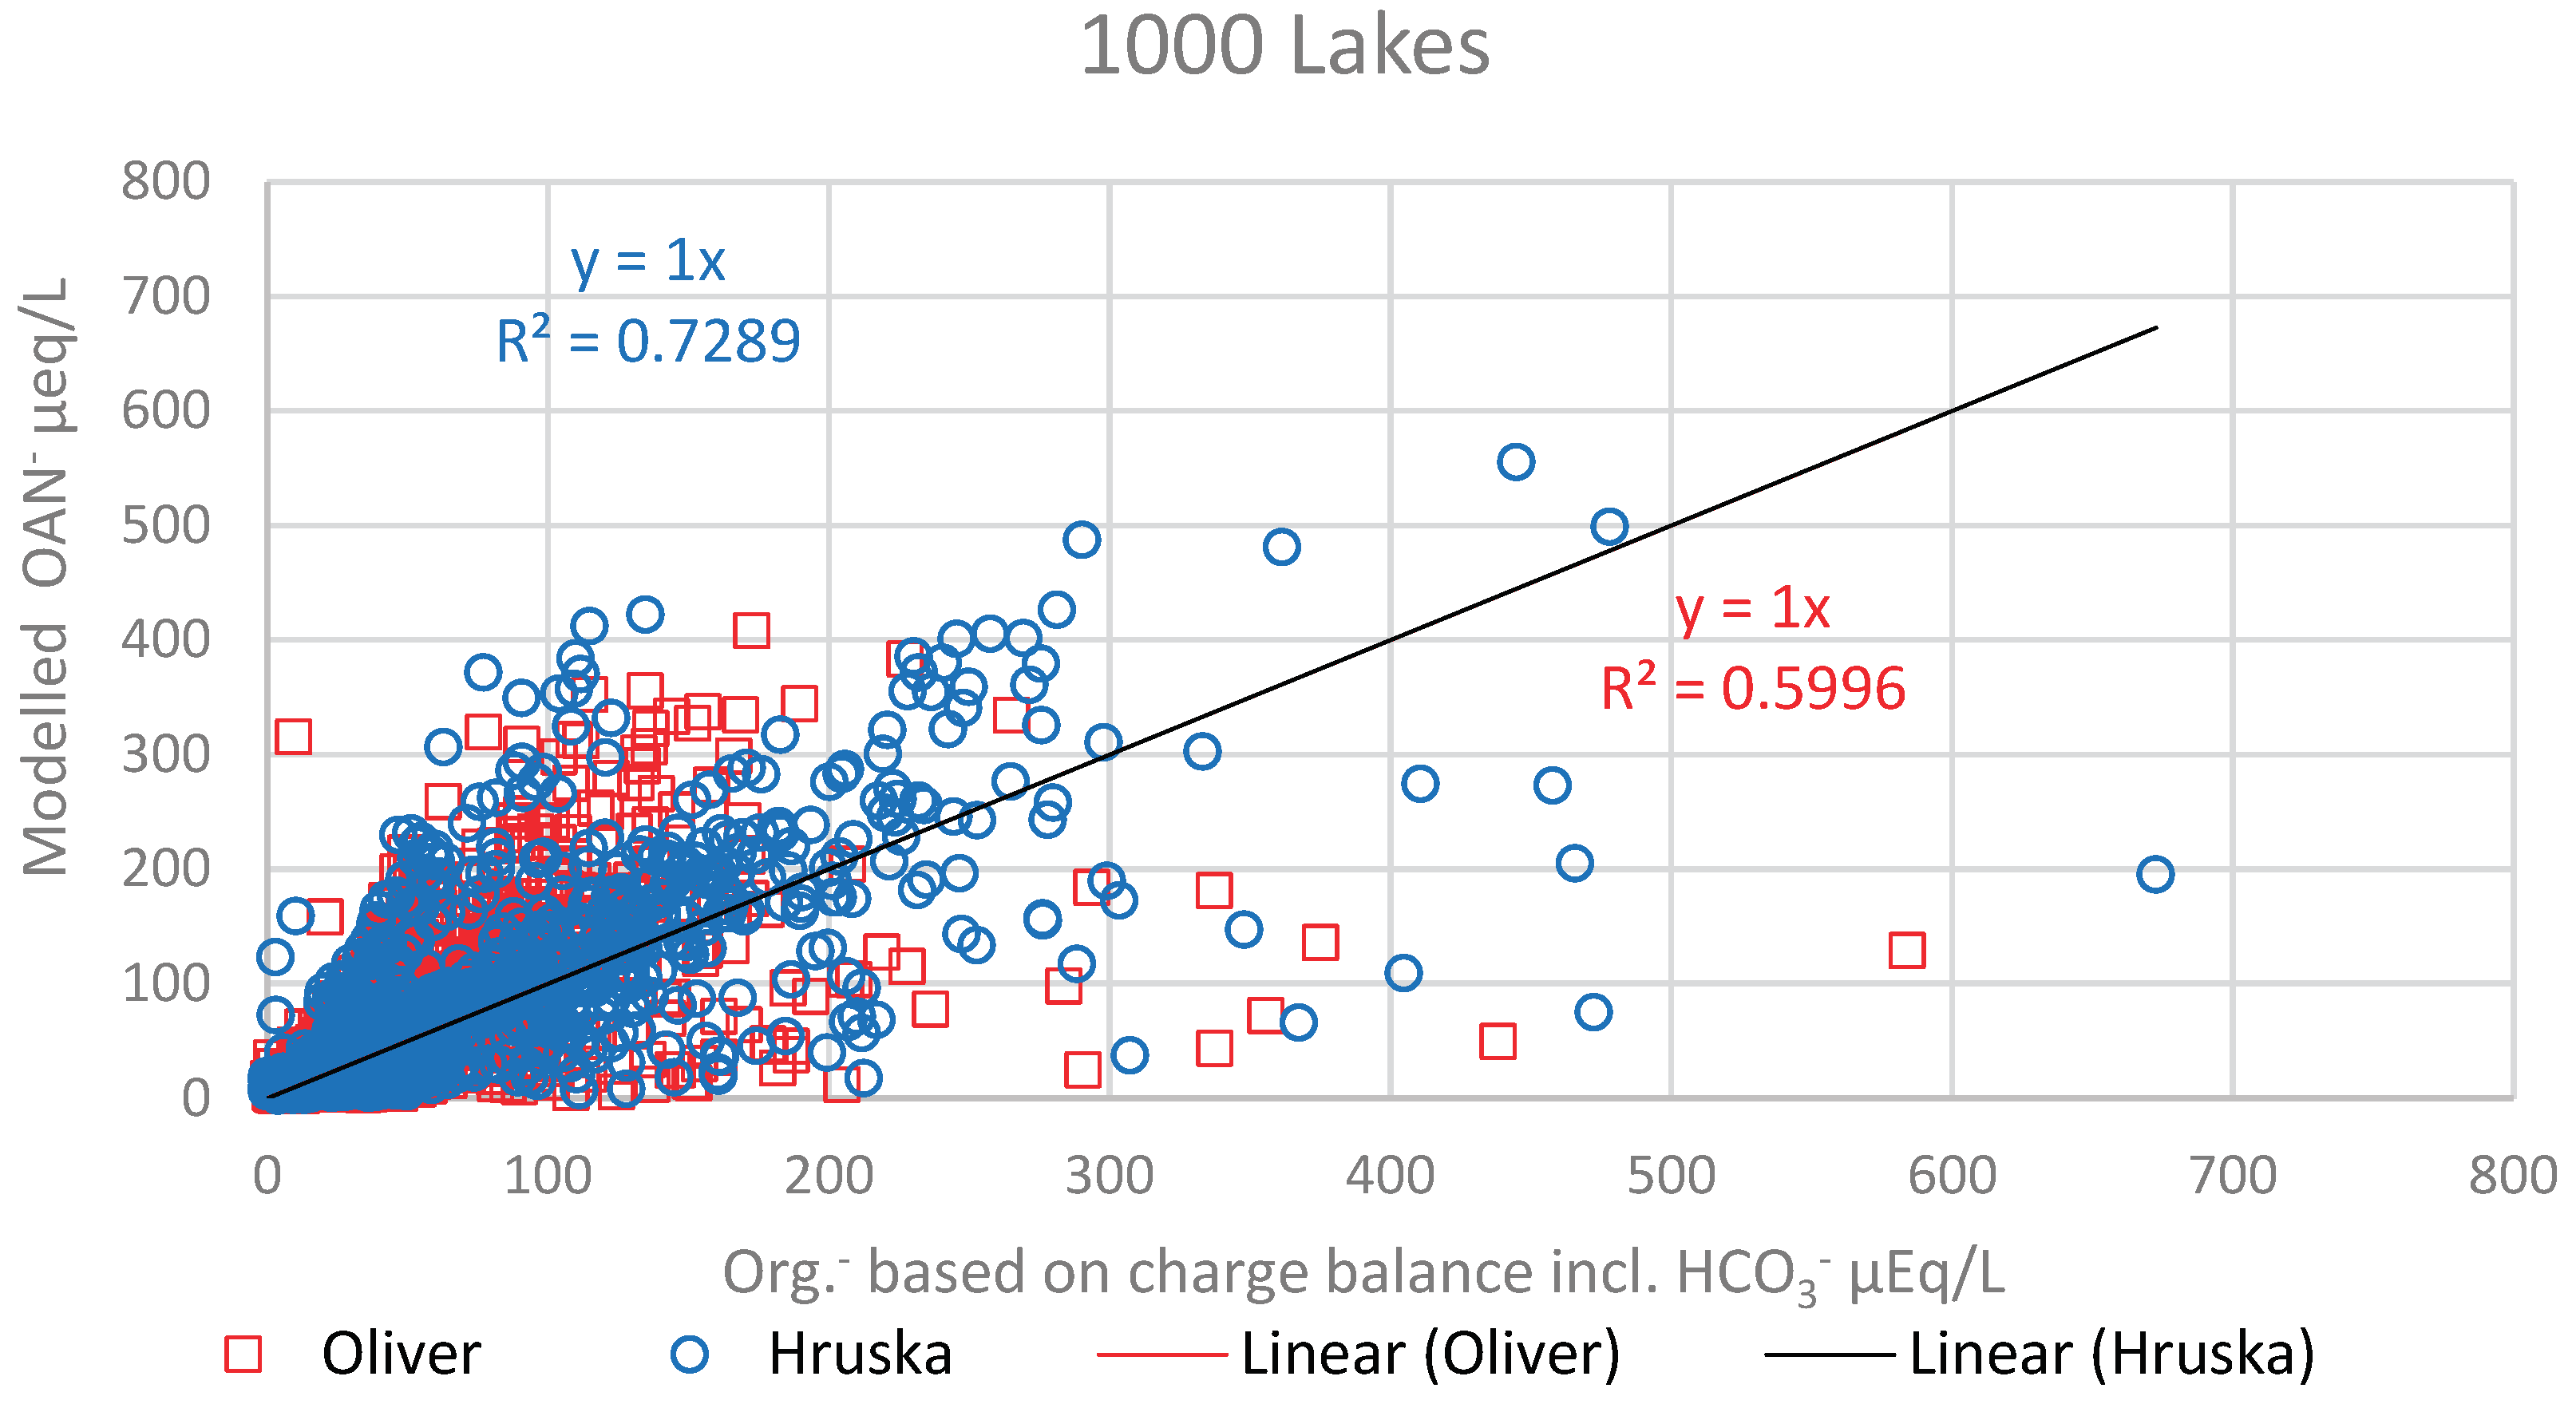
Figure 3.
Relationship between the site average levels of TOC, H+ and RAl vs. the optimized SD for the Oliver model (top) and the dependence of SD on the coefficient of determination (R2), based on optimized model simulations of the Oliver and Hruška models (bottom) in 78 Trend lakes (left) and 80 Reference Streams (right).
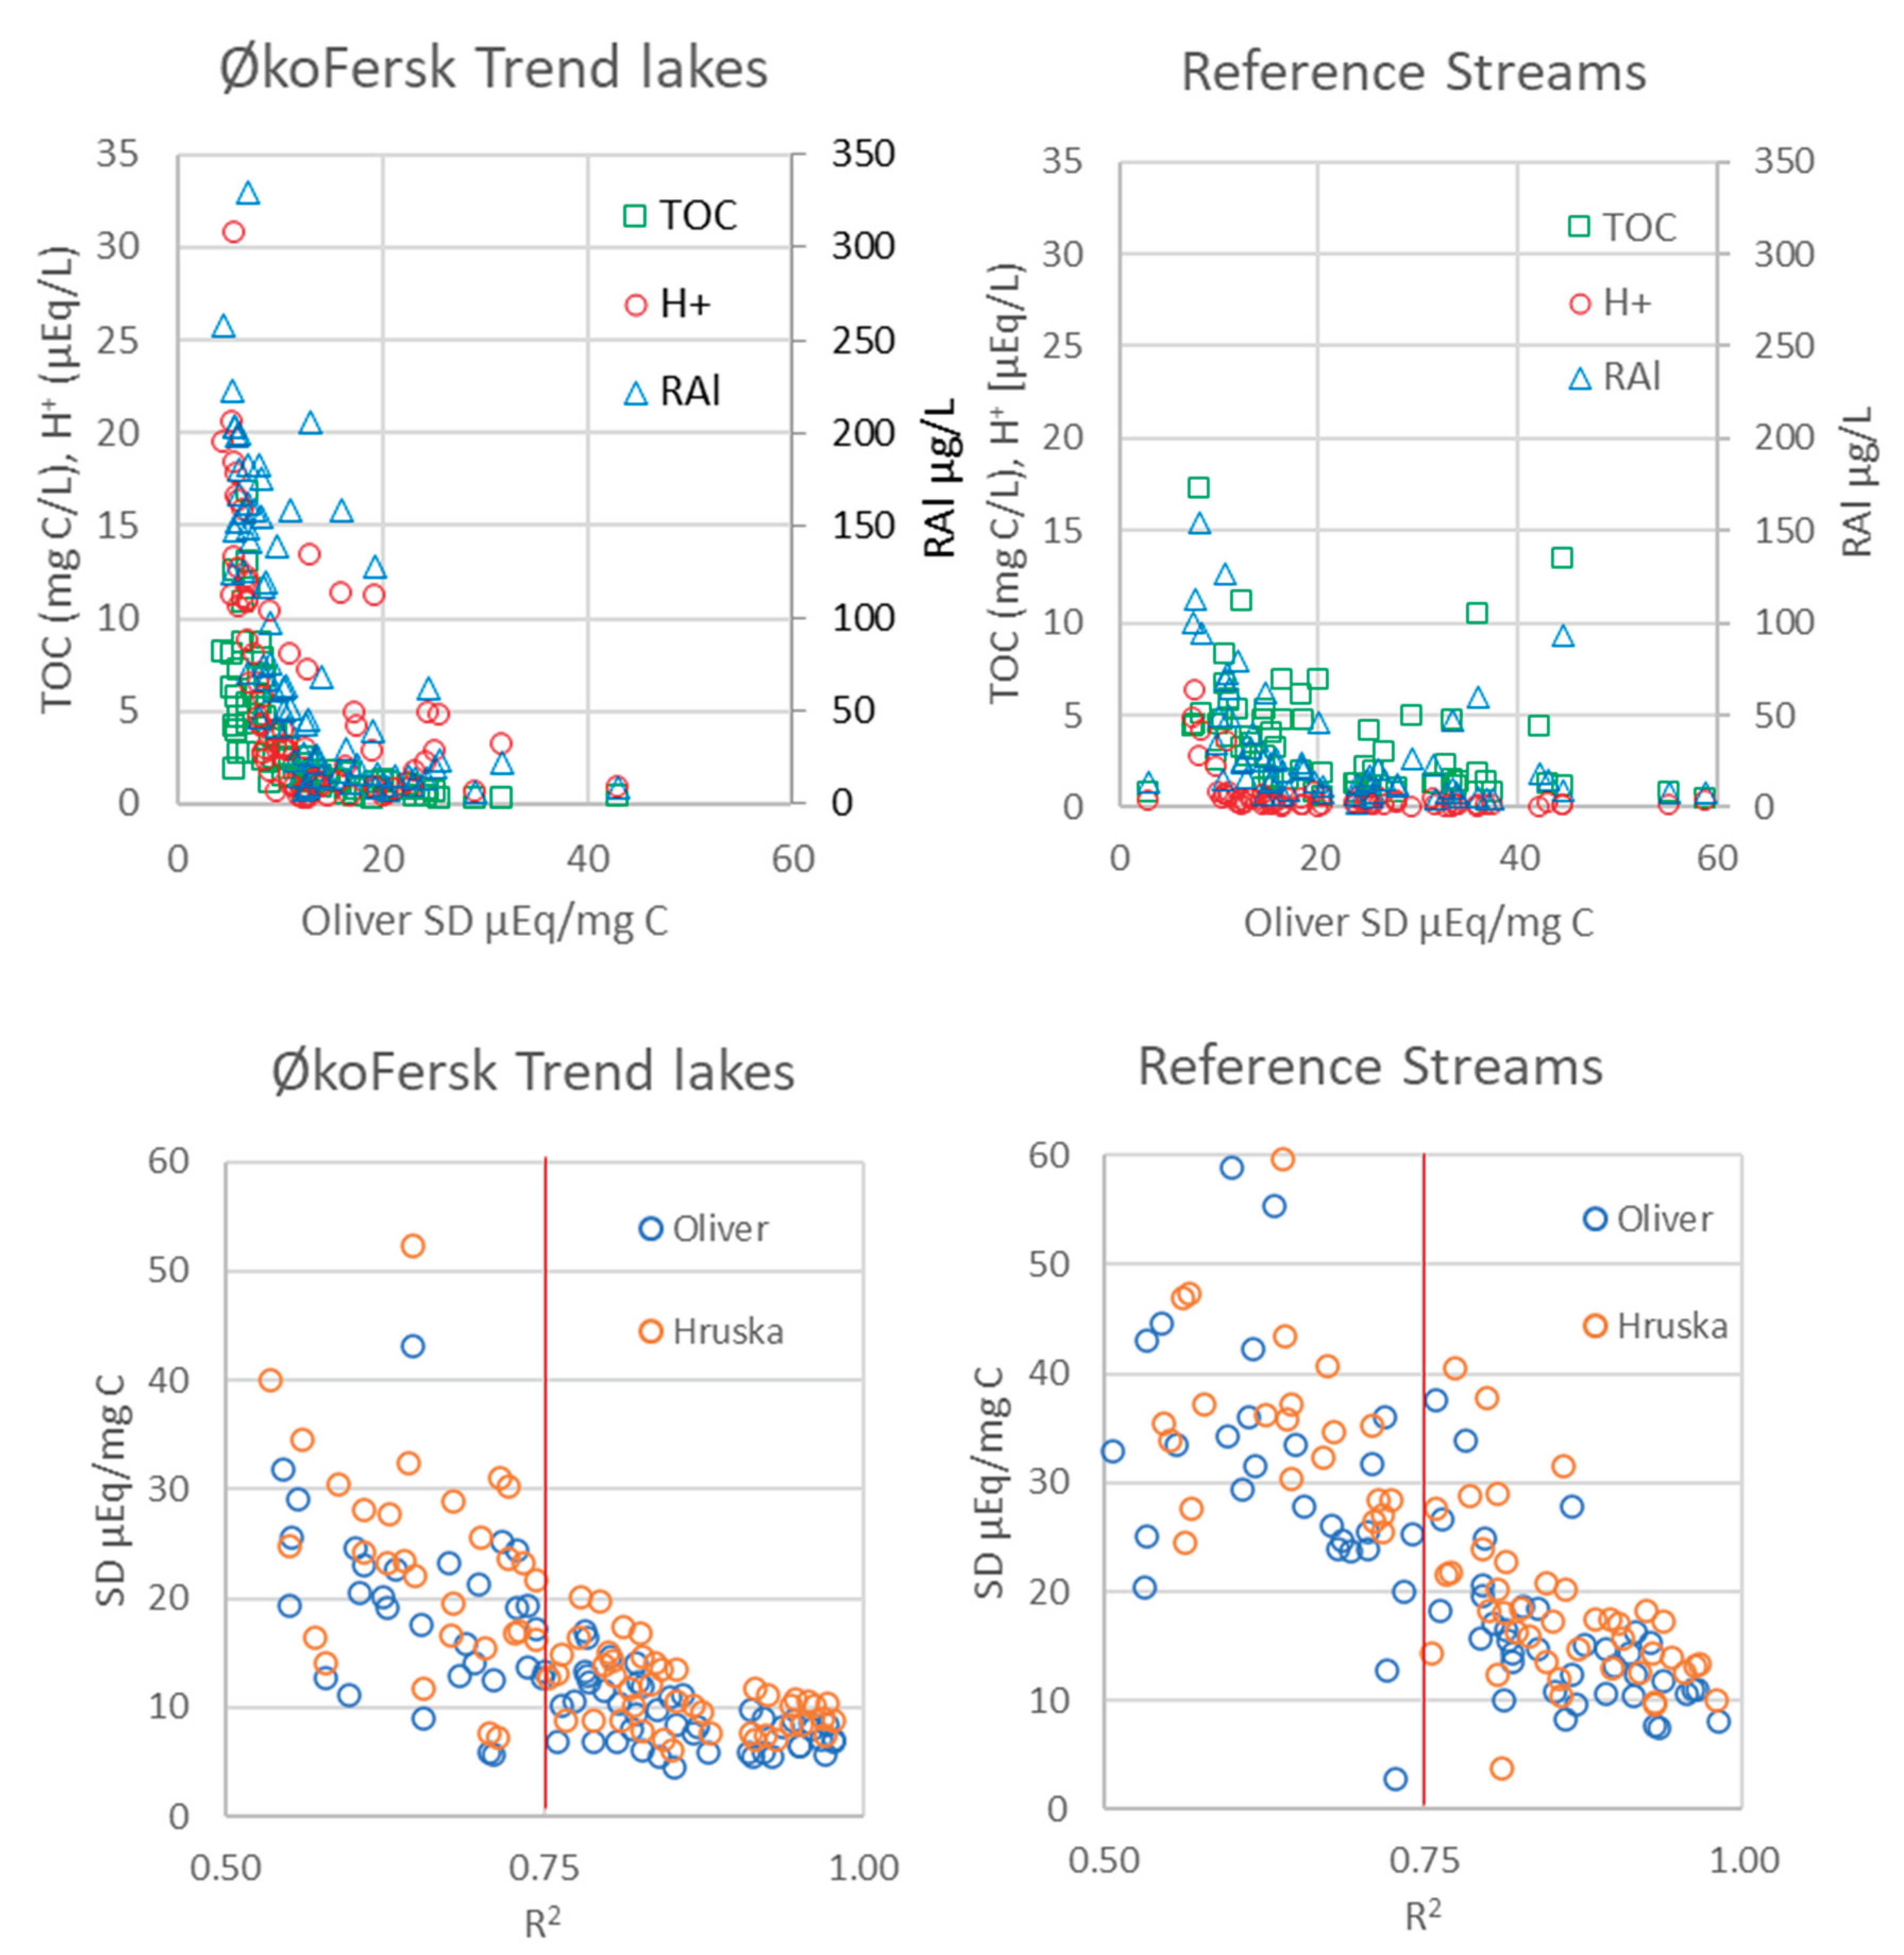
Figure 4.
Relationship between the site average levels of TOC, H+ and RAl vs. the optimized SD using the Oliver model in 44 ØkoFersk Trend lakes since 1986 and 35 Reference Streams since 2007 at sites with average TOC > 1 mg C/L and a R2 > 0.75 of the correlation between OAN- and Org.-.
Figure 4.
Relationship between the site average levels of TOC, H+ and RAl vs. the optimized SD using the Oliver model in 44 ØkoFersk Trend lakes since 1986 and 35 Reference Streams since 2007 at sites with average TOC > 1 mg C/L and a R2 > 0.75 of the correlation between OAN- and Org.-.
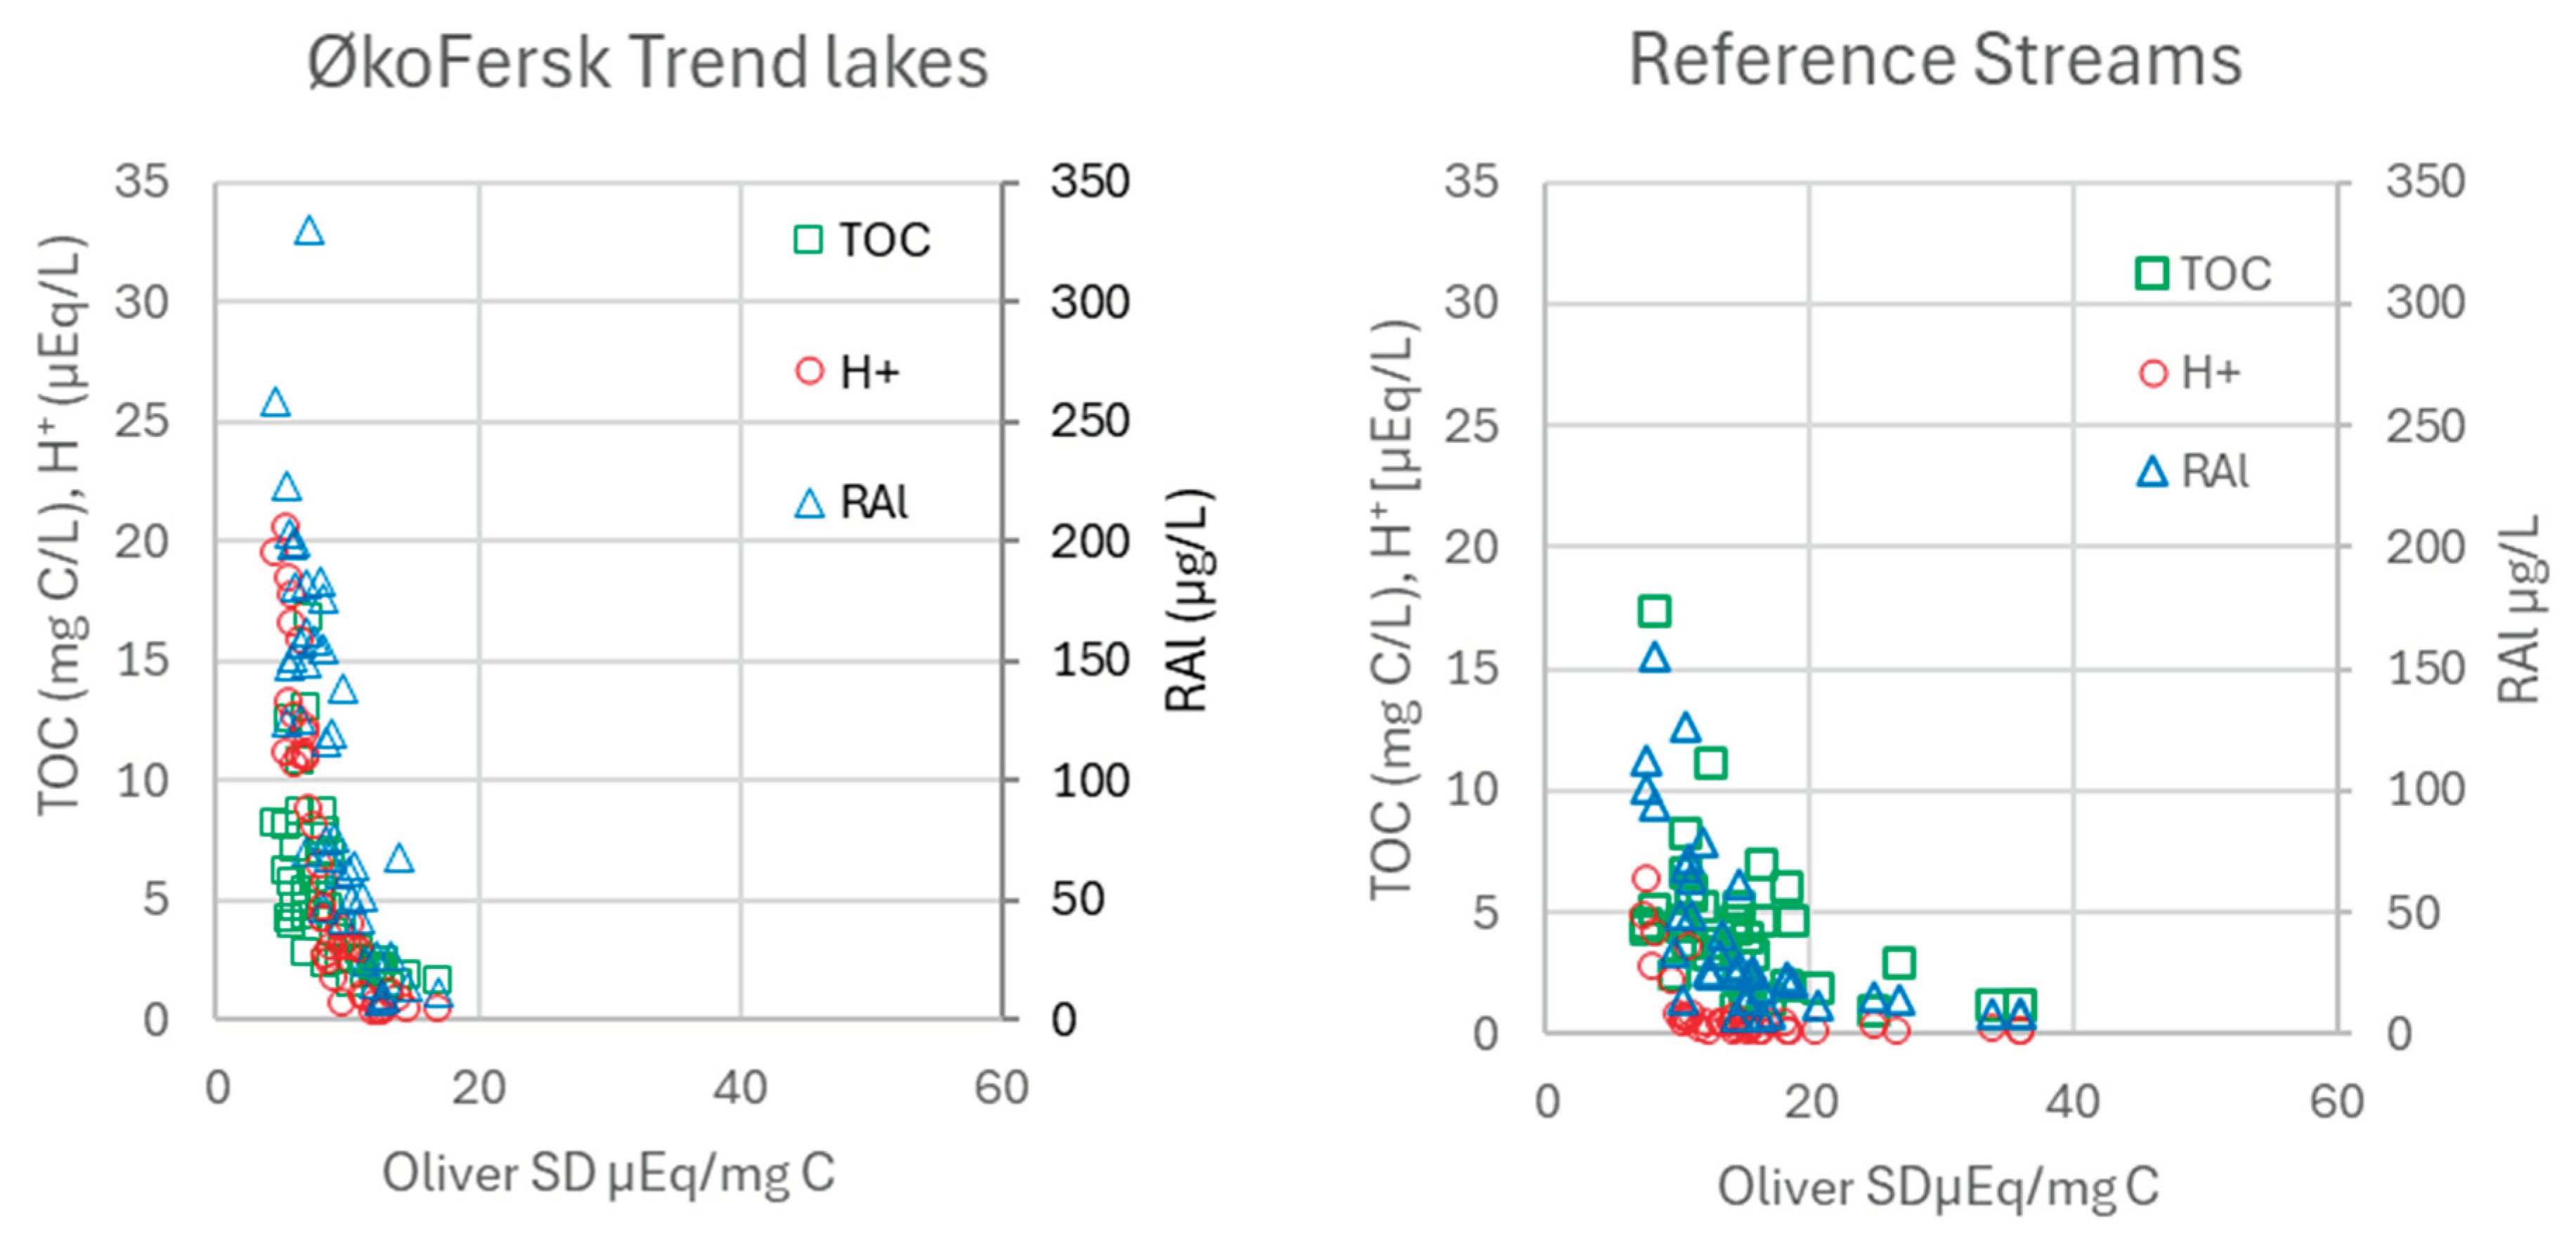
Figure 5.
Relationship between concentrations of TOC and RAl vs. the optimized site density (SD) in the Oliver model at 16 Reference streams in Norway. Based on monthly samples in 2022.
Figure 5.
Relationship between concentrations of TOC and RAl vs. the optimized site density (SD) in the Oliver model at 16 Reference streams in Norway. Based on monthly samples in 2022.
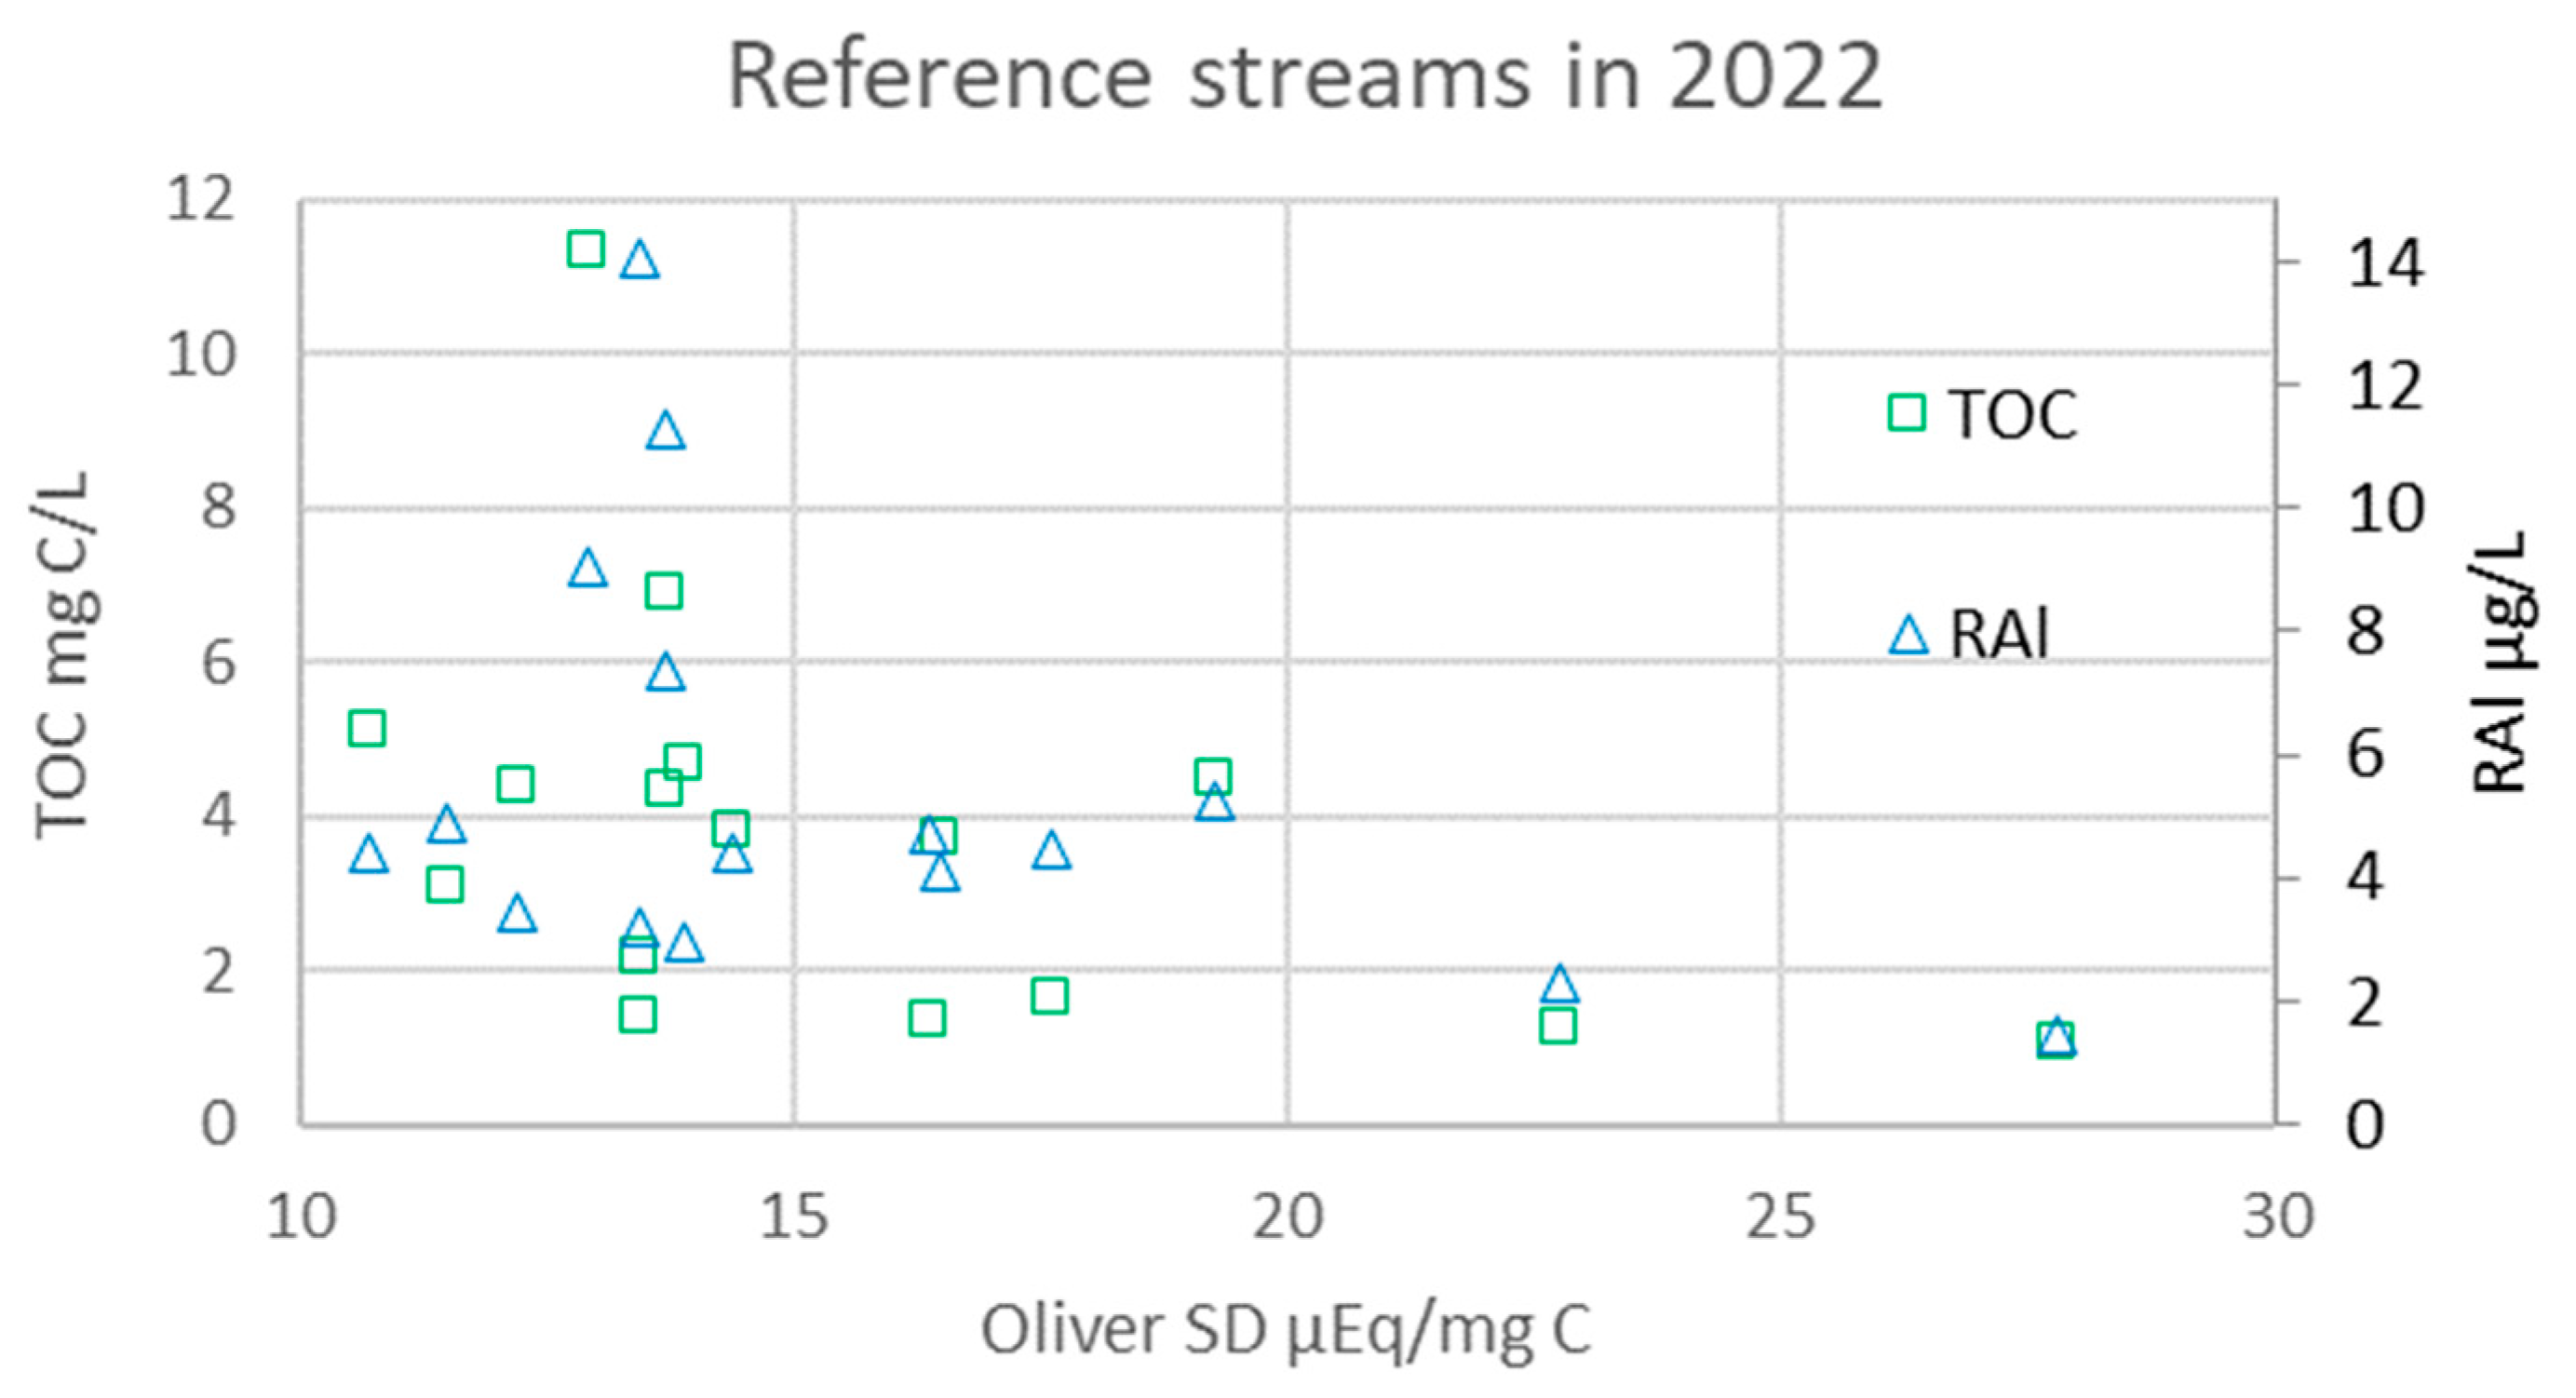
Figure 6.
Correlation between specific visual absorbency (sVISa) and site density (SD) at 16 Reference streams in Norway. The sVISa values are averaged monthly data from samples collected in 2022.
Figure 6.
Correlation between specific visual absorbency (sVISa) and site density (SD) at 16 Reference streams in Norway. The sVISa values are averaged monthly data from samples collected in 2022.
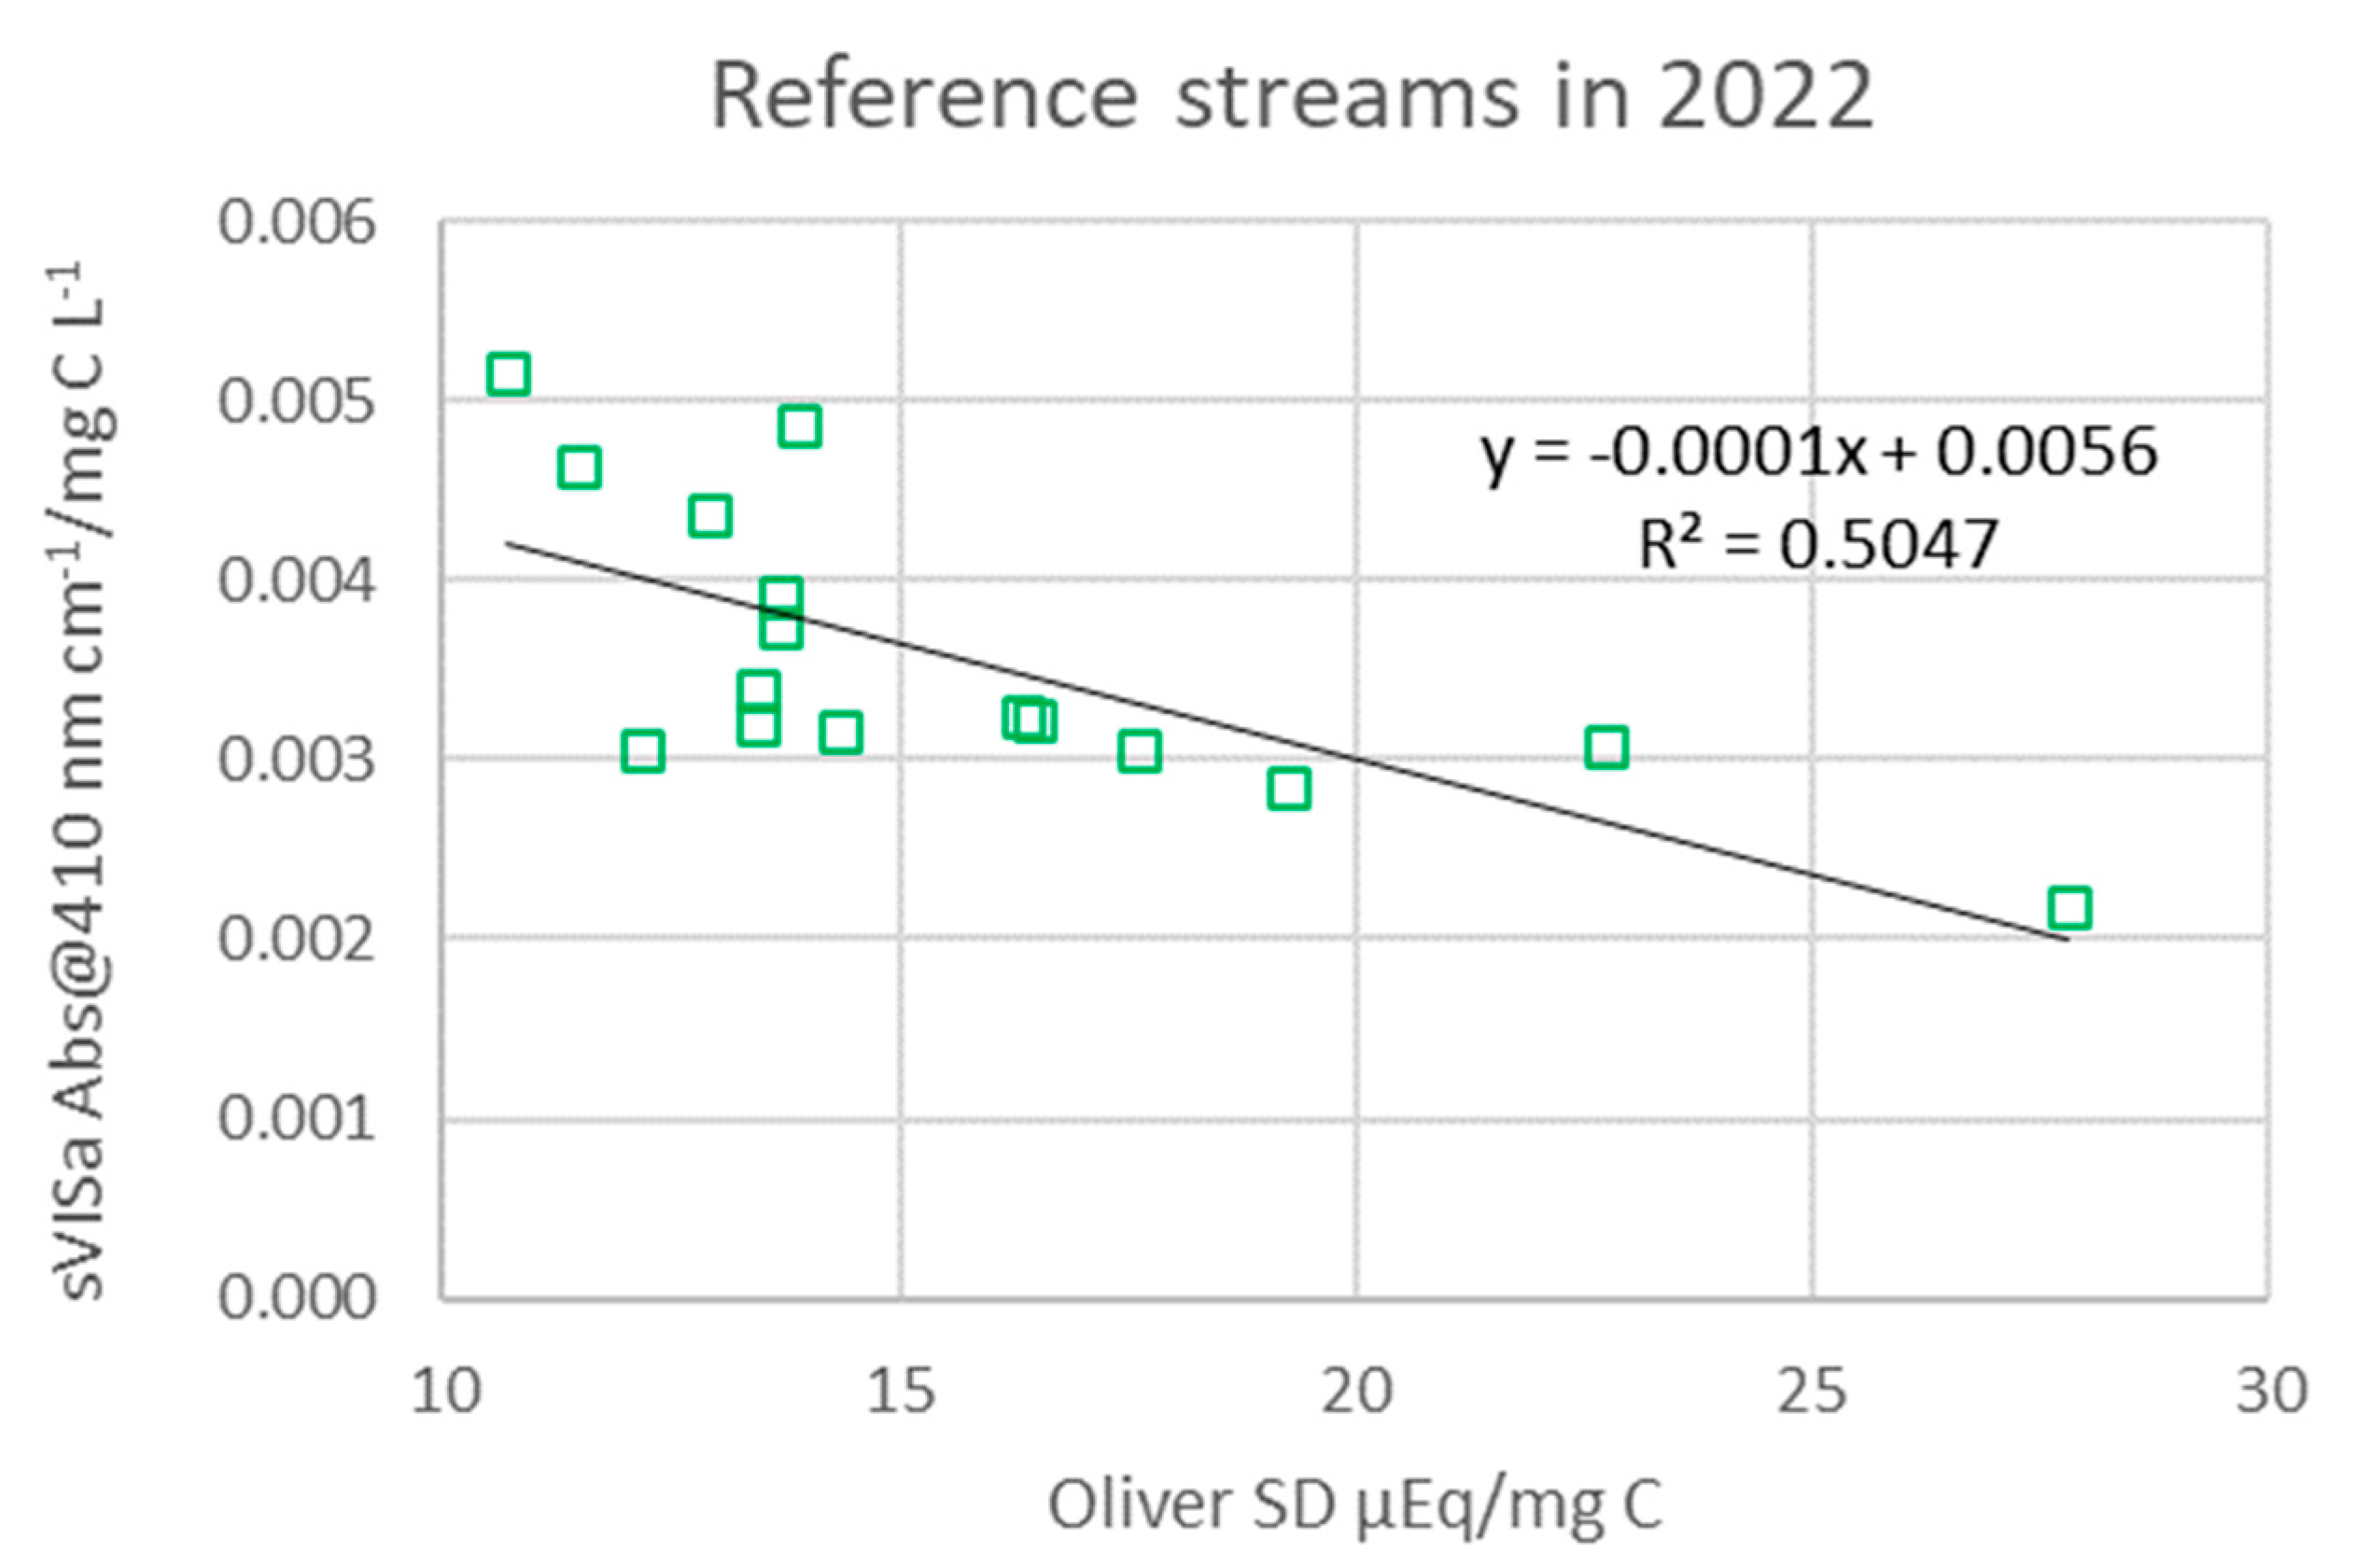
Figure 7.
ANC and TOC as explanatory factors for spatial variation in the temporal slope of CD.
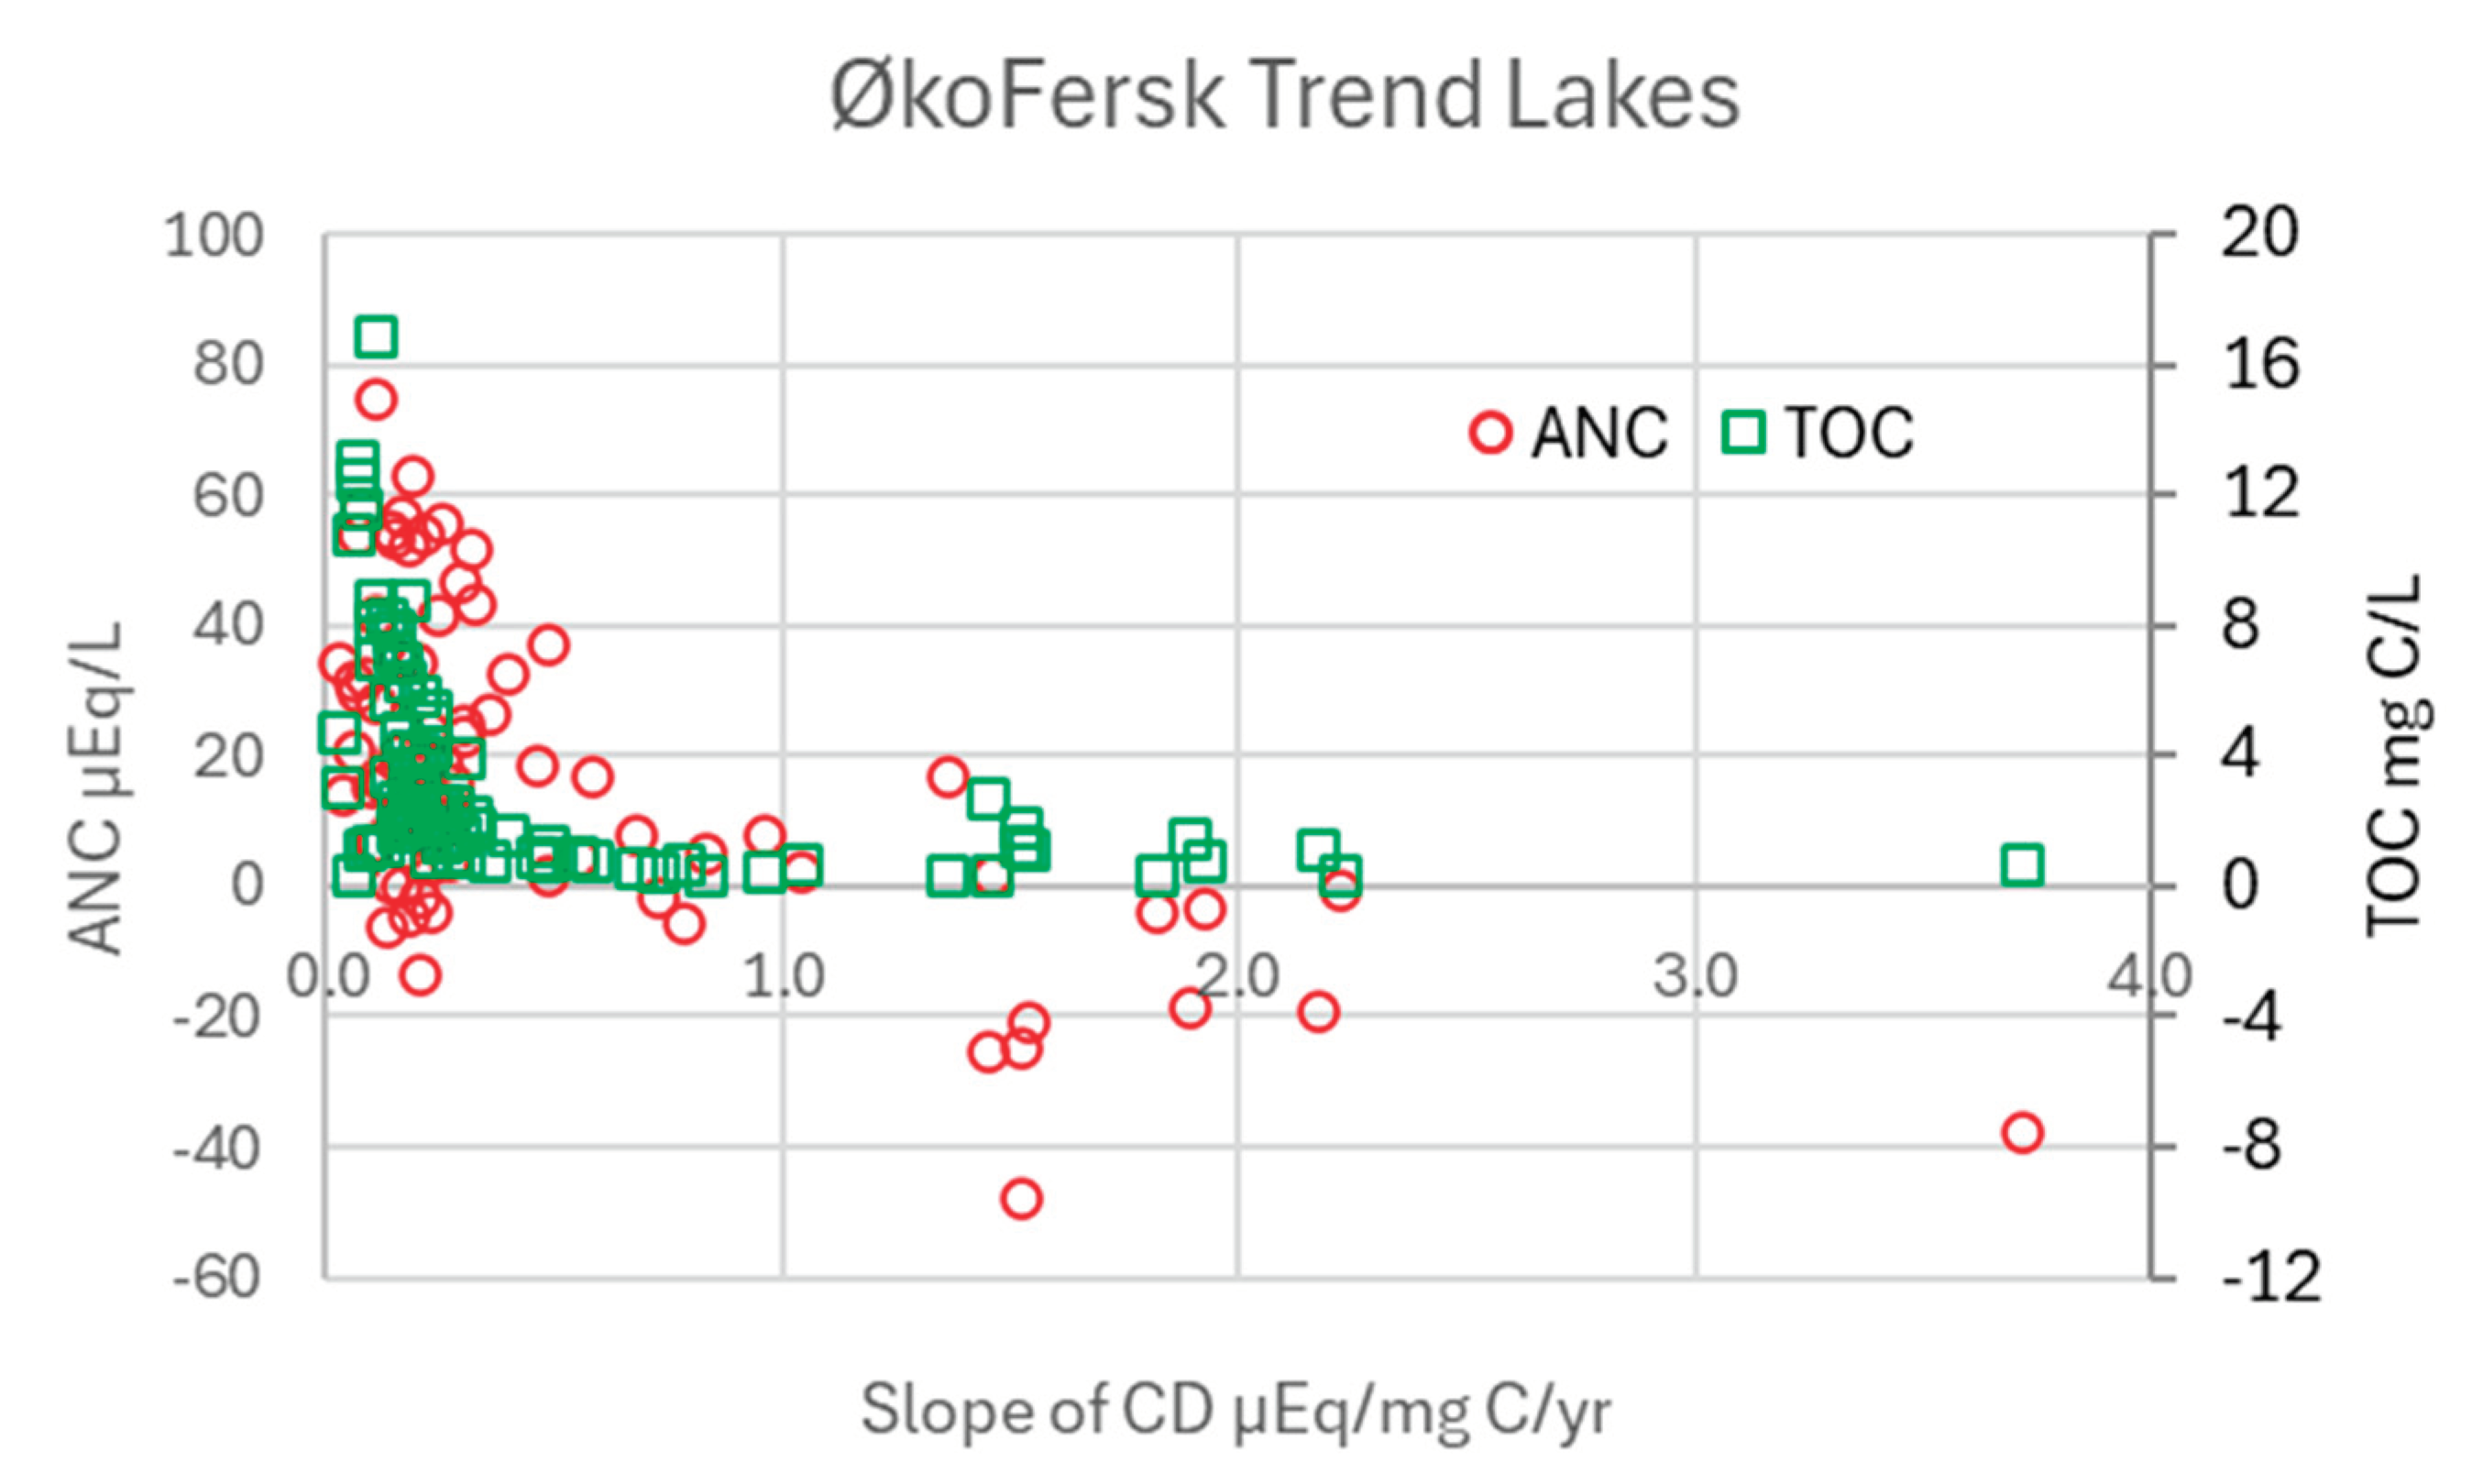

Table 1.
Optimized SD (Oliver model) for the modelled OAN-, i.e., generating a correlation slope of 1.000 against calculated Org.- based on IB incl. HCO3- calculated using Eqn. 9, on weekly data since 2001 from the 6 intensively monitored research stations in ØkoFersk Trend, along with main median explanatory parameters and the resulting sample median CD (i.e., Org.-/TOC). pH is based on median H+ concentration.
| Measured | Calculated | Oliver modelled | ||||||||
| Site | No. samples | SO42- | pH | TOC | RAl | Org.- | CD | OAN- | SD | R2 |
| # | ||||||||||
| Birkenes | 1083 | 48.5 | 4.88 | 5.7 | 270 | 14.8 | 2.49 | 22 | 5.31 | 0.7781 |
| Øygardsbekken | 826 | 34.8 | 5.49 | 1.5 | 58 | 7.37 | 4.23 | 15 | 11.7 | 0.5703 |
| Langtjern | 1086 | 16.3 | 5.05 | 11 | 155 | 59.8 | 5.25 | 61 | 6.88 | 0.9892 |
| Storgama | 1047 | 14.3 | 5.00 | 6.2 | 103 | 27.1 | 4.30 | 28 | 5.97 | 0.9585 |
| Kårvatn | 806 | 12.5 | 6.39 | 0.87 | 14 | 13.7 | 14.8 | 18 | 19.1 | 0.7426 |
| Dalelva | 1081 | 77.5 | 6.37 | 3.4 | 34 | 37.8 | 10.9 | 43 | 12.6 | 0.8625 |
Table 2.
Time trends in CD (i.e., Org.-/TOC), SO42-, H+ and the density of Al complexed to the DNOM (i.e., ILAl/TOC) at the 6 research monitoring stations between 2001 and 2021.
Table 2.
Time trends in CD (i.e., Org.-/TOC), SO42-, H+ and the density of Al complexed to the DNOM (i.e., ILAl/TOC) at the 6 research monitoring stations between 2001 and 2021.
| Station | CD Trend |
SO42 -Trend |
H+ Trend |
ILAl/TOC Trend |
| Birkenes | 0.10 | -1.93 | -0.10 | -0.47 |
| Øygardsbekken | 0.11 | -1.13 | -0.14 | -0.31 |
| Langtjern | 0.01 | -0.73 | -0.02 | -0.28 |
| Storgama | 0.06 | -0.84 | -0.19 | -0.30 |
| Kårvatn | -0.32 | -0.16 | 0.00 | -0.15 |
| Dalelva | -0.17 | -1.02 | 0.00 | -0.20 |
Table 3.
Overview of optimized site (SD) and median charge density (CD) derived using the Oliver and Hruška models on the assessed Norwegian monitoring datasets.
Table 3.
Overview of optimized site (SD) and median charge density (CD) derived using the Oliver and Hruška models on the assessed Norwegian monitoring datasets.
| Dataset | Site type | Data type | Period | # sites | # samples | Oliver SD | Hruška SD | Oliver CD | Hruška CD |
| Trend Lakes | Acid sensitive |
Spatio-temporal | 1986 - 2020 | 44 | 1 535 | 11.1 | 13.9 | 6.36 | 6.07 |
| Reference streams | Different land use | Spatio-temporal | 2017 - 2023 | 35 | 1 310 | 14.4 | 16.3 | 12.0 | 12.2 |
| Reference streams | Different land use | Spatial | 2022 | 16 | 181 | 13.8 | 15.8 | 12.3 | 13.6 |
| Rivers | High order | Spatial | 2021 - 2023 | 10 | 335 | 11.0 | 12.6 | 8.29 | 8.97 |
Disclaimer/Publisher’s Note: The statements, opinions and data contained in all publications are solely those of the individual author(s) and contributor(s) and not of MDPI and/or the editor(s). MDPI and/or the editor(s) disclaim responsibility for any injury to people or property resulting from any ideas, methods, instructions or products referred to in the content. |
© 2024 by the authors. Licensee MDPI, Basel, Switzerland. This article is an open access article distributed under the terms and conditions of the Creative Commons Attribution (CC BY) license (http://creativecommons.org/licenses/by/4.0/).
Copyright: This open access article is published under a Creative Commons CC BY 4.0 license, which permit the free download, distribution, and reuse, provided that the author and preprint are cited in any reuse.


