
Submitted:
04 April 2024
Posted:
04 April 2024
You are already at the latest version
Abstract
Succinic semialdehyde dehydrogenase (SSADH) is a mitochondrial enzyme involved in the catabolism of the neurotransmitter γ-amino butyric acid. Pathogenic variants in the gene encoding this enzyme cause SSADH deficiency, a developmental disease manifesting as hypotonia, autism and epilepsy. SSADH deficiency patients usually have family-specific gene variants. Here, we describe a family exhibiting four different SSADH variants, Val90Ala, Cys93Phe, and His180Tyr/Asn255Asp (a double variant). We provide a structural and functional characterization of these variants and show that Cys93Phe and Asn255Asp are pathogenic variants that affect the stability of the SSADH protein. Due to impairment of the cofactor NAD+ binding, these variants show a highly reduced enzyme activity. However, Val90Ala and His180Tyr exhibit normal activity and expression. The His180Tyr/Asn255Asp variant exhibits a highly reduced activity as a recombinant species, is inactive and shows a very low expression in eukaryotic cells. A treatment with substances that support protein folding by either increasing chaperone protein expression or by chemical means was not capable of increasing the expression of the pathogenic variants of the SSADH deficiency patient. However, stabilization of the folding of pathogenic SSADH variants by other substances may provide a treatment option for this disease.
Keywords:
Neurotransmitter diseases
; GABA
; mitochondria
; protein folding
; chaperones
; aldehyde dehydrogenases
1. Introduction
The catabolic pathway of the neurotransmitter γ-amino butyric acid (GABA) leads to production of succinic semialdehyde (SSA) that is normally converted into succinate by a mitochondrial enzyme, succinic semialdehyde dehydrogenase (SSADH, reviewed in [1,2]). In the absence of SSADH activity, SSA and GABA accumulate in the cells and in extracellular fluids [3,4]. In addition, a large fraction of SSA is converted into a toxic metabolite, γ-hydroxy butyric acid (GHB).
Impairment of SSADH activity is caused by mutations in the ALDH5A1 gene that encodes the SSADH enzyme, resulting in the rare genetic disease SSADH deficiency (SSADH-D) [5]. The patients usually suffer from a varying degree of mental retardation, behavioral problems with autistic features, muscle hypotonia, and lack of speech. Some SSADH-D patients also have epileptic seizures that can be very severe and may result in a sudden unexpected death in epilepsy [6,7,8,9]. Accumulation of the GABA metabolites is observed in the tissues and body fluids of the patients and can be used as a diagnostic tool. In addition, sequencing of the ALDH5A1 gene is usually done to verify the diagnosis.
SSADH-D is a recessively inherited disease, in which a large spectrum of pathogenic ALDH5A1 gene variants have been described [1,10,11,12]. However, there is only a poor genotype-phenotype correlation even within a single family. No major mutations that would be present in a high fraction of patients are known, and most patients have their private or family-specific pathogenic gene variants. In addition to a growing list of various pathogenic mutations in the ALDH5A1 gene, a number of presumably benign single nucleotide polymorphisms (SNP) are listed in genetic databases, such as ClinVar and GnomAD [13,14]. This poses a problem for the genetic diagnosis of SSADH-D, as it is not always clear how significant a certain gene variant is for the impairment of SSADH activity.
One such ALDH5A1 variant is c.538T>C, p.His180Tyr (SNP rs2760118), which is very common in the general population, with an allelic frequency of 0.348 [15]. The His180Tyr variant was described to be benign, with only mildly reduced or near-normal enzyme activity in overexpression systems [10,11,16]. However, it can exacerbate the effect of other amino acid substitutions that are present in the same allele of the ALDH5A1 gene, such as the Pro182Leu (c.545C>T) variant. Pro182Leu alone is also not very harmful, but together with His180Tyr, it shows a more severe effect on the SSADH enzyme activity [10]. Therefore, it is important to properly characterize all variants, including the seemingly benign ones that are present in a specific SSADH-D patient, before conclusions about the pathogenicity of the variants can be made.
In the present study, we describe an SSADH-D family with four ALDH5A1 gene variants, including the known His180Tyr and Cys93Phe variants [10], and two previously uncharacterized variants. We provide a thorough molecular and structural analysis of these variants, showing that Val90Ala and His180Tyr are benign variants, whereas Cys93Phe and Asn255Ala are pathogenic and result in a profound loss of SSADH protein expression and impairment of activity. We also show that treatment of cells expressing these variants with substances that enhance protein folding does not result in an improvement of SSADH expression or activity in the case of the above-mentioned pathogenic variants. Our data show that it is important to understand the molecular consequences of the potentially pathogenic variants as well their combinations, so that personalized precision therapies targeting patient-specific variants can be developed [17].
2. Results
2.1. SSADH Deficiency Patient Description
A male infant was born in-term as the first child of a non-consanguineous German couple without any family history of SSADH-D. According to the family, a mild developmental delay and muscle hypotonia were observed in the patient from early childhood on. Urine analysis revealed an increased amount of GHB, a hallmark of SSADH-D, and the diagnosis of SSADH-D was confirmed by genetic sequencing by a diagnostic company.
Upon the original genetic diagnosis in 2014, the patient was found to be heterozygous for two missense variants in the ALDH5A1 gene. The paternal variant, c.278C>T, p.Cys93Phe (Figure 1a), is a known pathogenic SSADH variant [10], whereas the maternal variant, c.763A>G (p.Asn255Asp, Figure 1b) was a novel one, i.e. a variant of unknown significance (VUS). However, a pathogenic variant in the same site, p.Asn255Ser, has already been described in an SSADH-D patient [10]. Thus, it was likely that the Asn255Asp variant would also be a pathogenic one, although its impact in terms of changes in the polarity and steric features may be less than that of Asn255Ser. In addition, two SNPs, rs2760118 (c.538T>C, p.His180Tyr; Figure 1c) and rs1272389025 (c.269T>C, p.Val90Ala; Figure 1d) were present in the maternal sequencing results [15]. Both SNPs were deemed to be without clinical relevance by the original diagnostic company, even though the His180Tyr variant has been shown to exacerbate the effect of SSADH missense variants that are present in the same allele [10], and Val90Ala has not been studied before.
Dermal fibroblast cultures were established from a punch biopsy of the patient for functional studies of the genetic ALDH5A1 variants. Upon further sequence analysis, the His180Tyr variant indeed turned out to be present in the same maternal allele as the Asn255Asp variant (thus designated as His180Tyr/Asn255Asp), whereas the Val90Ala variant resided in the other maternal allele that was not inherited by the patient, but was later found in the younger sister. Figure 1 shows the four variants found in the ALDH5A1 gene in the patient family (Figure 1).
2.2. Molecular Characterization of the SSADH Deficiency Patient Variants
Western Blot analysis with anti-SSADH antibody revealed barely any detectable SSADH expression in the patient fibroblasts, as compared to control fibroblasts (Figure 2a). Furthermore, SSADH activity was significantly reduced in the patient fibroblasts (Figure 2b), suggesting that the missense variants are indeed pathogenic and cause a destabilization of the SSADH protein, resulting in no or low expression of the SSADH protein. Consistently, immunostaining of the patient fibroblasts for the SSADH protein revealed very little SSADH signal as compared to the control fibroblasts (Figure 2c, green signals).
As the pathogenic nature of the Val90Ala variant and the Asn255Asp variant and its combination with His180Tyr was unclear, biochemical characterization of all individual genetic ALDH5A1 variants found in the family was performed at protein level. For this, the variants were cloned in the pcDNA3 vector and transiently overexpressed in HEK293T ALDH5A1 knockout cells [18] (Figure 3). The variants Val90Ala and His180Tyr exhibited a protein amount comparable with the wildtype (WT) SSADH protein, whereas Cys93Phe, Asn255Asp and His180Tyr/Asn255Asp were expressed in very low amounts (Figure 3a). Consistently, the SSADH activity of the latter three variants was barely measurable (below 5% of the WT), whereas the activities of Val90Ala and His180Tyr were comparable to the WT SSADH activity (Figure 3b). Therefore, Cys93Phe, Asn255Asp and His180Tyr/Asn255Asp are obviously pathogenic variants that result in a profound loss of both SSADH protein level and activity.
Since high-degree, transient overexpression may not always fully recapitulate the effects of natural missense variants of SSADH [11], HEK293 cell lines with a genomic knock-in were produced for the WT, His180Tyr and the three pathogenic variants. First, the endogenous ALDH5A1 gene was knocked out in Flip-InTM-293 cells. Thereafter, the SSADH WT and variant coding regions cloned in pcDNA5-FRT plasmid were inserted in the genomic Flp Recombination Target (FRT) site using the FRT recombinase activity of the Flip-In system [19]. The expression of the stable knock-in variants (Figure 4) was highly consistent with the transient expression data (Figure 3), with the His180Tyr variant showing a WT-like expression, whereas the potentially pathogenic variants Cys93Phe, Asn255Asp, and His180Tyr/Asn255Asp exhibited only very low amounts of the SSADH polypeptide (Figure 4a). Measurement of the relative SSADH activity revealed a WT level of activity for the His180Tyr variant (Figure 4b), supporting the previous findings showing that this variant is, per se, not pathogenic [10,11,16]. In contrast, Cys93Phe, Asn255Asp, and His180Tyr/Asn255Asp showed only background activity comparable with the SSADH knockout cells (Figure 4b).
2.3. Bioinformatic Analyses of the SSADH Variants
For structural in silico assessment of the SSADH variants, a bioinformatics analysis was performed. The amino acids altered in the SSADH variants reside in two different domains of the SSADH protein: in the NAD+ binding or the oligomerization domains (Figure 5). More precisely, Val90 and Cys93 are part of an α-helix at the surface of the NAD+ binding domain. Cys93 is engaged in multiple hydrogen bonds with the surrounding residues, stabilizing the monomer structure. In particular, hydrogen bonds with the backbone carbonyl of Pro258 and the hydroxyl moiety of Ser63 are formed, the latter of which is mediated by a water molecule (Figure 5). The substitution of Cys93 with Phe causes a loss of such interactions, thus resulting in profound structural impairments within the domain, as also shown before [12]. The Val90Ala substitution, given the conservation of the apolar chemical nature, does not change the hydrophobic microenvironment, in which Val90 is placed in a hydrophobic contact with Phe76, Val78, Pro234, and Pro258 (Figure 5). Thus, this variant, found in combination with the pathogenic His180Tyr/Asn255Asp in the mother of the patient, who is a healthy carrier, is not likely to be pathogenic.
The highly conserved Asn255 (Consurf value = 8) maps in a central stacked β-sheet in the proximity of the NAD+ binding groove. It interacts with the residues Gly252 and Val225 that belong to the same domain, but are deeply buried within the NAD+ binding cleft. The Asn255Asp substitution breaks these interactions, and new H-bonds with the backbone amino moiety of Gly66 are formed (Figure 5). These modifications may produce a structural domino effect by displacing the residues 252-282 that build the NAD+-binding cleft. Even a loss of the tetrameric SSADH structure may be induced, since the stacked β-sheet containing Asn255 is a fundamental structural element for the assembly of the SSADH oligomer [20].
His180 is a residue with an average degree of conservation (Consurf value = 4), and it resides in the oligomerization domain essential for the formation of the functionally active SSADH tetramer [20]. Through a water molecule, its imidazole moiety contacts the side chain of Lys192’ in the neighboring monomer (the prime denotes residues belonging to the neighboring tetramer subunit), thus contributing to the oligomer architecture (Figure 5). Upon substitution of His180 with Tyr, this interaction is preserved, as it is mediated by the hydroxyl group of the Tyr side chain at 2.6 Å distance from the ε-amino group of Lys192’ (Figure 5). Thus, the structural effects of the His180Tyr substitution are modest. Since His180 resides at the interface between the adjacent monomers, the predicted stabilization/destabilization energy of the His180Tyr variant, as compared to the WT protein, was predicted by the computational tool BindProfX [21]. The His180Tyr substitution only slightly alters the interface, with a measured ∆∆G value of +0.63 kcal/mol.
2.4. Spectroscopic and Kinetic Features of the SSADH Variants
According to our data, Val90Ala is a non-pathogenic variant, and Cys93Phe has already been characterized elsewhere [10,12,20]. Therefore, these two variants were not characterized further. However, the structural and functional features of His180Tyr and His180Tyr/Asn255Asp variants were analyzed using recombinant, purified SSADH protein species. Further analysis of the recombinant Asn255Asp variant was prevented by the fact that it turned out to be an insoluble species, at least in the E. coli bacterial expression system.
The far-UV circular dichroism (CD) spectrum (Figure 6a) of the His180Tyr variant (0.5 µM tetramer) is similar to that of the WT (0.5 µM tetramer). It presents characteristic minima at 208 and 222 nm, representative of a predominantly α-helical conformation, slightly altered in the presence of the coenzyme NAD+ for both the WT and the His180Tyr species (Supplementary Table S1). Interestingly, NAD+ binding to the WT species decreases the percentage of α -helices and increases that of β-sheets. The relative proportion of secondary structure elements evaluated for the His180Tyr variant in the presence of NAD+ shows an increase in other secondary structure elements, at the expense of β-sheets. It is a common feature that coenzyme binding causes modifications in the secondary structure spectra for NAD+-dependent dehydrogenases [23], which can be interpreted as a sign of NAD+ binding. The double variant His180Tyr/Asn255Asp exhibits a different far-UV CD spectrum that is less intense than those of the WT and His180Tyr, with an altered ratio of 208 nm/222 nm minima. No modifications were observed in the presence of NAD+, raising the question of how effective the coenzyme binding to this enzymatic species is (Figure 6a).
Binding of NAD+ stabilizes WT and His180Tyr SSADH, as revealed by the increase of about 4°C in the melting temperature (TM) values evaluated by monitoring the change of the dichroic signal at 222 nm in both species (Supplementary Table S1). The TM of the His180Tyr/Asn255Asp variant is 51.5 ± 0.2°C, a value similar to that of the other SSADH species in the absence of the coenzyme and unaffected by the presence of 200 µM NAD+.
The tetrameric molecular structure of WT and His180Tyr SSADH was assessed by size exclusion chromatography, with concentrations of 0.1 to 5 mg/ml (Supplementary Figure S1), confirming that the amino acid change in the oligomerization domain does not affect the overall quaternary structure of the protein.
The near-UV and visible CD spectrum of the WT SSADH presents dichroic signals related to some aromatic amino acid(s) that reside in an asymmetric environment (Figure 6b). In the presence of NAD+, a negative peak at 330 nm appears, reflecting the binding of the cofactor, with a slight alteration of the region around the aromatic amino acids. The His180Tyr variant shows a highly similar spectral behavior as the WT without NAD+. The CD signals of the His180Tyr/Asn255Asp variant present slight alterations as compared to the WT, both in the absence or presence of NAD+, suggesting that the coenzyme binding pocket is affected and the complex is not dichroic in the presence of NAD+, possibly due to an alteration in the microenvironment (Figure 6b).
The intrinsic fluorescence emission spectra reveal differences in the intensity values with a similar λmax = 332 nm for the WT and the His180Tyr variant, and a red-shift (λmax = 335 nm) for the His180Tyr/Asn255Asp variant (Figure 6c), indicating some alteration in the hydrophobic protein core, which is more pronounced in the case of the His180Tyr/Asn255Asp variant. The affinity for NAD+ was evaluated by measuring the change in the intrinsic fluorescence emission following excitation at 280 nm at increasing coenzyme concentrations (Figure 6d). The apparent equilibrium dissociation constants, KD, were calculated as described in chapter 4.15. WT and His180Tyr variant present similar KD values (2.8 ± 0.3 µM for WT, and 3.0 ± 1 µM for His180Tyr; Figure 6d), while the His180Tyr/Asn255Asp variant exhibits a strongly decreased affinity for the coenzyme, with a measured KD of 33 ± 13 µM, a value 10-fold higher than the WT (Figure 6d).
When assayed for the residual enzyme activity in the presence of 10 µM SSA and 500 µM NAD+, the His180Tyr and His180Tyr/Asn255Asp variants show different degrees of activity, with the His180Tyr variant retaining 83% (54 s-1) of the WT activity (65 s-1). In contrast, the activity of the His180Tyr/Asn255Asp variant dramatically drops to 0.1% (0.09 s-1), suggesting that a profound structural change is induced that leads to catalytic impairment. Interestingly, when the stability of the enzymatic species (WT and variants) is followed by evaluating the relative activity loss over time (Figure 6e), all species behave in a similar manner for at least two hours, corroborating that the Asn255Asp substitution induces a structural impairment deeply affecting the catalysis.
2.5. Folding Therapy Approaches for the SSADH Variants
Folding of pathogenic missense variants can in some cases be improved by chemical or pharmacological chaperones [24,25,26,27]. One possibility to enhance chaperone-mediated folding are small molecules, such as celastrol and arimoclomol, which increase the expression of the members of the Heat shock protein 70 (Hsp70) family [24,25,26]. Not only chaperone proteins but also pharmacological chaperones (PCs) and chemical chaperones can improve the folding of pathogenic variants [25,26]. Betaine (tri-methyl glycine) is a small molecule that has been shown by us and others to function as a PC substance for pathogenic variants of proteins residing in peroxisomes or lysosomes [28,29]. However, there are no data if betaine could directly bind to SSADH, but betaine is also used as a chemical chaperone to support protein folding and stability during protein purification and storage. In addition, betaine has several beneficial effects that can improve the state of cells, such as osmotic and lipotrophic effects [30].
Due to these potentially beneficial effects, stable knock-in cells expressing the SSADH variants were treated with arimoclomol, betaine or celastrol for 24 h. The effect of these substances on the SSADH variants was assessed by Western blot and SSADH activity measurement (Figure 7). Unfortunately, none of the substances showed a significant effect on SSADH protein level or activity (Figure 7a-d).
Similar data were obtained with the fibroblasts of the SSADH deficiency patient treated for 24 h or 48 h with the above substances (Figure 8). In the untreated patient fibroblasts, expression of SSADH was barely detectable. Neither arimoclomol, nor betaine, nor celastrol were able to significantly increase the expression or activity of SSADH in the fibroblasts of the patient (Figure 8a-b). After 48 h of treatment, arimoclomol and celastrol produced a minor increase in SSADH activity, but the difference to untreated cells failed to become significant (Figure 8b, right) Therefore, the three compounds tested do not seem to show any clear beneficial effect on the expression and activity of the pathogenic SSADH variants.
3. Discussion
In the present study, we have provided a thorough structural and functional characterization of the SSADH variants found in a family of a patient with SSADH-D. Upon original genetic diagnosis, two of these variants, Val90Ala and His180Tyr, were declared as SNPs without any clinical relevance, even though Val90Ala was a novel, uncharacterized variant (i.e. a VUS), and His180Tyr was known to exacerbate the effect of further amino acid substitutions [10,11,16]. The younger sister of the index patient in this family was later found to be a heterozygous carrier of Cys93Phe (paternal) and Val90Ala (maternal) variants. Therefore, it was important to characterize the molecular effects of the variants found in the family. The Val90Ala variant showed a WT-like expression and activity, thus confirming its non-pathogenic nature.
The Cys93Phe and Asn255Asp variants, located within the NAD+ binding domain, exhibited not only a highly reduced SSADH enzyme activity, but also a very low level of protein expression in eukaryotic cells, including patient fibroblasts. Akaboshi et al. have experimentally shown that the Cys93Phe variant shows a very low (3% of WT) activity in a transient overexpression system, but the protein expression level was not assessed [10]. Pop et al. have studied another substitution at this site, Cys93Arg, showing that this variant exhibited only a very low residual enzyme activity, but they did not study the protein expression level [11]. Exchange of Cys93 to Phe (or Arg) perturbs several hydrogen bonds within the cofactor binding domain, resulting in structural destabilization of these SSADH variants, as also previously predicted [12,20]. In addition, the Cys93Phe exchange also causes a high degree of steric hindrance within the monomeric SSADH structure, contributing to the structural destabilization of this variant [12]. Our studies show that the Cys93Phe substitution not only impairs the enzyme activity, but also profoundly perturbs the protein expression of this variant, consistent with the predicted structural aberrations and destabilization caused by this substitution.
Asn255 is a highly conserved residue within the NAD+ binding domain, and the Asn255Asp substitution causes a rearrangement of hydrogen bonds that are required for the stabilization of a central β-sheet. Consistently, the enzyme activity and the protein level were very low, and the variant was insoluble in bacterial expression systems, pointing to a profound structural destabilization by the Asn255Asp substitution. In addition to a local effect within the NAD+ binding domain, this substitution is also likely to cause further structural rearrangements within the polypeptide chain, which may even result in destabilization or loss of the tetrameric SSADH structure. Notably, several previously described, severe pathogenic variants also map in this region, including Gly252Cys, Gly252Val, Asn255Ser and Gly268Glu [10,12,20]. However, the Asn255Ser variant was shown to exhibit 17% of the WT SSADH activity in a transient overexpression system [10], but its protein expression level has not been studied. It is possible that the Ser substitution of Asn255 shows a milder structural perturbation than Asn255Asp, but its molecular consequences should be verified in a stable, low-level overexpression system, such as used in our study and by Popp et al. [11].
In our SSADH-D patient, the Asn255Asp substitution was found in the same allele together with a His180Tyr amino acid exchange, resulting in an exchange of two amino acids within the SSADH polypeptide. The His180Tyr variant alone has only a very mild effect on SSADH activity and shows a normal protein level (present study), with similar findings from previous studies [10,16]. Thus, this variant, found with a high frequency within the population [15], is per se not pathogenic. However, as shown previously, it may exacerbate the effect of further missense variants found within the same polypeptide chain, as shown previously for the Pro182Leu variant alone (44% residual activity) and in combination with His180Tyr (36% activity) [10]. In the case of our SSADH-D patient, the Asn255Asp substitution alone is already very severe, and His180Tyr does not further perturb the activity or expression of this variant. In eukaryotic expression systems, a very low activity and protein level are detected for the His180Tyr/Asn255Asp variant, similarly to the single Asn255Asp substitution. In fact, even though the Asn255Asp recombinant SSADH protein was insoluble in bacteria, the double-substituted His180Tyr/Asn255Asp species was stable and could be structurally assessed in our study. The His180Tyr/Asn255Asp variant exhibits a highly decreased affinity for NAD+, which can be attributed to the Asn255Asp substitution. Therefore, the low activity of this variant as a recombinant protein is probably due to inefficient cofactor binding, whereas in eukaryotic cells, the protein expression is also disturbed.
We here show that the reason for the high, WT-like SSADH activity of the His180Tyr variant is due to the fact that it does not cause a major structural perturbation. His180 resides within a region that is involved in the tetramerization of SSADH monomers. The hydrogen bond formed by His180 through a bridging water molecule with Lys192’ residue in an adjacent monomer is retained in the His180Tyr variant, as the hydroxyl group of Tyr180 is at a hydrogen bonding distance from Lys192’ of the neighboring subunit. However, further amino acid exchanges in the same polypeptide chain, e.g. Pro182Leu, may result in additional structural defects, such as impaired tetramerization.
As a mitochondrial protein, SSADH is transported in an unfolded state into the mitochondria, and only folds after reaching the matrix. The folding of mitochondrial proteins is supported by molecular chaperones that belong to the Hsp family [31]. We therefore attempted to increase the expression of Hsp proteins with two clinically relevant compounds, arimoclomol and celastrol [32,33,34]. In addition, betaine, a chemical chaperone that supports protein folding, was used. The rationale behind the treatment was that these compounds would be able to support the folding of the pathogenic SSADH variants, and thus result in an increased SSADH activity. Unfortunately, none of these compounds showed a significant effect on the expression or activity of SSADH in patient fibroblasts and in the knock-in expression system. In patient fibroblasts, a very small but non-significant increase in the activity was observed after 48 h of treatment, but a clear increase in the protein amount was not visible. Considering that the Asn255Asp variant shows an impaired cofactor binding, it may not be possible to reactivate this variant. The Cys93Phe variant could theoretically be more amenable to folding aids, as Cys93 is buried deep within the SSADH structure, and its exchange is likely to cause a structural effect, instead of directly impairing NAD+ binding. However, no significant improvement of activity was observed upon treatment with the three compounds. It is also possible that the compounds used were not able to reach mitochondria, thus being unable to stabilize SSADH folding. Therefore, further compounds should be identified that may be capable of supporting the expression and folding of specific pathogenic SSADH variants.
4. Materials and Methods
4.1. SSADH Deficiency Patient
A 7-year-old, male German SSADH deficiency patient from a non-consanguineous marriage was diagnosed with SSADH-D, and the family was found to exhibit the following genetic variants in the ALDH5A1 gene: c.269T>C, p.Val90Ala (maternal); c.278G>T, p.Cys93Phe; c.538T>C (paternal), p.His180Tyr, and c.763A>G, p.Asn255Asp (both maternal). The parents provided a signed informed consent for the study.
4.2. Chemicals
Succinic semialdehyde (SSA), succinic acid (SA), oxidized (NAD+) and reduced (NADH) nicotinamide adenine dinucleotide, isopropyl-β-d-thiogalactopyranoside (IPTG), phenylmethylsulfonyl fluoride (PMSF), poly-L-lysine, betaine and SigmaFast inhibitor cocktail were purchased from Merck (Darmstadt, Germany). Anti-SSADH and anti-His antibodies were from Santa Cruz Biotechnology (Heidelberg, Germany). ROTI®Mount FluorCare DAPI and 2-mercaptoethanol were from Roth (Karlsruhe, Germany). Hygromycin B was from Applichem GmbH (Darmstadt, Germany), and MACSfectinTM transfection reagent was from Miltenyi Biotech (Bergisch Gladbach, Germany). Puromycin, zeocin, Alexa Fluor 488-conjugated secondary anti-rabbit antibody and Mitotracker Orange were from Invitrogen/Thermo Fischer Scientific GmbH (Darmstadt, Germany). Further chemicals were of the highest purity available.
4.3. Site Directed Mutagenesis of SSADH Expression Constructs
Human ALDH5A1 open reading frame (ORF) and 36 bases of the 5’ untranslated region were cloned from pCDNA3 into pcDNA5/FRT vector (Invitrogen, Darmstadt, Germany). The constructs were used as templates for a PCR-based, site-directed mutagenesis using the Quick-Change II Mutagenesis Kit (Agilent Technologies, Frankfurt am Main, Germany) to generate the SSADH missense variants Val90Ala, Cys93Phe; His180Tyr; Asn255Asp; and His180Tyr/Asn255Asp. The oligonucleotides used for the mutagenesis are shown in Table 1. All constructs were confirmed by DNA sequencing of the complete ORF.
The ORF of human SSADH, without the mitochondrial targeting sequence (amino acids 1-47), was cloned with NdeI and XhoI recognition sequences into pET15b (Novagen, Life Science/Merck; Darmstadt, Germany), immediately adjacent to the N-terminal His-tag and the thrombin cleavage sequence. The oligonucleotides used for the mutagenesis are shown in Table 2. The constructs were verified by sequencing.
4.4. Eukaryotic Cell Culture
Human embryonic kidney (HEK-293T) and Flp-InTM-293 cells (Invitrogen/Thermo Fischer Scientific) were maintained in Dulbecco’s modified Eagle’s medium (DMEM) supplemented with 10% fetal calf serum (FCS) and 1% penicillin/streptomycin (all from Thermo Fisher Scientific). Cell cultures were maintained at 37°C in a humidified incubator with 8% CO2. Patient-derived skin fibroblasts of the SSADH deficiency patient harboring the above-described variants were obtained from a punch biopsy. Immortalized healthy human skin fibroblasts were used as a control [35]. All fibroblasts were cultured in DMEM (high glucose) medium supplemented with 10% FCS, 1% penicillin/streptomycin, 1% non-essential amino acids, and 1% sodium pyruvate (all from Thermo Fischer Scientific), and grown at 37°C in a humidified incubator with 8% CO2.
4.5. Generation of an SSADH-Deficient ALDH5A1 Knockout Flp-InTM-293 Cell Line
ALDH5A1 knockout cells (single cell clones) were generated using the same strategy as described previously [18]. Briefly, gRNAs for the exon 3 of the human ALDH5A1 gene (NM_001080.3) were cloned in the PX459 vector (Addgene: Cat.Nr.: 48139, Watertown, MA, USA). The gRNAs with the sequences 5'-CACCGGATGACTGCAGCCACGCCTA-3' (fwd) and 5'-AAACTAGGCGTGGCTGCAGTCATCC-3' (rev) were designed using the E-Crisp design tool [36]. The vector with the gRNA was used for the transfection of Flp-InTM-293 cells cells. The cells were first seeded onto 6-well plates in DMEM medium supplemented with 10% FCS and 1% penicillin/streptomycin and transfected with 1 μg SSADH-gRNA-PX459 and MACSfectinTM reagent (Miltenyi Biotec) according to the manufacturer’s instructions. After 24 h, the cells were supplemented with 2 μg/ml puromycin and cultured for additional 48 h. The surviving cells were then seeded as single cells onto 96-well plates and expanded for further analysis. The knockout was confirmed by Western blot and PCR-based sequencing of the genomic DNA.
4.6. Generation of Stable SSADH Knock-in Cell Lines
Flp-InTM-293 cell lines expressing WT SSADH or one of the SSADH variants (Cys93Phe, Asn255Asp, His180Tyr or Asn255Asp/His180Tyr) were generated according to the Flp-In system manual (Thermo Fischer Scientific). The Flp Recombination Target (FRT) site present in the genome of the Flp-InTM-293 cells and in the expression vector pcDNA5/FRT allows for a stable genomic integration of the gene of interest by means of a Flp recombinase-mediated DNA recombination. The FRT site in Flp-InTM-293 cells is inserted downstream of a lacZ-Zeocin fusion gene. After the recombination, the cells lose the zeocin resistance and gain a hygromycin resistance, which can be used for the selection of single-cell clones. The SSADH-deficient Flp-InTM-293 ALDH5A1 knockout cells were cotransfected with the pOG44 plasmid (expressing the Flp-recombinase) and the pcDNA5/FRT vectors with the SSADH variants (9:1 ratio). At 48 h post-transfection, the cells received 100 μg/ml hygromycin for additional 4 days. The hygromycin-resistant colonies were seeded onto 12-well plates, expanded, and analyzed further by western blot and PCR-based sequencing of the genomic DNA.
4.7. Transient Overexpression
Two hundred thousand HEK-293T and HEK-293T ALDH5A1-KO cells were seeded onto 6-well tissue culture plates in DMEM medium supplemented with 10% FCS and 1% Penicillin/Streptomycin. Next day, the cells were transfected with 1 µg of pcDNA3 carrying either WT SSADH or Val90Ala, Cys93Phe, His180Tyr, Asn255Asp, or the double His180Tyr/Asn255Asp SSADH variant using MACSfectinTM reagent (Miltenyi Biotec) according to the manufacturer’s protocol. After 48 h, the cells were solubilized in lysis buffer (50 mM Tris pH 7.4; 150 mM NaCl; 2 mM ethylenediamine-tetraacetic acid (EDTA); 1% NP-40), and the protein concentration was determined by Bradford assay (Biorad, Hercules, CA, USA) according to the manufacturer’s instructions.
4.8. Treatment of the Cells with Betaine and Hsp-Inducing Agents
SSADH-deficient ALDH5A1 knockout Flp-InTM-293 cells stably expressing one of the SSADH variants and patient-derived fibroblasts were seeded onto 6-well culture plates and next day treated with 50 µM arimoclomol (Biosynth, Staad, Switzerland), 10 mM betaine (Sigma-Aldrich) or 250 nM celastrol (Selleckchem, Cologne, Germany). After 24 h or 48 h, the cell pelletss were frozen at -20°C.
4.9. Western Blotting
Prior to western blot, the cells were lysed in a lysis buffer (50 mM Tris pH 7.4; 150 mM NaCl; 2 mM EDTA; 1% NP-40) supplemented with a protease inhibitor cocktail (Sigma Aldrich, Taufkirchen, Germany). Protein lysates (1 µg) were separated on a 10% SDS-PAGE under reducing conditions, followed by transfer to a nitrocellulose membrane. After blocking the membrane with 5% milk powder (Roth, Karlsruhe, Germany) in TBST, the membrane was probed with one of the following primary antibodies: anti-SSADH (1:10 000, ab 129017, Abcam, Cambridge, MA, USA) and anti-GAPDH (1:10 000, ab-8245, Abcam). Thereafter, the membrane was incubated with horseradish peroxidase-labeled secondary antibodies (Dako, Gostrup, Denmark). The final detection of proteins was performed using an Enhanced Chemiluminescence kit (SuperSignal™ West Femto/ Pico Chemiluminescent Substrate, Thermo Fisher Scientific). The signals were detected with an Odyssey® XF Imaging System (LI-COR Biotechnology, Bad Homburg, Germany). The intensity of the SSADH signal was normalized to GAPDH.
4.10. SSADH Enzyme Activity
SSADH enzyme activity in the stable knock-in cell clones and their parental cells was analyzed by a fluorimetric assay as described previously [18], with following modifications. Five hundred thousand cells were seeded onto a 6-well plate and solubilized in lysis buffer (50 mM Tris, pH 7.4; 150 mM NaCl; 2 mM EDTA; 1% NP-40) one day later. The protein lysates (1 µg) were pipetted in duplicates into a flat-bottom 96-well plate and incubated overnight at 37°C with 90 µl of an enzyme reaction mix containing 90 mmol/l Tris, pH 8.4, 0.2 mmol/l SSA, and 3 mmol/l NAD+. The SSADH-mediated reduction of NAD+ to NADH was measured as an increase in absorbance at 340 nm. To deduce the activity of other NAD+-reducing enzymes, the baseline values of samples incubated with a reaction mix without SSA were subtracted. Fluorescence was measured at an excitation wavelength of 355 nm and an emission wavelength of 470 nm with a TECAN Infinite 200 Microplate Reader (Tecan Group, Männedorf, Switzerland).
SSADH activity in the patient-derived fibroblasts was analyzed similarly, with modifications of the lysis procedure. Fibroblasts were first scraped into H2O, supplemented with 0.2 mM PMSF (Fluka Chemicals, Buchs, Switzerland) and 0.1% 2-mercaptoethanol (Roth), and then sonicated (12 s at 90% amplitude) with Sonopuls Sonicator (Bendelin, Berlin, Germany). Ten µg of the protein lysate was used to measure SSADH activity.
4.11. Immunocytochemistry
For SSADH staining, fifty thousand fibroblasts were seeded on poly-L-lysine coated glass coverslips in a 12-well plate, and incubated on the following day for 30 min at 37°C with fresh medium containing 100 nM MitoTracker Orange (Invitrogen) to stain mitochondria. The cells were washed and fixed with ice-cold methanol for 10 min at -20°C, then blocked with 1% bovine serum albumin (BSA) in PBS for 30 min at room temperature, followed by an 1 h incubation with a rabbit anti-SSADH antibody (1:100, ab129017, Abcam). After washing, the cells were incubated with Alexa Fluor 488-conjugated secondary anti-rabbit antibodies (Invitrogen). The coverslips were subsequently mounted onto specimen slides with ROTI®Mount FluorCare DAPI (Carl Roth, Karlsruhe, Germany), and the samples were then imaged using an Aurox Clarity laser-free, spinning-disc confocal microscope (Aurox Ltd., Oxfordshire, UK) and the Visionary software (Aurox Ltd, Oxfordshire, United Kingdom). Image processing was performed using the ImageJ software (NIH, Bethesda, MD, USA).
4.12. Bioinformatic Analyses
Conservation analyses were performed with the Consurf Server [37] using the human SSADH amino acid sequence (isoform 2). A conservation score from 1 (variable residue) to 9 (conserved residue) was attributed to each residue. BindProfX [21] was used to predict changes in the binding affinity upon the amino acid substitutions in the form of ΔΔG (change in free energy of binding) values. The algorithm combines the FoldX physics-based potential with the conservation scores from pairs of protein-protein interaction surface sequence profiles. Human SSADH crystal structure (PDB 2W8N) was superimposed with a structure obtained by in silico mutagenesis of the selected residues by the software PyMOL (Schrödinger, Limited Liability Company; LLC).
4.13. Expression, Purification and Enzymatic Assays of the Recombinant SSADH Species
Prokaryotic SSADH expression constructs in the pET15b vector (see 4.3) were transformed in E. coli BL21 cells. Bacteria were grown at 37°C in a selective Luria-Bertani broth with 0.1 mg/ml of ampicillin. Protein expression was allowed to proceed over night at 30°C after induction with 0.1 mM IPTG. The bacterial pellet, collected by centrifugation, was resuspended in a buffer (20 mM sodium phosphate, 20 mM imidazole, 500 mM sodium chloride, 10 mM β-mercaptoethanol, 0.5 mM PMSF, SIGMAFAST™ EDTA-free protease inhibitor cocktail, pH 7.40). Cell lysis was performed for 30 min at room temperature under constant agitation after adding lysozyme to a final concentration of 0.2 mg/ml. The suspension was then frozen in liquid nitrogen. After thawing, the suspension was treated with DNAse for 30 min under constant agitation, centrifuged, and the supernatant was loaded into a 5 ml HisTrap™ fast flow column (Cytiva, Global Life Sciences Solutions, Marlborough, MA, USA). A 50 min elution gradient was carried out for a single-step purification (flow 1 ml/min), with a second buffer containing 20 mM sodium phosphate, 500 mM imidazole, 500 mM sodium chloride, 10 mM β-mercaptoethanol, pH 7.40. The protein fractions were collected and dialyzed in 100 mM potassium phosphate, 10 mM β-mercaptoethanol, pH 8.00. The activity was measured spectroscopically at 340 nm as the NADH formed in the reaction (εM= 6,220 M-1cm-1) following the addition of an enzymatic sample to a total of 0.35 ml of 10 µM SSA and 500 µM NAD+ in 100 mM potassium phosphate, 10 mM β-mercaptoethanol, pH 8. The recombinant SSADH (amino acids 48-535) was then concentrated with Spin-X UF concentrators (Corning Inc., NY, USA) with cut-off 10 kDa, supplemented with 5% glycerol, frozen in liquid nitrogen, and finally stored at -80°C. SDS-PAGE was performed using 12% polyacrylamide gel to assess the purity of the recombinant SSADH. To assess the oligomerization state, size exclusion chromatography was carried out in 100 mM potassium phosphate and 150 mM NaCl, pH 8. Different concentrations (from 0.1 to 5 mg/ml) of recombinant WT and His180Tyr SSADH were loaded into a Superdex 200 (10/300) column (GE Healthcare, Boston, MA, USA) coupled to an ÄKTA Pure system (GE Healthcare), and the 280 nm signal was monitored.
4.14. Spectroscopic Analyses and Determination of the Equilibrium Dissociation Constant for NAD+
All spectroscopic measurements were carried out at 25°C in 100 mM potassium phosphate buffer, pH 8, unless otherwise stated. Absorbance spectra were recorded with a Jasco V-550 spectrophotometer (Jasco Europe S.R.L., Milano, Italy), whereas intrinsic fluorescence emission analyses were carried out in a Jasco FP-750 spectrofluorimeter (Jasco Europe S.R.L) at 0.1 mg/ml SSADH, with 5 nm excitation and emission bandwidths upon excitation at 280 nm. Circular dichroism (CD) spectra were acquired in a Jasco J-710 spectropolarimeter (Jasco Europe S.R.L) at a scan speed of 50 nm/min with 2 nm bandwidth, using 0.1 mg/ml and 1 mg/ml protein concentrations for the far UV (190-250 nm) and near UV/visible (250-550 nm) range, respectively. Thermal denaturation was performed by monitoring the CD signal at 222 nm of 0.1 mg/ml SSADH species on a 25-90°C linear temperature gradient with a temperature slope of 1.5°C/min.
The equilibrium dissociation constant, KD, for NAD+ was calculated by plotting the change in the intrinsic fluorescence emission, following excitation of the enzyme at 280 nm, as a function of NAD+ concentration and fitting it to the following equation:
where Y refers to the change of intrinsic fluorescence at each NAD+ concentration, Ymax to the maximal change in the intrinsic fluorescence at the saturating NAD+ concentration, and [E] refers to the monomeric SSADH concentration.
4.15. Statistical Analysis
Statistical analysis was performed using the GraphPad Prism software (v. 5.02, La Jolla, CA, USA). The data are presented as mean values ± SD unless otherwise stated. Differences between two groups were tested using Student’s t-test. Comparison of multiple groups was performed by One-way ANOVA followed by Tukey’s post-hoc test.
Supplementary Materials
The following supporting information can be downloaded at the website of this paper posted on Preprints.org., Figure S1: Molecular size of WT and H180Y SSADH. Supplementary Table S1: Secondary structure percentage of WT and H180Y evaluated by BeStSel, and TM of the same species measured at 222 nm.
Author Contributions
Conceptualization, R.T. and M.B.; methodology, M.D., S.C.; data validation, M.D., S.C.; Experimental investigation, M.D., S.C., S.F., N.T., I.B. and V.F.; data curation, M.D., S.C., M.B. and R.T.; writing—original draft preparation, R.T., M.B., M.D.; writing—review and editing, all authors; visualization, M.D., S.C., M.B. and R.T.; supervision, M.B., and R.T.; project administration, M.B. and R.T.; funding acquisition, M.B. and R.T. All authors have read and agreed to the published version of the manuscript.
Funding
This research was funded by SSADH-Defizit e.V. (grant 2018-001-Tik to R.T., and grant 2019-01-Bertoldi to M.B.), SSADH Association (to R.T.), and De Neu Asociación de Enfermedades de los Neurotrasmisores to M.B.
Institutional Review Board Statement
The study was conducted in accordance with the Declaration of Helsinki. An approval of the local Ethics Committee of the Faculty of Medicine, University of Giessen was obtained (License number AZ 144/21, from August 08, 2021).
Informed Consent Statement
Informed consent was obtained from the legal custodians of the subject involved in the study.
Data Availability Statement
The original research data are available from the authors upon a reasonable request.
Acknowledgments
We wish to thank Silvia Bianconi, Ralf Füllkrug, Petra Janson and Simone Kegel for their excellent technical assistance.
Conflicts of Interest
The authors declare no conflicts of interest. The funders had no role in the design of the study; in the collection, analyses, or interpretation of data; in the writing of the manuscript; or in the decision to publish the results.
References
- Didiasova, M.; Banning, A.; Brennenstuhl, H.; Jung-Klawitter, S.; Cinquemani, C.; Opladen, T.; Tikkanen, R. Succinic Semialdehyde Dehydrogenase Deficiency: An Update. Cells 2020, 9. [CrossRef]
- Lee, H.H.C.; McGinty, G.E.; Pearl, P.L.; Rotenberg, A. Understanding the Molecular Mechanisms of Succinic Semialdehyde Dehydrogenase Deficiency (SSADHD): Towards the Development of SSADH-Targeted Medicine. Int J Mol Sci 2022, 23. [CrossRef]
- Gibson, K.M.; Sweetman, L.; Nyhan, W.L.; Jakobs, C.; Rating, D.; Siemes, H.; Hanefeld, F. Succinic semialdehyde dehydrogenase deficiency: An inborn error of gamma-aminobutyric acid metabolism. Clin Chim Acta 1983, 133, 33-42. [CrossRef]
- Jakobs, C.; Bojasch, M.; Mönch, E.; Rating, D.; Siemes, H.; Hanefeld, F. Urinary excretion of gamma-hydroxybutyric acid in a patient with neurological abnormalities. The probability of a new inborn error of metabolism. Clinica chimica acta; international journal of clinical chemistry 1981, 111, 169–178. [CrossRef]
- Chambliss, K.L.; Hinson, D.D.; Trettel, F.; Malaspina, P.; Novelletto, A.; Jakobs, C.; Gibson, K.M. Two exon-skipping mutations as the molecular basis of succinic semialdehyde dehydrogenase deficiency (4-hydroxybutyric aciduria). Am J Hum Genet 1998, 63, 399-408. [CrossRef]
- Pearl, P.L.; Acosta, M.T.; Theodore, W.H.; Novotny, E.J.; Bennett, H.D. Human SSADH Deficiency – Phenotype and Treatment. 2006.
- Pearl, P.L.; Gibson, K.M.; Acosta, M.T.; Vezina, L.G.; Theodore, W.H.; Rogawski, M.A.; Novotny, E.J.; Gropman, A.; Conry, J.A.; Berry, G.T.; Tuchman, M. Clinical spectrum of succinic semialdehyde dehydrogenase deficiency. Neurology 2003, 60, 1413–1417. [CrossRef]
- Pearl, P.L.; Gibson, K.M.; Cortez, M.A.; Wu, Y.; Carter Snead, O., 3rd; Knerr, I.; Forester, K.; Pettiford, J.M.; Jakobs, C.; Theodore, W.H. Succinic semialdehyde dehydrogenase deficiency: Lessons from mice and men. J Inherit Metab Dis 2009, 32, 343-352. [CrossRef]
- Pearl, P.L.; Parviz, M.; Vogel, K.; Schreiber, J.; Theodore, W.H.; Gibson, K.M. Inherited disorders of gamma-aminobutyric acid metabolism and advances in ALDH5A1 mutation identification. Dev Med Child Neurol 2015, 57, 611-617. [CrossRef]
- Akaboshi, S.; Hogema, B.M.; Novelletto, A.; Malaspina, P.; Salomons, G.S.; Maropoulos, G.D.; Jakobs, C.; Grompe, M.; Gibson, K.M. Mutational spectrum of the succinate semialdehyde dehydrogenase (ALDH5A1) gene and functional analysis of 27 novel disease-causing mutations in patients with SSADH deficiency. Hum Mutat 2003, 22, 442-450. [CrossRef]
- Pop, A.; Smith, D.E.C.; Kirby, T.; Walters, D.; Gibson, K.M.; Mahmoudi, S.; van Dooren, S.J.M.; Kanhai, W.A.; Fernandez-Ojeda, M.R.; Wever, E.J.M.; Koster, J.; Waterham, H.R.; Grob, B.; Roos, B.; Wamelink, M.M.C.; Chen, J.; Natesan, S.; Salomons, G.S. Functional analysis of thirty-four suspected pathogenic missense variants in ALDH5A1 gene associated with succinic semialdehyde dehydrogenase deficiency. Molecular genetics and metabolism 2020, 130, 172–178. [CrossRef]
- Tokatly Latzer, I.; Roullet, J.B.; Cesaro, S.; DiBacco, M.L.; Arning, E.; Rotenberg, A.; Lee, H.H.C.; Opladen, T.; Jeltsch, K.; Garcia-Cazorla, A.; Julia-Palacios, N.; Gibson, K.M.; Bertoldi, M.; Pearl, P.L. Phenotypic correlates of structural and functional protein impairments resultant from ALDH5A1 variants. Hum Genet 2023, 142, 1755-1776. [CrossRef]
- ClinVar Database. Available online: https://www.ncbi.nlm.nih.gov/clinvar (accessed on 07.03.2024).
- GnomAD Database. Available online: https://gnomad.broadinstitute.org (accessed on 07.03.2024).
- ALDH5A1 variants GnomAD Database. Available online: https://gnomad.broadinstitute.org/gene/ALDH5A1?dataset=gnomad_r3 (accessed on 07.03.2024).
- Menduti, G.; Biamino, E.; Vittorini, R.; Vesco, S.; Puccinelli, M.P.; Porta, F.; Capo, C.; Leo, S.; Ciminelli, B.M.; Iacovelli, F.; Spada, M.; Falconi, M.; Malaspina, P.; Rossi, L. Succinic semialdehyde dehydrogenase deficiency: The combination of a novel ALDH5A1 gene mutation and a missense SNP strongly affects SSADH enzyme activity and stability. Mol Genet Metab 2018, 124, 210-215. [CrossRef]
- Didiasova, M.; Banning, A.; Tikkanen, R. Development of precision therapies for rare inborn errors of metabolism: Functional investigations in cell culture models. J Inherit Metab Dis 2023. [CrossRef]
- Brennenstuhl, H.; Didiasova, M.; Assmann, B.; Bertoldi, M.; Molla, G.; Jung-Klawitter, S.; Kuseyri Hubschmann, O.; Schroter, J.; Opladen, T.; Tikkanen, R. Succinic Semialdehyde Dehydrogenase Deficiency: In Vitro and In Silico Characterization of a Novel Pathogenic Missense Variant and Analysis of the Mutational Spectrum of ALDH5A1. Int J Mol Sci 2020, 21. [CrossRef]
- O'Gorman, S.; Fox, D.T.; Wahl, G.M. Recombinase-mediated gene activation and site-specific integration in mammalian cells. Science 1991, 251, 1351-1355. [CrossRef]
- Kim, Y.G.; Lee, S.; Kwon, O.S.; Park, S.Y.; Lee, S.J.; Park, B.J.; Kim, K.J. Redox-switch modulation of human SSADH by dynamic catalytic loop. EMBO J 2009, 28, 959-968. [CrossRef]
- Xiong, P.; Zhang, C.; Zheng, W.; Zhang, Y. BindProfX: Assessing Mutation-Induced Binding Affinity Change by Protein Interface Profiles with Pseudo-Counts. J Mol Biol 2017, 429, 426-434. [CrossRef]
- Sehnal, D.; Bittrich, S.; Deshpande, M.; Svobodova, R.; Berka, K.; Bazgier, V.; Velankar, S.; Burley, S.K.; Koca, J.; Rose, A.S. Mol* Viewer: Modern web app for 3D visualization and analysis of large biomolecular structures. Nucleic Acids Res 2021, 49, W431-W437. [CrossRef]
- Murtas, G.; Marcone, G.L.; Peracchi, A.; Zangelmi, E.; Pollegioni, L. Biochemical and Biophysical Characterization of Recombinant Human 3-Phosphoglycerate Dehydrogenase. Int J Mol Sci 2021, 22. [CrossRef]
- Mohamed, F.E.; Al-Gazali, L.; Al-Jasmi, F.; Ali, B.R. Pharmaceutical Chaperones and Proteostasis Regulators in the Therapy of Lysosomal Storage Disorders: Current Perspective and Future Promises. Frontiers in pharmacology 2017, 8, 448. [CrossRef]
- Parenti, G.; Andria, G.; Valenzano, K.J. Pharmacological Chaperone Therapy: Preclinical Development, Clinical Translation, and Prospects for the Treatment of Lysosomal Storage Disorders. Mol Ther 2015, 23, 1138-1148. [CrossRef]
- Parenti, G.; Moracci, M.; Fecarotta, S.; Andria, G. Pharmacological chaperone therapy for lysosomal storage diseases. Future Med Chem 2014, 6, 1031-1045. [CrossRef]
- Parenti, G.; Pignata, C.; Vajro, P.; Salerno, M. New strategies for the treatment of lysosomal storage diseases (review). Int J Mol Med 2013, 31, 11-20. [CrossRef]
- Banning, A.; Gulec, C.; Rouvinen, J.; Gray, S.J.; Tikkanen, R. Identification of Small Molecule Compounds for Pharmacological Chaperone Therapy of Aspartylglucosaminuria. Sci Rep 2016, 6, 37583. [CrossRef]
- Zhang, R.; Chen, L.; Jiralerspong, S.; Snowden, A.; Steinberg, S.; Braverman, N. Recovery of PEX1-Gly843Asp peroxisome dysfunction by small-molecule compounds. Proc Natl Acad Sci U S A 2010, 107, 5569-5574. [CrossRef]
- Craig, S.A. Betaine in human nutrition. Am J Clin Nutr 2004, 80, 539-549. [CrossRef]
- Pfanner, N.; Warscheid, B.; Wiedemann, N. Mitochondrial proteins: From biogenesis to functional networks. Nat Rev Mol Cell Biol 2019, 20, 267-284. [CrossRef]
- Kirkegaard, T.; Gray, J.; Priestman, D.A.; Wallom, K.-L.; Atkins, J.; Olsen, O.D.; Klein, A.; Drndarski, S.; Petersen, N.H.T.; Ingemann, L.; Smith, D.A.; Morris, L.; Bornæs, C.; Jørgensen, S.H.; Williams, I.; Hinsby, A.; Arenz, C.; Begley, D.; Jäättelä, M.; Platt, F.M. Heat shock protein-based therapy as a potential candidate for treating the sphingolipidoses. Science translational medicine 2016, 8, 355ra118. [CrossRef]
- Mengel, E.; Patterson, M.C.; Da Riol, R.M.; Del Toro, M.; Deodato, F.; Gautschi, M.; Grunewald, S.; Grønborg, S.; Harmatz, P.; Héron, B.; Maier, E.M.; Roubertie, A.; Santra, S.; Tylki-Szymanska, A.; Day, S.; Andreasen, A.K.; Geist, M.A.; Havnsøe Torp Petersen, N.; Ingemann, L.; Hansen, T.; Blaettler, T.; Kirkegaard, T.; Í Dali, C. Efficacy and safety of arimoclomol in Niemann-Pick disease type C: Results from a double-blind, randomised, placebo-controlled, multinational phase 2/3 trial of a novel treatment. Journal of inherited metabolic disease 2021, 44, 1463–1480. [CrossRef]
- Mu, T.-W.; Ong, D.S.T.; Wang, Y.-J.; Balch, W.E.; Yates, J.R.; Segatori, L.; Kelly, J.W. Chemical and biological approaches synergize to ameliorate protein-folding diseases. Cell 2008, 134, 769–781. [CrossRef]
- Mussche, S.; Devreese, B.; Nagabhushan Kalburgi, S.; Bachaboina, L.; Fox, J.C.; Shih, H.J.; Van Coster, R.; Samulski, R.J.; Gray, S.J. Restoration of cytoskeleton homeostasis after gigaxonin gene transfer for giant axonal neuropathy. Hum Gene Ther 2013, 24, 209-219. [CrossRef]
- E-Crispr tool. Available online: http://www.e-crisp.org (accessed on 23.04.2021).
- Consurf Server. Available online: https://consurf.tau.ac.il (accessed on 23.07.2023).
Figure 1.
Sequencing results of the SSADH-D patient family revealed four different genetic variants that were all present in a compound heterozygous form. (a) Paternal variant c.278C>T, p.Cys93Phe and (b) maternal variant, c.763A>G, p.Asn255Asp that were found in the patient. (c) In the maternally inherited ALDH5A1 allele, an additional variant, c.538T>C, p.His180Tyr was detected. (d) A variant of unknown significance, c.269T>C, p.Val90Ala, was detected in the mother, but not in the patient.
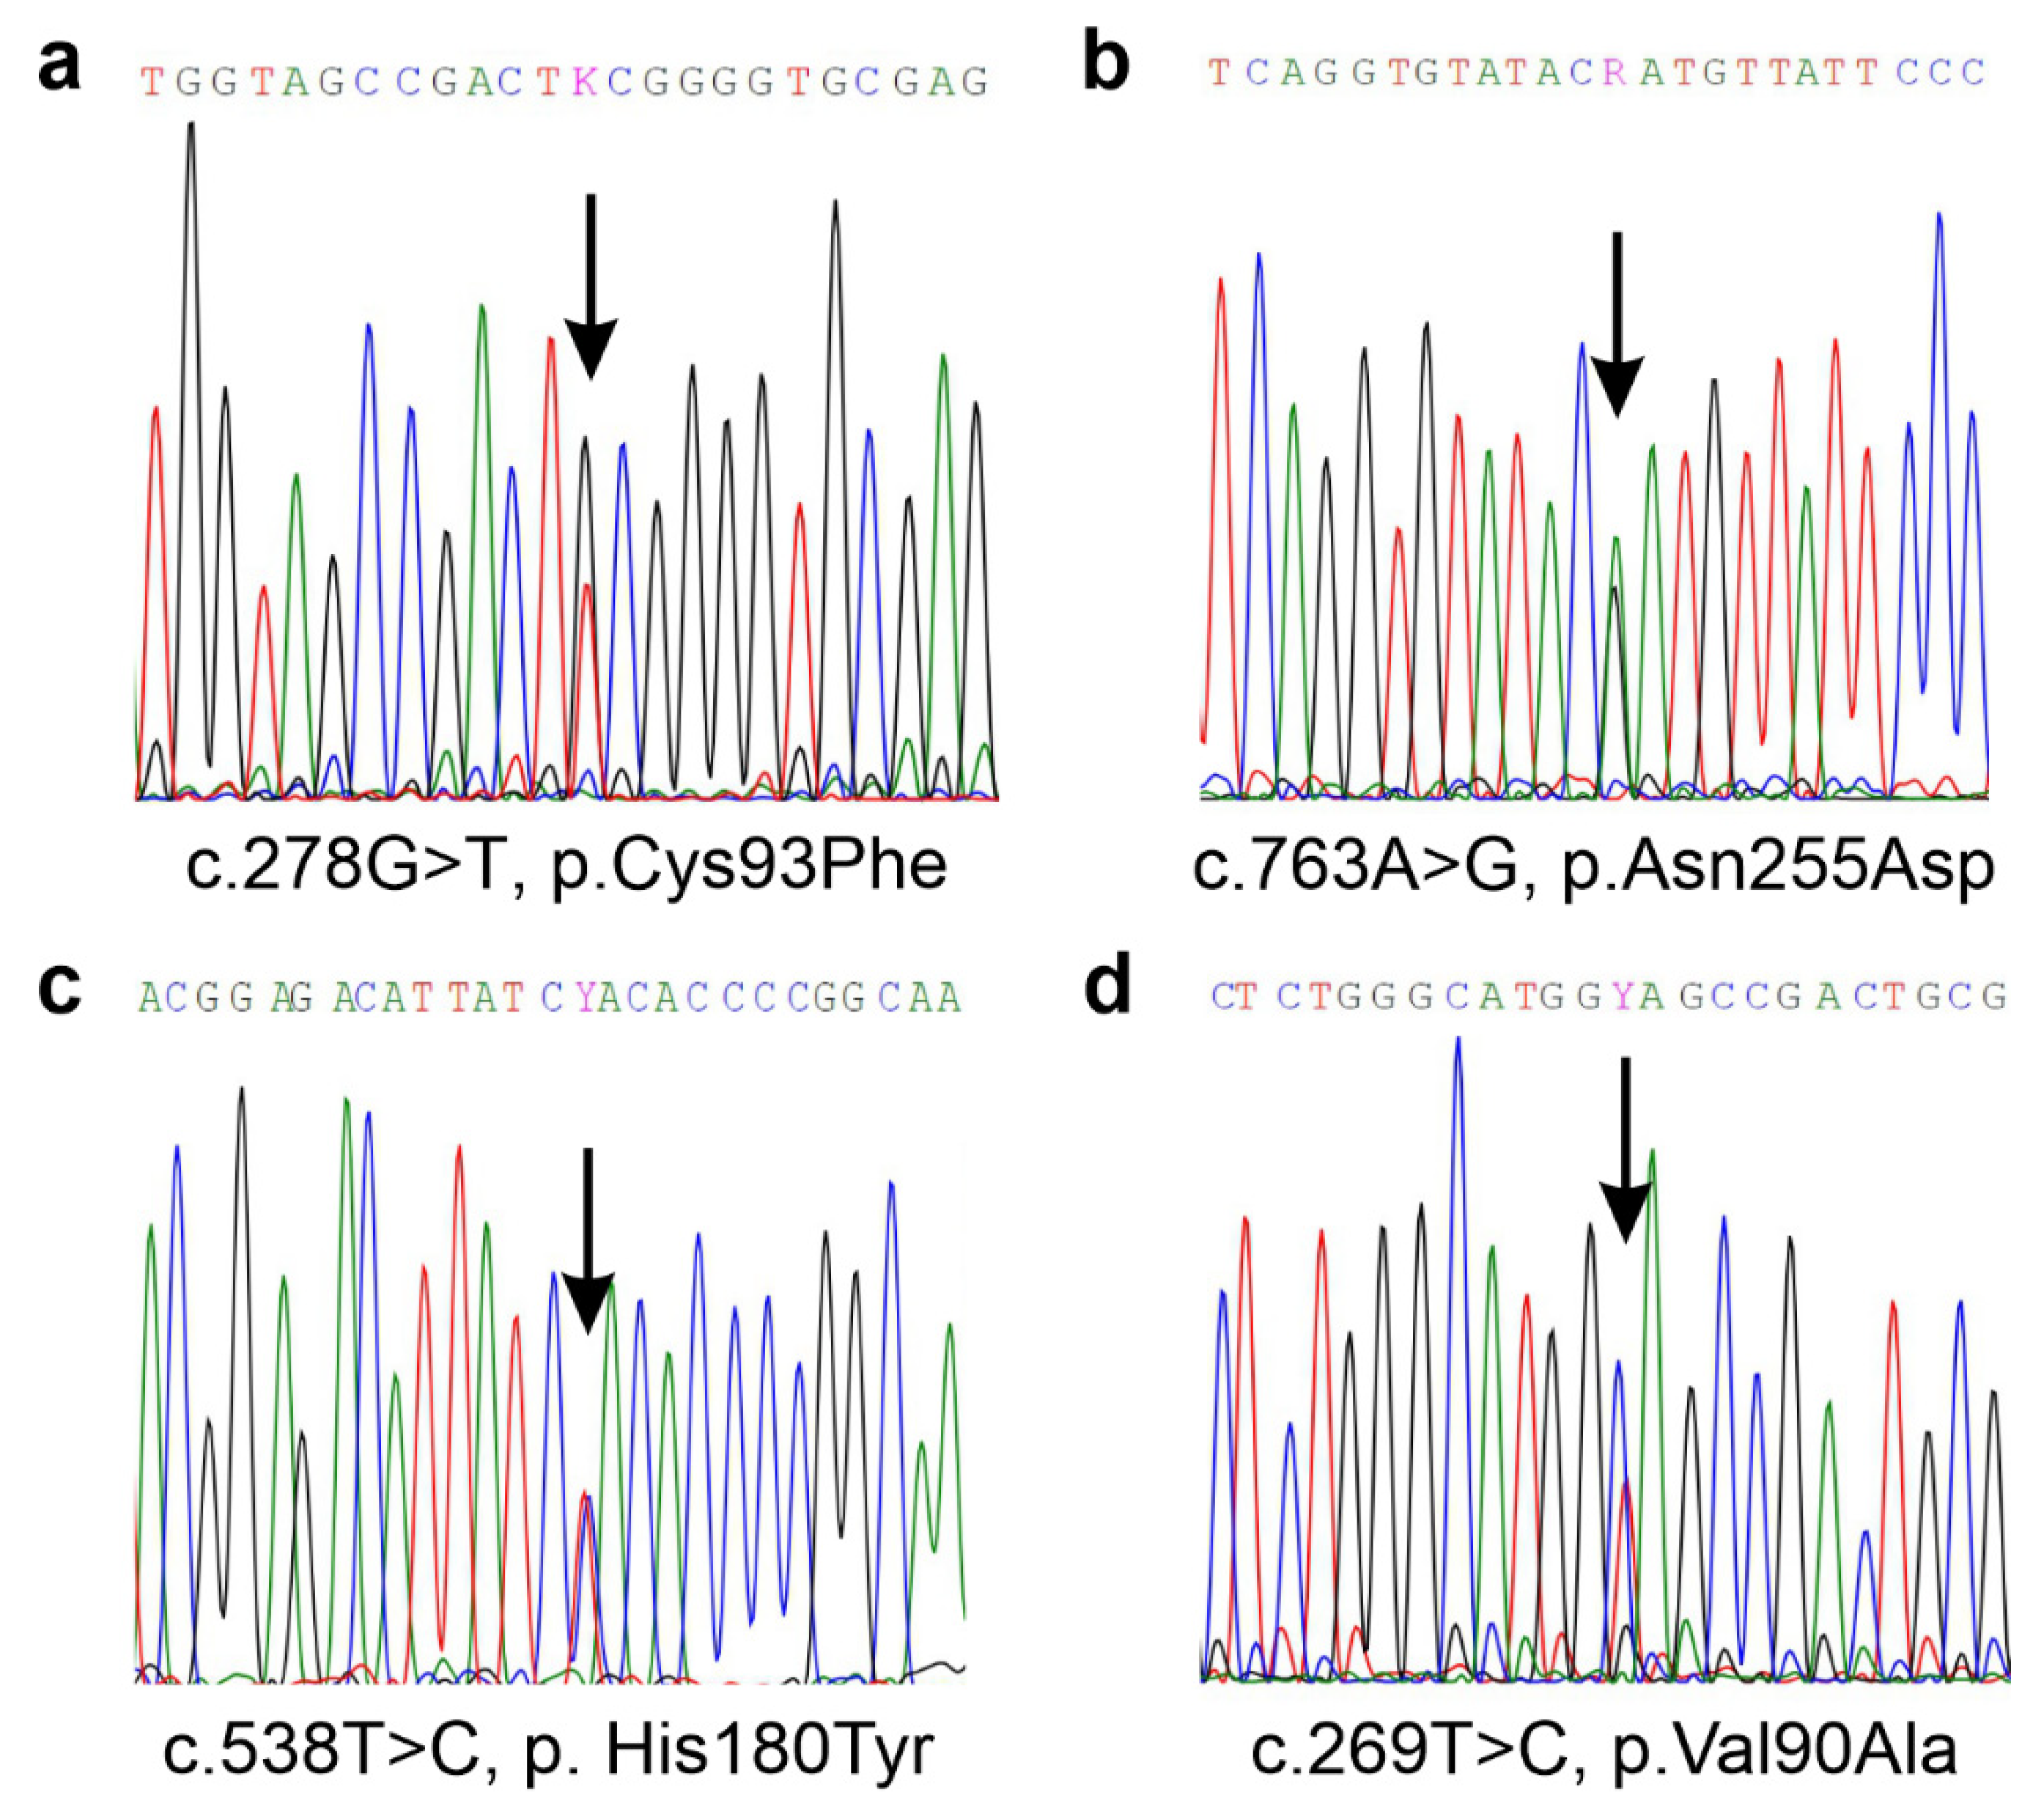
Figure 2.
SSADH protein expression, activity and localization in control and patient fibroblast cultures. (a) SSADH protein expression in control and patient fibroblasts. GAPDH was used as a loading control. Representative Western blots are shown (n = 3). (b) Relative SSADH enzyme activity was assessed by a fluorometric assay. Control fibroblast activity was set to 100%. Data are expressed as mean values ± SD (n = 3). *** p ≤ 0.001 (Student’s t-test). (c) Fluorescent images of control and patient fibroblasts stained with an anti-SSADH antibody (green) and MitoTracker (red) for visualization of mitochondria. Scale bar 20 μm.
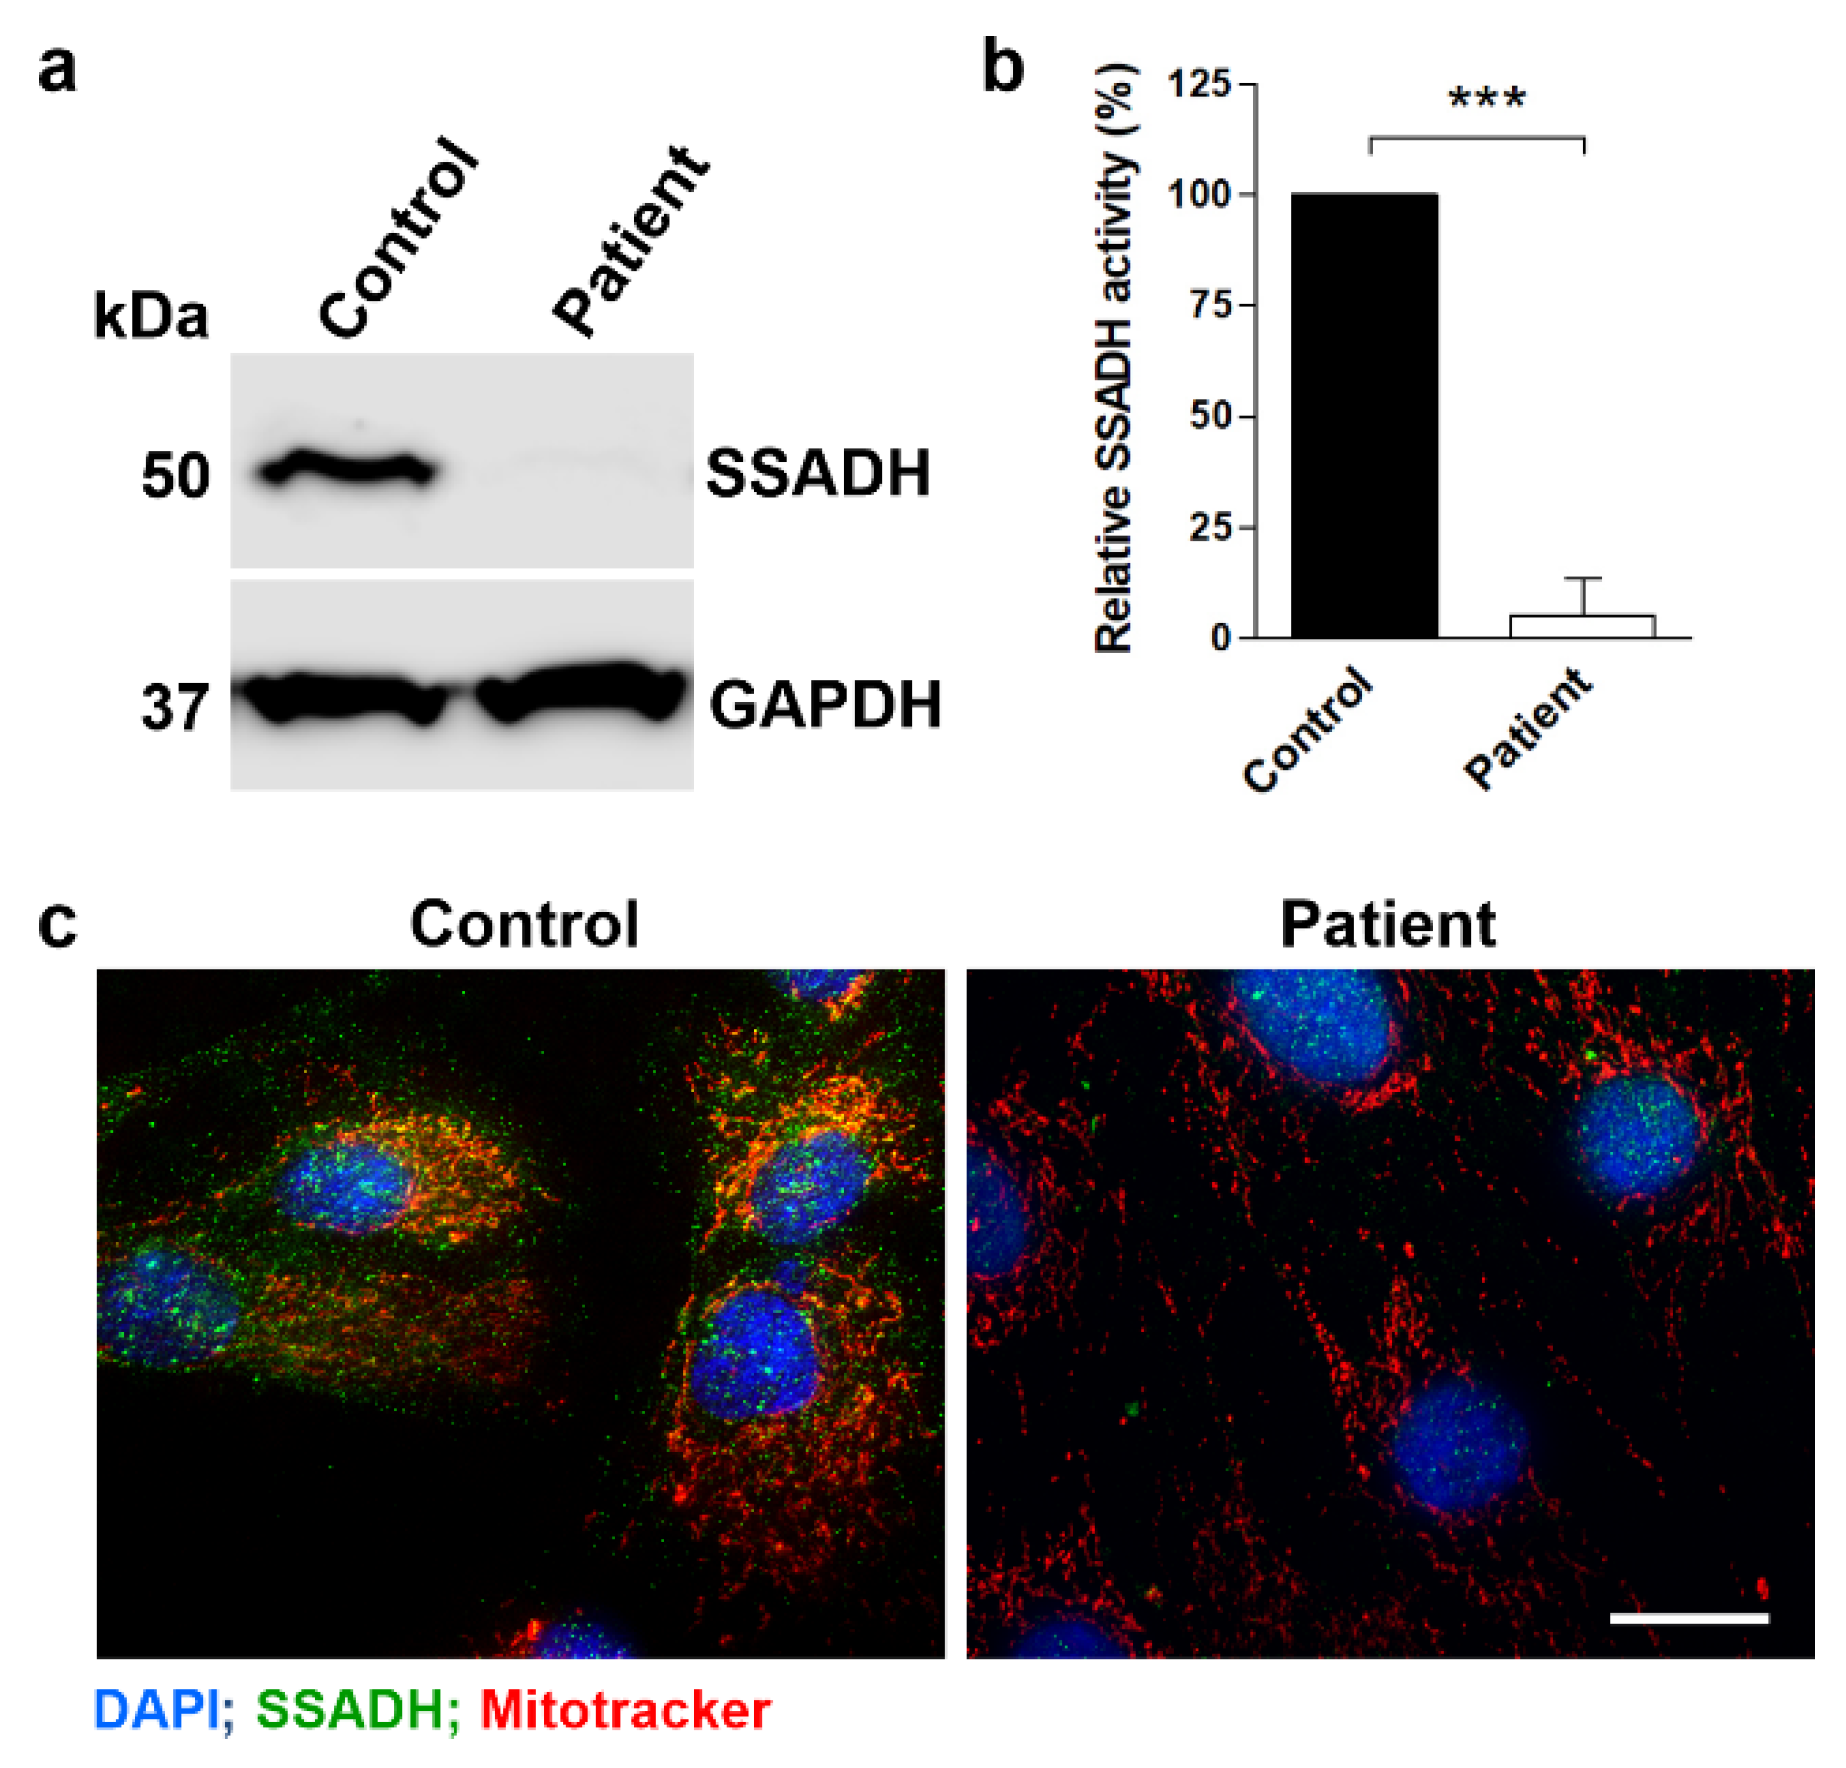
Figure 3.
In vitro characterization of SSADH deficiency patient variants in a transient overexpression system. HEK-293T ALDH5A1 knockout (SSADH-KO) cells were transiently transfected with pcDNA 3 vector carrying either WT or Val90Ala, Cys93Phe, His180Tyr, Asn255Asp or His180Tyr/Asn255Asp SSADH variant. After 48 h, cell lysates were prepared and (a) subjected to Western blotting. GAPDH was used as a loading control. Representative Western blots are shown (n = 3). (b) SSADH activity of SSADH-KO HEK-293T cells overexpressing WT SSADH was set to 100%, the variant activities are expressed as % WT. Data are expressed as mean values ± SD (n = 3). *** p ≤ 0.001, ns. = non-significant (One-way ANOVA followed by Tukey’s post-hoc test).
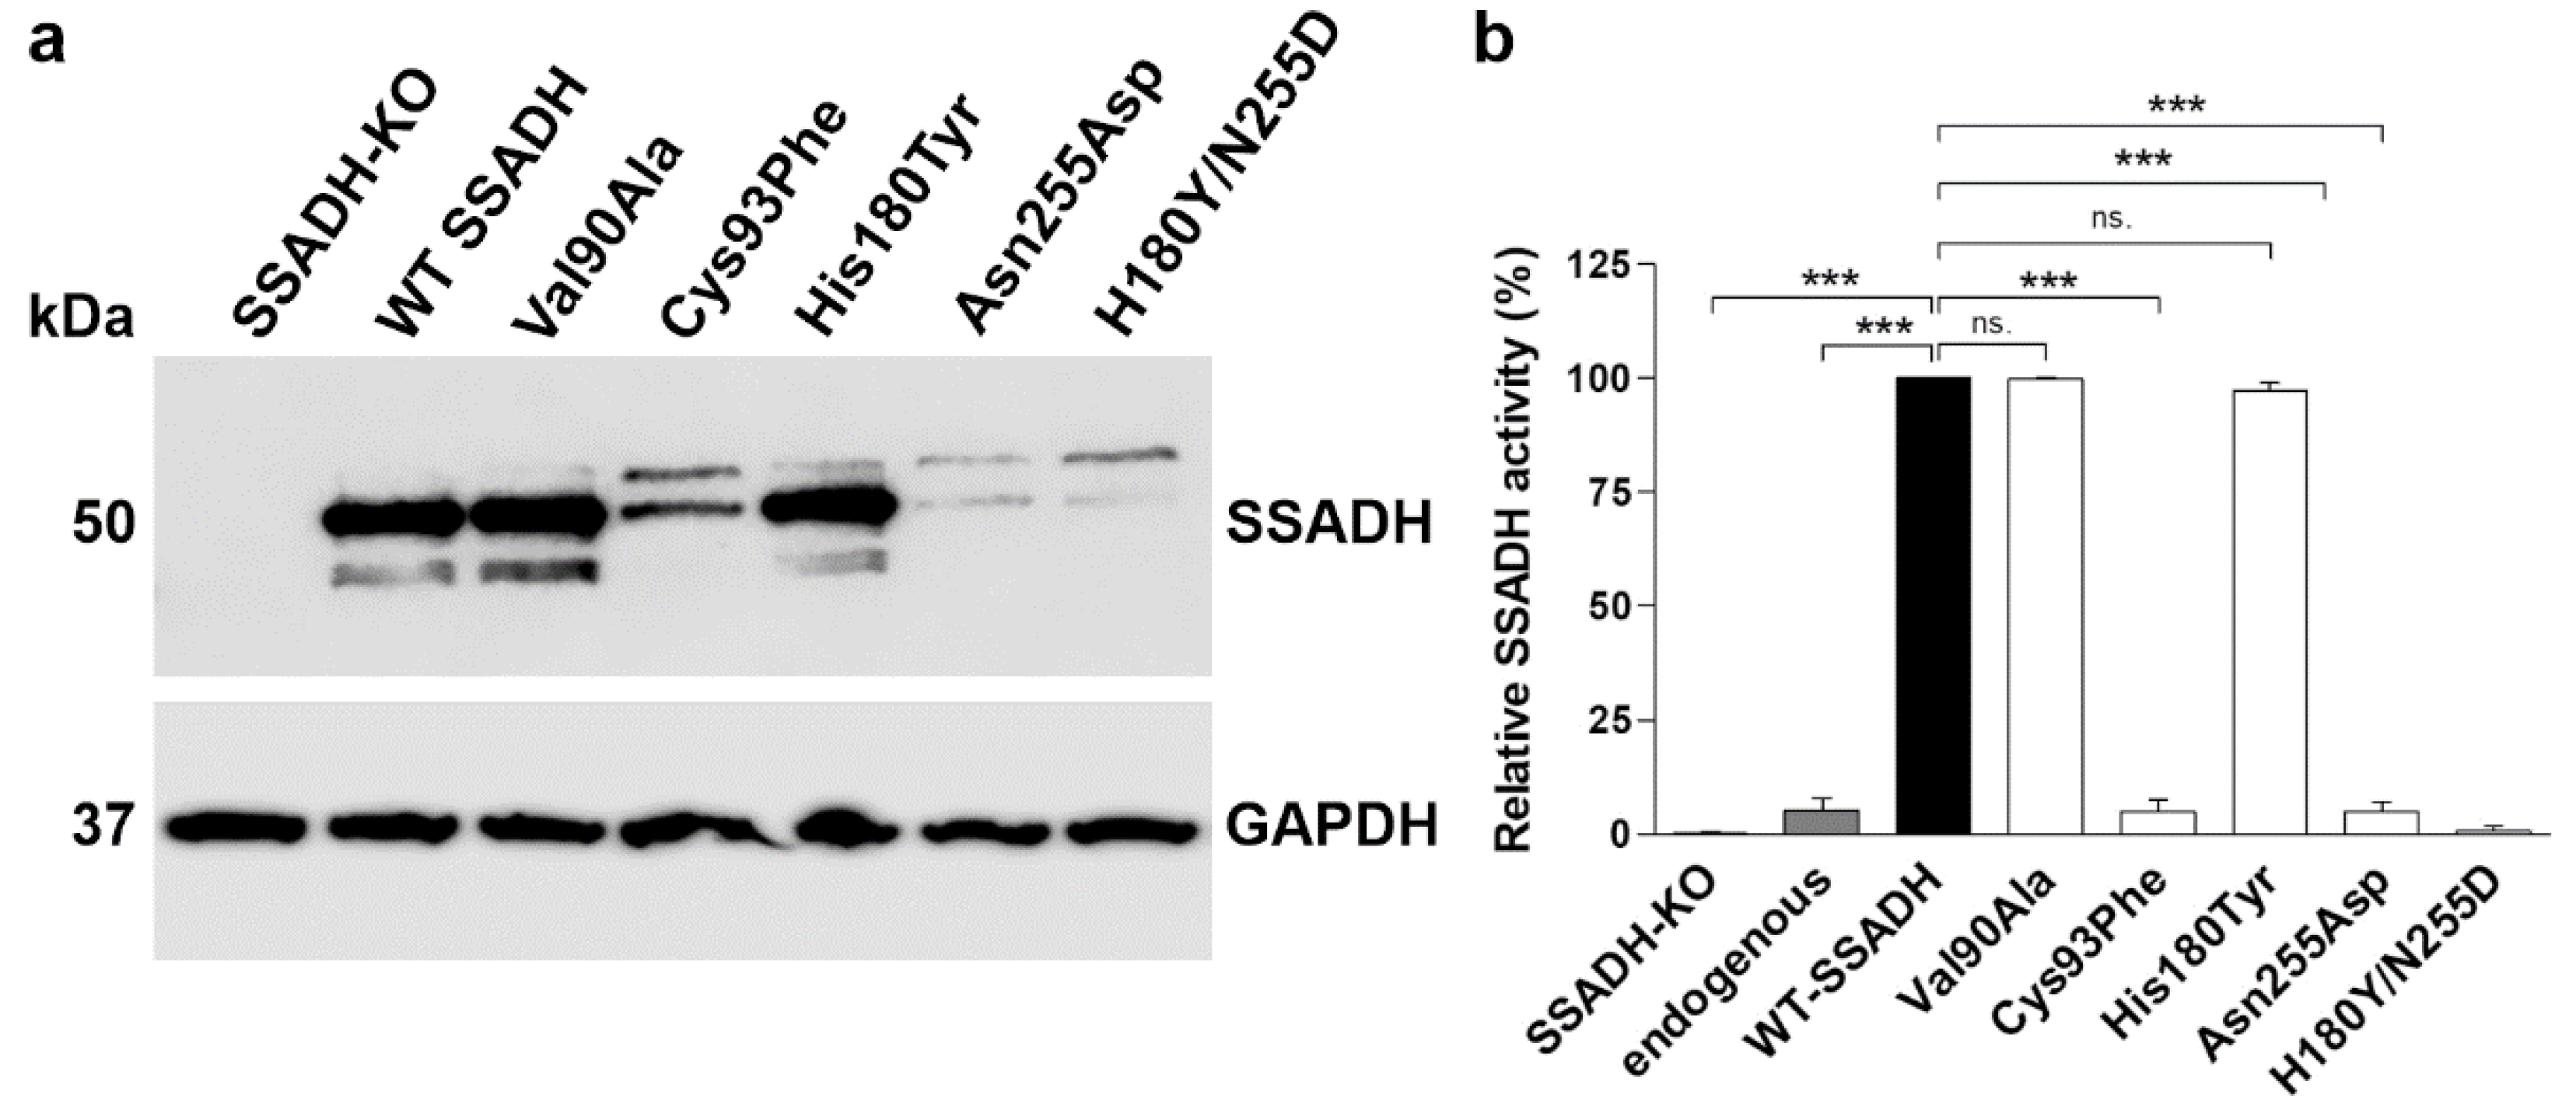
Figure 4.
In vitro characterization of the SSADH-D patient variants in a knock-in system. (a) SSADH protein expression and (b) relative SSADH enzyme activity in SSADH-deficient Flp-InTM-293 cells (SSADH-KO), Flp-InTM-293 (with endogenous SSADH) and in SSADH-KO Flp-InTM-293 cells with a genomic integration of either the WT SSADH or one of the SSADH variants (Asn255Asp, Cys93Phe, His180Tyr or Asn255Asp/His180Tyr). (a) Expression of SSADH variants. GAPDH was used as a loading control. Representative Western blots are shown (n = 3). (b) SSADH enzyme activity of SSADH-KO Flp-InTM-293 cells stably expressing WT SSADH was set to 100%, and the variant activities are expressed as % WT. Data are expressed as mean values ± SD (n = 3). *** p ≤ 0.001, ns. = non-significant (One-way ANOVA followed by Tukey’s post-hoc test).
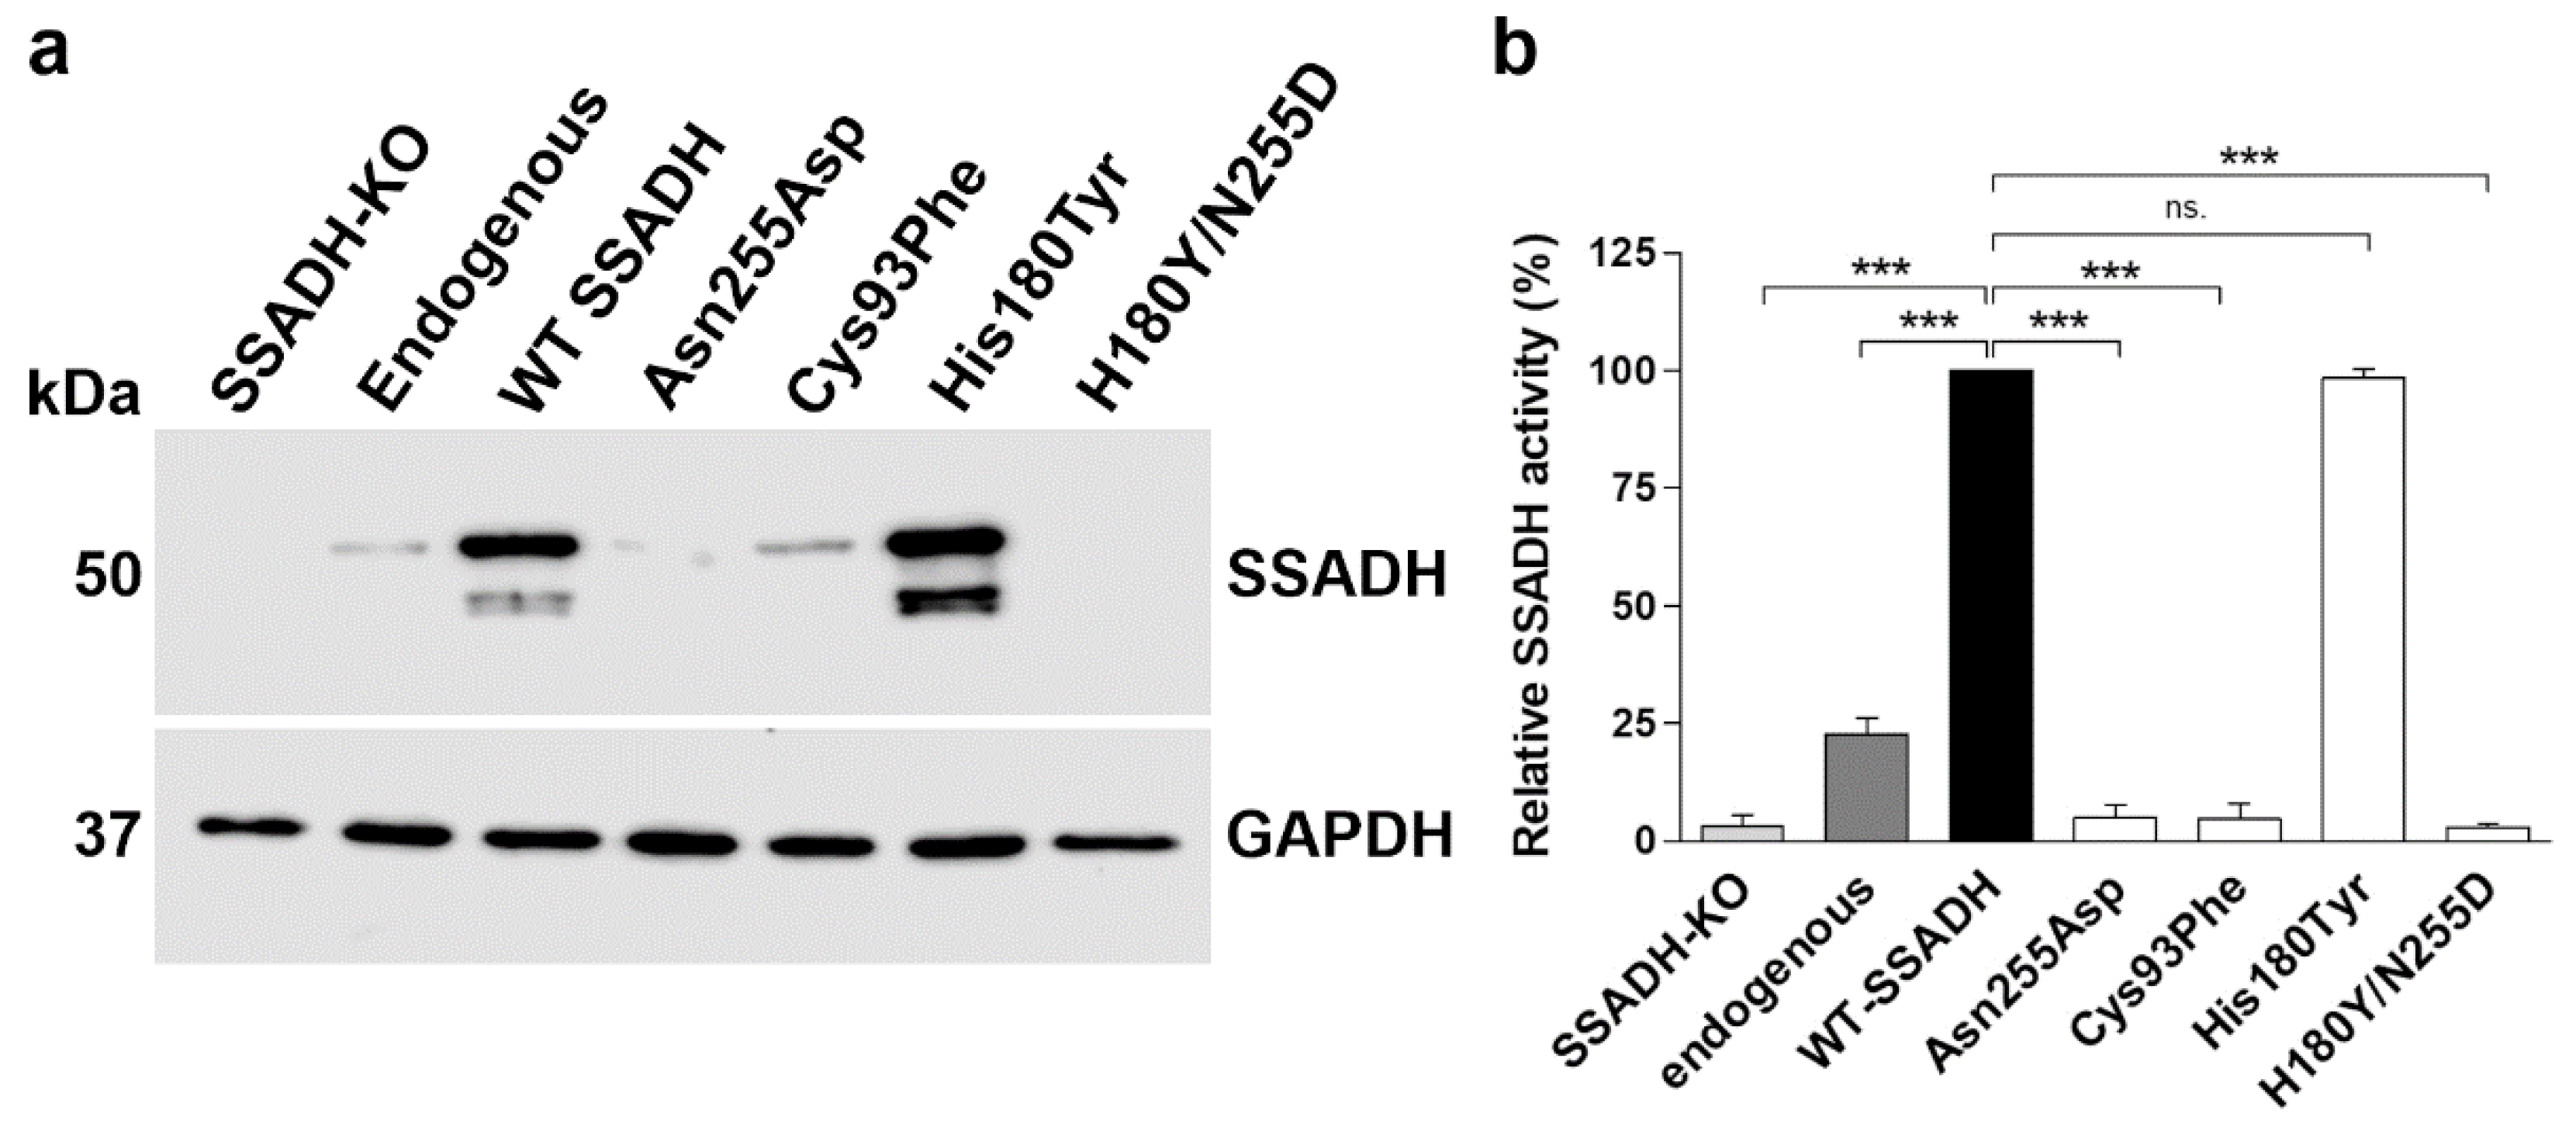
Figure 5.
Oligomeric and monomeric structures of human SSADH and the variants. Human SSADH crystal structure (PDB 2W8N) has been superimposed with a structure obtained by in silico mutagenesis of the selected residues by the software PyMOL (Schrödinger, LLC.). The four insets represent the microenvironment and interaction network changes induced by the substituted amino acids (i.e. V90A, C93F, N255D, and H180Y, from top to bottom) as compared to the WT. The variant residues (in blue) are superimposed to the corresponding WT residue (in dark orange). The dashed lines represent the new and lost contacts formed by the residues, respectively, in red (variant) and white (WT). Red dots represent water molecules.The image was built by MOL* [22].
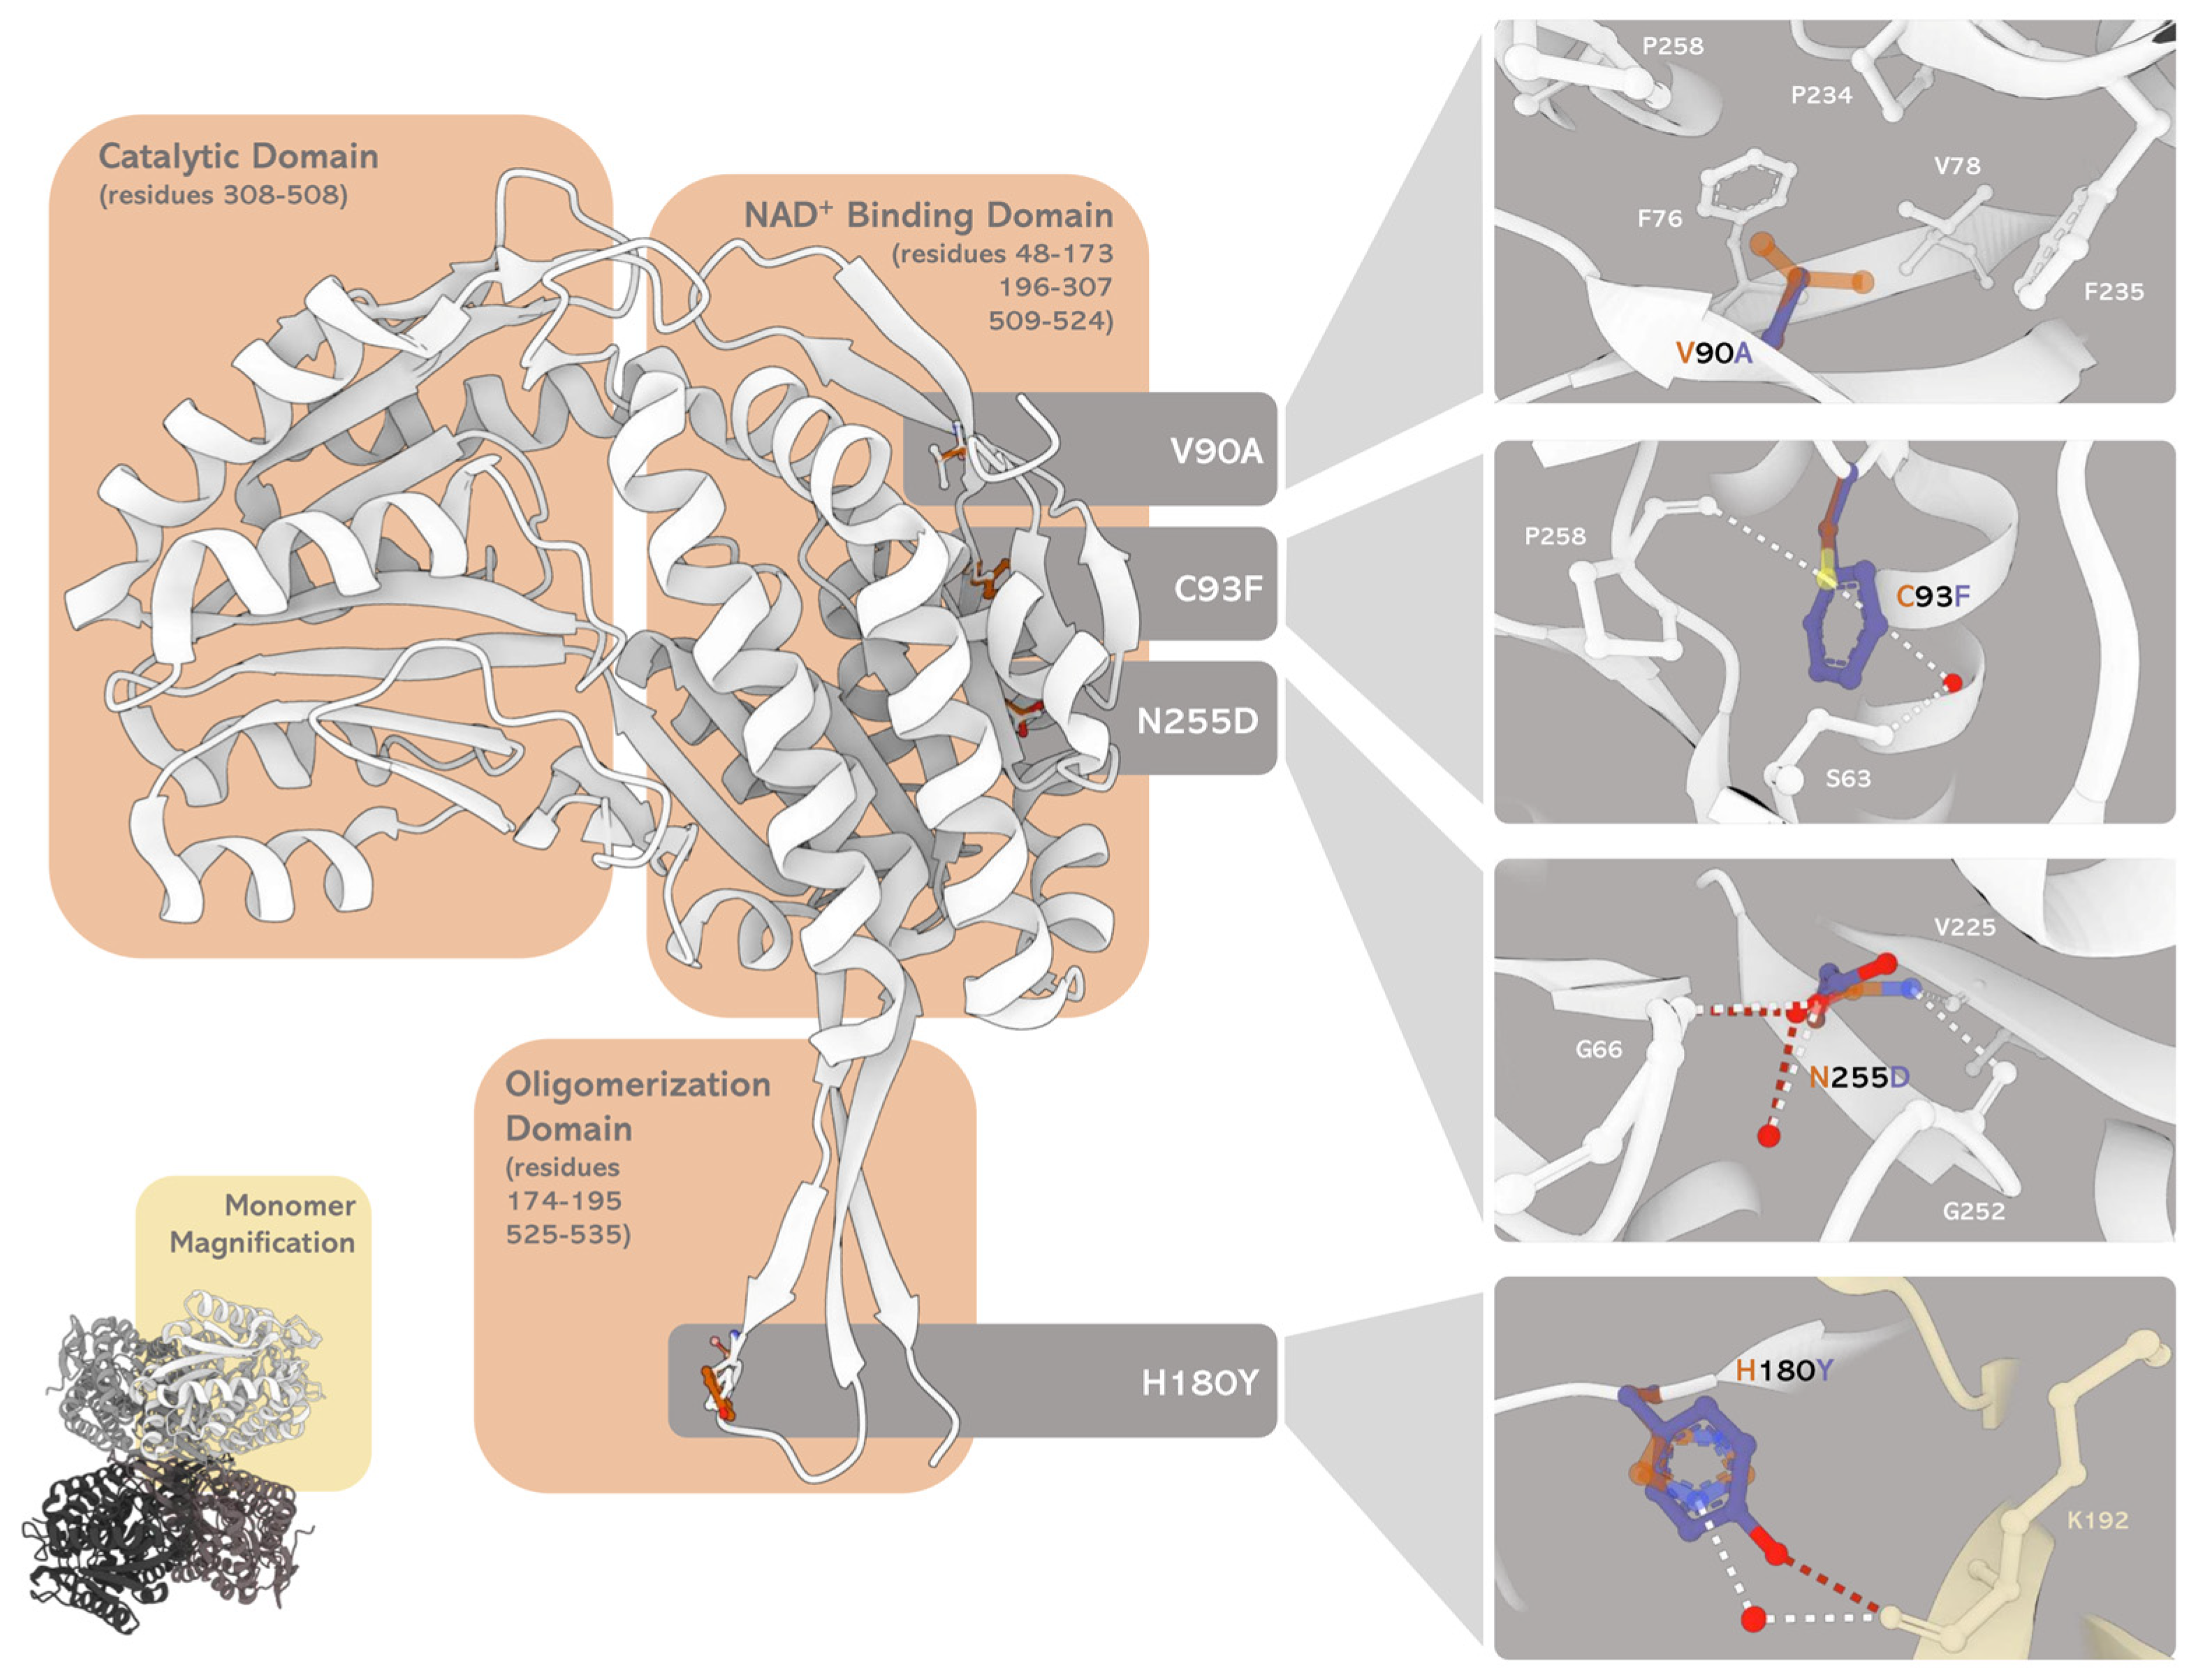
Figure 6.
Spectroscopic signals and apparent equilibrium dissociation constants for NAD+, and time course of reactions of WT (blue line), H180Y (red) and H180Y/N255D (green) SSADH variants. (a) Far-UV and (b) near-UV/visible circular dichroism (CD) spectra of the WT SSADH and the variants. Enzyme concentration was 0.1 mg/ml for far-UV and 1 mg/ml for near-UV/visible CD in 100 mM potassium phosphate buffer pH 8. Spectra of unliganded (straight line) and NAD+-bound (dashed line) enzyme species are reported (c) Emission fluorescence intensity of WT and the variant SSADH species at 0.1 mg/ml, following excitation at 280 nm in 100 mM potassium phosphate buffer pH 8. (d) Data for the calculation of the apparent equilibrium dissociation constant (KD) for NAD+, calculated as reported in chapter 4.15. (e) Loss of residual activity over time of the dehydrogenase reaction catalyzed by the WT and the variant SSADH species. The activity of each species at the beginning (timepoint 0) was set to 100% and the decline was monitored over time.
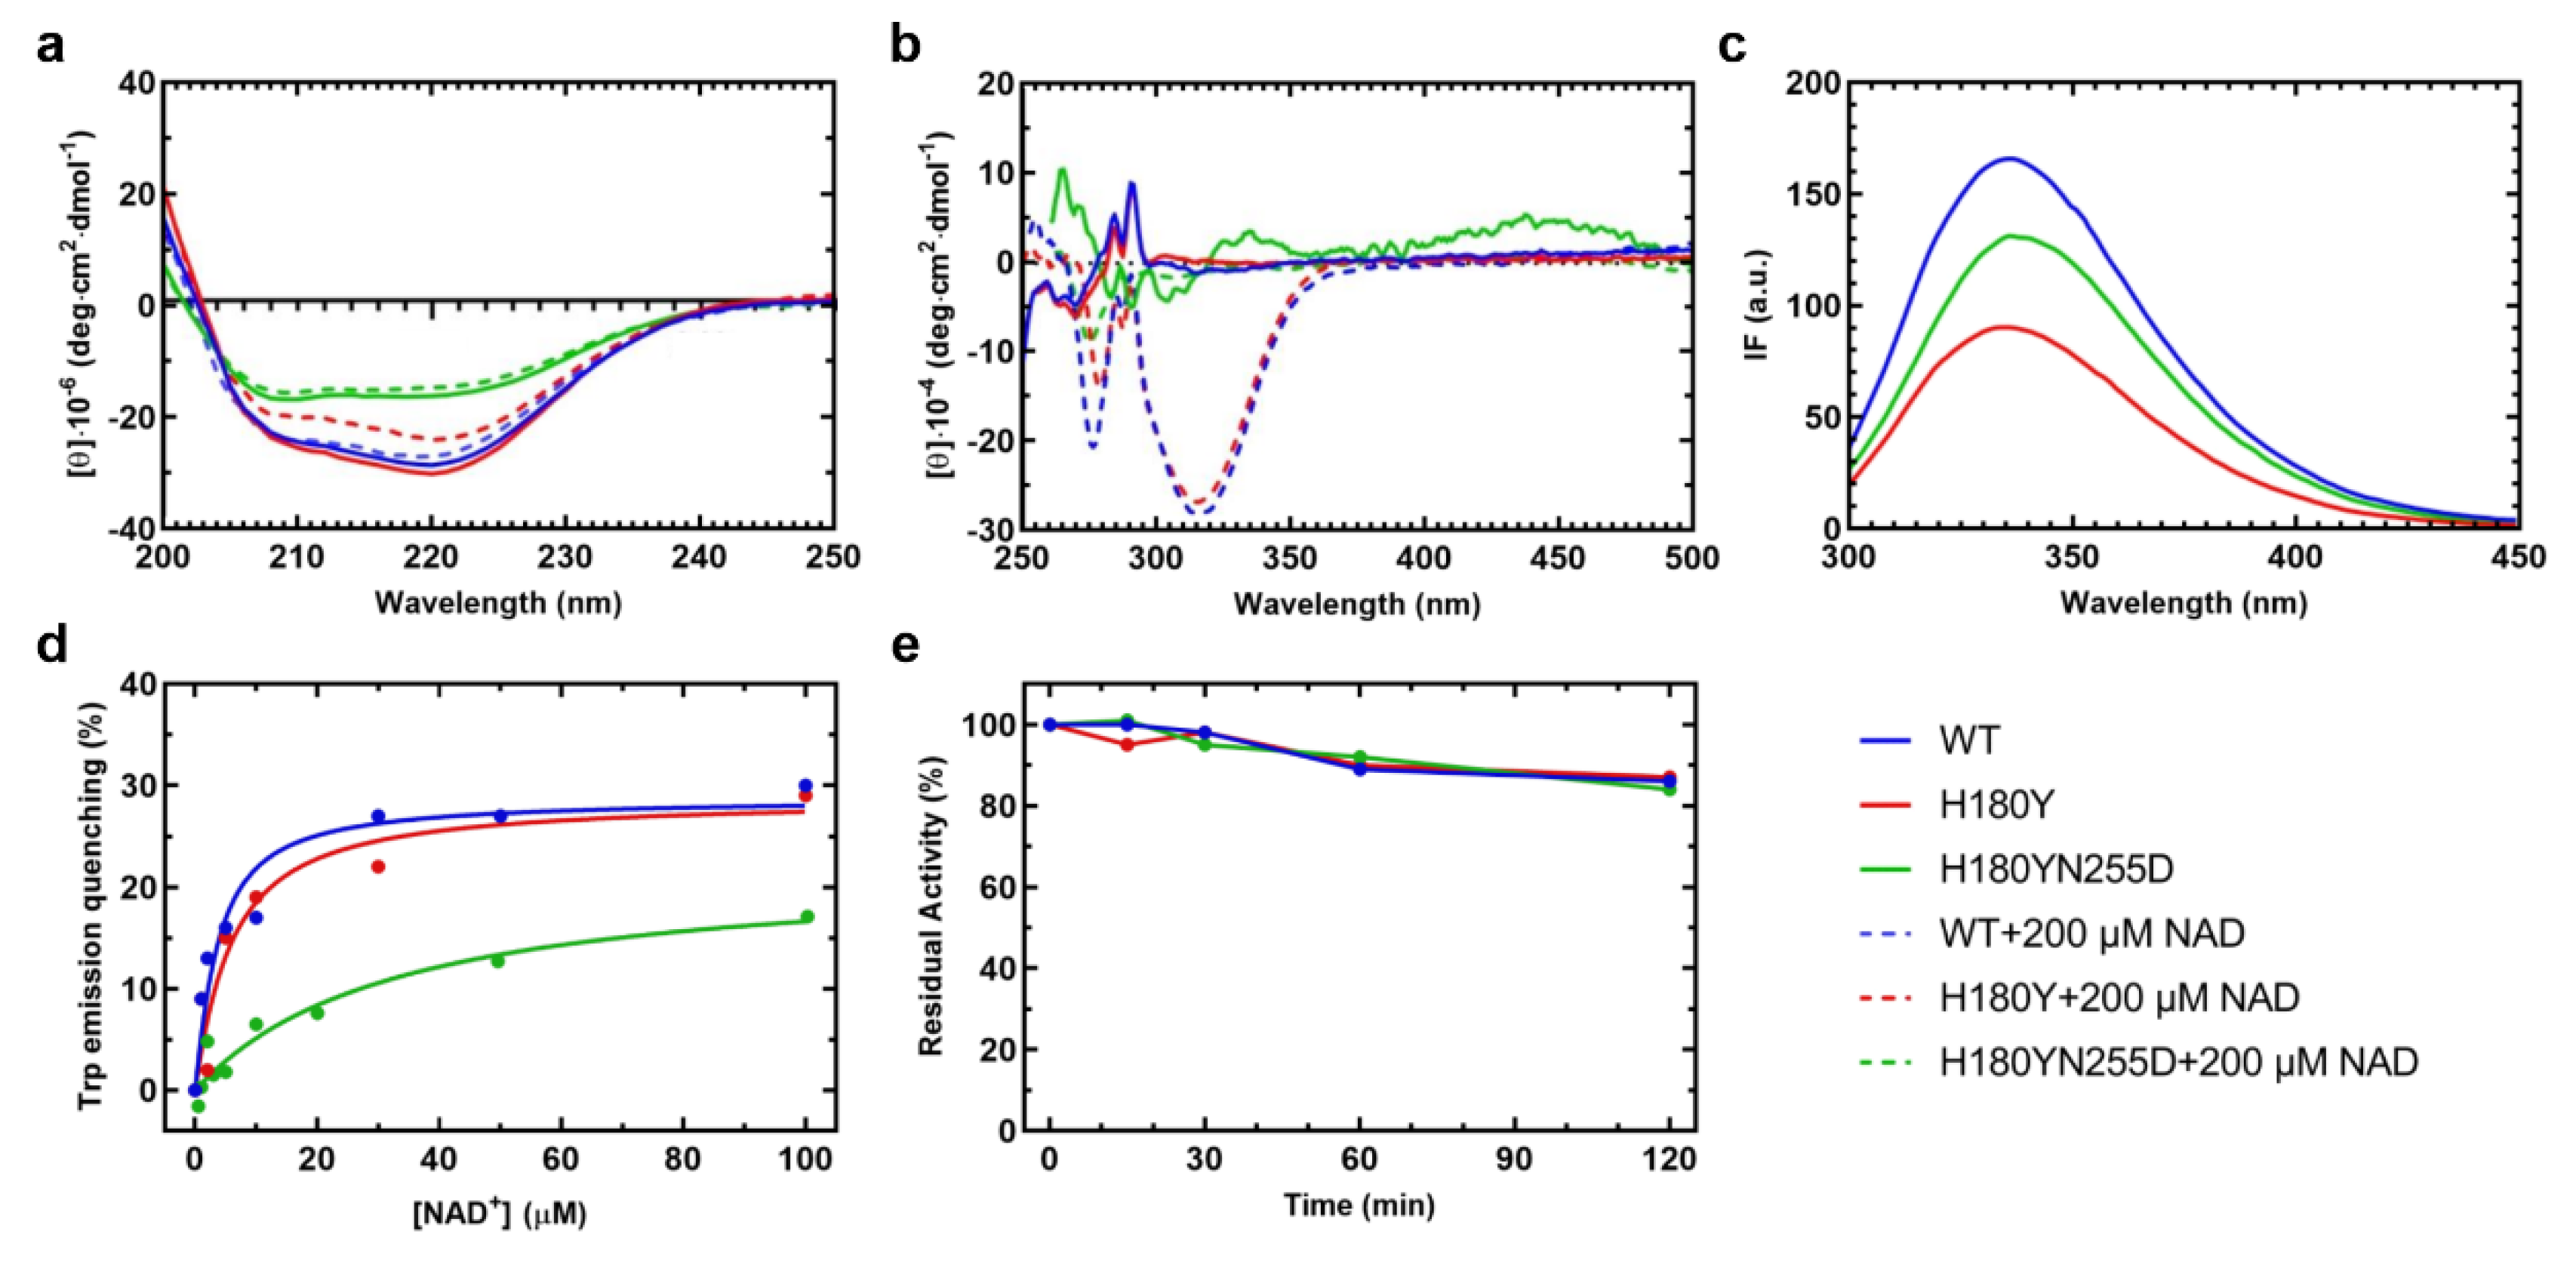
Figure 7.
Treatment of knock-in cells stably expressing the SSADH patient variants. (a-d) SSADH-deficient Flp-InTM-293 cells (KO) stably expressing one of the SSADH variants (Cys93Phe, His180Tyr, Asn255Asp or Asn255Asp/His180Tyr) were treated with 50 µM arimoclomol (A), 10 mM betaine (B), or 250 nM celastrol (C). After 24 h, cell lysates were prepared and subjected to Western blotting (left panels) and SSADH enzyme activity assay (right panels). GAPDH was used as a loading control for Western blots. Representative Western blots are shown (n = 3). SSADH activity of SSADH-KO Flp-InTM-293 cells stably expressing WT SSADH was set to 100%, and the variant activities are expressed as % WT. Data are expressed as mean values ± SD (n = 3). *** p ≤ 0.001 n.s. = non-significant (One-way ANOVA followed by Tukey’s post-hoc test).
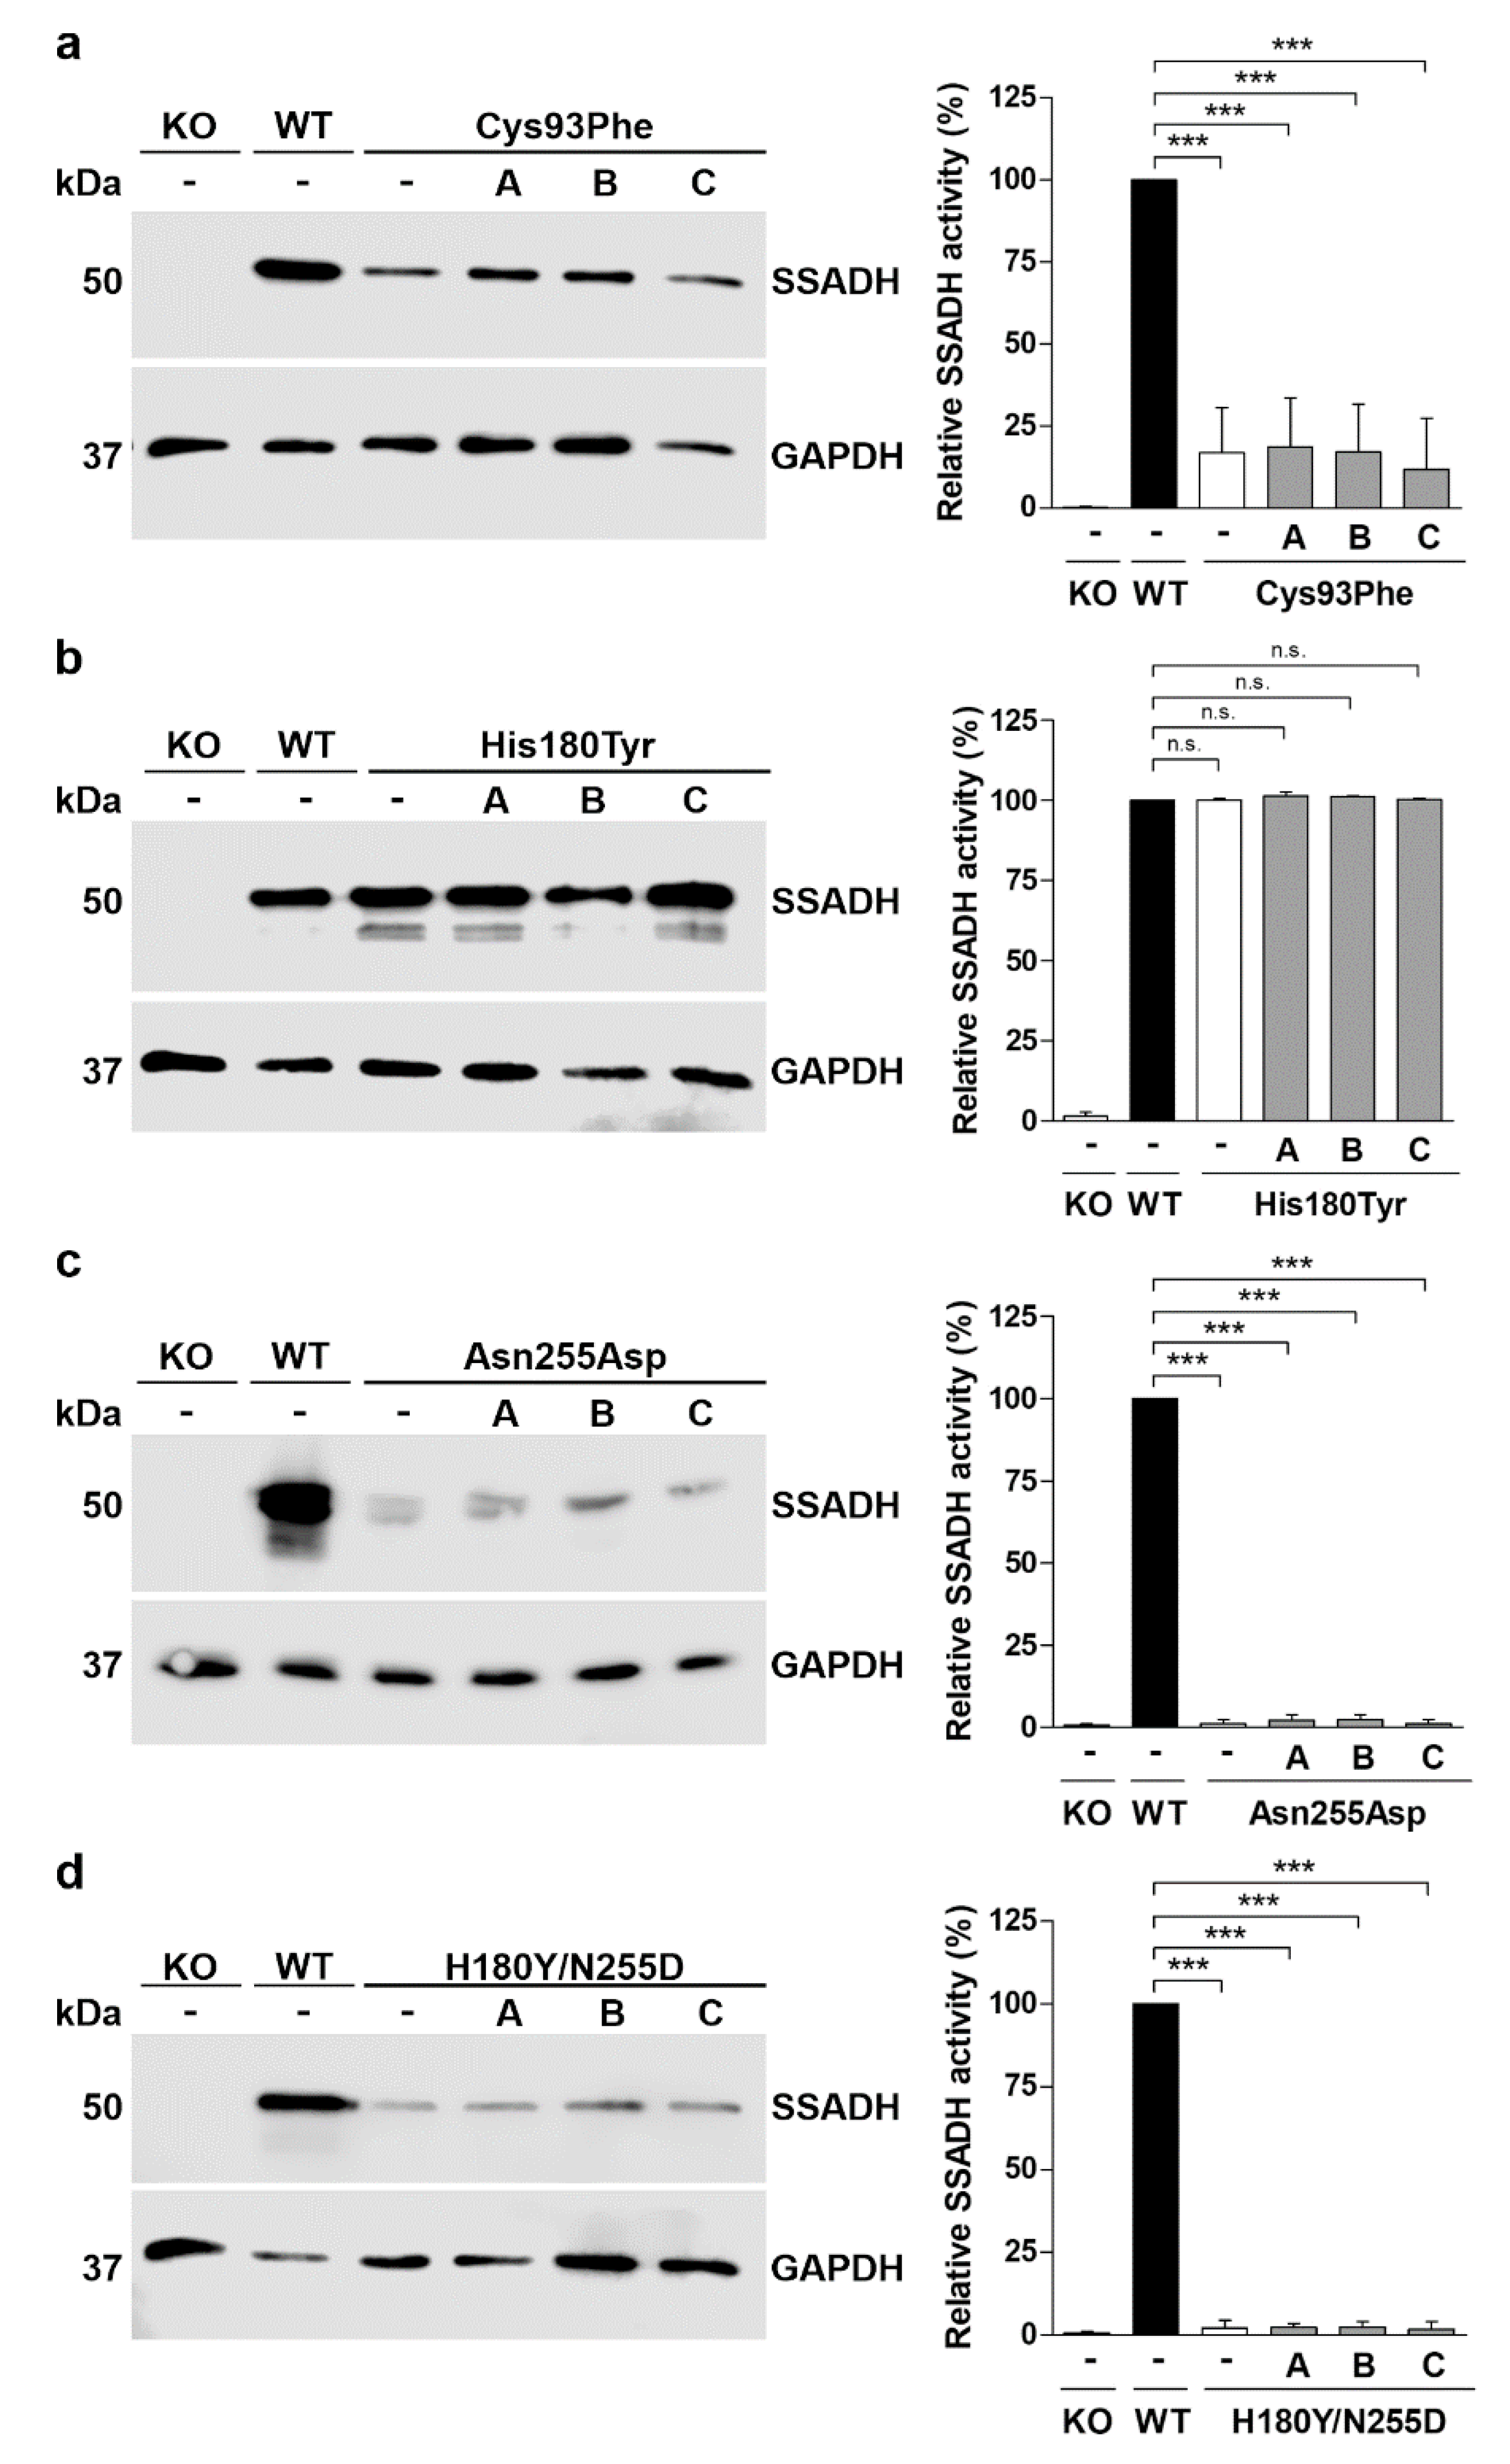
Figure 8.
Treatment of SSADH deficiency patient fibroblasts. Patient fibroblasts were treated either with 50 µM arimoclomol (A), 10 mM betaine (B), or 250 nM celastrol (C), and compared to untreated control fibroblasts (Co). After 24 h or 48 h, cell lysates were prepared and subjected to (a) Western blotting and (b) SSADH enzyme activity assay. GAPDH was used as a loading control in the Western blots. Representative Western blots are shown (n = 3). (b) SSADH activity of untreated control fibroblasts was set to 100%, and the relative SSADH activities in the patient cells were expressed as % WT. Data are expressed as mean values ± SD (n = 3). ** p ≤ 0.01; *** p ≤ 0.001 (One-way ANOVA followed by Tukey’s post-hoc test)..
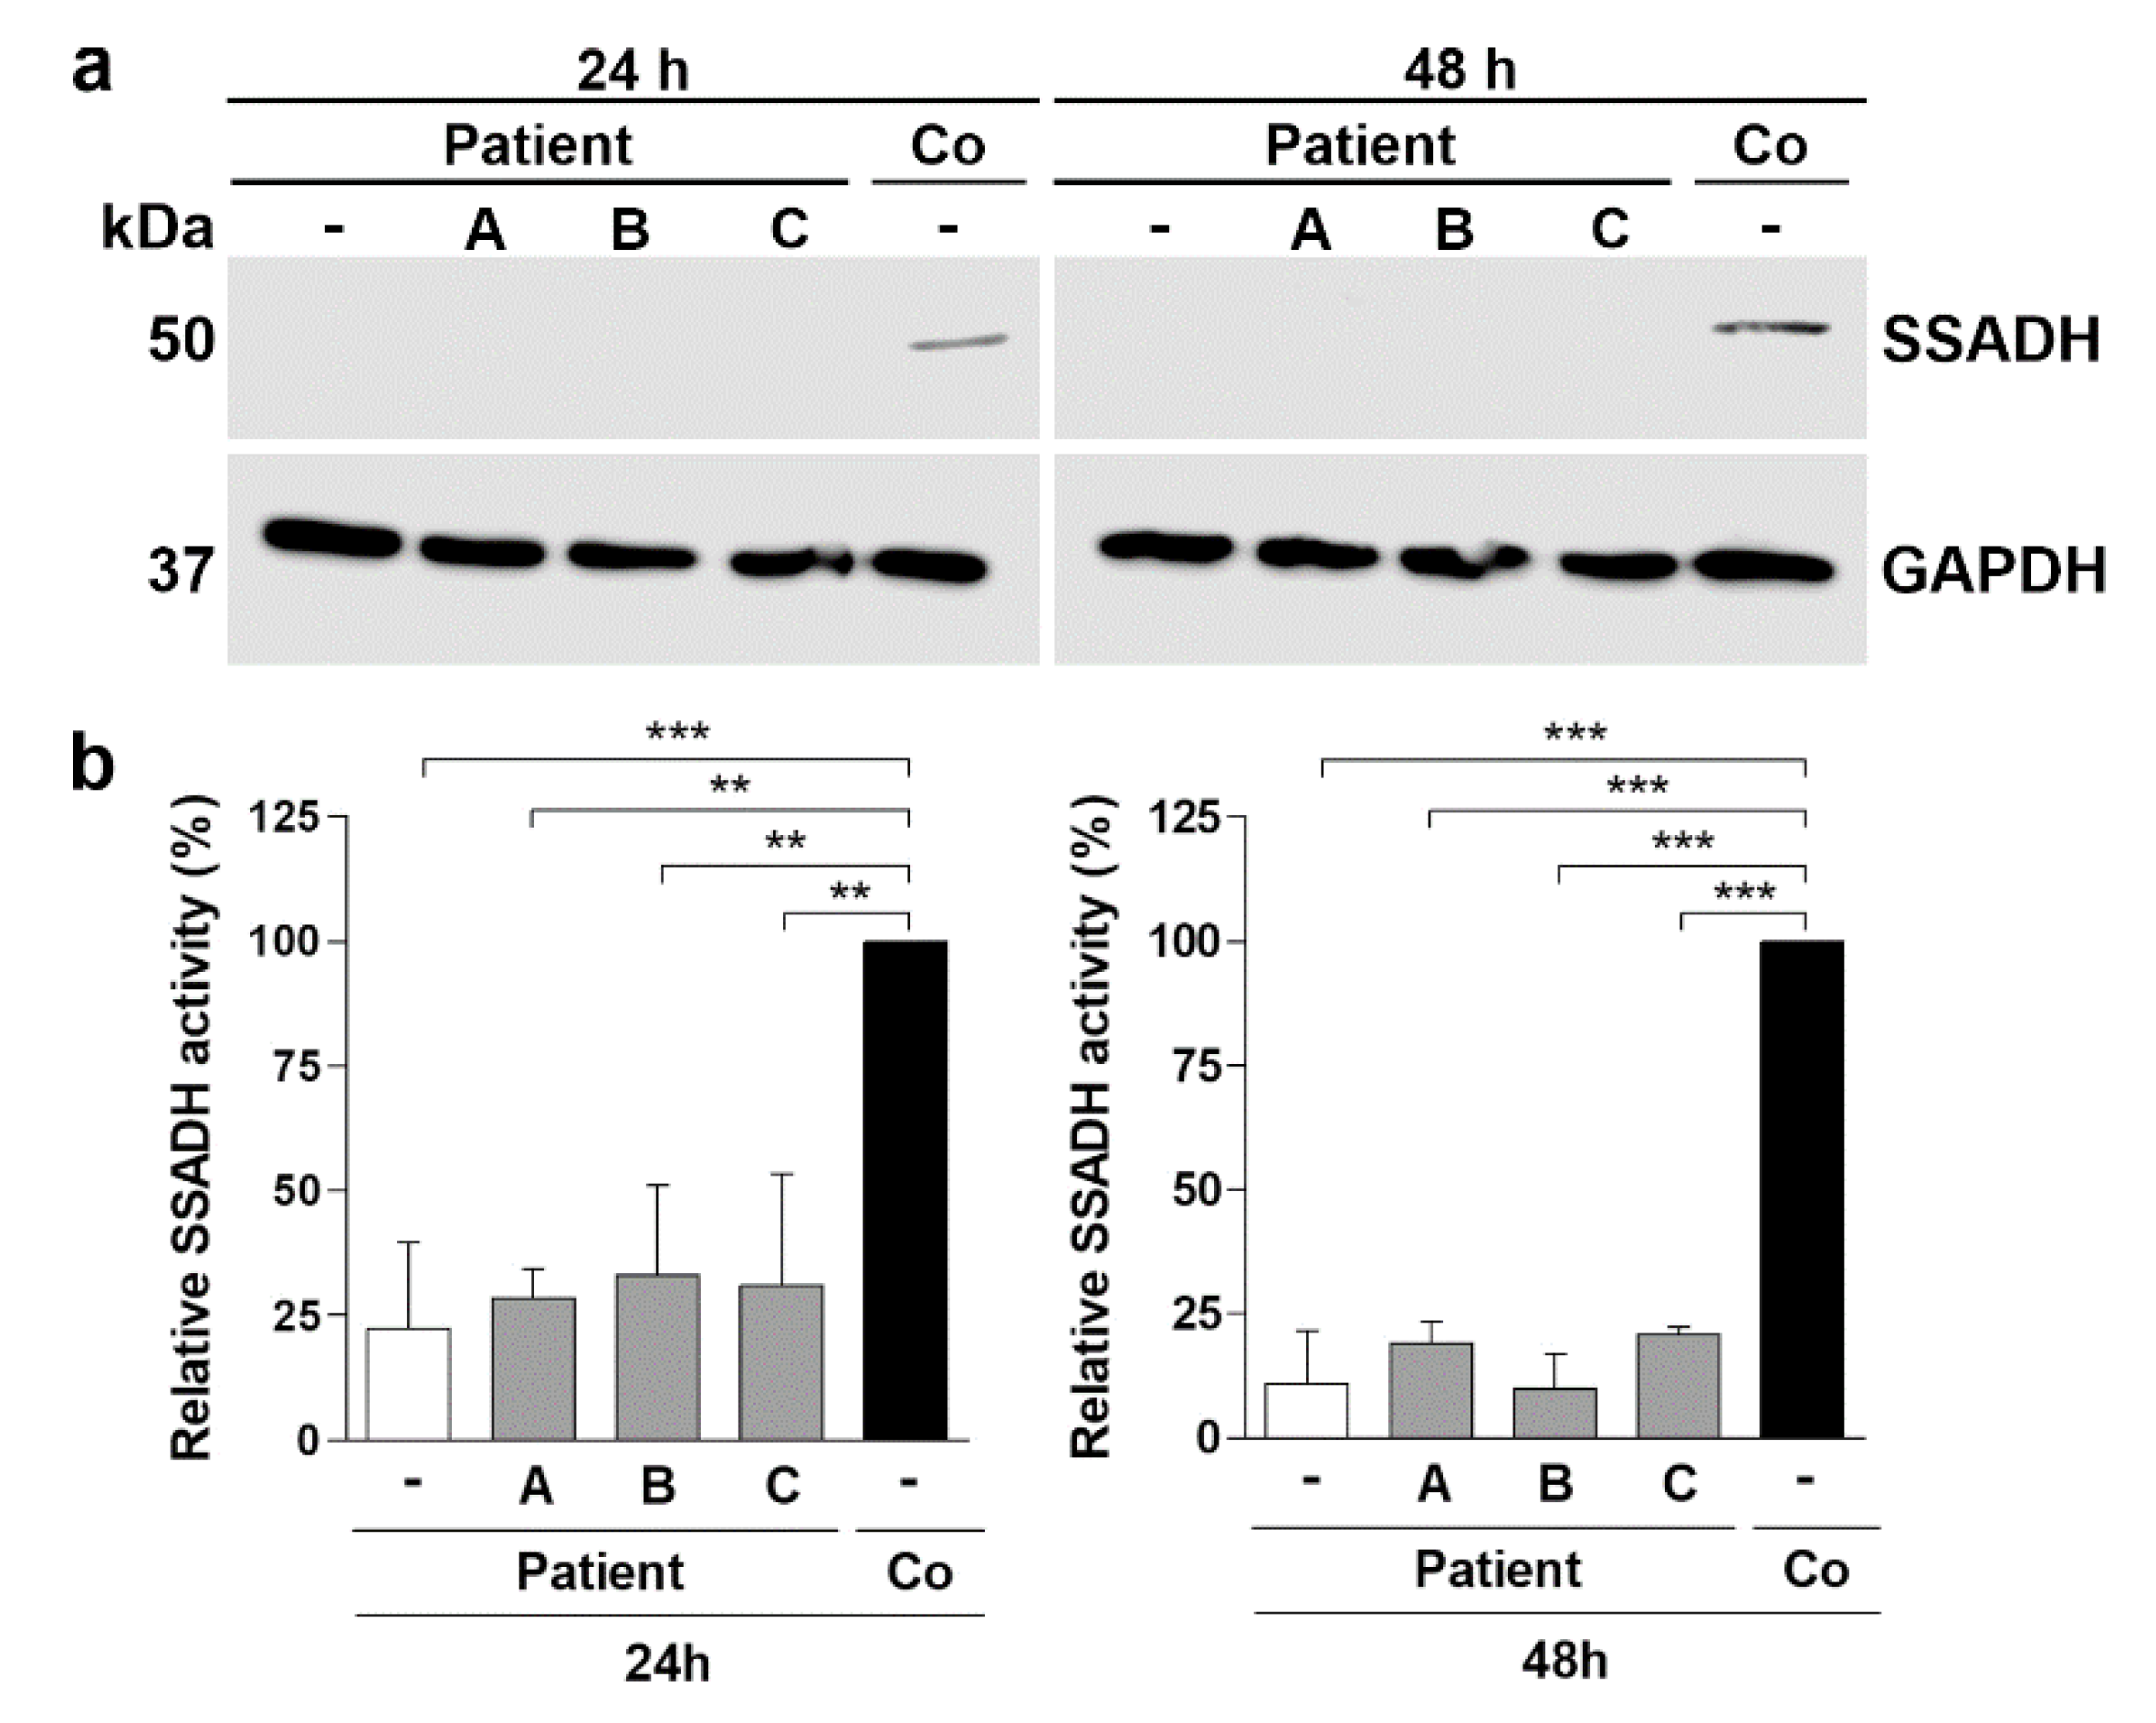

Table 1.
Oligonucleotide sequences used for PCR-based site-directed mutagenesis of eukaryotic expression vectors. All sequences are shown in 5´–3´ direction. F: forward, R: reverse.
Table 1.
Oligonucleotide sequences used for PCR-based site-directed mutagenesis of eukaryotic expression vectors. All sequences are shown in 5´–3´ direction. F: forward, R: reverse.
| Substitution | Sequence |
|---|---|
| Val90Ala | F: CGCTCTGGGCATGGCAGCCGACTGCGGGG R: CCCCGCAGTCGGCTGCCATGCCCAGAGCG |
| Cys93Phe | F: GGGCATGGTAGCCGACTTCGGGGTGCG R: CGCACCCCGAAGTCGGCTACCATGCCC |
| His180Tyr | F: GTGTTTACGGAGACATTATCTACACCCCGGCAAAG R: CTTTGCCGGGGTGTAGATAATGTCTCCGTAAACAC |
| Asn255Asp | F: GATTCCTTCAGGTGTATACGATGTTATTCCCTGTTCTCG R: CGAGAACAGGGAATAACATCGTATACACCTGAAGGAATC |
Table 2.
Oligonucleotide sequences used for PCR-based site-directed mutagenesis of prokaryotic expression vectors. All sequences are shown in 5´–3´ direction. F: forward, R: reverse.
Table 2.
Oligonucleotide sequences used for PCR-based site-directed mutagenesis of prokaryotic expression vectors. All sequences are shown in 5´–3´ direction. F: forward, R: reverse.
| Substitution | Sequence |
|---|---|
| Val90Ala | F: GCTGGGCATGGCTGCGGATTGCGGTG R: CACCGCAATCCGCAGCCATGCCCAGC |
| Cys93Phe | F: GCATGGTTGCGGATTTCGGTGTTCGTGAAGC R: GCTTCACGAACACCGAAATCCGCAACCATGC |
| His180Tyr | F: GTTTATGGTGACATCATTTACACCCCGGCGAAGG R: CCTTCGCCGGGGTGTAAATGATGTCACCATAAAC |
| Asn255Asp | F: GCGGCGTTTACGACGTGATTCCGTGCAG R: CTGCACGGAATCACGTCGTAAACGCCGC |
Disclaimer/Publisher’s Note: The statements, opinions and data contained in all publications are solely those of the individual author(s) and contributor(s) and not of MDPI and/or the editor(s). MDPI and/or the editor(s) disclaim responsibility for any injury to people or property resulting from any ideas, methods, instructions or products referred to in the content. |
© 2024 by the authors. Licensee MDPI, Basel, Switzerland. This article is an open access article distributed under the terms and conditions of the Creative Commons Attribution (CC BY) license (http://creativecommons.org/licenses/by/4.0/).
Copyright: This open access article is published under a Creative Commons CC BY 4.0 license, which permit the free download, distribution, and reuse, provided that the author and preprint are cited in any reuse.


