Submitted:
01 April 2024
Posted:
02 April 2024
Read the latest preprint version here
Abstract
The medicinal plant Abrus precatorius L. was traditionally used in Siddha and Ayurvedic systems of medicine in India. The Indian centre of origin holds vast variability for its seed color. The objective of this study was to assess the total monomeric anthocyanin, flavonol, antioxidative potential, protein content and ash content among the accessions. A total of 99 accessions conserved in the Indian National Genebank were used in this study. The method used for the estimation of total monomeric anthocyanin, flavonol, antioxidative potential, protein content and ash content was pH differential method, Oomah method, Ferric Reducing Antioxidant Potential, Dumas method and gravimetric method respectively. The completely black colored accession was recorded with highest total monomeric anthocyanin (51.95 mg / 100 g of cyanidin 3-glucoside equivalent) and flavonol content (66.41 mg/g of quercetin equivalent). Red + black colored accessions have recorded the maximum value with respect to antioxidants (14.18 mg/g of gallic acid equivalent). Highest amount of protein content was found in a completely white colored accession (20.67%) and maximum ash content was recorded in red + black seed colored accession (4.01%). The promising accessions identified can be used by pharmaceutical companies in drug development and in curing degenerative diseases.
Keywords:
Abrus precatorius
; anthocyanin
; flavonol
; antioxidative potential
; medicinal herb
1. Introduction
Abrus precatorius L. was a medicinal herb native to Indian subcontinent. The genus name Abrus was derived from Latin which denotes “graceful” or “beautiful” [1]. It connotes the attractive appearance of its seed. The vast genetic variability of the species occurs throughout the country. It was commonly known as Indian liquorice and belongs to family fabaceae. However the plant was known by different names in various parts of the world like Gunja, Rosary pea, Crab’s eye, Jequerity bean [2]. In the outer Himalyan region, it was found at an altitude of up to 1200 m above sea level [3]. Due the presence of toxic albumin abrin, the seeds should not be consumed without detoxification [4]. Even a very small quantity of abrin (0.1-1 microgram/kg) can cause death in humans [5]. In the ayurvedic texts of India, various detoxification techniques were available. The process was called as “Shodhana” which denotes the removal of toxic chemical compound without affecting its efficacy in curing diseases [6]. The chemical structure of abrin was given in Figure 1.
In the traditional system of medicine, the plant was known for the treatment of various diseases or health problems. Few among them were aphrodisiac, abortifacient, rheumatic arthritis and dysentery [7]. It was observed that the seed kernel was mainly comprised of protein but the oil and starch content were low. The seeds were rich in mineral nutrients like phosphorous, sulfur, potassium, calcium, magnesium and iron. The entire plant (roots, leaves and seeds) was used in the Siddha, Unani and ayurvedic system of medicines [8]. The previous workers have reported that the seed extract was found to possess anti-cancer activity [9]. In the ethanobotany, the leaf extract was known for curing rabies, tetanus, cat and dog bites [3]. Abrusosides A-D, four novel sweet-tasting triterpene glycosides from the leaves of Abrus precatorius. The sweet taste of leaves was due to the presence of these compounds which is 30 to 100 times sweeter than that of sucrose [10]. In the folk medicine, paste of leaves or root was used as a remedy for snake bite. The root powder can also be applied topically [11]. The leaves were found to be the ideal material for the production of silver nanoparticles and possess good antibacterial activity [12]. The detoxified seeds (by boiling) of A. precatorius are eaten as food by the residents of Andaman and Nicobar Islands in India. Onges tribe consumes them at the time of food scarcity. Ratti seeds are rich in essential amino acids except cysteine and threonine [13]. The calorific value of Abrus seeds was better in terms of food energy value than any other fabaceae seeds. However the heat labile antinutritional components have to be removed by proper cooking [8]. The Indian centre of origin represents the vast genetic variability for seed color. Therefore, the present study was to investigate the differences in chemical constituents among the multi seed colored Abrus germplasm.
2. Results
2.1. Total Monomeric Anthocyanin (mg/g of QE)
The observed mean value of total monomeric anthocyanin among the Ratti accessions studied was 23.04 ± 1.22 mg / 100g of CGE and the median value was 27.07 mg / 100 g of CGE (Table 1). The samples were recorded with the range of 51.95 mg / 100 g of CGE. The completely black colored accession was reported with the maximum value of total monomeric anthocyanin i.e., 51.95 mg / 100g of CGE whereas it was absent in complete white, cream + brown and pink + brown accessions. The top three accessions that recorded highest amount of total monomeric anthocyanin were IC0605143 (51.95 mg / 100 g of CGE), IC0405311 (49.83 mg / 100 g of CGE) and IC0401666 (47.63 mg / 100 g of CGE) as given in Table 2. All these three accessions were having the black seed coat color. The mean value of total monomeric anthocyanin (mg/100g of CGE) among different seed colored Abrus precatorius accessions was shown in Figure 2.
2.2. Flavonols (mg/g of QE)
The average amount of flavonol content among the 99 Ratti accessions studied was 42.23 ± 0.83 mg/g of QE and the median value was 44.04 mg/g of QE. The accessions were recorded with the range of 40.80 mg/g of QE (Table 1). The completely white colored accession was recorded with lowest amount of flavonols i.e., 25.61 mg/g by IC0545109. Whereas, the completely black colored accession was recorded with highest amount of flavonols i.e., 66.41 mg/g by IC0405311. From Table 2, it was observed that the top three accessions which were observed with highest amount of flavonols were IC0405311 (66.41 mg/g), IC0401666 (64.31 mg/g) and IC0605143 (59.91 mg/g). All these three accessions which were recorded with highest amount of flavonols were with black seed coat color. The mean value of flavonol (mg/g of QE) among different seed colored Abrus precatorius accessions was shown in Figure 3.
2.3. Antioxidants (mg/g of GAE)
One of the important applications of Abrus in pharmaceutical industry was due to its antioxidant property [14,15]. Among the accessions studied, the mean value of antioxidant was 10.24 ± 0.45 mg/g of GAE and the median value of antioxidant was 11.65 mg/g of GAE (Table 1). Its range in the accessions studied was 13.42 mg/g of GAE. The white colored Ratti accessions have recorded the minimum value with respect to antioxidant i.e., 0.76 mg/g of GAE by IC0545109. On the other hand, Red + black color combination of Ratti accessions have recorded the maximum value with respect to antioxidants i.e., 14.18 mg/g of GAE by IC0405295. From Table 2, it was observed that the top three accessions with highest amount of antioxidant were IC0405295 (14.18 mg/g), IC0385638 (14.13 mg/g) and IC0405311 (14.07 mg/g). The mean value of antioxidants (mg/g of GAE) among different seed colored Abrus precatorius accessions was shown in Figure 4.
2.4. Protein Content
The boiled seeds were consumed as food by Onges tribe in India [13]. Among the accessions studied, the average value of protein content was 17.99 ± 0.11% and the median value of protein content was 18.03% (Table 1). Its range among the accessions studied was 5.23%. The completely white colored Ratti accession has recorded the minimum value of protein content i.e., 15.43% by IC0392840. The highest amount of protein content (%) was also found in the complete white colored accession i.e., IC0385644 (20.67%). From Table 2, it was observed that the top three accessions with highest amount of protein content were IC0385644 (20.67%), IC0538733 (20.41%) and IC0349819 (20.17%). The mean value of protein content (%) among different seed colored Abrus precatorius accessions was shown in Figure 5.
2.5. Ash Content
The ash content of Abrus sample helps in estimating the amount of inorganic residues which was left after ignition. Based on the analysis of ash content in Abrus seeds, it was found that the mean value was 3.28 ± 0.04% and the median value was 3.34% (Table 1). The range was estimated as 1.93%. The Red + Black seed colored Ratti accession has recorded the minimum value of ash content i.e., 2.08% by IC0310646. The maximum amount of ash content (%) was also observed in the Red + black seed colored accession i.e., IC0418119 (4.01%). From Table 2, it was noted that IC0418119 (4.01%), IC0310855 (4.00%) and IC0469946 (3.95%) were the top three accessions with highest amount of ash content. The mean value of ash content (%) among the different seed colored Abrus precatorius accessions studied was shown in Figure 6.
2.6. Correlation Analysis
The correlation analysis was done to study the association among various biochemical parameters in Abrus germplasm. The result of correlation analysis was presented in Figure 7. Based on the scale, the degree association between various traits was studied [16]. There exists highly significant, very strong and positive association between antioxidants and anthocyanin (r=0.92), antioxidants and flavonols (r=0.87) and anthocyanin and flavonols (r=0.92). On the contrary, the association among other parameters studied was found to be non-significant. Previous studies have reported that the antioxidant activity of Abrus extracts was positively correlated with the total phenol content. It was also reported that the total phenol content was associated with total flavonoid content [17]. Similarly, strong correlation between total phenol content, total flavonoid content and their antioxidant activities in Abrus cantoniensis and Abrus mollis [18].
3. Discussion
The average value of total monomeric anthocyanin content among complete black and red + black accessions were 49.8 and 27.68 mg/100g of CGE. Previous studies have reported 60.44 ± 0.50 CGE/ 100g as the total anthocyanin content from the crude extract of A. precatorius seed coat [19]. The complete black, complete white, cream + brown, pink + brown and red + black seeded accessions were recorded with the mean flavonol content of 63.54 mg/g, 26.84 mg/g, 27.66 mg/g, 33.28 mg/g and 44.98 mg/g of QE respectively. Most of the previous studies were focused on estimation of total flavonoid content of leaves. It was reported that the total flavonoid content of different extracts of Abrus leaves viz. ethanol, water, and petroleum ether as 14.43±1.35, 20.84±1.97, 1.6±0.41 mg QE/g dry extract [20]. The hydro-methanolic extract of seed contains the total flavonoid content of 73.33±2.36 mg/g of rutin equivalent (RE) [21]. The complete black, complete white, cream + brown, pink + brown and red + black seeded accessions were recorded with the mean antioxidant content of 13.6 mg/g, 1.13 mg/g, 1.96 mg/g, 2.37 mg/g and 12.27 mg/g of GAE respectively. Previous workers have observed that the antioxidant capacity of methanolic leaf extracts was maximum with a low IC50 value of 62.86±0.68µg/mL [20]. The leaf extract was found to have the antioxidative potential which ranges between 2.67 ± 0.40 to 13.34 ± 0.35 mg/g of ascorbic acid equivalents (AAE) [14]. The complete black, complete white, cream + brown, pink + brown and red + black seeded accessions were recorded with the mean protein content of 18.10%, 18.11%, 17.84%, 18.54% and 17.96% respectively. The protein content of Abrus seed was earlier studied by few researchers using kjeldahl method [13]. Their study revealed the protein content as 16.28% which was closer to that of Australian pulse crop, Cassia notabilis. Some researchers have studied the crude protein content in the leaves of Abrus precatorius. Based on their study, the protein content was estimated as 8% in the leaves [22]. The complete black, complete white, cream + brown, pink + brown and red + black seeded accessions were recorded with the mean ash content of 3.27%, 3.40%, 3.13%, 3.12% and 3.27% respectively. It was reported that the ash content of Abrus seeds was 3.36% [13]. They have also mentioned that the value of ash content was similar to that of pinto bean (Phaseolus vulgaris), Narrowleaf lupin (Lupins angustifolius and L. hispanicus). Some early investigation was done the ash content of Abrus leaves. Based on their study, the amount of ash content in Abrus leaves was 7.00 ± 1.41% [22]. Accessions with different seed color significantly vary in terms of its bioactive constituents. The present investigation provides experimental proof that Abrus seeds contains considerable amount of total monomeric anthocyanin (except complete white, cream + brown and pink + brown colored accessions), flavonols and antioxidants. The pharmaceutical companies can make use these accessions for drug development. Accessions recorded with highest antioxidative potential can be used in the treatment of degenerative diseases and as a free radical scavenger resulting from oxidative stress. However, preclinical studies should be conducted to understand the side effects of the drug developed from Abrusf seeds.
4. Materials and Methods
4.1. Seed Material
A total of 99 accessions were chosen based on germination % and seed quantity from the Indian National Genebank, National Bureau of Plant Genetic Resources (NBPGR). These accessions represent the different agro-ecological zones of India with the exception of north east India. The five main groups based on the seed color (as shown in Figure 8) and their corresponding RHS color code were as follows viz. red + black combination (43A + 202A), pink + brown combination (65D + 199D), cream + brown combination (156D + 199B), complete black (202A + 42B) and complete white color (155C). The number of accessions presents in red + black combination, cream + brown combination, pink + brown combination, complete black and complete white color were seventy seven, five, two, three and twelve respectively.
4.2. Estimation of Total Monomeric Anthocyanin Pigment Content by pH Differential Method
This method was based on the color change of monomeric anthocyanin reversibly with change in pH. The colored oxonium form at pH 1.0 changes to hemiketal form at pH 4.5. The absorbance reading at 520 nm gives the concentration of pigments. Degraded anthocyanin cannot be detected because they does not change color and absorb at both pH 4.5 and pH 1.0. The materials required are standard buffer solutions, pH meter (standardized with pH 4.0 and 7.0), volumetric flasks (50 mL), spectrophotometer, cuvette (1 cm path length).
4.2.1. Reagents Required
Potassium chloride (0.025M): Weigh 1.86 g KCl and transfer it into beaker. Then add 980 mL distilled water. Adjust the pH to 1.0 with HCl, then transfer it to volumetric flask of 1L and make up the required volume using distilled water. Sodium acetate (0.4M): For this, measure 54.43 g of sodium acetate trihydrate and add 960mL of distilled water. Adjust the pH to 4.5 with HCl, and then transfer it to volumetric flask of 1 liter. Finally, make up the required volume using distilled water.
4.2.2. Procedure
Weigh 0.1 g of sample and transfer it into a 15 mL centrifuge tube. Add 10mL of 0.1N HCl into the tube and keep it in rotospin for overnight so that the contents mix properly. After that, centrifuge the tubes at 10,000 rpm for 10 minutes. Pipette out 500 µL of supernatant in two different glass tubes. Then, transfer 1500 µL of HCl buffer in one tube and 1500 µL of sodium acetate buffer in another tube. Blank 1 for pH 1.0 buffer: Pipette out 500 µL of 0.1N HCl into a glass tube and add 1500 µL of HCl buffer into it. Blank 2 for pH 4.5 buffer: Pipette out 500 µL of 0.1N HCl into a glass tube and add 1500 µL of sodium acetate buffer into it. Keep them in room temperature for 30 minutes and vortex it for mixing the contents. Take absorbance reading at 520 and 700 nm. If test portion is turbid, then centrifuge it to clarify them. Other method is to use filter (Millipore TM membrane filter, 1.2 mm pore size). The unit for measuring total monomeric anthocyanin was mg / 100 g of cyanidin 3-glucoside equivalent (CGE). Anthocyanin content was calculated using the formula below:
Anthocyanin = A×MW×DF×v×102 / ε× l× W
Where,
A (Absorbance) = (A520 nm – A700 nm) at pH 1.0 – (A520 nm – A700 nm) at pH 4.5;
MW (Molecular weight) = 449.2 g/mol;
DF = Dilution factor;
l = Path length in cm;
ε = 26900 molar extinction coefficient (L mol–1 cm –1);
W - Weight of sample and
V - Volume of test solution
4.3. Flavonol Estimation by Oomah Method
It involves the formation of an acid stable and acid labile complex formed by flavonol which was having maximum absorbance at 360 nm [23].
4.3.1. Reagents Required
The following reagents were required for flavonol estimation: 75%, 80% and 95% ethanol, 2% HCl in 75% ethanol and the quercetin standard. The stock concentration of quercetin should be 1 mg/ml. This can be prepared by dissolving 25 mg of quercetin in 25 ml of 95% ethanol. The working standard can be prepared by pipetting 4 ml from stock solution and then make up the volume to 50 ml by using 95% ethanol.
4.3.2. Procedure
100 μl of sample was taken in a test tube. Add 2.4 ml of 2% HCl in 75% ethanol. Prepare the standard with different concentrations (16, 32, 48, 64, 80 μg/ml) and blank. These were labeled as S1, S2, S3, S4, S5 and blank. The working solution of quercetin and 80% ethanol were used to prepare standards of different concentrations. In the blank, working solution was not added i.e., all the 100 μl were made with the 80% ethanol. The sample and standards were prepared at the same time. Stir the contents by using vortex and keep it for 30 minutes at room temperature. Then, measure the absorbance at 360 nm by using spectrophotometer. The spectrophotometer readings for different standards were recorded and the values were plotted in a graph. Then the spectrophotometer readings for samples were noted down. Based on the graph, the amount of flavonol in the samples was estimated. The results were expressed as quercetin equivalent/ gram (QE/g) of sample
4.4. Estimation of Antioxidants by Ferric Reducing Antioxidant Potential (FRAP)
FRAP method is based on reduction potential of complex Ferric-tripyridyltriazine (Fe3+-TPTZ) to blue colored Ferrous-tripyridyltriazine (Fe2+-TPZ) complex form by antioxidants at lower pH [24].
4.4.1. Reagents
The reagents required were as follows: 0.1 M acetate buffer at pH 3.6. This can be prepared by dissolving 8.2 g of sodium acetate in 1L of distilled water. 20 mM Ferric chloride (Fecl3.6H2O) can be prepared by dissolving 8.1mg Ferric chloride in 2.5 ml of distilled water. 10 mM Tripyridyltriazine (TPTZ) can be prepared by dissolving 8.34 mg of TPTZ in 2.5 ml of 40mM HCl. The Gallic acid was used as the standard stock solution which was prepared by dissolving 0.1 g Gallic acid in 100 ml of distilled water. The working standard 1 was prepared by pipetting 10 ml of stock solution and then make up the volume to 100 ml. After that, working standard 2 was prepared by pipetting 10 ml of working standard 1 and then make up the volume to 100ml. From working standard 2 take 50 µl, 100 µl, 150 µl, 200 µl, 250 µl and 300 µl and make up their volume to 300 µl by using distilled water. The blank was prepared with 300 µl of distilled water. FRAP reagent was freshly prepared by combining the above reagents (acetate buffer, TPTZ solution and ferric chloride) in 10:1:1 ratio.
4.4.2. Procedure
The volume of sample required varies among the accessions with different seed color i.e., 20 µL of red + black colored accessions, 20 µL completely black colored accessions and 100 µL of white colored accessions. Add 2200 µL of freshly prepared FRAP reagent to the sample taken in test tubes. Make up the final volume to 2500 µL (i.e., 280 µL of distilled water for red + black colored accessions, 280 µL for completely black colored accessions and 200 µL for white colored accessions). Then vortex each test tube and incubate it at room temperature for 30 minutes. During incubation it forms indigo blue color. Note down the absorbance reading by using UV- spectrophotometer at 593 nm. Prepare standards (S1, S2, S3, S4 and S5) and blank. The unit for measuring antioxidant activity was mg/g of gallic acid equivalent (GAE)
4.5. Determination of Protein Content by Dumas Method
This method was based on the determination of total nitrogen content in the sample of organic matrix via subsequent oxidation and reduction. The sample is combusted at very high temperature (700-1000°C) in presence of oxygen. The gases are produced in which the CO2 is trapped and remaining gases are reduced by copper. Nitrogen produced will be detected by a thermal conductivity detector.
4.5.1. Procedure
Inject the samples into combustion tube (940°C) along with oxygen. Gathering ring in combustion tube increases the temperature up to 1800°C during combustion. This results in oxidation and halogen trapping (silver cobalt and chromium sesquioxide). It was followed by reduction (nitrogen oxides into nitrogen by copper at 700°C). The chromatography helps in the separation of nitrogen and methane. Unmeasured elements like H2O and CO2 is trapped using anhydrone and ascarite respectively. After chromatography, the detection of nitrogen was done by catharometer and further data processing will takes place. The procedure involved were as follows: Weigh 0.1 gram of sample and place them properly at the hole position in the instrument. Aspartic acid was used as the standard. Properly close the lid and run the samples. Then the instrument will burn the sample and records the protein content per 100 g of sample.
4.6. Estimation of Ash Content by Gravimetric Method
Ash is an inorganic residue that remains after removal of water and organic matter in the presence of oxidizing agents by heat. It helps in measuring the total minerals within the sample and the unit was gram of ash per 100 gram sample. The principle was to burn off the organic matter (<550°C) by oxidation and the remaining inorganic matter is determined. Temperature above 650°C volatilizes inorganic salts. This causes the fraction of ash fuses with some of the carbon particle and prevents that from ignition. After incineration, the resultant residue is the ash content of that sample.
4.6.1. Materials Required
4 N Nitric acid (refer Appendix-I), Furnace (control: 100°C to 600°C), Analytical balance (200 g, sensitivity: 0.1 mg), Air oven, Bunsen burner, Electric coil, Tongs, Spatula and Silica dish.
4.6.2. Procedure
Initially, keep the crucible in the furnace for 2 - 3 hours at 500 - 550°C. After sometimes, transfer the crucible to oven (100°C for 1-2 hours) to reduce the temperature of crucible to 100°C and the weight is noted immediately as W1. Again, take 2-4 g dry samples in replicates in the crucible and noted it as W2. For burning the sample, place the crucible that contain sample in furnace at 180°C for 1 hour and gradually increase the temperature up to 250°C for 1 hour. Maintain the samples in furnace for 3 hours at 450°C. This temperature is achieved by gradually increasing temperature (50°C) at 30 minutes interval from 180ºC to 450°C. Check whether the sample is completely dried to white color ash form or not. If not properly dried then add concentrated nitric acid (2-3 drops). After that, evaporate it in water bath and repeat the same heating procedure in furnace (30- 60 minutes) till the stable reading is achieved. Again, decrease the temperature of furnace and take weight (W3) at 100°C. The ash content was measured by g per 100 g.
Ash content = [(W3 – W1) / (W2 - W1)] × 100
W1 - weight of crucible,
W2 - weight of crucible + sample and
W3 - weight of crucible + ash.
4.7. Statistical Analysis
The data was evaluated by one-way analysis of variance and comparison was done by least significant difference (LSD) by using the software WASP 2.0 (Web Based Agricultural Statistics Software Package). If the p-value was <0.05, there exists statistically significant difference among the accessions. The treatments were replicated three times and the final results were exhibited as the mean values. Correlation analysis was performed by using Karl Pearson correlation coefficient and the software used was R studio version 4.2.3.
Author Contributions
Conceptualization, R.B. and V.G.; methodology, P.S.; software, S.R. and S.M.; validation, P.S., V.G. and R.B.; formal analysis, P.S.; investigation, R.B.; resources, P.S. and V.G.; data curation, P.S.; writing—original draft preparation, P.S.; writing—review and editing, R.B. and V.G.; visualization, S.R. and S.M.; supervision, V.G.; project administration, V.G.; funding acquisition, P.S. All authors have read and agreed to the published version of the manuscript.
Funding
The authors were grateful to University Grants commission (UGC) for providing the financial support in the form of Senior Research Fellowship (No. 3791/NET-DEC 2018 to P. S.).
Data Availability Statement
All data are contained within the article. Additional details are available from the corresponding author, V.G., upon reasonable request.
Acknowledgments
The authors acknowledge the Indian Agricultural Research Institute (IARI) and National Bureau of Plant Genetic Resources (NBPGR) for providing the necessary facilities and seed materials.
Conflicts of Interest
The authors declare no conflict of interest.
References
- Boddupalli, R.S. Historical Note: Traditional Use of Legume Seeds for Weighing Gold in India. Indian J. Hist. Sci. 2020, 55, 173–182. [Google Scholar] [CrossRef]
- Santhosam, S.; Selvam, P.; Danodia, A. Phytochemical Analysis of Abrus precatorius Seeds: A Review. Int. J. Pharm. Sci. Rev. Res. 2023, 79. [Google Scholar] [CrossRef]
- Garaniya, N.; Bapodra, A. Ethno botanical and Phytopharmacological potential of Abrus precatorius L. : A review. Asian Pac. J. Trop. Biomed. 2014, 4, S27–S34. [Google Scholar] [CrossRef] [PubMed]
- Adedapo, A.A.; Omoloye, O.A.; Ohore, O.G. Studies on the toxicity of an aqueous extract of the leaves of Abrus precatorius (L. ) on rats. Onderstepoort J. Vet. Res. 2007, 74, 31–36. [Google Scholar] [PubMed]
- Dickers, K.J.; Bradberry, S.M.; Rice, P.; Griffiths, G.D.; Vale, J.A. Abrin poisoning. Toxicol. Rev. 2003, 22, 137–142. [Google Scholar] [CrossRef] [PubMed]
- Roy, S.; Acharya, R.; Shukla, V.J. Shodhana (processing) of Gunja (Abrus precatorius Linn. ) seeds with godugdha (cow’s milk); a pharmaceutical analysis. Int. j. Ayurvedic med. 2012, 3, 68–75. [Google Scholar]
- Nautiyal, M.; Bahuguna, A.; Chauhan, J.S.; Singh, B. Effect of some pre-sowing scarification treatment on water uptake and germination of Abrus precatorious L. (Ratti). Res. J. Seed. Sci. 2014, 7, 14–20. [Google Scholar] [CrossRef]
- Chakradhari, S.; Patel, K.S.; Towett, E.K.; Martín-Ramos, P.; Gnatowski, A. Chemical Composition of Abrus precatorius L. Seeds. Eur. J. Med. Plants 2019, 1–6. [Google Scholar] [CrossRef]
- Kaur, A.; Sharma, Y.; Kumar, A.; Ghosh, M.P.; Bala, K. In-vitro antiproliferative efficacy of Abrus precatorius seed extracts on cervical carcinoma. Sci. Rep. 2022, 12, 1–14. [Google Scholar] [CrossRef]
- Choi, Y.-H.; Hussain, R.A.; Pezzuto, J.M.; Kingborn, A.D.; Morton, J.F. Abrusosides A-D, Four Novel Sweet-Tasting Triterpene Glycosides from the leaves of Abrus precatorius. J. Nat. Prod. 1989, 52, 1118–1127. [Google Scholar] [CrossRef] [PubMed]
- Upasani, S.V.; Beldar, V.G.; Tatiya, A.U.; Upasani, M.S.; Surana, S.J.; Patil, D.S. Ethno medicinal plants used for snakebite in India: a brief overview. Integr. Med. Res. 2017, 6, 114–130. [Google Scholar] [CrossRef] [PubMed]
- Gaddala, B.; Nataru, S. Synthesis, characterization and evaluation of silver nanoparticles through leaves of Abrus precatorius L.: an important medicinal plant. Appl. Nanosci. 2014, 5, 99–104. [Google Scholar] [CrossRef]
- Rajaram, N.; Janardhanan, K. The chemical composition and nutritional potential of the tribal pulse,Abrus precatorius L. Plant Foods Hum. Nutr. 1992, 42, 285–290. [Google Scholar] [CrossRef]
- Gul, M.Z.; Ahmad, F.; Kondapi, A.K.; Qureshi, I.A.; Ghazi, I.A. Antioxidant and antiproliferative activities of Abrus precatorius (L. ) leaf extracts - an in-vitro study. BMC Complement. Altern. Med. 2013, 13, 1–12. [Google Scholar]
- Palvai, V.R.; Mahalingu, S.; Urooj, A. Abrus precatorius (L. ) leaves: antioxidant activity in food and biological systems, pH and temperature stability. Int. J. Med. Chem. 2014, 2014, 1–7. [Google Scholar]
- Searle, S.R. The Value of Indirect Selection: I. Mass Selection. Biometrics 1965, 21, 682–707. [Google Scholar] [CrossRef] [PubMed]
- Jain, A.; Sinha, P.; Jain, A.; Vavilala, S. Estimation of flavonoid content, polyphenolic content and antioxidant potential of different parts of Abrus precatorius (L. ). Int. J. Pharm. Pharm. Sci. 2015, 7, 157–163. [Google Scholar]
- Yang, M.; Shen, Q.; Li, L.-Q.; Huang, Y.-Q.; Cheung, H.-Y. Phytochemical profiles, antioxidant activities of functional herb Abrus cantoniensis and Abrus mollis. Food Chem. 2015, 177, 304–312. [Google Scholar] [CrossRef] [PubMed]
- Mobin, L.; Saeed, S.A.; Ali, R.; Saeed, S.M.G.; Ahmed, R. Antibacterial, antioxidant and phenolic compound analysis of Abrus precatorius seed coat extract and its different fractions. Pak. J. Bot. 2017, 49, 2499–2506. [Google Scholar]
- Farhana, F.; Ray, G.; Islam, A.; Chakraborty, D.; Bhattacharjee, S.C.; Das, S. Antioxidant Activity, Phenolic and Flavonoid Contents of Abrus precatorius Leaf in four Different Extracts. EAS J. Pharm. Pharmacol. 2023, 5, 168–175. [Google Scholar] [CrossRef]
- Tabasum, S.; Khare, S.; Jain, K. Spectrophotometric quantification of total phenolic, flavonoid and alkaloid contents of Abrus precatorius (L. ) seeds. Asian J. Pharm. Clin. Res. 2016, 9, 371–374. [Google Scholar]
- Paul, E.D.; Sangodare, R.S.A.; Uroko, R.I.; Agbaji, A.S.; Dakare, M.A. Chemical analysis of leaves of Abrus precatorius. Int. J. Plant Physiol. Biochem. 2013, 5, 65–67. [Google Scholar]
- Oomah, B.D.; Martinez, A.C.; Pina, G.L. Phenolics and antioxidative activities in common beans (Phaseolus vulgaris L. ). J. Sci. Food Agric. 2005, 85, 935–942. [Google Scholar] [CrossRef]
- Benzie, I.F.F.; Strain, J.J. The ferric reducing ability of plasma (FRAP) as a measure of “antioxidant power”: The FRAP assay. Anal. Biochem. 1996, 239, 70–76. [Google Scholar] [CrossRef] [PubMed]
Figure 1.
Chemical structure of Abrin.
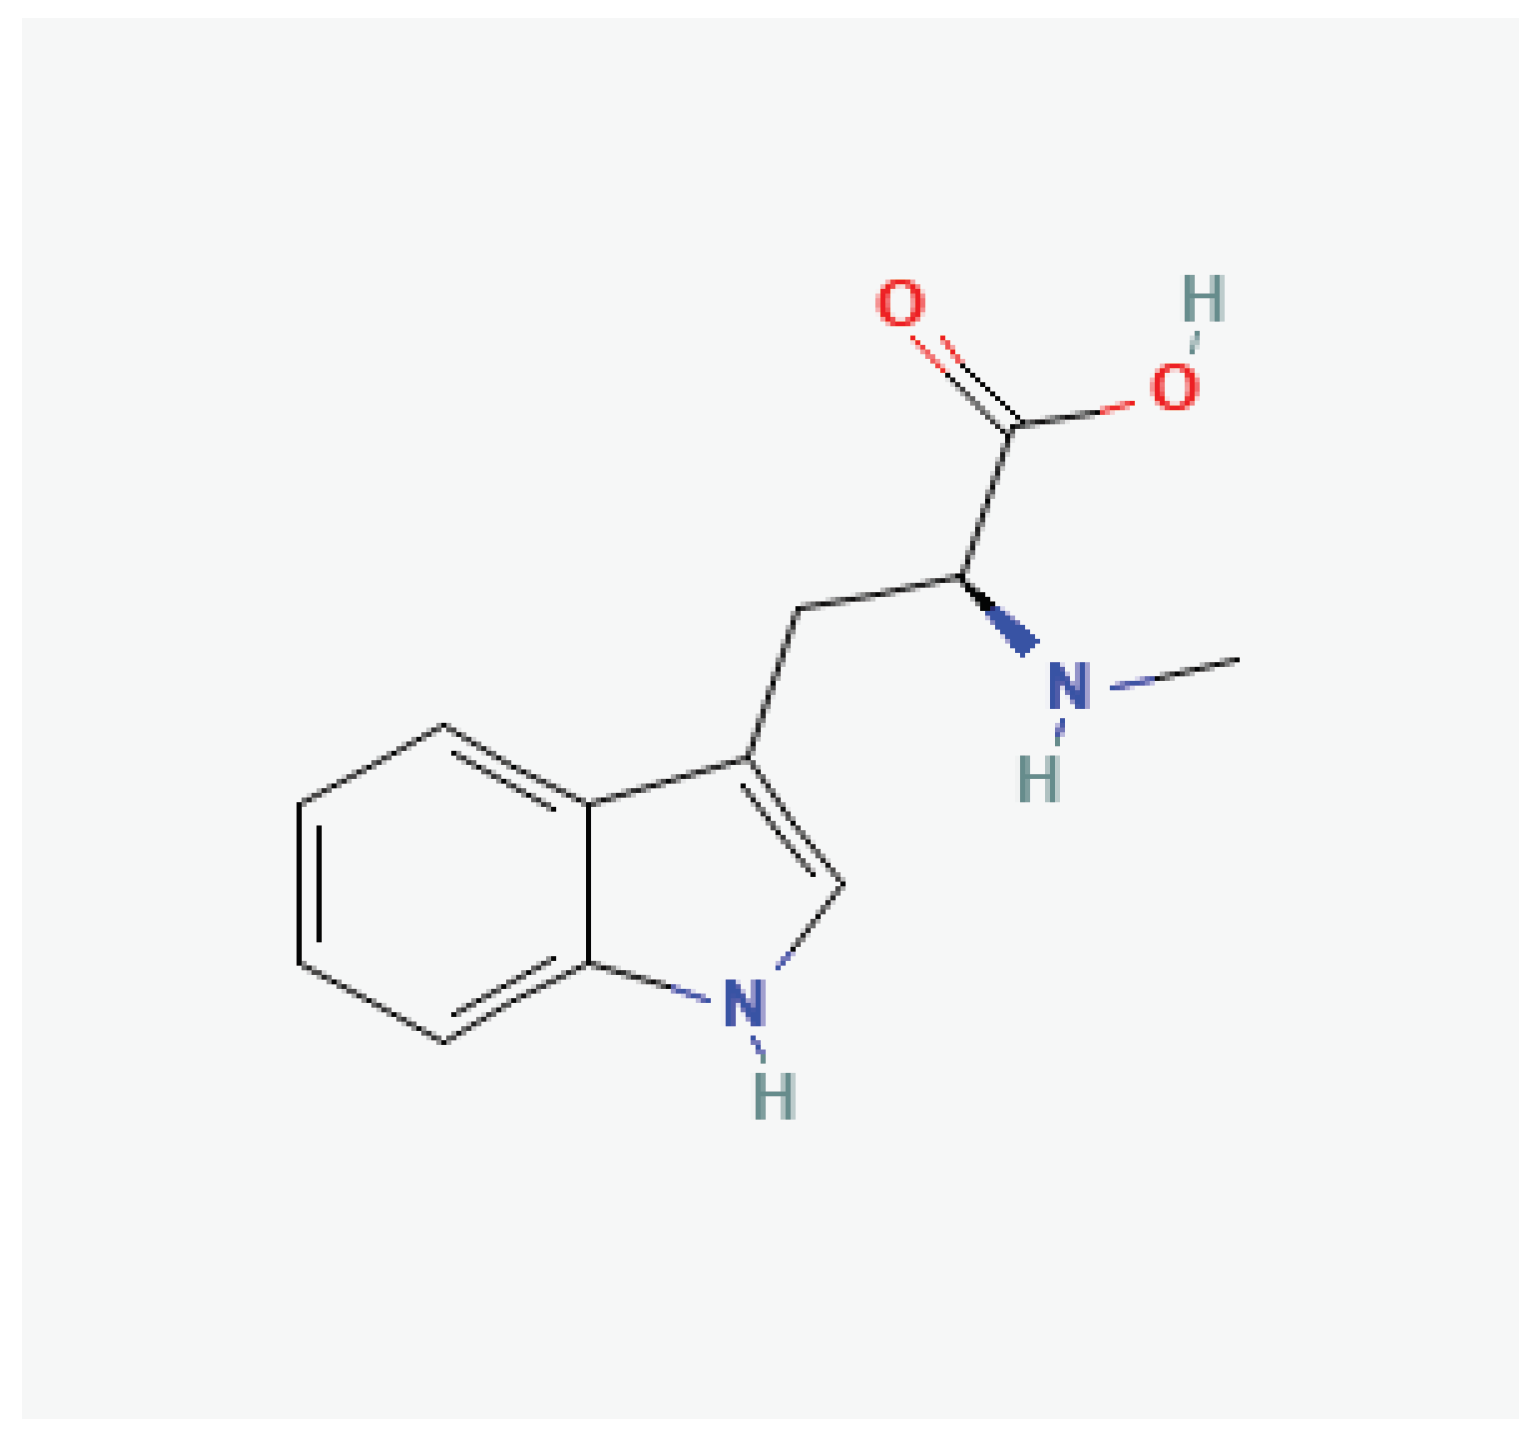
Figure 2.
Mean value of total monomeric anthocyanin (mg/100g of CGE) among different seed colored Abrus precatorius accessions.
Figure 2.
Mean value of total monomeric anthocyanin (mg/100g of CGE) among different seed colored Abrus precatorius accessions.
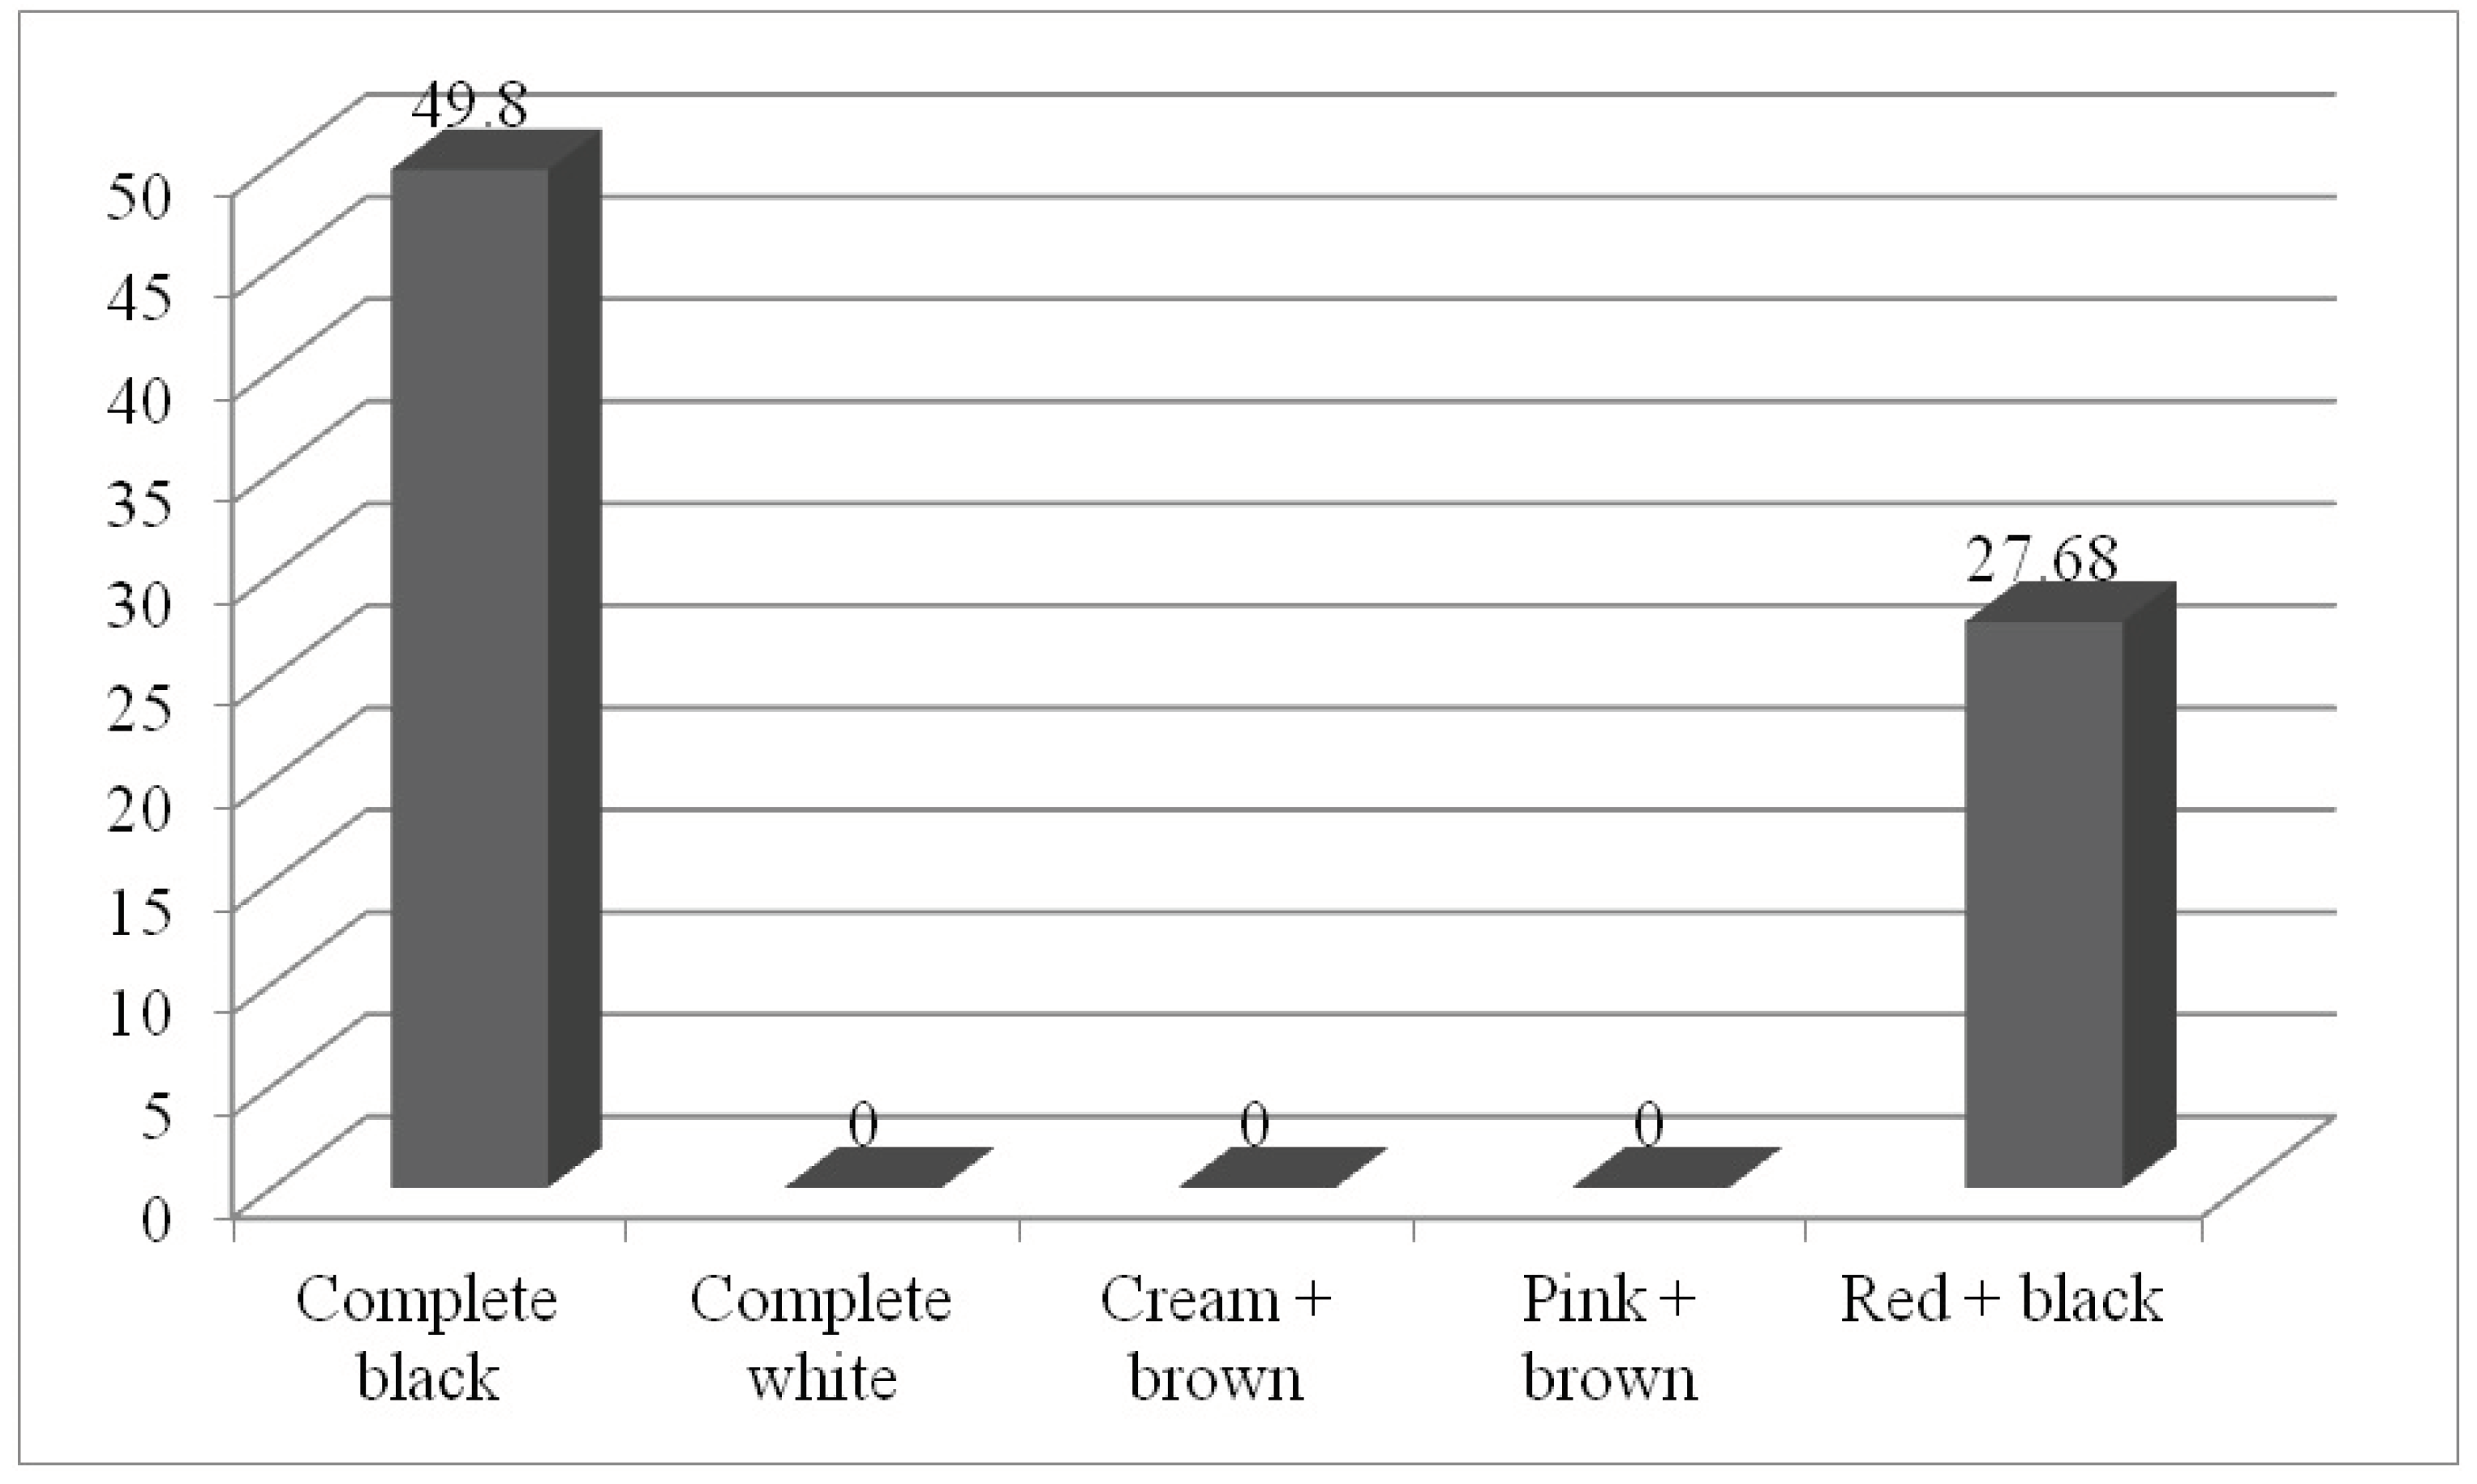
Figure 3.
Mean value of flavonol (mg/g of QE) among different seed colored Abrus precatorius accessions.
Figure 3.
Mean value of flavonol (mg/g of QE) among different seed colored Abrus precatorius accessions.
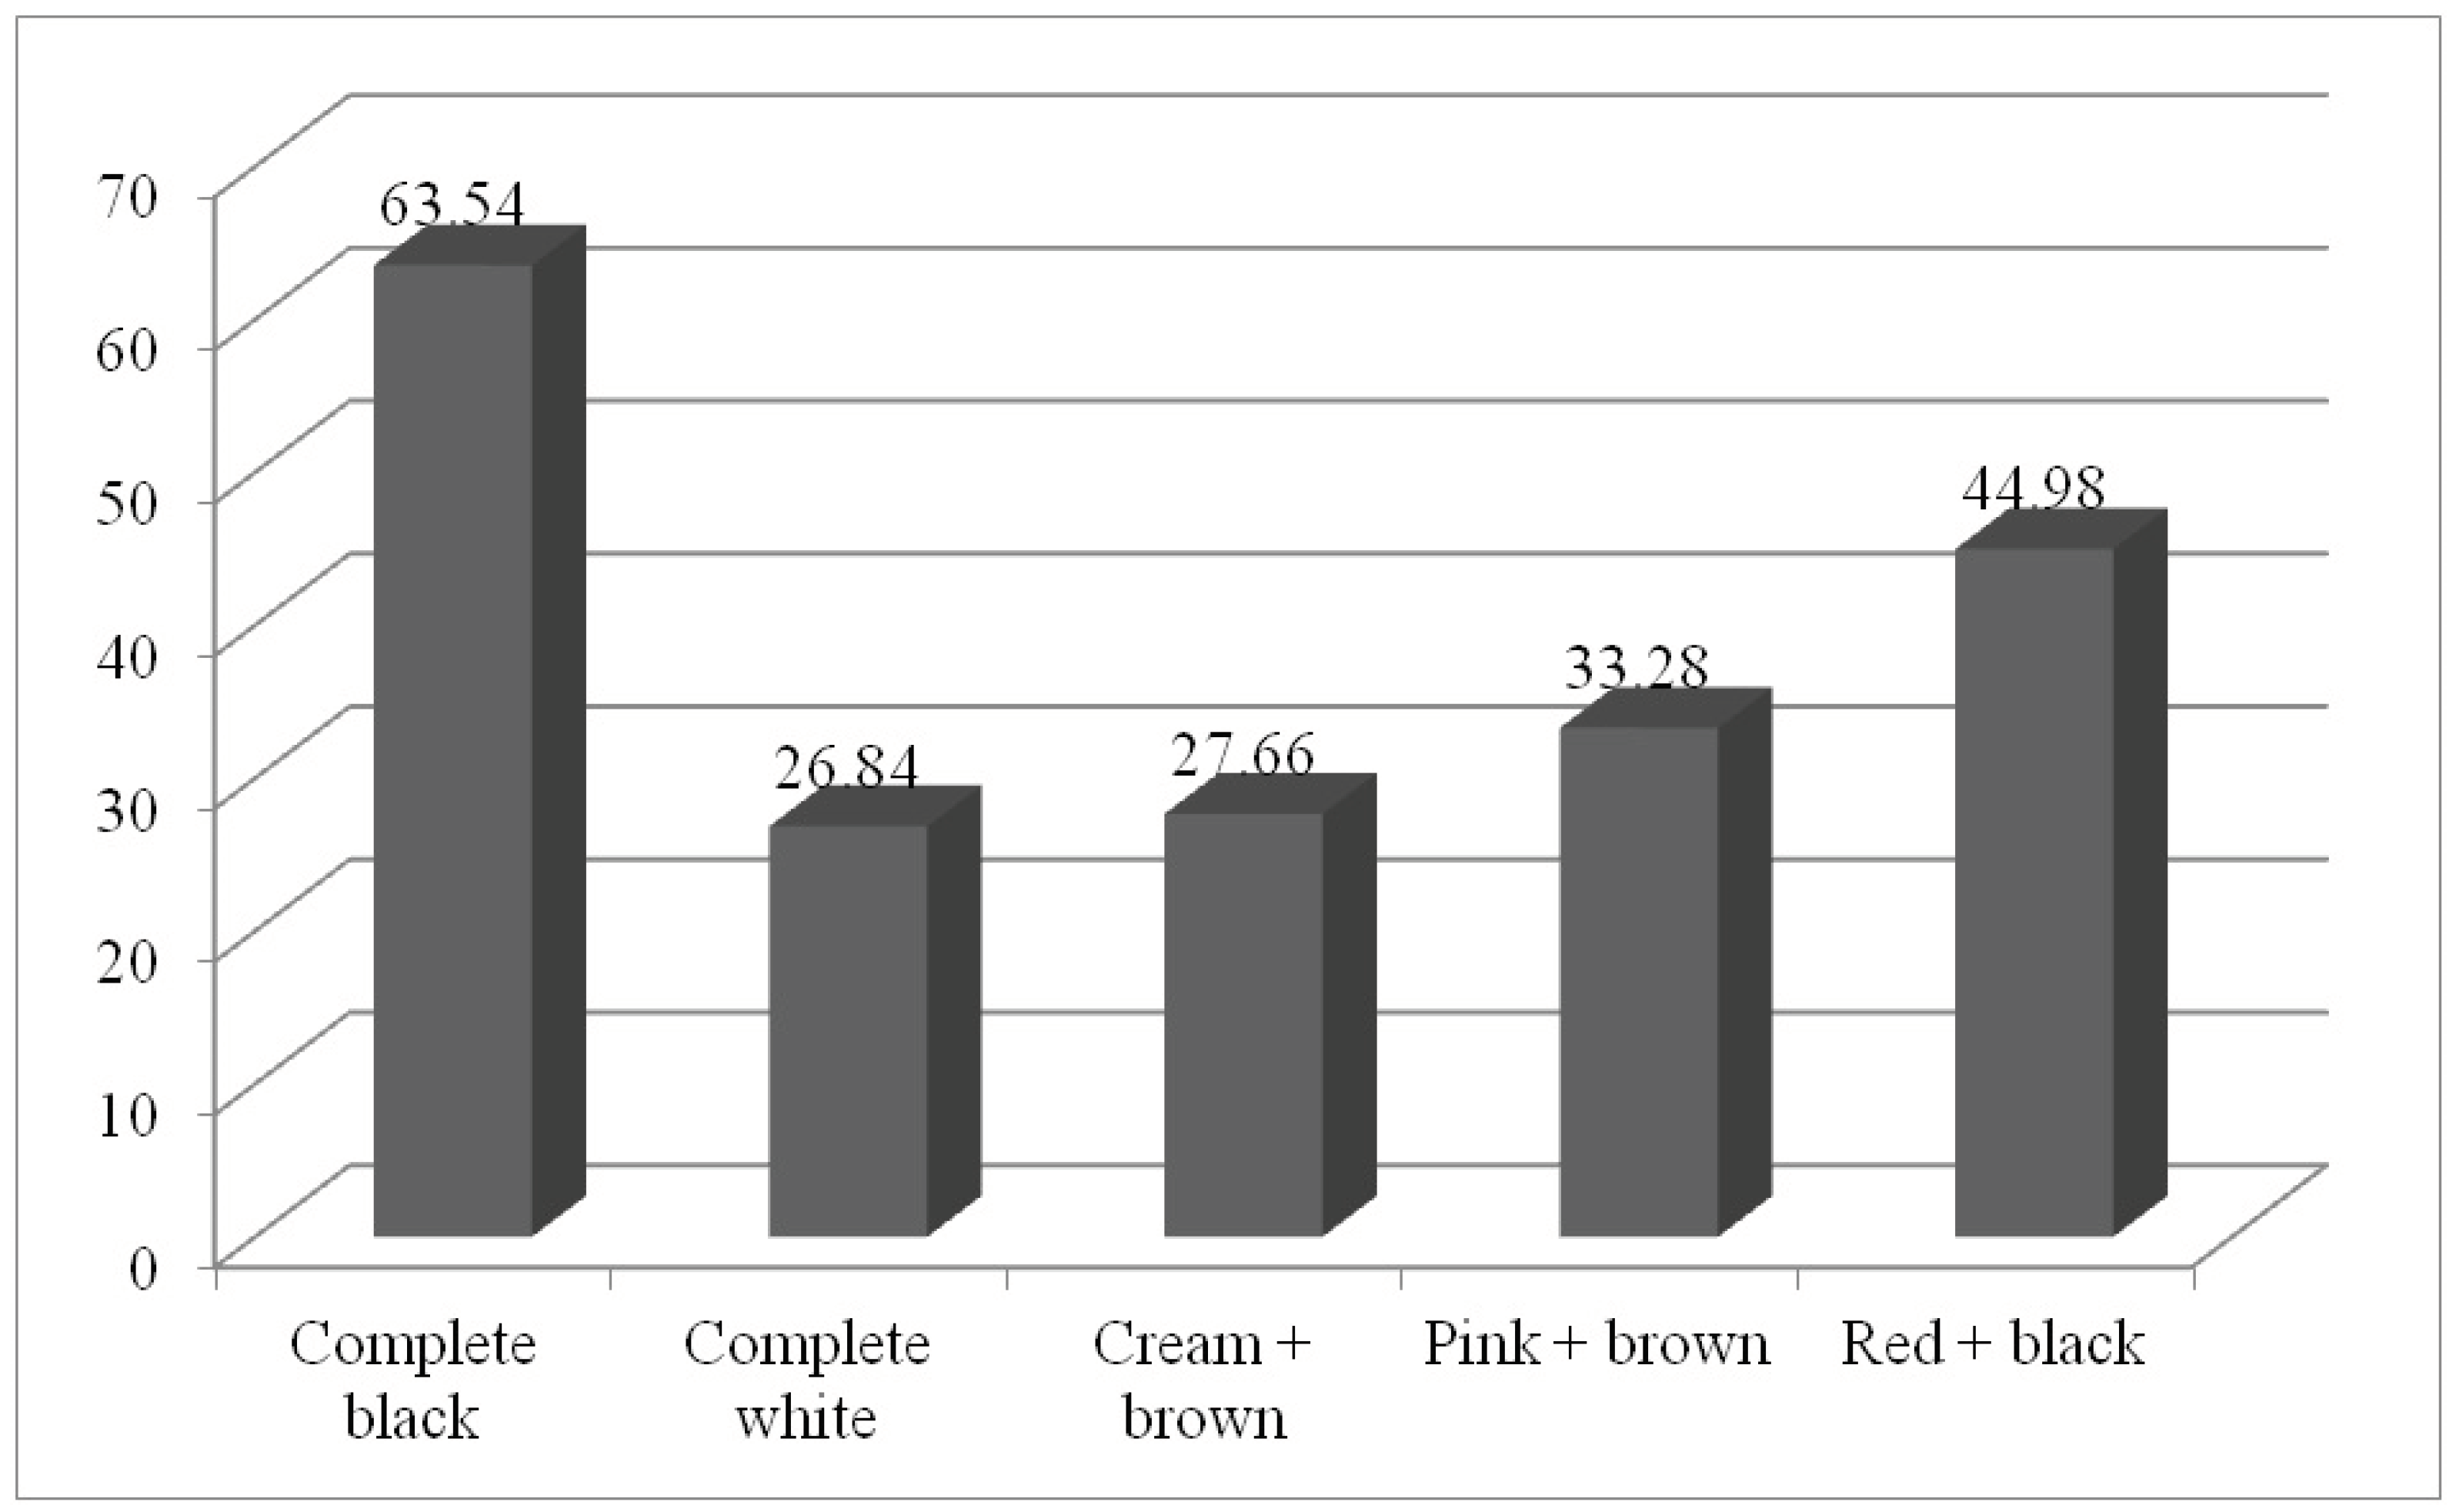
Figure 4.
Mean value of antioxidants (mg/g of GAE) among different seed colored Abrus precatorius accessions.
Figure 4.
Mean value of antioxidants (mg/g of GAE) among different seed colored Abrus precatorius accessions.
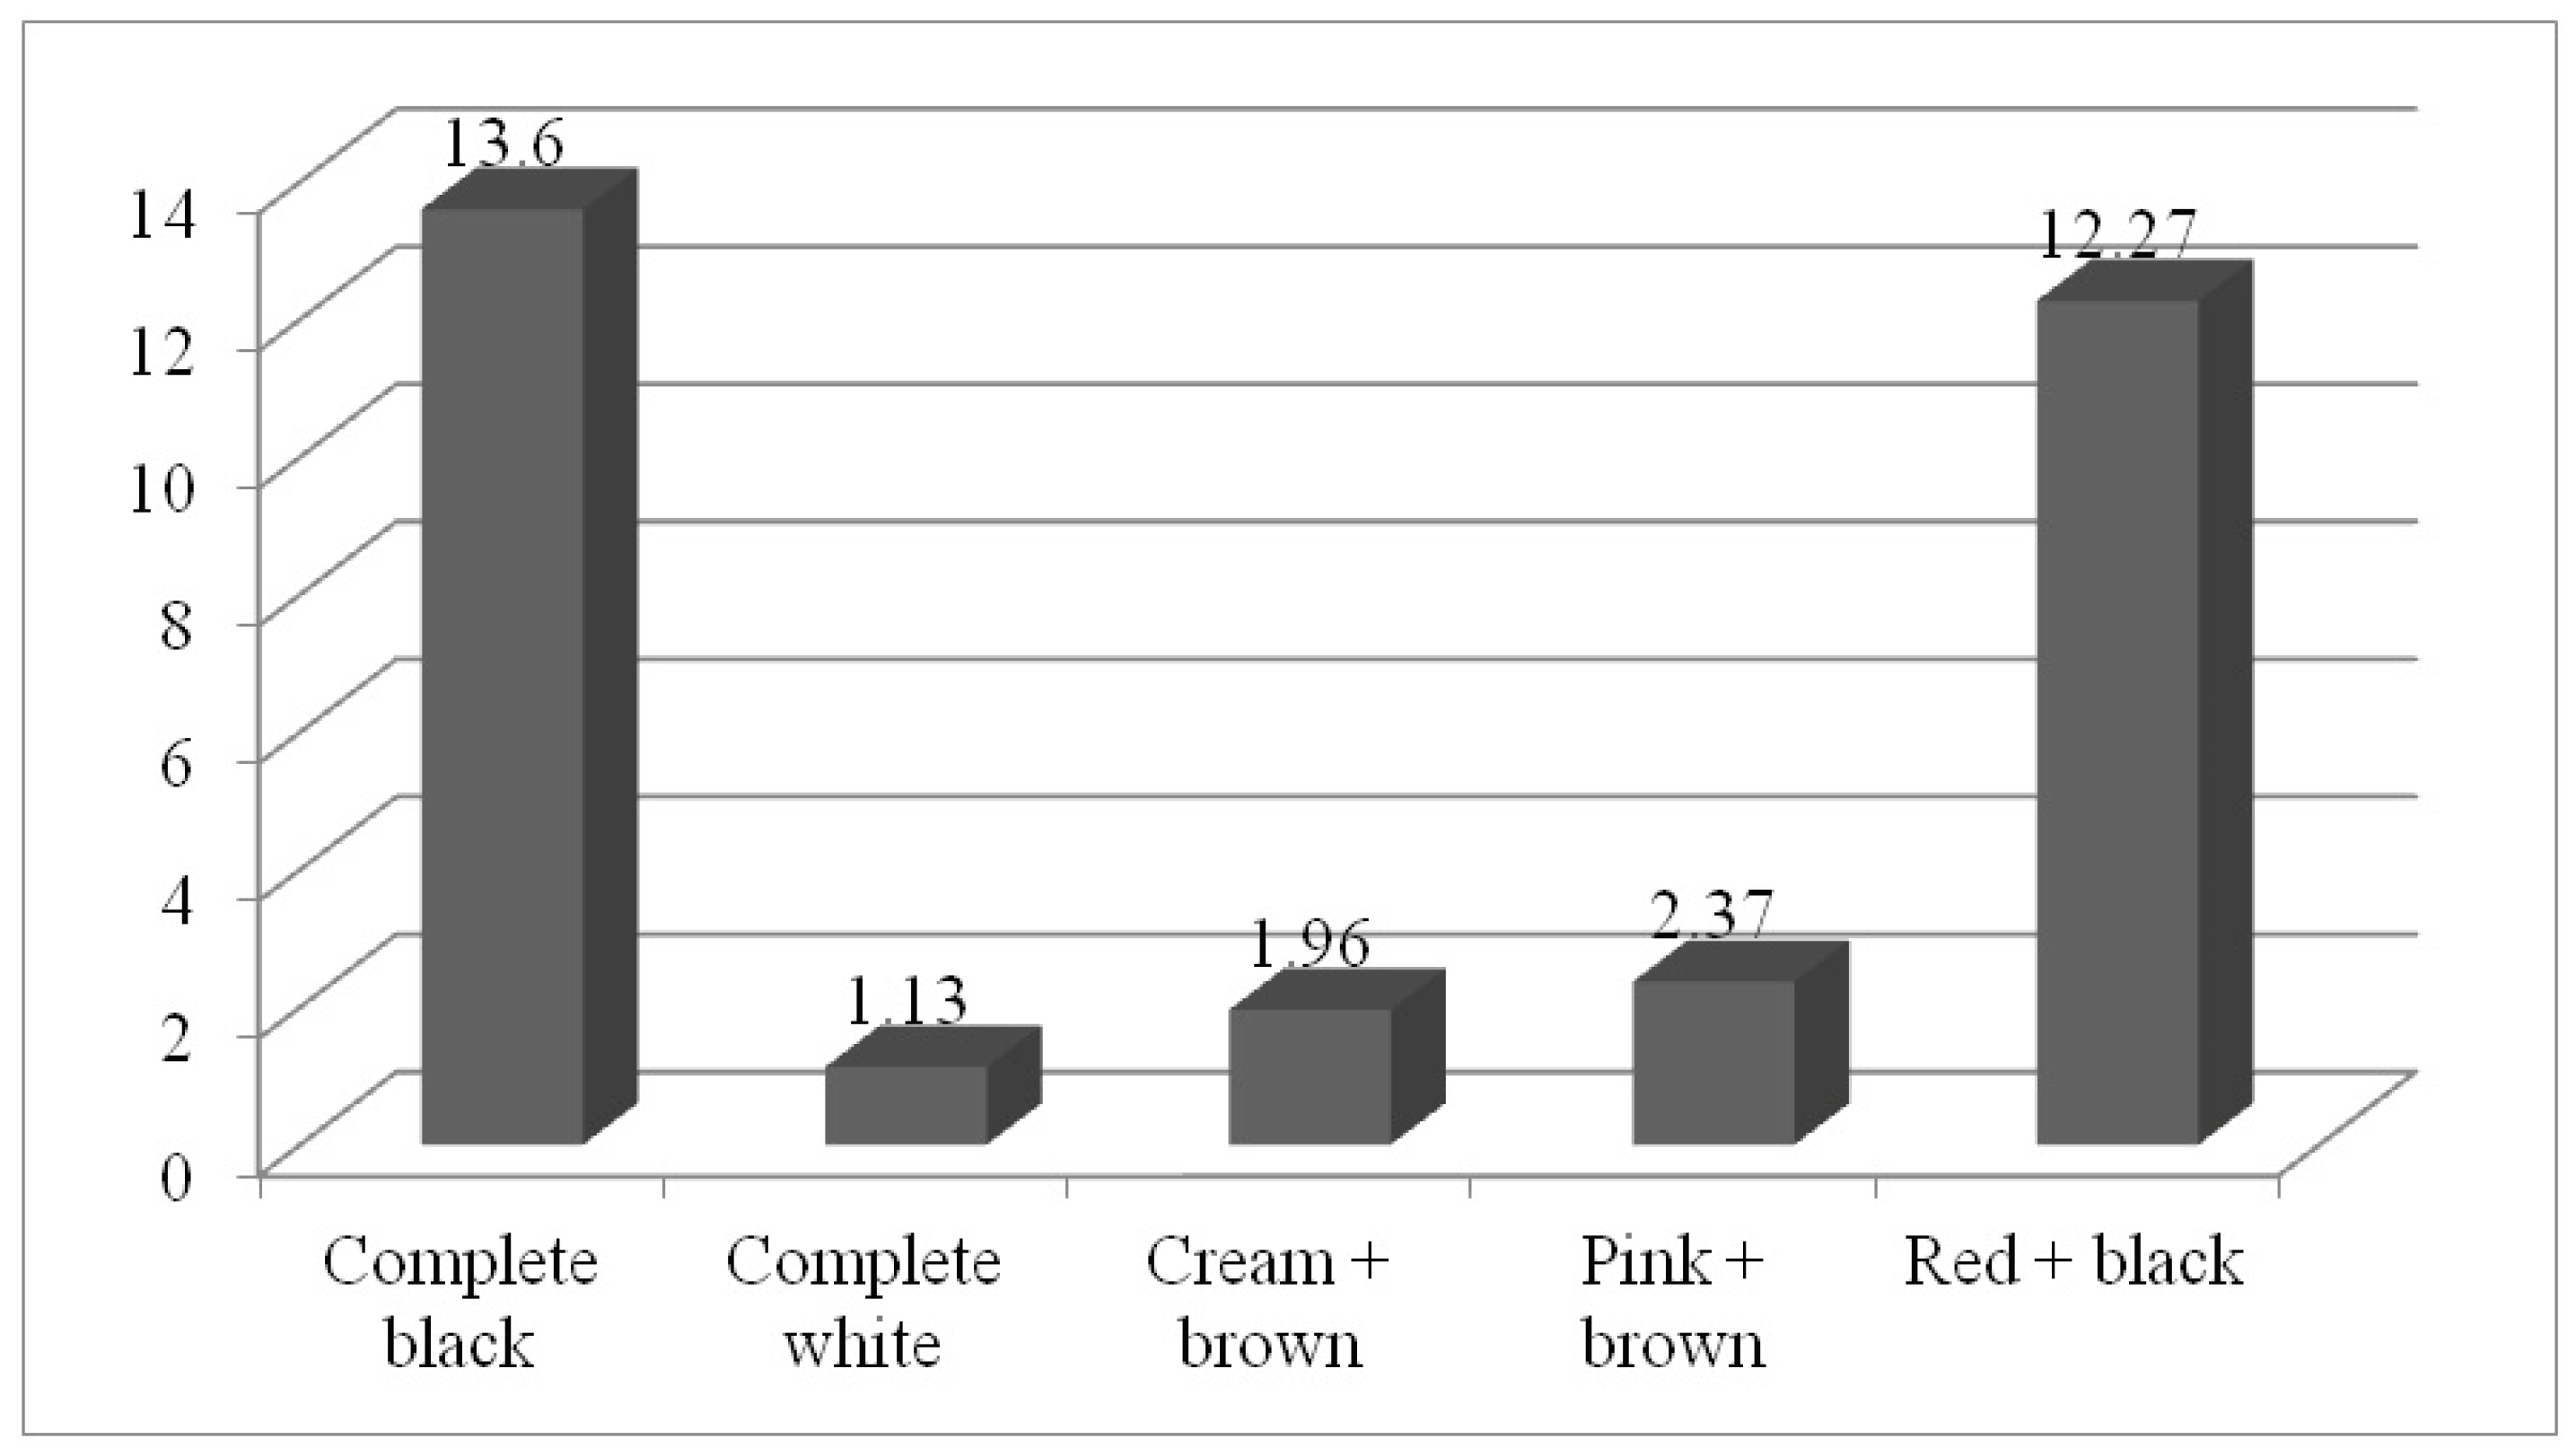
Figure 5.
Mean value of protein content (%) among different seed colored Abrus precatorius accessions.
Figure 5.
Mean value of protein content (%) among different seed colored Abrus precatorius accessions.
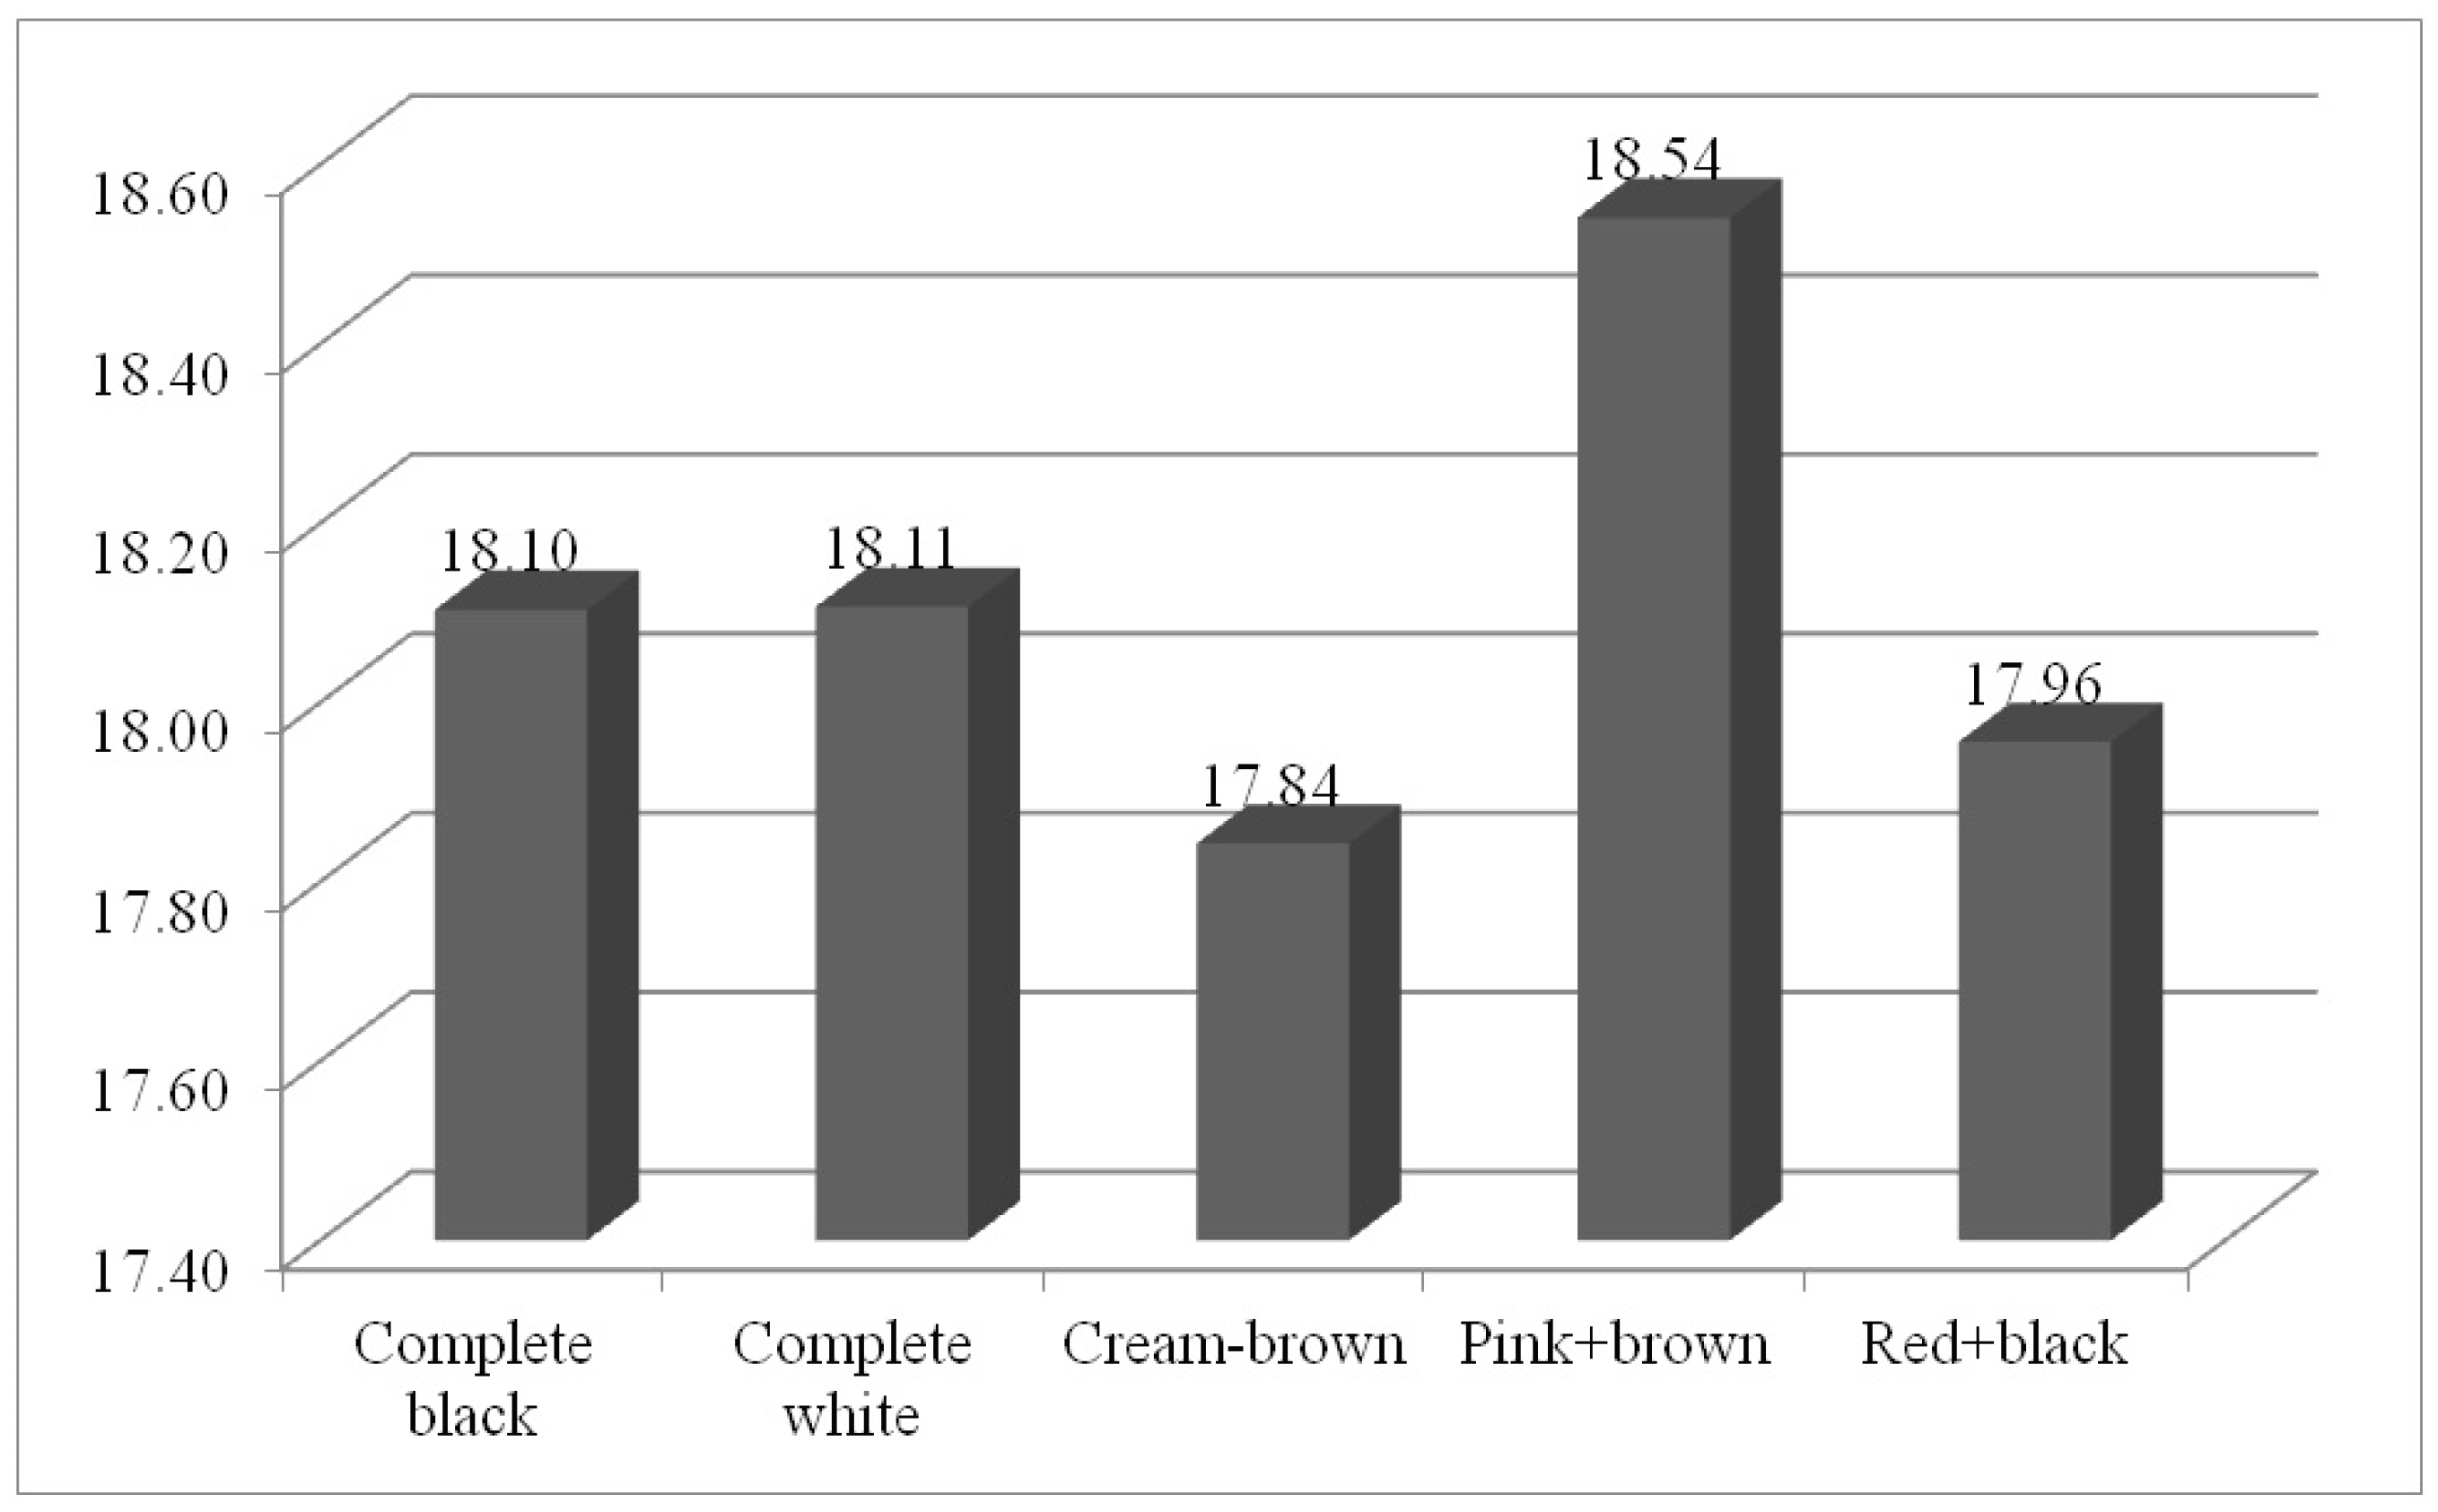
Figure 6.
Mean value of ash content (%) among different seed colored Abrus precatorius accessions.
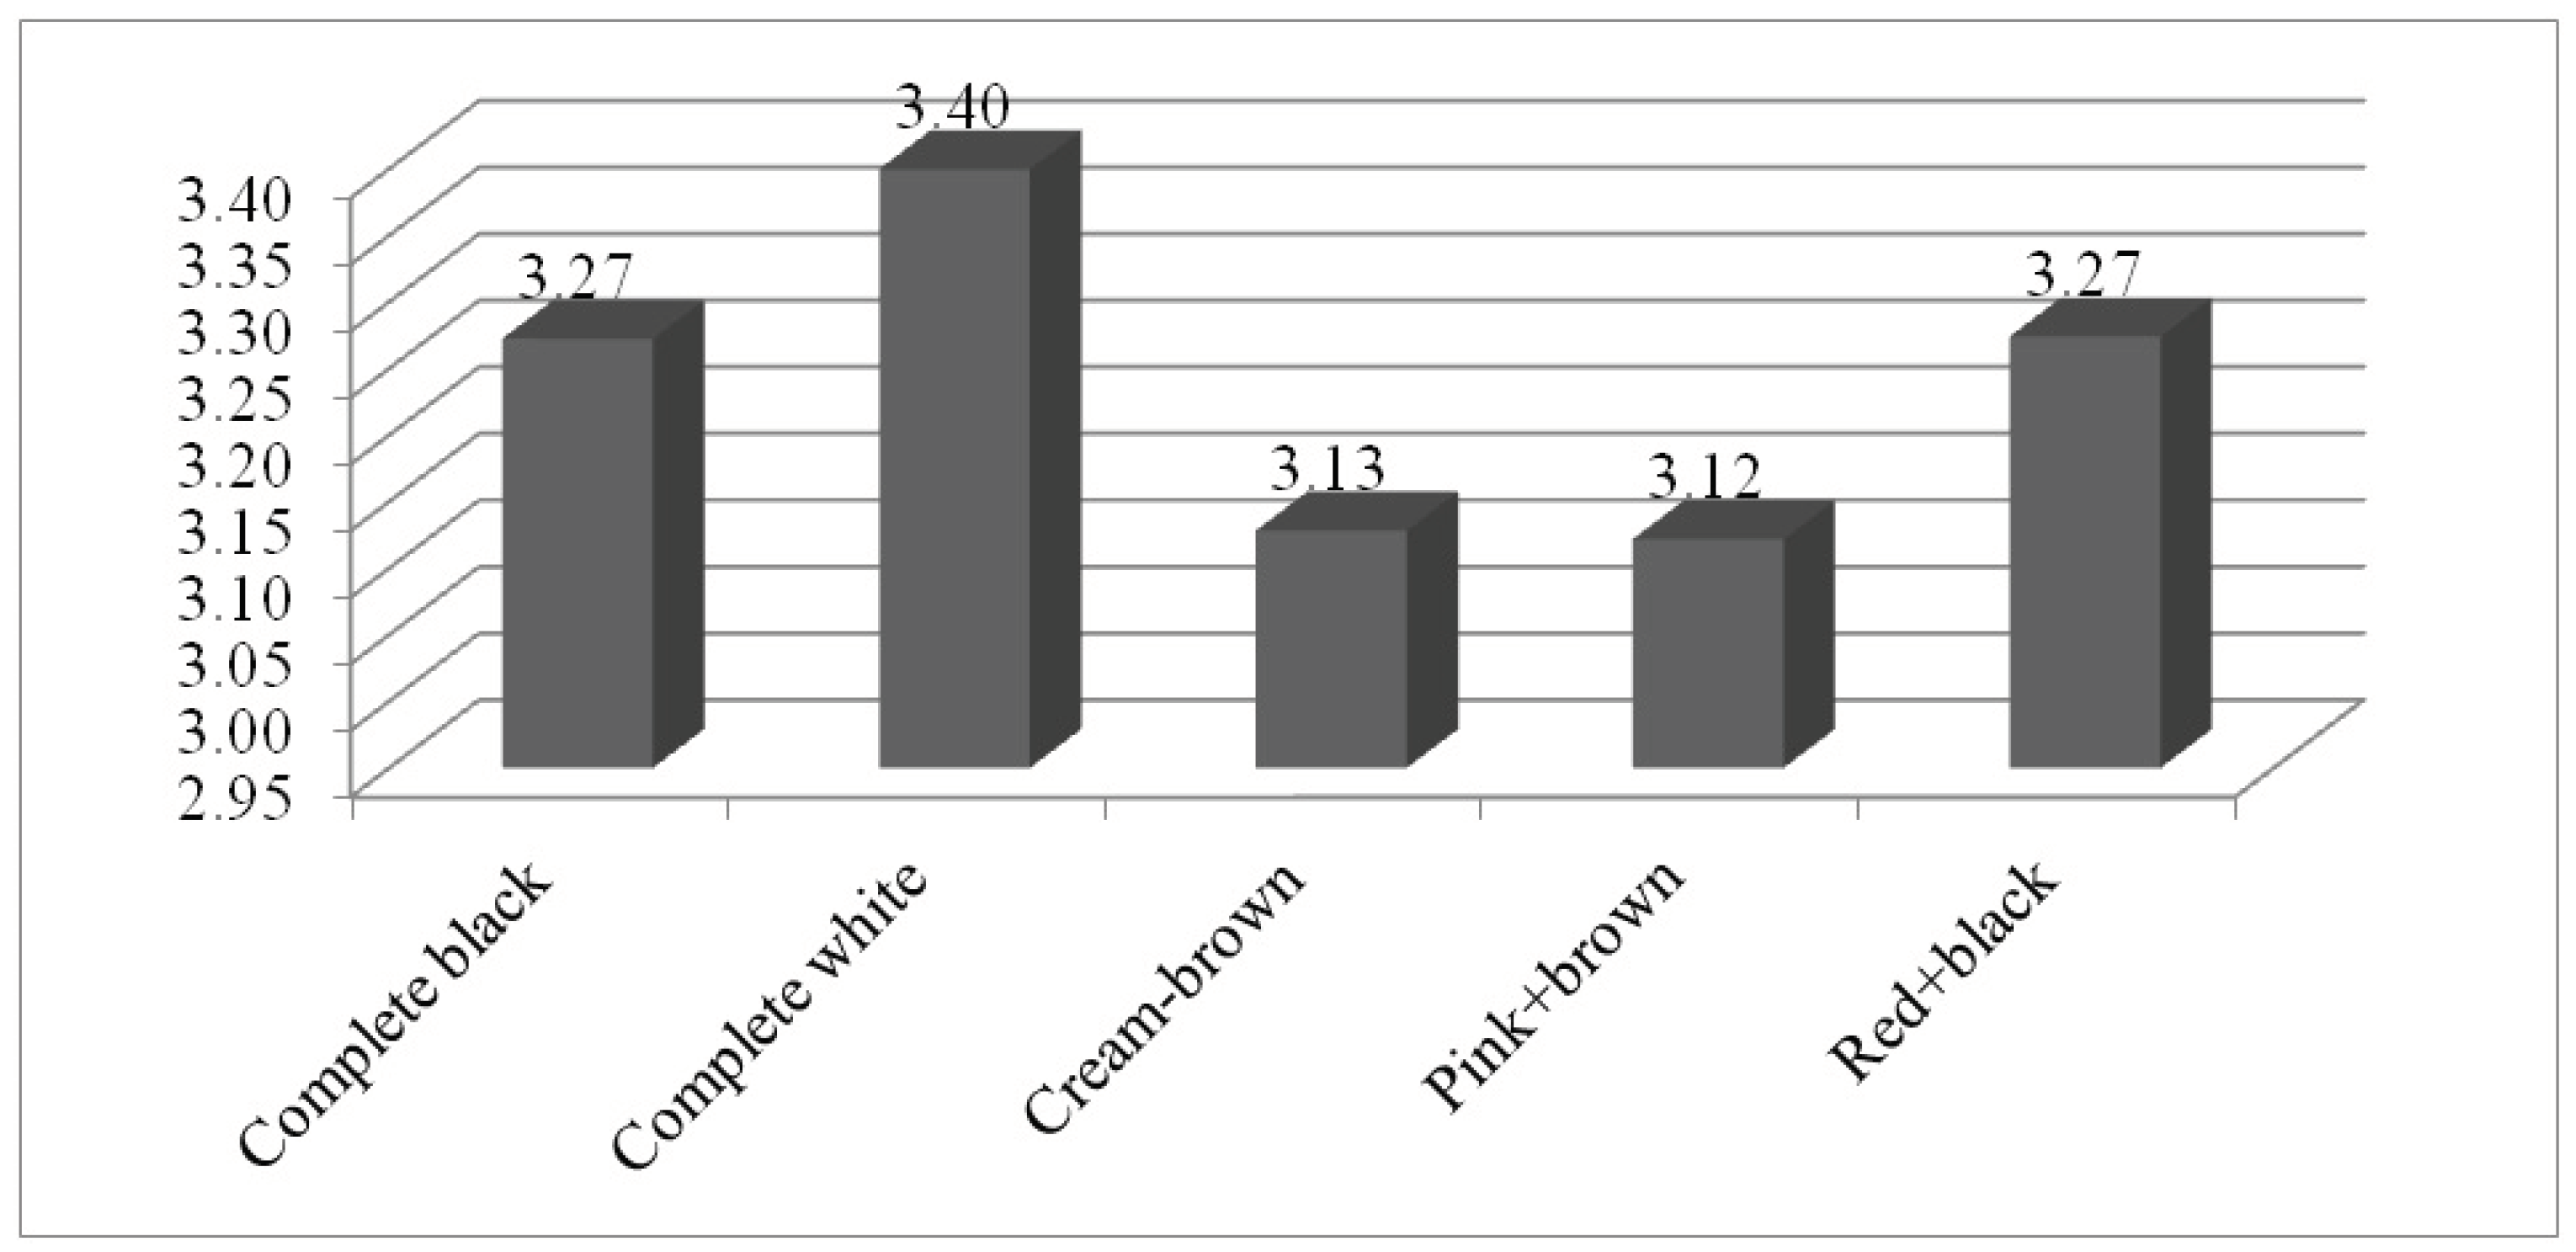
Figure 7.
Correlation matrix depicting the relationship between various chemical components of seeds in Abrus precatorius.
Figure 7.
Correlation matrix depicting the relationship between various chemical components of seeds in Abrus precatorius.
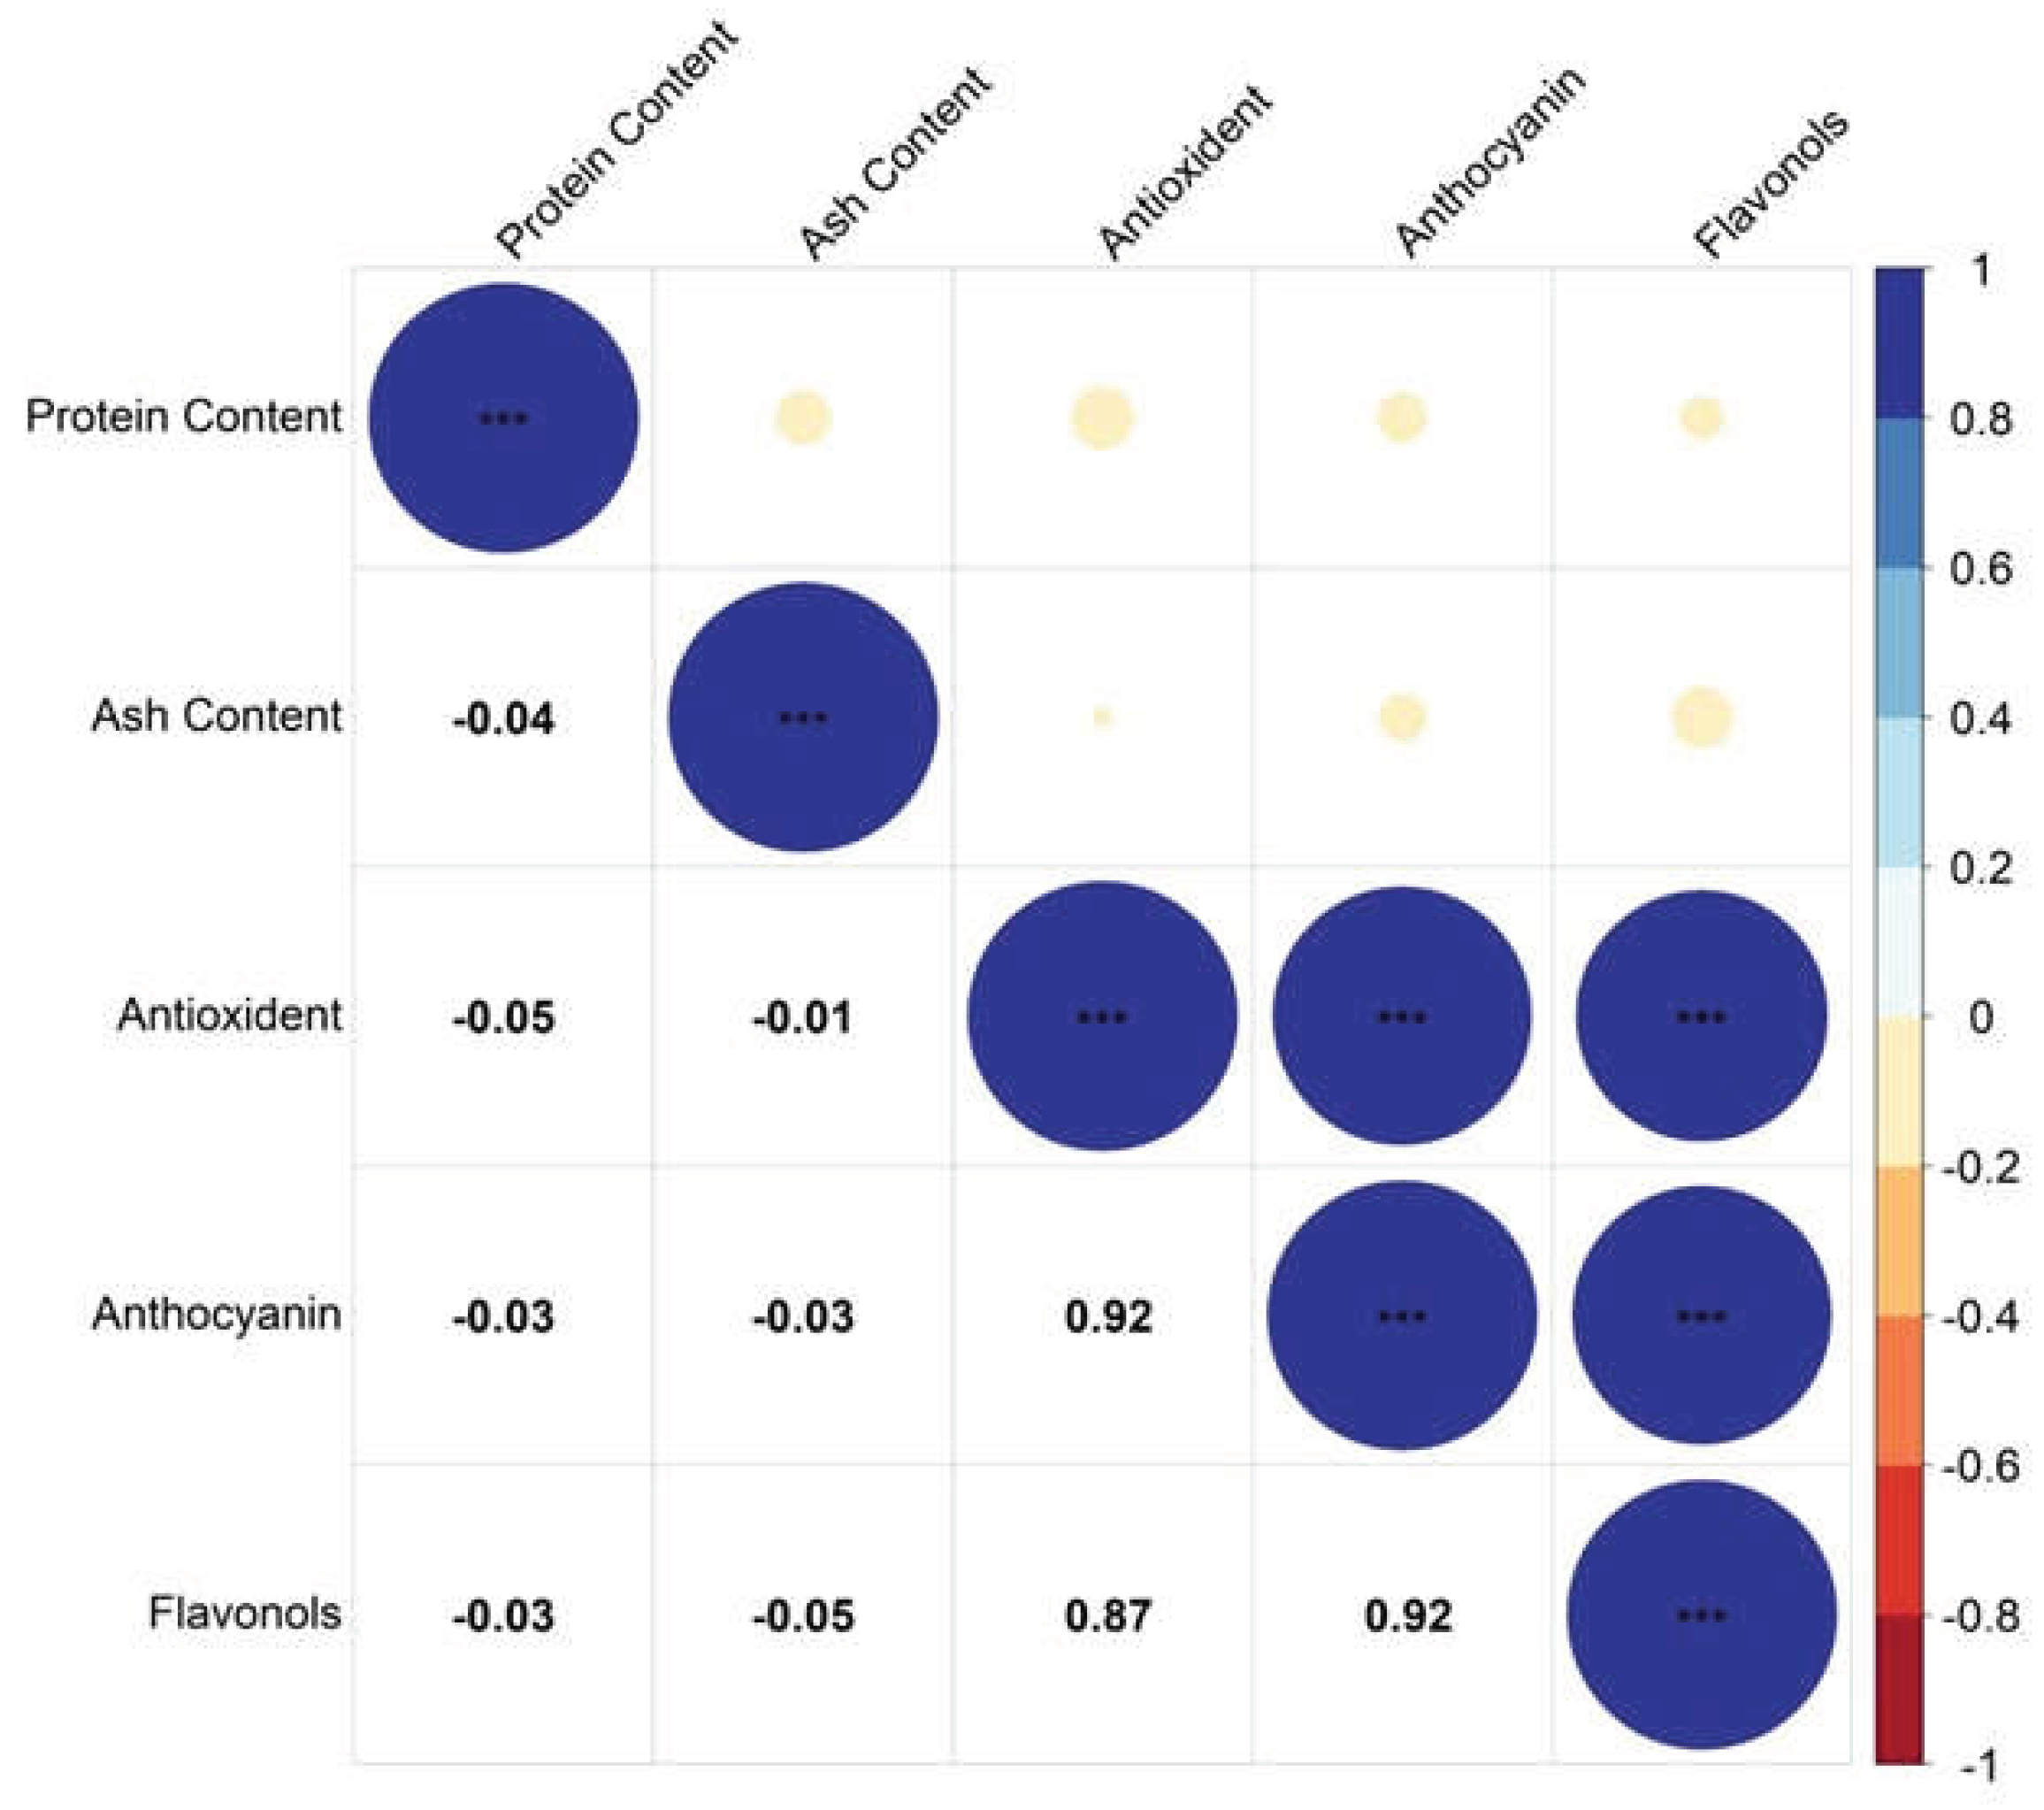
Figure 8.
Seed coat color diversity among the Abrus precatorius germplasm conserved at the Indian National Genebank. (a) Red + black combination; (b) Pink + brown combination; (c) Cream + brown combination; (d) Complete black color and (e) Complete white color.
Figure 8.
Seed coat color diversity among the Abrus precatorius germplasm conserved at the Indian National Genebank. (a) Red + black combination; (b) Pink + brown combination; (c) Cream + brown combination; (d) Complete black color and (e) Complete white color.
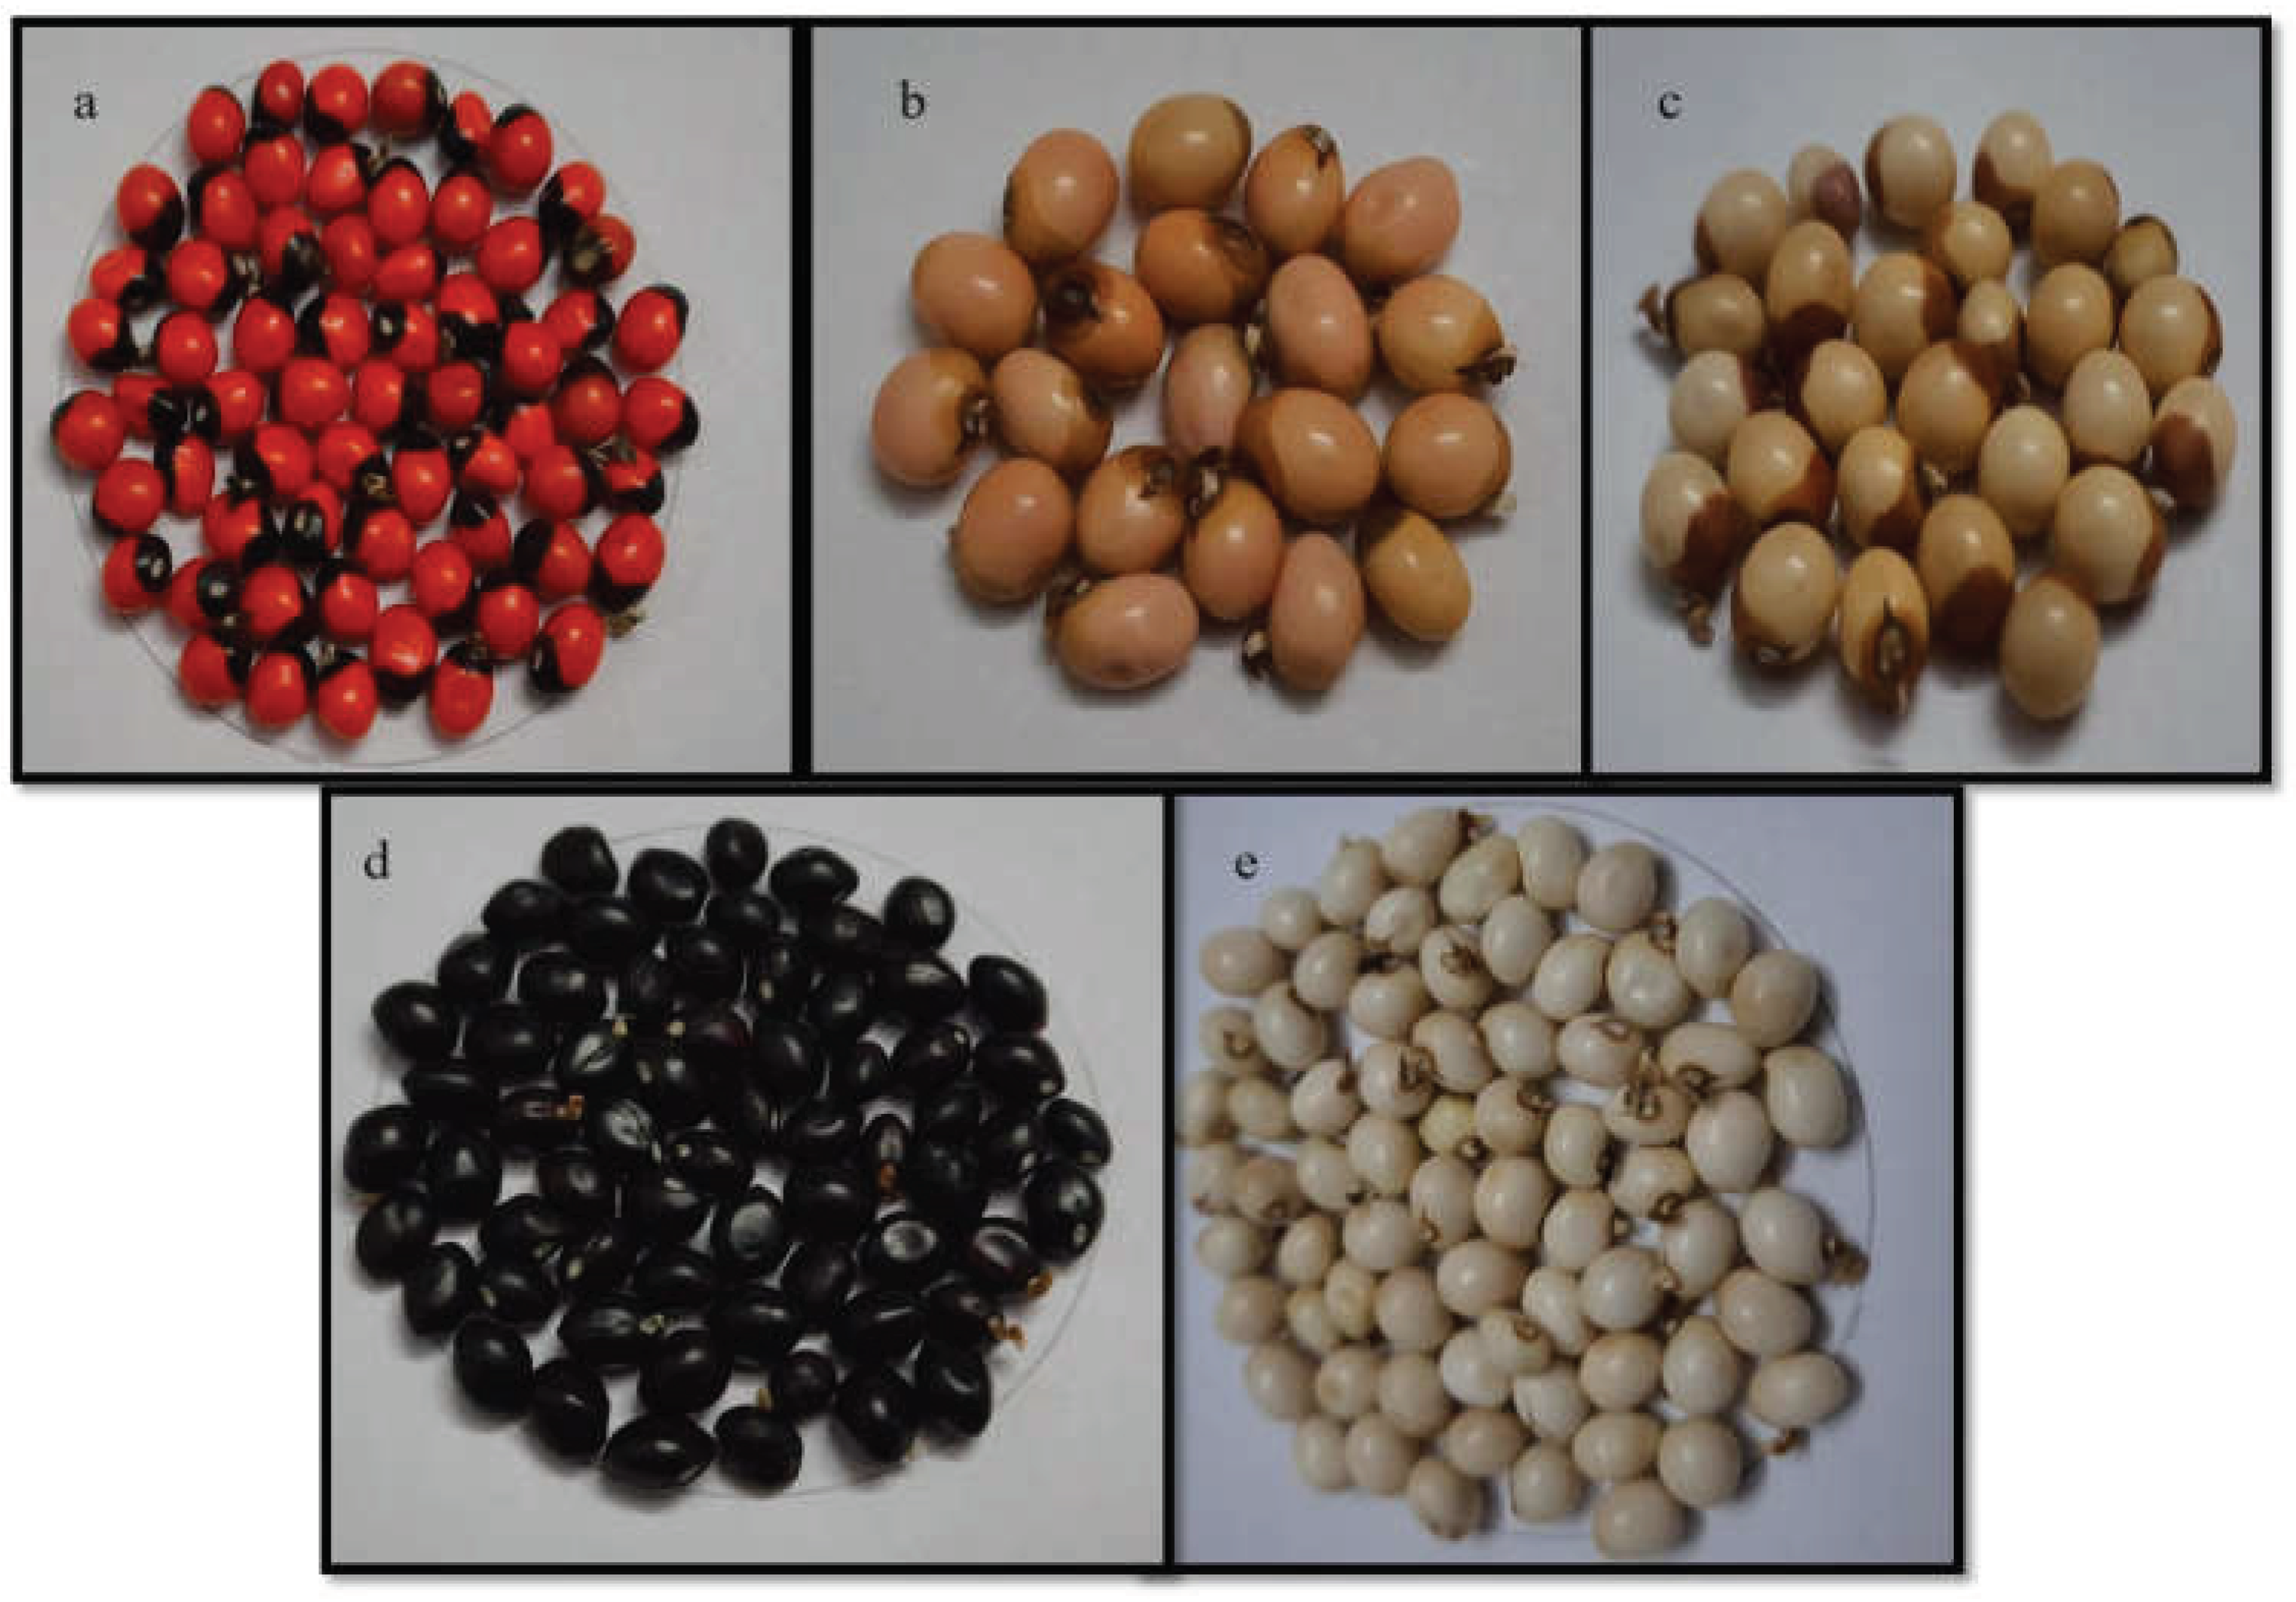

Table 1.
Descriptive statistics of Abrus precatorius accessions on the basis of biochemical parameters.
Table 1.
Descriptive statistics of Abrus precatorius accessions on the basis of biochemical parameters.
| Descriptive statistics |
Total monomeric anthocyanin (mg/ 100g of CGE) |
Flavonols (mg/g of QE) | Antioxidants(mg/g of GAE) | Protein content (%) | Ash content (%) |
|---|---|---|---|---|---|
| Mean | 23.04 | 42.23 | 10.24 | 17.99 | 3.28 |
| Standard Error | 1.22 | 0.83 | 0.45 | 0.11 | 0.04 |
| Median | 27.07 | 44.04 | 11.65 | 18.03 | 3.34 |
| Range | 51.95 | 40.80 | 13.42 | 5.23 | 1.93 |
| Minimum | 0.00 | 25.61 | 0.76 | 15.43 | 2.08 |
| Maximum | 51.95 | 66.41 | 14.18 | 20.67 | 4.01 |
Table 2.
The top three best performing accessions in Abrus precatorius accessions based on phytochemical analysis.
Table 2.
The top three best performing accessions in Abrus precatorius accessions based on phytochemical analysis.
| S. No. | Biochemical parameters | Best performing accessions |
|---|---|---|
| 1 | Total monomeric anthocyanin (mg/100g of CGE) | IC0605143 (51.95 mg/ 100g), IC0405311 (49.83 mg/ 100g) and IC0401666 (47.63 mg/ 100g) |
| 2 | Flavonols (mg/g of QE) | IC0405311 (66.41 mg/g), IC0401666 (64.31 mg/g) and IC0605143 (59.91 mg/g) |
| 3 | Antioxidants (mg/g of GAE) |
IC0405295 (14.18 mg/g ), IC0385638 (14.13 mg/g ) and IC0405311 (14.07 mg/g) |
| 4 | Protein content (%) | IC0385644 (20.67%), IC0538733 (20.41%) and IC0349819 (20.17%) |
| 5 | Ash content (%) | IC0418119 (4.01%), IC0310855 (4.00%) and IC0469946 (3.95%) |
Disclaimer/Publisher’s Note: The statements, opinions and data contained in all publications are solely those of the individual author(s) and contributor(s) and not of MDPI and/or the editor(s). MDPI and/or the editor(s) disclaim responsibility for any injury to people or property resulting from any ideas, methods, instructions or products referred to in the content. |
© 2024 by the authors. Licensee MDPI, Basel, Switzerland. This article is an open access article distributed under the terms and conditions of the Creative Commons Attribution (CC BY) license (https://creativecommons.org/licenses/by/4.0/).
Copyright: This open access article is published under a Creative Commons CC BY 4.0 license, which permit the free download, distribution, and reuse, provided that the author and preprint are cited in any reuse.


