
Submitted:
30 March 2024
Posted:
01 April 2024
You are already at the latest version
Abstract
Theoretical and experimental approaches have been applied to study the polymer physics under-lying compaction of DNA in the bacterial nucleoid. Knowledge of the compaction mechanism is necessary to obtain a mechanistic understanding of the process of segregation of replicating chromosome arms (replichores) during the cell cycle.
In the first part of this review light microscope observations are discussed that have demonstrated that the nucleoid has a lower refractive index and thus a lower density than the cytoplasm. A polymer-physical explanation for this phenomenon was given by the theory of Theo Odijk pro-posed in 1998. By assuming a phase separation between nucleoid and cytoplasm and by imposing equality of osmotic pressure and chemical potential between the two phases, a minimal energy situation is obtained in which soluble proteins are depleted from the nucleoid, thus explaining its lower density. The theory is compared with recent views for DNA compaction that are based on mere exclusion of polyribosomes from the nucleoid or on the transcriptional activity of the cell. These new views raise the question of whether they can still explain the lower refractive index or density of the nucleoid.
In the second part of this review the question is discussed how DNA segregation occurs in Esche-richia coli, in the absence of the so-called active ParABS system, present in the majority of bacteria. How is entanglement prevented of nascent chromosome arms, generated at the origin in the pa-rental network of the E. coli nucleoid? The observations of the groups of Sherratt and Hansen in 2006, that the four nascent chromosome arms synthesized in the initial replication bubble, segre-gate to opposite halves of the sister nucleoids implies that extensive intermingling of daughter strands does not occur. Based on the hypothesis that leading and lagging replichores synthesized in the replication bubble, fold into micro-domains that do not intermingle, a passive "four-excluding-arms model" for segregation is proposed. This model implies that the key for seg-regation already lies in the structure of the replication bubble at the very start of DNA replication; it explains the different patterns of chromosome arms as well as the segregation distances between replicated loci as experimentally observed.
Keywords:
bacterial nucleoid
; phase-contrast microscopy
; DNA polymer physics
; protein depletion
; chromosome arms
; replication bubble or orisome
; active and passive DNA segregation.
1. Introduction
In contrast to the chromatin in eukaryotic cells, bacterial DNA occurs free in the cell, not surrounded by a membrane. Nevertheless, the DNA can be observed as a distinct, central region, called the nucleoid. What macro-molecular interactions or activities induce this phase separation, compact the DNA and prevent it from dispersing throughout the cytoplasm?
Already in 1956, Mason and Powelson [1] showed by phase-contrast microscopy of cells grown in rich medium and supplemented with gelatin, that a bright, central structure expands and divides in step with the growing cell. This light appearance of the nucleoid structure suggests that it has a low refractive index and thus a low density, indicative of a lower protein concentration. At that time, it was still assumed that bacteria contained “nuclei” or nuclear structures and that they possessed “a mitotic apparatus consisting of a centriole and spindle” (see for a discussion of the changing views of the nucleoid Robinow and Kellenberger [2]).
Why is the DNA not dispersed throughout the whole cell, but does occur in distinct regions as observed by phase-contrast microscopy? This question has been studied by many groups applying molecular dynamics simulations [3,4] and theoretical computations based on equilibrium statistical mechanics [5,6]. These involve formulations of the free energy of the system according to models for interactions between the supercoiled DNA and macromolecular crowders that cause the compaction of the nucleoid. Whereas Odijk’s so-called depletion theory [5], merely considered the interaction of supercoiled DNA with soluble proteins (see Appendix A), the approach of the Männik-group [6,7] also considered the crowding interaction of DNA with larger particles like polyribosomes. Both theories predict the phase separation between cytoplasm and nucleoid, but the question remains whether the low refractive index as observed by phase contrast microscopy can be confirmed. Here, this question is discussed by comparing the properties of cells described in both approaches (see Appendix B).
Nucleoid compaction can also be explained if the solvent quality of the cytoplasm for DNA is considered [8] or through transcriptional activities that induce folding of transcribed and supercoiled regions [9,10]. Also for these studies is the question whether the low refractive index of the nucleoid is ensured.
The mechanism(s) of DNA compaction can be expected to influence DNA segregation. Because replication and segregation go hand-in-hand, the movement of replicated DNA strands through the parental, un-replicated DNA network already starts at initiation within the so-called initial replication bubble or orisome [11]. From here, the newly synthesized chromosome arms, containing the leading and lagging strands, have to segregate to separate halves of the daughter nucleoids [12,13]. There are two views that try to explain the disentanglement of daughter strands and the formation of daughter nucleoids: (i) an active segregation mechanism like the tripartite ParAB-parS system [14], occurring in the majority of bacterial species [15,16,17]. The system may be helped by SMC (structural maintenance of chromosome) proteins and loop extrusion mechanisms [18,19], or (ii) a passive segregation process based on de novo DNA synthesis. Here, it is proposed that the newly synthesized chromosome arms or replichores do not become mixed or entangled because of their physical differences (explained in Section 4.1, Figure 8). From initiation onwards, the arms are maintained as separate entities, excluding each other and enlarging by de novo DNA synthesis in the meshwork of parental DNA. This is proposed in the “four-excluding-arms model” that explains not only how the two daughter strands segregate into the prospective daughter cells, but also how each chromosome arm ends up in an opposite halve of the two newly-formed nucleoids.
2. The Nucleoid as a Low-Density Structure
2.1. Immersive Refractometry
The observations (Figure 1A) of Mason and Powelson [1] were confirmed by studies using PVP [20] or bovine serum albumin (BSA; Figure 1B; [21]) to increase the refractive index of the external medium surrounding the cells. As discussed by Barer et al. [22] such an increase in the density of the immersion medium reduces the light scattering of the dense bacterium and abolishes the disturbing halo around the cell. At the same time, the phase contrast of internal structures within the cell, like the nucleoid, is increased. In addition, this immersion technique enables the estimation of the refractive index and thus of the density of the internal structure, when its light intensity is equal to that of an external medium with known concentration. Mason and Powelson [1] argued that the observed low-refractive index structures did not arise from an effect of the gelatin on the cell, because the same structures could be seen after fixation and specific staining of DNA with the Feulgen reaction.
Mason and Powelson [1] also showed how the bright, central structure in the cells expands and divides in step with the growing cell. Likewise, the movie made by Yamaichi and Niki [23] from rapidly growing E. coli cells immersed in gelatin showed how the light nucleoid areas enlarge and divide (Figure 1C), confirming that DNA replication and nucleoid segregation go hand in hand [24].
Recently, a reduction in density of the nucleoid as compared to the cytoplasm was confirmed by Spatial Light Interference Microscopy (SLIM). Using this quantitative phase-contrast microscope, Oldewurtel et al. [25] observed in E. coli cells growing in media without gelatin or BSA, a decrease in refractive index of about 10-30% at the site of the nucleoid. It is reassuring that the low-refractive index structures could also be directly visualized in growing bacteria by optical diffraction tomography (ODT; also called digital holographic microscopy, DHM; [26]), without immersion of cells in a dense medium (Figure 2). In this study the nucleoid shows (Figure 2) a lower refractive index (1.35) compared to that of the cytoplasm (1,37); these values are somewhat lower than those obtained by Valkenburg and Woldringh [27] discussed below.
Applying immersive refractometry (Figure 3), Valkenburg and Woldringh [27] determined the refractive indices (RI) of cytoplasm and nucleoid in slow growing E. coli B/r cells. They also calculated theoretical RI values, using both the data of Churchward and Bremer [28] for the macromolecular composition of E. coli and the measurements of cellular and nucleoid volumes of their cells. For these volume measurements an early confocal scanning light microscope (CSLM) was used, developed by Brakenhoff et al. [29]. (see for a review of its rediscovery Nanninga, [30]). This microscope showed an improved optical resolution and visualized the unstained nucleoid by mere absorption contrast (see Figure 1 in [27]). Assuming that the nucleoid only contained DNA and that all proteins and RNA were located in the cytoplasm, the theoretical value for the RI of nucleoid was lower than the experimental value. To match both RI values, it was proposed that the nucleoid must contain, besides the DNA, about 8.6% of proteins, whereas the cytoplasm would contain 21% protein and RNA. These values resulted in a reduction of the macromolecular density for the nucleoid of about 30% as compared with the density of the cytoplasm [27]. In the next sections, the question is discussed whether these observations can be explained on the basis of polymer-physical considerations.
2.2. Polymer-Physical Explanation of a Low-Density Nucleoid by Odijk’s Depletion Theory
Can the phase separation and the reduced density of macromolecules in the nucleoid as compared to that of the cytoplasm described above (Figure 1, Figure 2 and Figure 3), be explained by polymer physical interactions between DNA and proteins? Although it is generally accepted that macromolecular crowding, both in vitro [32,33] and in the cell [7] can lead to DNA compaction, the specific role of different crowders like soluble proteins or polyribosomes has remained unclear. Here, the free-energy approach of Theo Odijk, his so-called depletion theory [5], based on supercoiled DNA self-interactions and DNA-protein cross-interactions [34], is shortly summarized from the viewpoint of a biologist (see also the supplementary information in ref. [35]).
Based on concepts of equilibrium statistical mechanics [36], polymer physicists regard linear, double-stranded DNA as a semi-flexible, polyelectrolyte polymer consisting of stiff, freely-jointed segments in which chemical details like the sequence of base pairs are not considered. The segments can move relative to each other and because of the thermal motion that causes the surrounding solvent molecules to bounce continuously against the polymer (with an energy of ~1 kBT), the elastic DNA rod undulates and takes the shape of a worm-like chain (Figure 4a). However, the chain is also resistant to bending, which is reflected by straight segments with a so-called persistence length, P. The chain can thus be viewed as a random walk with a step length longer than P, also called the Kuhn length, A, which is a statistical entity with the length of about 2P. Fluctuations of the long, thin chain due to Brownian motion, make the Kuhn segments to collide with each other causing the so-called excluded volume effect. Because the chains have a finite volume that is excluded to the rest of the chain and because a chain cannot pass through itself, the rod-like segments exclude a volume with the size of A2deff, representing an expansion or swelling of the long chain (see also Figure 3 in [37]).
These considerations for linear DNA also hold for plectonemic, supercoiled DNA. Under the bombardment of solute molecules, the superhelical DNA will also behave like an elastic structure causing a strong excluded volume effect through interactions between supercoiled Kuhn segments. We now consider a “superwormlike chain” to have a persistence of Ps and an effective Kuhn-length of As = 2 Ps (Figure 4b).
Equations for the free energy of the principal excluded volume interactions between the segments of the superhelical DNA itself and the steric, repulsive cross-interactions between the DNA double helix and soluble proteins are discussed in the Appendix A. Starting-point for the calculations in Odijk’s depletion theory [5] is obtained by formulating the excluded volumes for both interactions (Bself in Figure 4b and Bcross in Figure 4c). These expressions, scaled by thermal energy (kBT and by the total volume of the system (Vcell), give us the free energy of the supercoiled DNA and of its interaction with soluble proteins (Fcross). For the latter expression, only the high number of small, soluble proteins (~106) is considered, while the possible contribution of large polyribosomes was omitted; because they occur in a much smaller number (~8000), their influence on the energy balance as calculated in Appendix A was assumed to be negligible [5].
The total free energy of the nucleoid Fnuc, when occurring dispersed throughout the cell, can be expressed as the sum of three free-energies, Fcross, Fself and a so-called mixing term, Fmix, expressing the electrostatic repulsion between the soluble proteins:
In view of the phase contrast microscope observations (Figure 1), it can be assumed that a phase separation exists between nucleoid and cytoplasm. By taking the derivative of the above equation with respect to cell volume we obtain the force for compaction or osmotic pressure, π. By taking the derivative with respect to the number of proteins, we obtain the force for mixing or chemical potential, μ. A minimal free energy situation or thermodynamic equilibrium is imposed by equalizing these two forces throughout the two phases (Figure 4d). This results in two so-called co-existence equations (see Equations (16) and (17) in [5] and Appendix A). From these two equations and a third equation on the protein volume fraction of total proteins, the protein volume fractions in cytoplasm (vc) and nucleoid (vn), as well as the volume of the nucleoid (Vn) can be calculated and compared with the experimental values. It should be noted that the full- thermodynamic equilibrium here assumed for the calculations, does not hold for the living cell which is in a stationary dynamic (or steady-state) equilibrium.
As shown in Appendix A, interaction between the superhelical DNA and the soluble proteins (Figure 4c) “overwhelms” the self-energy of the DNA (Figure 4b), leading to the observed phase separation in a minimal energy situation. The results [5,34] indicated that the protein volume fraction in the cytoplasm of vc = 0.166 is much larger than the protein volume fraction in the nucleoid (vn = 0.06), as calculated for a nucleoid volume of about Vn = 0.1, explaining the observed refractive index difference between nucleoid and cytoplasm in the phase contrast microscope (Figure 1). However, as discussed in the next section, new estimates have indicated that the volume of the nucleoid may be much larger (about 3-fold; see Table 1 below).
(Here, it should be mentioned that Theo Odijk has re-evaluated the formalism of the equations developed for his 1998-depletion theory, with the tentative conclusion that multiple solutions could be possible. Regarding the effect of polyribosomes (see section 3.1 below), these could cause a perturbation not much larger than 10%; he will come back to this problem in future work (personal communication).)
2.3. Fluorescence Microscopy: New Estimates of Nucleoid Volume
Because in slow-growing E. coli cells, the nucleoid has a simple, rod-like shape, its volume has been estimated by several groups in such cells using fluorescence microscopy. The DNA was either tagged with fluorescent proteins or stained with DAPI. In Table 1 their results are compared with the early measurements of unstained E. coli B/r cells [27] obtained with a CSLM. The rare pictures that have been made with the CSLM show an exceptionally small nucleoid with a volume of 0.07 µm3. A slightly larger volume of 0.12 µm3 was estimated from an archived, original print marked with the original instrumental CSLM-magnification.
The measurements obtained from fluorescent microscope images of E. coli K-12 cells show a much larger nucleoid volume (0.23-0.27 µm3, column 4 in Table 1). Although with the CSLM, we look at the nucleoid visualized by light absorption [29] and in the fluorescence microscope at the light emitted from fluorochrome excitation, it is unlikely that this can explain the different volume measurements. We therefore decided to re-measure images obtained from the same E. coli B/r strain grown under similar conditions (unpublished growth experiment by P.G. Huls, 2001). As shown in Table 1 (last row), three nucleoid volumes were obtained, depending on the threshold used (Figure 5; see Table A2 in Appendix B).
An exceptionally large nucleoid volume (0.7 μm3) has been measured by the group of Jacobs-Wagner, using the Oufti open-source software package [8]. Other estimates by the groups of Kleckner [38] and Männik [7], arrive at values of 0.27 and 0.23 µm3 for nucleoid volume in newborn or early cell-cycle cells, comparable to the 0.24 µm3 value obtained for the DAPI-stained cells of Huls (see Table 1) at a threshold of 0.5 (Figure 5b). In the next section, these larger nucleoid volumes will be discussed and used for comparing the different polymer-physical approaches of Odijk [5] and the group of Männik [6].
3. Different Views on DNA Compaction
3.1. Compaction through Polyribosome Exclusion
In his analysis, Odijk [5] only considered the high number of soluble proteins (~106 per cell), because it was assumed that larger crowder particles, being present in a relatively small number like ribosomes (8000 in slowly growing cells), would exert a negligible influence on the energy balance. However, later studies proposed that crowders like polyribosomes may well have an effect on nucleoid compaction because of their larger size. The groups of Bae-Yeun Ha [3] and Jaan Männik [7] have implemented Odijk’s free-energy approach, while taking into account not only the numbers, but also the size of the crowders. It should be noted that the nucleoid compaction here discussed, is the effect of steric interactions between crowders (proteins, (poly-)ribosomes) and DNA. A different view, discussed in Section 3.2 below, is that nucleoid compaction is not caused by steric interactions between DNA and crowders, but by the poor solvent quality for DNA in the cytoplasm.
In the study of the group of Männik [7], compaction of nucleoid volume was measured by decreasing the volume of the cell through an increase of the osmolality of the suspension medium (a hyperosmotic shock with NaCl) or by mechanical squeezing of cells in a microfluidic chip in which pressure could be applied. Their observations show that a 30% increase in crowder concentration can cause a three-fold decrease in nucleoid volume in living cells. For measuring nucleoid volume small cells in the early stage of the cell cycle were used, because they contain nucleoids with a simple ellipsoidal shape that can be measured relatively easy (see Table 1, row 4, column 3 and 4).
In an elaborate, theoretical follow-up of the experimental work of Yang et al. [7] the group of Männik has further investigated the different contributions of crowder species like soluble proteins as small crowders (diameter 5 nm) and polyribosomes as large crowders (radius of gyration 35 nm), interacting with supercoiled DNA (see Figure 1 in [6]). Their work is here summarized in the nucleoid compression curve of Figure 6. The curve shows that a rapid exclusion of polyribosomes from the nucleoid (green, dashed line) already generates a phase separation between cytoplasm and nucleoid (red, solid line), in a transition from cell (a) to (b) in Figure 6. The solid, red line shows that under the normal physiological condition about 95% of the soluble proteins are still present in the nucleoid (blue, dashed line). Only upon further increase of the concentration of small crowders, a decrease in nucleoid volume is obtained accompanied by depletion of soluble proteins from the nucleoid (Figure 6; transition from cell (b) to (c)).
The proposal of Männik and coworkers that polyribosomes are the dominant factor in establishing a phase separation between cytoplasm and nucleoid is based on considering hypothetical cells where only polyribosomes are present. The compaction curve of these simulated cells shows initially the same phase separation as when polyribosomes are present together with proteins. However, with only polyribosomes as crowder, relative nucleoid volume (Vnuc/Vcell) decreases not further than ~0.4 (Figure 2b in [6]). In addition, the simulation shows that when only proteins are present, a mixed state of the nucleoid is maintained (compare cell (a) in Figure 6). Phase separation (cell (b) in Figure 6) now only occurs at a relative high protein number when nc/nc0 > 1.4 (cf. Figure 2c in [6]). The very large effect of polyribosomes is contrasted by the observations of Cunha et al. [33] that small polyethylene glycol molecules (radius of gyration ~1.5 nm) are effective in compacting nucleoids isolated from E. coli.
In the theoretical approach of the Männik-group, polymer physical assumptions are made and input values are used that differ from the work of Odijk [5]. This complicates a comparison between the two approaches. For instance, minimalization of total free energy of the cell, is obtained by Chang et al. [6] using best-fit values for the parameters g and a of their Equation (2). By applying this equation as formulated by Cunha et al. [33], the free energy of DNA self-interactions, Fself, includes the crosslinking of the DNA in the nucleoid. As a result, the Fself has a somewhat lower value (0.58 x 10⁴ kBT) than the value (1.9 x 10⁴ kBT) obtained by Odijk [5] who considered the mere excluded volume interaction between the supercoiled Kuhn segments.
In the approach of Odijk [5], energy minimalization is obtained by equalizing the chemical potentials and osmotic pressures in nucleoid and cytoplasm (Figure 4d), as explained in Appendix A. Furthermore, Chang et al. [6] used different input values regarding supercoil persistence length (50 nm versus 80 nm in Odijk’s model), the supercoil contour length (493 µm versus 630 µm, considered by Odijk) and the number of supercoiled (Kuhn) segments (Ns = 6700 versus 4000 estimated by Odijk, [5]). In addition, different input values have been used for ribosomes (6000 versus 8000 considered by Odijk) and for the total number of soluble (non-ribosomal) proteins in cytoplasm and nucleoid (0.23 x 10⁶ versus 1.6 x 10⁶ considered by Odijk; see Table A2 in Appendix B); this 7-fold difference could have a great impact on the different conclusions. In the work of the Männik-group [6], the number for soluble proteins was again obtained by fitting their model to the experimental data (see Figure 1c in [6]), whereas Odijk’s value was obtained from the physiological measurements of Bremer and Dennis [43].
Männik and co-workers [6] also emphasized that “the experimental uncertainties for several parameters entering the expression of the total free energy are considerable.” This certainly holds for the volume of the nucleoid (see Table 1) and for the number of soluble proteins assumed to be present in slow growing E. coli cells (see Figure 7 below). These are the parameters that determine the density and thus the refractive index (RI) of nucleoid and cytoplasm, as discussed in Section 2.1. If phase separation is only the effect of the exclusion of polyribosomes and if soluble proteins would diffuse throughout the cell, what protein-concentration difference and thus RI difference between cytoplasm and nucleoid can be expected? To evaluate this question, a comparison is made in Figure 7 of cytoplasmic and nucleoid volumes and of numbers of ribosomal and soluble proteins between an average E. coli K-12 cell as described in [6] and of the re-measured E. coli B/r cells of Huls (2001), both presented in Table 1. A detailed description of the relevant assumptions and data is given in Table A2 of Appendix B. The comparison shows that for the cells in [6], a reduction of the RI-value in the nucleoid relative to the cytoplasm of 33% is obtained (Figure 7a). This is in agreement with the reduction observed in [27] as described in Section 2.1. For the cells of Huls (2001), the RI-reduction is only 22% (Figure 7b), which can be ascribed to the higher protein concentration assumed to be present in these cells. It suggests that given the assumptions made for this cell, additional depletion of soluble proteins from the nucleoid to a concentration of ~13 mg/ml and an increase of protein concentration (soluble and ribosomal) in the cytoplasm to~ 20 mg/ml is needed to obtain a RI-reduction in the nucleoid of about 34% (see Table A2 in Appendix B).
The total volume fraction of soluble proteins in the cells of [6] calculated from Figure 7a is 0.017; the protein volume fraction calculated for the cells of Huls (Figure 7b) is 0.101. Future estimates and measurements will have to show whether the 7-fold lower input value for soluble proteins as used in [6] is realistic.
3.2. Compaction through Transcriptional Activities
A different approach to DNA compaction was taken by the group of Jacobs-Wagner [8]. Their study is not based on free-energy minimization of steric self- and cross-interactions, but on the solvent quality of chromosomal DNA in the cytoplasm. As a starting point, they are considering the DNA to be a “random-coil polymer” (see Figure 1A of [8]), in which the compacted DNA chains will contact each other and form a network with cross-points depending on the DNA concentration and the quality of the cytoplasmic solvent, consisting of water, proteins, ribosomal subunits and polyribosomes. The distance between the cross-points, the so-called correlation length, ξ, determines the mesh size of the network. They calculated the solvent quality theoretically, using their Equation (1) in [8]. Important parameters for this equation are a Kuhn length for the double helix of 60 nm (rather than 90 nm as given in Figure 4a), a DNA concentration in the nucleoid of ~7 mg/ml, which is about 3x lower than the value obtained in other studies (see Table 1) and an average mesh size of 50 nm. This last value was determined experimentally using probes (GFP-µNS particles) varying in size from 50 to 150 nm. The observations showed that the apparent average mesh size in the nucleoid must be around 50 nm (see Figure 2C,F in [8]). With the above input values, the so-called Flory-exponent was calculated. This exponent is indicative for the solvent quality and gave a value of ν = 0.36. Such a low value (< 0.5) implies that the cytoplasm behaves as a poor solvent for DNA. Here, it should be emphasized that in contrast to the branched DNA superhelix models used by Odijk ([5]; see also Figure 5 in Wegner et al., [44]) and Männik and coworkers ([6]; see also Figure 3B in [34] and [45]), the group of Jacobs-Wagner only considered circular, non-supercoiled DNA for their calculations and poor-solvent simulations (see Figure 3 in [8]).
The results of their experiments on the spatial distribution of (poly)ribosomes and on the effect of transcription inhibition by rifampicin, causing expansion of the nucleoid (see below), made the authors suggest that RNAs in general cause an effective poor solvent quality for DNA in the cytoplasm. These results [8] agree with recent super-resolution and single-molecule fluorescence-microscope studies (review: [46]), suggesting that large proteins [47] and free ribosomal subunits (~20 nm diameter) are able to diffuse through the nucleoid [48,49,50]. These microscopic observations suggest that the nucleoid does not deplete soluble proteins and larger particles (up to 20 nm diameter) and thus contains a heterogeneous mixture of DNA and cytoplasmic components (as suggested by the poor-solvent simulations in Figure 3 of [8]).
In a recent study, a different mechanism of DNA compaction has been described by Bignaud et al. ([10]; see for reviews [18,51]). Based on high resolution chromosome-conformation-capture analyses (Hi-C), Bignaud and coworkers propose that folding of the chromosome is obtained by transcription-induced supercoiled regions in association with SMC proteins. So-called transcription insulating domains (TIDs), that tend to contact each other and cluster together, are suggested to fold the chromosome and to function as its primary building blocks (see Figure 4l in [10]). Their contact maps reveal the occurrence of a succession of short, transcription-induced, compact domains alternating with unstructured, highly-expressed gene regions, that inhibit supercoil diffusion. Previously, Lioy et al. [52] already identified some ~30 chromosome self-interacting domains (or CIDs), with an average size of 150 kb. As to be expected, the Hi-C patterns induced by transcriptional activity disappeared upon inhibition with rifampicin (Figure 1b in [10]).
It is evident that the inhibition of transcription initiation by rifampicin, causing the dissociation of polyribosomes and of 70S ribosomes and the degradation of mRNA, must have a profound effect on the transcriptional units as described by Bignaud et al. in their Figure 4l [10]. If these transcriptional units play a role in chromosome folding, rifampicin is expected to annihilate compaction of the nucleoid. Indeed, rifampicin has been found to change the appearance of the nucleoid in all microscopic studies compilated in Table 2. Because growth rate [6] and the fixation procedure [51] have been suggested to influence nucleoid appearance, they are mentioned in Table 2. In 7 of the 18 studies, a full dispersal of the nucleoid has been noted, all in fast-growing cells; in 2 of these studies cells had been fixed (see column 2 and 3 in Table 2). In the other studies, the changed appearance was described as a radial contraction combined with a longitudinal expansion, both in fast and slow growing cells. An explanation for this behavior was proposed by Mondal et al. [53] from computer simulation studies: polyribosomes are preferentially localized at the endcaps of the cell, where the nucleoid becomes compressed axially. When rifampicin causes their dissociation, the nucleoid will expand in the long axis, while the ribosomal 30S and 50S subunits now form a thicker layer along the cylindrical wall, compressing the nucleoid radially. Some studies [48,54,55] seem to confirm this explanation, which predicts that there is still depletion of ribosomes and proteins from the nucleoid as described in Section 2.2 by the depletion theory of Odijk [5].
Where authors suggest that the nucleoid becomes fully dispersed (indicated in the last column of Table 2 with “yes”), it seems plausible that dissociated ribosomal subunits and soluble proteins fully penetrate the nucleoid, annihilating any phase separation between cytoplasm and nucleoid ([6]; see Figure 7a). This would imply that phase contrast microscopy of rifampicin-treated cells immersed in a high refractive index medium (see Figure 1A–C), would show no region in the cell with a lower refractive index. Future microscopic studies will have to solve the disagreements as evident from the studies compiled in Table 2.
The heterogeneous nucleoid structure proposed by Xiang et al. [8] on the basis of poor solvent simulations and by Bignaud et al. [10], will have to comply with the density difference visualized by phase-contrast microscopy (Figure 1) and must also be understood in terms of the polymer-physical and thermodynamic rules of equal osmotic pressure and chemical potential in the two phases as mentioned above in Figure 4d. The same holds for the proposal of Bakshi et al. [61] that the dissociated 30S and 50S ribosomal subunits can mix with DNA causing nucleoid expansion.
4. Segregation and Movement of Chromosome Arms (Replichores)
4.1. Replichore Movement to Opposite Halves of the Nucleoid
As depicted in Figure 8a, the circular chromosome of E. coli can be divided in two chromosome arms, also called left (L) and right (R) replichores, that run from origin to terminus. Bi-directional replication from the origin results in a so-called replication bubble at initiation, in which two nascent pairs of replichores (red and blue), connected by an origin, represent the two daughter chromosome arms. These have to segregate to the two prospective daughter cells. When studying the necessary movement of daughter arms and their left and right replichores, the physical properties of nucleoid compaction described in the previous sections has to be taken into account. This implies properties like the permeability of the nucleoid to macromolecules involved in transcription and translation. As described by Kohiyama et al. [64] the replication bubble starts with a DnaA-based hyperstructure that integrates the many proteins involved in metabolic and regulatory pathways necessary for the initiation of replication. Here, however, only the structural aspects of the nascent chromosome arms and their behavior during segregation are considered. Does the segregation process take place in a heterogeneous region where small and larger protein complexes (polyribosomes) are mixed with the nucleoid as suggested in some fluorescence microscope studies [48,49,50]? Or does segregation occur in a relatively homogeneous nucleoid where small, soluble proteins are depleted to some extent from the nucleoid as proposed by Odijk ([5]; see also [34])?
Studying the paths of fluorescent loci in slow-growing E. coli cells by time-lapse experiments, the groups of Sherratt [12] and Hansen [13,65] have found that the E. coli chromosome is arranged with its left and right replichore lying separated in opposite halves of the nucleoid (Figure 8b). Their important observations and views (reviews [66,67,68] form the basis for the discussion below and as well for the speculative proposal of a passive segregation model in Section 4.2. Using the constructs of Flemming Hansen in which the origin and two loci on the left and right replichore were tagged with three different colors, the observations of Wang et al. [12] and of Nielsen et al. [13] could be confirmed by measuring the simultaneous movement of the three loci [63]
Figure 8.
Schematic representation of the circular chromosome and of the localization of replichores in the nucleoid. (a) Left and right chromosome arms (replichores) with replicated origins (green circles) in the replication bubble. During the replication or C-period [69], the arms are replicated by the two replisomes (red and blue triangles), each synthesizing a leading strand and a lagging strand with Okazaki-fragments (short triangles). Several fluorescently labeled loci (red and blue stars) are indicated, that will show the position of the arms in the growing cells of Flemming Hansen (see below). The two daughter replichores (dashed arrows) will each end up in the prospective daughter cells with their replichores in two opposite halves of the nucleoid. The origin localizes at mid-cell between the left and right replichores that are connected by the terminus (black cross). (b) Position in a slow-growing E. coli cell (cf. Figure 5), with the two chromosome arms in the so-called transversal arrangement. Initiation of DNA replication at mid-cell has formed a replication bubble, which results in a replichore pattern indicated as Left-ori-ori-Right (L-O-O-R). The terminus occurs in a stretched connection between both replichores and migrates after duplication and cell division from the new pole to the cell center. (c) For comparison, a longitudinal arrangement of chromosome arms (cf. Caulobacter [16] or Agrobacterium [17]). Replication bubble is positioned at the stalked cell pole; the terminus at the other tip of the nucleoid [16].
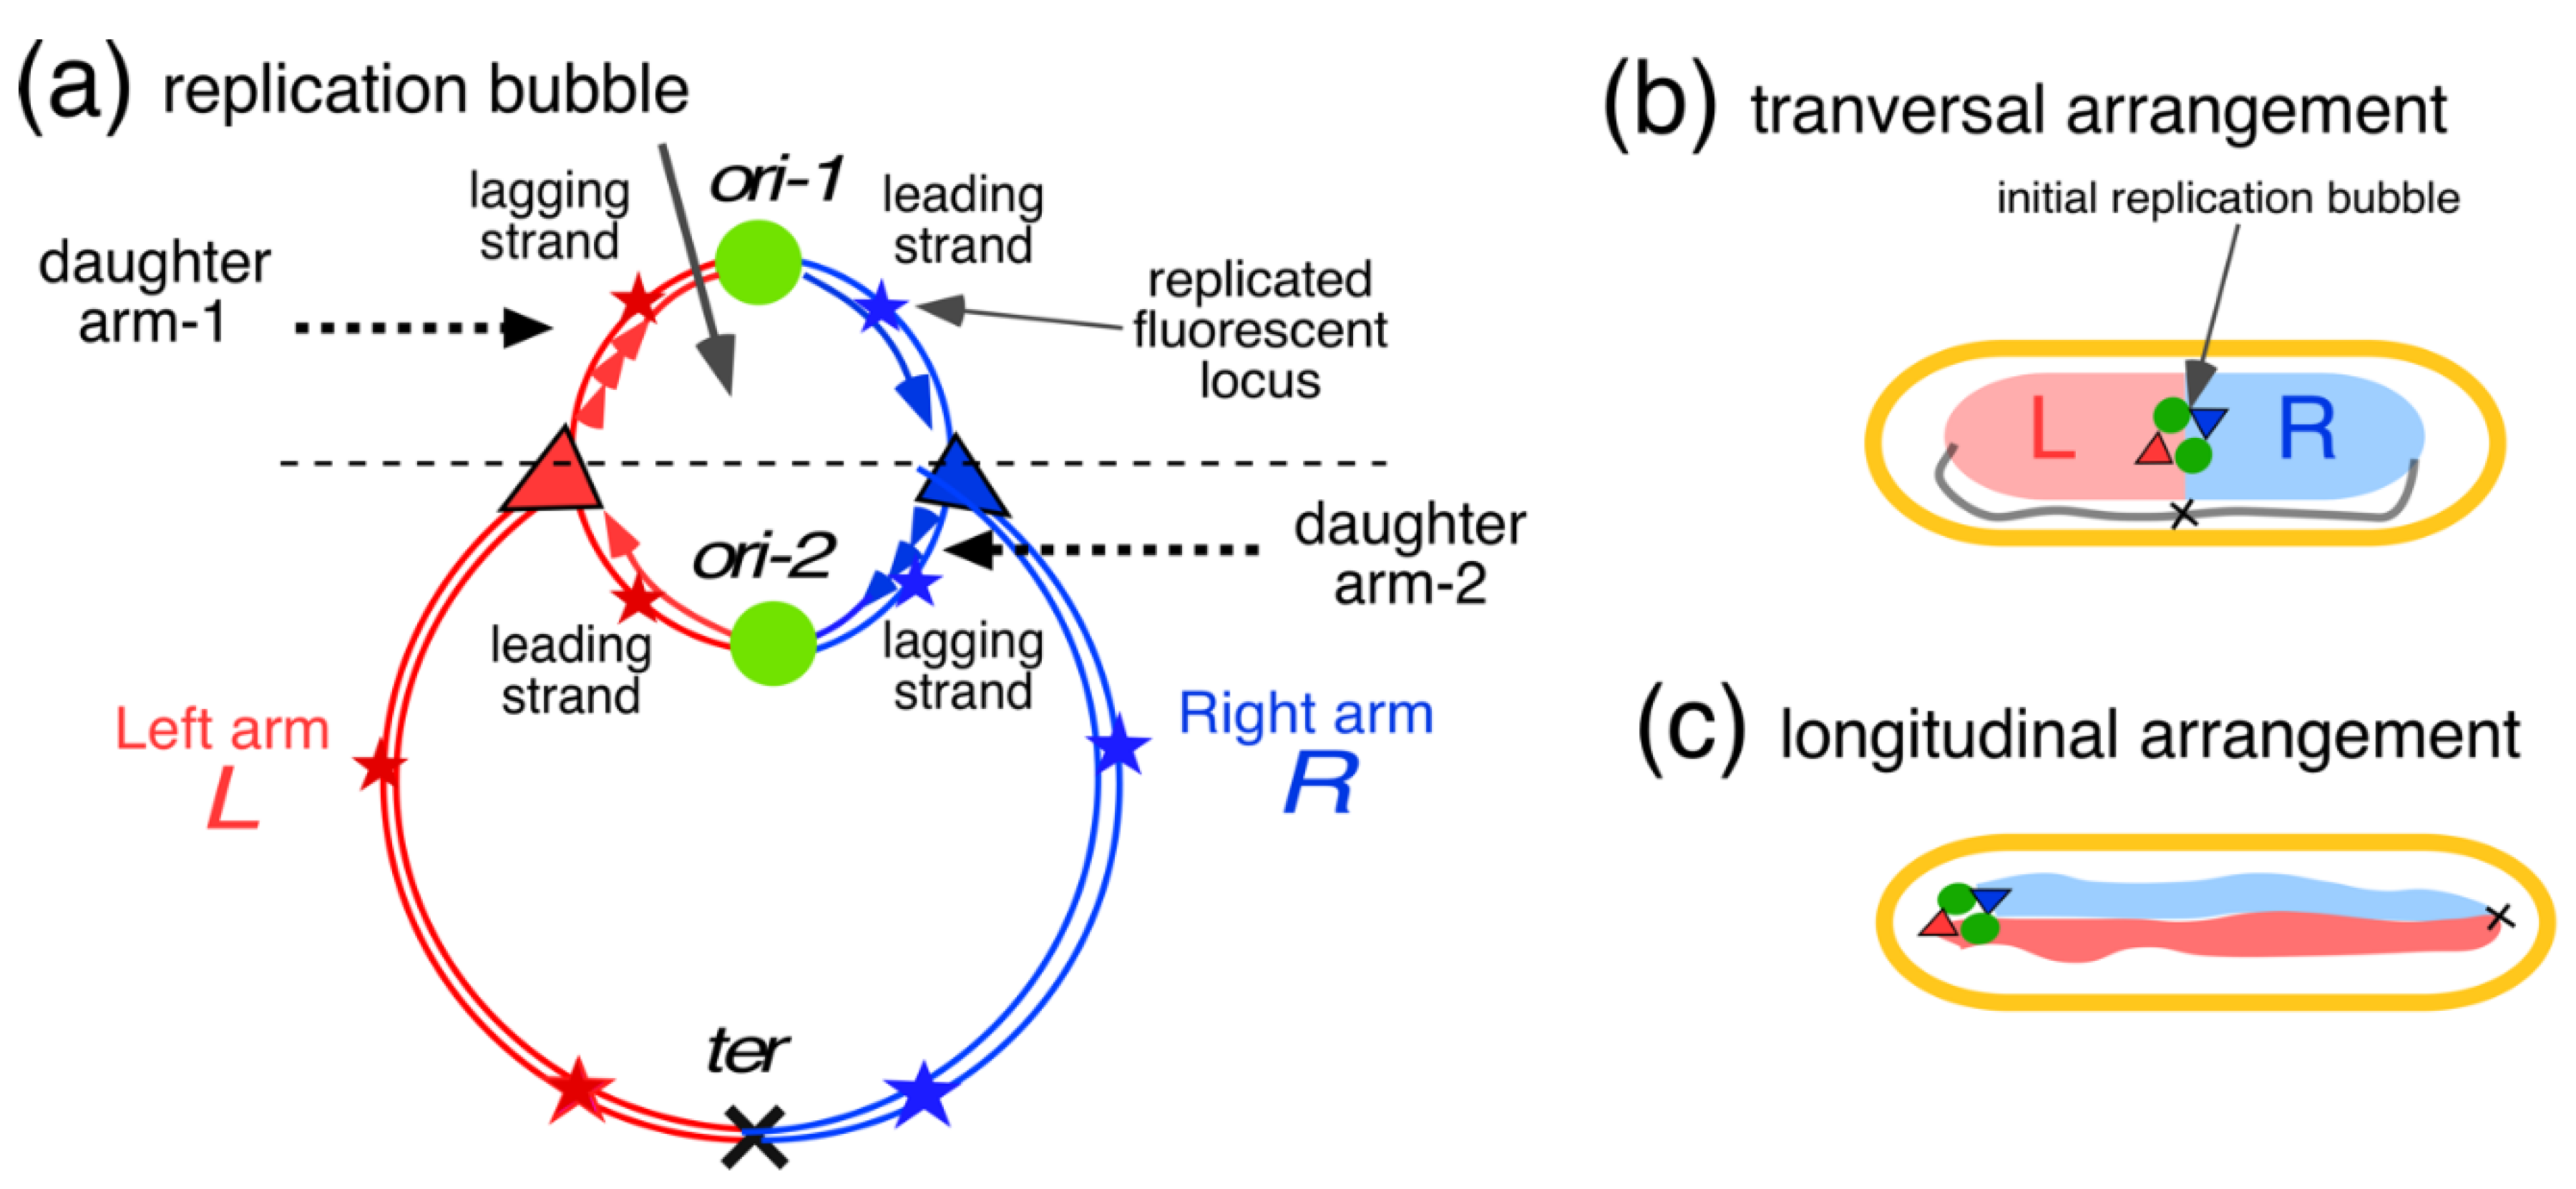
The measurements showed that in newborn cells that had not yet initiated replication, the three loci occurred in the typical pattern of L-O-R in 80% of the cells (Figure 9a). This high percentage can be interpreted to indicate that the two replichores had not mixed, but had ended up separated in the two halves of the nucleoid (see Figure 8b and Figure 9a). If the replichores would have intermingled the three loci would occur in three patterns (LOR; LRO; RLO) and the percentage of the L-O-R pattern would only be 33%. After initiation and origin duplication, the cells contained 4 spots showing the patterns L-O-O-R (44%) and O-L-O-R (46%). In the majority of 4-spot cells with increased length (L>2.3 µm), the origins have moved apart and passed either one (36%; O-L-O-R / O-R-O-L; Figure 9b) or both of the replichore loci (26%; O-L-R-O). This indicates that soon after duplication, one of the origins has passed an un-replicated locus on one of the replichores (see also Table A1 in [63]). Figure 9c shows a pattern in cells with 6 spots indicative for an almost fully replicated chromosome. As indicated by the schematic chromosome image in Figure 9c, the symmetric L-O-R-L-O-R arrangement is obtained when the leading strands move faster (through transcriptional activity?) than the lagging strands. This behavior is described by Mäkelä et al. (see Figure 5A in ref. [70]), who attribute it to the MukBEF-dependent binding of DnaN (β2-clamps) primarily to the lagging strands.
To obtain the various patterns in the transversal arrangement, replicating left and right arms have to pass each other once or twice. As will be explained below (Section 4.2, Figure 10 and Figure 11), the formation of these patterns and thus the mechanism of movement of loci or arms results from the development, already in the initial replication bubble, of replichore domains that do not become mixed. These separate domains within the nucleoid are assumed to enlarge and displace each other through continued DNA replication.
It should be emphasized here that, except for the origin (Figure 9b), the occurrence of three adjacent spots (L-L-O-O-R-R) was never observed. This can be interpreted to indicate that replichore loci separate almost immediately after their replication (see also discussion on cohesion in Section 4.3). This contrasts unpublished measurements of E. coli FH4035 cells (see construct of Flemming Hansen in ref. [63]), grown in LB-medium at 30°C (doubling time 66 min) and treated with 30 µg/ml nalidixic acid for 2-3 generations: the short filaments showed duplicated, colocalized spots, mostly separated in the short axis, suggesting that de novo DNA synthesis is required for segregation in the long axis of the cell.
Because it has been suggested that the active process of transertion [71,72] may play a role in the movement of segregating daughter strands, experiments were performed with cells treated with 300 µg/ml rifampicin that inhibits transcription and growth, but allows run-off DNA synthesis and residual divisions [63]. If replicated spots would not segregate in rifampicin-treated cells we would expect to observe a high percentage of cells with adjacent spots (L-L-O-O-R-R). However, as can be seen from Table 3, the replichore patterns found in non-growing cells are similar to those in the control cells. In view of (i) the significantly decreased percentage of cells with 4 or 5 spots, resulting from continued run-off replication (Table 3, column 4), (ii) the absence of cells with adjacent LL-OO-RR spots, and (iii) the decrease in percentage of cells showing the origin lying outside of the other loci (Figure 9b; see Table 2 in [63]) in both growing and non-growing cells, we conclude that chromosome movements in non-growing cells occur in a similar way as in growing cells: in both cases the two arms migrate to different halves of the nucleoid with the origin in between. This result contradicts a previous proposal that the process of transertion drives DNA segregation [71,72] and supports the hypothesis that segregation is passively driven by the process of de novo DNA synthesis. Ideas of a replication-driven segregation have been proposed previously by the groups of Grossman [73], Hansen [13,65], Sherratt [12], Austin [65,74], and Wiggins [75]. A direct link between DNA replication and chromosome organization has been demonstrated by the group of Sherratt [66] and will be discussed in the next section.
Wang and Sherratt [76] already presented evidence that inhibition of transcription with rifampicin did not affect segregation of the origin in E. coli, in agreement with the results presented in Table 3. The conclusion of these experiments [63] is that segregation continues during run-off DNA replication, but with a more random ordering of replichores (see columns 7-9 in Table 3). With respect to the distances measured between loci pairs (LL, OO, RR) in (unfixed) rifampicin-inhibited cells, it can be noted that these were about 0.3 µm smaller than in the growing control cells (Table 3 in [63]). This result can be ascribed to the smaller average length of rifampicin-treated cells (column 6 in Table 3), partly due to inhibited elongation and to residual divisions (see Appendix C, Figure A2).
Regarding the active process of transertion, it should be noted that the separation of daughter nucleoids after termination of replication, is dependent on cell growth (Figure A1; see also Figure 3 in [63]). Active processes like transertion and also cell constriction may thus be involved in stimulating this second step of the segregation process.
4.2. Four-Excluding-Arms Model for Segregation (1)
(1) Presented at the Lorentz workshop, “Escherichia coli DNA-segregation patterns in the presence and absence of growth.” Leiden, 18 June 2012.
It is tempting to assume that movement of replicated chromosome arms (Figure 8a) to opposite halves of the daughter nucleoids (Figure 8b), is only possible if the four newly synthesized DNA arms do not become mixed or entangled but are maintained as separate entities right from the start of the replication-segregation process. This demixed state could be achieved with the help of an active enzymatic mechanism like energy consuming (motor) proteins and topoisomerases. These proteins include, ATPases like topoisomerase IV and SMC complexes, like SMC-ScpAB in Bacillus subtilis and C. crescentus, the MukBEF complex in E. coli, and the MksBEF complex in a wide range of other bacterial species [77]. It is generally believed that E. coli DNA is organized by an axial core formed by MukBEF complexes, which promote individualization of chromosome arms and linear compaction of the chromosome through loop extrusion [19,78]. Sherratt and coworkers have also proposed that a linear MukBEF axial core could direct the symmetric (L-R-L-R) segregation of replichores (see Figure 9c) at the replication fork through differential binding of the β2-clamps to the lagging strands (see Figure 5A in [70]). Previously Jun and Mulder [79] already proposed that asymmetric constraints of leading and lagging strands may cause the formation of different patterns during their segregation.
A simpler, mechanistic explanation for the different segregation patterns of replichores is given by the “four-excluding-arms model”, as proposed here and illustrated in Figure 10. It is hypothesized that the chromosome arms containing the nascent strands synthesized by the four Pol III-replicases (indicated in Figure 10a), become separated through physical exclusion, because of topological and physiological differences between the leading and lagging double strands. As proposed in Figure 10b, the arms with the nicked lagging strands will have a random-coil structure because the ~20 Okazaki-fragments have first to become ligated (see Appendix C), whereas the leading arms can directly become supercoiled and transcribed. It can be assumed that, once the four nascent arms in the initial replication bubble have formed separate blobs, their physical entanglement becomes unlikely, because the mixing of such blobs is energetically unfavorable. Their demixed state in the parental DNA network could represent a minimal energy situation, just as the phase separation between DNA and cytoplasm as described in Section 2.2 represents a minimal energy situation. Future considerations by polymer physicists should reveal whether such a de-mixed state between newly synthesized and parental DNA is feasible. (see discussion in [80] and supplementary information in [35]).
It is proposed that the four nascent replichore arms continue to remain separated and to form separate micro-domains (Figure 10c), that enlarge and displace each other. This exclusion of chromosome arms may be helped by the low DNA diffusion coëfficient as determined both in liberated nucleoids [33] and in living cells [81]. Because mixing or entanglement of the newly synthesized replichores is prevented right from the beginning, the process of entropic de-mixing [79] at a later stage may not be necessary.
An immediate separation of the origins in the replication bubble is to be expected if the replicated DNA in the origin region increases in mass and is free to move, while the two replisomes remain tethered to the un-replicated parental DNA which they are reeling-in. Such tethering of the replisomes would force the duplicated origins to move apart as indicated by the double black arrow in Figure 10b. It can be envisaged that once the initial blobs have been established, they develop into larger, separate domains that are fed by de novo DNA synthesis (Figure 10c). This causes the disappearance of the initial replication bubble, as visualized in Figure 10b, which could represent a structure with replisomes that differ from the ongoing ones (Figure 10c). Intriguingly, such a mechanistic distinction may have been referred to by Khodursky et al. [82] in their discussion of the effects of inhibition of initiating replication forks on thymineless death (TLD).
While the 4 micro-domains enlarge through de novo DNA synthesis within the meshwork of un-replicated, parental DNA, they are envisaged to first form a tetrahedron in the replication bubble (Figure 10c and Figure 11a). Further enlargement of the domains by the two replisomes will force the domains to displace each other and to rearrange in the long axis of the narrow nucleoid (see Appendix C). Such rearrangements will cause different patterns in cells with 6 spots as depicted in Figure 9c. The domain rearrangements could be related to large-scale structural changes and rapid movement of certain loci (“snaps”) as described by Joshi et al. [84]. As previously proposed by Sherratt and coworkers [66], transient pausing of one replisome, causing a lower velocity of DNA synthesis of one replisome and thus of domain expansion, may cause loci in the smaller domains to be pushed to mid-cell by the faster expanding domains synthesized by the other replisome. This results in the patterns like R-O-L L-O-R or L-O-R R-O-L, as indicated in Figure 11(b2).
In Figure 11c the transition to a faster growth rate (nutritional shift-up) is considered. Because the cells become wider [85], there is no need for the enlarging microdomains to adopt the different side-by-side patterns. Instead, the tetrahedron conformation of microdomains is maintained as previously described for spherical, thymine-limited cells by Zaritsky et al. [86]. In addition, because in the wider cells no re-arrangements of domains are necessary, there is no need for the origins to pass the replicating chromosome arms (see Figure 9b). As a result, the origins keep moving apart at the tip of the developing nucleoid towards the cell poles, even upon re-initiation, resulting in a longitudinal arrangement of the chromosome arms as described in [74].
Could this proposal of the formation of 4 excluding and expanding domains starting in the initial replication bubble (Figure 10a) be confirmed by the chromosome-conformation-capture technique or Hi-C [9], for instance, by increased interactions within the 4 domains? This is not to be expected as long as the contacts occur as intra-arm interactions on the same replichore, already visible as the primary diagonal on the Hi-C contact map (see for E. coli Figure 1A in Lioy et al. [52]). Only if the domains of nascent right and left replichore arms were to intermingle, inter-arm interactions would be visualized as a secondary diagonal on the Hi-C contact map (see for C. crescentus Figure 3Ad in [77]). Absence of such interactions in published E. coli Hi-C maps, is in agreement with the “four-excluding-arms model” here proposed.
The organization of the chromosome as proposed by the four-excluding-arms model is compatible with the higher-order level of organization of the chromosome into 4 macrodomains (Ter, Ori, Right and Left) and 2 non-structured regions as described by [87]; see also [52]). As soon as the left and right replichores have become replicated and the four excluding micro-domains (Figure 10b), have developed into four macro-domains these will develop in the duplicated structured and unstructured macro-domains as described in [87] (see also [9]).
For the transversal arrangement of the chromosome as depicted in Figure 11a, the asymmetric deposition of newly synthesized DNA requires stretched regions of replicated DNA that feed the newly developing nucleoids (see Figure 4B panel 3 and 4 in [63]. These “feeding strands” can be expected to induce superdiffusive motions of loci, which have occasionally been observed [81,88].
Is the four-excluding-arms model able to explain the distances between replicated spots as documented for the slow growing E. coli K-12 cells in [63]? In Appendix C the volumes of the developing domains have been calculated for the slow growing E. coli cells depicted in Figure 11 a and b. Although the calculations apply to a different strain (E. coli B/r), the results show that the distances obtained by mere de novo DNA synthesis (1.8 µm in Figure A1, cell b-4), are similar to those measured in the E. coli K-12 strain in [63] (1.4 - 1.6 µm in Figure C2 a, b).
4.3. Comparison between Bacteria and Eukaryotic Cells and the Phenomenon of Cohesion
A fundamental difference between bacteria and eukaryotes lies in the pairing and alignment of sister chromatids throughout G2-phase, until the chromatids become condensed in the metaphase of mitosis [92]. During this cohesion-period the eukaryotic sister chromatids are held together by ring-shaped cohesin protein complexes, thus overcoming the gap between the time when the genome is replicated and when the chromatids are physically separated. However, already during S-phase, sister chromatids become segregated through the loop-extrusion activities of condensin II complexes that prepare the chromosomes for their further condensation by condensin I [93]. Subsequently, the chromatids become separated by proteolysis of cohesins and transported by microtubules of the mitotic spindle, processes not occurring in bacteria. Hirano ([94]) emphasized that “sister chromatids in eukaryotes are already well resolved by metaphase before they are subjected to poleward movement in anaphase…” and that it is therefore reasonable to hypothesize that the resolution process in eukaryotes is mechanistically equivalent to the segregation process in bacteria (see also [80]).
Contrary to the proposition of Bates and Kleckner [39], it has been argued that there is no trustful experimental evidence for a eukaryotic cohesion phenomenon in bacteria [12,95] and that the replicated DNA strands can immediately be separated if no precatenanes have been formed behind the forks that cause interstrand entanglements [96]. Estimation of the cohesion time is generally based on the independent measurements of, for instance, the copy number of the gln locus in comparison with its appearance as fluorescent foci in the cells [84]. See for discussions of “cohesion-experiments” in E. coli, [97,98,99].
While there seems to be no functional necessity for initial linking of bacterial daughter strands by cohesion, analogously to cohesion in eukaryotes, the passive four-excluding-arms model presented here suggests an immediate separation of nascent DNA strands in the replication bubble. However, active mechanisms for bringing strands transiently together on some distance from the replisome for processes like recombination and mismatch repair can be envisaged. Such an organization, involving SeqA-complexes on a distance of ~250 nm from the replisome (cf. distances in Figure A1 and Table A3), has been described by the group of Skarstad [100].
5. Conclusion
Various microscopic studies of bacterial DNA have demonstrated that the nucleoid represents a low refractive index region that is well separated from the cytoplasm (Figure 1, Figure 2 and Figure 3). Polymer-physical and biochemical studies, including chromosome-conformation-capture techniques (Hi-C), have tried to understand this phase separation, either considering the free energy of DNA-crowder interactions [5,6] or chromosome folding by transcriptional activities [10]. An important tool in both approaches is the effect on nucleoid compaction after inhibiting transcription with rifampicin (cf. Table 2). Better microscopy studies of living cells are required to evaluate and understand the volume expansion of the nucleoid in rifampicin-inhibited cells. Also, it is not always clear whether the different proposals for DNA compaction conform to the observation of a low refractive-index nucleoid. A final conclusion has to await better agreement on the biological input values of the number of soluble proteins in an E. coli cell and better estimates of the volume of the nucleoid (see Figure 5). Regarding the polymer-physical approaches to minimalize the total free energy of the cells, it would be helpful if they would be accompanied by a more educational explanation for biologists (see [34,35]), to understand the sources of input values and the complicated computations.
Studies on bacterial DNA segregation indicate two different views: Either, resolution and movement of replicated daughter strands is performed by a dedicated, active process based on DNA loop extrusions through structural maintenance of chromosome (SMC) complexes, or by the passive process of de novo DNA synthesis, as described here. If, in the initial replication bubble (Figure 10b), intermingling of the newly synthesized DNA strands would occur, it is to be expected that the entanglements could only be resolved with an elaborate mechanism of topoisomerases and SMC proteins [19]. However, the different physical properties of nascent leading and lagging chromosome arms (Figure 10a), together with different gene expression activities between the two replichores, could prevent the mixing of the 4 daughter strands right from the beginning. In that case, the secret of segregation lies in the build-up of the replication bubble: if no initial mixing occurs due to their different physical properties, the 4 chromosome arms will exclude each other and will become confined in 4 individual domains without the necessity of de-mixing (Figure 10b).
So far, microscopic observations have not given any indication for the existence of the 4 excluding domains. Further developments of techniques for pulse labelling of nascent DNA, like performed by Spahn et al. [48] seem promising if they could be applied to slow-growing E. coli cells. As already described in Small Things Considered (https://schaechter.asmblog.org/schaechter/2019/11/forbearance-with-the-escherichia-coli-nucleoid.html), the Dekker group studied the dynamics of a ring-shaped nucleoid, “opened up” and replicating in artificially widened cells. The studies show how in living cells duplicated origin-spots are often positioned in or near low-density, blob-like DNA domains [101]. In another study by this group [102], it is shown how, upon initiation of DNA replication, the duplicated origins first move apart in random directions, but re-orient towards the long axis after some time when the amount of replicated DNA has locally increased. These observations also reflect what may happen during the hypothetical transition from slow to fast growth as depicted in Figure 11c,d.
Further developments in spatial light interference microscopy [103], or digital holographic microscopy combined with optical diffraction tomography [26] and improved labeling techniques for nascent DNA strands [48], will be necessary to evaluate the above hypothesis of the four-excluding-arms created in the initial replication bubble. When a more detailed quantification of the number of proteins involved in the replication bubble will become available, calculations of the free energy state of the proposed 4 nascent arms, as performed by Odijk for the whole nucleoid (Figure 5 in [44]), for the construction of the DNA replication cycle during shift-up could become possible. Such calculations might support the above proposal of passive DNA segregation in the form of the hypothetical 4 excluding domains (Figure 10b) that gradually replace the parental nucleoid.
Funding
This research received no external funding.
Acknowledgments
Theo Odijk is thanked for his stimulating interest in the compaction of the E. coli nucleoid and for his polymer physical lessons in the past. He did not participate in this work because of his prolonged illness and because of new reflections on the effect of ribosomes that evoke new phenomena of depletion and could possibly explain anomalous observations on the behavior of the nucleoid. Nanne Nanninga, Arieh Zaritsky, Charles Helmstetter, Norman Grover, Vic Norris and Roberto Kolter, are gratefully acknowledged for their encouragement, cooperation and comments. I am greatly indebted to Peter Huls for performing most of the experiments, to Norbert Vischer for his help with image analysis throughout the years and to Vic Norris and Arieh Zaritsky for commenting on the manuscript. I am grateful to Tove Atlung and Flemming Hanen for their hospitality and discussions in Hedeland (Denmark). I thank Jaan Männik, Fred Brakenhoff, Sonia Cunha, Chathuddasie Amarasinghe and Mu-Hung Chang (Männik-group), Paul Park (ODT), Sebastian Robalino, Rick Ghauharali, Suckjoon Jun and Sven van Teeffelen for helpful discussions on microscopy and polymer physics. Leendert Hamoen is thanked for hospitality to his laboratory.
Conflicts of Interest
The author declares no conflicts of interest.
Appendix A
1. Computation of theoretical values for the protein volume fractions in nucleoid and cytoplasm and for the volume of the nucleoid
An E. coli cell is considered as a compartment filled with a mixture (i) of a chromosome consisting of a single branched, plectonemic DNA supercoil and (ii) of small, globular proteins. This mixed state is maintained at the cost of energy. Therefore, de-mixing or phase separation between proteins and DNA is to be expected, resulting in a minimal energy state at thermodynamic equilibrium. This implies a reduction of free energy in spite of the fact that formation of a DNA-phase (or nucleoid) looks more ordered.
To obtain values for the protein volume fractions in nucleoid and cytoplasm and for the nucleoid volume, Odijk [5] formulated equations for the free energy of the principal interactions between the superhelical segments of the DNA () and between the DNA double helix and soluble proteins (). Here, the work of Theo Odijk [5] is followed as also explained in [34] and in [104]. The computation is performed in 4 steps:
(i) Definition of the excluded volumes of DNA supercoil segments colliding with themselves (Figure 4b of main text) and of the DNA protein cross-interactions (Figure 4c in the main text).
(ii) Taking the derivatives of the free energy equations with respect to the volumes and the number of proteins of the two phases, equations are obtained of the force of compaction (osmotic pressure) and the force for particle mixing (chemical potential) in both phases, cytoplasm and nucleoid.
(iii) Equalizing both forces for the two compartments (Figure 4d in main text) results in two so-called co-existence equations that contain the three unknown variables of protein volume fractions in cytoplasm (vcyto) and nucleoid (vnuc) and the volume of the nucleoid (Vnuc).
(iv) Together with a third equation on the volume fraction of total protein, the three variables can be computed and compared with experimental values.
2. Excluded volume of DNA supercoil self-interactions
Here we consider the superhelical DNA in the cell as it interacts with itself. As given in Table A1, the DNA supercoil has a diameter Ds = 22 nm and a contour length Ls = 640 µm [105]. The supercoiled DNA can be considered to consist of so-called Kuhn segments with a step length or Kuhn length As = 158 nm (2x the supercoil persistence length Ps). These superhelical Kuhn segments collide with themselves, giving a strong excluded-volume effect (blue and red supercoils in Figure 4b of main text). The excluded volume (β) between two segments (see Figure 3 in [37]) can be estimated as (cf. Equation (2.5.2) in [104]):
There are N = Ls/As Kuhn segments, giving rise to N(N-1)/2 N2/2 pairs of interactions. Therefore, the total excluded volume (Bs) of the DNA-supercoil (which is independent of As) is (cf. Equation (13) in [5]):
The superhelix self-energy, scaled by cell volume Vcell and thermal energy kBT, can now be expressed as (cf. Equation (14) in [5]):
3. Excluded volume of DNA-protein cross-interactions
We next consider the statistical cross-interaction or steric repulsion between a spherical protein with an average radius a = 2.3 nm that is excluded from the DNA double helix (see Figure 3c of main text). Because such a small particle will swim right through the interstitional space of the supercoil, the excluded volume must be proportional to the contour length L of the DNA double helix (L 1600 nm). Because of electrostatic repulsion the protein cannot approach the double helix more closely than the depletion radius E, which can be estimated to represent the sum of the protein radius, a, the DNA-helix radius (1/2d) and two times the so-called Debye screening length λ for an ionic strength of 0.2M:
The protein exclusion volume, Bcross, is the volume around the DNA cylinder with radius E and length L from which the protein is excluded or depleted (cf. Equation (8) in [5]):
The total protein-DNA depletion energy of m proteins interacting with the DNA exclusion volume, Bcross, scaled by cell volume Vcell and thermal energy kBT, can now be expressed as (cf. Equation (12) in [5]):
4. Phase separation and co-existence equations
If the DNA occurs dispersed throughout the cell (volume V), the total free energy of the nucleoid, Fnuc, is the sum of three energies:
in which Fmix represents “an ideal mixing term due to the entropy of the proteins” (cf. Equation (5) in [34]). The above equation can be re-written as (cf. Equation (15), [5]):
Fnuc = Fmix + Fcross + Fself,
Here, is the volume of 1 protein with diameter b: (b = 4.6 nm). Therefore, the volume fraction of total protein = m.or m/ Vcell = /. Because the protein volume fraction in the cytoplasm (m./) is low, the interactions between proteins, Fmix, is neglected. Also, the function g( is not considered further. Here, it should be noted that in the calculations of [6], g ( was not neglected.
Because Fcross is ~10x Fself, an unstable situation arises in the mixed suspension. By assuming a phase separation (cf. Figure 1 of main text), a low energy situation can be obtained in which the DNA occurs in a nucleoid with volume Vnuc, together with soluble proteins. The general form of the re-written equation (Equation (8)), is now used to impose thermodynamic equilibrium between a cytoplasmic phase (with mcyto proteins and volume Vcyto) and a nucleoid phase (with mnuc proteins and volume Vnuc), where
By taking the derivative of Equation (8) with respect to volume, Vcyto, one obtains the osmotic pressure () as a force for compaction. The derivative of energy with respect to the number of proteins, m, gives the chemical potential (µ) as a force for mixing of molecules.
Rewriting Equation (8) for the cytoplasm we obtain:
Taking the derivative with respect to m gives:
Taking the derivative with respect to Vcyto gives:
Rewriting Equation (8) for the nucleoid we obtain:
Taking the derivative with respect to m gives:
Taking the derivative with respect to Vnuc gives:
To ensure a minimum energy situation, the chemical potentials and the osmotic pressures in cytoplasm and nucleoid are equalized, giving two coexistence equations (cf. Equations (16) and (17) in [5]).
The two coexistence equations are obtained as follows:
For equality of the osmotic pressure in cytoplasm and nucleoid, we write πc = πn and obtain:
Substituting by and multiplying both sides of the equation by gives (cf. Equation (16), [5]):
For equality of the chemical potential in cytoplasm and nucleoid, we write µc = µn and obtain (cf. Equation (17), [5]):
which is equivalent to: ).
In these equations the relationship is used between the protein volume fraction (vc or vn) as given by:
), and the cytoplasmic or nucleoid volume (Vc or Vn).
In order to compute the unknown theoretical variables vc and vn we solve Equation (17) for vn. By eliminating vn from the two equations (substituting vn in Equation (16) and dividing both sides by vc), they reduce to (cf. Equation (24), [5]):
In order to compute the unknown theoretical variable Vnuc, a third equation is needed which states that the volume fraction of the total amount of protein (vtot) equals the sum of the protein volume fractions in cytoplasm (vc) and nucleoid (vn):
The volume of the cell, Vtot is measured microscopically. Using the parameters given in Table A1, the theoretical values for protein volume fractions in nucleoid (vnuc) and cytoplasm (vcyto) and for nucleoid volume (Vnuc) can be computed. However, in the new calculations the effect of (poly)ribosomes should be included, resulting in more complex equations; these will have to be published elsewhere.
From the protein and DNA concentrations in the two phases, the respective refractive indices (RI’s) can be calculated as shown in Appendix B.

Table A1.
Input values for computation of exclusion values, Bs and Bc and of the free energies Fself and Fcross. For the number of soluble proteins (m) and for the volume of the average cell (Vcell), the values given in Figure 7b of the main text have been used.
Table A1.
Input values for computation of exclusion values, Bs and Bc and of the free energies Fself and Fcross. For the number of soluble proteins (m) and for the volume of the average cell (Vcell), the values given in Figure 7b of the main text have been used.
| Variable | Input value |
| Volume cell (cytoplasm + nucleoid), Vcell; see Table 1, note (2) in main text. |
0.81 µm3 |
| Double helix contour length, L | 1600 µm |
| Superhelix contour length, Ls | 640 µm |
| Superhelix diameter, Ds | 22 nm |
| Radius average 40 kDal protein, a volume of spherical 40 kDal protein: |
2.3 nm 0.051 x 10⁻⁶ µm3 |
| Supercoil Kuhn length, As | 158 nm |
| Number supercoiled Kuhn segments, Ns = Ls/ As = | 4000 |
| DNA self-excluded volume Bs = = | 7073 µm3 |
| Fself = Bs/Vcell = 7073/0.81= | 0.87 x 10⁴ kBT |
| Number soluble proteins, m (in cytoplasm (0.77x10⁶) plus nucleoid (0.84x10⁶)); see Figure 7b in main text. | 1.6 x 10⁶ |
| Exclusion radius, E ( | 4.7 nm |
| DNA-protein excluded volume, = | 0.11 µm3 |
| Fcross = = | 22 x 104 kBT |
| Volume fraction total proteins, = | 0.101 |
Appendix B
1. Calculation of refractive indices (RI’s) of cytoplasm and nucleoid from macromolecular concentrations
The refractive index of a specimen is a (dimensionless) number (n) that indicates how the velocity of light (v) traversing an object with a certain density (c) is retarded with respect to its speed in vacuum. In the formula n = c/v, Barer and Joseph [22] have established that the refractive index is linearly proportional to the concentration (density) of macromolecules in the cell. This is expressed by the formula: ncell = nwater + γ C, in which C is the macromolecular concentration in grams/100 ml and γ the specific refraction increment factor (in ml/g). More recently, this linear relationship between refractive index and concentration has been shown to hold for complex cells [106] and for bacteria [25].
To estimate the macromolecular concentration in cytoplasm and nucleoid we need to know (i) the volumes of cell and nucleoid measured microscopically and (ii) the amounts of different macromolecules in the cell as determined, amongst others, by Churchward and Bremer [28]. Table A2 shows the theoretical refractive indices, calculated using the above relationship of Barer and Joseph [22].
In Table A2, the macromolecular composition and refractive indices of two slow-growing E. coli cells are compared: (i) E. coli K-12 as described by the group of Jaan Männik and discussed in Section 3.1 and (ii) E. coli B/r cells as described in ref. [27] and [5]. Schematic drawings of the two cell types are shown in Figure 7a,b, assuming only exclusion of polyribosomes from the nucleoid and no depletion of soluble proteins. The data are from the DAPI-stained E. coli B/r cells of Huls (2001; see last row in Table 1 in main text), that have recently been re-measured. Note that these measurements are different from those obtained by confocal scanning light microscopy as published in [27] and described in Section 2.1 (see first row in Table 1 of main text).
At present, there are two major uncertainties in the data we use: the volume of the nucleoid and the number of soluble, non-ribosomal proteins. Assuming mere exclusion of polyribosomes from the nucleoid without depletion of soluble proteins by the DNA, the reduction in RI of the nucleoid as compared to the cytoplasm (i) increases with increasing relative nucleoid volume and (ii) increases with decreasing concentration of soluble proteins.
Table A2.
Estimation of macromolecular concentrations and refractive indices for two slow-growing E. coli populations, assuming equal dispersion of soluble proteins throughout nucleoid and cytoplasm. Cell and nucleoid volumes and macromolecular concentrations are calculated for the average cell in the population. See Figure 7a,b in main text.
|
Volume (x 10-12 ml), mass (x 10-12 mg) and numbers |
Cells of Chang(1a) |
Cells of Huls (2001)1b) |
| Doubling time at 37°C | 60 min | 150 min |
| Volume cell (Vcell) |
0.7 (Table S1) |
0.81(2b) |
| Volume nucleoid (Vnuc) | 0.35 | 0.33(2b) |
| Volume envelope (Venv) | - | 0.12 (3b) |
| Volume “cytosolic phase”, Vcyto | 0.35 (4a) | 0.36 (4b) |
| Volume cytoplasm + nucleoid, Vcyto+nuc | - | 0.69(5b) |
| Total mass of proteins | 22.59(6a) | 136 (6b) |
| Total mass soluble and ribosomal proteins (considered as 40 kDa proteins) divided over: - cytosol - nucleoid |
15.3(6a) 8.1 7.17 |
116(6b) cytosol+nucleoid: 116 |
| Total number of 40 kDa proteins (soluble + ribosomal proteins) | 0.34x10⁶ | 2.05x10⁶ |
| Number of ribosomes | 6000(7a) | 8000 (7b) |
| DNA mass (1 chromosome equivalent) | 4.72 (8a, b) | |
| Average number chrom. equivalents per cell, Gc | 1.67 | 1.35(9b) |
| Total mass of stable RNA for 6000(10a) or 8000 ribosomes(10b) | 19.2(10a) | 23(10b) |
| Mass ribosomal proteins in cytosol | 7.32(11a) | 9.76(11b) |
| Number ribosomal proteins considered as 40 kDa proteins | 0.11x10⁶ | 0.15x10⁶ |
| Mass non-ribosomal, soluble 40 kDa proteins in cytosol | 8.1 | 106(11b) |
| Number of non-ribosomal (soluble) proteins in cytoplasm | 0.84x10⁶ | |
| Number of non-ribosomal (soluble) proteins in nucleoid | 0.108x10⁶ | 0.77x10⁶ |
| Total number of non-ribosomal (soluble) proteins | 0.23 x 10⁶ | 1.61 x 10⁶ |
| Concentrations (g/100 ml) (12) | ||
| DNA concentration in nucleoid (DNA mass x number chrom.equiv./ Vnuc) | 2.25 | 1.93 |
| Concentration soluble proteins in nucleoid | 2.05(6a) | 15.4(6b) |
| Concentration stable RNA in cytosol (Vcyto) | 5.49(10a) | 6.39(10b) |
| Concentration soluble proteins in cytosol | 2.32(6a) | 15.4(6b) |
| Concentration ribosomal proteins in cytosol (Vcyto) | 2.09(11a) | 2.71(11b) |
(1b) E. coli B/rH266 cells were grown by Huls et al. (2001-unpublished; see Figure 5 in main text). Cells were stained with DAPI, prepared on an agar slab and visualized by fluorescence microscopy. Previously [27], cells from the same strain were measured after attachment to a coverslip with poly-lysine and visualized with a CSLM. It appeared that the latter cells and nucleoids were significantly smaller for unexplained reasons. See Table 1 in main text.
(2b) Average volumes of cells and nucleoids were obtained from a distribution of 281 cells. A threshold of 0.5 was applied using the ObjectJ plugin of N. Vischer: Coli-Inspector-04q+NucVol.ojj. See Figure 5b in main text.
(3b) Because the cell envelope is not accessible to diffusing proteins or particles, its volume was calculated using data in bionumbers.harvard.edu, giving a total thickness of 23 nm (plasma membrane 6 nm, the peptidoglycan layer 4 nm and of the outer membrane 13 nm). For an average cell the volume Venv = 0.12 x 10⁻¹² ml, which is 15% of cell volume, Vcell.
(4a) The volume accessible to (poly)ribosomes, Vcyto, is obtained from Vcell - Vnuc.
(4b) Vcyto obtained from Vcell - (Venv + Vnuc).
(5b) The volume accessible to soluble proteins, Vcyto+nuc, is obtained from Vcell - Venv.
(6a) “Based on results of free energy minimization” [6], the total number of soluble (non-ribosomal) 40 kDa proteins = 2.3 x 10⁵.
(Mass of 40 kDa protein = 40,000 x 1.66 x 10-21 = 66.4 x 10⁻¹⁸ mg.)
Total mass of (non-ribosomal) 40 kDa proteins = 2.3 x 105 x 66.4 x 10-18 = 15.3 x 10⁻¹² mg. Together with the ribosomal mass (note 11a) 0f 7.32 x 10 -12 this gives a total mass of protein = 22.59 x 10⁻¹² mg. (compare with 6b below).
The mass of soluble, non-ribosomal proteins is divided over nucleoid with 1.08 x 10⁵ proteins (mass= 7.2 x 10⁻¹² mg) and cytosol with (2.3-1.08=) 1.22 x 10⁵ proteins (mass = 8.1 x 10⁻¹² mg).
Concentration of 40 kDa proteins in nucleoid = 7.2 x 10⁻¹²/0.35 x 10-12 =20.5 mg/ml (2.05 g/100 ml).
Concentration of 40 kDa proteins in cytosol = 8.1 x 10⁻¹²/0.35 x 10-12 =23.14 mg/ml (2.32 g/100 ml).
(Mass of 40 kDa protein = 40,000 x 1.66 x 10-21 = 66.4 x 10⁻¹⁸ mg.)
Total number of 40 kDa proteins = 1.36 x 10⁻¹²/66.4 x 10-18 = 2.05 x 10⁶.
Subtraction proteins in volume envelope: Assuming equal distribution of 40 kDa proteins over envelope and cytosol + nucleoid, the envelope (with volume Venv= 0.15 x Vcell) contains 0.15 x136.10-12 = 20.4 x 10⁻¹² mg protein. This amount is subtracted from total protein mass (136 x 10-12 mg), because the envelope-proteins cannot interact with DNA. This leaves in the cytosol+nucleoid (136-20.4=) 116 x 10-12 mg protein, both ribosomal and soluble proteins. Overall concentration of 40 kDa proteins in Vcyto+nuc = 116 x 10-12mg/0,69 x 10-12ml = 168 mg/ml (including mass of ribosomal proteins; see note 11b).
(7a) Based on best-fit values for Equation (2) [6] and Ehrenberg et al. [107] and Milo [108]. See Figure 1c of [6].
(8a, b) Excluding water molecules removed during polymerization, the mass of 1 bp DNA = 618 Da. DNA mass 1 chromo some equivalent = 4.6 x 106 bp x 618 x 1.66 x 10-24 = 4.72 x 10⁻¹² mg. The value given by [40], is used throughout: 4.8 x 10⁻¹² mg.
(9b) GC was calculated using the equation in ref. [41]:
Gc = Td/Cln2 (2^(C+D)/Td – 2^(D/Td), with Td = 150’, B= 50’, C= 80’ and D= 30’.
(10a) Total mass of stable RNA as in e-mail of 30 June 2023 = 16 x 10-15g for 5000 ribosomes. For 6000 ribosomes mass = 19.2 x 10⁻¹⁵g. With Vcyto = 0.35 x 10⁻¹² ml, this gives a concentration of RNA in the cytosol = 19.2 x 10⁻¹²/0.35 x 10-12 = 54.9 mg/ml (5.49 g/100 ml).
(10b) Total mass of stable RNA per cell for 8000 ribosomes given in Tables 2 and 3 of ref. [107]= 23 x 10-12 mg.
Concentration of RNA in cytosol = 23 x 10-12/0.36 x 10-12 = 63.9 mg/ml (6.39 g/100 ml).
(11a) Mass ribosomal proteins in cytosol for 6000 ribosomes according to Ortega ([109]) = 6000 x (0.45+0.77) x 10-15 = 7.32 x 10⁻¹² mg. This gives a concentration in the cytosol of 7.32 x 10⁻¹²/0.35 x 10-12 = 20.91 mg/ml (2.09 g/100 ml).
(11b) Mass ribosomal proteins in cytosol for 8000 ribosomes = 9.76 x 10⁻¹² mg.
This gives a concentration of ribosomal proteins in the cytosol of 9.76 x 10⁻¹²/0.36 x 10-12 = 27.1 mg/ml (2.71 g/100 ml).
Mass of non-ribosomal, soluble proteins = mass of 40 kDa proteins (see note 6b) - mass of ribosomal proteins (see above) = 116 x 10-12 - 9.76 x 10-12 = 106 x 10-12 mg. Assuming equal dispersion of soluble proteins through cytoplasm and nucleoid, their concentration in Vcyto+nc = 106.2 x 10⁻¹²/0.69 x 10-12 =154 mg/ml (15.4 g/100 ml).
(12) Theoretical refractive indices were calculated according to ncell = nwater + γ ρ, where ρ is the dry weight content per cell or per cytoplasmic or nucleoid volume (expressed as g/100ml) and γ the specific refraction increment factor given by Barer and Joseph [22]. The same formula as given in [27] was used:
ncell = nwater +0.0016 x nucleic acid (g/100ml) + 0.00186 x protein (g/100ml) + 0.00178 x remaining low molecular weight (LMW) compounds (5.8 g/100ml).
The calculations of the refractive indices (n) below indicate that for the E. coli K-12 cells of Chang et al., [6], mere exclusion of polyribosomes and equal concentration of soluble proteins in nucleoid and cytosol (see Figure 7a) results in a reduction of the refractive index as contributed by macromolecular content of 33 %. This is in accordance with the observations of [27]. See last rows in Table A2 for the various concentrations used:
nnuc = 1.333 + 0.0016 x 2.25 (DNA) + 0.00186 x 2.05 (prot.) + 0.00178 x 5.8 (LMW) = 1.351
ncyto = 1.333 + 0.0016 x 5.49 (RNA) + 0.00186 x (2.32+2.09) (prot.) x + 0.00178 x 5.8 = 1.360
Reduction n as contributed by macromolecular content: n-1.333 = (0.027-0.018)/0.027 = 0.33.
For the E. coli B/r cells of Huls (2001), mere exclusion of polyribosomes and equal concentration of soluble proteins in nucleoid and cytosol (see Figure 7b), results in a reduction of only 22%:
nnuc = 1.333 + 0.0016 x 1.93 (DNA) + 0.00186 x 15.4 (prot) + 0.00178 + 5.8 (LMW) = 1.375
ncyto = 1.333+0.0016 x 6.39 (RNA) + 0.00186 x 15.4+2.71 (prot.) + 0.00178 x 5.8 =1.387
Reduction n as contributed by macromolecular content: n-1.333 = (0.054-0.042)/0.054 = 0.22.
To obtain a difference of about 30 % as observed in [27], additional depletion of soluble proteins from the nucleoid to a concentration of ~13 mg/ml and an increase of protein concentration (soluble and ribosomal) in the cytoplasm to ~20 mg/ml has to be assumed to obtain a RI-reduction in the nucleoid of about 34%:
nnuc = 1.333+0.0016 x 1.93 (DNA) + 0.00186 x 13.4 (prot) + 0.00178 +5.8 (LMW) = 1.375
ncyto = 1.333+0.0016 x 6.39 (RNA) + 0.00186 x 17.4+2.71 (prot.) + 0.00178 x 5.8 =1.387
Reduction n as contributed by macromolecular content: n-1.333 = (0.058-0.038)/0.058 = 0.34.
Appendix C
1. Calculation of domain volumes for the “Four-excluding-arms model”
Starting point of the volume calculations of domains is (i) the volume of the whole chromosome (contour length L=~1600 µm) as estimated for a newborn E. coli B/r cell, described in Table 1 (last column) and Figure 5b in the main text: Vnuc = 0.24 µm3 and (ii) the superhelix contour length of the non-replicating chromosome Ls = 0.4 x 1600 =) 640 µm, with a number of superhelical Kuhn segments of 4000 (see Table A1 of Appendix A). In addition, it is assumed that the speed of the E. coli Pol III replicase is about 1000 nucleotides (nt) per s [110] and that the length of Okazaki fragments is about 1500 nt [110]. Therefore, an average Okazaki fragment will be synthesized in 1.5 s. Thus, 30 s after initiation of DNA replication at ori, the lagging strands in the replication bubble will show a run of about 20 Okazaki fragments (Figure 10a in main text). Ligation of the Okazaki fragments involves removal of RNA primers by endonucleases, filling the gaps between the fragments by repair DNA polymerase and sealing by DNA ligase. During this maturation process, the nicked lagging strand cannot become supercoiled and will have the conformation of a random coil (Figure 10b in main text); similar calculations were performed in [97].
After 30 s of DNA replication, 30.000 nt are synthesized by both the leading and lagging strand Pol III replicases. Each newly synthesized strand has a length of 30.000 x 0.34 nm = about 10 µm of DNA (0.34 is the axial distance between base pairs). Assuming that for the leading strand this DNA becomes immediately supercoiled, it will represent a length of (0.4 x 10 =) 4 µm of supercoiled DNA. As the chromosomal contour length of supercoiled DNA, represents 4000 Kuhn segments (Appendix A, Table A1), the 4 µm of supercoiled DNA synthesized in 30 s, will contain about 25 Kuhn segments. These have been depicted in Figure 10b of the main text as being folded into a blob with a volume of 0.0015 µm3 and a diameter of 140 nm (see also Figure 4c in [83], assuming that its packing density is the same as that of the whole nucleoid, being 4000 Kuhn segments in a volume of 0.24 µm3.
After 5 min (300 s) of replication with a fork speed of 1000 nt/s, 300.000 x 0.34 nm = ~100 µm of DNA has been synthesized by each of the Pol III-replicases of leading and lagging strands. This implies for the leading strands a contour length of supercoiled DNA of (0.4 x 100 =) 40 µm, folded into a microdomain of 250 Kuhn segments with a volume of 0.015 µm3 and a diameter of 310 nm (Figure 10c main text). See Table A3 for domain volumes obtained after longer replication periods.
Figure A1.
Enlargement and rearrangement of nascent domains in the four-excluding-arms model. (a) Schematic representation of the 4 nascent, excluding arms (cf. Figure 8a in main text). (b) See for the volumes of the domains Table A3. Sizes (yellow contour) of the E. coli B/r cells are not to scale. The replication period is assumed to be C = 40 min. (b-1) After initiation of DNA replication, the 4 excluding arms in the replication bubble are assumed to form a tetrahedron within the parental nucleoid. (b-2) After 5 min of replication, the enlarged tetrahedron exceeds the diameter of the parental nucleoid, forcing the domains to rearrange in the long axis. (b-3) After 20 min of replication, the rearranged domains have formed the most common ordering pattern L-R-L-R (see Table 3 in main text) in the elongating nucleoid. (b-4) After 40 min of replication the chromosome is assumed to have fully replicated. The two replichore domains of each daughter strand now occupy opposite halves in the developing daughter nucleoids. The red double arrow indicates the distance over which a replicated locus on the left replichore has segregated. Compare with segregation distances shown for a different strain (E. coli K-12) in Figure A2a. (b-5) Schematic representation of a cell at division, in which the daughter nucleoids have moved apart through continued cell elongation before cell division.
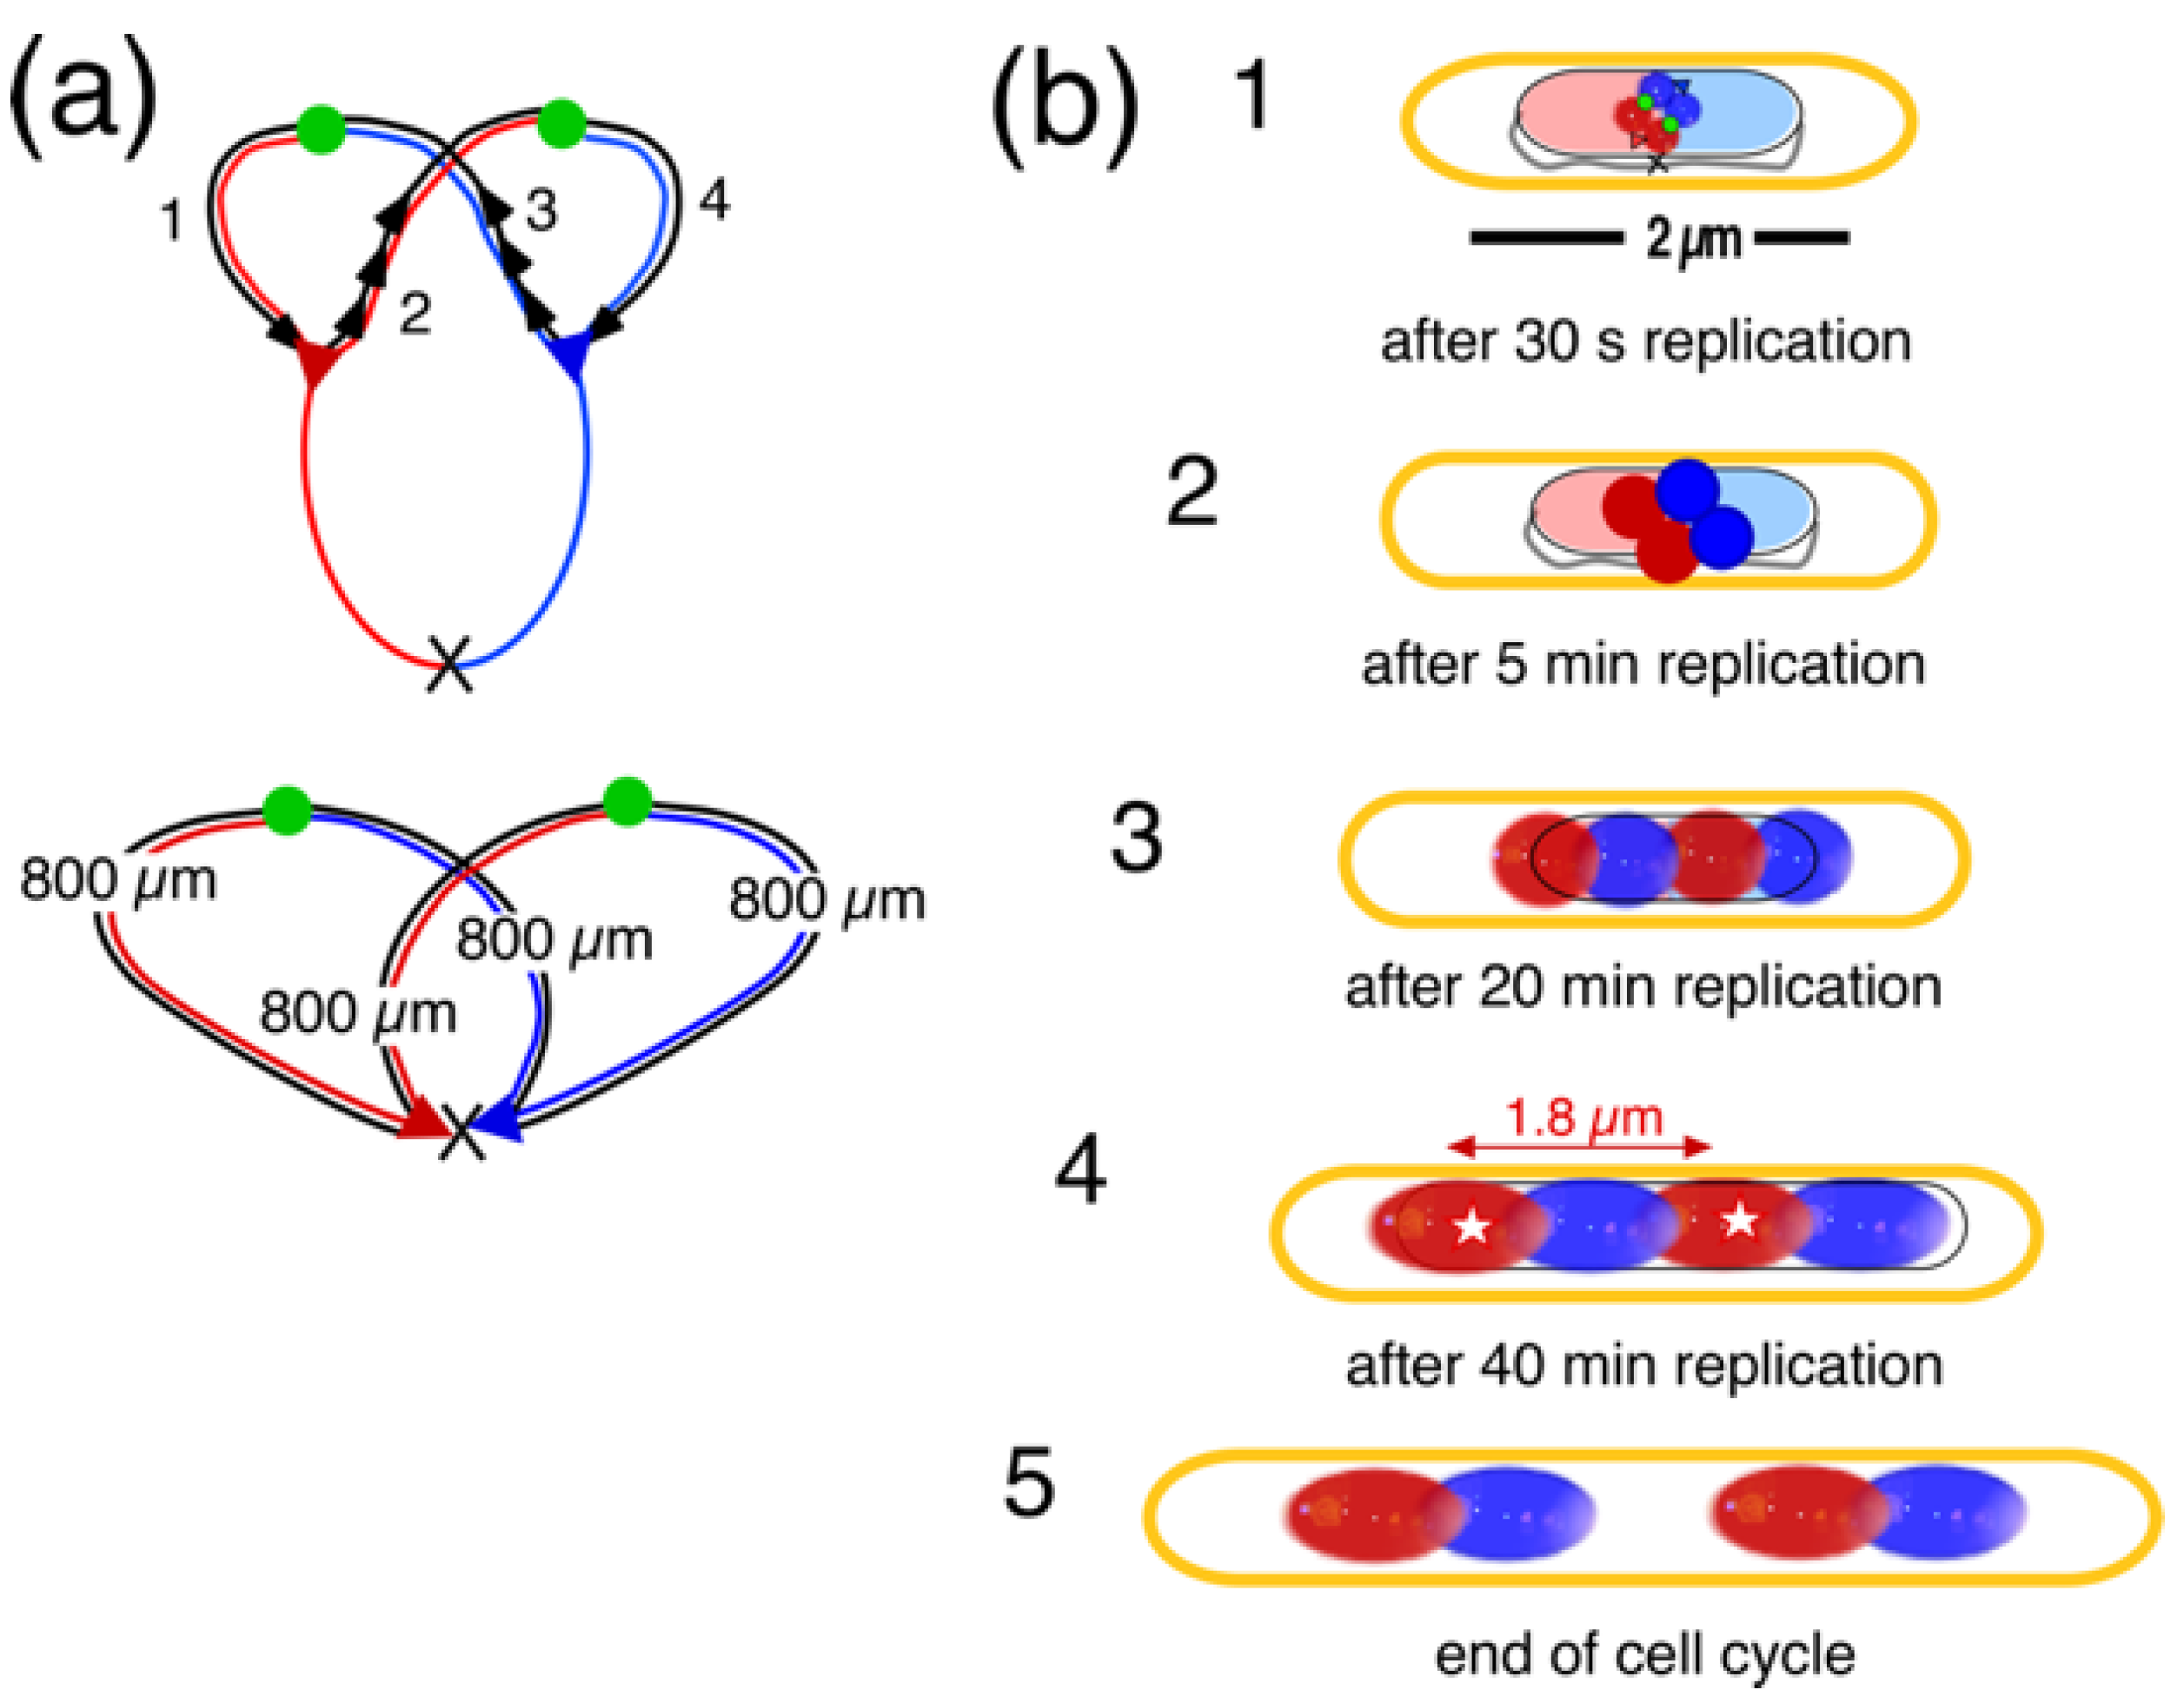
Table A3.
Domain volumes of the nucleoid after different periods of replication in slow-growing E. coli B/r cells (cf. Figure 11a, b, in main text).
Table A3.
Domain volumes of the nucleoid after different periods of replication in slow-growing E. coli B/r cells (cf. Figure 11a, b, in main text).
| Time after initiation |
Length of newly replicated DNA per domain (1) (µm) |
Approximate volume nascent domain (2) (µm3) |
Domain diameter sphere or diameter/length cylinder (µm) |
Used for panels in Figure A1b |
| 30 s | 10 | 0.0015 | 0.14 | 1 |
| 5 min | 100 | 0.015 | 0.31 | 2 |
| 10 min | 200 | 0.031 | 0.39 | - |
| 20 min | 400 | 0.062 | 0.46/0.53 | 3 |
| 30 min | 600 | 0.093 | 0.46/0.7 | - |
| 40 min | 800 | 0.124 | 0.46/0.9 | 4 |
(1) See Figure 10a,b in main text. (2) Assuming the same packing density that holds for the chromosome (~1600 µm) in a nucleoid volume of 0.24 µm3 (see text).
2. Segregation distances measured between replicated loci pairs in growing and non-growing cells
Estimates of distances performed in live, unfixed E. coli cells, constructed by Flemming Hansen as described in [63]. The Four-excluding-arms model explains the observed patterns of replichores (Figure A1b) as well as the segregation distances measured between replicated loci pairs (Figure A2).
Figure A2.
Graphical overview of the average distances between spot pairs (L-L; O-O; R-R) measured in growing and non-growing, rifampicin-inhibited cells of E. coli K-12 (MG1655), as documented in Table 3 of [63]. The lengths of cells and segregation distances (colored, double arrows) are drawn to scale. Numbers next to the double arrows indicate distances in µm, averaged over the first 5 constructs in Table 3 of [63]. Because nucleoids were not visualized by staining, their sizes are not known and are drawn schematically. (a) In growing cells, showing the LRLR ordering pattern of chromosome arms, replicated loci of the L-O-R pattern segregate apart over similar distances maintaining the pattern L-O-R-L-O-R (see Figure 9 in main text). Red and blue triangles indicate hypothetical replisomes that have slightly moved apart. (b) In cells showing the LRRL or RLLR ordering pattern, the hypothetical replisomes stay in the cell center and the L-L and R-R distances are either larger or smaller than the segregation distance between the origins (green O-O). (c), (d) In rifampicin-treated cells, loci segregate during run-off DNA synthesis in a similar way as in the control cells (cf. a, b). The smaller cells contain an elongated nucleoid that contains a double amount of DNA due to run-off DNA synthesis (indicated by the darker shade). Such nucleoids will not divide. Cell lengths and segregation distances are smaller than in growing cells (a, b).
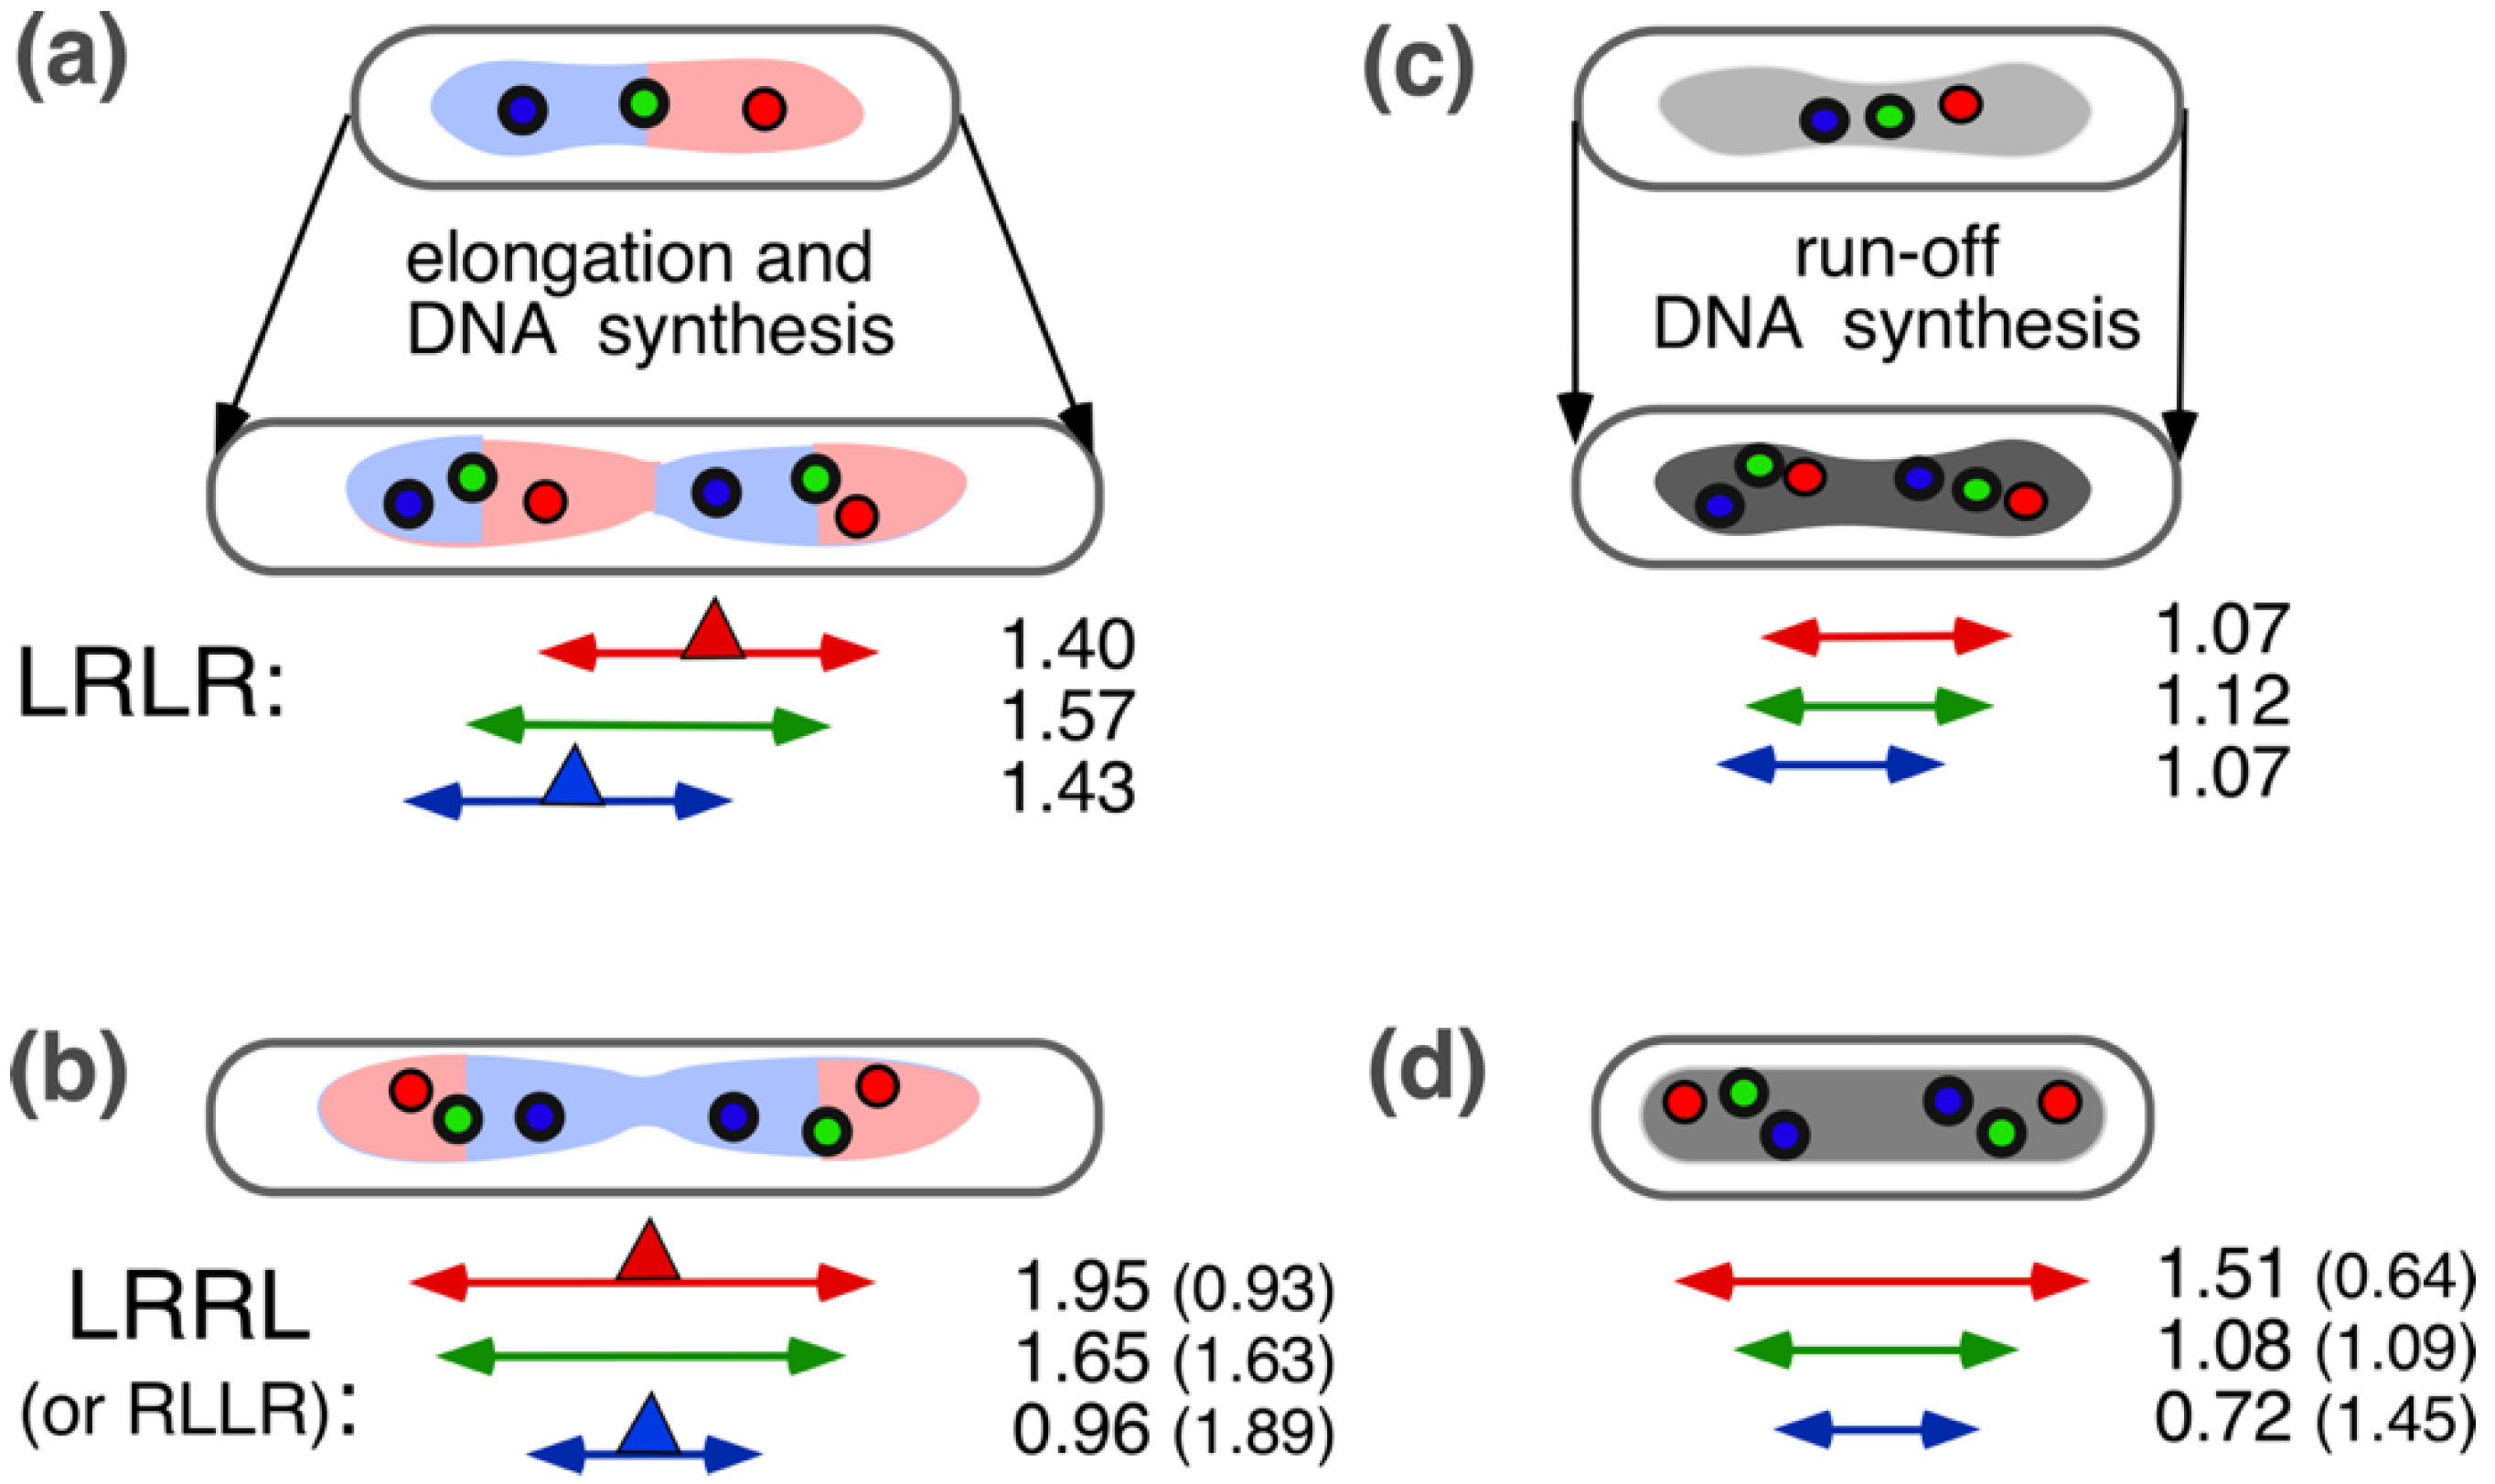
References
- Mason, D.J.; Powelson, D.M. Nuclear division as observed in live bacteria by a new technique. J Bacteriol 1956, 71, 474–479. [Google Scholar] [CrossRef]
- Robinow, C.; Kellenberger, E. The bacterial nucleoid revisited. Microbiol Rev 1994, 58, 211–232. [Google Scholar] [CrossRef]
- Kim, J.; Jeon, C.; Jeong, H.; Jung, Y.; Ha, B.Y. A polymer in a crowded and confined space: Effects of crowder size and poly-dispersity. Soft Matter 2015, 11, 1877–1888. [Google Scholar] [CrossRef]
- Joyeux, M. Organization of the bacterial nucleoid by DNA-bridging proteins and globular crowders. Front Microbiol 2023, 14, 1116776. [Google Scholar] [CrossRef]
- Odijk, T. Osmotic compaction of supercoiled DNA into a bacterial nucleoid. Biophys Chem 1998, 73, 23–29. [Google Scholar] [CrossRef]
- Chang, M.H.; Lavrentovich, M.O.; Mannik, J. Differentiating the roles of proteins and polysomes in nucleoid size homeostasis in Escherichia coli. Biophys J 2023. [Google Scholar] [CrossRef]
- Yang, D.; Mannik, J.; Retterer, S.T.; Mannik, J. The effects of polydisperse crowders on the compaction of the Escherichia coli nucleoid. Mol Microbiol 2020, 113, 1022–1037. [Google Scholar] [CrossRef]
- Xiang, Y.; Surovtsev, I.V.; Chang, Y.; Govers, S.K.; Parry, B.R.; Liu, J.; Jacobs-Wagner, C. Interconnecting solvent quality, transcription, and chromosome folding in Escherichia coli. Cell 2021. [Google Scholar] [CrossRef]
- Le, T.B.; Imakaev, M.V.; Mirny, L.A.; Laub, M.T. High-resolution mapping of the spatial organization of a bacterial chromosome. Science 2013, 342, 731–734. [Google Scholar] [CrossRef]
- Bignaud, A.; Cockram, C.; Borde, C.; Groseille, J.; Allemand, E.; Thierry, A.; Marbouty, M.; Mozziconacci, J.; Espéli, O.; Koszul, R. Transcription-induced domains form the elementary constraining building blocks of bacterial chromosomes. Nat Struct Mol Biol 2024. [Google Scholar] [CrossRef]
- Leonard, A.C.; Grimwade, J.E. The orisome: Structure and function. Front Microbiol 2015, 6, 545. [Google Scholar] [CrossRef]
- Wang, X.; Liu, X.; Possoz, C.; Sherratt, D.J. The two Escherichia coli chromosome arms locate to separate cell halves. Genes Dev 2006, 20, 1727–1731. [Google Scholar] [CrossRef]
- Nielsen, H.J.; Ottesen, J.R.; Youngren, B.; Austin, S.J.; Hansen, F.G. The Escherichia coli chromosome is organized with the left and right chromosome arms in separate cell halves. Mol Microbiol 2006, 62, 331–338. [Google Scholar] [CrossRef]
- Kawalek, A.; Wawrzyniak, P.; Bartosik, A.A.; Jagura-Burdzy, G. Rules and exceptions: The role of chromosomal ParB in DNA segregation and other cellular processes. Microorganisms 2020, 8, 105. [Google Scholar] [CrossRef]
- Livny, J.; Yamaichi, Y.; Waldor, M.K. Distribution of centromere-like pars sites in bacteria: Insights from comparative genomics. J Bacteriol 2007, 189, 8693–8703. [Google Scholar] [CrossRef]
- Viollier, P.H.; Thanbichler, M.; McGrath, P.T.; West, L.; Meewan, M.; McAdams, H.H.; Shapiro, L. Rapid and sequential movement of individual chromosomal loci to specific subcellular locations during bacterial DNA replication. Proceedings of the National Academy of Science U.S.A. 2004, 101, 9257–9262. [Google Scholar] [CrossRef]
- Robalino-Espinosa, J.S.; Zupan, J.R.; Chavez-Arroyo, A.; Zambryski, P. Segregation of four agrobacterium tumefaciens replicons during polar growth: PopZ and PodJ control segregation of essential replicons. Proc Natl Acad Sci U S A 2020, 117, 26366–26373. [Google Scholar] [CrossRef]
- Badrinarayanan, A.; Le, T.B.; Laub, M.T. Bacterial chromosome organization and segregation. Annual review of cell and developmental biology 2015, 31, 171–199. [Google Scholar] [CrossRef]
- Gogou, C.; Japaridze, A.; Dekker, C. Mechanisms for chromosome segregation in bacteria. Front Microbiol 2021, 12, 685687. [Google Scholar] [CrossRef]
- Schaechter, M.; Williamson, J.P.; Hood, J.R., Jr.; Koch, A.L. Growth, cell and nuclear divisions in some bacteria. J Gen Microbiol 1962, 29, 421–434. [Google Scholar] [CrossRef]
- Binnerts, J.S.; Woldringh, C.L.; Brakenhoff, G.J. Visualization of the nucleoid in living bacteria on poly-lysine coated surfaces by the immersion technique. J Microsc 1982, 125, 359–363. [Google Scholar] [CrossRef]
- Barer, R.; Joseph, S. Refractometry of living cells, Part I. Basic principles. Journal of Cell Science 1954, s3-95, 399–423. [Google Scholar] [CrossRef]
- Yamaichi, Y.; Niki, H. Migs, a cis-acting site that affects bipolar positioning of oric on the Escherichia coli chromosome. EMBO Journal 2004, 23, 221–233. [Google Scholar] [CrossRef]
- Woldringh, C.L. Morphological analysis of nuclear separation and cell division during the life cycle of Escherichia coli. J Bacteriol 1976, 125, 248–257. [Google Scholar] [CrossRef]
- Oldewurtel, E.R.; Kitahara, Y.; van Teeffelen, S. Robust surface-to-mass coupling and turgor-dependent cell width determine bacterial dry-mass density. Proc Natl Acad Sci U S A 2021, 118. [Google Scholar] [CrossRef]
- Oh, J.; Ryu, J.S.; Lee, M.; Jung, J.; Han, S.; Chung, H.J.; Park, Y. Three-dimensional label-free observation of individual bacteria upon antibiotic treatment using optical diffraction tomography. Biomed Opt Express 2020, 11, 1257–1267. [Google Scholar] [CrossRef]
- Valkenburg, J.A.; Woldringh, C.L. Phase separation between nucleoid and cytoplasm in Escherichia coli as defined by immersive refractometry. J Bacteriol 1984, 160, 1151–1157. [Google Scholar] [CrossRef]
- Churchward, G.; Bremer, H.; Young, R. Macromolecular composition of bacteria. Journal of theoretical biology 1982, 94, 651–670. [Google Scholar] [CrossRef]
- Brakenhoff, G.J.; Blom, P.; Barends, P. Confocal scanning light microscopy with high aperture immersion lenses. Journal of Microscopy 1979, 117, 219–232. [Google Scholar] [CrossRef]
- Nanninga, N. Molecular cytology of ‘little animals’: Personal recollections of Escherichia coli (and Bacillus subtilis). Life (Basel) 2023, 13. [Google Scholar] [CrossRef]
- Woldringh, C.L.; Nanninga, N. Structure of the nucleoid and cytoplasm in the intact cell. In Molecular cytology of Escherichia coli., Nanninga, N., Ed. Academic Press: London, 1985; pp 161-197.
- Zimmerman, S.B.; Murphy, L.D. Release of compact nucleoids with characteristic shapes from Escherichia coli. J Bacteriol 2001, 183, 5041–5049. [Google Scholar] [CrossRef]
- Cunha, S.; Woldringh, C.L.; Odijk, T. Polymer-mediated compaction and internal dynamics of isolated Escherichia coli nucleoids. J Struct Biol 2001, 136, 53–66. [Google Scholar] [CrossRef]
- Woldringh, C.L.; Odijk, T. Structure of DNA within the bacterial cell: Physics and physiology. In Organization of the prokaryotic genome, R.L. Charlebois Ed. American Society for Microbiology, Washington, D.C., 1999; pp 171-187.
- Pelletier, J.; Halvorsen, K.; Ha, B.Y.; Paparcone, R.; Sandler, S.J.; Woldringh, C.L.; Wong, W.P.; Jun, S. Physical manipulation of the Escherichia coli chromosome reveals its soft nature. Proc Natl Acad Sci U S A 2012, 109, E2649–E2656. [Google Scholar] [CrossRef]
- Grosberg, A.Y.; Khokhlov, A.R. Giant molecules: Here, there, and everywhere. Academic Press: New York, 1997; p 242.
- Reisner, W.; Pedersen, J.N.; Austin, R.H. DNA confinement in nanochannels: Physics and biological applications. Rep Prog Phys 2012, 75, 106601. [Google Scholar] [CrossRef]
- Fisher, J.K.; Bourniquel, A.; Witz, G.; Weiner, B.; Prentiss, M.; Kleckner, N. Four-dimensional imaging of E. coli nucleoid organization and dynamics in living cells. Cell 2013, 153, 882–895. [Google Scholar] [CrossRef]
- Bates, D.; Kleckner, N. Chromosome and replisome dynamics in Escherichia coli: Loss of sister cohesion triggers global chromosome movement and mediates chromosome segregation. Cell 2005, 121, 899–911. [Google Scholar] [CrossRef]
- Blattner, F.R.; Plunkett, G., 3rd; Bloch, C.A.; Perna, N.T.; Burland, V.; Riley, M.; Collado-Vides, J.; Glasner, J.D.; Rode, C.K.; Mayhew, G.F. , et al. The complete genome sequence of Escherichia coli K-12. Science 1997, 277, 1453–1462. [Google Scholar] [CrossRef]
- Weinberger, M.; Helmstetter, C.E. Chromosome replication and cell division in plasmid-containing Escherichia coli B/r. J Bacteriol 1979, 137, 1151–1157. [Google Scholar] [CrossRef]
- Gray, W.T.; Govers, S.K.; Xiang, Y.; Parry, B.R.; Campos, M.; Kim, S.; Jacobs-Wagner, C. Nucleoid size scaling and intracellular organization of translation across bacteria. Cell 2019, 177, 1632–1648.e20. [Google Scholar] [CrossRef]
- Bremer, H.; Dennis, P.P. Modulation of chemical composition and other parameters of the cell at different exponential growth rates. EcoSal Plus 2008, 3. [Google Scholar] [CrossRef]
- Wegner, A.S.; Alexeeva, S.; Odijk, T.; Woldringh, C.L. Characterization of Escherichia coli nucleoids released by osmotic shock. J Struct Biol 2012, 178, 260–269. [Google Scholar] [CrossRef] [PubMed]
- Junier, I.; Ghobadpour, E.; Espeli, O.; Everaers, R. DNA supercoiling in bacteria: State of play and challenges from a viewpoint of physics based modeling. Front Microbiol 2023, 14, 1192831. [Google Scholar] [CrossRef] [PubMed]
- Endesfelder, U. From single bacterial cell imaging towards in vivo single-molecule biochemistry studies. Essays Biochem 2019, 63, 187–196. [Google Scholar]
- Zhu, Y.; Mustafi, M.; Weisshaar, J.C. Biophysical properties of Escherichia coli cytoplasm in stationary phase by superresolution fluorescence microscopy. mBio 2020, 11. [Google Scholar] [CrossRef] [PubMed]
- Spahn, C.K.; Glaesmann, M.; Grimm, J.B.; Ayala, A.X.; Lavis, L.D.; Heilemann, M. A toolbox for multiplexed super-resolution imaging of the Escherichia coli nucleoid and membrane using novel paint labels. Sci Rep 2018, 8, 14768. [Google Scholar] [CrossRef] [PubMed]
- Spahn, C.; Hurter, F.; Glaesmann, M.; Karathanasis, C.; Lampe, M.; Heilemann, M. Protein-specific, multicolor and 3d STED imaging in cells with DNA-labeled antibodies. Angew Chem Int Ed Engl 2019, 58, 18835–18838. [Google Scholar] [CrossRef] [PubMed]
- Stracy, M.; Lesterlin, C.; Garza de Leon, F.; Uphoff, S.; Zawadzki, P.; Kapanidis, A.N. Live-cell superresolution microscopy reveals the organization of RNA polymerase in the bacterial nucleoid. Proc Natl Acad Sci U S A 2015, 112, E4390–E4399. [Google Scholar] [CrossRef] [PubMed]
- Jin, D.J.; Cagliero, C.; Zhou, Y.N. Role of rna polymerase and transcription in the organization of the bacterial nucleoid. Chem Rev 2013, 113, 8662–8682. [Google Scholar] [CrossRef] [PubMed]
- Lioy, V.S.; Junier, I.; Boccard, F. Multiscale dynamic structuring of bacterial chromosomes. Annu Rev Microbiol 2021, 75, 541–561. [Google Scholar] [CrossRef]
- Mondal, J.; Bratton, B.P.; Li, Y.; Yethiraj, A.; Weisshaar, J.C. Entropy-based mechanism of ribosome-nucleoid segregation in Escherichia coli cells. Biophys J 2011, 100, 2605–2613. [Google Scholar] [CrossRef]
- Cabrera, J.E.; Cagliero, C.; Quan, S.; Squires, C.L.; Jin, D.J. Active transcription of rrna operons condenses the nucleoid in Escherichia coli: Examining the effect of transcription on nucleoid structure in the absence of transertion. J Bacteriol 2009, 191, 4180–4185. [Google Scholar] [CrossRef] [PubMed]
- Spahn, C.; Middlemiss, S.; Gómez-de-Mariscal, E.; Henriques, R.; Bode, H.B.; Holden, S.; Heilemann, M. Transertion and cell geometry organize the Escherichia coli nucleoid during rapid growth. bioRxiv, 2023; 2023.2010.2016.562172. [Google Scholar]
- Dworsky, P.; Schaechter, M. Effect of rifampin on the structure and membrane attachment of the nucleoid of Escherichia coli. J Bacteriol 1973, 116, 1364–1374. [Google Scholar] [CrossRef] [PubMed]
- Harrington, E.W.; Trun, N.J. Unfolding of the bacterial nucleoid both in vivo and in vitro as a result of exposure to camphor. J Bacteriol 1997, 179, 2435–2439. [Google Scholar] [CrossRef]
- Van Helvoort, J.; Huls, P.G.; Vischer, N.O.E.; Woldringh, C.L. Fused nucleoids resegregate faster than cell elongation in Escherichia coli pbpB(ts) filaments after release from chloramphenicol inhibition. Microbiology (Reading) 1998, 144, 1309–1317. [Google Scholar] [CrossRef]
- Sun, Q.; Margolin, W. Effects of perturbing nucleoid structure on nucleoid occlusion-mediated toporegulation of FtsZ ring assembly. J Bacteriol 2004, 186, 3951–3959. [Google Scholar] [CrossRef] [PubMed]
- Bakshi, S.; Siryaporn, A.; Goulian, M.; Weisshaar, J.C. Superresolution imaging of ribosomes and RNA polymerase in live Escherichia coli cells. Mol Microbiol, 2012; 85, 21–38. [Google Scholar] [CrossRef]
- Bakshi, S.; Choi, H.; Mondal, J.; Weisshaar, J.C. Time-dependent effects of transcription- and translation-halting drugs on the spatial distributions of the Escherichia coli chromosome and ribosomes. Mol Microbiol 2014, 94, 871–887. [Google Scholar] [CrossRef]
- Bakshi, S.; Choi, H.; Weisshaar, J.C. The spatial biology of transcription and translation in rapidly growing Escherichia coli. Front Microbiol 2015, 6, 636. [Google Scholar] [CrossRef]
- Woldringh, C.L.; Hansen, F.G.; Vischer, N.O.; Atlung, T. Segregation of chromosome arms in growing and non-growing Escherichia coli cells. Front Microbiol 2015, 6, 448. [Google Scholar] [CrossRef]
- Kohiyama, M.; Herrick, J.; Norris, V. Open questions about the roles of DnaA, related proteins, and hyperstructure dynamics in the cell cycle. Life 2023, 13, 1890. [Google Scholar] [CrossRef]
- Nielsen, H.J.; Youngren, B.; Hansen, F.G.; Austin, S. Dynamics of Escherichia coli chromosome segregation during multifork replication. J Bacteriol 2007, 189, 8660–8666. [Google Scholar] [CrossRef]
- Liu, X.; Wang, X.; Reyes-Lamothe, R.; Sherratt, D. Replication-directed sister chromosome alignment in Escherichia coli. Mol Microbiol 2010, 75, 1090–1097. [Google Scholar] [CrossRef] [PubMed]
- Reyes-Lamothe, R.; Nicolas, E.; Sherratt, D.J. Chromosome replication and segregation in bacteria. Annu Rev Genet 2012, 46, 121–143. [Google Scholar] [CrossRef] [PubMed]
- Reyes-Lamothe, R.; Sherratt, D.J. The bacterial cell cycle, chromosome inheritance and cell growth. Nat Rev Microbiol 2019, 17, 467–478. [Google Scholar] [CrossRef]
- Helmstetter, C.E. DNA synthesis during the division cycle of rapidly growing Escherichia coli B/r. J Mol Biol 1968, 31, 507–518. [Google Scholar] [CrossRef] [PubMed]
- Makela, J.; Uphoff, S.; Sherratt, D.J. Nonrandom segregation of sister chromosomes by Escherichia coli MukBEF. Proc Natl Acad Sci U S A 2021, 118. [Google Scholar] [CrossRef] [PubMed]
- Norris, V.; Madsen, M.S. Autocatalytic gene expression occurs via transertion and membrane domain formation and underlies differentiation in bacteria: A model. J Mol Biol 1995, 253, 739–748. [Google Scholar] [CrossRef] [PubMed]
- Woldringh, C.L. The role of co-transcriptional translation and protein translocation (transertion) in bacterial chromosome segregation. Mol Microbiol 2002, 45, 17–29. [Google Scholar] [CrossRef] [PubMed]
- Lemon, K.P.; Grossman, A.D. The extrusion-capture model for chromosome partitioning in bacteria. Genes Dev 2001, 15, 2031–2041. [Google Scholar] [CrossRef]
- Youngren, B.; Nielsen, H.J.; Jun, S.; Austin, S. The multifork Escherichia coli chromosome is a self-duplicating and self-segregating thermodynamic ring polymer. Genes Dev 2014, 28, 71–84. [Google Scholar] [CrossRef]
- Wiggins, P.A.; Cheveralls, K.C.; Martin, J.S.; Lintner, R.; Kondev, J. Strong intranucleoid interactions organize the Escherichia coli chromosome into a nucleoid filament. Proc Natl Acad Sci U S A 2010, 107, 4991–4995. [Google Scholar] [CrossRef]
- Wang, X.; Sherratt, D.J. Independent segregation of the two arms of the Escherichia coli ori region requires neither RNA synthesis nor MreB dynamics. J Bacteriol 2010, 192, 6143–6153. [Google Scholar] [CrossRef] [PubMed]
- Dame, R.T.; Rashid, F.M.; Grainger, D.C. Chromosome organization in bacteria: Mechanistic insights into genome structure and function. Nat Rev Genet 2019. [Google Scholar] [CrossRef] [PubMed]
- Makela, J.; Sherratt, D.J. Organization of the Escherichia coli chromosome by a mukbef axial core. Mol Cell 2020, 78, 250–260.e5. [Google Scholar] [CrossRef] [PubMed]
- Jun, S.; Mulder, B. Entropy-driven spatial organization of highly confined polymers: Lessons for the bacterial chromosome. Proc Natl Acad Sci U S A 2006, 103, 12388–12393. [Google Scholar] [CrossRef] [PubMed]
- Jun, S.; Wright, A. Entropy as the driver of chromosome segregation. Nat Rev Microbiol 2010, 8, 600–607. [Google Scholar] [CrossRef] [PubMed]
- Elmore, S.; Muller, M.; Vischer, N.; Odijk, T.; Woldringh, C.L. Single-particle tracking of oriC-GFP fluorescent spots during chromosome segregation in Escherichia coli. J Struct Biol 2005, 151, 275–287. [Google Scholar] [CrossRef] [PubMed]
- Khodursky, A.; Guzman, E.C.; Hanawalt, P.C. Thymineless death lives on: New insights into a classic phenomenon. Annu Rev Microbiol 2015, 69, 247–263. [Google Scholar] [CrossRef]
- Woldringh, C.L. The bacterial nucleoid: From electron microscopy to polymer physics-a personal recollection. Life (Basel) 2023, 13. [Google Scholar] [CrossRef] [PubMed]
- Joshi, M.C.; Bourniquel, A.; Fisher, J.; Ho, B.T.; Magnan, D.; Kleckner, N.; Bates, D. Escherichia coli sister chromosome separation includes an abrupt global transition with concomitant release of late-splitting intersister snaps. Proc Natl Acad Sci U S A 2011, 108, 2765–2770. [Google Scholar] [CrossRef]
- Zaritsky, A.; Vollmer, W.; Mannik, J.; Liu, C. Does the nucleoid determine cell dimensions in Escherichia coli? Front Microbiol 2019, 10, 1717. [Google Scholar] [CrossRef]
- Zaritsky, A.; Woldringh, C.L.; Fishov, I.; Vischer, N.O.E.; Einav, M. Varying division planes of secondary constrictions in spheroidal Escherichia coli cells. Microbiology (Reading) 1999, 145 Pt 5, 1015–1022. [Google Scholar] [CrossRef] [PubMed]
- Valens, M.; Penaud, S.; Rossignol, M.; Cornet, F.; Boccard, F. Macrodomain organization of the Escherichia coli chromosome. EMBO J 2004, 23, 4330–4341. [Google Scholar] [CrossRef] [PubMed]
- Javer, A.; Kuwada, N.J.; Long, Z.; Benza, V.G.; Dorfman, K.D.; Wiggins, P.A.; Cicuta, P.; Lagomarsino, M.C. Persistent super-diffusive motion of Escherichia coli chromosomal loci. Nat Commun 2014, 5, 3854. [Google Scholar] [CrossRef] [PubMed]
- Reyes-Lamothe, R.; Wang, X.; Sherratt, D. Escherichia coli and its chromosome. Trends Microbiol 2008, 16, 238–245. [Google Scholar] [CrossRef] [PubMed]
- Zaritsky, A.; Wang, P.; Vischer, N.O. Instructive simulation of the bacterial cell division cycle. Microbiology 2011, 157, 1876–1885. [Google Scholar] [CrossRef] [PubMed]
- Woldringh, C.L.; Grover, N.B.; Rosenberger, R.F.; Zaritsky, A. Dimensional rearrangement of rod-shaped bacteria following nutritional shift-up. Ii. Experiments with Escherichia coli B/r. Journal of theoretical biology 1980, 86, 441–454. [Google Scholar] [CrossRef]
- Gadde, S.; Heald, R. Mechanisms and molecules of the mitotic spindle. Curr Biol 2004, 14, R797–R805. [Google Scholar] [CrossRef]
- Goloborodko, A.; Imakaev, M.V.; Marko, J.F.; Mirny, L. Compaction and segregation of sister chromatids via active loop extrusion. Elife 2016, 5. [Google Scholar] [CrossRef]
- Hirano, T. Condensin-based chromosome organization from bacteria to vertebrates. Cell 2016, 164, 847–857. [Google Scholar] [CrossRef]
- Nanninga, N.; Roos, M.; Woldringh, C.L. Models on stickiness of replicated Escherichia coli oriC. Microbiology (Reading) 2002, 148, 3327–3328. [Google Scholar] [CrossRef]
- Wang, X.; Reyes-Lamothe, R.; Sherratt, D.J. Modulation of Escherichia coli sister chromosome cohesion by topoisomerase iv. Genes Dev 2008, 22, 2426–2433. [Google Scholar] [CrossRef] [PubMed]
- Woldringh, C.L.; Nanninga, N. Structural and physical aspects of bacterial chromosome segregation. J Struct Biol 2006, 156, 273–283. [Google Scholar] [CrossRef] [PubMed]
- Roos, M.; Van Geel, A.B.; Aarsman, M.E.; Veuskens, J.T.; Woldringh, C.L.; Nanninga, N. The replicated ftsQAZ and minB chromosomal regions of Escherichia coli segregate on average in line with nucleoid movement. Molecular Microbiology 2001, 39, 633–640. [Google Scholar] [CrossRef] [PubMed]
- Lau, I.F.; Filipe, S.R.; Soballe, B.; Okstad, O.A.; Barre, F.X.; Sherratt, D.J. Spatial and temporal organization of replicating Escherichia coli chromosomes. Mol Microbiol 2003, 49, 731–743. [Google Scholar] [CrossRef] [PubMed]
- Helgesen, E.; Fossum-Raunehaug, S.; Saetre, F.; Schink, K.O.; Skarstad, K. Dynamic Escherichia coli SeqA complexes organize the newly replicated DNA at a considerable distance from the replisome. Nucleic Acids Res 2015, 43, 2730–2743. [Google Scholar] [CrossRef] [PubMed]
- Wu, F.; Japaridze, A.; Zheng, X.; Wiktor, J.; Kerssemakers, J.W.J.; Dekker, C. Direct imaging of the circular chromosome in a live bacterium. Nat Commun 2019, 10, 2194. [Google Scholar] [CrossRef] [PubMed]
- Japaridze, A.; Gogou, C.; Kerssemakers, J.W.J.; Nguyen, H.M.; Dekker, C. Direct observation of independently moving replisomes in Escherichia coli. Nat Commun 2020, 11, 3109. [Google Scholar] [CrossRef]
- Mir, M.; Babacan, S.D.; Bednarz, M.; Do, M.N.; Golding, I.; Popescu, G. Visualizing Escherichia coli sub-cellular structure using sparse deconvolution spatial light interference tomography. PLoS One 2012, 7, e39816. [Google Scholar] [CrossRef]
- Cunha, S. In Experiments on the bacterial nucleoid of Escherichia coli viewed as a physical entity, Thesis Technical University of Delft 2004. ISBN 90-77595-77-5.
- Boles, T.C.; White, J.H.; Cozzarelli, N.R. Structure of plectonemically supercoiled DNA. J Mol Biol 1990, 213, 931–951. [Google Scholar] [CrossRef]
- Popescu, G.; Park, Y.; Lue, N.; Best-Popescu, C.; Deflores, L.; Dasari, R.R.; Feld, M.S.; Badizadegan, K. Optical imaging of cell mass and growth dynamics. Am J Physiol Cell Physiol 2008, 295, C538–C544. [Google Scholar] [CrossRef]
- Ehrenberg, M.; Bremer, H.; Dennis, P.P. Medium-dependent control of the bacterial growth rate. Biochimie 2013, 95, 643–658. [Google Scholar] [CrossRef]
- Milo, R. What is the total number of protein molecules per cell volume? A call to rethink some published values. Bioessays 2013, 35, 1050–1055. [Google Scholar] [CrossRef]
- Ortega, J.P. Physical characterization of the 16s and 23s ribosomal ribonucleic acids from Escherichia coli. Graduate student thesis, University of Montana, 1978.
- Xu, Z.-Q.; Dixon, N.E. Bacterial replisomes. Current Opinion Structural Biology 2018, 53, 159–168. [Google Scholar] [CrossRef]
- O’Donnell, M. Replisome architecture and dynamics in Escherichia coli. J Biol Chem 2006, 281, 10653–10656. [Google Scholar] [CrossRef]
Figure 1.
Visualization of the bacterial nucleoid in live E. coli cells by three different laboratories, applying immersion of cells in medium with a high refractive index. The nucleoids become visible when the refractive indices of cytoplasm and immersion medium become almost equal in the range of n = 1.38 to 1.39. (a) Mason and Powelson [1] used 20% gelatin for the immersion medium and a phase contrast microscope that showed dark areas in the cells, comparable to the nuclei of stained preparations (negative phase contrast). Here, the image contrast has been inverted. Time separation between images about 6 min. (See for the original photograph of Mason and Powelson [1] the description by Elio Schaechter in “Small Things Considered”. (b) Cut-out from [21]. Note the increase in refractive index of the medium for the 3 panels from n = 1.37, 1.38 to 1.39, achieved with increased concentrations of bovine serum albumin (BSA) and reduced salt concentrations in the medium to keep the osmolality constant. The lowest panel shows “phase reversal”: the light intensity of the nucleoid is higher than that of the surrounding medium. (c) Still from a movie of Hironori Niki [23] of rapidly growing E. coli cells immersed in gelatin. With permission from Niki (Microbial Physiology Laboratory, Department of Gene Function and Phenomics, National Institute of Genetics, Shizuoka, 411-8540 Japan). Magnification bars 1 µm.
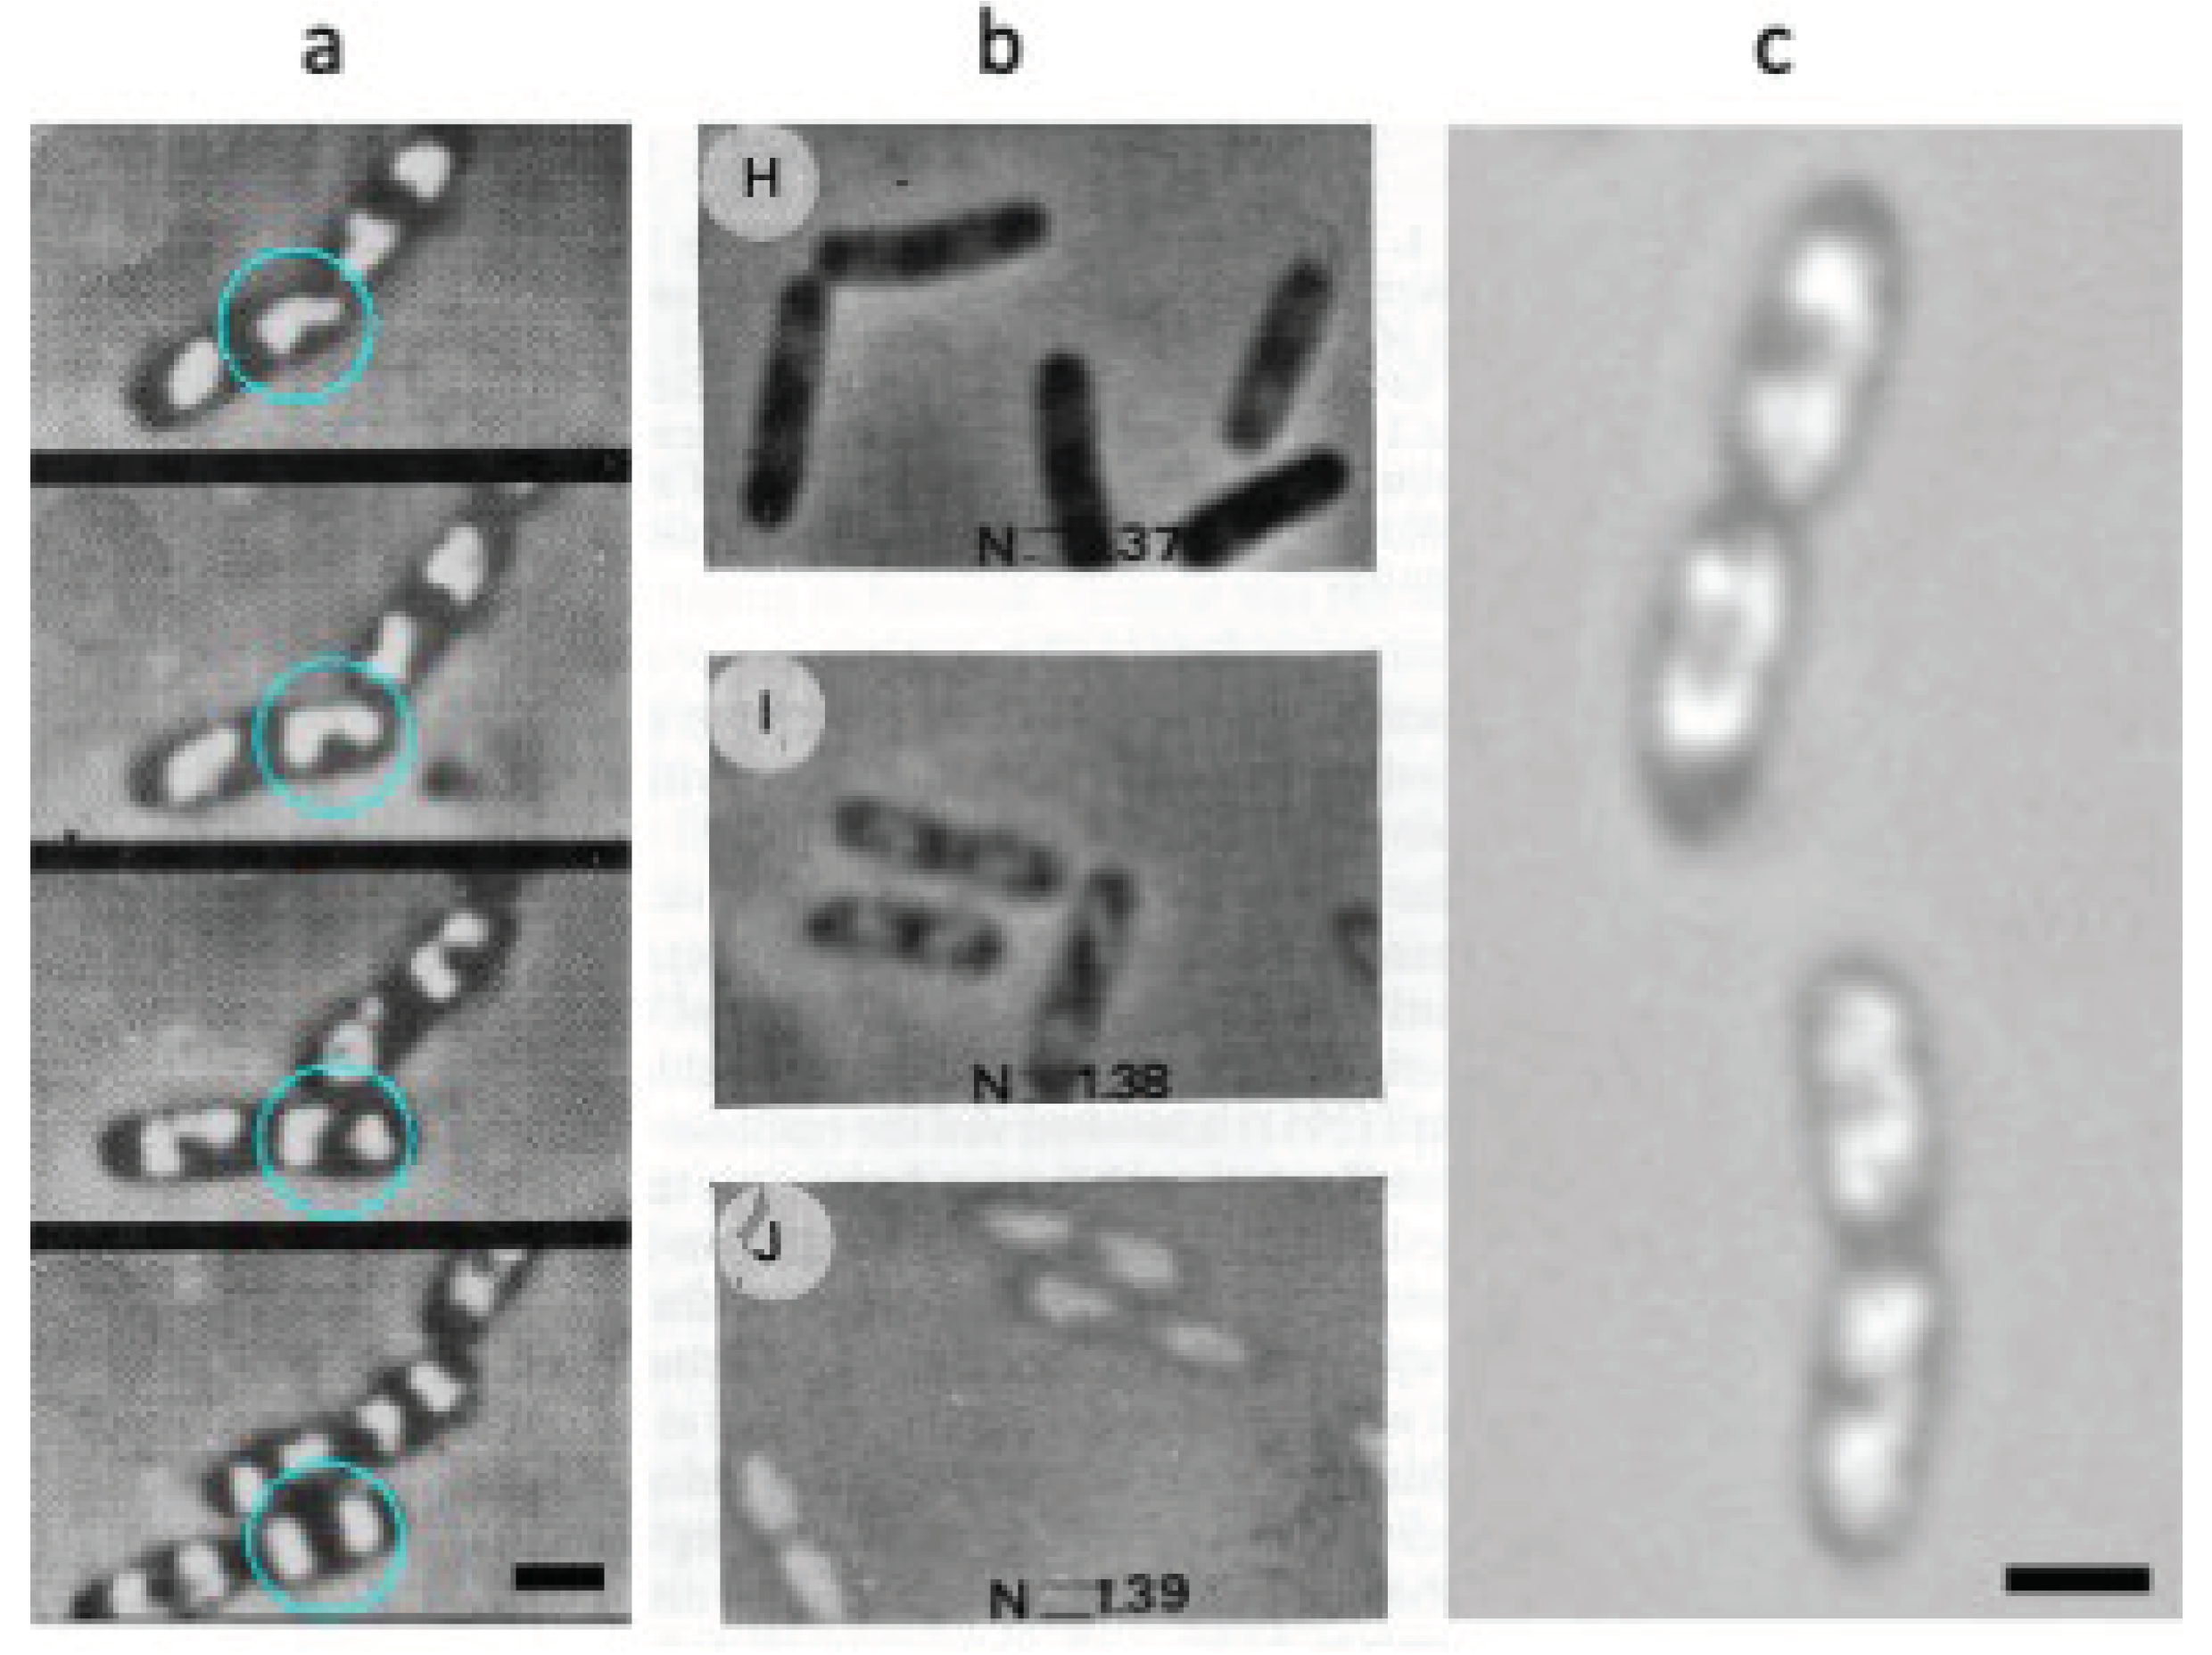
Figure 2.
Cut-out of Figure 2a and b of Oh et al. (2020 [26]). E. coli cells were grown in Tryptic soy broth in the absence of antibiotics. Doubling time at 25°C is 56 min. (a) Three-section view of the reconstructed RI distribution of E. coli cells, grown for 240 min without antibiotics. The color map shows values of RI. (b) 3D rendered image of the growing cells in (a) obtained with “Tomocube software”. The red, double arrow shows a cell with 2 nucleoids having a lower RI-value. Scale bar 3 µm. Permission obtained from Yongkeun Park (Department of Physics, Korea Advanced Institute of Science and Technology, Daejeon, 34141, South Korea).
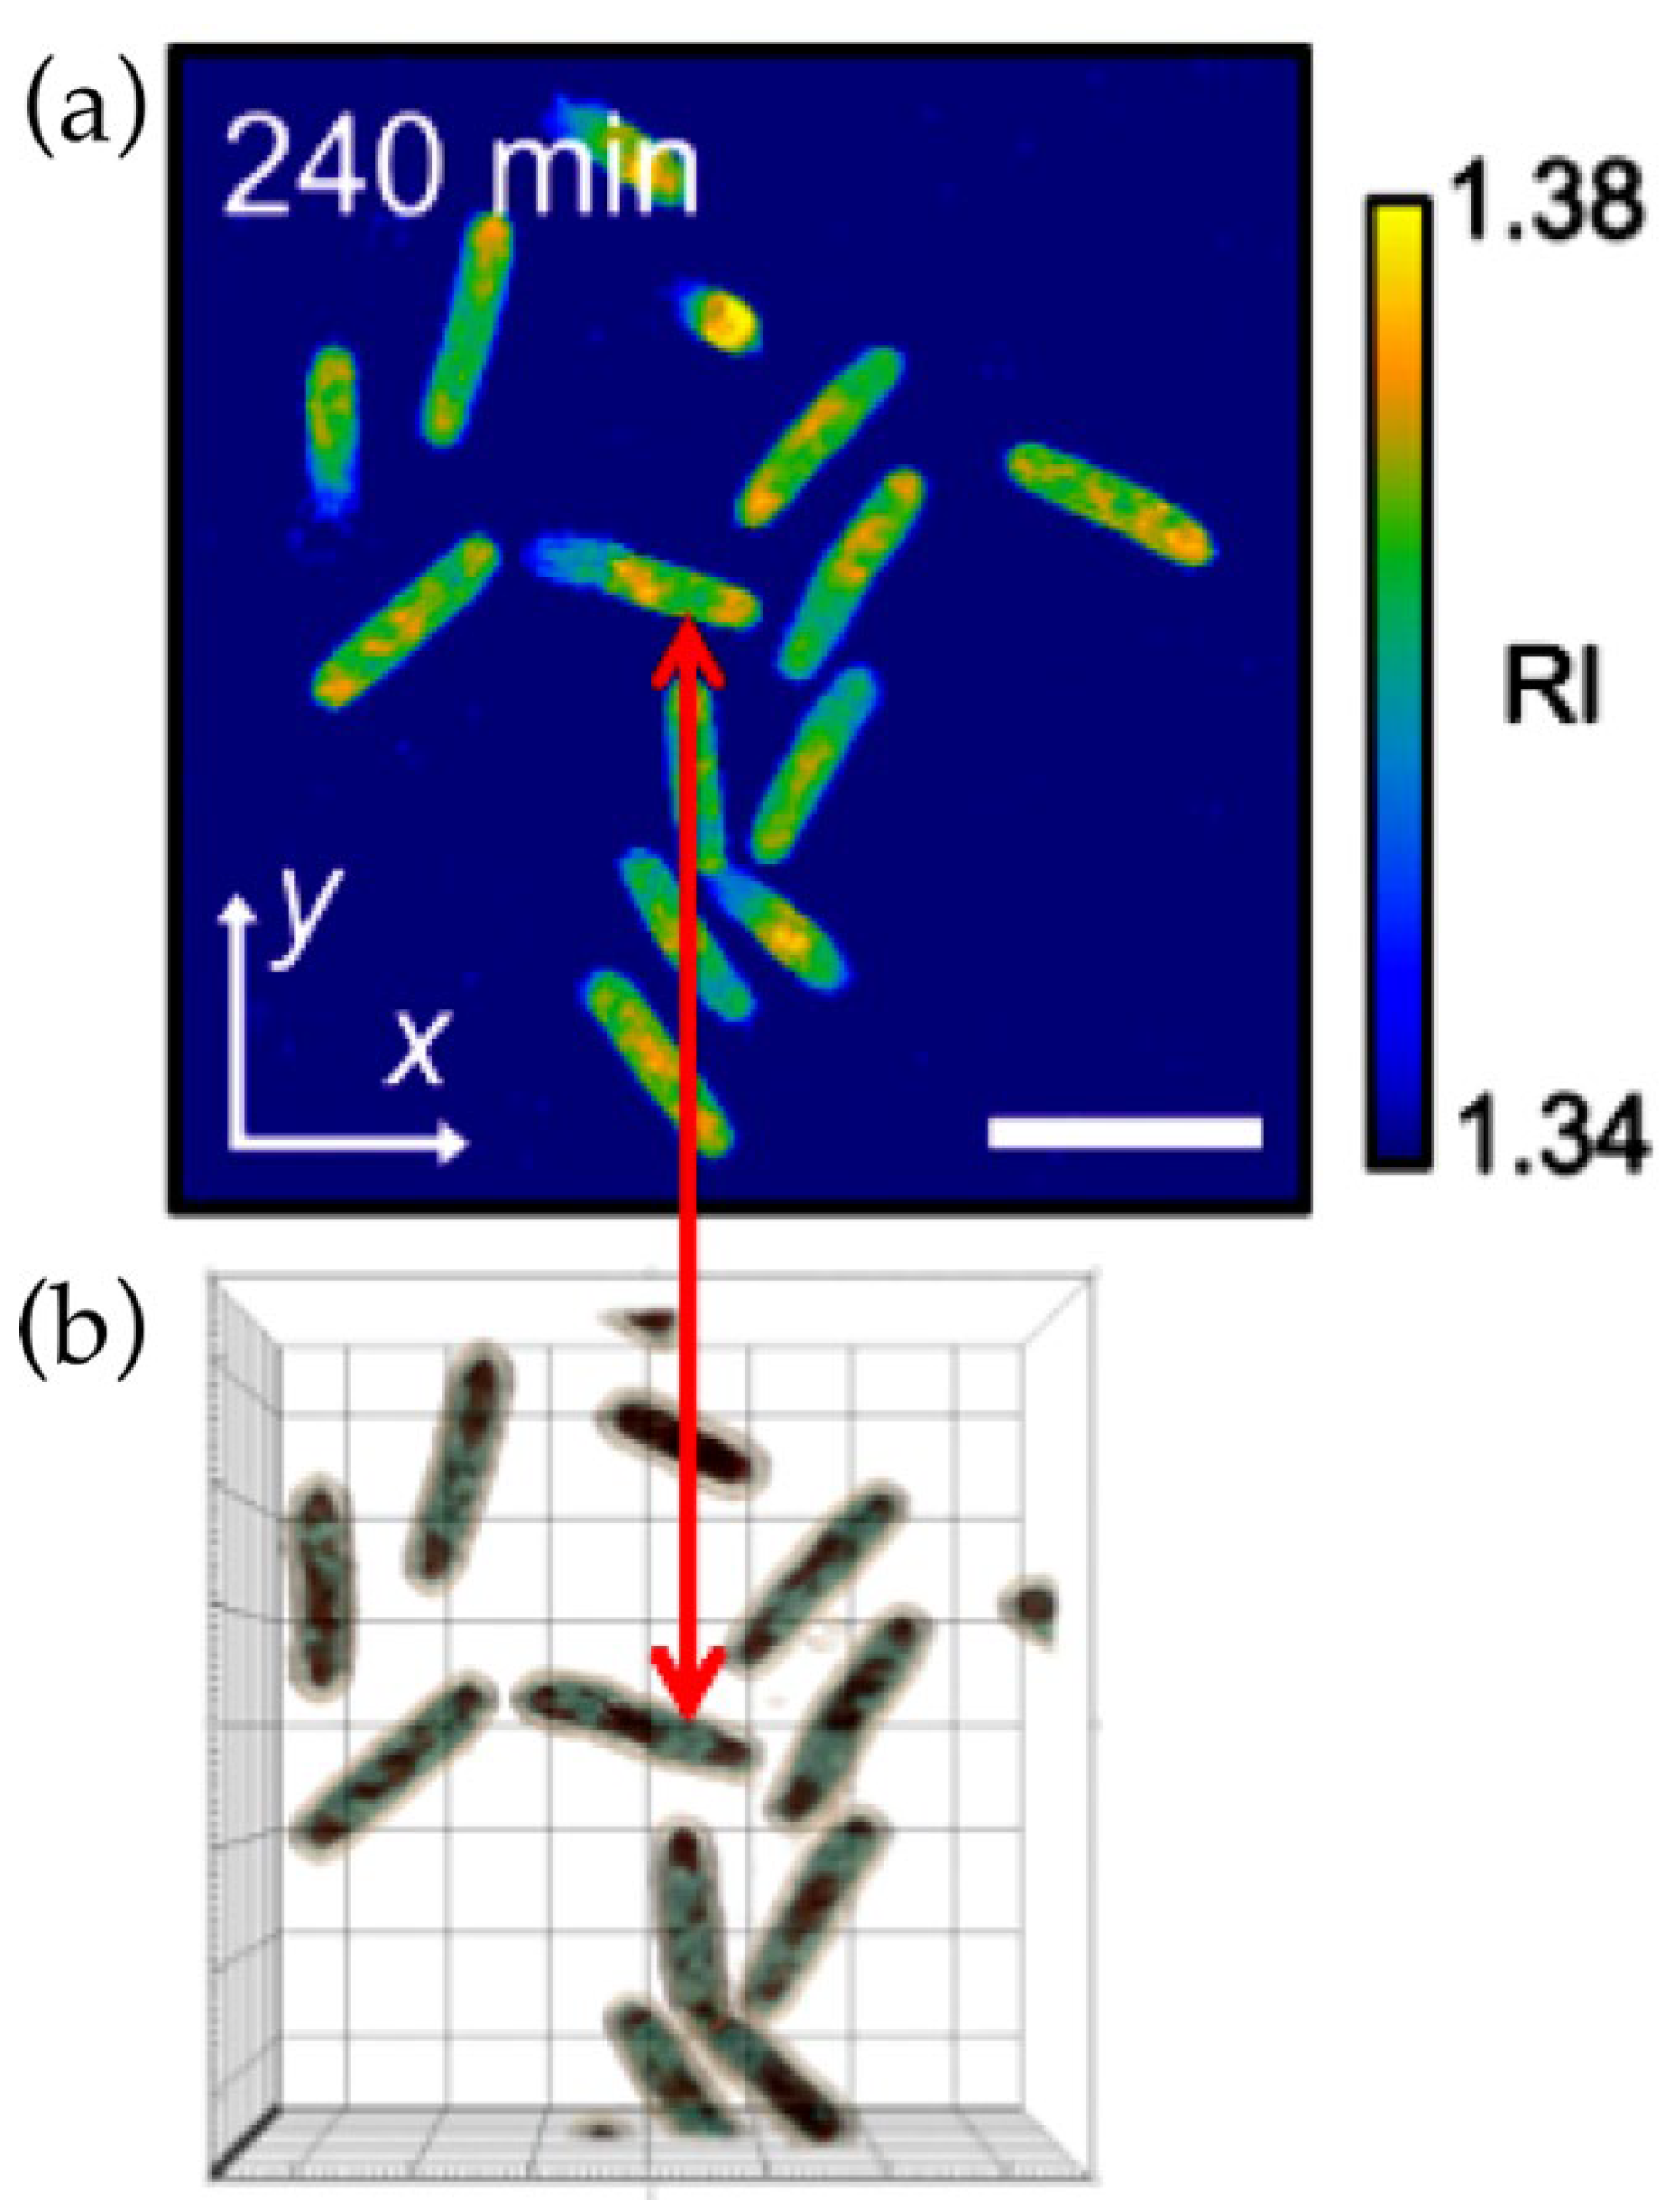
Figure 3.
Immersive refractometry of an E. coli B/r cell growing in alanine medium with a doubling time Td = 150 min. (a) See for the real cell dimensions Figure A2 in [27]: cell diameter, dcell (= 0.5 µm); thickness of cytoplasmic layer surrounding the nucleoid, d1 (= 0.145 µm); diameter of the nucleoid, d2 (= 0.21 µm). In the left and right panels, the cell is immersed in 17.5 and 24 % BSA, respectively, with refractive indices (n1) of 1.342 and 1.370. (b) Refractive indices integrated along the optical axis for different positions of the cell: cell center (n4); cytoplasm (n2); nucleoid (n3). (c) The calculated relative light intensity of the phase-contrast image is indicated as in Figure 5 of [31]. The intensity of the background is taken to be equal (dashed line). Note that the difference in relative light intensity (ΔI) of the nucleoid-containing part (n4) has increased in the higher refractive index medium and that the disturbing halo around the cell has decreased, both improving the visibility of the nucleoid.
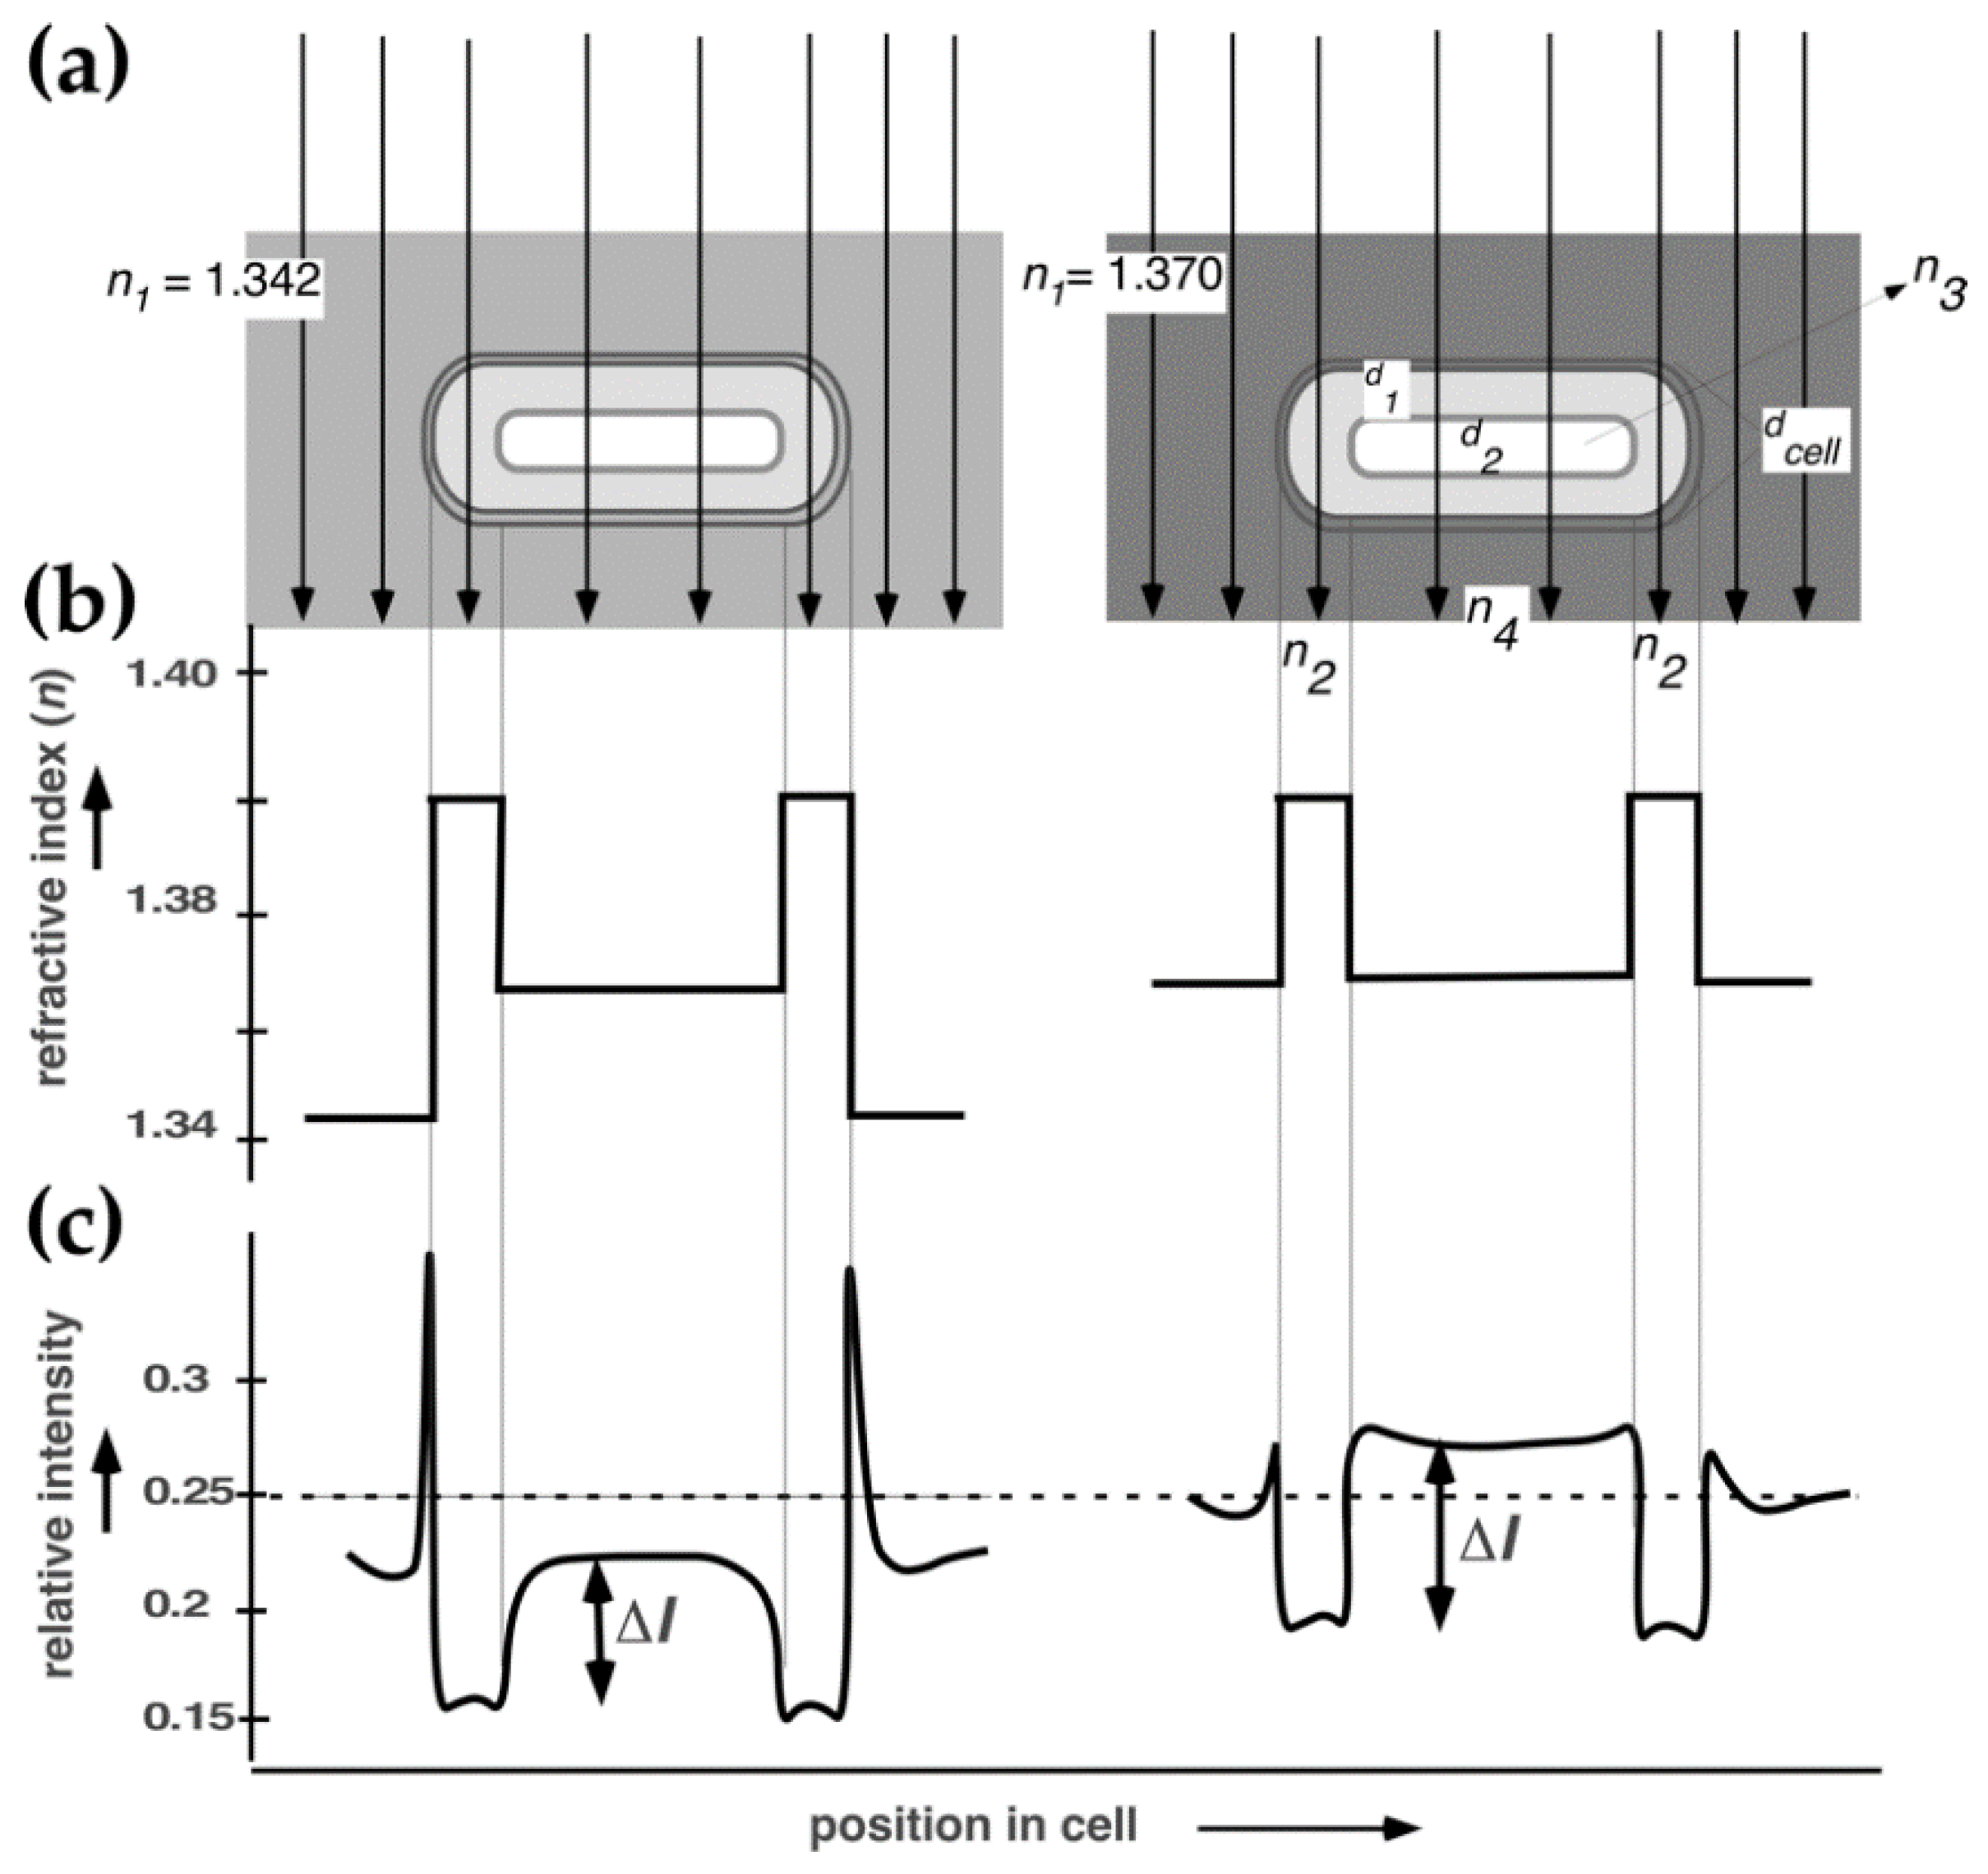
Figure 4.
Graphical summary of Odijk’s free-energy approach; see also Appendix A. (a) Topology of the linear double helix with a diameter of deff = 2 nm: solvent molecules (black circles) collide with a linear DNA strand with an energy of 1 kBT, the amount of energy per thermal fluctuation. The continuous collisions cause the DNA to resemble a wormlike chain. Nevertheless, sections of the chain somewhat less than the persistence length P (about 45 nm, giving a Kuhn length of 90 nm) are essentially rod-like. Two points on the DNA contour separated by a distance much greater that P are uncorrelated (see Figure 3A and Equation (1) in [34]. (b) The DNA double helix is depicted as a branched supercoil. See Appendix A for the calculation of the excluded volume of two colliding superhelical Kuhn segments. (c) Electrostatic cross-interactions between soluble proteins (blue circles with radius a = 2.3 nm) with the DNA double helix, having a depletion radius E = 4.7 nm (dashed, green tube). See Appendix A for the calculation of the cross-interaction volume of a protein and the DNA. (d) Minimalization of the total free energy is obtained by assuming a phase separation between cytoplasm and nucleoid and by imposing equal osmotic pressures and chemical potentials in the two coexisting phases (with indices c and n for cytoplasm and nucleoid.
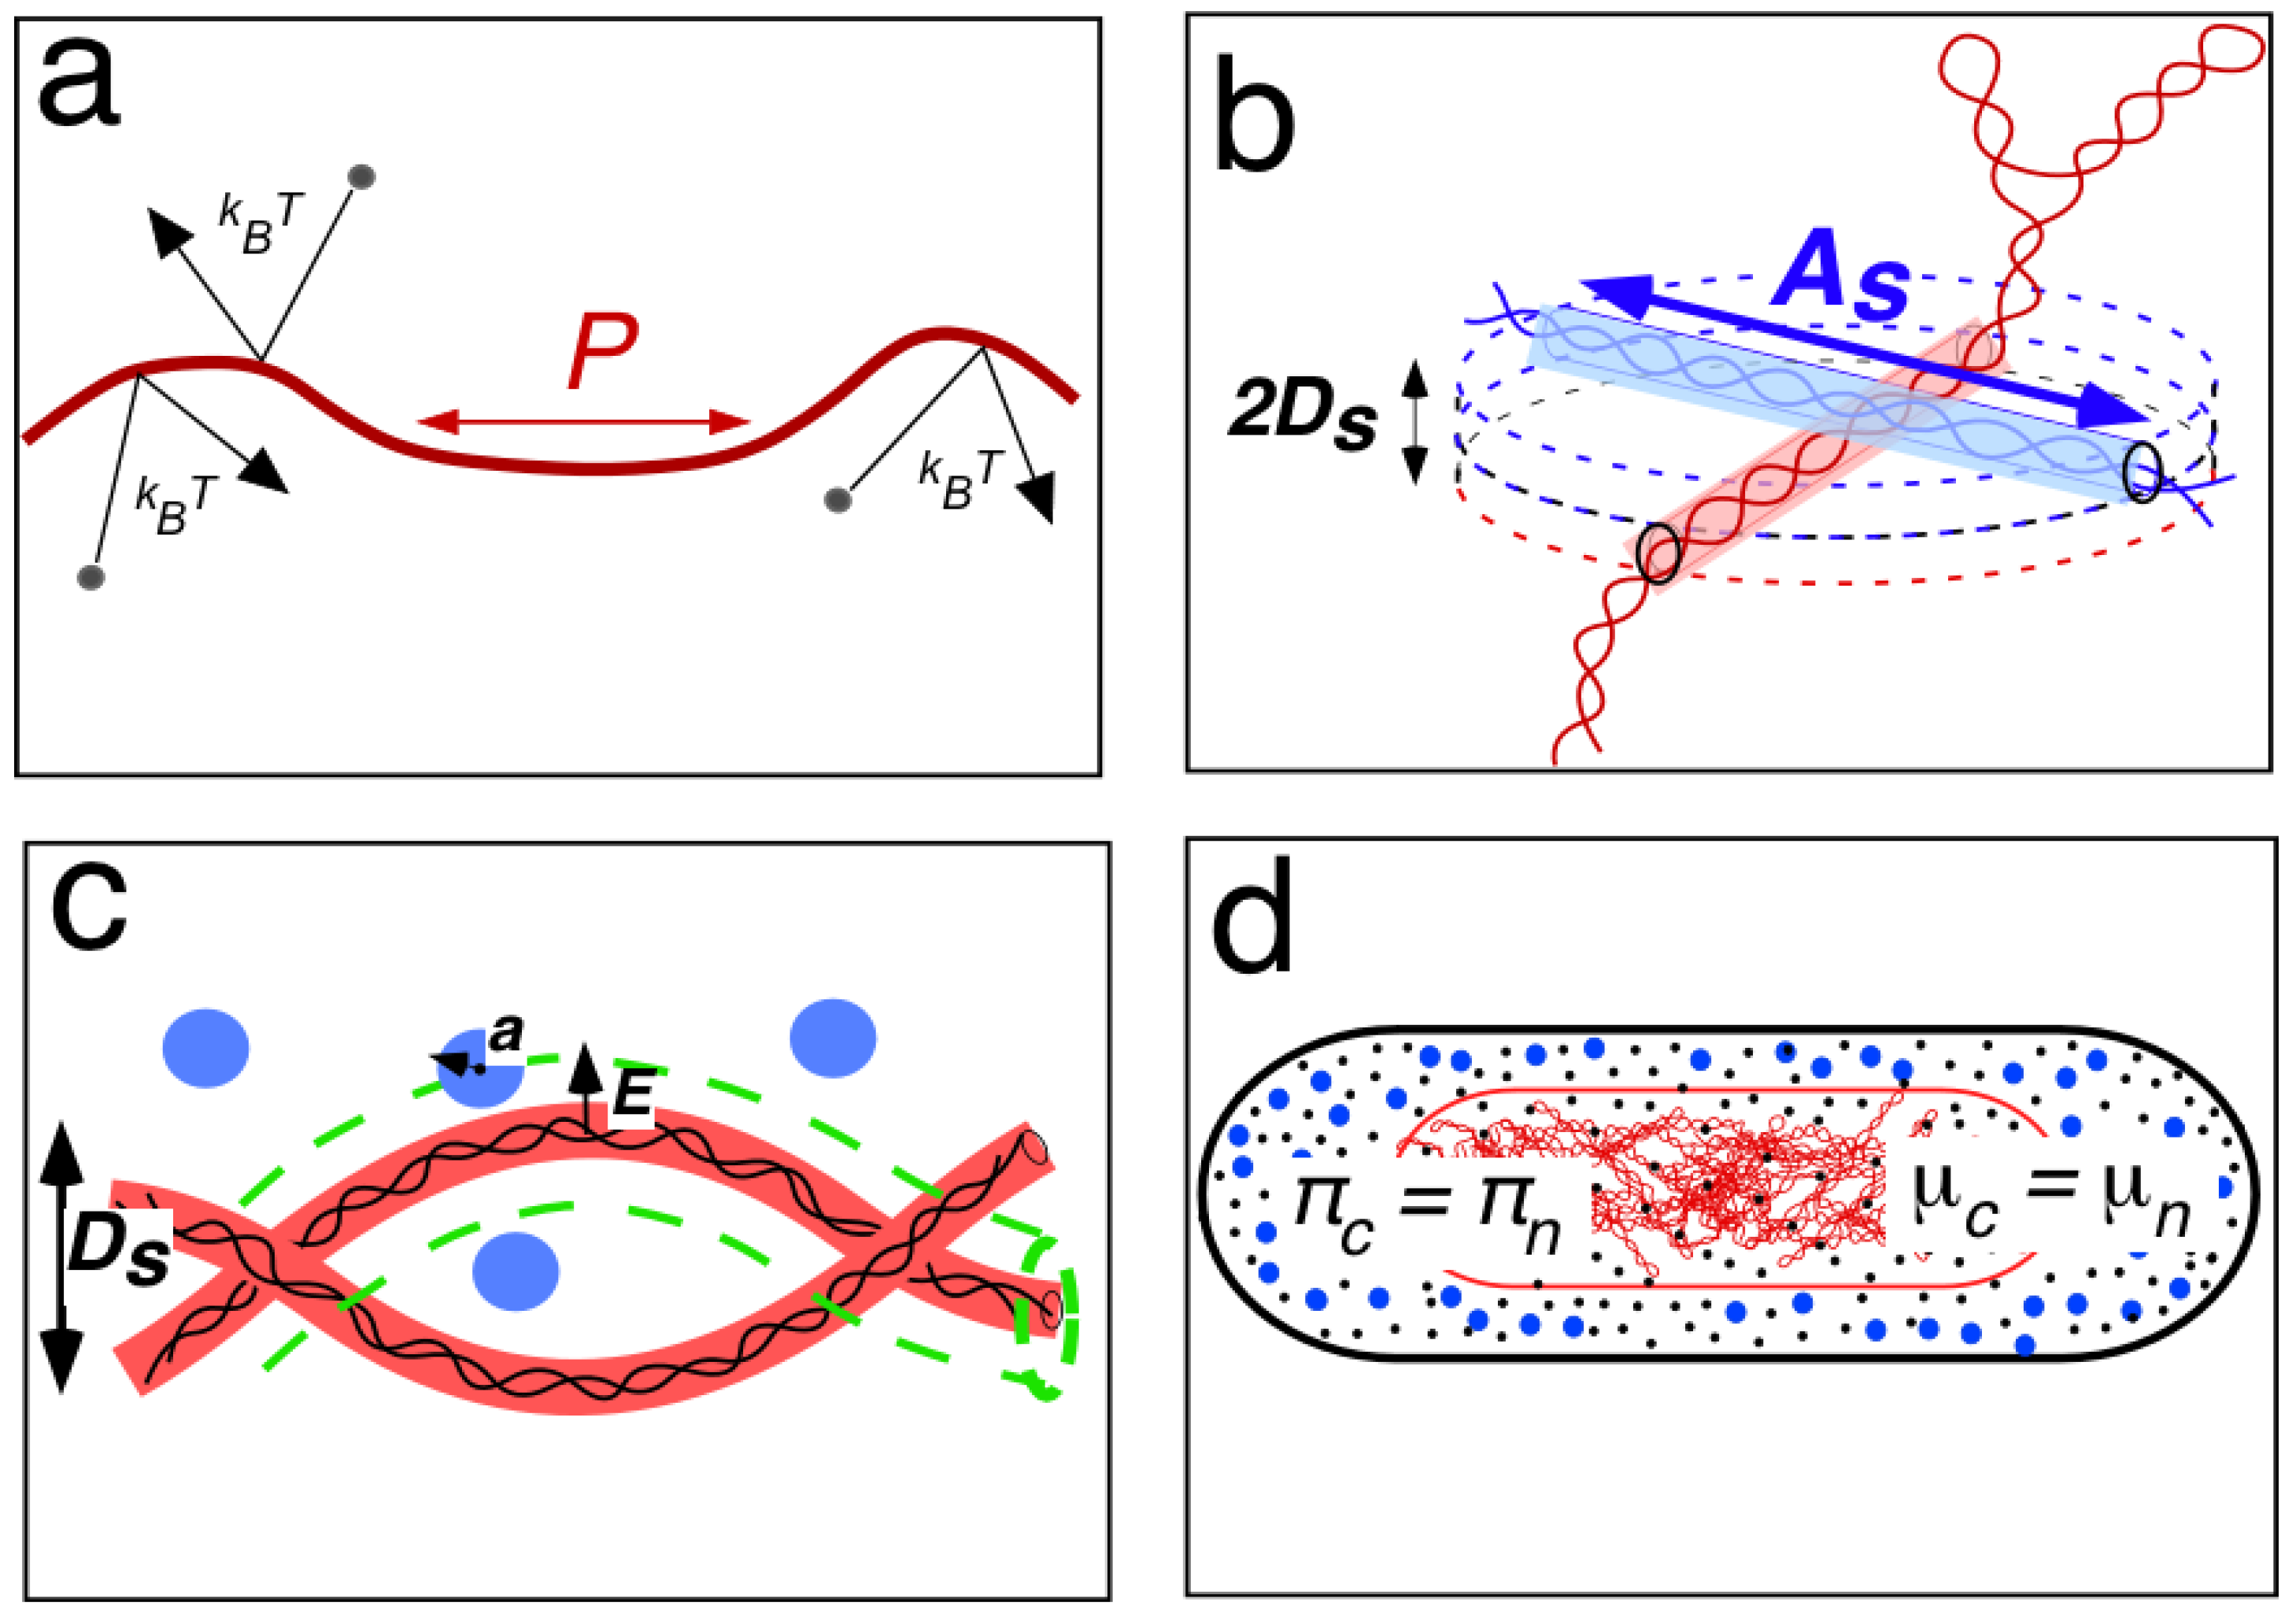
Figure 5.
Measurement of nucleoid volume in 3 populations of E. coli B/rH266 cells, grown in alanine-medium (doubling time 150 min), stained in growth medium with DAPI (unpublished results by Huls et al., 2001). The cells were analyzed with the ImageJ plugin (Coli-Inspector-04o+NucVol.ojj) at 3 different thresholds. The program finds the cell contour in the phase-contrast image (green line in left panels) and extends it with 8 pixels (yellow contour). The area of a nucleoid in the fluorescence channel, including its neighborhood, is temporarily smoothed, before detecting its min and max value. Then, in the fluorescence images (right panels), an intensity threshold of, for example, thr = min + 0.4 * (max-min) is applied to define the nucleoid contour using the 3 different threshold values indicated (magenta contour). The contour is converted to a “best-fitting rod” in order to measure length and diameter and to calculate nucleoid volume. Here the three values for the average nucleoid volume are given. See for the nucleoid volumes of newborn cells Table 1, last row. The results of calculations using the 0.5 threshold corresponded best to measurements “by eye and hand”.
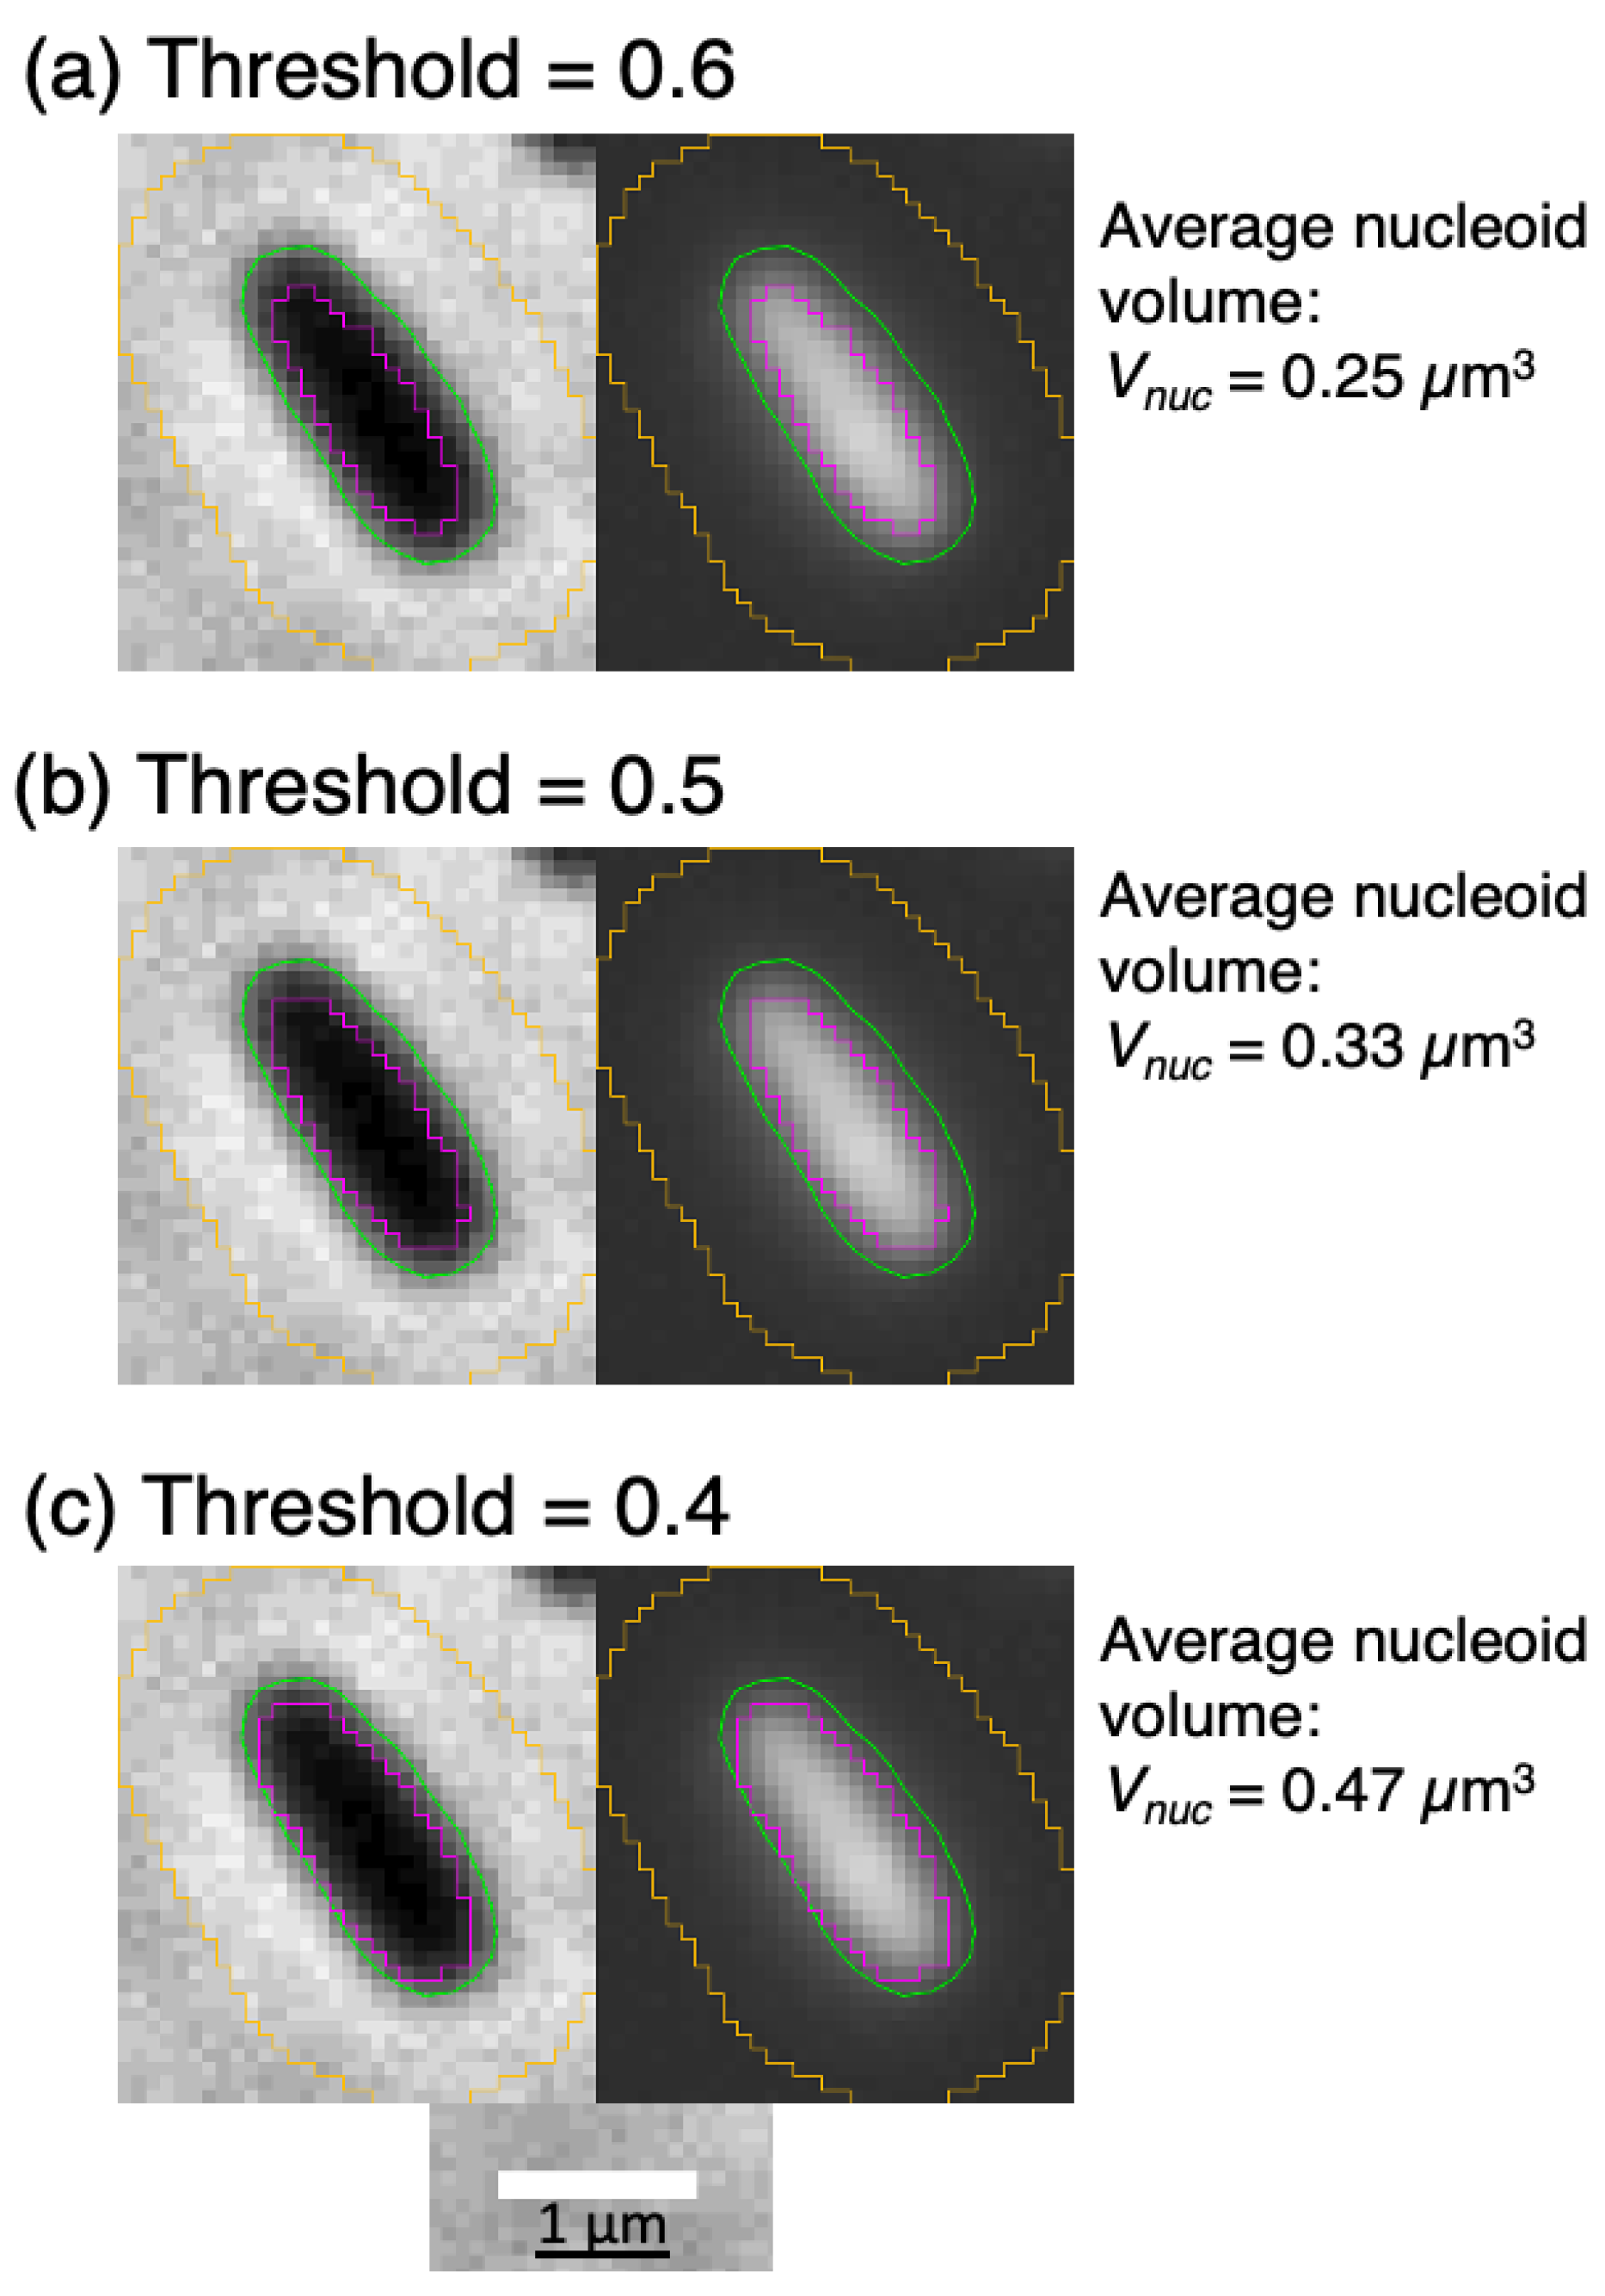
Figure 6.
Schematical, qualitative representation of a nucleoid-compaction curve comparable to Figure 2a of [6]. The red, solid line shows the nucleoid volume relative to cell volume as a function of the number of crowders (polyribosomes or proteins): nc stands for either polyribosomes or proteins and nC0 is the corresponding number at the normal physiological condition. The dashed green and blue lines represent the relative crowder concentrations within the nucleoid for polyribosomes and soluble proteins, respectively. Cell (a) shows the model cell (fixed volume of 0.7 µm3) in a non-equilibrium situation with a fully dispersed nucleoid and a homogeneous crowder mixture of small proteins and large polyribosomes. Going from left to right, an increase in the relative polyribosome concentration shows an immediate (see inset Figure 2a of [6]) and full exclusion of polyribosomes from the nucleoid (green, dashed line) and a slow compaction of nucleoid volume (red, solid line) upon increasing polyribosome concentration. Cell (b) shows the equilibrium situation at physiological concentrations of polyribosomes and soluble proteins. Nucleoid volume has decreased to half the cell volume (Vnuc = 0.35 µm3), while soluble proteins still occur for ~95% within the nucleoid volume (blue, dashed line). This cell (b) is also used for the comparison in Figure 7a. Cell (c) shows that upon further increase of the crowder concentrations (eg. by osmotic shock), the soluble proteins become depleted from the nucleoid, while nucleoid volume rapidly decreases.
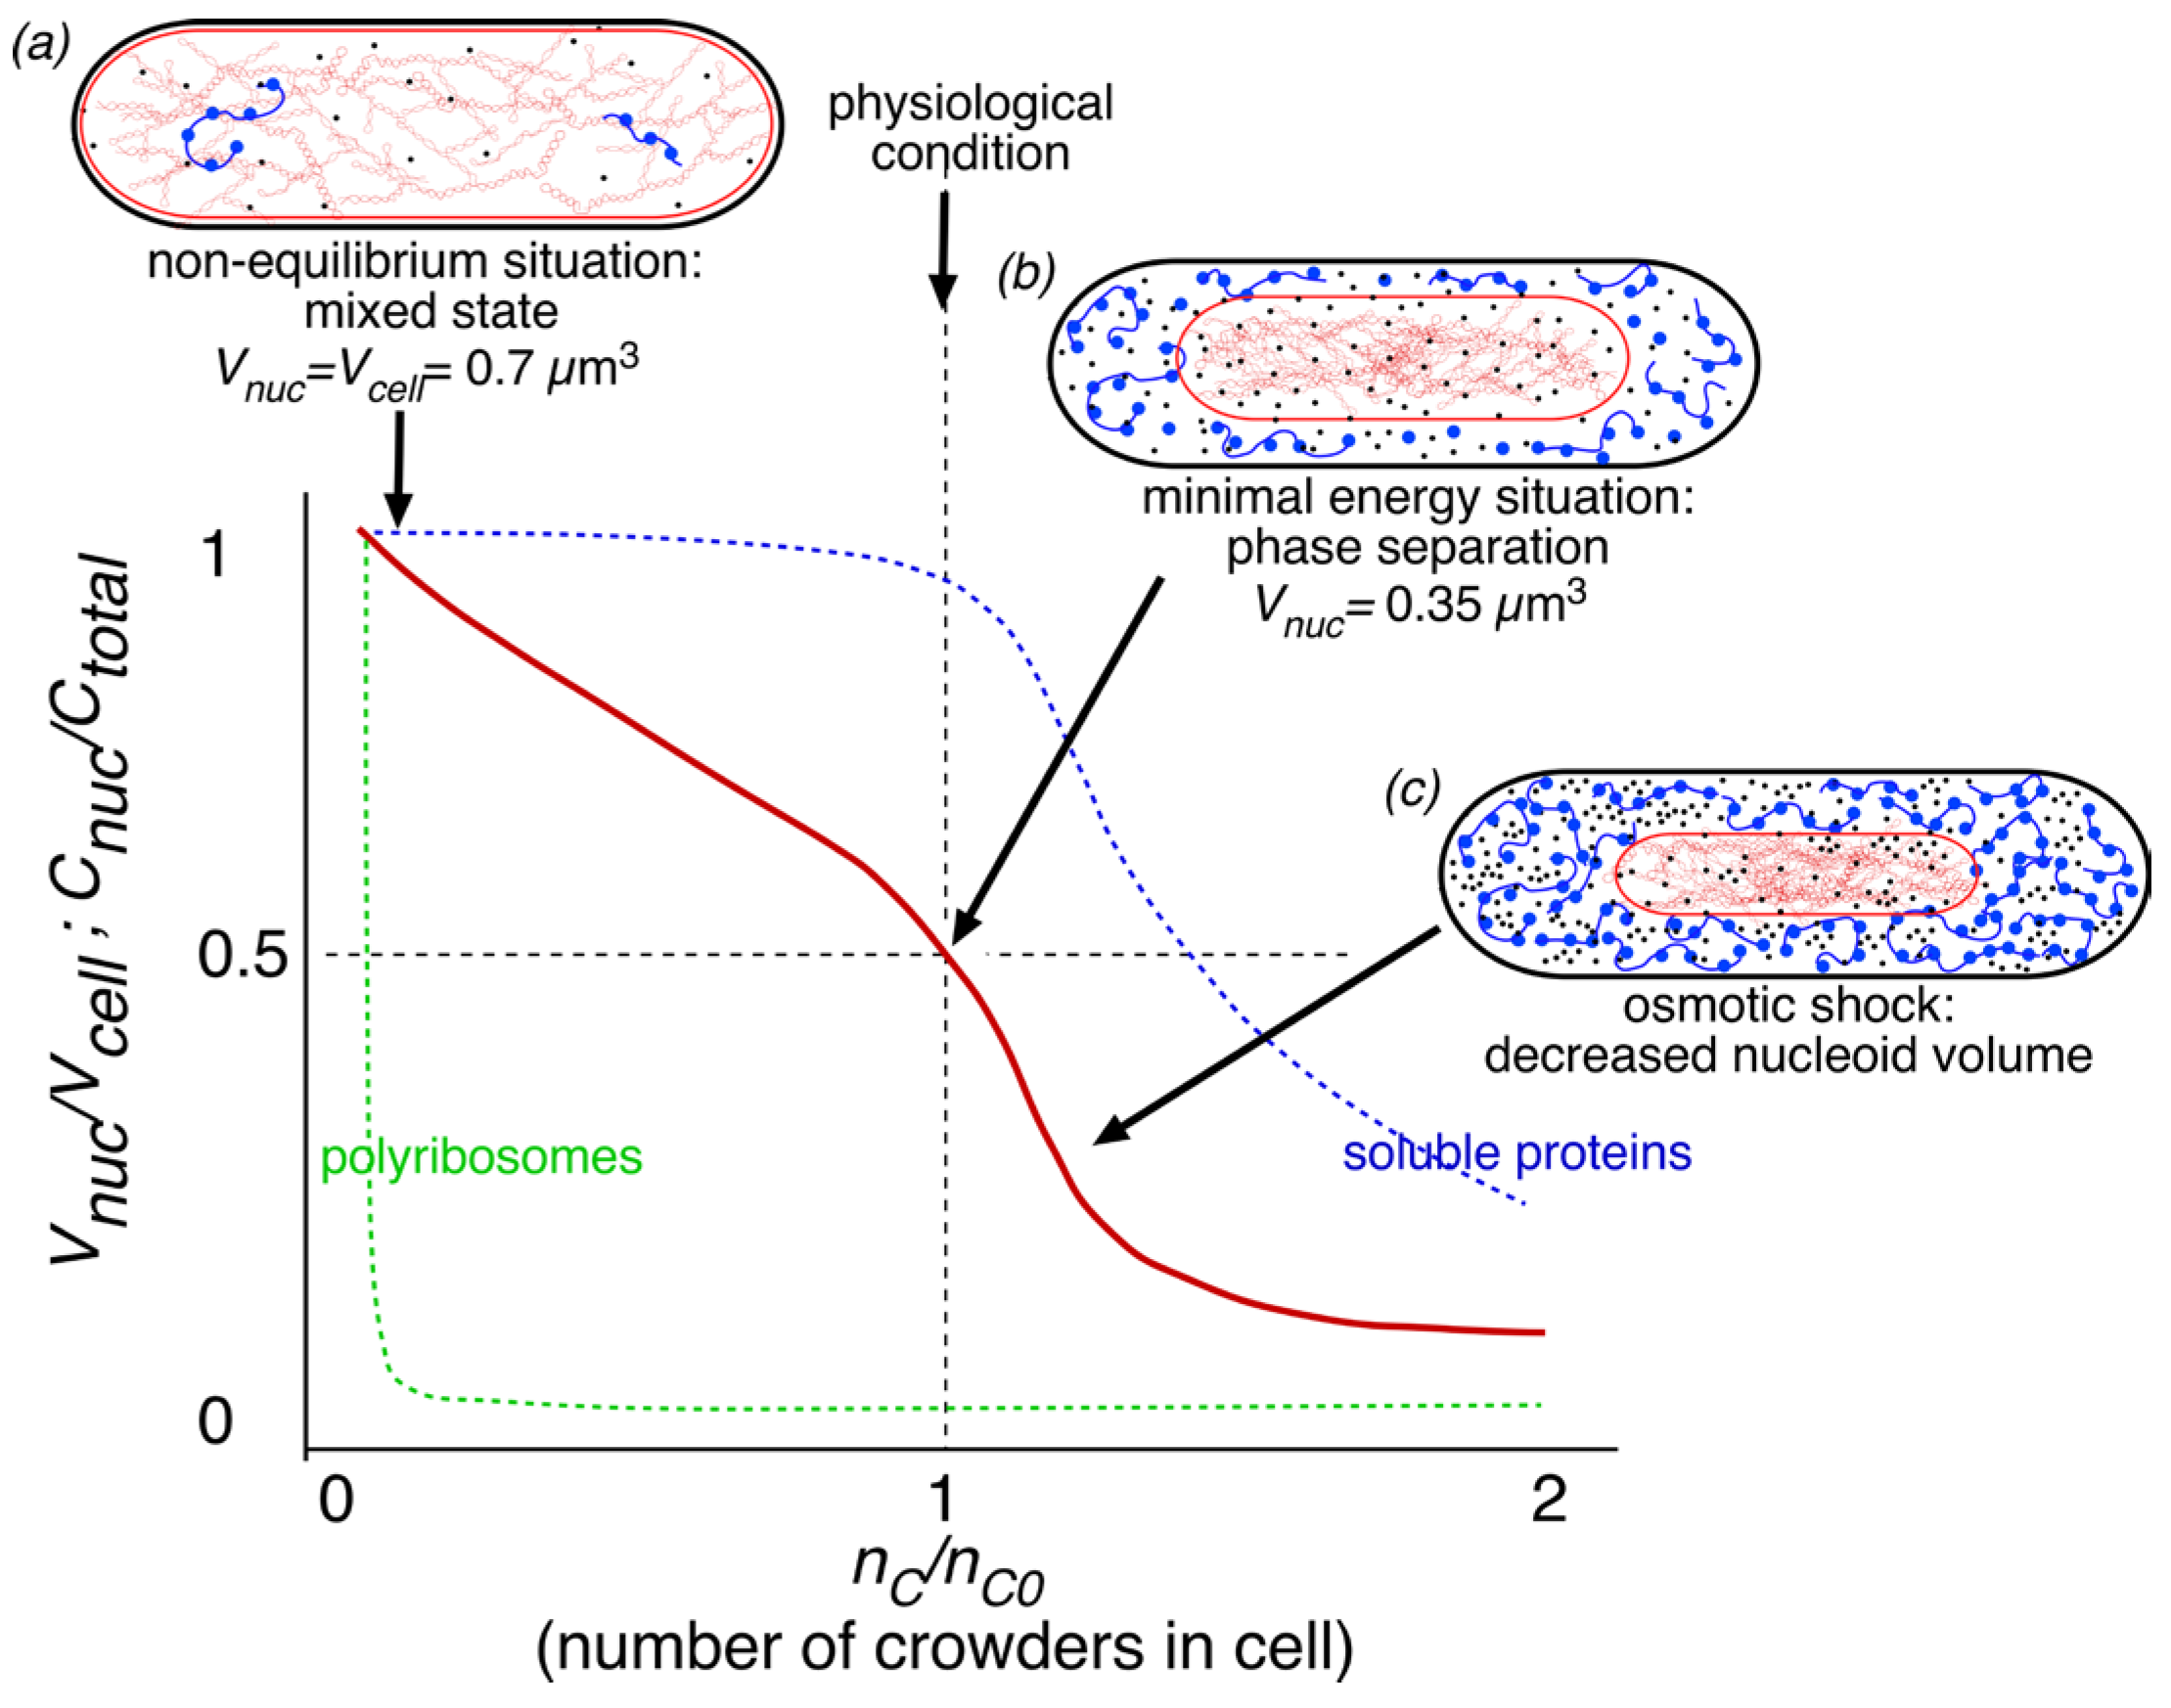
Figure 7.
Schematic representation of (a) an average E. coli K-12 cell from [6] and (b) an average E. coli B/r cell (unpublished results; see Table 1 and Figure 5b). The cell in (a) is the same as cell (b) in Figure 6. The cell in (b) is from the same population as the cell in Figure 5. For both cells, it has been assumed that polyribosomes are excluded from the nucleoid, whereas soluble proteins are able to diffuse throughout the cytoplasm and nucleoid and are thus not being depleted from the nucleoid as proposed by Odijk [5]. See for the calculated reduction of the refractive index of the nucleoid relative to the cytoplasm Appendix B, Table A2, note (12).
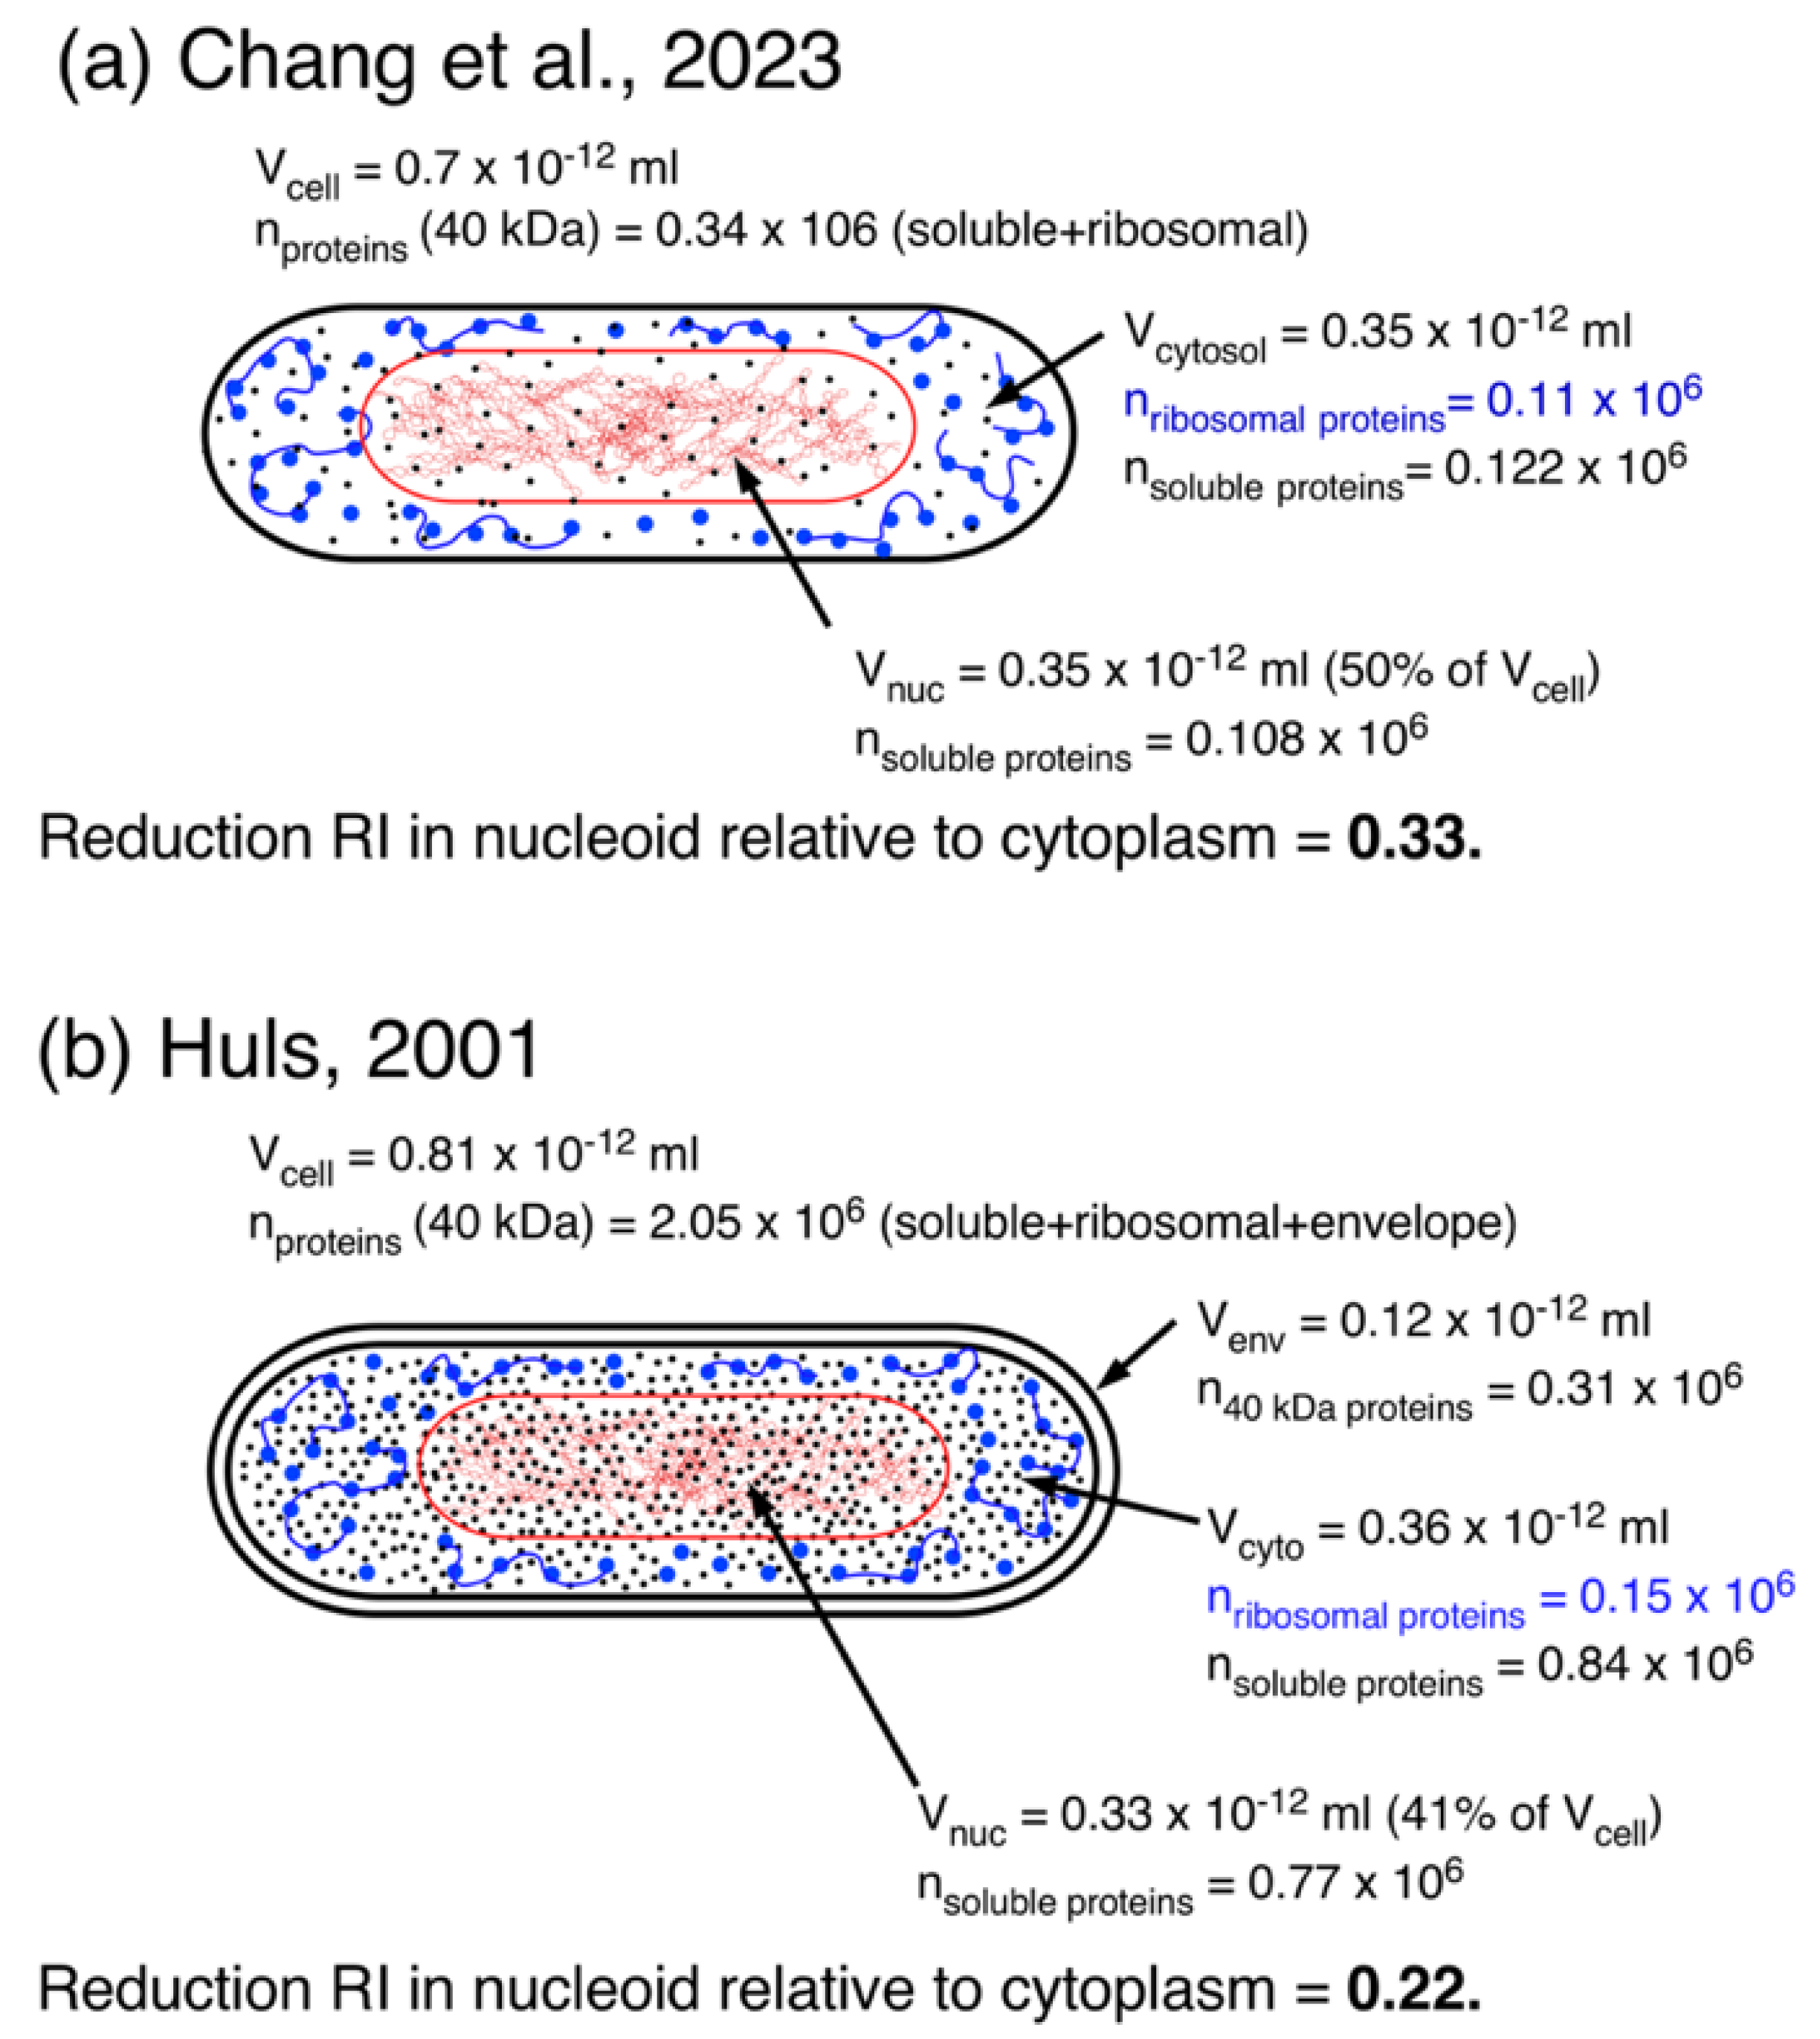
Figure 9.
Measurement of positions of origin(s) (green circles) and replichores (red and blue stars), as observed in the constructs of Flemming Hansen in slow growing E. coli cells with a doubling time of 150 min at 32°. Diagrams below the cells show the presumed replication status of the chromosome. Percentages indicate major pattern observed; see Tables in [63]. (a) Newborn cells with unreplicated DNA. (b) Cells with duplicated origins (4 spots) showing 2 patterns. (c) Cells with an almost replicated chromosome (6 spots) showing the most common pattern (34%) that gives rise upon division to the pattern (L-O-R) in newborn cells as shown in (a).
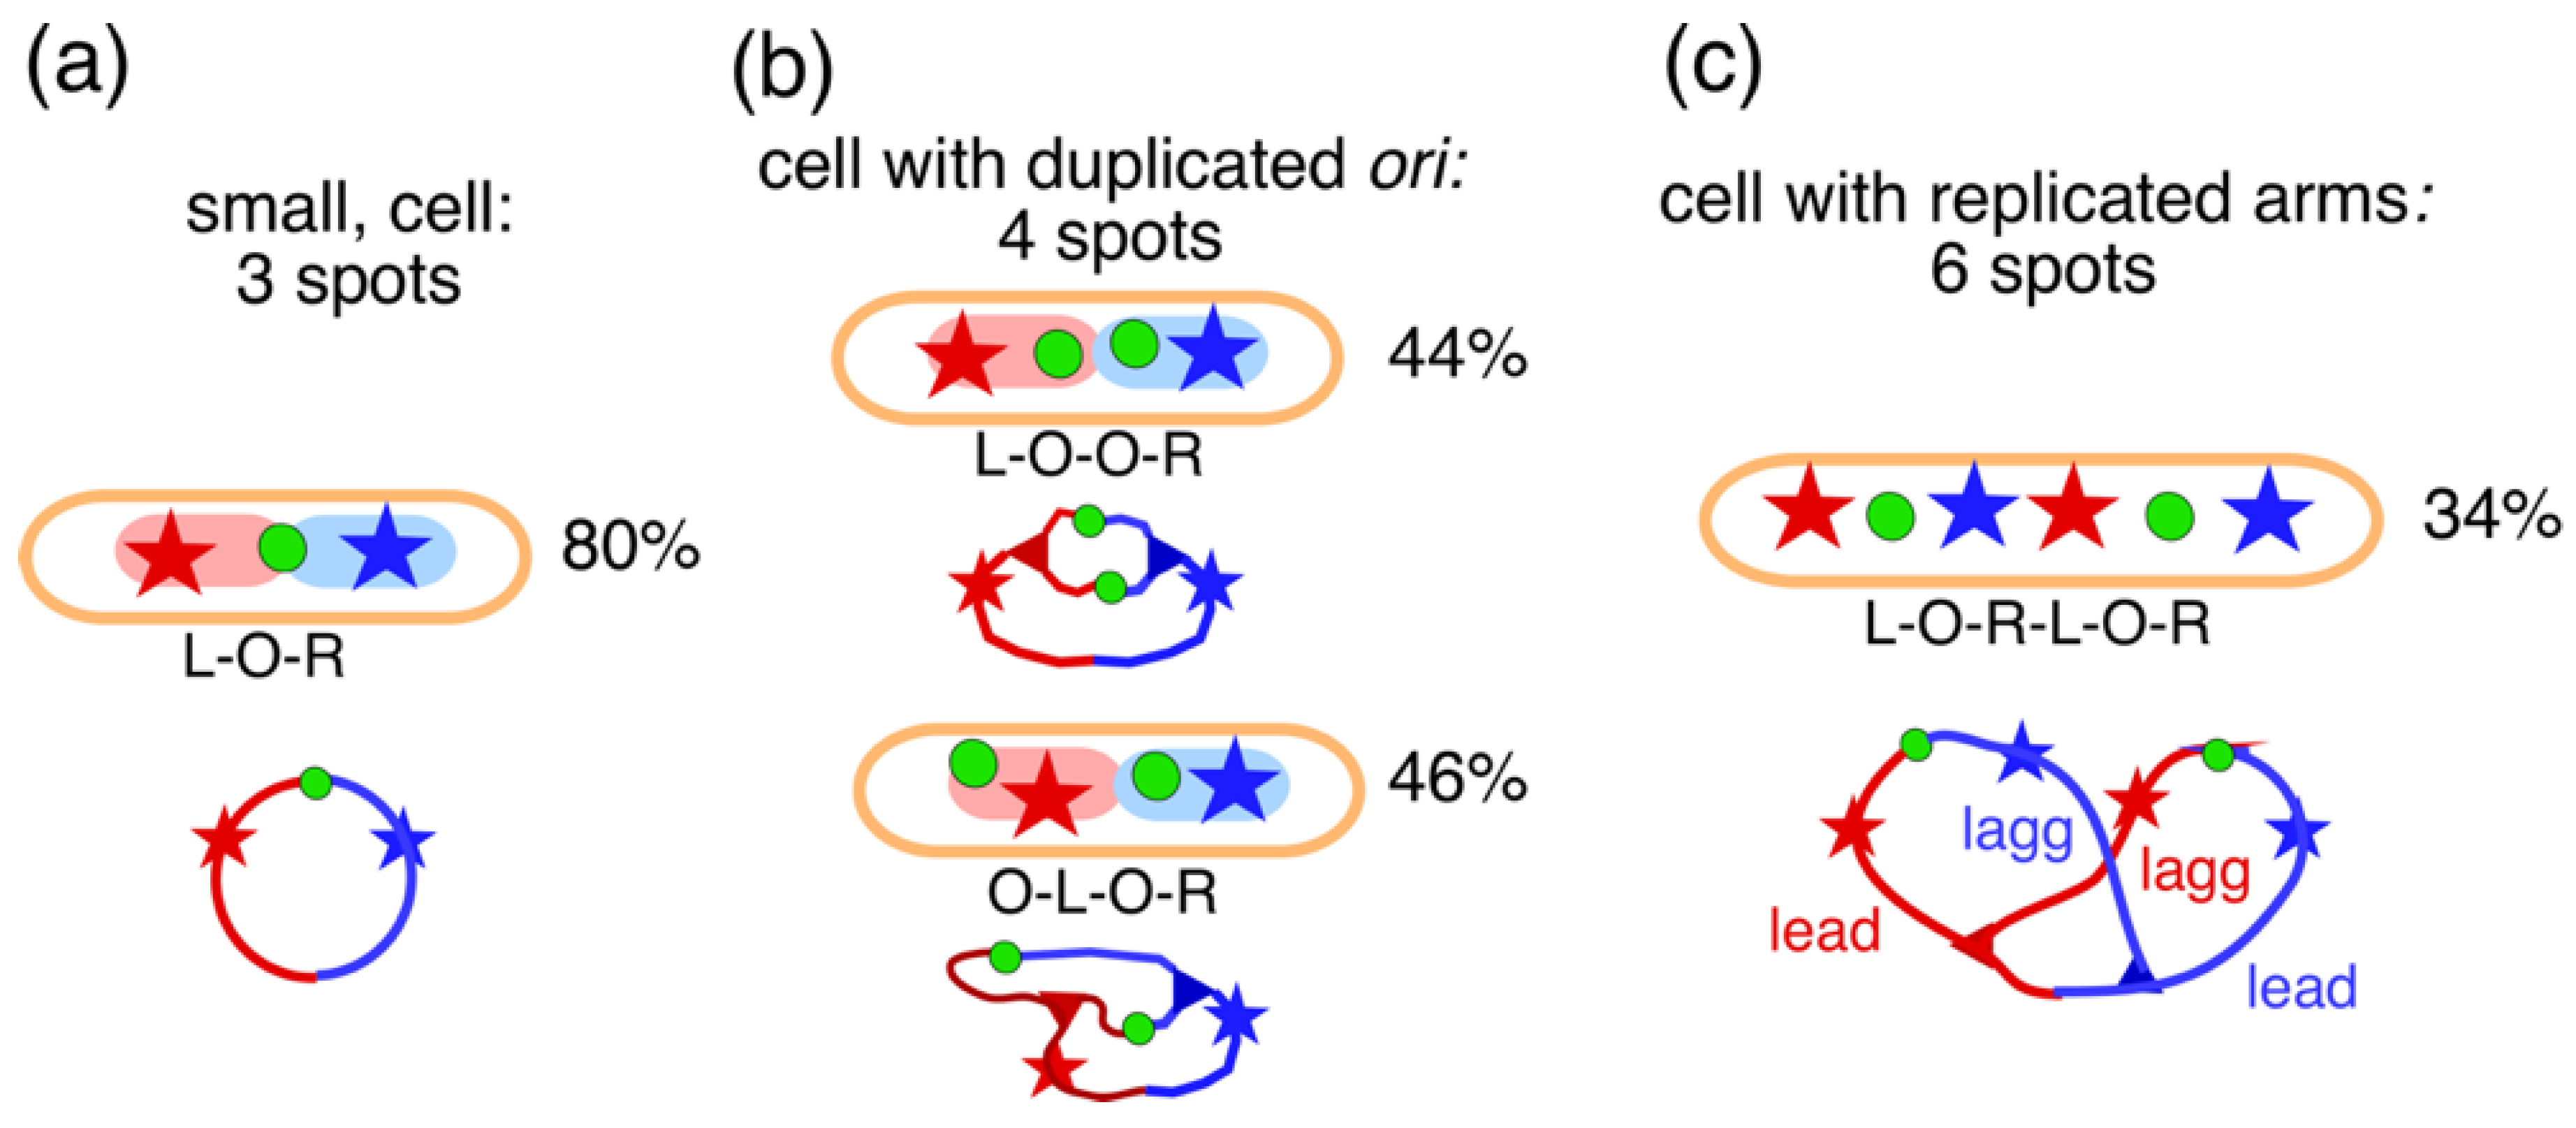
Figure 10.
The four-excluding-arms model: daughter strand exclusion in the initial replication bubble (orisome). (a) Schematical drawing of the initial stage, 30s after firing of the origin. Leading- and a lagging-strands of ~10 µm have been synthesized by the two Pol III-replicases of each replisome. See Appendix C. The nascent leading and lagging arms are proposed to exclude each other (remain de-mixed) because of physical differences (random coil versus supercoiled segments) and physiological differences (transcription of different genes). (b) Initial stage of the replication bubble 30 s after initiation: the 2 leading chromosome arms (#2 and #3) will immediately become supercoiled and fold into a blob (diameter 140 nm; see Table A3). The 2 lagging arms (#1 and #4) will adopt a random coil conformation until the Okazaki fragments (about 20 fragments) have been ligated. Due to tethering of the two replisomes to the parental DNA they are replicating, the enlarging blobs push the origins apart (double arrow). See also description of Figure 4 in [83]. (c) 2D-projection of the developing micro-domains: After 5 min, nascent chromosome arms of 100 µm DNA have been synthesized and have enlarged into micro-domains with a diameter of 310 µm. Inset shows a 3D representation. Further enlargement of the micro-domains by DNA synthesis will force these domains to re-arrange positions in the narrow tube of the nucleoid (see Figure 11.b1 and Table A3 in Appendix C).
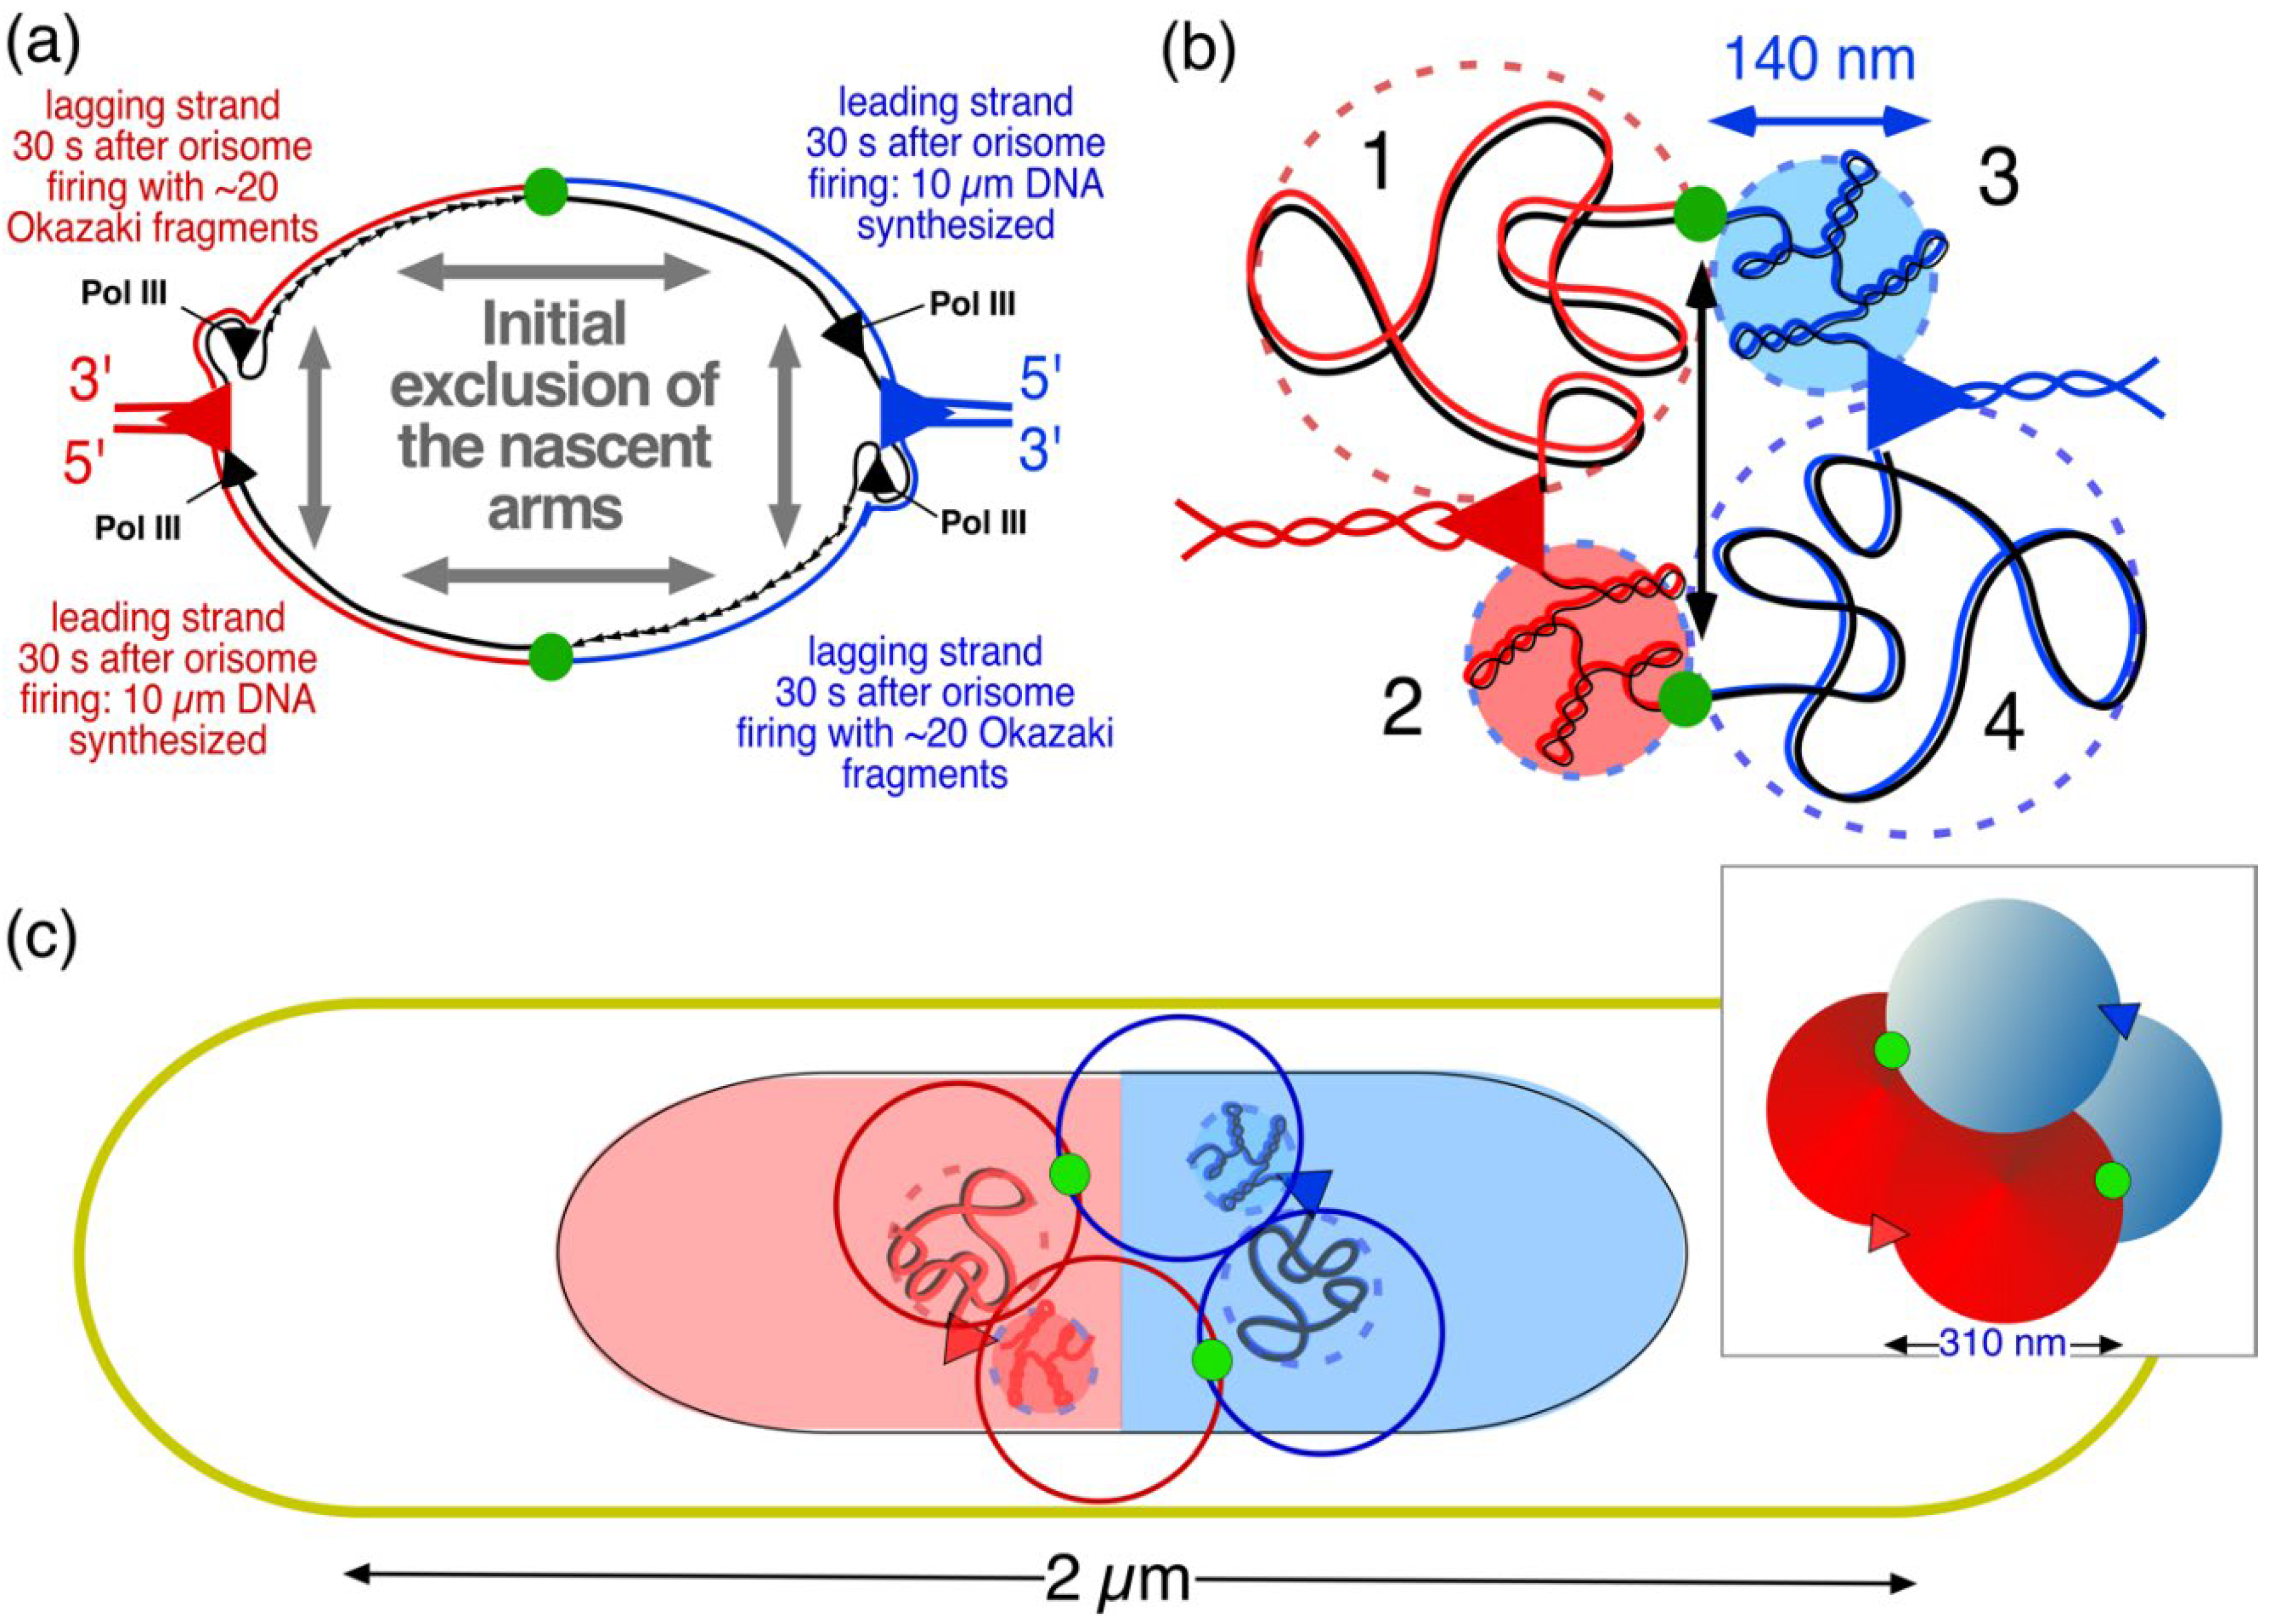
Figure 11.
Schematic representation of the development of 4 excluding micro-domains in transversal arrangement of E. coli B/r during slow growth (Td = 150 min) and in longitudinal arrangement after shift-up to fast growth. Modification of Figure 2 of Reyes-Lamothe [89]. (a) The 4 initial micro-domains as depicted in Figure 10b and c, are drawn as a tetrahedron of 4 spheres (not to scale), connected to each other both by the origin (green circle) and by the feeding threads emanating from the replisomes that are replicating the parental DNA (light colored regions). In this 4-spot cell (cf. Figure 8b) the pattern is L-O-O-R. (b1) At the end of replication, the 4 spherical domains, enlarged through continued DNA synthesis, have rearranged themselves in the long axis of the narrow nucleoid as indicated by the dashed arrows. They end up in a transversal arrangement. Because both leading arms of the two replichores move faster than the lagging arms, the asymmetric ordering pattern L-O-R L-O-R is obtained. (b2) An alternative arrangement can be obtained because of a faster expansion of both the leading and the lagging arms of the red replichore (caused by pausing of the blue replisome), resulting in the symmetric pattern L-O-R R-O-L (see text). (c) Nutritional shift-up from a doubling time of 150 min to fast growth (Td = 24 min). After 60 min, the average cell is wider and contains 4 origins after re-initiation. Because the microdomains do not have to re-arrange in the wider cell, the origins remain at the tip of the nucleoid in a longitudinal arrangement. (d) After 90 min, the average cell contains 2 nucleoids with a total of 8 origins; see for the construction of the DNA replication cycle during shift-up the cell cycle simulation program in Zaritsky et al. [90]. Cell sizes reflect the measurements of E. coli B/r cells by Woldringh et al. [91]. See also Youngren et al. [74] for the longitudinal arrangement of the E. coli nucleoid in fast growing cells.
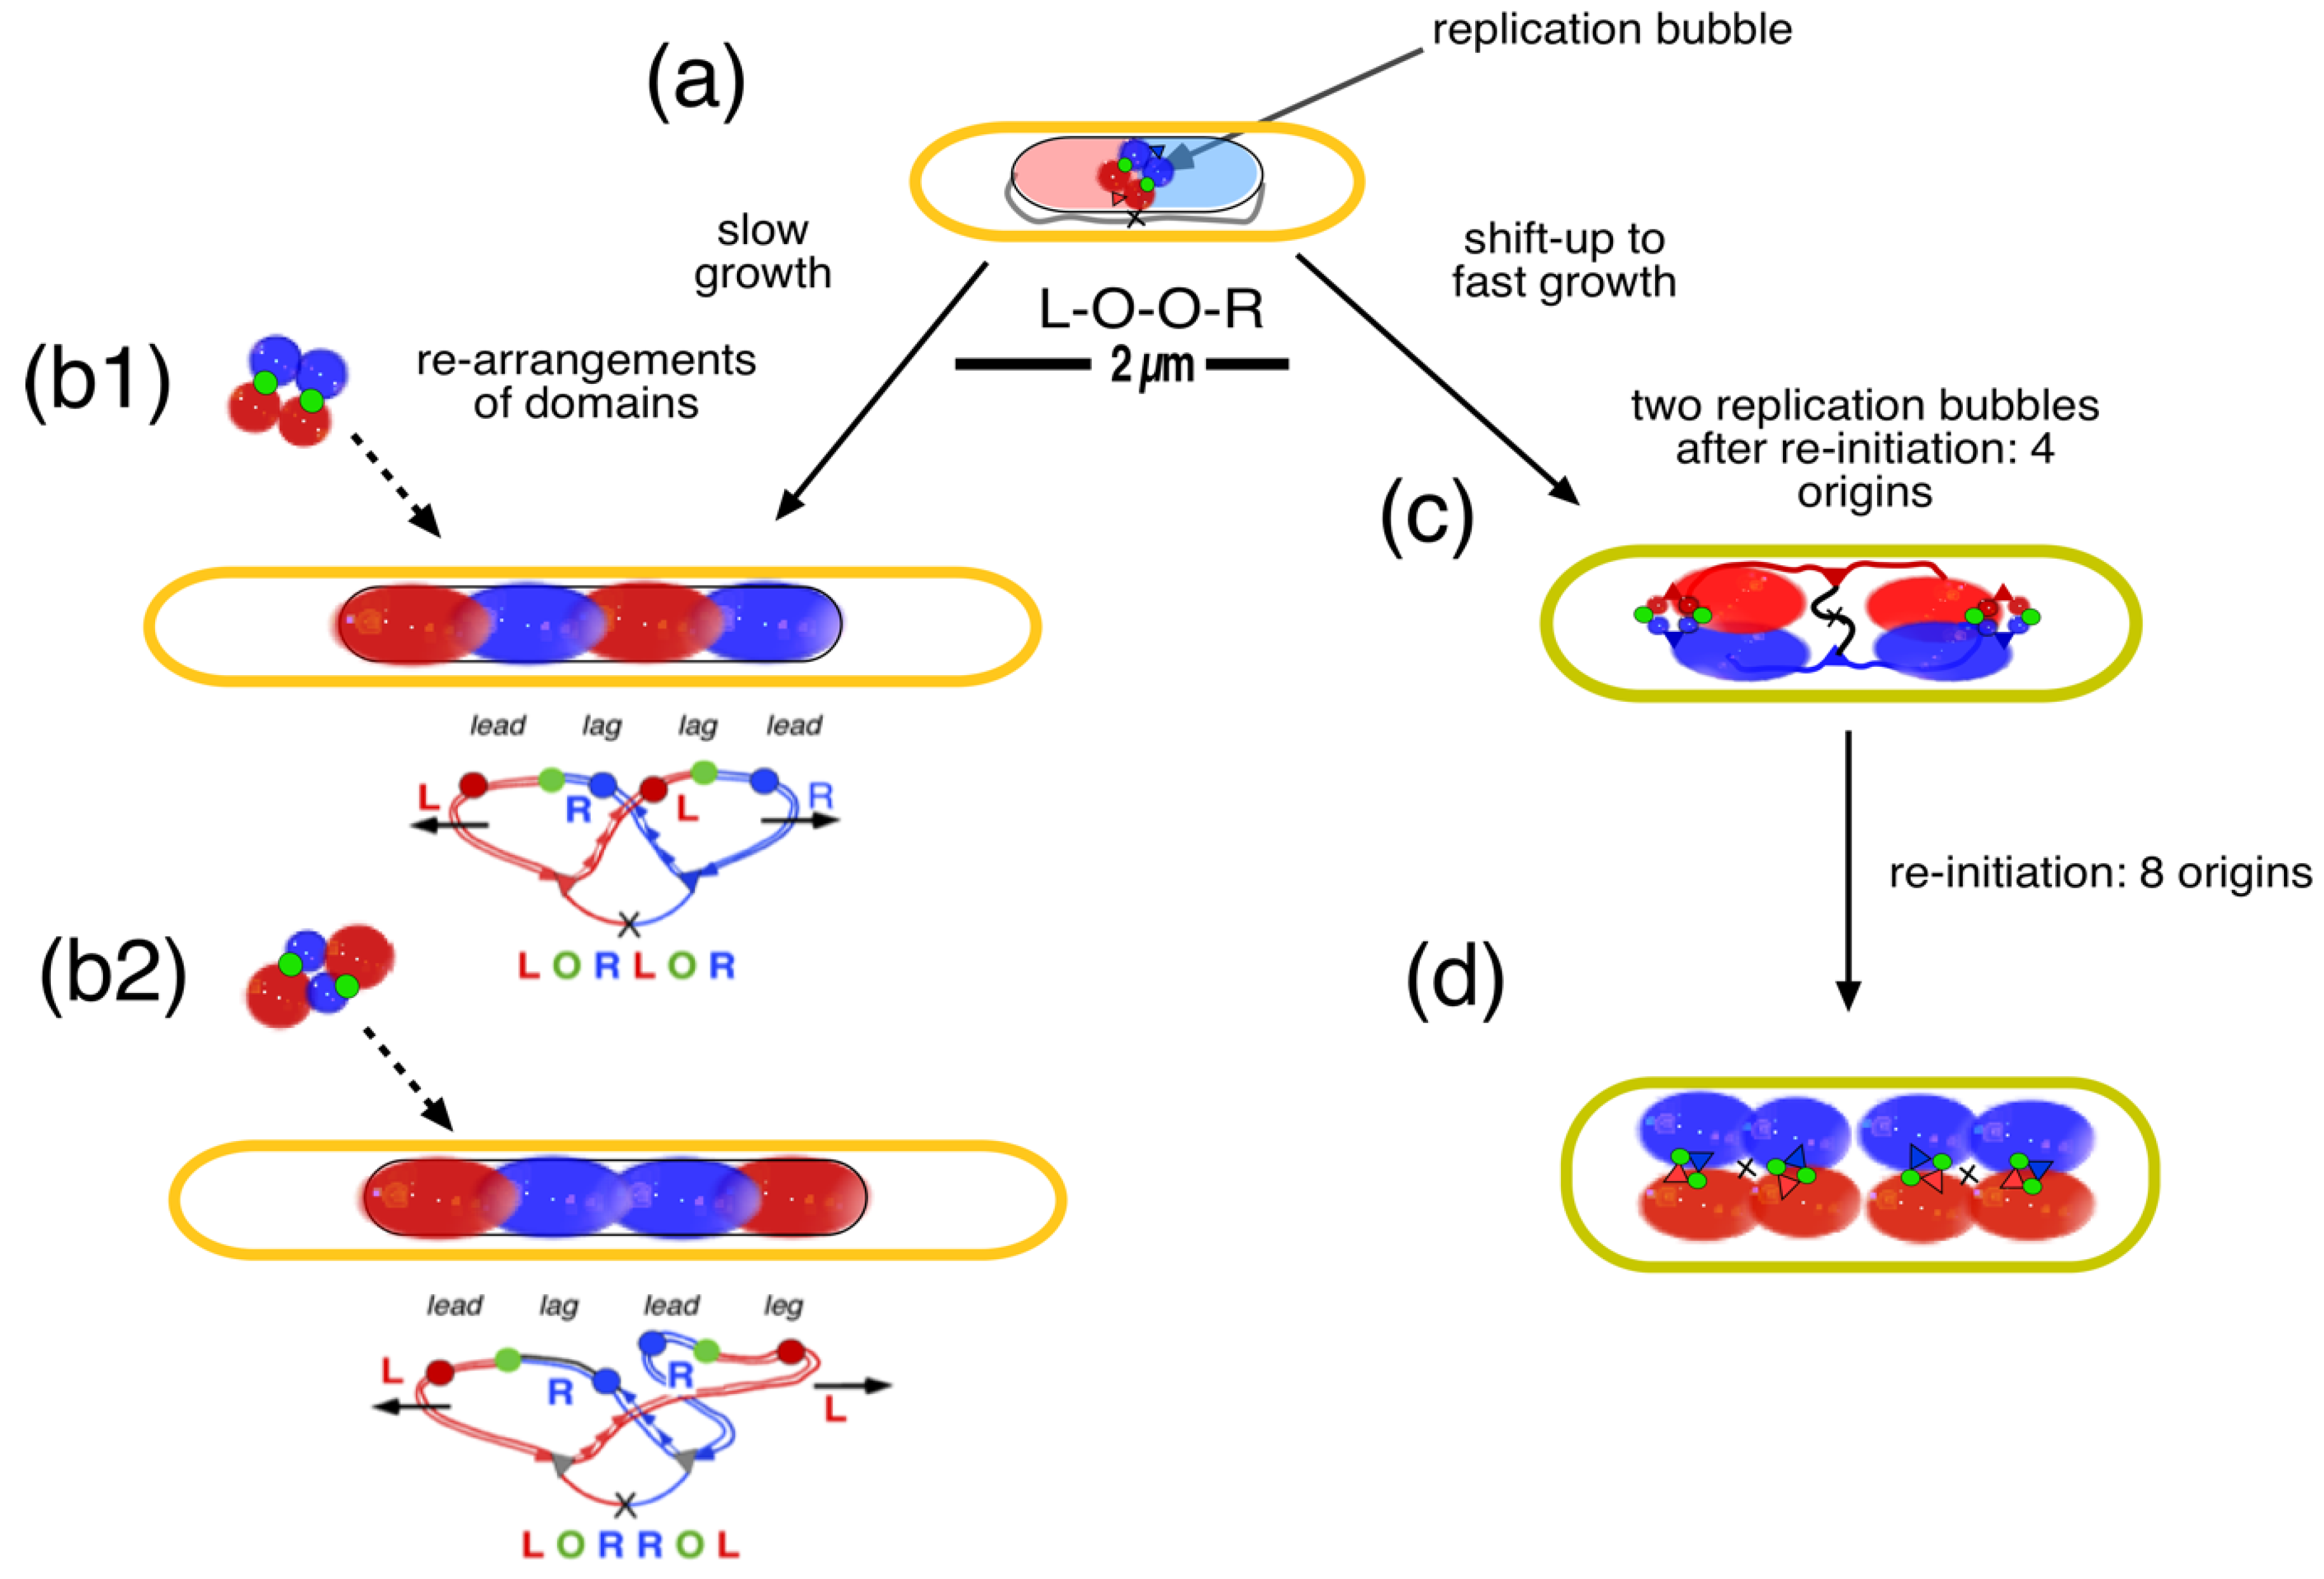
Table 1.
Cell and nucleoid volumes measured from microscopic images of live, slow-growing E. coli cells. Nucleoid volumes were estimated for cells in the early cell cycle (in B-(G1-) period) or calculated for newborn cells.
Table 1.
Cell and nucleoid volumes measured from microscopic images of live, slow-growing E. coli cells. Nucleoid volumes were estimated for cells in the early cell cycle (in B-(G1-) period) or calculated for newborn cells.
|
E. coli strain |
Doubling time at 37°C (min) 1) |
Volume of newborn cell 2) (µm3) (cell number measured) |
Nucleoid volume in newborn cell (µm3) (threshold) |
DNA concentr. in nucleoid 3) (mg/ml) |
Reference (microscopy/staining: figure in reference) |
| B/rH266 | 150 | 0.33 (10) |
0.07 0.12 4) |
69 40 |
[27] (CSLM/ unstained: Figure 1) |
| K-12 (NK9387) |
~70 (125 at 30°C) |
0.33 (2) |
0.27 (0.5) | 18 | [38,39] (Fluor. microscopy/HupA-mCherry: Figure 1B and 3B) |
| K-12 (MG1655) |
110 (220 at 28°C) |
0.45 0.50 5) |
0.23 0.25 |
21 19 |
[7] (Fluor. microscopy/ HupA- mNeonGreen: Tables S2 and S5) [6] (Fluor. microscopy: Figure 2) |
| K-12 (CJW6324) |
81 6) |
- (B-period cells) (n = 19,510) |
0.7 |
7 | [8] (Fluor. microscopy/DAPI: Figure 7A |
| B/rH266 | 150 | 0.58 (281) |
0.18 (0.6) 7) 0.24 (0.5) 8) 0.34 (0.4) |
27 20 14 |
Huls, 2001 (unpublished) (Fluor. microscopy/DAPI: Figure 5 main text) |
1) Doubling times refer to growth at 37°C. Growth at 28-30 °C is assumed to be 2x slower. 2) Volume of newborn cell is obtained by dividing the volume of the average cell (Vav = 0.81 µm3) by 2ln2, under assumption of exponential growth of an individual cell. 3) Amount of DNA in non-replicating chromosome is 4.8x10⁻¹² mg [40]. Amount of DNA in replicating cell with average length and volume is calculated from the average chromosome equivalents (genome content) per cell using the expression as given by Cooper and Helmstetter ([41]: Gc = Td/Cln2 (2^(C+D)/Td – 2^(D/Td)). At slow growth a newborn cell in B-(G1-) period is assumed to contain 1 chromosome equivalent. 4) Reestimated using instrumental magnification of 23850x as indicated on the original photographic print. 5) Calculated from average cell Vcell = 0.7 µm3; Vnewborn = 0.7/2ln2 = 0.5 µm3. See note 2) and Table A1. 6) Doubling time from Figure 1B of Gray et al. [42]. 7) The DAPI-stained population of Huls (2001), was re-measured at different thresholds using the ObjectJ plugin of Vischer: Coli-Inspector-04k+NucVol(0.5).ojj. See legend Figure 5 and Table A1 in Appendix A. 8) Same cells were used for the comparison in Figure 7b.
Table 2.
Microscopic studies from the literature of the effect of rifamp(ic)in on the spatial organization of the nucleoid in E. coli cells.
Table 2.
Microscopic studies from the literature of the effect of rifamp(ic)in on the spatial organization of the nucleoid in E. coli cells.
| Reference | Cells and growth condition (Growth rate: fast/slow) |
Rifampicin treatment and imaging/preparation/ staining |
Appearance nucleoid (figure) and interpretation |
Fully dispersed nucleoid (1) Yes/No |
|---|---|---|---|---|
| [56] |
E. coli K-12; M9+glucose+Casa, 37°C (fast) |
100 µg/ml; 30 min; electron microscopy; OsO4 - fixation |
“axial” appearance; (Figure 1b) |
no |
| [57] |
E. coli K-12 (NT3) LB medium, 37°C (fast) |
20 µg/ml; 60 min; Light microscopy; poly-lysine slide; no fixation |
“nucleoids decondense” (Figure 2D) |
yes |
| [58] |
E. coli K-12 (MC4100) Glucose minimal medium; 30°C; (slow) |
100 µg/ml; 30 min; Light microscopy, OsO4-fixation; DAPI stained |
“nucleoid fusion”; (Figure 4B) |
no |
| [32] |
E. coli K-12 (C600) LB medium, 37°C (fast) |
40 µg/ml; 60 min; no fixation. |
“compact nucleoids” (Figure 6B) |
no |
| [54] |
E. coli K-12 (DJ2599) M63+glucose+Casa, 30°C; (fast) |
50 µg/ml (?); 10 min; DIC-microscopy; formalde-hyde fixation; DAPI stained; |
“less condensed”; (Figure 2B) |
yes |
| [59] |
E. coli K-12 M9+glucose+Casa, 30°C; (fast) |
100 µg/ml; 30 min; Phase-contrast; methanol-fixed cells; DAPI stained |
“staining uniform throughout cells” (Figure 3F) |
yes |
| [54] |
E. coli K-12 (DJ2599) LB medium, 32°C (fast) |
100 µg/ml; 20 min; Light microscopy; formaldehyde fixation; DAPI stained |
Quick expansion; elongated nucleoid, phase separated (Figure 1B) |
no |
| [60] |
E. coli K-12 (MG1655 ) Low-phosphate EZRDM; 30°C: Td = 60 min; (slow) |
200 µg/ml; 30 min; Widefield epifluorescence microscopy; no fixation; DNA stain DRAQ5 |
radial compaction and axial expansion; (Figure 7B) |
no |
| [51] |
E. coli K-12 () LB medium, 37°C; (fast) |
50 µg/ml (?); 30 or 60 min. fixation? |
“fully expanded nucleoid”; phase separation (Figure 11 and Figure 13) |
no |
| [61] |
E. coli K-12 (MG1655 ) Low-phosphate EZRDM; 30°C: Td = 60 min; (slow) |
300 µg/ml; 20 min; Phase contrast microscopy; no fixation; time-lapse; SYTOX Orange staining |
“radial contraction”; axial contraction followed by expansion; (Figure 2) |
no |
| [62] | idem | idem |
(Figure 8b) |
no |
| [50] |
E. coli MG1655 LB medium; 37°C; (fast) |
50 µg/ml; 3o min; SIMicroscopy; no fixation; DAPI-stained |
Expanded nucleoid (Figure 4C) |
yes |
| [63] |
E. coli MG1655 (FH4035) Minimal glycerol medium (slow) |
300 µg/ml; 210 min; 28°C; Fluorescence microscopy; OsO4-fixation.; DAPIstained |
Compact nucleoids: 9% show divided nucleoids (Figure 3B) |
no |
| [48] |
E. coli K-12 (MG1655 /KF26 cells) LB medium; 32°C; (fast) |
100 µg/ml (Sigma); 30 min; Fixation with 2% formaldehyde+0.05% glutaraldehyde. PAINT-SMLM imaging |
Contraction and expansion nucleoid. Nucleoid fusion? (Figure 5b) |
no |
| [7] |
E. coli K-12 (MG1655) Slow: M9 glycerol minimal medium; Td=60 min at 28°C. Moderately fast: M9+glucose +CASA; Td = 30 min at 28°C. |
300 µg/ml; 20-90 min; Epifluoresc. microscopy; no fixation |
Length expansion at mod. fast growth (Figure 4). volume expansion at fast growth (Figure S13) |
Slow: no fast: yes |
| [8] |
E. coli K-12 (MG1655) M9-glycerol + Casa; 37°C; (fast) |
300 µg/ml; 40 min; no fixation; DAPI-stained |
Expansion nucleoid; nucleoid fusion; (Figure 7A) |
yes |
| [6] |
E. coli K-12 (MG1655-JM57) EZ-Rich medium + glucose; 37°C; (fast) |
300 µg/ml; 20-90 min; Epifluoresc. microscopy; no fixation; HupA-mNeon Green |
“expansion nucleoid” (Figure S4a) |
yes |
| [55] |
E. coli K-12 (NO34) LB at 32°C; (fast) |
100 µg/ml; 60 min. CSLMicroscopy. Fixation with 2% formaldehyde+0.05% glutaraldehyde. |
contraction followed by expansion after 20 min to elongated structure (Figure 2B) |
no |
(1) If “yes”: The DNA stain occurs dispersed throughout the whole cell, also in the end caps. There is no visible phase separation between nucleoid and cytoplasm. If “no”: The nucleoid is still visible as a phase-separated structure, although its volume may have increased by run-out DNA synthesis or fusion of nucleoids. Its shape may have changed by expansion in the long axis (“axial filament”) and by nucleoid contraction in the short axis (see text).
Table 3.
Summary of ordering patterns in growing and non-growing cells as documented in Table A1, Table A2 and Tables 2 and 3 of [63]. A fully random ordering pattern would give the percentages 50, 25 and 25 in columns 7 to 9.
| Strain FH4035(1) |
Number of sequences analyzed | Average number of spots/cell | % cells with 4-5 spots |
% cells with 6 spots | Average length 6 spot cells (µm) |
% RLRL/ LRLR 
|
% RLLR 
|
% LRRL 
|
% LLRR |
| Control (average of 8 experiments) |
4072 |
4.2 |
13/5 |
39 |
3.02 |
64 |
19 |
17 |
3 |
| Rifampicin treatment (average of 3 experiments) |
2848 |
4.6 |
1/1 |
53 |
2.73 |
51 |
28 |
21 |
0 |
(1) In this strain the loci on the two replichores become replicated 30 min after initiation of replication. (2) Cells were treated with 300 µg/ml rifampicin for 210 min at 28°C.
Disclaimer/Publisher’s Note: The statements, opinions and data contained in all publications are solely those of the individual author(s) and contributor(s) and not of MDPI and/or the editor(s). MDPI and/or the editor(s) disclaim responsibility for any injury to people or property resulting from any ideas, methods, instructions or products referred to in the content. |
© 2024 by the author. Licensee MDPI, Basel, Switzerland. This article is an open access article distributed under the terms and conditions of the Creative Commons Attribution (CC BY) license (http://creativecommons.org/licenses/by/4.0/).
Copyright: This open access article is published under a Creative Commons CC BY 4.0 license, which permit the free download, distribution, and reuse, provided that the author and preprint are cited in any reuse.


