
Submitted:
30 March 2024
Posted:
01 April 2024
You are already at the latest version
Preprints on COVID-19 and SARS-CoV-2
Abstract
Background: Online survey-based observational cross-sectional study aimed at elucidating experience and attitudes of unstructured population regarding diagnostic imaging. Methods: Invitations to participate were distributed using mixed-mode design to deidentified residents aged 18 years and older. Main outcome measures included morbidity structure and incidence of diagnostic imaging administrations. Results: Respondents (n = 1069) aged 44.3 ± 14.4 years; 32.8% suffered from cardiovascular diseases (CVD); 9.5% had chronic respiratory pathology; 28.9% considered themselves healthy. Respondents with COVID-19 history (49.7%) reported higher rates of computed tomography (CT) (p < .0001), magnetic resonance imaging (MRI) (p < .001), and ultrasound (p < .05). COVID-19 history in CVD respondents shifted imaging administrations towards CT and MRI (p < .05). Every tenth respondent received MRI, CT, and ultrasound on paid basis; 29.0% could not pay for diagnostic procedures; 13.1% reported unavailable MRI. Professional status significantly affected the pattern of diagnostic modalities (p < .05). MRI and CT availability differed between respondents in urban and rural areas (p < .0001). History of technogenic events predisposed responders to overestimate diagnostic value of fluorography (p < .05). Conclusions: Preparedness to future pandemics requires development of community-based outreach programs focusing on people's awareness regarding medical imaging safety and diagnostic value.
Keywords:
surveys and questionnaires
; diagnostic imaging
; magnetic resonance imaging
; epidemiology
; public health
; big data
; COVID-19
; environmental pollution
; rural health services
; population health
1. Introduction
The pandemic of 2019-novel-coronavirus infection (COVID-19) dramatically transformed the healthcare system and life of society at every level. Hospitalization and mortality rates in emergency departments doubled in non-COVID and tripled in COVID-19 diagnosis, and these spikes resulted from both patient severity and healthcare system overload [1]. On the contrary, admission rates in other tertiary centers significantly decreased due to safety concerns. Remarkable disturbances occurred in delivering diagnostic imaging services at specialized cardiovascular center during the onset of COVID-19 pandemic, when the significant drop in the number of diagnostic procedures was caused by the restriction measures aimed at providing safety to patients and medical personnel [2,3]. Successful vaccination campaign decreased global burden of acute COVID-19, but large groups of population continue suffering from persisting symptoms of post-COVID-19 syndrome or long COVID [4,5] while the waves of COVID-19 tend to reoccur [6].
Previous data showed the involvement of cardiovascular system into the pathogenesis of long COVID suggesting the need for consistent use of diagnostic algorithms aimed at ruling out the inflammatory changes in the myocardium as it may be lifesaving [2,3,7]. Beside cardiovascular involvement, long COVID manifests with multiple conditions [8] including thrombotic and cerebrovascular abnormalities [9], type 2 diabetes mellitus [10], myalgic encephalomyelitis [11,12], and autonomic failure [12]. Long COVID symptoms can last for years [13] and become a disabling condition in so many people that it may contribute to labor shortages at national level [8]. Affected individuals require continuous monitoring and preventive medical examinations [2].
Healthcare systems and overall society must take steps for developing viral epidemic preparedness and emergency disaster care plans due to the threat of impending pandemics [1,14]. The measures should cover all aspects of healthcare including self-management, clinical laboratory services, diagnostic procedures, outpatient and inpatient care, telemedicine, etc. Deep neural network-based integration of diagnostic imaging and clinical information was proposed for predicting survival of COVID-19 patients [15].
Medical imaging represents a valuable resource for combating long COVID and future epidemics especially if adequately integrated with self-management in case of healthcare system overload. However, while the situation with diagnostic imaging during the last pandemic has been relatively clear from the stand point of one medical center [2], the experience, attitudes, and expectations of population in regard to diagnostic services remain poorly understood.
Survey-based approach showed to be promising for identifying clinically vulnerable population [16] and behavioral determinants of health during the pandemic [17]. The primary objective of our online survey-based study was to gain insight into real-world data characterizing the experience, attitudes, and awareness of unstructured population regarding their use of diagnostic imaging modalities during and after COVID-19 pandemic.
2. Materials and Methods
2.1. Ethics
Study protocol was approved by the Biomedical Ethics Committee at Cardiology Research Institute of Tomsk National Research Medical Center (Tomsk, Russia) (approval #248 from September 27, 2023). All patients signed the informed consent form online. The present paper is the first of a planned series of research articles reporting data from the study registered at ClinicalTrials.gov ID: NCT06159699.
2.2. Depersonalized Online Survey
The study assessed the depersonalized survey questionnaire data of a total of 1069 respondents from several regions of the Russian Federation including the Amur, Chelyabinsk, Irkutsk, Kemerovo, Leningrad, Magadan, Novosibirsk, Omsk, Rostov, Sverdlovsk, Tomsk, Vladimir, and Volgograd regions; Khabarovsk, Krasnodar, Krasnoyarsk, and Trans-Baikal territories; Primorsky Krai; Jewish Autonomous Province; Republic of Buryatia and Republic of Tyva. Online questionnaire was available on specialized original websites [18,19] from December 1, 2022 to October 31, 2023.
Only adult respondents aged 18 years and older were invited by text messages sent to deidentified residents via Target-SMS service provided by the telecommunication company Tele2 Russia. The delivery rate reached 77.4%. The invitees were selected randomly by Target-SMS software based on the following criteria: (1) compliance of customer to receive target SMS messages; (2) Android or iOS mobile operating systems powering the device; (3) residence in the selected territories of the country at the time of obtaining the Subscriber Identity Module card. Additionally, the invitations were posted on the Internet (on the VK Social Network and authors' institution official website).
Mobile and desktop versions of specialized websites [18,19] were developed. The survey questionnaire contained the questions on demographic, social, behavioral, clinical, and environmental factors, as well as people's experience and attitudes to medical imaging.
No identifiable patient information is provided in the manuscript. The paper contains only aggregate depersonalized data. The participants had the option to provide their contact information (phone number or/and email). Each participant provided signed informed consent agreement online by checking the appropriate box at the website to comply with legal requirements.
2.3. Sample Size Calculation
Sufficiency of sample size was established based on the following considerations: the acceptable margin of error of 5%, confidence level of 95%, and approximate population size of 1,000,000. Taking into account assumed 50%-response distribution, sufficient sample size was 385 respondents calculated as follows: the sample size n and margin of error E are given by
where N is the population size, r is the fraction of responses of interest, and Z×(c/100) is the critical value for the confidence level c. Taking into account that our sample of respondents exceeded the calculated sample size, the sample size was considered sufficient.
2.4. Statistical Analysis
Normality of distribution of variables was checked by the Kolmogorov–Smirnov test and the Shapiro–Wilk test. Data are presented as percentages, absolute numbers, probabilities, mean ± standard deviation, and median and interquartile range where appropriate. Correlational analysis was performed by computing Pearson and Spearman's Rank correlation coefficients where appropriate. Categorical variables were compared by Pearson's Chi-Square test using multifield contingency tables. Correlation matrix was used to analyze significant associations between the variables. Values were considered statistically significant when p-value was < 0.05.
3. Results
3.1. Sample Characteristics
Distribution of SMS invitations resulted in a total of 3096 persons followed the link provided in the text message; 1588 of invitees signed the informed consent form, and 1069 individuals (67.9%) validly completed the survey questionnaire. The enrolled respondents aged 44.3 ± 14.4 years, and majority of them were female (73.0%). Age distribution in the cohort was normal in both men and women. Median age did not significantly differ between men and women. Rates of answer choices regarding medical imaging did not significantly depend on sex of respondents. For this reason, the paper presents unadjusted data.
Respondents reported to receive the following diagnostic imaging examinations within the two years prior to the survey: fluorography (76.7%), ultrasound (66.0%), X-ray (40.2%), MRI (27.9%), CT (24.4%), scintigraphy (1.9%), and endoscopy (13.7%). 6.1% of respondents reported that they did not receive any diagnostic procedures within the two years prior to the survey. Fluorography was the most common imaging modality (Figure 1 and Figure 2).
3.2. Age-Related Associations
Cohort-wide numbers of administered imaging modalities were normally distributed, and probabilities of imaging modalities had upward age-related trends (Figure 1 and Figure 2). Significant age-related differences were found between 60-69-year-olds and other age groups. The 60-69-year-old group had significantly higher probability to receive CT compared with 20-49-year-old respondents (p < .05). However, they had lower probability of MRI compared with 20-59-year-old respondents (p < .05). This group more often received X-ray compared with 20-29-year-olds (p < .05) and chest fluorography compared with 30-39-year-olds (p < .05). The probability to receive ultrasound in this group was higher than in 18-19- and 30-39-year-old respondents (p < .05). 60-69-year-olds had significantly higher probability to receive endoscopy compared with 20-59-year-olds (p < .05). Respondents aged 50-59 years had significantly higher probability to undergo MRI compared with 18-29-year-olds (p < .05) and fluorography compared with 20-29-year-olds (p < .05). Respondents aged 70-89 years had significantly higher probabilities to receive endoscopy (p < .05) and X-ray examinations compared with 20-29-year-old respondents (p < .05).
3.3. Morbidity-Related Characteristics
Only 27.8% of respondents reported to feeling well while 61.5% of respondents reported slight malady (slightly unwell), and 10.7% felt unwell at the time of survey. As many as 32.8% of respondents reported to suffer from cardiovascular disease (CVD); 9.5% of people had chronic respiratory pathology; 28.9% of people in the survey considered themselves free of any chronic diseases. Figure 3 shows a morbidity structure reported by the respondents. Nearly half of respondents (49.7%) had history of confirmed COVID-19 infection. History of confirmed COVID-19 was associated with a significant increase in CVD morbidity among the respondents aged 40 to 49 years (p < .05) (Figure 4).
Figure 5 shows probabilities of diagnostic imaging administrations within the two years prior to the survey depending on the presence of reported chronic diseases. Respondents with cancer reported significantly higher rate of scintigraphy (p < .05) and significantly lower rate of fluorography (p < .05) compared with respondents of most other groups.
Respondents with history of confirmed COVID-19 had significantly higher probabilities of CT (p < .0001), MRI (p < .001), ultrasound (p < .05), and endoscopy (p < .05) administrations. Figure 6 shows that the presence of CVD was associated with a shift of the diagram towards ultrasound and fluorography among those without history of COVID-19 (p < .05). History of COVID-19 in respondents with CVD shifted the diagram towards CT and MRI compared with those who did not have CVD (p < .05).
The probabilities of receiving fluorography and ultrasound were significantly lower among the respondents who reported to feeling unwell compared with those who felt well or slightly unwell (p < .05).
3.4. Diagnostic Imaging Affordability
Every tenth respondent (10.2%) used to receive diagnostic imaging procedures (MRI, CT, and ultrasound) on privately paid basis while 29.0% of people in the survey admitted that they were unable to pay for diagnostic imaging procedures. 13.1% of respondents reported unavailability of MRI in their neighborhood. Almost a quarter of respondents (24.0%) reported that MRI was available and covered by compulsory health insurance (CHI) with waiting time of two to four weeks while 6.5% reported that insurance-covered MRI was available immediately without waiting. Receiving MRI on paid basis was associated with waiting time of two to four weeks in 15.3% of respondents. 41.2% of respondents reported that privately paid MRI was available immediately without any waiting period. At the population level, respondents who reported that they would personally pay for imaging study only in case of emergency (n = 656) constituted vast majority in every diagnostic modality. Top second answer chosen by respondents suggested that they would receive diagnostic study only free of charge, covered by CHI (n = 312). Respondents who used to pay for diagnostic imaging examinations constituted minority (n = 110).
The rates of administrations for CT, X-ray, fluorography, endoscopy, and scintigraphy did not significantly depend on the ability of respondents to pay for diagnostic imaging (Figure 7). However, there was a significant increase in reported MRI (p < .001) procedures received by respondents who used to have examinations on paid basis. Respondents who tended to receive free-of-charge only diagnostics had the smallest probability to undergo diagnostic ultrasound (p < .05).
3.5. Professional Status
Ultrasound, endoscopy, and CT were most common among retired respondents (p < .05) (Figure 8). Students reported the lowest rates of MRI administrations (p < .05). Unemployed individuals had significantly lower probability to receive fluorography compared with employed participants (p < .05).
3.6. Perceived Superiority of Diagnostic Imaging Modalities
59.5% of respondents considered computed tomography (CT) the most informative method for detecting COVID-19-associated pneumonia. MRI, fluorography, X-ray, and scintigraphy were chosen by 28.4%, 12.5%, 17.5%, and 2.8% of respondents as the best alternatives, respectively.
The highest rates of CT, X-ray, fluorography, and scintigraphy tended to occur in the groups of residents who considered these very modalities the best choice for diagnosing COVID-19-assoctiated pneumonia (Figure 9). The only modality, which was inconsistent with this pattern, was MRI, whose rate was inferior to those of scintigraphy and CT in the group of respondents who, nevertheless, considered MRI the best choice for diagnosing COVID-19-assoctiated pneumonia.
Perceived superiority of chosen diagnostic modality depended on settlement type (city or village) and history of technogenic environmentally unfriendly events in the area (Figure 10). Compared with urban residents, the villagers valued diagnostic informativeness of MRI, CT, and fluorography less (p < .05). On the contrary, residents of villages provided higher rating of X-ray compared with the rating given by respondents residing in the cities. History of technogenic pollution in the area of residence predisposed responders to give a higher appraisal to fluorography (p < .05) compared with the respondents residing in areas with more favorable ecological situation.
3.7. Local Factors
Respondents residing in the areas with history of environmentally adverse technogenic events had significantly higher probability of receiving fluorography compared with respondents living in ecologically favorable areas independently on the type of settlement (p < .001) (Figure 11).
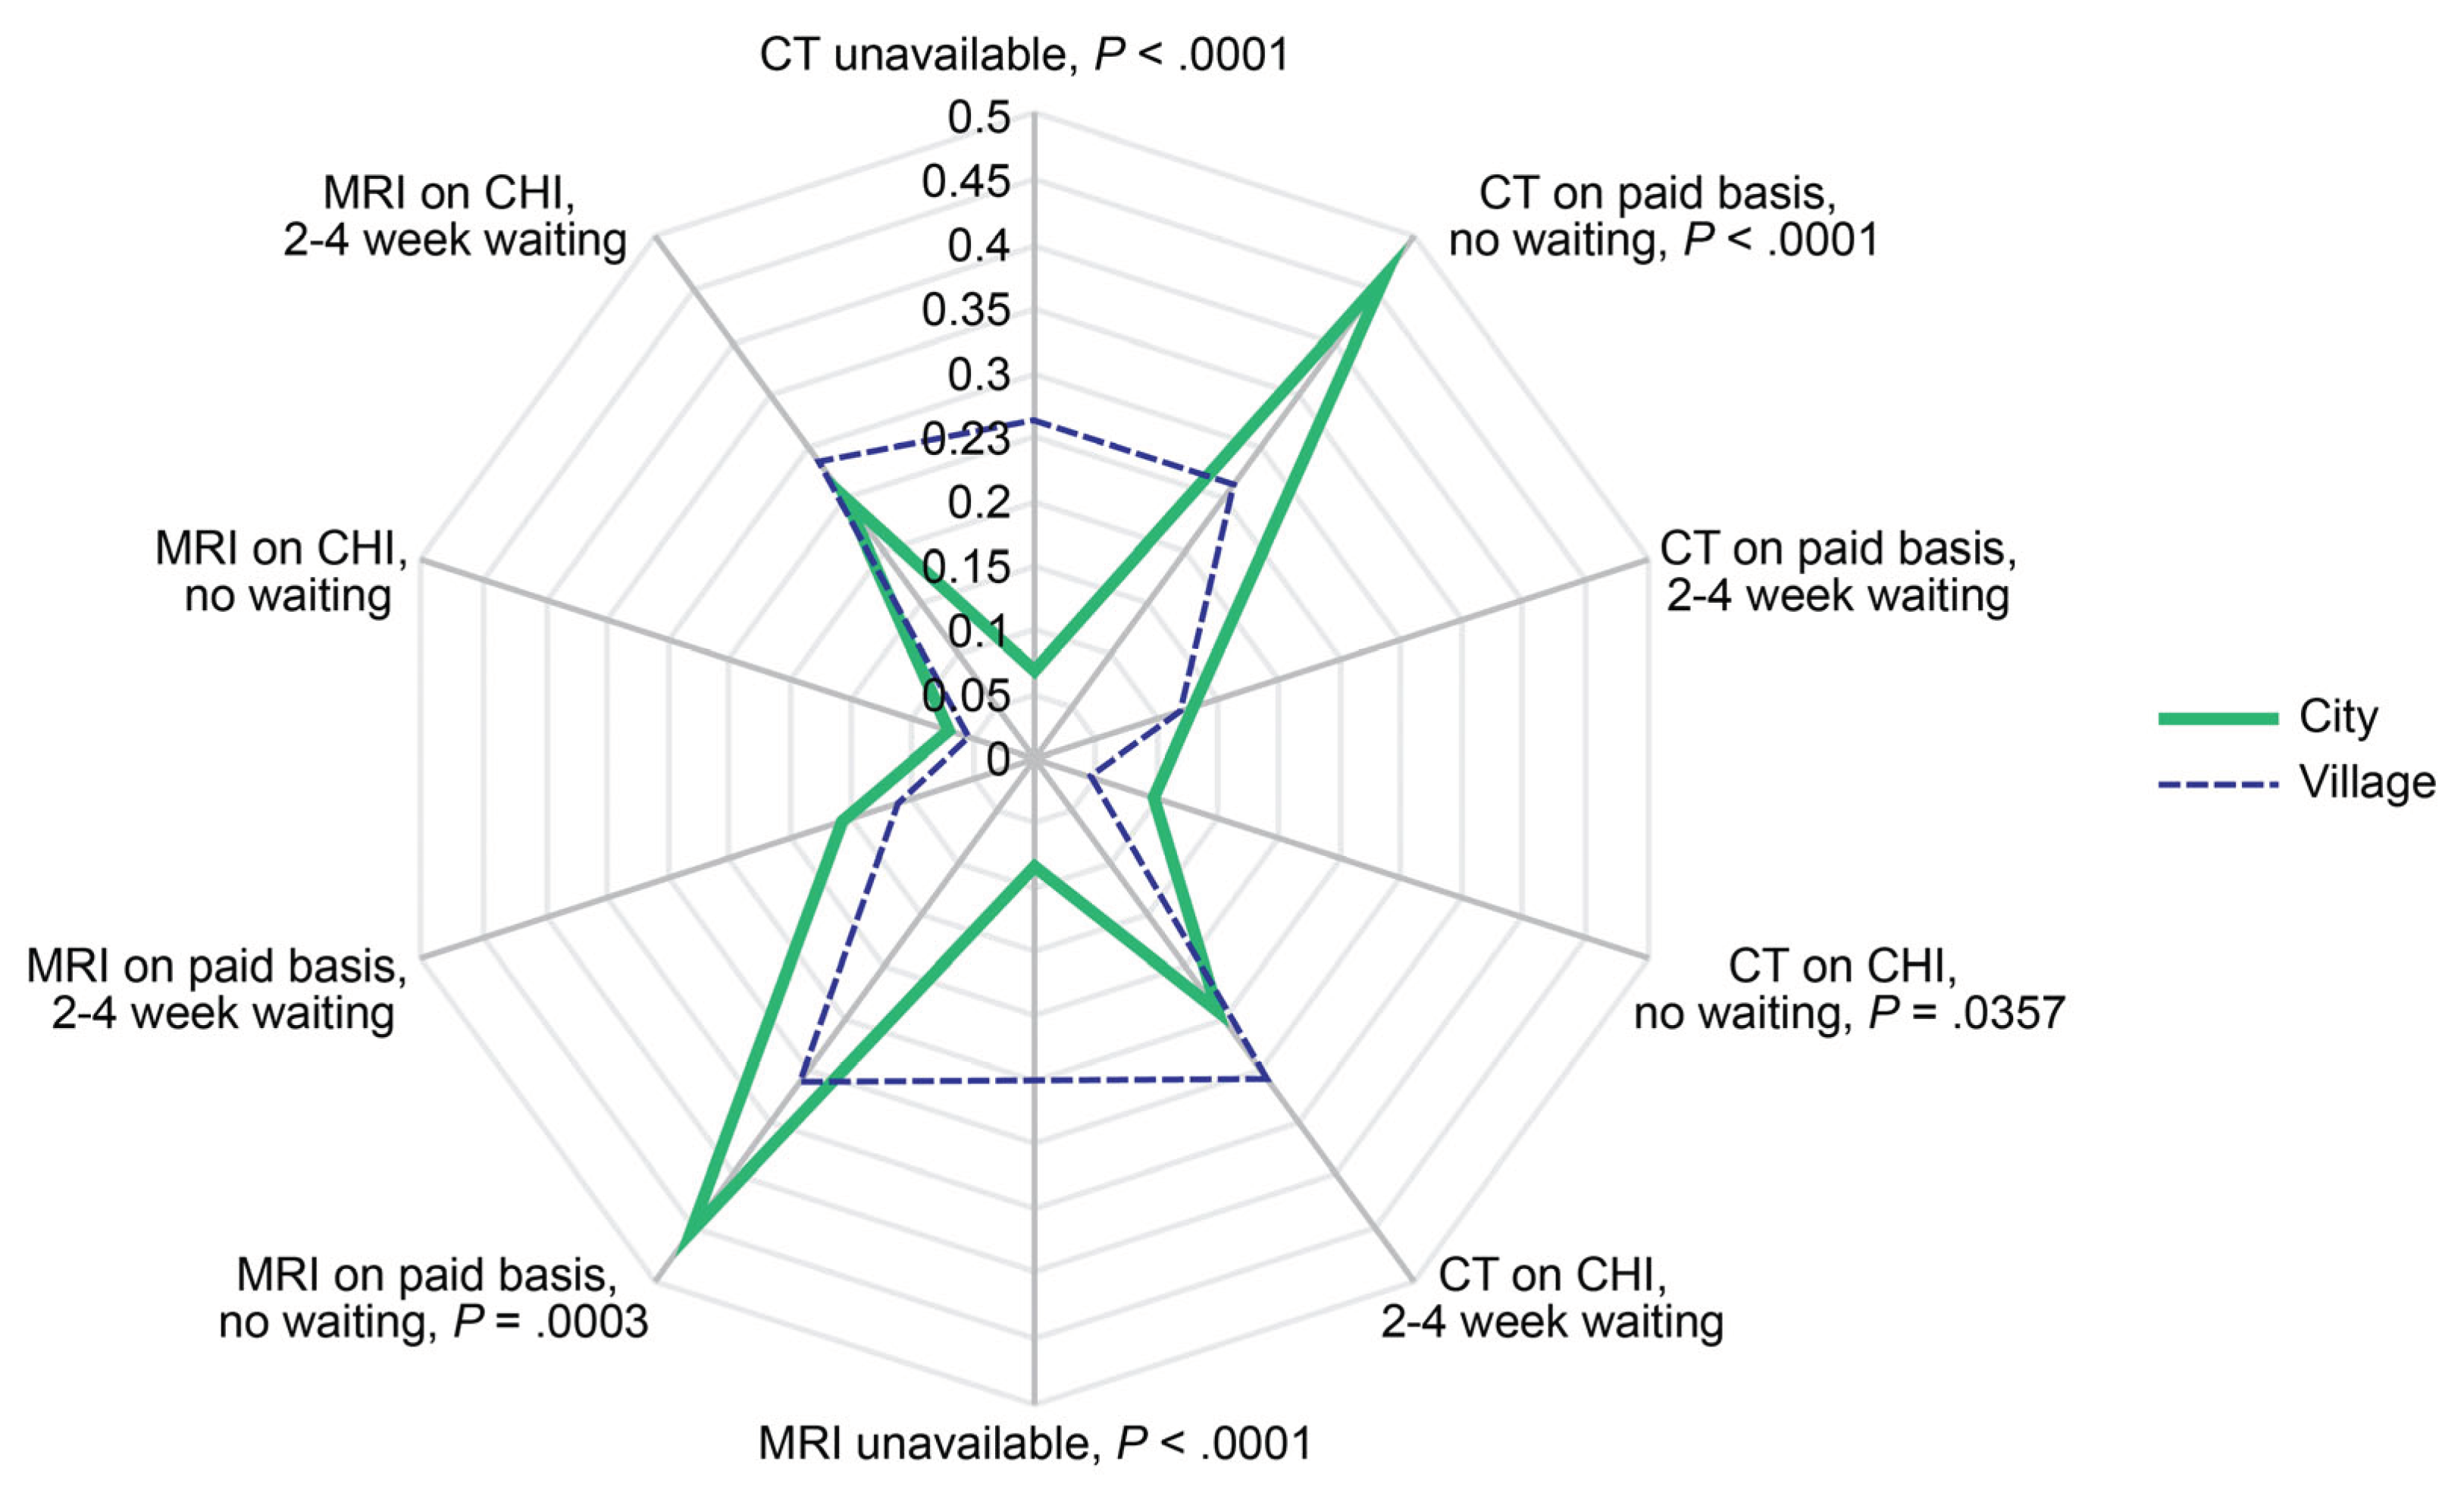
Significantly more respondents from the rural areas considered MRI (p < .0001) and CT unavailable (p < .0001). They had lower probability of receiving CT (p < .0001) and MRI (p < .001) on paid basis without waiting as well as lower probability of receiving prompt CHI-covered CT (p < .05) (Figure 12).
4. Discussion
This paper is the first in a series of articles presenting the results of the online survey-based study registered with ClinicalTrials.gov (NCT06159699). The work uses originally developed websites [18,19] and online survey questionnaire tools. We analyzed the results of the online survey of over a thousand respondents residing in several regions of the Russian Federation. The online survey allowed to obtain real-world data on population experience with diagnostic imaging at the end of COVID-19 pandemic and identified the factors influencing probabilities to receive medical imaging. Better understanding of real-world data may contribute to developing remote monitoring approaches for the evaluation of lung disorders [20] and other diseases.
According to literature, there are many approaches to recruit participants to online surveys, and the methods for improving participation rates in national and regional self-administered web/mail surveys remain under development and investigation [21,22,23]. The effective use of newsletters or emails was found to be the most successful recruitment technique, and the reasons for participating in remote surveys comprise intent to advance research, community protection, and, to a lesser degree, incentives. Altruism is among the primary reasons for contributing to community-based research [23]. The approaches to forming sample range from sequential mixed-mode designs where alternative non-web modes such as mail and telephone are used to follow up with non-respondents [21] to employing the services of online survey research firms [24,25] that use different methods, sometimes not fully disclosed. Target-SMS tool, provided by nationwide telecom company, allowed distributing invitations to potential respondents.
10.7% of our respondents reported to "feel unwell", and about 30% of them considered themselves free of any chronic diseases. In comparison, 15% of American adults perceived themselves as unhealthy according to data of the Health Information National Trends Survey of U.S. [26]. Below average (bad and very bad) self-perceived health was reported by 8.6% of Russian respondents in the study focusing on inequalities in perceived health in the Russian Federation, 1994–2012 [27]. Nearly a half of our respondents reported history of confirmed COVID-19 infection, which exceeds the rate of past COVID-19 infection (16.2%) calculated based on data of the World Health Organization [28] and the Russian Federal State Statistics Service [29]. Considering that many cases, first of all, of mild COVID-19 infection could remain unconfirmed, the vast majority of surveyed population had history of COVID-19. Respondents who reported history of confirmed COVID-19 also reported higher rates of CT, MRI, ultrasound, and endoscopy administrations.
Nearly a half of our respondents reported history of confirmed COVID-19 infection, which exceeds 16.2% calculated based on data of the World Health Organization [28] and the Russian Federal State Statistics Service [29]. Considering that many cases, first of all, of mild COVID-19 infection could remain unconfirmed, the vast majority of surveyed population had history of COVID-19. Respondents who reported history of confirmed COVID-19 also reported higher rates of CT, MRI, ultrasound, and endoscopy.
A third of our respondents had CVD despite relatively young mean age of the people surveyed (~45 years). A significant COVID-19 history-associated increase in CVD morbidity occurred in 40 to 49-year-old group of respondents, which agrees with observations that incident CVD may be a long-term outcome of COVID-19 infection [2,3,30,31,32,33]. Indeed, non-ischemic myocardial fibrosis, exceeding the prevalence in the normal adult population, was found in every third patient with clinical suspicion of cardiovascular post-acute sequelae of SARS-CoV-2 infection. A possible history of myocarditis may explain the persistent symptoms [34]. History of COVID-19 has been linked to an increased risk of developing aortic aneurysms [35,36]. Alarmingly, aortic strain and aortic distensibility abnormalities in the presence of SARS-CoV-2 and multisystem inflammatory syndrome may occur as early as in childhood [37]. CT shows significant long-lasting pulmonary abnormalities up to two years after suffering from severe COVID-19 infection [38]. Controversy remains regarding an informative value of routine brain MRI protocol for long COVID diagnostics [39]. However, advanced imaging modalities, in particular [18F]FDG PET imaging studies show notable hypometabolism in many regions of the brain in individuals with neurological and psychiatric manifestations of long COVID-19 [40]. COVID-19 history shifted imaging administrations towards CT and MRI in respondents with CVD, which agrees with previous data [2].
COVID-19 pandemics posed new threats to general and cardiac health, and imaging services proved to be valuable in identifying emerging health problems [2,3,32,33]. Global COVID-19 pandemic put unprecedented pressure on the healthcare system worldwide. The first wave of this viral infection was associated with a decline in the most areas of healthcare such as planned and screening procedures including examinations requiring MRI [41,42,43,44] It is not surprising that a significant drop in the number of diagnostic MRI procedures was observed in our cardiovascular center during the first months of COVID-19 pandemic though there was a significant increase in the number of cardiac MRI procedures [2]. The decline was, at least, partially compensated by self-administration of medical imaging. The need in cardiac exams may persist considering direct (to a lesser degree) and largely indirect (through systemic inflammatory reaction) impact of SARS-CoV-2 on the cardiovascular system. Besides, heart damage may be associated with the side effects of polypharmacy often administered to COVID-19 patients [4,45,46].
Professional status of respondents significantly affected the pattern of administered diagnostic modalities. This association could be partially explained by age difference, for example, between students, retired, employed, and unemployed respondents. Nevertheless, obtained data demonstrated that there no large disparities between these population categories, and unemployment status did not prevent people from receiving medical imaging procedures though unemployment history could create self-perceived barriers to healthcare access [47].
CT is considered most powerful imaging modality for diagnosing COVID-19-assocated pneumonia [48]. However, less than 60% of our respondents perceived CT superior to other imaging modalities. The widespread use of CT in COVID-19 may cause adverse biological effects. Low radiation-dose scans may lower exposure levels, but they are significantly inferior in the detection of ground-glass opacity, a hallmark of COVID-19 pneumonia [49]. X-ray and chest fluorography are hardly the methods of choice in case of COVID-19-associated pneumonia, but MRI may indeed possess high diagnostic value especially if repeated scans are required [33]. MRI was available to majority of people in the survey, but it was only the fourth most popular diagnostic imaging method despite its high diagnostic value and well-known safety. Relatively high proportion of people could not access or afford MRI procedure due to residing in remote areas. Privately paid MRI was associated with shorter waiting times and was readily available to roughly every tenth person. Being a safe (in the absence of contraindications) method with high diagnostic value, MRI is still not very affordable while MRI prescriptions in the private and public sectors sometimes considered inappropriate [50]. The development and timely updates of appropriate use criteria for MRI would benefit society in case of the next pandemic.
In our study, perceived superiority of diagnostic modalities depended on settlement type and history of environmentally adverse technogenic events in the area. Less favorable ecological situation predisposed responders to give a higher appraisal to chest fluorography, which was administered to those individuals more often. It remains unclear if there were causal relationships in those associations. Evidence suggests that residing/working in the areas with past technogenic events is associated with increased health-related risks [51]. Our study showed that advanced imaging modalities such as MRI and CT were less available for the respondents residing in rural areas, which agrees with other studies [52].
Considering the history of partial collapse of public health care during the COVID-19 pandemic, population will benefit from adequate self-administered advanced medical imaging if similar healthcare crisis reoccurs. In case of a new pandemic, relevant knowledge may navigate people to receive advanced imaging, at least, on paid basis. Real-world data (RWD) on population health conditions and attitudes are essential to generate real-world evidence (RWE), which may be applied to medical diagnostics. Interdisciplinary collaboration would help to translate causal question into causal estimand [53].
Potential limitation of our online survey consists in enriching study cohort with the respondents who left digital footprint in the fields of healthcare and pharmacy before and who used the iOS and Android devices. It could lead to underrepresentation of other groups of diverse Russian population. However, our pilot study of groups who had left or had not left digital shadow in healthcare for the previous three months gained similar results between these categories of respondents. Moreover, the response rate and survey representativeness could be inferior if invitees did not possess devices enabling them to use the mobile versions of online questionnaire. Besides, invitations, potentially distributed in a blind manner, could not allow avoiding the bias of respondents' cohort underrepresentation because acceptance of invitations was affected by respondents' interest in healthcare and medicine, by definition. The Tele2 Russia Target-SMS software used health-related digital shadow to ensure high response to tele-invitations. Measuring potential underrepresentation extent is challenging and requires further research. Other limitation of the study is relatively small group of respondents residing in the areas with history of technogenic environmentally adverse events. This direction requires further research considering health-related findings associated with history of low-dose technogenic radiation [47].
5. Conclusions
In the context of impending pandemics, preventive strategies may require using telecommunication technologies to establish dialogue between healthcare providers, biomedical researchers, and population to ensure effective management and delivery of diagnostic services when needed. Educational and organizational efforts may contribute to promoting the use of relevant imaging modalities among population. An increase in affordability and availability of advanced imaging is strategically essential for population health.
Author Contributions
Conceptualization, NDA, TAS, ASM, NIR, and WYU; Data curation, NDA and ANR; Formal analysis, NDA, TAS, ASM, and NIR; Funding acquisition, NDA; Investigation, NDA, TAS, ASM, NIR, ADK, and NPC; Methodology, NDA, ADK, TAS, ASM, NIR, NPC, and WYU; Project administration, NDA; Resources, NDA; Software, ADK; Supervision, NDA and ANR; Validation, NDA, TAS, ASM, and NIR; Writing – original draft, NDA and ASM; Writing – review & editing, NDA, ASM, TAS, NIR, ADK, NPC, WYU, and ANR.
Funding
Please add: The study was supported by grant of the Russian Science Foundation (project #22-15-00313) with regard to study design, data acquisition, data analysis, data interpretation, and publication of research results; methodology of the study was developed in a framework of state assignment for basic research (#122020300040-0).
Institutional Review Board Statement
The study was conducted in accordance with the Declaration of Helsinki, and approved by the Biomedical Ethics Committee at Cardiology Research Institute of Tomsk National Research Medical Center (Tomsk, Russia) (approval #248 from September 27, 2023). All patients signed the informed consent form online. The present paper is the first of a planned series of research articles reporting data from the study registered at ClinicalTrials.gov ID: NCT06159699.
Informed Consent Statement
No identifiable patient information is provided in the manuscript. The paper contains only aggregate depersonalized data. The participants had the option to provide their contact information (phone number or/and email). Each participant provided signed informed consent agreement online by checking the appropriate box at the website to comply with legal requirements.
Data Availability Statement
Deidentified individual participant data (text, tables, figures, and appendices), underlying the results of the trial, will be shared with researchers to achieve the aims in the approved proposal. Supporting Information may include Study Protocol, Statistical Analysis Plan (SAP), and Clinical Study Report (CSR). Proposals may be submitted up to 36 months following publication of the results of the trial. After 36 months, the data will be available in the Center's data ware house but without investigator support other than deposited metadata. Information regarding submitting proposals and accessing data may be requested from the principal investigator by e-mail sent to corresponding author.
Acknowledgments
Authors thank Tele2 Russia and Mrs. Liana Ishkulova for excellent telecommunication services and Professor Rostislav S. Karpov for a fruitful discussion regarding real world data.
Conflicts of Interest
The authors declare no conflicts of interest.
References
- Fernandez Alonso, C.; Fuentes Ferrer, M.; Llorens, P.; Burillo, G.; Alquézar-Arbé, A.; Jacob, J.; Montero-Pérez, F.J.; Aguiló, S.; Abad Cuñado, V.; Amer Al Arud, L.; et al. Impact of first wave of COVID-19 pandemic on mortality at emergency department in elderly patients with covid and non-covid diagnoses. Gerontology 2023. Dec 29. [Google Scholar] [CrossRef]
- Shelkovnikova, T.A.; Maksimova, A.S.; Ryumshina, N.I.; Mochula, O.V.; Vaizov, V.K.; Ussov, W.Y.; Anfinogenova, N.D. Transformative Effect of COVID-19 Pandemic on Magnetic Resonance Imaging Services in One Tertiary Cardiovascular Center. J. Imaging 2023, 9, 108. [Google Scholar] [CrossRef] [PubMed]
- Shelkovnikova, T.A.; Pushnikova, E.Y.; Baev, A.E.; Ryabov, V.V.; Ussov, W.Y. Magnetic resonance syndromes of myocardial damage in patients after new coronavirus infection (COVID-19) - two typical clinical cases. Siberian Journal of Clinical and Experimental Medicine 2022, 37, 135–141, (In Russ.). https://www.sibjcem.ru/jour/article/view/1364. [CrossRef]
- Higgins, V.; Sohaei, D.; Diamandis, E.P.; Prassas, I. COVID-19: from an acute to chronic disease? Potential long-term health consequences. Crit. Rev. Clin. Lab. Sci. 2021, 58, 297–310. [Google Scholar] [CrossRef] [PubMed]
- Todorovic, V. Mild SARS-CoV-2 infection leaves long-lasting effects on cardiovascular health. Nat. Cardiovasc. Res. 2022, 1, 870. [Google Scholar] [CrossRef]
- Hinds, Z.; Lockwood, P. A cross-sectional student survey of the impact of the Covid-19 lockdowns on clinical placement in England. Radiography (Lond.) 2023, 29, 190–199. [Google Scholar] [CrossRef] [PubMed]
- Luchian, M.-L.; Higny, J.; Benoit, M.; Robaye, B.; Berners, Y.; Henry, J.-P.; Colle, B.; Xhaët, O.; Blommaert, D.; Droogmans, S.; et al. Unmasking Pandemic Echoes: An In-Depth Review of Long COVID’s Unabated Cardiovascular Consequences beyond 2020. Diagnostics 2023, 13, 3368. [Google Scholar] [CrossRef] [PubMed]
- Davis, H.E.; Assaf, G.S.; McCorkell, L.; Wei, H.; Low, R.J.; Re'em, Y.; Redfield, S.; Austin, J.P.; Akrami, A. Characterizing long COVID in an international cohort: 7 months of symptoms and their impact. EClinicalMedicine 2021, 38, 101019. [Google Scholar] [CrossRef] [PubMed]
- Xie, Y.; Xu, E.; Bowe, B.; Al-Aly, Z. Long-term cardiovascular outcomes of COVID-19. Nat. Med. 2022, 28, 583–590. [Google Scholar] [CrossRef] [PubMed]
- Xie, Y.; Al-Aly, Z. Risks and burdens of incident diabetes in long COVID: a cohort study. Lancet Diabetes Endocrinol. 2022, 10, 311–321. [Google Scholar] [CrossRef]
- Mancini, D.M.; Brunjes, D.L.; Lala, A.; Trivieri, M.G.; Contreras, J.P.; Natelson, B.H. Use of Cardiopulmonary Stress Testing for Patients With Unexplained Dyspnea Post-Coronavirus Disease. JACC Heart Fail. 2021, 9, 927–937. [Google Scholar] [CrossRef]
- Larsen, N.W.; Stiles, L.E.; Shaik, R.; Schneider, L.; Muppidi, S.; Tsui, C.T.; Geng, L.N.; Bonilla, H.; Miglis, M.G. Characterization of autonomic symptom burden in long COVID: A global survey of 2,314 adults. Front. Neurol. 2022, 13, 1012668. [Google Scholar] [CrossRef] [PubMed]
- Demko, Z.O.; Yu, T.; Mullapudi, S.K.; Varela Heslin, M.G.; Dorsey, C.A.; Payton, C.B.; Tornheim, J.A.; Blair, P.W.; Mehta, S.H.; Thomas, D.L.; et al. Post-acute sequelae of SARS-CoV-2 (PASC) impact quality of life at 6, 12 and 18 months post-infection. medRxiv [Preprint] 2022, arXiv:2022.08.08.22278543. [Google Scholar] [CrossRef]
- Martínez, M.J.; Cotton, M.; Phan, M.V.T.; Becker, K.; Espasa, M.; Leegaard, T.M.; Lisby, G.; Schneider, U.V.; Casals-Pascual, C. Viral epidemic preparedness: a perspective from five clinical microbiology laboratories in Europe. Clin. Microbiol. Infect. 2023, 8, S1198-743X(23)00198-2. [Google Scholar] [CrossRef]
- Ghafoori, M.; Hamidi, M.; Modegh, R.G.; Aziz-Ahari, A.; Heydari, N.; Tavafizadeh, Z.; Pournik, O.; Emdadi, S.; Samimi, S.; Mohseni, A.; et al. Predicting survival of Iranian COVID-19 patients infected by various variants including omicron from CT Scan images and clinical data using deep neural networks. Heliyon 2023, 9, e21965. [Google Scholar] [CrossRef] [PubMed]
- Di Gessa, G.; Price, D. Changes in health and social well-being in the COVID-19 clinically vulnerable older English population during the pandemic. J. Epidemiol. Community Health 2021, 75, 1070–1077. [Google Scholar] [CrossRef] [PubMed]
- Bann, D.; Villadsen, A.; Maddock, J.; Hughes, A.; Ploubidis, G.B.; Silverwood, R.; Patalay, P. Changes in the behavioural determinants of health during the COVID-19 pandemic: gender, socioeconomic and ethnic inequalities in five British cohort studies. J. Epidemiol. Community Health 2021, 75, 1136–1142. [Google Scholar] [CrossRef] [PubMed]
- Questionnaire. Online survey-based clinical study: Risk factors and new challenges for the population on the path to achieving active aging. Available online: https://zdorov.expert/1-1 (accessed on 03 March 2024).
- Online survey-based clinical study: Risk factors and new challenges for the population on the path to achieving active aging. Available online: https://zdorov.tpu.ru/forms (accessed on 03 March 2024).
- Ranjan, Y.; Althobiani, M.; Jacob, J.; Orini, M.; Dobson, R.J.; Porter, J.; Hurst, J.; Folarin, A.A. Remote Assessment of Lung Disease and Impact on Physical and Mental Health (RALPMH): Protocol for a Prospective Observational Study. JMIR Res. Protoc. 2021, 10, e28873. [Google Scholar] [CrossRef] [PubMed]
- West, B.T.; Zhang, S.; Wagner, J.; Gatward, R.; Saw, H.W.; Axinn, W.G. Methods for improving participation rates in national self-administered web/mail surveys: Evidence from the United States. PLoS One 2023, 18, e0289695. [Google Scholar] [CrossRef] [PubMed]
- Edwards, P.J.; Roberts, I.; Clarke, M.J.; DiGuiseppi, C.; Woolf, B.; Perkins, C. Methods to increase response to postal and electronic questionnaires. Cochrane Database Syst. Rev. 2023, 11, MR000008. [Google Scholar] [CrossRef] [PubMed]
- Schilling, J.; Klein, D.; Bartholmae, M.M.; Shokouhi, S.; Toepp, A.J.; Roess, A.A.; Sill, J.M.; Karpov, M.V.; Maney, K.; Brown, K.P.; et al. A Digital Health Initiative (COVIDsmart) for Remote Data Collection and Study of COVID-19's Impact on the State of Virginia: Prospective Cohort Study. JMIR Form. Res. 2023, 7, e37550. [Google Scholar] [CrossRef] [PubMed]
- Lakhoo, K.; Almario, C.V.; Khalil, C.; Spiegel, B.M.R. Prevalence and Characteristics of Abdominal Pain in the United States. Clin. Gastroenterol. Hepatol. 2021, 19, 1864–1872.e5. [Google Scholar] [CrossRef]
- Lee, J.J.; Poon, C.Y.; O'Connor, S.; Wong, J.Y.H.; Kwok, J.Y.Y.; Choi, E.P.H.; Tsang, W.N.; Wang, M.P. Associations of eHealth literacy and knowledge with preventive behaviours and psychological distress during the COVID-19 pandemic: a population-based online survey. BMJ Open 2023, 13, e069514. [Google Scholar] [CrossRef]
- AlDukhail, S.; Bahdila, D. Self-perception of health and physical activity among adults before and amidst the COVID-19 pandemic: United States, 2019-2020. Prev. Med. 2022, 158, 107037. [Google Scholar] [CrossRef]
- Paul, P.; Valtonen, H. Inequalities in perceived health in the Russian Federation, 1994-2012. BMC Public Health 2016, 16, 165. [Google Scholar] [CrossRef]
- World Health Organization. Number of COVID-19 cases reported to WHO (cumulative total): Russian Federation. Available online: https://data.who.int/dashboards/covid19/cases?m49=643&n=c (accessed on 03 March 2024).
- Federal State Statistics Service (March 17, 2023). Estimation of the resident population as of January 1, 2023 and on average for 2022 and the components of its change (taking into account the results of the All-Russian Population Census of 2020). Available online: https://rosstat.gov.ru/compendium/document/13282 (accessed on 03 March 2024).
- Koyama, A.K.; Imperatore, G.; Rolka, D.B.; Lundeen, E.; Rutkowski, R.E.; Jackson, S.L.; He, S.; Kuklina, E.V.; Park, S.; Pavkov, M.E. Risk of Cardiovascular Disease After COVID-19 Diagnosis Among Adults With and Without Diabetes. J. Am. Heart Assoc. 2023, 12, e029696. [Google Scholar] [CrossRef]
- Ussov, W.Y.; Ignatenko, G.A.; Nudnov, N.V.; Bergen, T.A.; Gulyaev, V.M.; Pervak, M.B.; Yaroshevsky, S.P.; Dubovaya, A.V.; Karmazanovsky, G.G. Comprehensive MRI of the chest and brain in the diagnosis of injury to thoracic organs, myocardium, and brain in COVID-19. The University Clinic 2021, Suppl.I, 144–145, (In Russ.). Available online: https://dnmu.ru/wp-content/uploads/2021/02/materConfCovid_010221.pdf.
- Ussov, W.Y.; Nudnov, N.V.; Ignatenko, G.A.; Fisenko, A.Y.; Gulyaev, V.M.; Maritskii, S.V.; Kalyuzhin, V.V.; Lukyanenok, P.I. Evaluation of lung damage in pneumonia, from chest magnetic resonance imaging, in primary diagnosis and in the follow-up of treatment. Medical Visualization 2020, 24, 63–77. Abstract available online: https://medvis.vidar.ru/jour/article/view/914. [CrossRef]
- Ussov, W.Y.; Nudnov, N.V.; Ignatenko, G.A.; Gulyaev, V.M.; Pervak, M.B.; Shelkovnikova, T.A.; Dubovaya, A.V.; Bergen, T.A. Primary and prospective imaging of the chest using magnetic resonance imaging in patients with viral lung damage in COVID-19. Medical Visualization 2020, 24, 11–26. Abstract available online: https://medvis.vidar.ru/jour/article/view/967. [CrossRef]
- Halfmann, M.C.; Luetkens, J.A.; Langenbach, I.L.; Kravchenko, D.; Wenzel, P.; Emrich, T.; Isaak, A. Cardiac MRI Findings in Patients Clinically Referred for Evaluation of Post-Acute Sequelae of SARS-CoV-2 Infection. Diagnostics 2023, 13, 2172. [Google Scholar] [CrossRef]
- Mohseni, A.; Di Girolamo, A.; Cangiano, R.; Ascione, M.; di Marzo, L.; Mansour, W. High-Grade Infection after Branched Endovascular Aortic Repair in Patient with Recent COVID-19 Hospitalization. Diagnostics 2024, 14, 205. [Google Scholar] [CrossRef]
- Anfinogenova, N.D.; Sinitsyn, V.E.; Kozlov, B.N.; Panfilov, D.S.; Popov, S.V.; Vrublevsky, A.V.; Chernyavsky, A.; Bergen, T.; Khovrin, V.V.; Ussov, W.Y. Existing and Emerging Approaches to Risk Assessment in Patients with Ascending Thoracic Aortic Dilatation. J. Imaging 2022, 8, 280. [Google Scholar] [CrossRef]
- Ostberg, N.P.; Zafar, M.A.; Ziganshin, B.A.; Elefteriades, J.A. The Genetics of Thoracic Aortic Aneurysms and Dissection: A Clinical Perspective. Biomolecules 2020, 10, 182. [Google Scholar] [CrossRef]
- Babar, M.; Jamil, H.; Mehta, N.; Moutwakil, A.; Duong, T.Q. Short- and Long-Term Chest-CT Findings after Recovery from COVID-19: A Systematic Review and Meta-Analysis. Diagnostics 2024, 14, 621. [Google Scholar] [CrossRef]
- Vasilev, Y.; Blokhin, I.; Khoruzhaya, A.; Kodenko, M.; Kolyshenkov, V.; Nanova, O.; Shumskaya, Y.; Omelyanskaya, O.; Vladzymyrskyy, A.; Reshetnikov, R. Routine Brain MRI Findings on the Long-Term Effects of COVID-19: A Scoping Review. Diagnostics 2023, 13, 2533. [Google Scholar] [CrossRef]
- Hameed, R.; Bahadur, A.R.; Singh, S.B.; Sher, J.; Todua, M.; Moradi, L.; Bastakoti, S.; Arslan, M.; Ajmal, H.; Lee, G.Y.; et al. Neurological and Psychiatric Manifestations of Long COVID-19 and Their [18F]FDG PET Findings: A Review. Diagnostics 2023, 13, 2353. [Google Scholar] [CrossRef]
- de Pelsemaeker, M.C.; Guiot, Y.; Vanderveken, J.; Galant, C.; Van Bockstal, M.R. The Impact of the COVID-19 Pandemic and the Associated Belgian Governmental Measures on Cancer Screening, Surgical Pathology and Cytopathology. Pathobiology 2021, 88, 46–55. [Google Scholar] [CrossRef]
- Keizman, E.; Ram, E.; Kachel, E.; Sternik, L.; Raanani, E. The impact of COVID-19 pandemic on cardiac surgery in Israel. J. Cardiothorac. Surg. 2020, 15, 294. [Google Scholar] [CrossRef]
- Saban, M.; Reznik, A.; Shachar, T.; Wilf-Miron, R.; Sivan-Hoffmann, R. The effect of the COVID-19 pandemic on ED referrals and care for stroke patients: A four-year comparative study. J. Crit. Care 2021, 62, 230–234. [Google Scholar] [CrossRef]
- Hartnett, K.P.; Kite-Powell, A.; DeVies, J.; Coletta, M.A.; Boehmer, T.K.; Adjemian, J.; Gundlapalli, A.V.; National Syndromic Surveillance Program Community of Practice. Impact of the COVID-19 Pandemic on Emergency Department Visits - United States, January 1, 2019-May 30, 2020. MMWR Morb. Mortal. Wkly. Rep. 2020, 69, 699–704. [Google Scholar] [CrossRef]
- Anfinogenova, N.D.; Trubacheva, I.A.; Popov, S.V.; Efimova, E.V.; Ussov, W.Y. Trends and concerns of potentially inappropriate medication use in patients with cardiovascular diseases. Expert Opin. Drug Saf. 2021, 20, 1191–1206. [Google Scholar] [CrossRef]
- Anfinogenova, N.D.; Novikova, O.M.; Trubacheva, I.A.; Efimova, E.V.; Chesalov, N.P.; Ussov, W.Y.; Maksimova, A.S.; Shelkovnikova, T.A.; Ryumshina, N.I.; Stepanov, V.A.; et al. Prescribed Versus Taken Polypharmacy and Drug–Drug Interactions in Older Cardiovascular Patients during the COVID-19 Pandemic: Observational Cross-Sectional Analytical Study. J. Clin. Med. 2023, 12, 5061. [Google Scholar] [CrossRef]
- Hoven, H.; Backhaus, I.; Gerő, K.; Kawachi, I. Characteristics of employment history and self-perceived barriers to healthcare access. Eur. J. Public Health 2023, 33, 1080–1087. [Google Scholar] [CrossRef]
- Xu, X.; Yu, C.; Qu, J.; Zhang, L.; Jiang, S.; Huang, D.; Chen, B.; Zhang, Z.; Guan, W.; Ling, Z.; et al. Imaging and clinical features of patients with 2019 novel coronavirus SARS-CoV-2. Eur. J. Nucl. Med. Mol. Imaging 2020, 47, 1275–1280. [Google Scholar] [CrossRef]
- Karakaş, H.M.; Yıldırım, G.; Çiçek, E.D. The reliability of low-dose chest CT for the initial imaging of COVID-19: comparison of structured findings, categorical diagnoses and dose levels. Diagn. Interv. Radiol. 2021, 27, 607–614. [Google Scholar] [CrossRef]
- Jahanmehr, N.; Bigdeli, A.S.; Salari, H.; Mokarami, H.; KhodaKarim, S.; Damiri, S. Analyzing inappropriate magnetic resonance imaging (MRI) prescriptions and resulting economic burden on patients suffering from back pain. Int. J. Health Plann. Manage. 2019, 34, e1437–e1447. [Google Scholar] [CrossRef] [PubMed]
- Karpov, A.B.; Takhauov, R.M.; Zerenkov, A.G.; Semenova, Y.V.; Bogdanov, I.M.; Kazantceva, S.B.; Blinov, A.P.; Kalinkin, D.E.; Gorina, G.V.; Litvinova, O.V.; et al. Descriptive characteristics of occupational exposures and medical follow-up in the cohort of workers of the Siberian Group of Chemical Enterprises in Seversk, Russia. Int. J. Radiat. Biol. 2021, 97, 848–860. [Google Scholar] [CrossRef]
- Burdorf, B.T. Comparing magnetic resonance imaging and computed tomography machine accessibility among urban and rural county hospitals. J. Public Health Res. 2021, 11, 2527. [Google Scholar] [CrossRef]
- Dang, L.E.; Gruber, S.; Lee, H.; Dahabreh, I.J.; Stuart, E.A.; Williamson, B.D.; Wyss, R.; Díaz, I.; Ghosh, D.; Kıcıman, E.; et al. A causal roadmap for generating high-quality real-world evidence. J. Clin. Transl. Sci. 2023, 7, e212. [Google Scholar] [CrossRef]
Figure 1.
Numbers of administrations of diagnostic imaging modalities in age groups over the entire cohort for the past two years prior to the survey. The rates were calculated for two years prior to the survey. CT — computed tomography, MRI — magnetic resonance imaging.
Figure 1.
Numbers of administrations of diagnostic imaging modalities in age groups over the entire cohort for the past two years prior to the survey. The rates were calculated for two years prior to the survey. CT — computed tomography, MRI — magnetic resonance imaging.
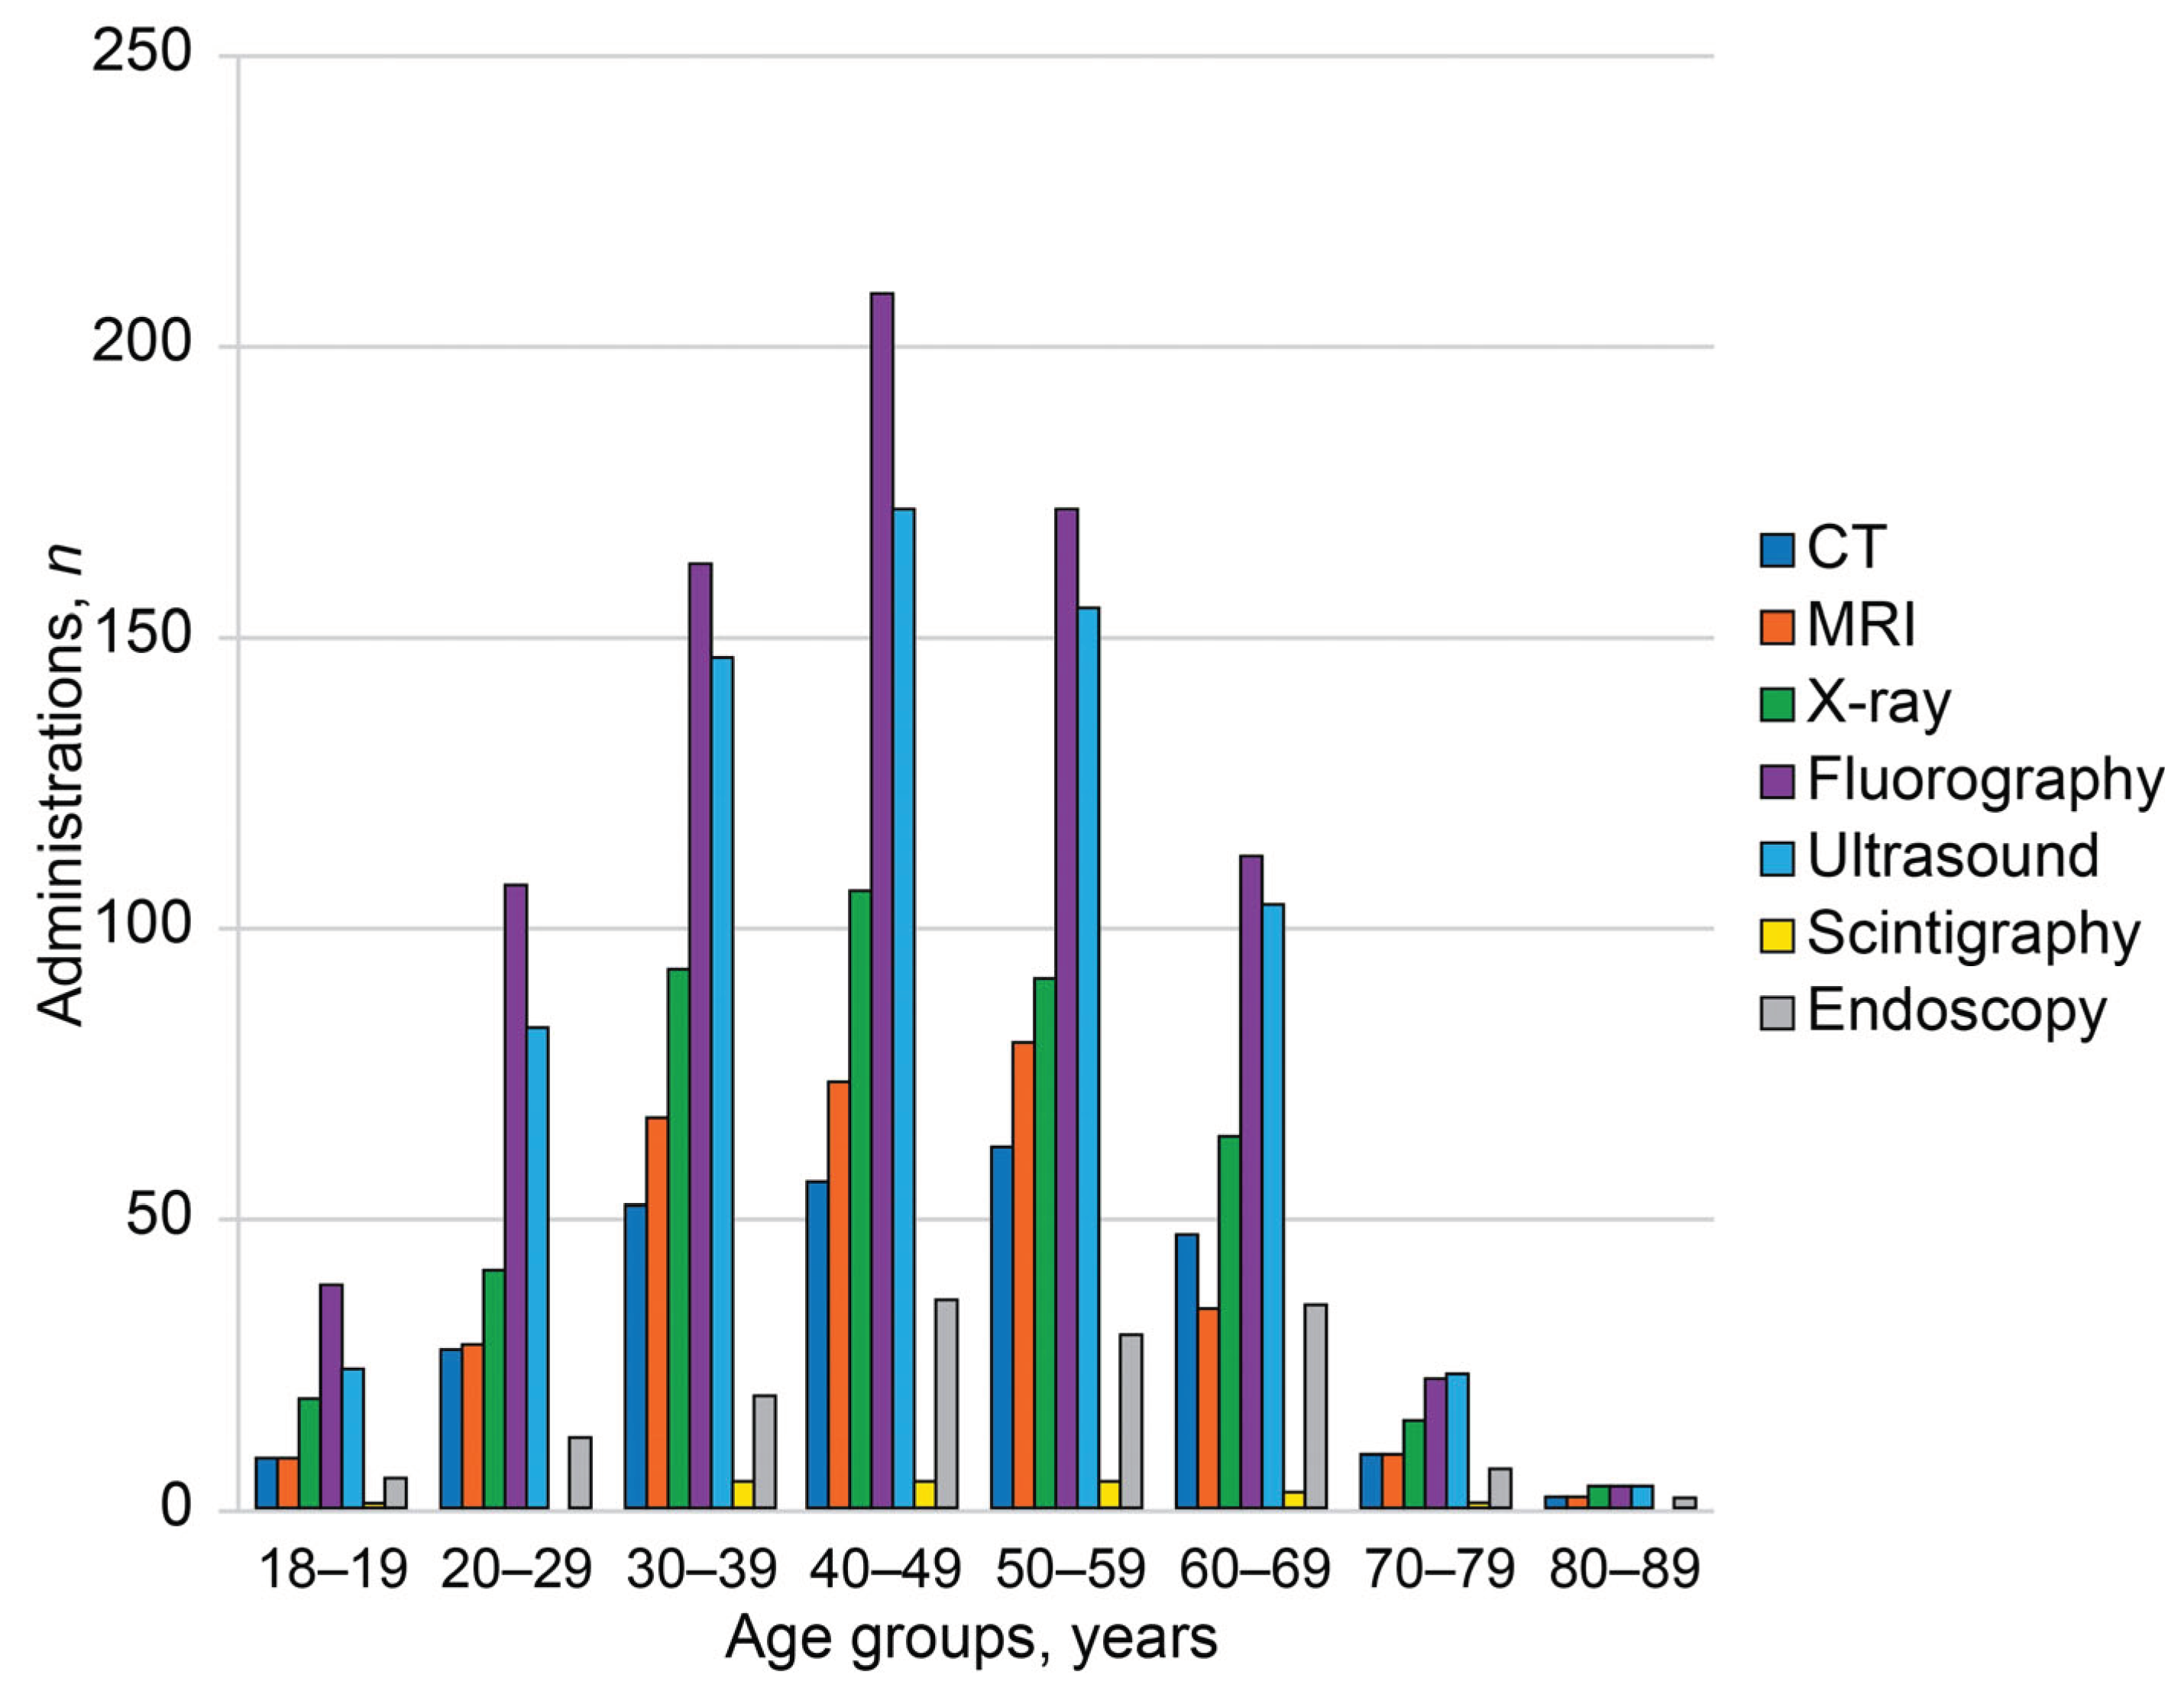
Figure 2.
Probabilities of imaging modality administrations per person in age groups. Black lines represent linear trends in age-dependent probabilities. The rates were calculated per person for the past two years prior to the survey. CT — computed tomography, MRI — magnetic resonance imaging.
Figure 2.
Probabilities of imaging modality administrations per person in age groups. Black lines represent linear trends in age-dependent probabilities. The rates were calculated per person for the past two years prior to the survey. CT — computed tomography, MRI — magnetic resonance imaging.
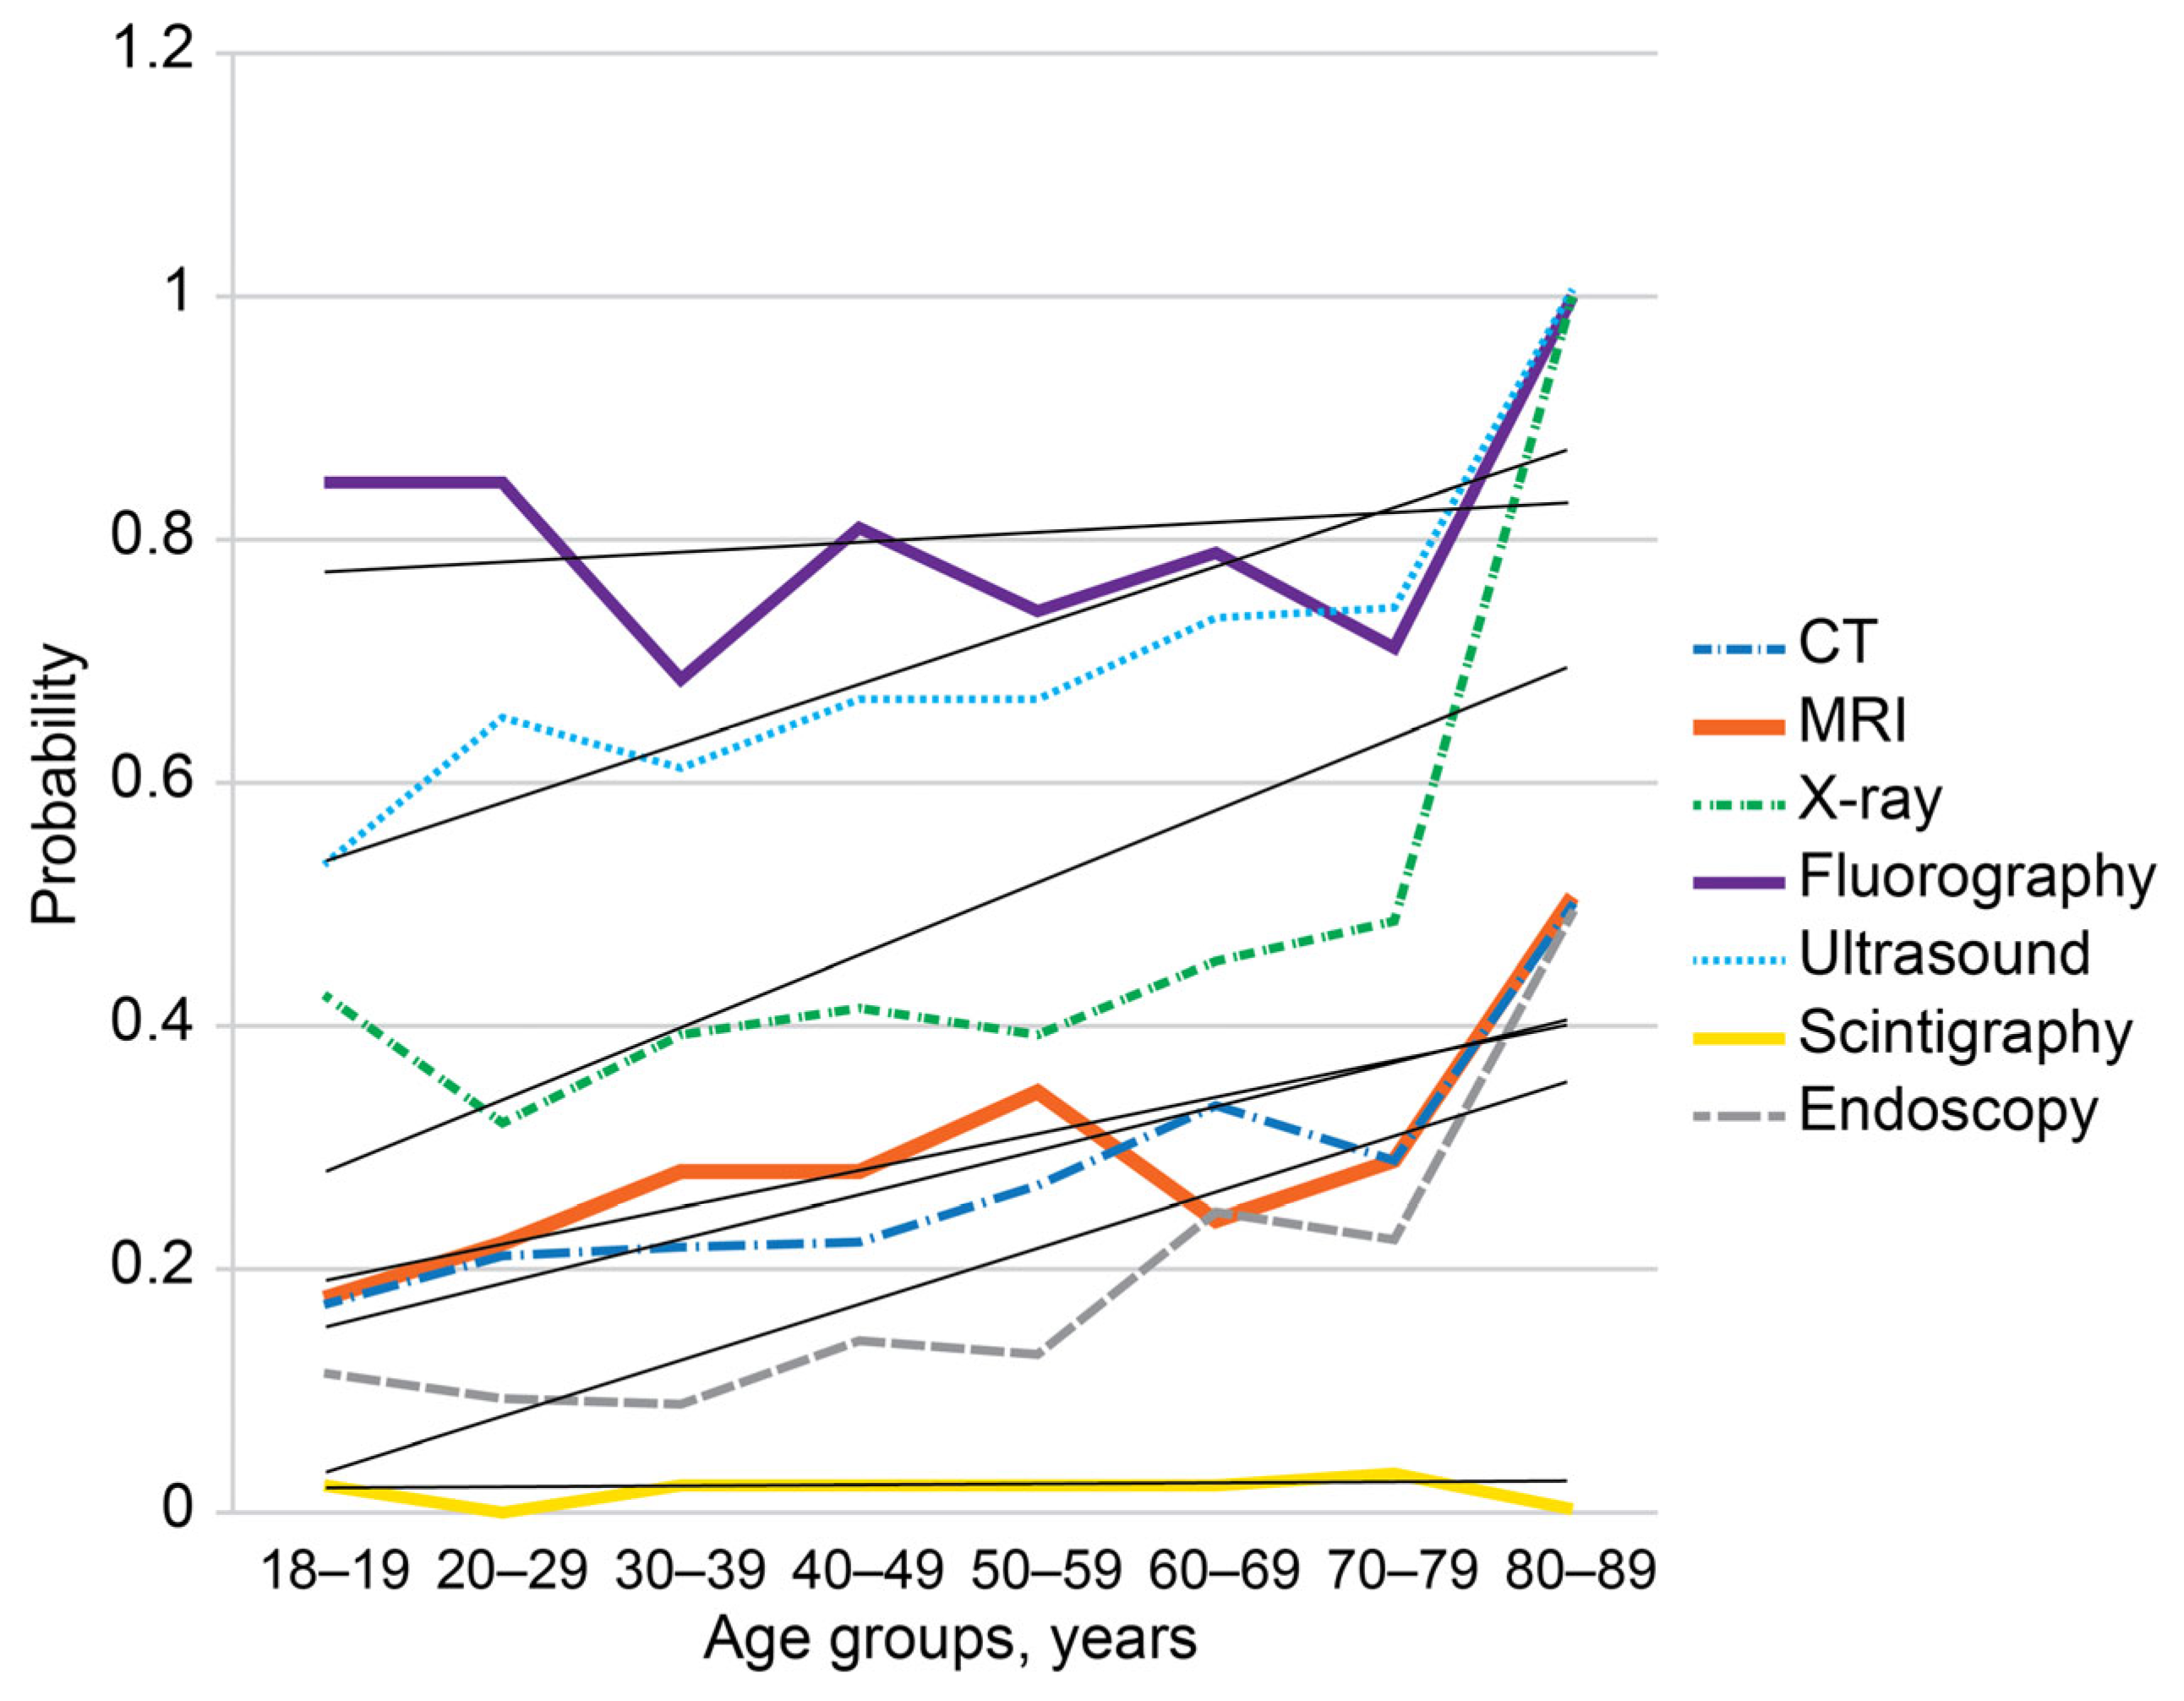
Figure 3.
Morbidity structure reported by the respondents of the online survey. B — chronic viral infections, HBV — hepatitis B, HCV — hepatitis C, HIV — human immunodeficiency virus infection. C — oncology disease, D — blood and blood-forming organ diseases and certain disorders involving the immune mechanism, E — endocrine disorders, unspecified, E-DM — diabetes mellitus, F — mental, behavioral and neurodevelopmental disorders, G — diseases of the nervous system, H — diseases of eye and adnexa, ear and mastoid process, I — cardiovascular and ischemic diseases, J — diseases of the respiratory system, K — diseases of the digestive system, M — musculoskeletal, rheumatic, and autoimmune disorders, MSDs — musculoskeletal disorders, N — diseases of the genitourinary system, Q — genetic disorders, S,T — injury, poisoning and certain other consequences of external causes.
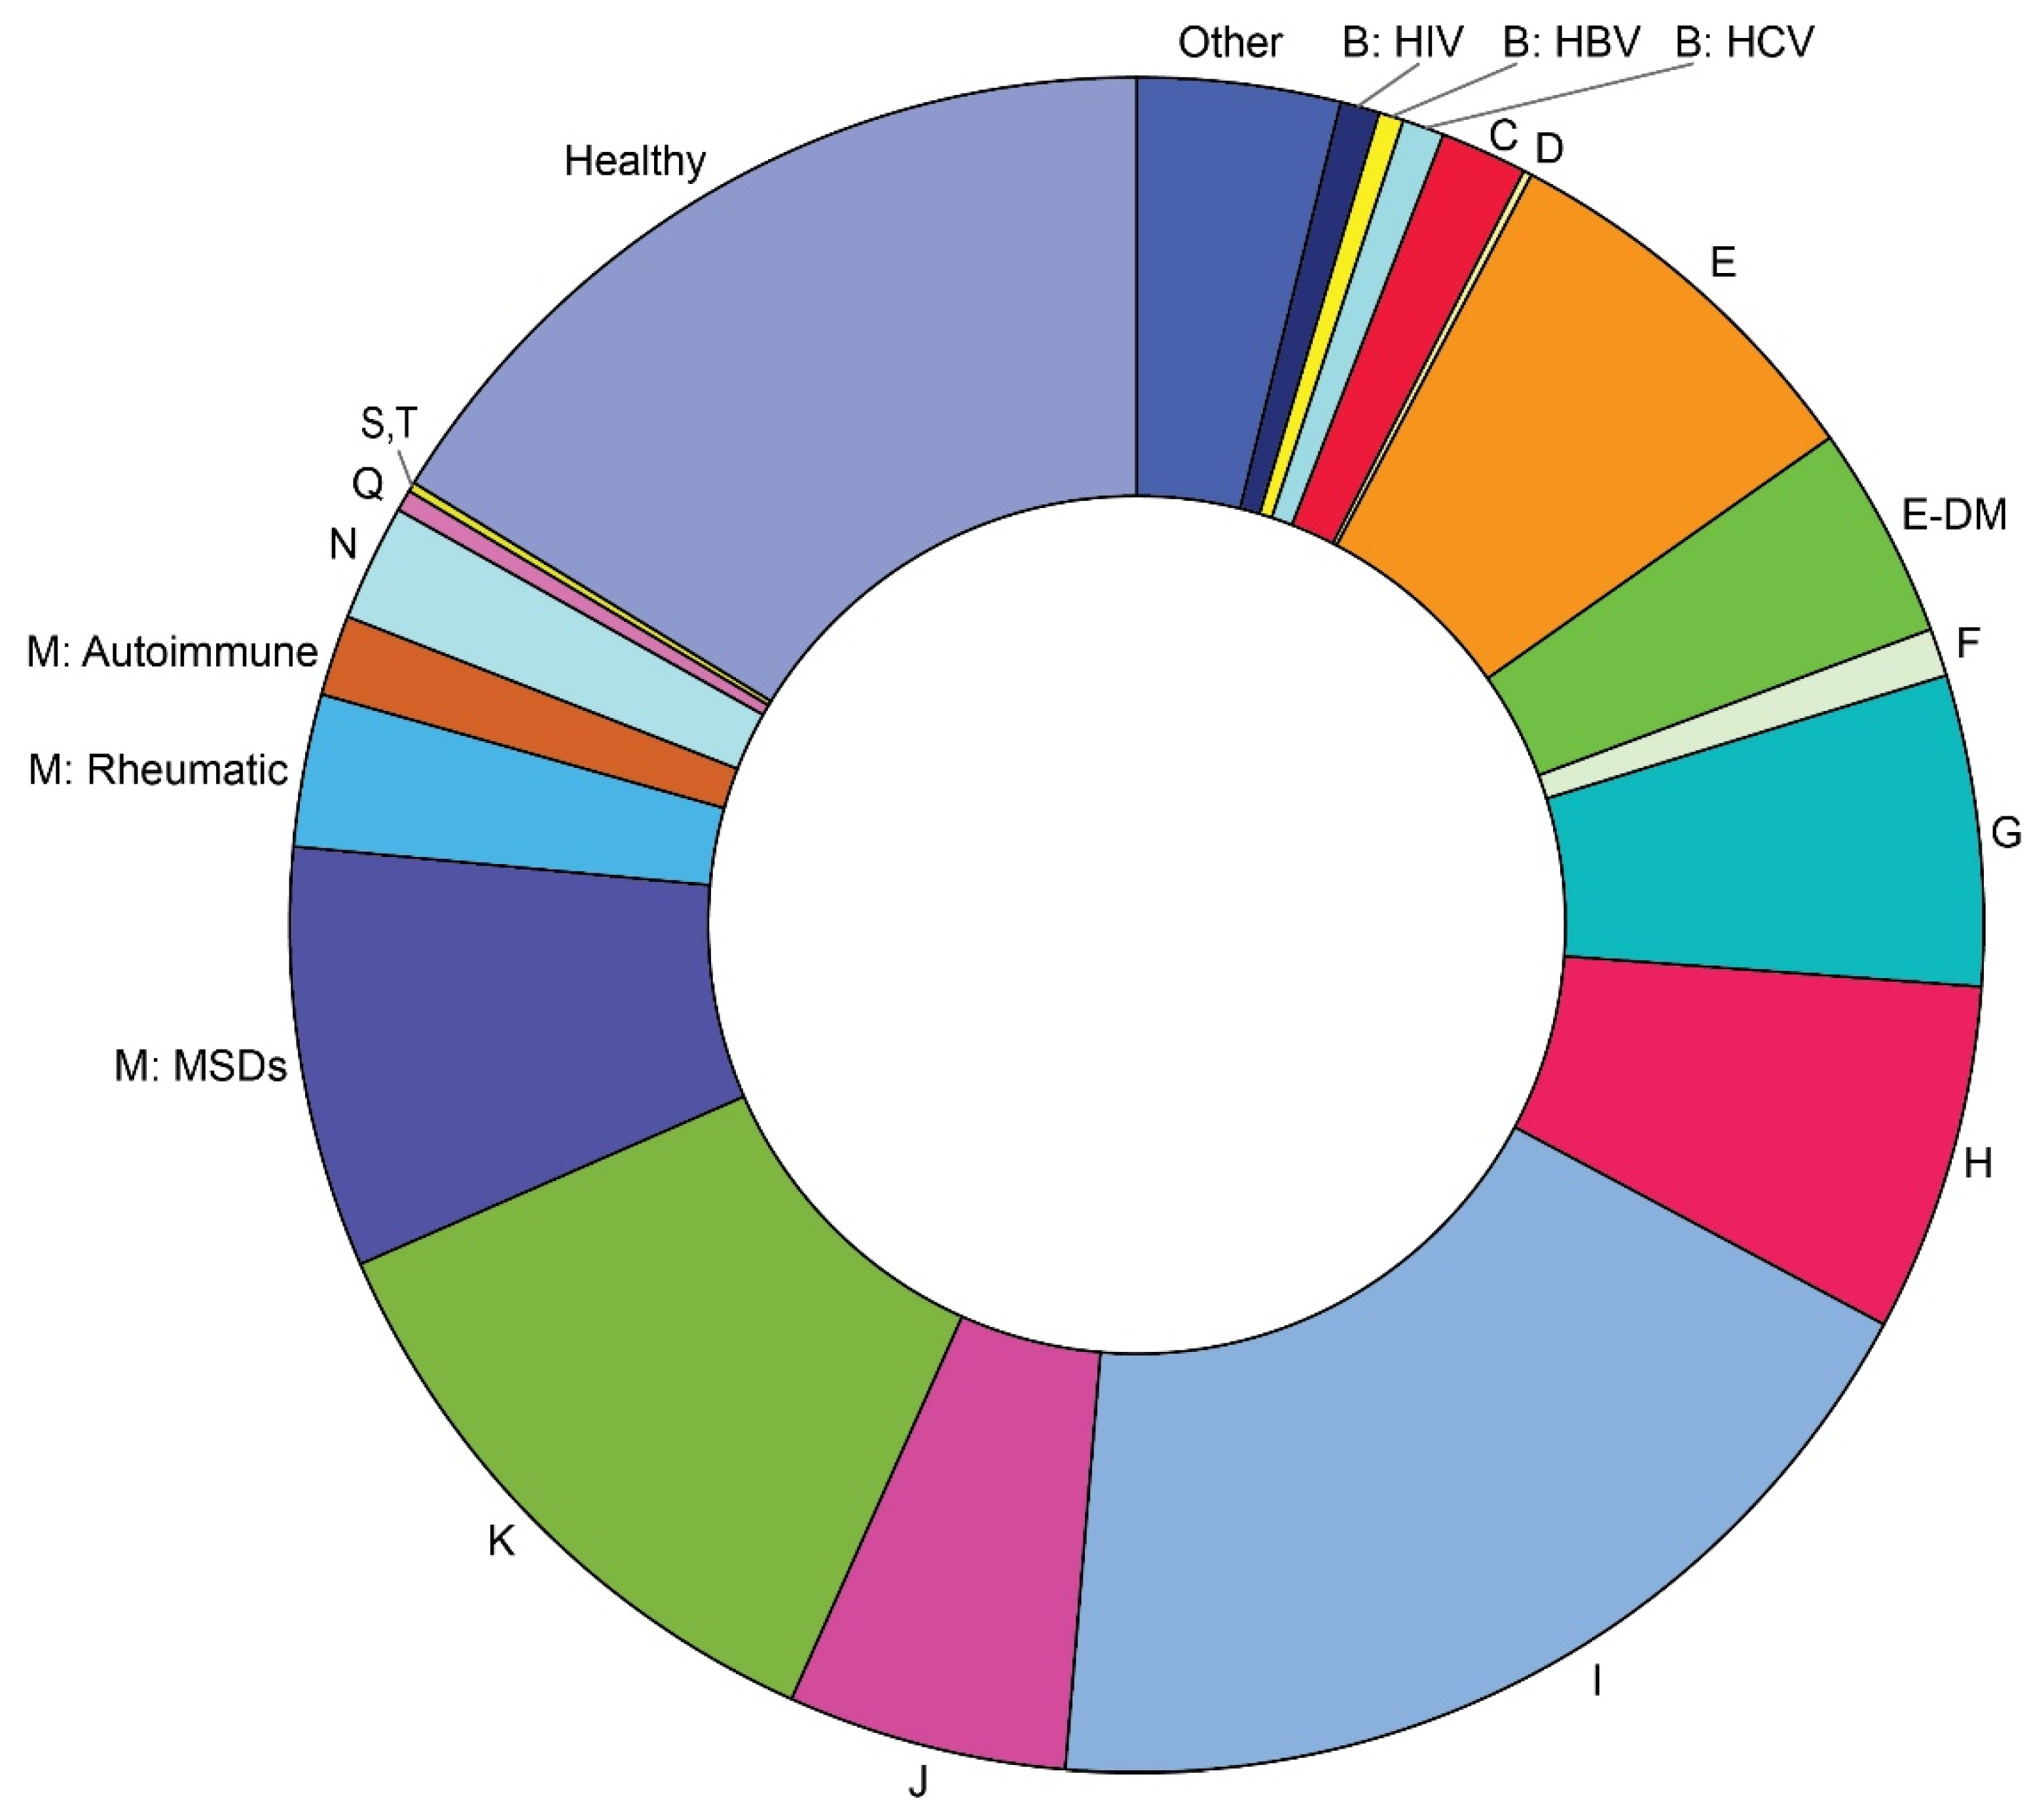
Figure 4.
Probabilities of cardiovascular diseases (CVD) in respondents with and without history of COVID-19 depending on age.
Figure 4.
Probabilities of cardiovascular diseases (CVD) in respondents with and without history of COVID-19 depending on age.
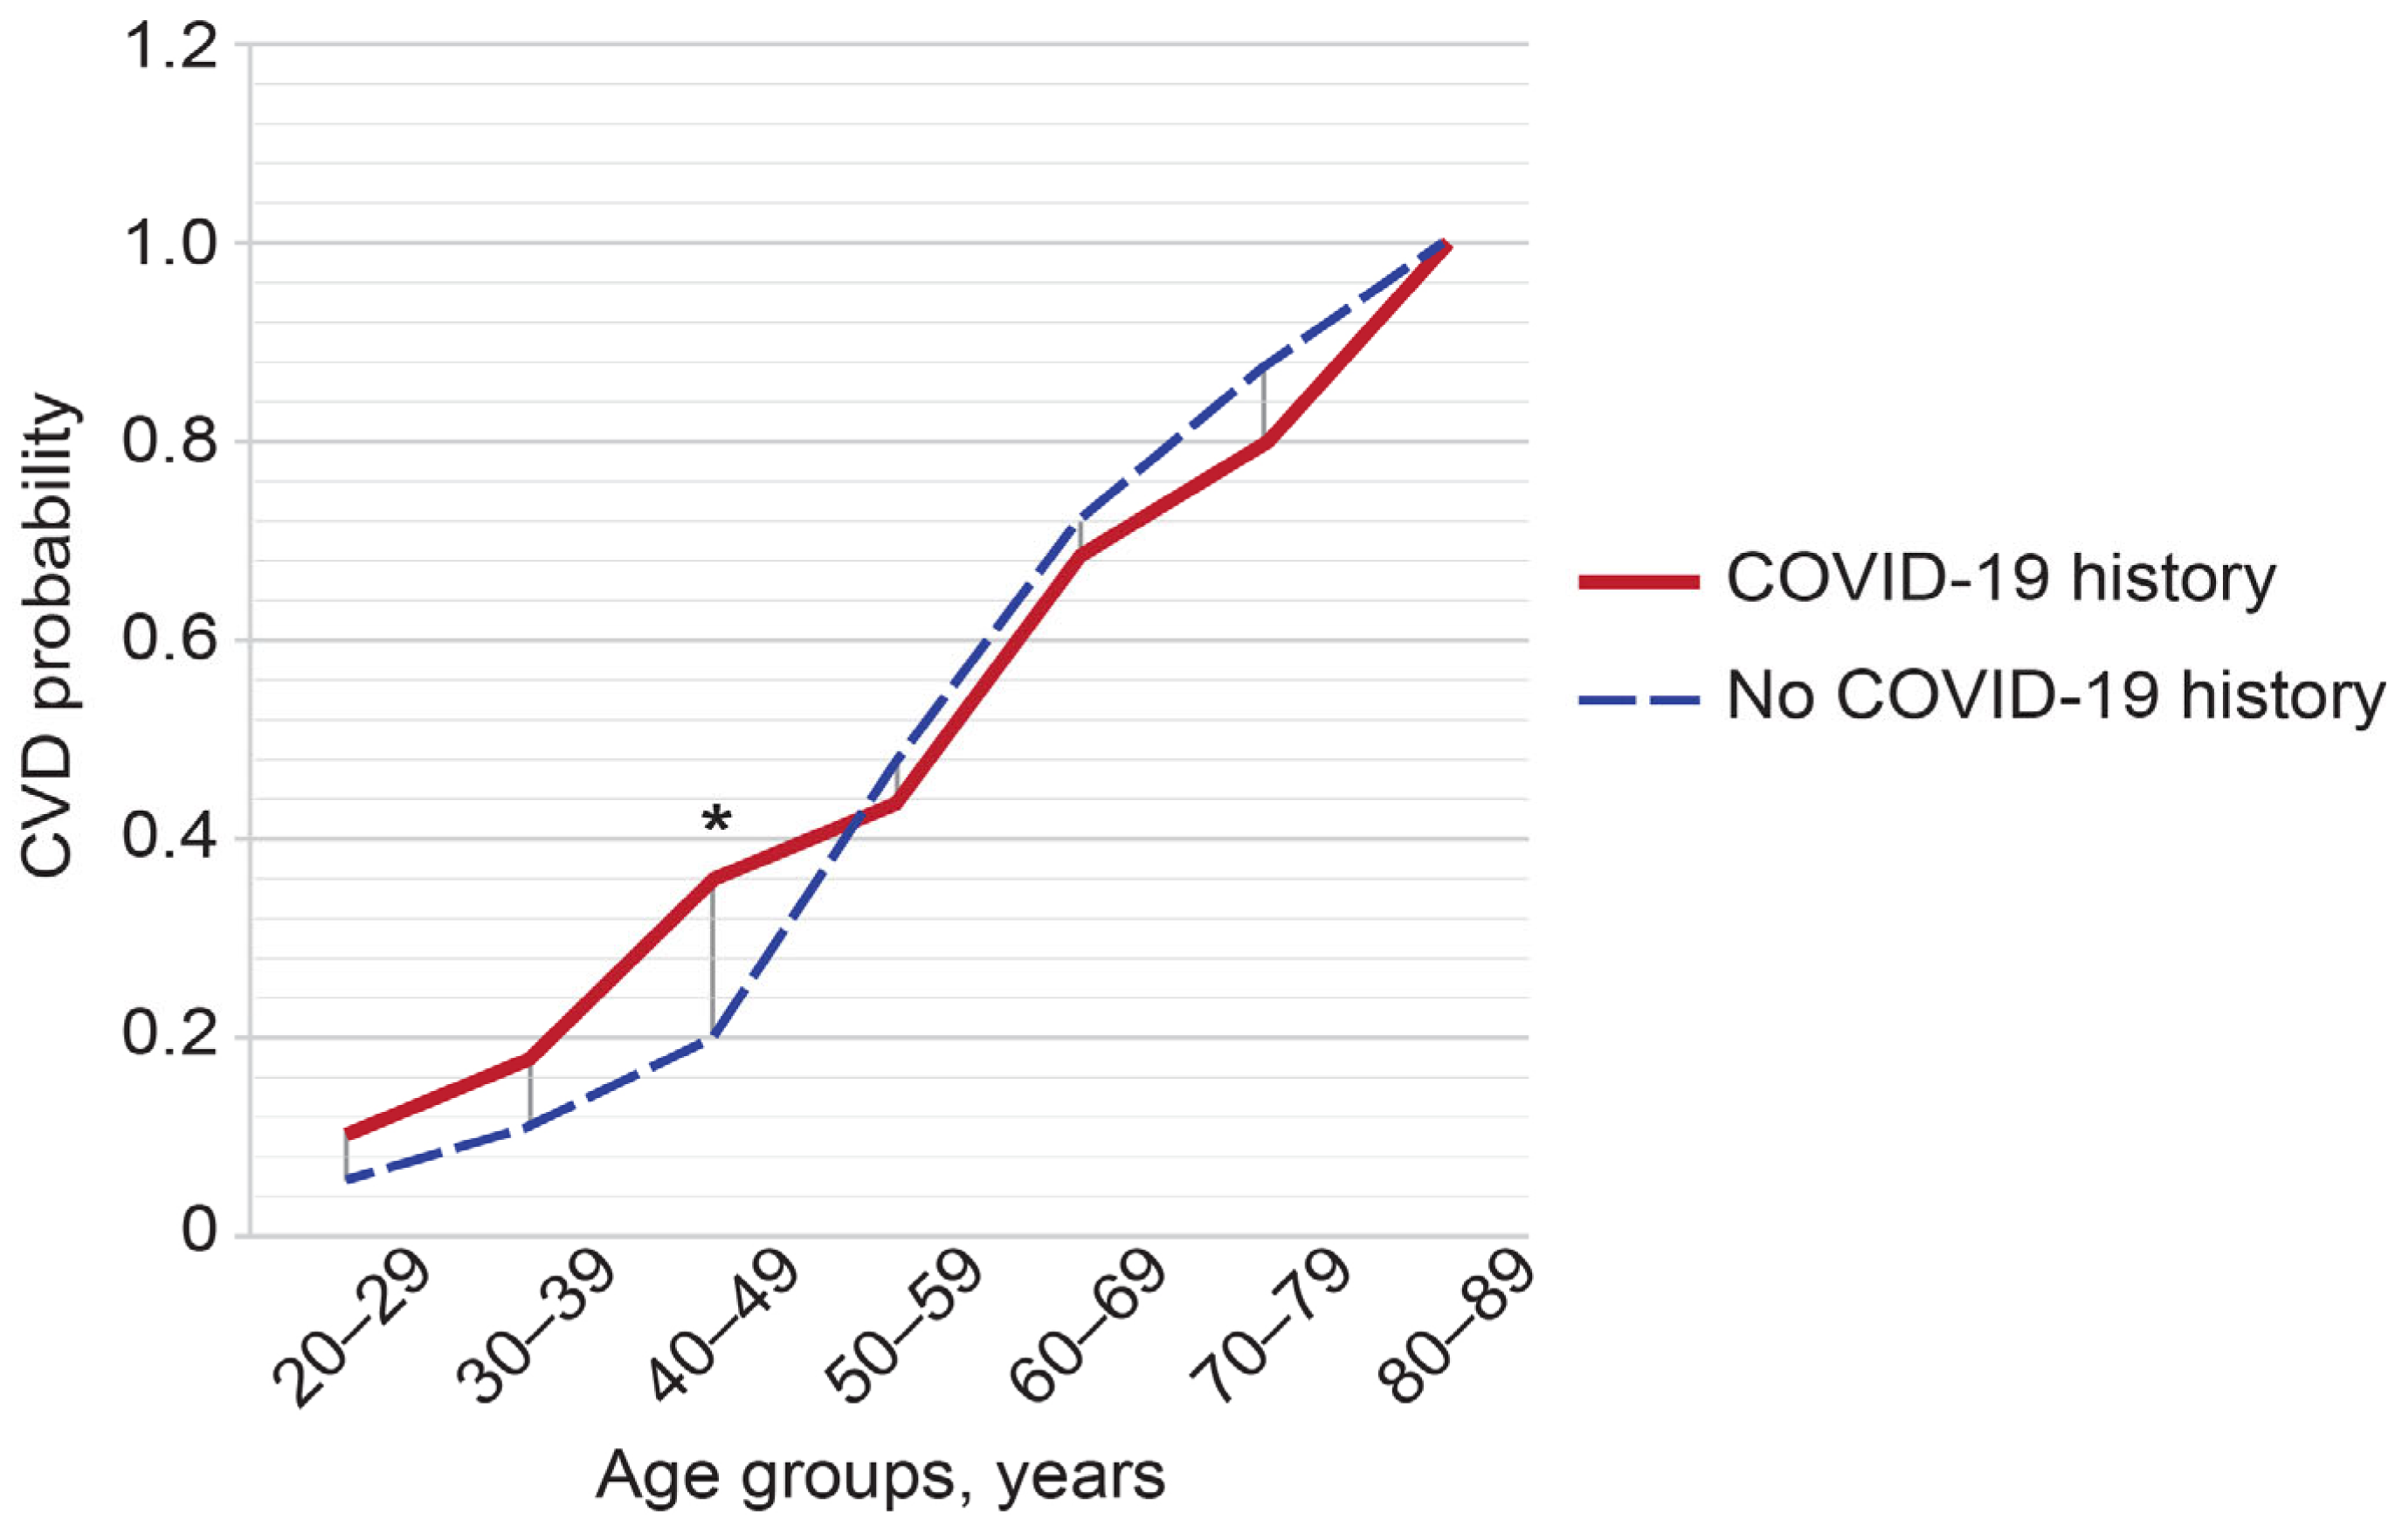
Figure 5.
Morbidity-dependent structure of probabilities for the main imaging modalities administered for the past two years prior to the survey. The rates were calculated per person for the past two years prior to the survey. Scale shows calculated probabilities of choosing the corresponding answers. B — chronic viral infections (HBV, HCV, and HIV), C — oncology disease, E — endocrine disorders, unspecified, E-DM — diabetes mellitus, F — mental, behavioral and neurodevelopmental disorders, G — diseases of the nervous system, H — diseases of eye and adnexa, ear and mastoid process, I — cardiovascular and ischemic diseases, J — diseases of the respiratory system, K — diseases of the digestive system, M — musculoskeletal, rheumatic, and autoimmune disorders, N — diseases of the genitourinary system, Z — healthy, CT — computed tomography, MRI — magnetic resonance imaging.
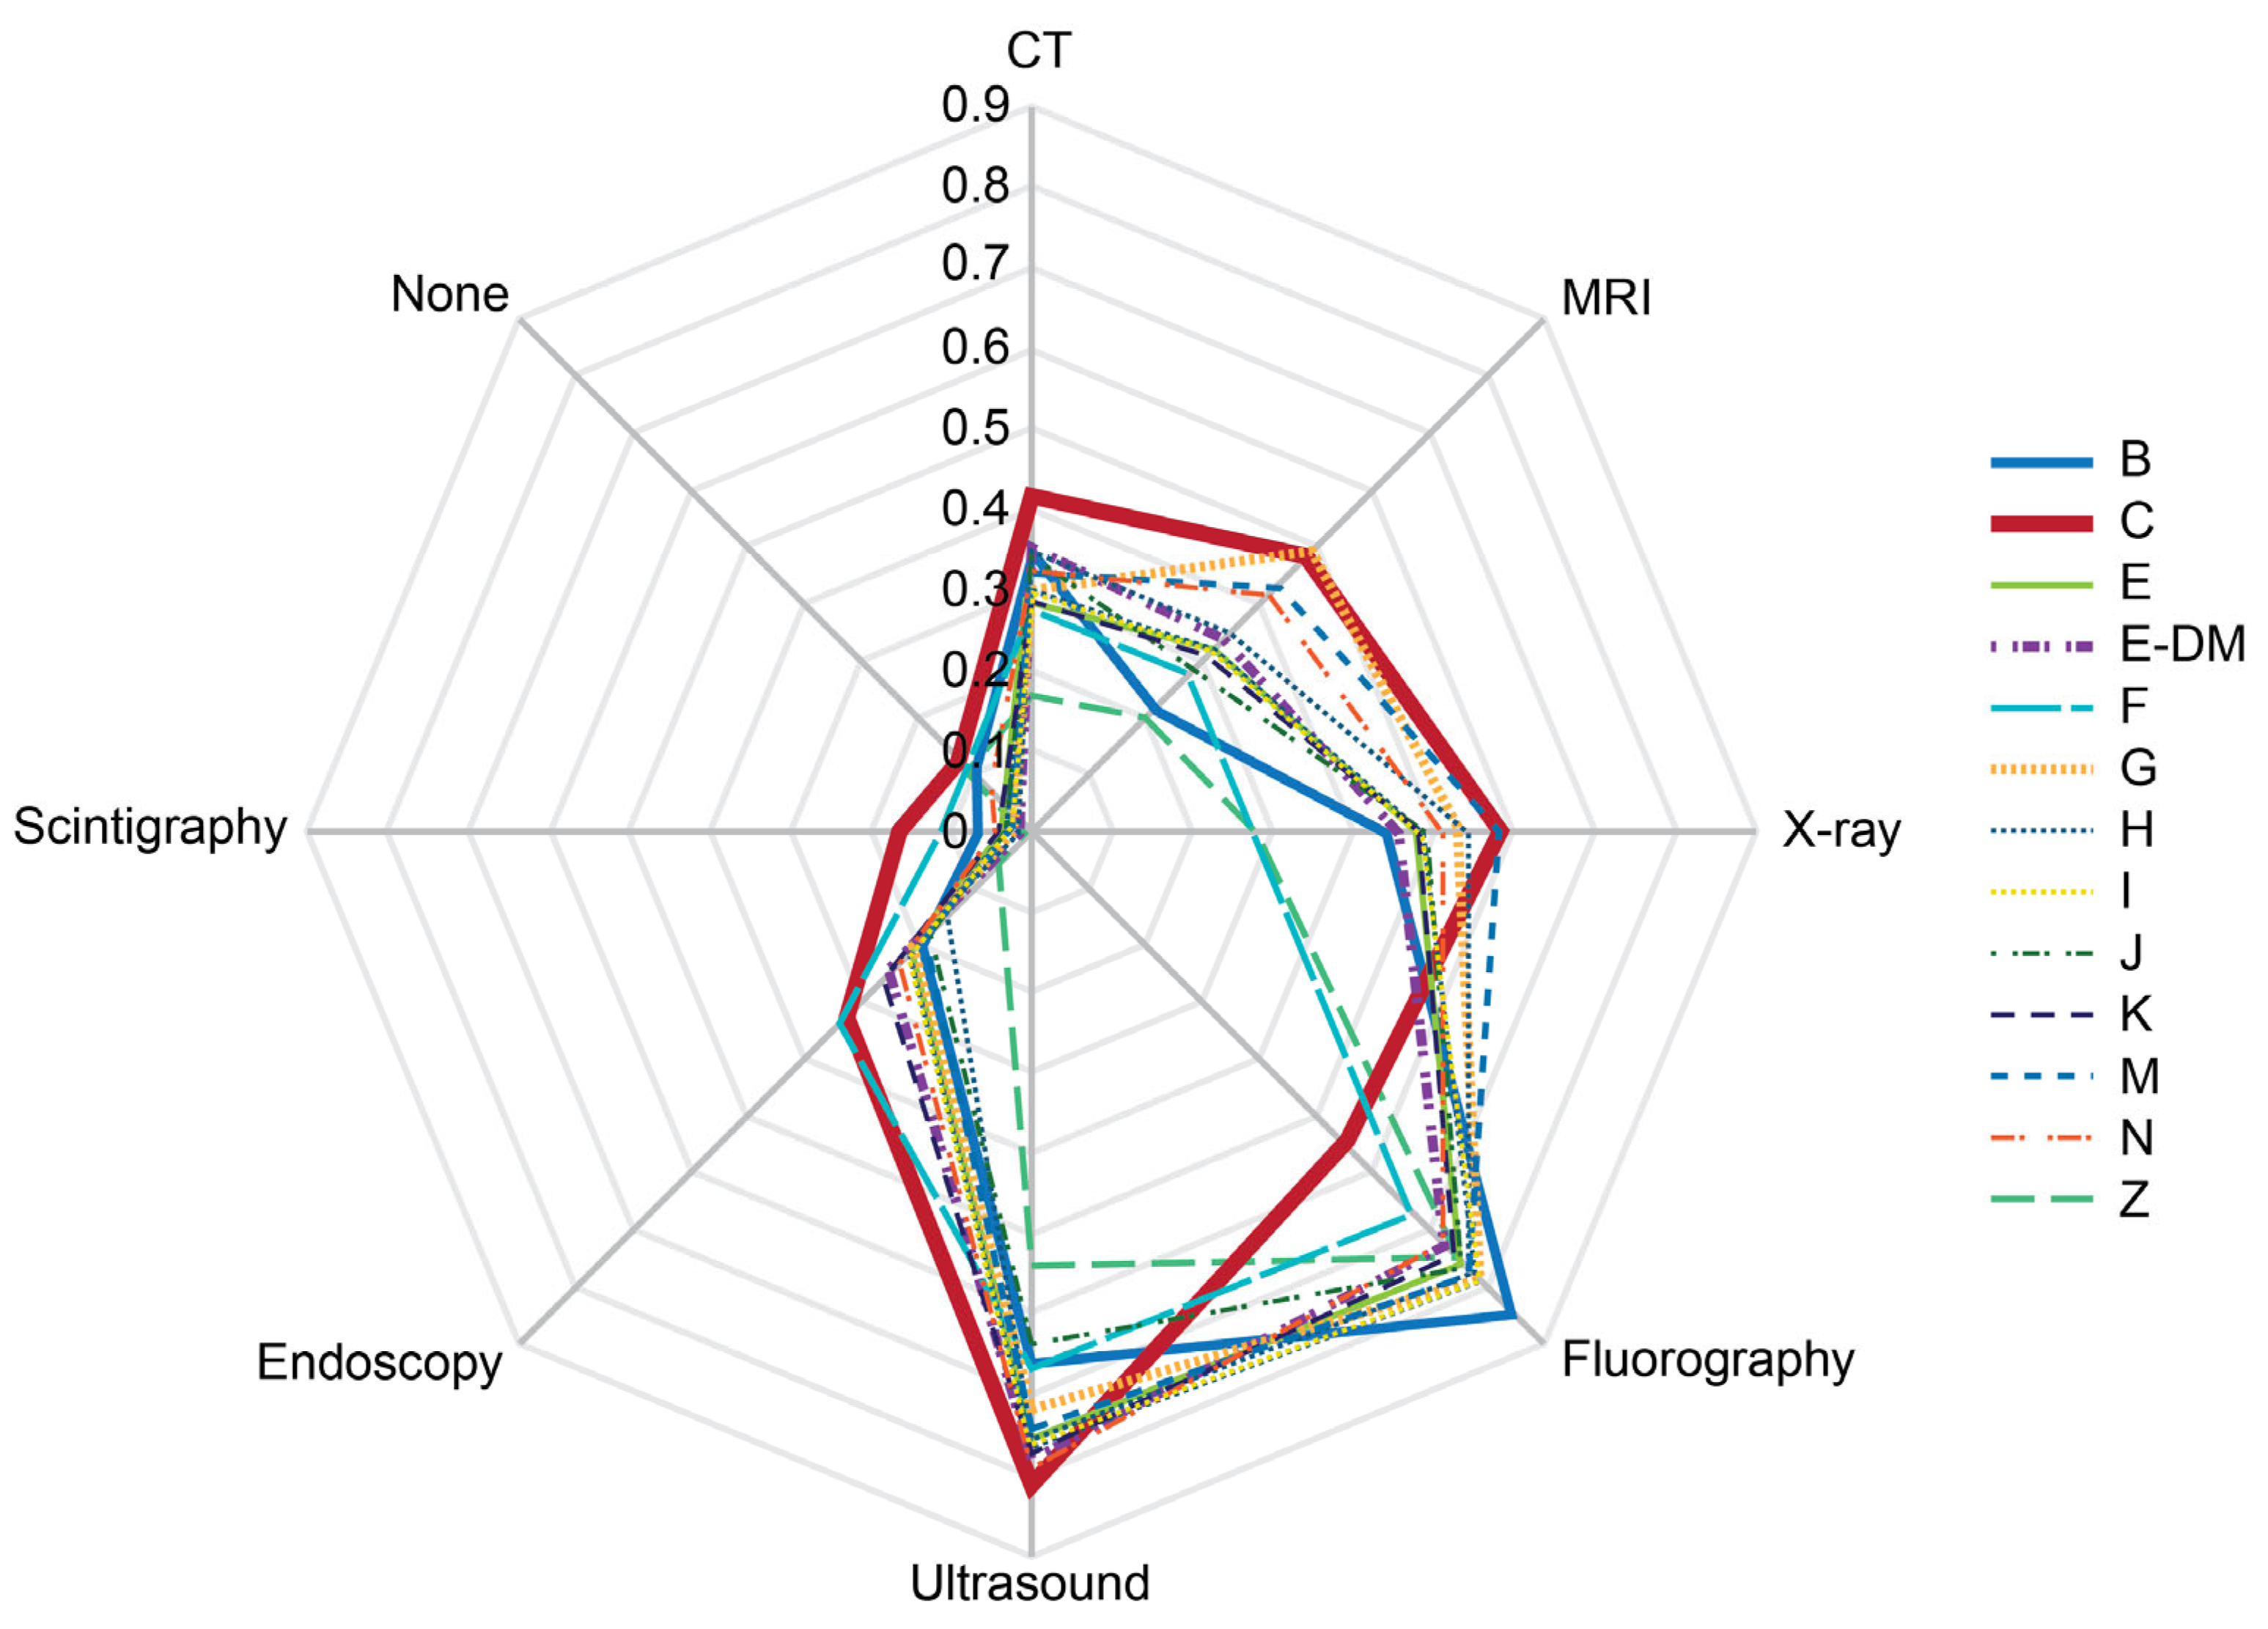
Figure 6.
Probabilities of imaging modality administrations depending on history of confirmed COVID-19 in the presence or absence of cardiovascular diseases. The rates were calculated per person for the past two years prior to the survey. Scale shows calculated probabilities of choosing the corresponding answers. CVD — cardiovascular diseases, COVID — history of coronavirus disease 2019.
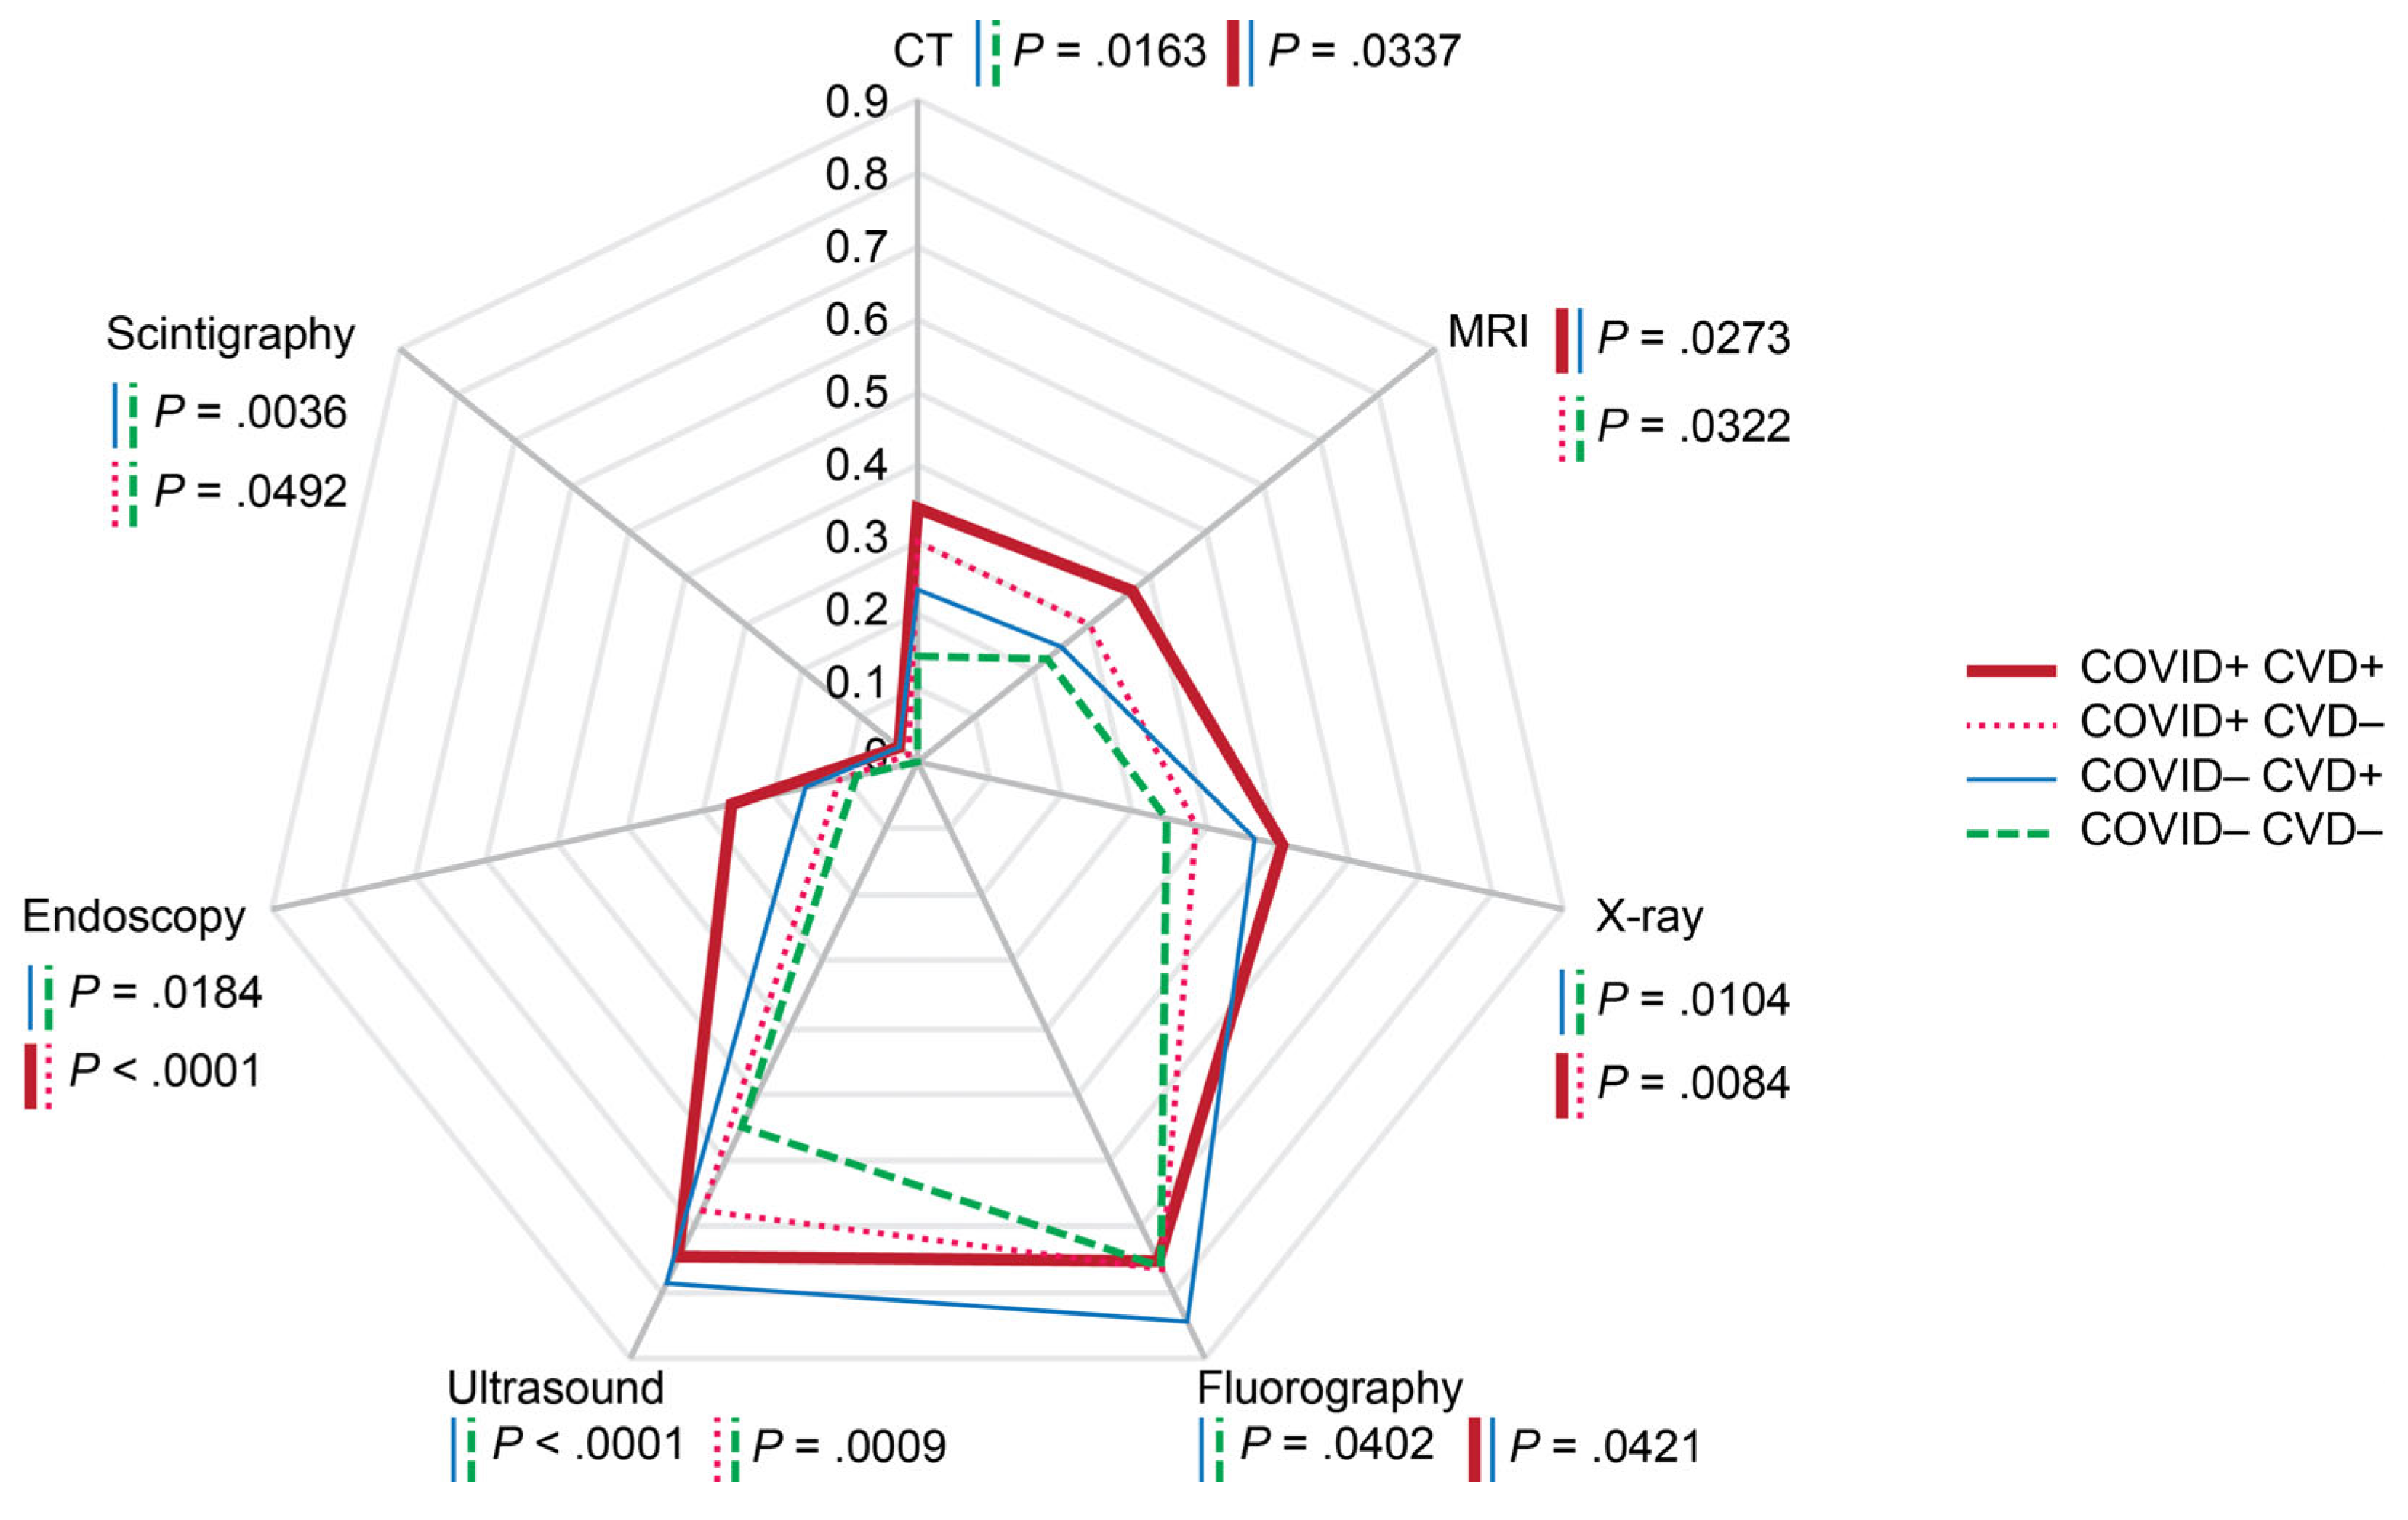
Figure 7.
Probabilities of imaging modality administrations depending on respondents' readiness to cover diagnostic imaging by personal payments. The rates were calculated per person for the past two years prior to the survey. Scale shows calculated probabilities of choosing the corresponding answers. CT — computed tomography, MRI — magnetic resonance imaging.
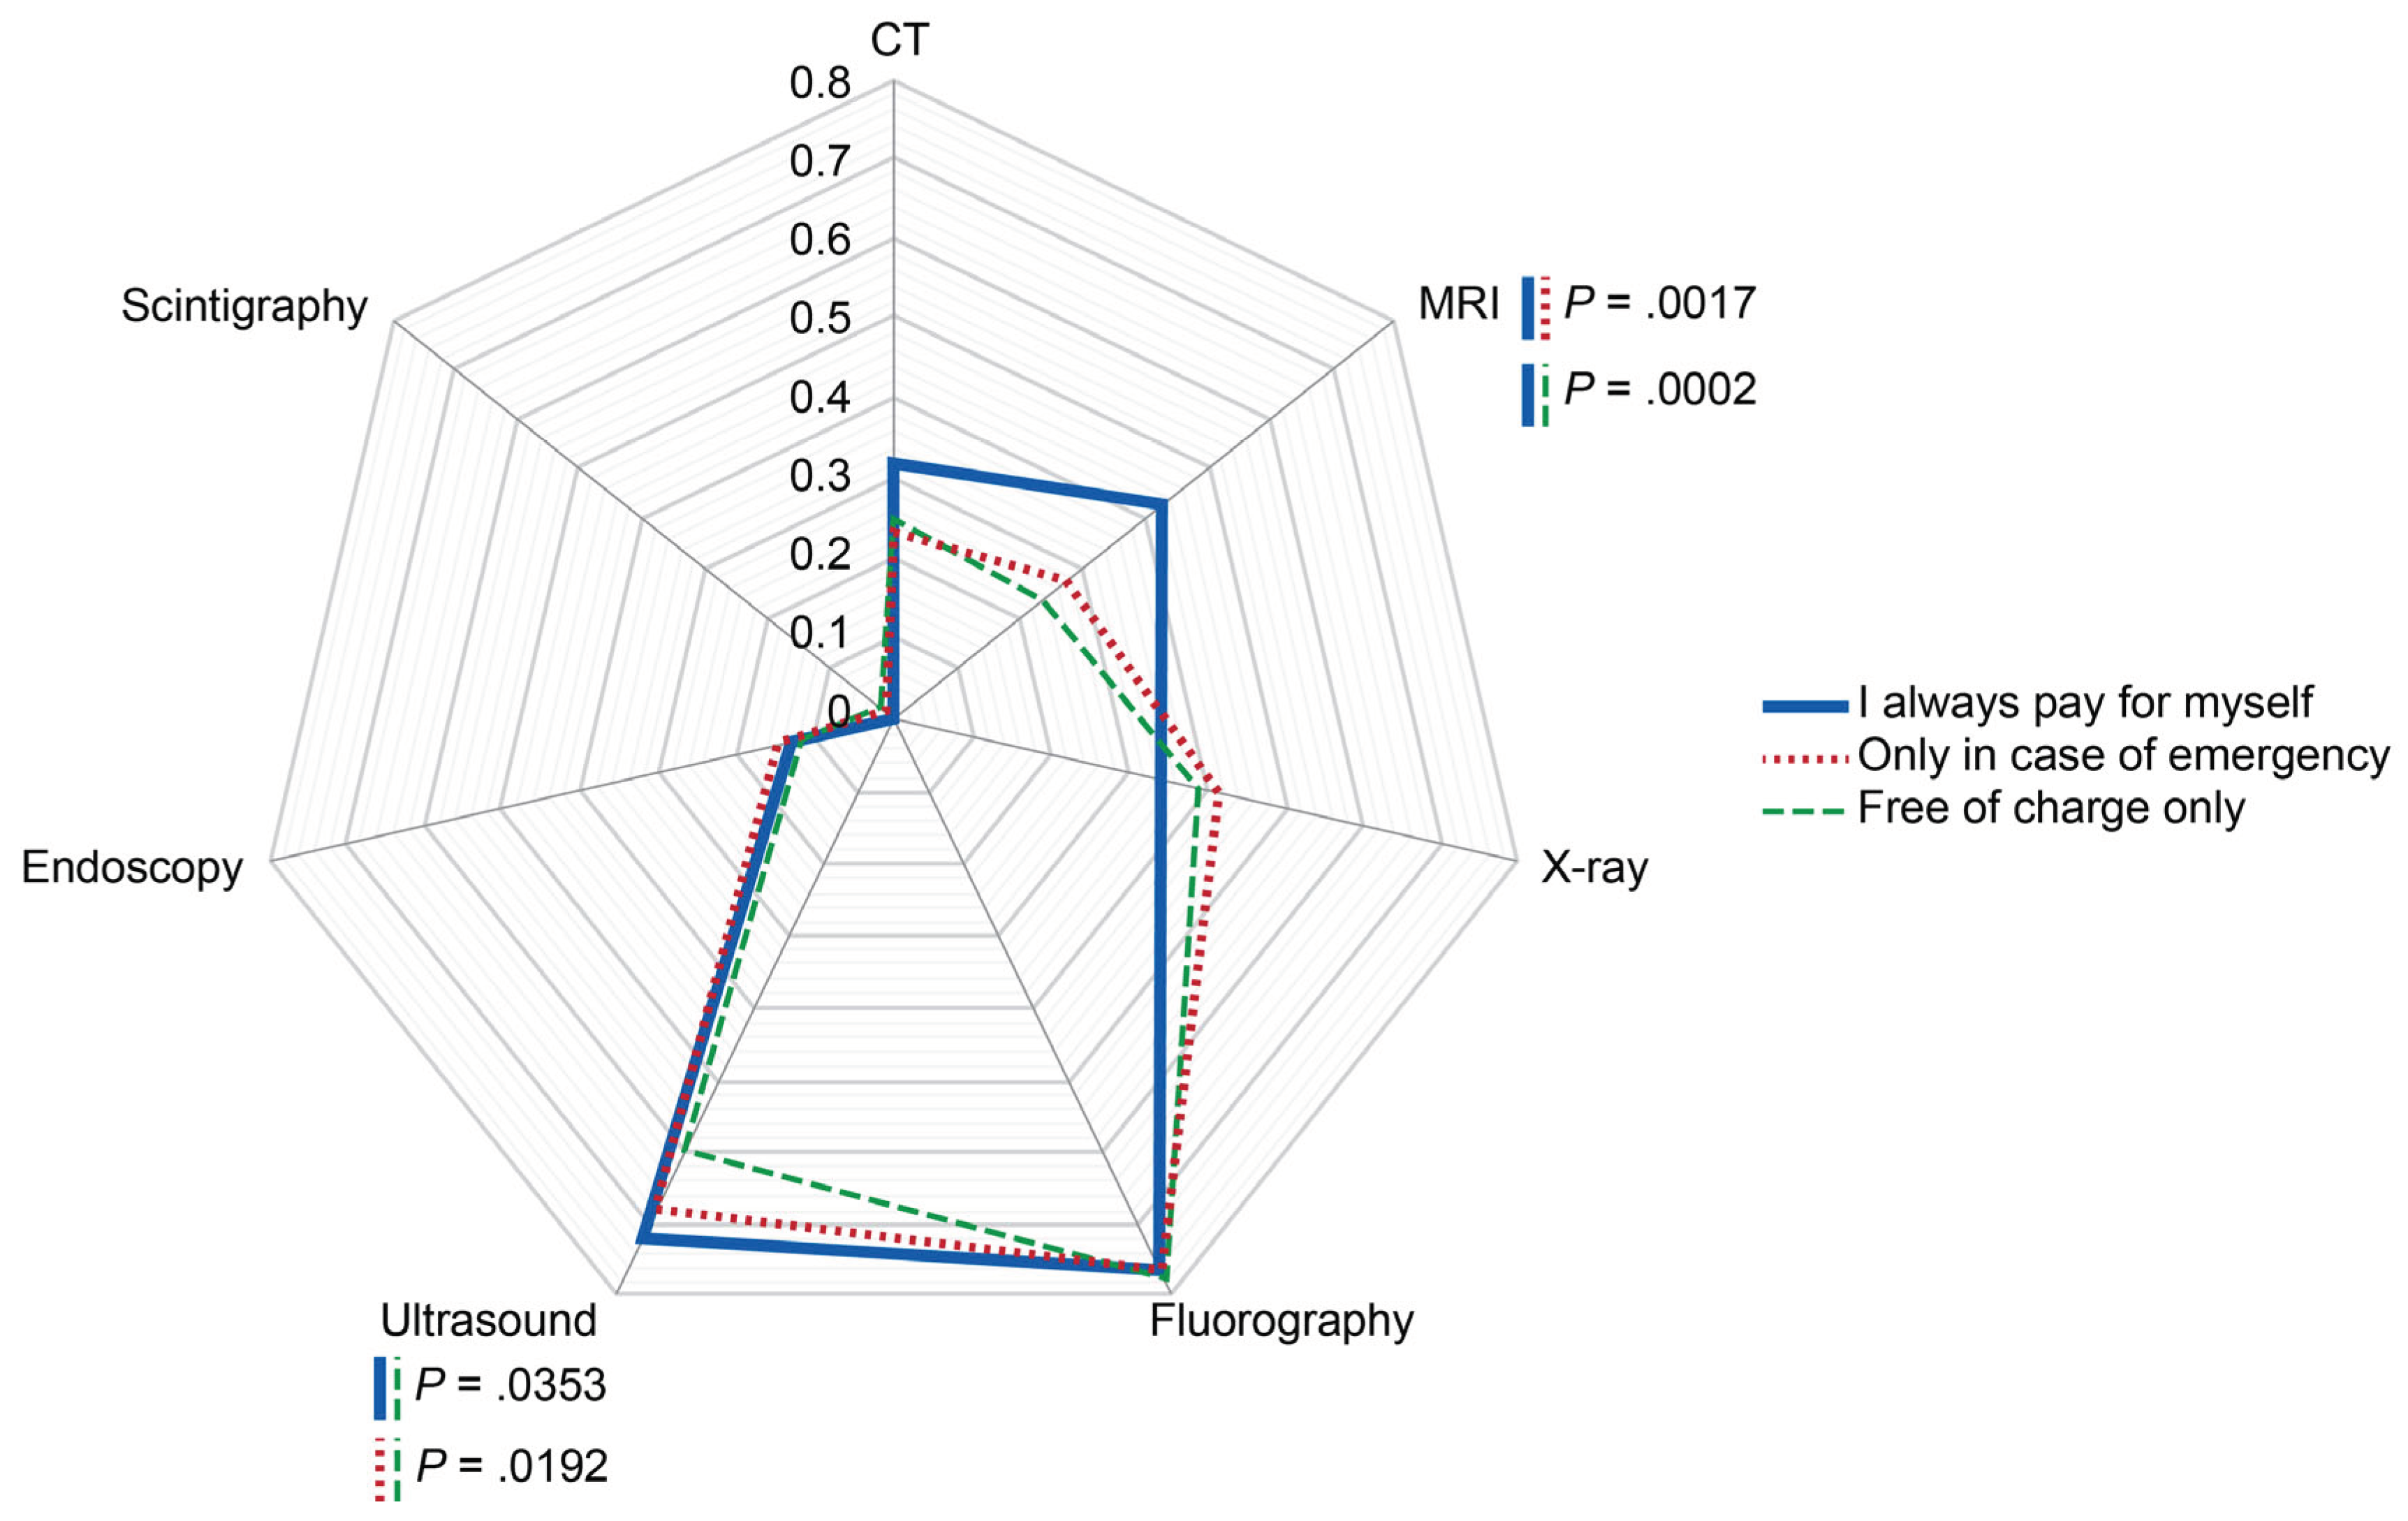
Figure 8.
Probabilities of imaging modality administrations depending on professional status of the respondents. The rates were calculated per person for the past two years prior to the survey. Scale shows calculated probabilities of choosing the corresponding answers. CT — computed tomography, MRI — magnetic resonance imaging.
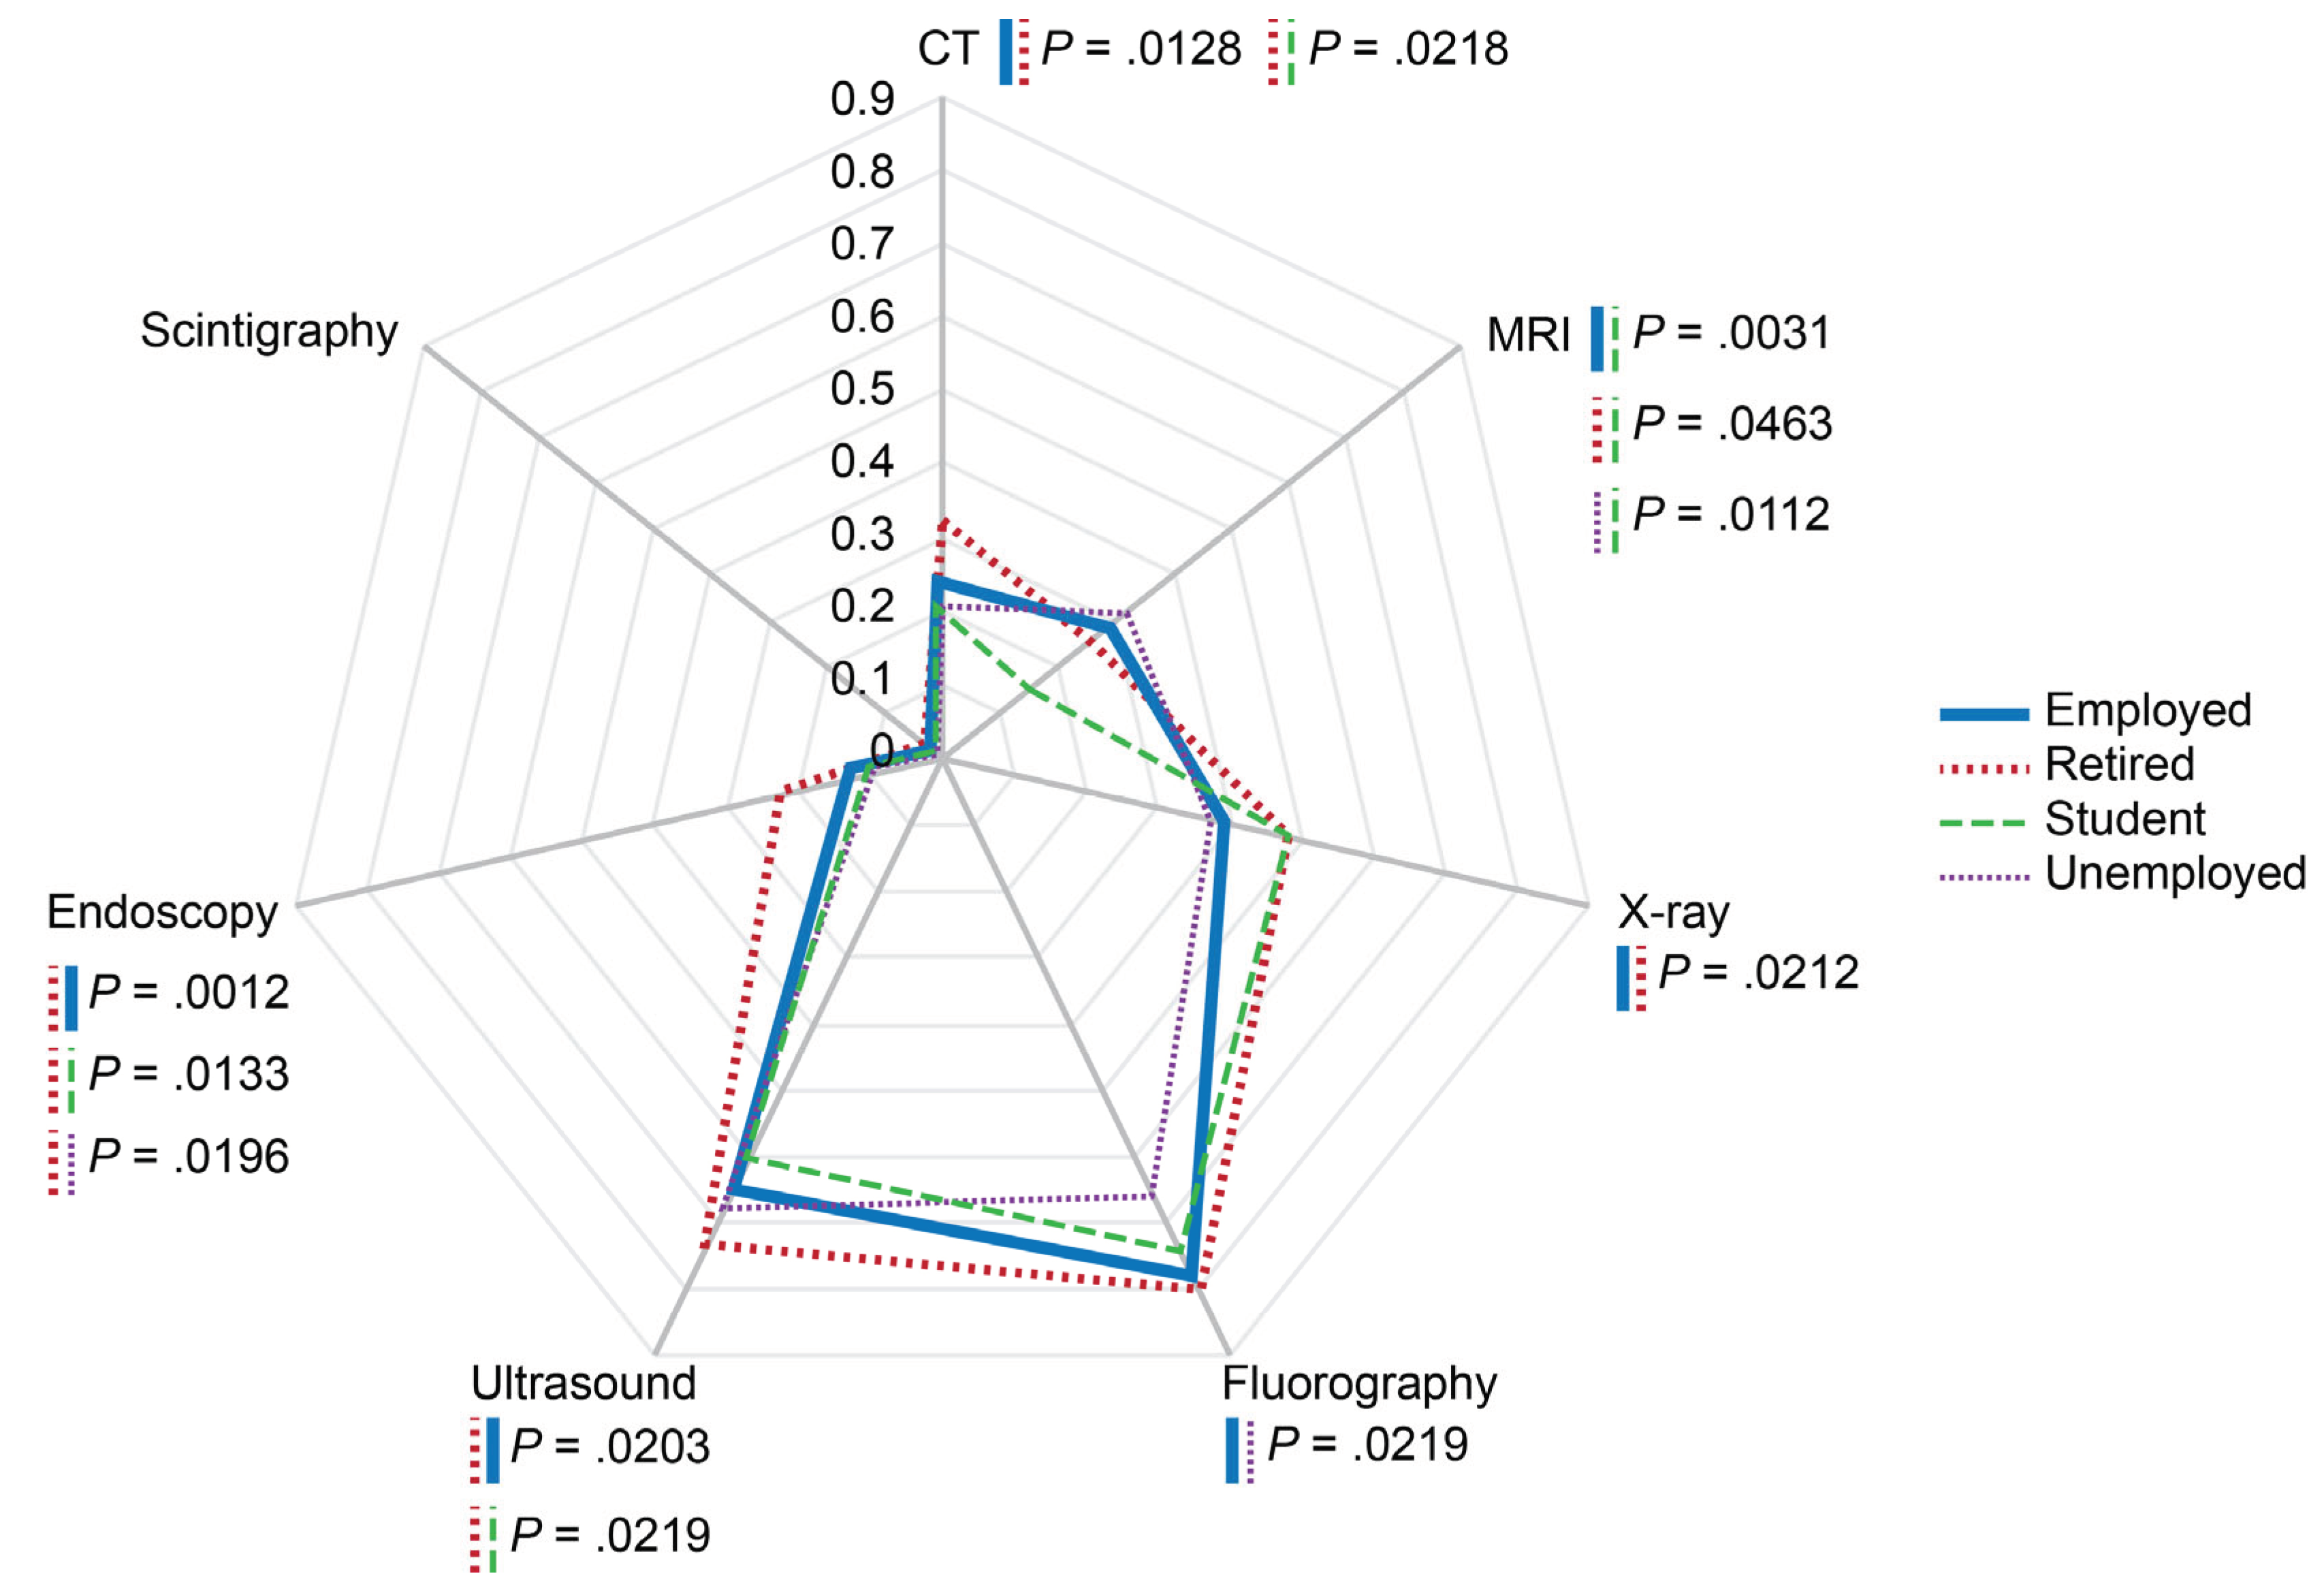
Figure 9.
Probabilities of imaging modality administrations depending on perceived superiority of chosen diagnostic modality. The rates were calculated per person for the past two years prior to the survey. Scale shows calculated probabilities of choosing the corresponding answers. CT — computed tomography, MRI —magnetic resonance imaging.
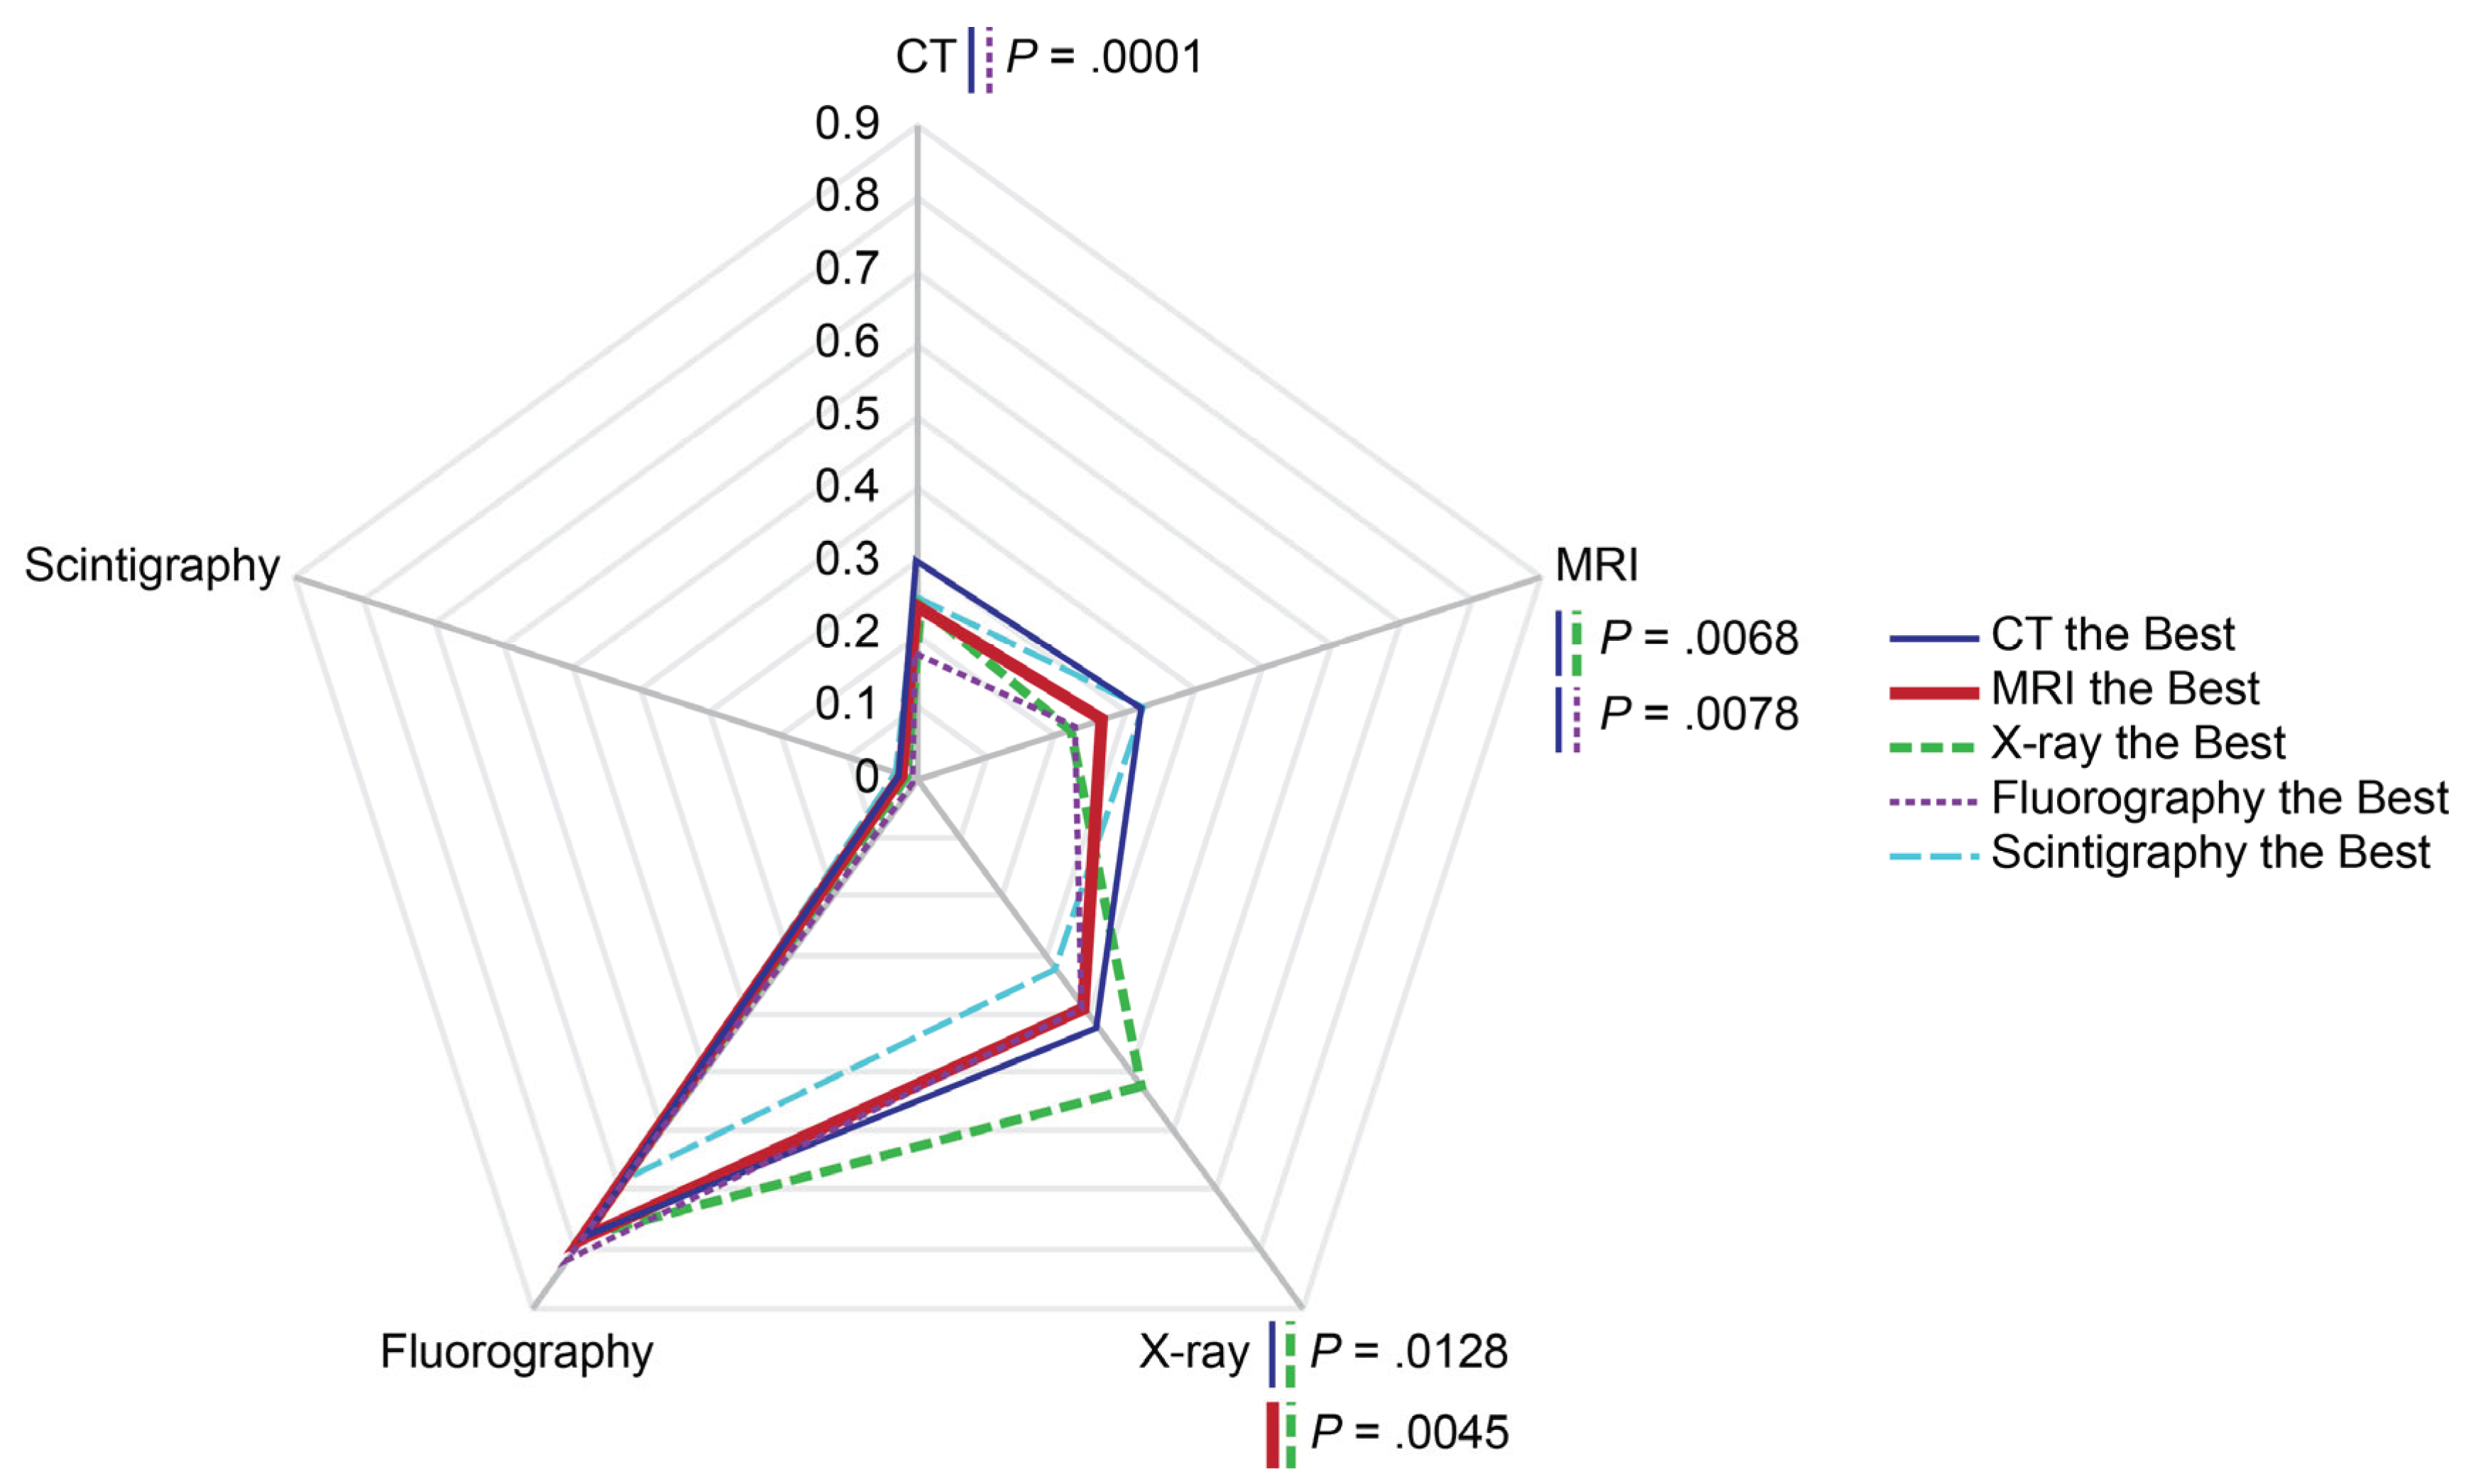
Figure 10.
Probabilities of perceived diagnostic superiority of modalities in diagnosing COVID-19-associated pneumonia depending on settlement type and history of past technogenic radioactive events in the area. The rates were calculated per person for the past two years prior to the survey. Scale shows calculated probabilities of choosing the corresponding answers. CT — computed tomography, MRI —magnetic resonance imaging.
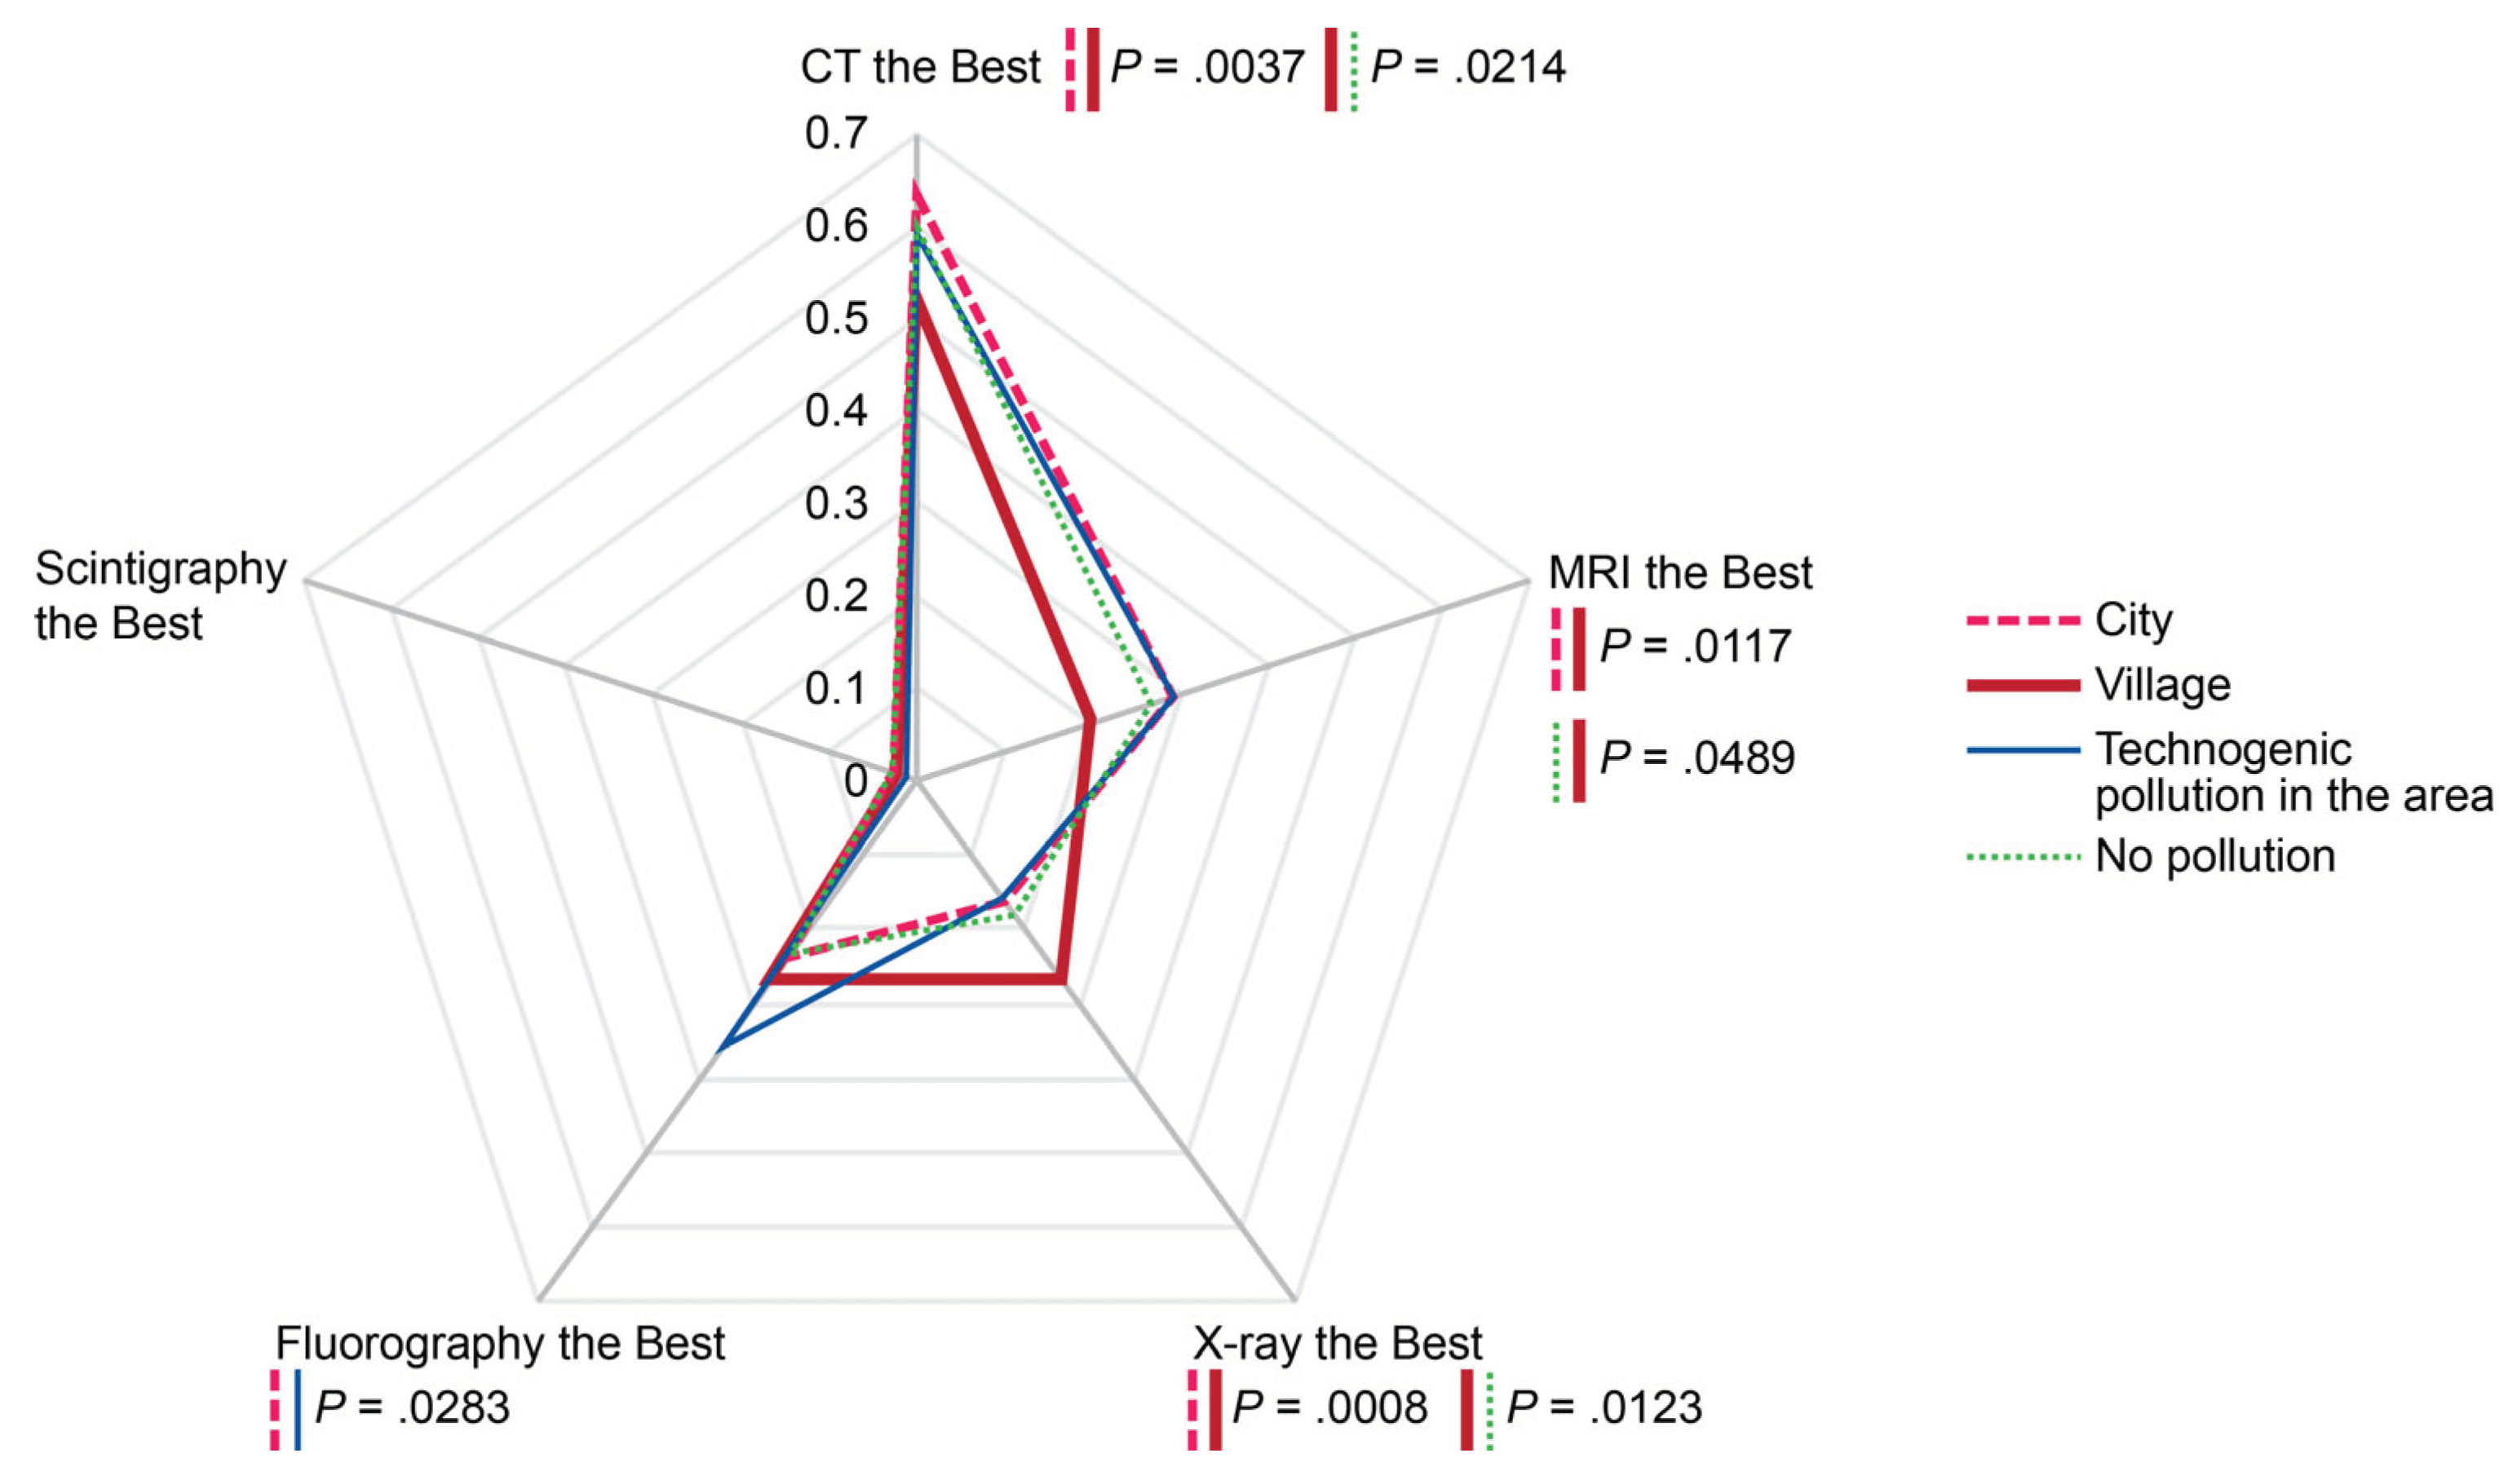
Figure 11.
Probabilities of imaging modality administrations (per person for the past two years prior to the survey) depending on local history of technogenic events and settlement type. The rates were calculated per person for the past two years prior to the survey. Scale shows calculated probabilities of choosing the corresponding answers. CT — computed tomography, MRI —magnetic resonance imaging.
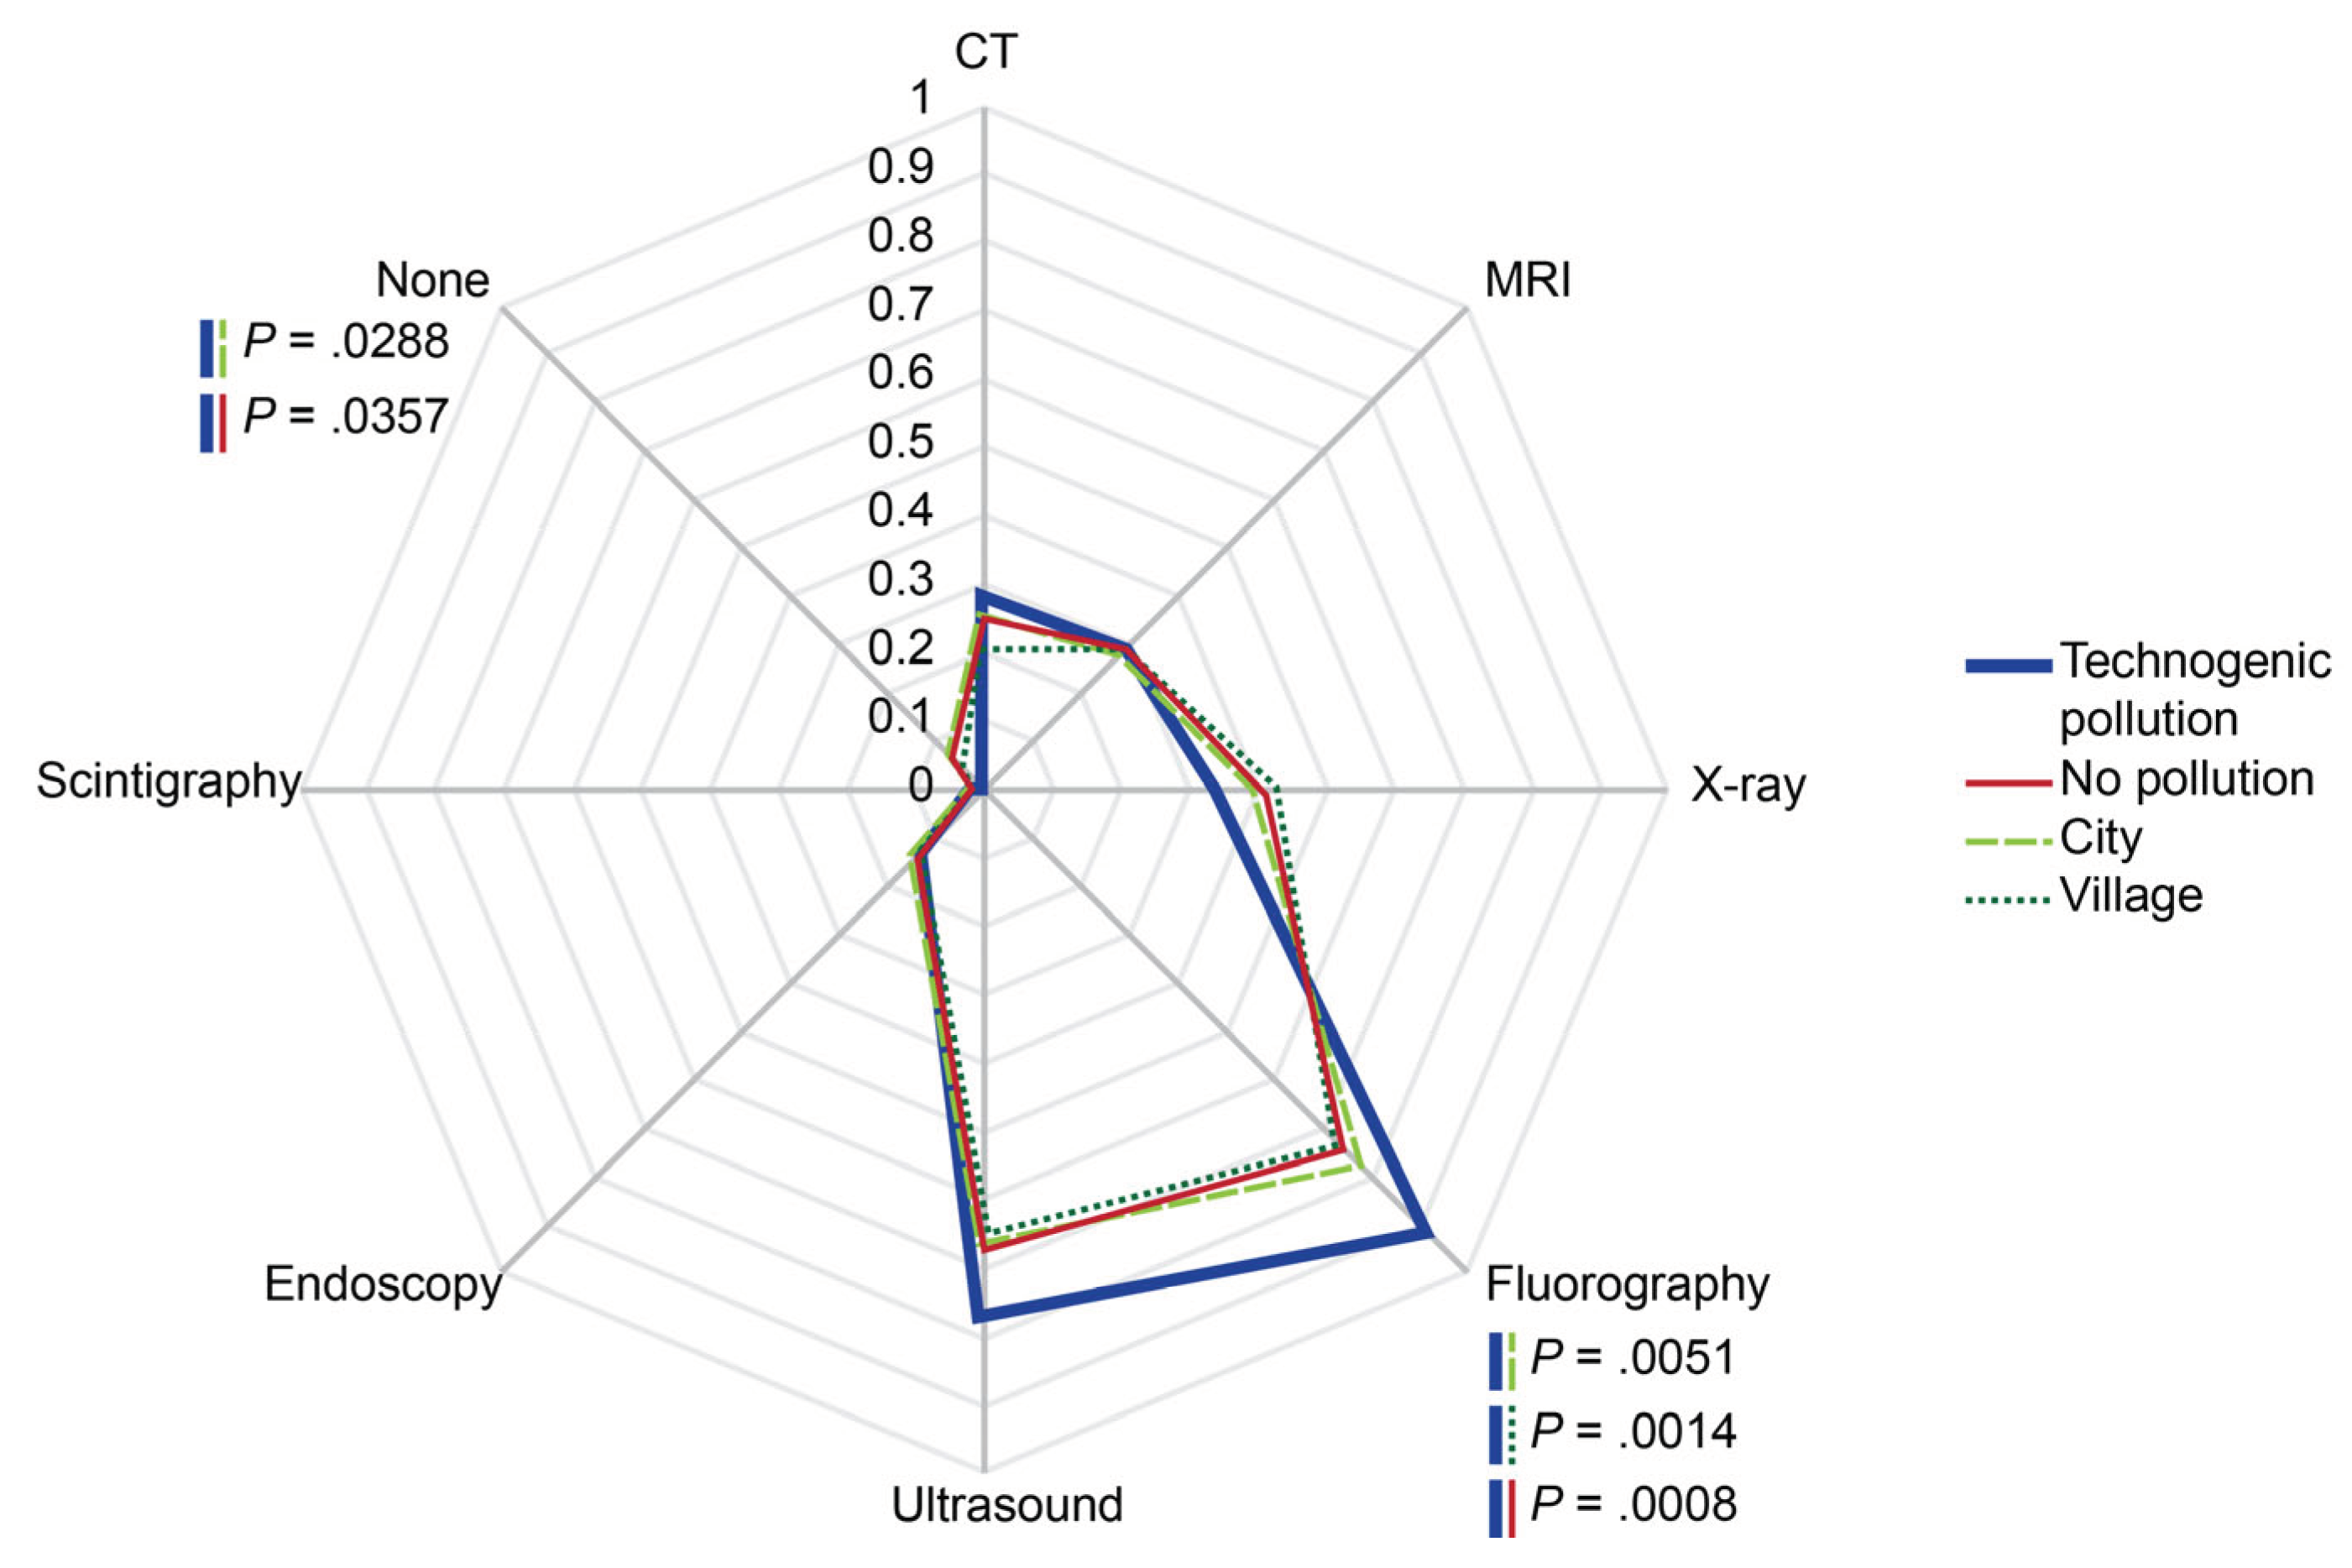
Figure 12.
Probabilities of CT and MRI availability as reported by respondents residing in the urban and rural areas, respectively. The rates were calculated per person for the past two years prior to the survey. Scale shows calculated probabilities of choosing the corresponding answers. CHI — compulsory health insurance, CT — computed tomography, MRI —magnetic resonance imaging.
Disclaimer/Publisher’s Note: The statements, opinions and data contained in all publications are solely those of the individual author(s) and contributor(s) and not of MDPI and/or the editor(s). MDPI and/or the editor(s) disclaim responsibility for any injury to people or property resulting from any ideas, methods, instructions or products referred to in the content. |
© 2024 by the authors. Licensee MDPI, Basel, Switzerland. This article is an open access article distributed under the terms and conditions of the Creative Commons Attribution (CC BY) license (http://creativecommons.org/licenses/by/4.0/).
Copyright: This open access article is published under a Creative Commons CC BY 4.0 license, which permit the free download, distribution, and reuse, provided that the author and preprint are cited in any reuse.


