Submitted:
01 April 2024
Posted:
02 April 2024
You are already at the latest version
Abstract
The Indian Himalayan Region (IHR), due to its topography, geography, and active
tectonics, a rough mountain zone, is among the most vulnerable zones to the landslip
danger. The most cutting-edge and accurate ways for creating a landslip susceptibility
model (LSM) are advanced statistical techniques. The goal of the current work was to
use advanced statistical techniques to analyse and evaluate the updated landslip
susceptibility for East District in the NE Himalayas of Sikkim, India. The spatiotemporal
landslip inventory for the years are produced using literature surveys, historical
satellite imageries and on-site observations. Slope, aspect, elevation, curvature, plane
curvature, profile curvature, topographic wetness index (TWI), lithology, distance to
faults, distance to streams, distance to roads, normalised difference vegetation index
(NDVI), rainfall, drainage density and land use/ land cover (LULC) are some of the
topographic, environmental, geologic, and anthropogenic factors that were included in
the spatial database. These LCFs were chosen to study the area's periodic landslip
vulnerability. An inventory of 151 landslides from historical published records, field
visits and Imagery interpretations, respectively, were used in the experimental design.
Information Value Model (IVM), was used to evaluate the vulnerability to landslides as
determined by fifteen LCFs. The goal of the study is to reduce the number of fatalities
and possible economic harm caused by the region's frequent slope instabilities. It is
expected that the application of statistical algorithms would assist relevant authorities
and organisations in properly planning for and managing the region's landslip threat.
Keywords:
East Sikkim
; Landslide susceptibility
; Information Value Model
1. Introduction
The most significant geo-environmental risk that is seen in mountainous terrains across the world and poses a serious danger to infrastructure and human life is landslides (Sati et al.,2020). Landslides are one of the main risks brought on by natural events like earthquakes and rains, as well as human activities like road construction and urbanisation that may result in slope collapses (Svalova et al.,2019). Almost 9% of all natural disasters globally include landslides. Large-scale slope failures have been caused by recent big earthquakes that have occurred in China (1999,2008,2010 & 2013), Kashmir (2005), Sikkim (2011), Nepal (2015), New Zealand (2016), Japan (2018), etc. Numerous people were killed, injured, and infrastructure was damaged, particularly since the road networks were disrupted, as a result of these disastrous occurrences. 1.3% of fatalities of all natural disasters died through landslides, with Asia accounting for around 54% of these landslides (Froude et al.,2018).In recent years, landslides have accelerated in both wealthy and underdeveloped nations due to rapid urbanisation and development (Yawen & M., 2011). Many fatalities worldwide are caused by natural occurrences like earthquake-induced landslides (Gorum et al.,2011 & 2015, Kirschbaum et al., 2015; Petley et al.,2006; Sepúlveda et al., 2015). The majority of the landslides take place in regions with active tectonics, uneven topography, and high rates of precipitation. The geographic distribution and intensity of landslides are influenced by topographic features, lithology, geomorphology, land use, and land cover (Aydin et al.,2017). The Himalayan Mountain region's population and infrastructure are always under risk due to mass migrations (Hewitt et al.,2012). Due to the predominately mountainous topography of the NE Himalaya, landslip activity is seen as a severe issue that threatens both infrastructure and habitation. Thousands of landslides occurred in Indian Himalayan Region (IHR) and its adjoining areas as a result of the catastrophic 2005 & 2011 earthquake in Kashmir and Sikkim (Owen et al.,2008; Geoseismological Report, GSI,2011). Massive landslides, rock avalanches, and other slope collapses that occur often have caused severe casualties and significant infrastructure damage (Peiris et al.,2006; Owen et al.,2008; Basharat, 2012 & 2021).There have been many studies done in the past to identify the distribution of landslides, field data collecting techniques, inventory development, and geographic distribution analysis (Sato et al.,2007; Kamp et al.,2008; Owen et al.,2008; Basharat et al.,2014 & 2016) as well as to understand the mechanics, distribution, and evolution of earthquake-triggered landslides. The territory has been divided into several susceptible zones using the methodologies of landslip susceptibility, including knowledge-based, statistical, deterministic, probabilistic, and machine learning (ML) (Girma et al., 2015; Hamza et al.,2017 & Basharat et al.,2021). An efficient method for preventing and reducing landslides across a large territory is landslide susceptibility assessment. It is one of the most helpful informational resources for decision-makers and aids experts in lowering the danger to life and property. In recent years, a number of methods for assessing landslide susceptibility have been created, all of which are based on the idea that future mass movements may be predicted by looking at the relationship between previous landslides and the elements that influenced them (Guzzetti et al,2002; Chen et al.,2020). There are several ways to create a landslide susceptibility map (LSM) based on various formulations, but statistical approaches and machine learning are the most popular ones (Ikram et al.,2017; Sahin et al.,2020; Farooq et al.,2021; Polat,2021). For the detection, categorization, and evaluation of landslides, satellite remote sensing (RS) and geographic information systems (GIS) are extensively used. Recent years have seen an increase in the use of freely available moderate resolution satellite data, such as that from Sentinels and Landsat 8. Landslides in the area have previously been accurately identified using LISS Imageries of high resolutions (Martha et al.,2010). The aid of data on topography and environmental characteristics has posed a boon to data- and knowledge-driven statistical models, which have dominated the LSM field recently (Guzzetti et al., 2012). Numerous statistical techniques for LSM have been anticipated and effectively used to aid in the analysis of landslip distribution patterns and the processes that create them as a result of recent advancements in geospatial technology (Merghadi et al.,2020). LSM are quickly converting from statistical and knowledge-driven learning to advanced statistical approaches with more precision and accuracy. LSM has been employed to handle the global mapping of landslip risk because of its magnificence. Around the world, landslip mapping has been done in a variety of ways, but they all have the same objectives. Numerous models and approaches are now being proposed at both the local and regional levels to predict the spatial distribution of landslides. While optimum LSM is of growing interest to land geoscientists, many of them are concentrating on a statistical and knowledge-based model for landslip predictions, such as (Ahmed et al.,2021; Kamp et al.,2008; Riaz et al.,2018). Recently, researchers are working upon advanced statistical models due to their usefulness and excellent accuracy. The precision of traditional statistical techniques for LSM make them successful. The most efficient statistical techniques are considered to be Information Value Model (IVM), Statistical index (SI), frequency ratio (FR) and certainty factor (CF). The effectiveness of each of the landslide causative factors on the incidence of landslides is assessed using these methodologies, which are commonly used data-driven approaches. In order to reduce the probability of landslides occurring, it is helpful to examine regionally scaled landslide risks and their numerous affecting factors. Thousands of landslides occurred in Eastern Himalayas as a result of the anthropogenic and tectonic factors. Numerous studies have been done in different parts of Indian Himalayan Region (IHR) and the areas surrounding it that were damaged by the tectonic causes in order to characterize landslides and determine their vulnerability (Kumar et al.,2006). The objective of the current work is to analyse the spatio-temporal LSM using advanced statistical techniques that are more reliable and stable. The aim of this study is to apply cutting-edge advanced statistical methods to forecast the spatiotemporal vulnerability of landslides. In the district of East Sikkim, NE Himalayas of India, the current study's particular goal is to construct and access landslip susceptibility models about their impacting cause utilising temporal data from historical records, field visits and satellite Imageries. Further evaluation of the sensitivity and risk maps for landslip mitigation and the use of disaster reduction methods in the area might be done using susceptibility maps.
2. Study Area
The study area geographically lies in the NE Himalayas of India, which covers an area of 964 square kilometres with a population of 0.16 million situated. In the East District, 679 square kilometres, or 71.17 percent of the district's total land area (964 square kilometres), are covered by forests. Of the overall geographic area, very dense forest takes up 162 square km, dense forest takes up 396 square km, and open forest takes up 121 square km. Hill, valley, and slope are the three main physiographic units. Teesta, Rangpo Chhu, and Dik Chhu are the three main drainage systems in the East District. Elevation range from 246 m to 4625 m (Figure 1). Mean average temperatures ranges between 22℃ to 36℃ in summer, while minus 04℃ to 07℃ in winter, with annual precipitation of 100–900 mm (Source : IMD data) (Figure 2). The lithostatic units in the area are Kanchenjunga gneiss, Darjeeling gneiss, Chungthang schists and gneiss, Lingtse granite gneiss, and the Daling group of rocks, which includes phyllite, slates, quartzites, and schist of Pre-Cambrian age, are the five geological units found in the district (Source : GSI Report, 2020) . Alluvium quaternary deposits periodically form along streams and rivers. Numerous fractures, faults, joints, folds, and other structural anomalies have formed in the rocks found in the district as a result of various structural disturbances. Geological formations in the area show prominent lineaments that run in the N-S, E-W, NE-SW, ENE-WSW, and NW-SE directions.
3. Materials and Methods
3.1. Data Collection
The data sources used to create the landslip inventory and LCFs are shown in Table 1. Using LISS IV Sensor (Resourcesat Satellite) Images, Google Earth Images, Toposheets and field investigations based on the criterion of loss of vegetation and disruptions in forest canopy, the landslides in the research region were interpreted and mapped. Using supervised classification in Exelis ENVI version 5.3, a land-use/land-cover map was created using LISS IV satellite images.
The National Remote Sensing Centre (NRSC) provided the temporal images of Resourcesat Satellite LISS IV (5.8 m resolution) with a cloud cover of 2.10%. To extract the topographic variables for the research region, a 5.8 m resolution, digital elevation model (DEM) based on LISS IV was employed. To determine the lithological and tectonic properties of the region, geological maps obtained from the Geological Survey of India (GSI) were used. Using a handheld Global Positioning System (GPS) and GLONASS receiver with a field survey precision of 5 metres (m), the landslip inventory was cross-verified. In the field, landslides' physical qualities and feature such as length and slope angle are measured using laser distance. ArcGIS 10.8 (Esri Inc.) was used to map, digitise, and analyse the data that was collected from various sources. Figure 3 depicts the methodological flow chart used to accomplish the study's predetermined goal.
3.2. Landslide Inventory
The use of a sustainable landslip inventory requires precise, high-quality data from a geospatial record in conjunction with a reconnaissance survey based on fieldwork (Figure 4 a,b,c,d,e,f,g &h). A crucial step in comprehending and analysing the comparison between a landslip and the governing variables that determine landslip susceptibility and hazard mapping is the identification and development of landslip inventory (Galli et al.,2008; Chen et al.,2017). By mapping with on-site visits, remote sensing methods, and examining temporal satellite pictures, the temporal landslides were updated.
In order to interpret and update the landslide inventories in the study area, remote sensing data from Google Earth and RESOURCESAT satellite imageries from 2010, 2015 and 2020 were used. These data are very useful in identifying those landslides present in the hilly or mountainous areas that are not accessible through the field survey. For the purpose of recognising mass migration, the destruction of natural vegetation is employed as a fundamental criterion.
Following landslide detection using RESOURCESAT, temporal landslide inventory of several years were created, encompassing 151 landslides that covered 9.939 km2 respectively (Figure 5 a & b). To create the IVM models, samples from the 2010, 2015, and 2020 inventories of landslides and non-landslides were used. Each landslip inventory is randomly split into two groups (training and testing) based on the percentage of samples, with a ratio of 70%:30%.
Each year's inventory contains 70% samples of landslides and non-landslides that are used as training samples, while the remaining 30% are samples that are used for testing. This method yields the best results since the non-landsliding area is chosen on a low-angled slope area where the likelihood of landsliding is extremely low. After preparing the datasets, LSMs were created using the weighted overlay tool pack in Arc GIS 10.8.
3.3. Landslide Causative Factors
Numerous LCFs, such as topographical, geological, environmental, and anthropogenic factors, interact to affect slope failure (Costanzo et al.,2012; Dou et al.,2019). The likelihood of a mass movement was assessed by the link between landslip activity and influencing factors. There are fifteen LCFs in this study, including NDVI, landuse/land cover, slope gradient, aspect, elevation, curvature, profile curvature, plan curvature, Rainfall, Drainage density, TWI, and lithology (Figs. 6, 7 and 8).
Landslides are greatly influenced by topography or geomorphology (Dahal et al.,2008). Slope, aspect, elevation, curvature, plan curvature, profile curvature, distance to streams, and topographic wetness index (TWI) are some of the topographic parameters used to determine the topography in the Cartosat DEM, which displays terrain with a 2.5 m resolution. They play a significant influence in the action of landslides (Riaz et al.,2022). Here is a quick discussion of these parameters that were obtained from the DEM.
3.3.1. Slope Gradient
The slope gradient is the main reason for landslides (Vijith et al.,2014). It affects the stress distribution in the slope, the weathering layer, and the run off from the slope's surface (Figure 6a). The reason why steep slopes collapse more frequently than moderate slopes may be attributed to restriction pressures (Gou et al.,2015). According to Riaz et al.,2018, the slope area was derived from a DEM with a 2.5 m resolution and categorised into seven classes: 0 - 15, 15 - 20, 20 - 30, 30 - 40, Above > 40.
3.3.2. Aspect
Due to the slope's aspect (Figure 6b), which causes melting of the snow and water infiltration, increased freezing and thawing, and mass movement, the aspect is a key influencing element. In a certain area, landslides usually occur in a particular direction (Saadatkhah etal.,2014). Using ArcGIS 10.8, the aspect was reclassified into eight classes after being generated from the DEM.
3.3.3. Elevation
The elevation (Figure 6c) plays a significant role in the geographical distribution of landslides used for landslide susceptibility studies (Dai et al.,2001; Kamp et al.,2008). Elevation has a major impact on slope failure and has a considerable impact on regional features (Ercanoglu et al.,2004). The research area's elevation varies from 246 m to 4625 m, and an elevation map was created using DEM and the reclassification tool in ArcGIS 10.8.
3.3.4. Curvature
The slope's curvature is another way to express the slope's geometry, and it plays a crucial role in the occurrence of landslides (Nefeslioglu et al.,2008) (Figure 6d). (Maggioni and Gruber,2003) state that curves with negative values are concave and those with positive values are convex. The slope surface's curves and curvature value both rise at the same time.
3.3.5. Plan Curvature
Plan curvature, often referred to as the curvature of the slope surface in a horizontal surface or the line of elevation on a topographical map (Figure 6e), is what determines how the water will move in its flowing trajectory. Positive values imply that the cell's side surfaces are convex, whilst negative values imply that the side surfaces are concave. A surface with a zero value, on the other hand, is regarded as linear or flat.
3.3.6. Profile Curvature
Profile curvature is described as having a high slope angle in the direction of the slope surface (Figure 6f). The trajectory of water is also influenced by the profile curvature (Pourghasemi et al.,2018;, Zhou et al.,2018). The surface of the cell is assumed to be convex upwards by a negative number and concave by a positive number. If the value is 0, the surface is flat. The acceleration or slowdown of flow through a surface is influenced by profile curvature.
3.3.7. Topographic Wetness Analysis (TWI)
The TWI is a significant contributor to the mass movement's causes. The TWI identified the region of accumulation of water flow, which is commonly connected to saturated land, both intermittently and permanently (Figure 6g). The hydrology and raster calculator tool in ArcGIS 10.8 was used to create a DEM with a spatial resolution of 2.5 m (Gruber et al.,2009).
3.3.8. Lithology
The local lithology (Figure 6h) has a significant impact on the likelihood of mass movement. Lithology is regarded as a well-known criterion that significantly influences the physical characteristics of surface and subsurface materials and plays a significant role in the slope failure process (Ikram et al.,2022). The majority of slope failures occurred in weak, unstable, or brittle lithological units. The variance in slope surface instability is also influenced by the differences between different lithological units (Aditian et al.,2018).
3.3.9. Distance to Faults
When the faults are active, they have a significant impact on the distribution of mass movement (Figure 6i). The majority of slope collapses are impacted by the proximity to faults caused by rock and surface structure cracking (Basharat et al.,2014). ArcGIS software was used to calculate the distance from the faults using the buffer tool.
3.3.10. Normalized Difference Vegetation Index (NDVI)
According to (Riaz et al.,2022) NDVI is a significant environmental influencing element (Figure 7a). The plant density on the slope surface is measured using the NDVI. It is widely acknowledged that the addition of grasses and roots plays a significant part in the strength of the soil. An NDVI map was produced using multispectral Resourcesat satellite data to show the location and density of surface vegetation.
3.3.11. Rainfall
The rainfall map of East district is prepared using rainfall data from India Meteorological Department (IMD) website having resolution of 4km×4Km. The rainfall data of last twenty years since 2000 to 2020 is downloaded for monsoon months (May to September) and averaged (Saha and Saha, 2021). The thematic layer of rainfall is prepared using averaged data with the help of the interpolation method of IDW in ArcGIS (Figure 7b).
3.3.12. Drainage Density
The density of drainage is a significant signal of the linear scale of the element in stream eroding topography and is specified as the total stream length of all orders and drainage areas and may indicate the channel spacing closeness (Dikshit et al., 2014; Rawat et al., 2016). Drainage density is critical as it leads to mass wasting and slope failure. The drainage density in the study area is divided into nine classes up to 335 km2. In the ArcGIS software drainage density map with the help of data from Cartosat DEM is prepared (Figure 7c).
3.3.13. Landuse/Landcover
Environmentally regulated elements are thought to play a significant role in the likelihood of landslides. Another crucial environmental regulated influencing factor of the landslip that avoids surface soil deterioration is the area's LU/LC (Figure 8a). Land cover is a key determining factor for slope failure since the mass movement is based on the kind of land. The land use/landcover model was calculated using Resourcesat images with 2% cloud cover. Exiles ENVI software was used to categorise the picture into several landuse groups (such as forest, barren, grass land, water bodies, and urban land) after performing supervised classification.
3.3.14. Distance from Drainage
Distance to drainage (Figure 8b) is determined as a significant influencing parameter in the slope failure because the proximity to a water body in a region increases the likelihood of a slope failure by increasing fluid pore pressure and slope toe erosion (Du et al.,2017; Raja et al.,2017). Due to the rugged topography, which was extracted using Cartosat DEM and then reclassified in Arc GIS 10.8, the project area includes a substantial drainage network.
3.3.15. Distance from Roads
Anthropogenic influences are those that are brought on by human action, such as road construction, mining or removing vegetation. One of the key considerations is the distance from the road (Figure 8c), since most landslides occur owing to the influence of the road network, which has a similar effect to the closeness of drainage in steep terrain (Yalcin et al.,2011). The roads were digitalized using Google Earth and topographical maps. The road network was divided into many buffers, which were subsequently reclassified using the reclassify tool in ArcGIS 10.8.
3.4. Information Value Model (IVM)
The information value model is a statistical approach to predict an event based on the parameter relation and the event. This is an approach focused on the frequency of the landslide occurrence in the Landslide Causing Spatial Factor distribution across the study area (Cao et al., 2016; Banerjee et al., 2018). It is an indirect statistical method and can be used to determine the spatial relation between the likelihood of landslide occurrence and the conditioning factors (Du et al., 2019). The likelihood of landslides is determined in this model by the factor information value (Luo et al 2019). The efficiency of this model depends on the variables between the landslide conditioning factors and the landslide distribution (Singh and Kumar, 2018). In order to determine the weights of the predictor, the ratio of landslide density in each class of a causal factor to landslide density in the total area should be calculated (Chen et al., 2014). The weight measurement equation is given below:
where, Wt = Weight of a factor class; ln = natural logarithm; Npix(Si) = Number of pixel of landslide within class i; Npix(Ni) = Number of pixel of class i; ΣNpix(Si) = Number of pixel of landslide within the whole study area; ΣNpix(Ni) = Number of pixel of the whole study area.
The natural logarithm is used to give negative weights when the landslide density is less than average, and when it is more than average positive weights are assigned. The positive weight (Wt) is the direct connection between landslide and landslide predictor factor and the existence of landslide predictors. For each class of causative variables, the weight value was calculated by the above equation. A weighted value was added for the landslide susceptibility index (LSI) of each pixel to produce a map for landslide susceptibility.
LSI=𝐴𝑆𝑃𝑤𝑡+𝑆𝐿𝑃𝑤𝑡+𝐶𝑈𝑅𝑤𝑡+𝐷𝑁𝐷𝑤𝑡+𝐿𝐺𝑌𝑤𝑡+𝐿𝑈𝐿𝑤𝑡+𝑁𝐷𝑉𝑤𝑡+𝐸𝐿𝑉𝑤𝑡+𝐿𝑁𝐷𝑤𝑡+𝐺𝑀𝑃𝑤𝑡+𝑆𝐿𝑇𝑤𝑡
where ASPwt is the weight of aspect, SLPwt is the weight of slope, CURwt is the weight of curvature, DNDwt is the weight of drainage density, LGYwt is the weight of lithology, LULwt is the weight of land use and land cover, NDVwt is the weight of NDVI, ELVwt is the weight of elevation LNDwt is the weight of lineament density, GMPwt is the weight of geomorphology and SLTwt is the weight of soil type. The negative and positive weighted values represent the interaction of an irrelevant and significant element with an occurrence of the landslide (Chen et al., 2020). The landslide-susceptibility map is subsequently combined with the landslide training and the testing raster. Dividing LSI into three areas based upon its steepness, which include a high susceptibility zone, a moderate susceptibility zone and a low susceptibility zone, intensity of landslide susceptibility is measured. (Table 2)
4. Results
4.1. Landslide Susceptibility Models
Utilising values assigned to the LCFs, and landslide inventory of several years (2010, 2015, and 2020) the susceptibility models for the research region was created using ArcGIS 10.8 and unique, extremely accurate advanced statistical techniques. The resulting LSMs depict the likelihood of landslides in a "low to high" range, with low denoting a region that is safe from mass movement activity and high denoting a likelihood that landslides would occur (Figure 9). LSM is calculated using the IV wt. coefficients and corresponding class and landslide variation of LCFs.
Each dataset identifies regions that are vulnerable to mass movement activities in a little to somewhat varied manner. Additionally, the LSM is divided into three zones (Low, Moderate, High) to help identify areas that may be at high risk of experiencing landslides. Figure 9 displays the IVM-LSM. To determine the highest likelihood of a landslip occurring along a fault, LSMs classified as high susceptibility zones. The majority of the area's roadways have moderate to high grades and are located between 1000 and 1500 metres above sea level.
The area occupied by these sensitive zones on basis of landslide inventory of various years is depicted in Figure 9. The slope gradient and area's lithology, such as fragile phyllite and schists, are effective LCFs among all other LCFs for landslip activity in the years 2010, 2015, and 2020. This is demonstrated by the Information Value weight coefficient. According to the updated, the LR susceptibility model predicts a very high susceptible zone of 109.68 km2, Moderate susceptible zone of 492.95 km2 and low susceptible zone of 361.37 km2 out of total 964 km2 of the research region. (Figure 9 & Table 3).
LSM of East District indicates that 37.49%, and of the total district area is classified into low landslide susceptibility while 51.14% area have moderate landslide susceptibility. 11.38% of the total district have high landslide susceptibility (Table 3). East District is found to have high landslide susceptibility which is confirmed by field visits and secondary sources.
The output landslide susceptibility map of Study area (Figure 9) based on Information Value method is classified into three susceptible categories as Low, Medium,High.Percentage area in each class is calculated.(Table 3)
The analysis of IVM susceptibility model indicate that the region is susceptible to landslip activity is growing in a very high susceptible zone over the various years’ worth of data.
Our findings are consistent with Costanzo et al.'s assertion that topographic conditions have a substantial impact on the occurrence of landslides. Our findings support those of Riaz et al., Pham et al., Ikram et al., and Ahmed et al. that lithological units and slope gradient are the most significant LCFs. Using the advanced statistical model i.e Information Value Model (IVM) it is discovered that the most significant LCFs are Elevation, distance to drainage, NDVI, curvature, and rainfall. These findings proved that the significance of major LCFs varies depending on the geography and models used.
For the current study fifteen landslide conditioning factors, i.e., slope aspect, slope gradient, elevation, Lithology, land use and land cover (LULC), rainfall, Curvature, Plan curvature, Profile curvature, normalized difference vegetation index (NDVI), Geology, Road Proximity, Drainage Proximity Drainage density, and total wetness index were analyzed in the remote sensing (RS) and geographic information system (GIS) environment. The thematic layers for the same has been prepared which is further used to prepare the Landslide Susceptibility Map of the study area.
For the validation of LSM, it is compared with landslide inventory map. It is observed that eastern part of the district is classified into high and very high landslide susceptibility class which is in agreement with the landslide inventory map. Landslide inventory map also suggests that majority of the landslides are observed in the eastern part of the district.
5. Conclusions
This study used temporal landslide inventories for the District East Sikkim in the NE Himalayas of India to apply advanced statistical technique to determine the susceptibility zones of landslides and estimate the likelihood of landslide activity. The East Sikkim district has experienced significant economic losses as a result of the landslip activity, including damage to communities, infrastructure, and roadways.
To create IVM-LSM and determine the causes of landslides in the area, the study used spatiotemporal landslide inventories (2010, 2015, and 2020) with fifteen causative elements, including topographic, geological, environmental, and anthropogenic variables. The LSM showed that the rainfall, slope and lithological (i.e., fragile Phyllite, Schists) control in the proximity of faults considerably regulate the landslip activities in the research region. The most trustworthy IVM-based LSM study datasets from the years 2010, 2015, and 2020 showed that the area has a very high sensitive zone that is continually expanding.
It was determined that IVM models are workable by the validation using statistical measures and in agreement with the landslide inventories of various years. The findings also imply that IVM-LSMs are more trustworthy and authentic. It is recommended that advance statistical models be used as the preferred models for predicting landslides in the study region. This study establishes that since the region is highly susceptible in nature, so as to predict, the updated LSM Modelling has to be done to evaluate the effectiveness LSM in this particular area.
In our present study landslide susceptible zonation mapping is done. Almost all the landslides have been reported in the rainy season. The study shows that land use/land cover, rainfall, slope, drainage density, structure and lithology play an important role in landslide triggering. The ranking of the conditioning factors based on the present analysis and the landslide hazard index is highest for rainfall followed by structures, lithology, slope, LU/LC and drainage density. The total study area is divided into three susceptible zones i.e. low, medium and high susceptible zones comprising of 37.49%, 51.14% and 11.38% and 361.37 km2, 492.95km2 and109.68km2 in East district (Figure 10 &Figure 11) . The methodology described here for landslide susceptible mapping includes generating thematic information layers, developing an appropriate numerical rating system, integrating spatial data and validating outcomes. It is analyzed that GIS application is extremely helpful for the generation of thematic information and their spatial data analysis, involving complex tasks. The numerical rating system enables to enhance performance assessment and optimization. Since the contributing variables to the landslide differ from region to region, however this rating may not apply to other areas of the Himalayas.
To create temporal landslide inventory for recursive landslide hazard assessment, historical landslide data from a variety of sources can be used. Finally, the knowledge from this study's findings will help urban planners, disaster management authorities, and other decision-makers choose safe building sites and identify regions that are prone to landslides. In order to prevent infrastructure development in landslip risk locations, more practise with landslip risk assessment studies might be conducted to build risk maps.
Acknowledgments
The author is very thankful to GBPNIHE for financial support through GBPIHE project sanction letter No.: GBPI/IERP/19-20/13 dated 31st March 2020 and Dean, USEM, Guru Gobind Singh Indraprastha University, New Delhi for providing the facility in carrying out the study.
Conflicts of Interest
Declare conflicts of interest or state “The authors declare no conflict of interest.” Authors must identify and declare any personal circumstances or interest that may be perceived as inappropriately influencing the representation or interpretation of reported research results. Any role of the funders in the design of the study; in the collection, analyses or interpretation of data; in the writing of the manuscript; or in the decision to publish the results must be declared in this section. If there is no role, please state “The funders had no role in the design of the study; in the collection, analyses, or interpretation of data; in the writing of the manuscript; or in the decision to publish the results”.
References
- Aditian, A.; Kubota, T.; Shinohara, Y. Comparison of GIS-based landslide susceptibility models using frequency ratio, logistic regression, and artificial neural network in a tertiary region of Ambon, Indonesia. Geomorphology 2018, 318, 101–111. [Google Scholar] [CrossRef]
- Ahmed, K.S.; Basharat, M.; Riaz, M.T.; Sarfraz, Y.; Shahzad, A. Geotechnical investigation and landslide susceptibility assessment along the Neelum road: a case study from Lesser Himalayas, Pakistan. Arab. J. Geosci. 2021, 14, 1–19. [Google Scholar] [CrossRef]
- AYDIN, A.; EKER, R.; FUCHS, H. Lidar Data Analysis With Digital Image Correlation (Dic) In Obtaining Landslide Displacement Fields: A Case Of Gschliefgraben Landslide-Austria. The Online Journal of Science and Technology-17, 7. 20 October.
- Basharat, M.; Riaz, M.T.; Jan, M.Q.; Xu, C.; Riaz, S. A review of landslides related to the 2005 Kashmir Earthquake: implication and future challenges. Nat. Hazards 2021, 108, 1–30. [Google Scholar] [CrossRef]
- Basharat, M.; Riaz, M.T.; Jan, M.Q.; Xu, C.; Riaz, S. A review of landslides related to the 2005 Kashmir Earthquake: implication and future challenges. Nat. Hazards 2021, 108, 1–30. [Google Scholar] [CrossRef]
- Basharat, M.; Shah, H.R.; Hameed, N. Landslide susceptibility mapping using GIS and weighted overlay method: a case study from NW Himalayas, Pakistan. Arab. J. Geosci. 2016, 9, 1–19. [Google Scholar] [CrossRef]
- Basharat, M.; Rohn, J.; Baig, M.S.; Khan, M.R. Spatial distribution analysis of mass movements triggered by the 2005 Kashmir earthquake in the Northeast Himalayas of Pakistan. Geomorphology 2014, 206, 203–214. [Google Scholar] [CrossRef]
- Basharat, M.; Rohn, J.; Baig, M.S.; Khan, M.R.; Schleier, M. Large scale mass movements triggered by the Kashmir earthquake 2005, Pakistan. J. Mt. Sci. 2014, 11, 19–30. [Google Scholar] [CrossRef]
- Basharat, M. (2012). The distribution, characteristics and behaviour of mass movements triggered by the Kashmir Earthquake 2005, NW Himalaya, Pakistan (Doctoral dissertation, Friedrich-Alexander-Universität Erlangen-Nürnberg (FAU)).
- Banerjee, P.; Ghose, M.K.; Pradhan, R. Analytic hierarchy process and information value method-based landslide susceptibility mapping and vehicle vulnerability assessment along a highway in Sikkim Himalaya. Arab. J. Geosci. 2018, 11, 1–18. [Google Scholar] [CrossRef]
- Cao, Y.; Yin, K.; Alexander, D.E.; Zhou, C. Using an extreme learning machine to predict the displacement of step-like landslides in relation to controlling factors. Landslides 2015, 13, 725–736. [Google Scholar] [CrossRef]
- Chen, W.; Li, Y. GIS-based evaluation of landslide susceptibility using hybrid computational intelligence models. CATENA 2020, 195, 104777. [Google Scholar] [CrossRef]
- Chen, W.; Xie, X.; Wang, J.; Pradhan, B.; Hong, H.; Bui, D.T.; Duan, Z.; Ma, J. A comparative study of logistic model tree, random forest, and classification and regression tree models for spatial prediction of landslide susceptibility. CATENA 2017, 151, 147–160. [Google Scholar] [CrossRef]
- Chen, W.; Li, X.; Wang, Y.; Chen, G.; Liu, S. Forested landslide detection using LiDAR data and the random forest algorithm: A case study of the Three Gorges, China. Remote. Sens. Environ. 2014, 152, 291–301. [Google Scholar] [CrossRef]
- Costanzo, D.; Rotigliano, E.; Irigaray, C.; Jiménez-Perálvarez, J.D.; Chacón, J. Factors selection in landslide susceptibility modelling on large scale following the gis matrix method: application to the river Beiro basin (Spain). Nat. Hazards Earth Syst. Sci. 2012, 12, 327–340. [Google Scholar] [CrossRef]
- Dahal, R.K.; Hasegawa, S.; Nonomura, A.; Yamanaka, M.; Dhakal, S.; Paudyal, P. Predictive modelling of rainfall-induced landslide hazard in the Lesser Himalaya of Nepal based on weights-of-evidence. Geomorphology 2008, 102, 496–510. [Google Scholar] [CrossRef]
- Dai, F.C.; Lee, C.F. Terrain-based mapping of landslide susceptibility using a geographical information system: a case study. Canadian Geotechnical Journal 2001, 38, 911–923. [Google Scholar] [CrossRef]
- Dikshit, K.R.; Dikshit, J.K. (2014). Relief features of north-east India. In north-east India: land, people and economy (pp. 91-125). Springer, Dordrecht.
- Dou, J.; Yunus, A.P.; Bui, D.T.; Sahana, M.; Chen, C.-W.; Zhu, Z.; Wang, W.; Pham, B.T. Evaluating GIS-Based Multiple Statistical Models and Data Mining for Earthquake and Rainfall-Induced Landslide Susceptibility Using the LiDAR DEM. Remote. Sens. 2019, 11, 638. [Google Scholar] [CrossRef]
- Du, G.-L.; Zhang, Y.-S.; Iqbal, J.; Yang, Z.-H.; Yao, X. Landslide susceptibility mapping using an integrated model of information value method and logistic regression in the Bailongjiang watershed, Gansu Province, China. J. Mt. Sci. 2017, 14, 249–268. [Google Scholar] [CrossRef]
- Du, G.; Zhang, Y.; Yang, Z.; Guo, C.; Yao, X.; Sun, D. Landslide susceptibility mapping in the region of eastern Himalayan syntaxis, Tibetan Plateau, China: a comparison between analytical hierarchy process information value and logistic regression-information value methods. Bull. Eng. Geol. Environ. 2018, 78, 4201–4215. [Google Scholar] [CrossRef]
- Ercanoglu, M.U.R.A.T.; Gokceoglu, C.A.N.D.A.N.; Th, W.; Van Asch, J. Landslide susceptibility zoning north of Yenice (NW Turkey) by multivariate statistical techniques. Natural Hazards 2004, 32, 1. [Google Scholar] [CrossRef]
- Farooq, S.; Akram, M.S. COMPARISON OF DATA-DRIVEN LANDSLIDE SUSCEPTIBILITY ASSESSMENT USING WEIGHT OF EVIDENCE, INFORMATION VALUE, FREQUENCY RATIO AND CERTAINTY FACTOR METHODS. Acta Geodynamica et Geromaterialia 2021, 18, 301–318. [Google Scholar] [CrossRef]
- Froude, M.J.; Petley, D.N. Global fatal landslide occurrence from 2004 to 2016. Nat. Hazards Earth Syst. Sci. 2018, 18, 2161–2181. [Google Scholar] [CrossRef]
- Galli, M.; Ardizzone, F.; Cardinali, M.; Guzzetti, F.; Reichenbach, P. Comparing landslide inventory maps. Geomorphology 2008, 94, 268–289. [Google Scholar] [CrossRef]
- Girma, F.; Raghuvanshi, T.K.; Ayenew, T.; Hailemariam, T. Landslide hazard zonation in Ada Berga District, Central Ethiopia–a GIS based statistical approach. J Geom 2015, 9(i), 25–38. [Google Scholar]
- Gorum, T.; Fan, X.; van Westen, C.J.; Huang, R.Q.; Xu, Q.; Tang, C.; Wang, G. Distribution pattern of earthquake-induced landslides triggered by the 12 May 2008 Wenchuan earthquake. Geomorphology 2011, 133, 152–167. [Google Scholar] [CrossRef]
- Gorum, T.; Carranza, E.J.M. Control of style-of-faulting on spatial pattern of earthquake-triggered landslides. Int. J. Environ. Sci. Technol. 2015, 12, 3189–3212. [Google Scholar] [CrossRef]
- Gruber, S.; Peckham, S. Land-surface parameters and objects in hydrology. Developments in soil science 2009, 33, 171–194. [Google Scholar]
- Guo, C.; Montgomery, D.R.; Zhang, Y.; Wang, K.; Yang, Z. Quantitative assessment of landslide susceptibility along the Xianshuihe fault zone, Tibetan Plateau, China. Geomorphology 2015, 248, 93–110. [Google Scholar] [CrossRef]
- Guzzetti, F. (2002, October). In Landslide hazard assessment and risk evaluation: Limits and prospectives. In Proceedings of the 4th EGS Plinius Conference, Mallorca, Spain (pp. 2-4).
- Guzzetti, F.; Mondini, A.C.; Cardinali, M.; Fiorucci, F.; Santangelo, M.; Chang, K.-T. Landslide inventory maps: New tools for an old problem. Earth-Science Rev. 2012, 112, 42–66. [Google Scholar] [CrossRef]
- Hamza, T.; Raghuvanshi, T.K. GIS based landslide hazard evaluation and zonation–A case from Jeldu District, Central Ethiopia. Journal of King Saud University-Science 2017, 29, 151–165. [Google Scholar] [CrossRef]
- Hewitt, K.; Mehta, M. Rethinking risk and disasters in mountain areas. 2012. [Google Scholar]
- Ikram, N.; Basharat, M.; Ali, A.; Usmani, N.A.; Gardezi, S.A.H.; Hussain, M.L.; Riaz, M.T. Comparison of landslide susceptibility models and their robustness analysis: a case study from the NW Himalayas, Pakistan. Geocarto Int. 2021, 37, 9204–9241. [Google Scholar] [CrossRef]
- Kamp, U.; Growley, B.J.; Khattak, G.A.; Owen, L.A. GIS-based landslide susceptibility mapping for the 2005 Kashmir earthquake region. Geomorphology 2008, 101, 631–642. [Google Scholar] [CrossRef]
- Kumar, K.V.; Martha, T.R.; Roy, P.S. Mapping damage in the Jammu and Kashmir caused by 8 October 2005 Mw 7. 3 earthquake from the Cartosat–1 and Resourcesat–1 imagery. International Journal of Remote Sensing 2006, 27, 4449–4459. [Google Scholar]
- Kirschbaum, D.; Stanley, T.; Zhou, Y. Spatial and temporal analysis of a global landslide catalog. Geomorphology 2015, 249, 4–15. [Google Scholar] [CrossRef]
- Luo, X.; Lin, F.; Zhu, S.; Yu, M.; Zhang, Z.; Meng, L.; Peng, J. Mine landslide susceptibility assessment using IVM, ANN and SVM models considering the contribution of affecting factors. PLOS ONE 2019, 14, e0215134. [Google Scholar] [CrossRef] [PubMed]
- Maggioni, M.; Gruber, U. The influence of topographic parameters on avalanche release dimension and frequency. Cold Reg. Sci. Technol. 2003, 37, 407–419. [Google Scholar] [CrossRef]
- Martha, T.R.; Kerle, N.; Jetten, V.; van Westen, C.J.; Kumar, K.V. Characterising spectral, spatial and morphometric properties of landslides for semi-automatic detection using object-oriented methods. Geomorphology 2010, 116, 24–36. [Google Scholar] [CrossRef]
- Merghadi, A.; Yunus, A.P.; Dou, J.; Whiteley, J.; ThaiPham, B.; Bui, D.T.; Avtar, R.; Abderrahmane, B. Machine learning methods for landslide susceptibility studies: A comparative overview of algorithm performance. Earth Sci. Rev. 2020, 207, 103225. [Google Scholar] [CrossRef]
- Nefeslioglu, H.A.; Gokceoglu, C.; Sonmez, H. An assessment on the use of logistic regression and artificial neural networks with different sampling strategies for the preparation of landslide susceptibility maps. Eng. Geol. 2008, 97, 171–191. [Google Scholar] [CrossRef]
- Owen, L.A.; Kamp, U.; Khattak, G.A.; Harp, E.L.; Keefer, D.K.; Bauer, M.A. Landslides triggered by the 8 October 2005 Kashmir earthquake. Geomorphology 2008, 94, 1–9. [Google Scholar] [CrossRef]
- Petley, D.; Dunning, S.; Rosser, N.; Kausar, A.B. Incipient landslides in the Jhelum Valley, Pakistan following the 8th 05 earthquake. Messages v. 20 October.
- Peiris 2006, N.; Rossetto, T.; Burton, P.; Mahmood, S. EEFIT mission: October 8, 2005 Kashmir earthquake. Published Report 2006, The institution of structural engineers, London. [Google Scholar]
- Polat, A. An innovative, fast method for landslide susceptibility mapping using GIS-based LSAT toolbox. Environ. Earth Sci. 2021, 80, 1–18. [Google Scholar] [CrossRef]
- Pourghasemi, H.R.; Teimoori Yansari, Z.; Panagos, P.; Pradhan, B. Analysis and evaluation of landslide susceptibility: a review on articles published during 2005–2016 (periods of 2005–2012 and 2013–2016). Arabian Journal of Geosciences 2018, 11, 1–12. [Google Scholar] [CrossRef]
- Rawat, M.S.; Joshi, V.; Sundriyal, Y.P. Slope stability analysis in a part of East Sikkim, using Remote Sensing & GIS. 2016 2nd International Conference on Next Generation Computing Technologies (NGCT). LOCATION OF CONFERENCE, IndiaDATE OF CONFERENCE; pp. 51–60.
- Raja, N.B.; Çiçek, I.; Türkoğlu, N.; Aydin, O.; Kawasaki, A. Landslide susceptibility mapping of the Sera River Basin using logistic regression model. Nat. Hazards 2016, 85, 1323–1346. [Google Scholar] [CrossRef]
- Riaz, M.T.; Basharat, M.; Hameed, N.; Shafique, M.; Luo, J. A Data-Driven Approach to Landslide-Susceptibility Mapping in Mountainous Terrain: Case Study from the Northwest Himalayas, Pakistan. Nat. Hazards Rev. 2018, 19. [Google Scholar] [CrossRef]
- Riaz, M.T.; Basharat, M.; Pham, Q.B.; Sarfraz, Y.; Shahzad, A.; Ahmed, K.S.; Ikram, N.; Waseem, M.H. Improvement of the predictive performance of landslide mapping models in mountainous terrains using cluster sampling. Geocarto Int. 2022, 37, 12294–12337. [Google Scholar] [CrossRef]
- Saha, A.; Saha, S. Application of statistical probabilistic methods in landslide susceptibility assessment in Kurseong and its surrounding area of Darjeeling Himalayan, India: RS-GIS approach. Environ. Dev. Sustain. 2020, 23, 4453–4483. [Google Scholar] [CrossRef]
- Saadatkhah, N.; Kassim, A.; Lee, L.M. Qualitative and quantitative landslide susceptibility assessments in Hulu Kelang area, Malaysia. EJGE 2014, 19, 545–563. [Google Scholar]
- Sahin, E.K.; Colkesen, I.; Kavzoglu, T. A comparative assessment of canonical correlation forest, random forest, rotation forest and logistic regression methods for landslide susceptibility mapping. Geocarto Int. 2018, 35, 341–363. [Google Scholar] [CrossRef]
- Sati, S.P.; Sharma, S.; Sundriyal, Y.P.; Rawat, D.; Riyal, M. Geo-environmental consequences of obstructing the Bhagirathi River, Uttarakhand Himalaya, India. Geomatics, Nat. Hazards Risk 2020, 11, 887–905. [Google Scholar] [CrossRef]
- Sato, H.P.; Hasegawa, H.; Fujiwara, S.; Tobita, M.; Koarai, M.; Une, H.; Iwahashi, J. Interpretation of landslide distribution triggered by the 2005 Northern Pakistan earthquake using SPOT 5 imagery. Landslides 2006, 4, 113–122. [Google Scholar] [CrossRef]
- Sepúlveda, S.A.; Petley, D.N. Regional trends and controlling factors of fatal landslides in Latin America and the Caribbean. Nat. Hazards Earth Syst. Sci. 2015, 15, 1821–1833. [Google Scholar] [CrossRef]
- SERIES-E, E.U.L.L.E.T.I.N. Geoseismological Report on Sikkim Earthquake. 2011.
- Singh, A.; Pal, S.; Kanungo, D.P.; Pareek, N. An overview of recent developments in landslide vulnerability assessment-presentation of a new conceptual framework. In Workshop on World Landslide Forum 2017, 795-802. Springer, Cham.
- Singh, K.; Kumar, V. Hazard assessment of landslide disaster using information value method and analytical hierarchy process in highly tectonic Chamba region in bosom of Himalaya. J. Mt. Sci. 2018, 15, 808–824. [Google Scholar] [CrossRef]
- Svalova, V.B.; Zaalishvili, V.B.; Ganapathy, G.P.; Nikolaev, A.V.; Melkov, D.A. Landslide risk in mountain areas. Geology of the South of Russia 2019, 2. [Google Scholar]
- Vijith, H.; Krishnakumar, K.; Pradeep, G.; Krishnan, M.N.; Madhu, G. Shallow landslide initiation susceptibility mapping by GIS-based weights-of-evidence analysis of multi-class spatial data-sets: a case study from the natural sloping terrain of Western Ghats, India. Georisk: Assess. Manag. Risk Eng. Syst. Geohazards 2013, 8, 48–62. [Google Scholar] [CrossRef]
- Yalcin, A.; Reis, S.; Aydinoglu, A.C.; Yomralioglu, T. A GIS-based comparative study of frequency ratio, analytical hierarchy process, bivariate statistics and logistics regression methods for landslide susceptibility mapping in Trabzon, NE Turkey. Catena 2011, 85, 274–287. [Google Scholar] [CrossRef]
- Yawen, M. (2011). Regional scale multi-hazard susceptibility assessment: a case study in Mtskheta-Mtianeti, Georgia (Master's thesis, University of Twente).
- Zhou, C.; Yin, K.; Cao, Y.; Ahmed, B.; Li, Y.; Catani, F.; Pourghasemi, H.R. Landslide susceptibility modeling applying machine learning methods: A case study from Longju in the Three Gorges Reservoir area, China. Comput. Geosci. 2018, 112, 23–37. [Google Scholar] [CrossRef]
Figure 1.
Geographical location of the study area.
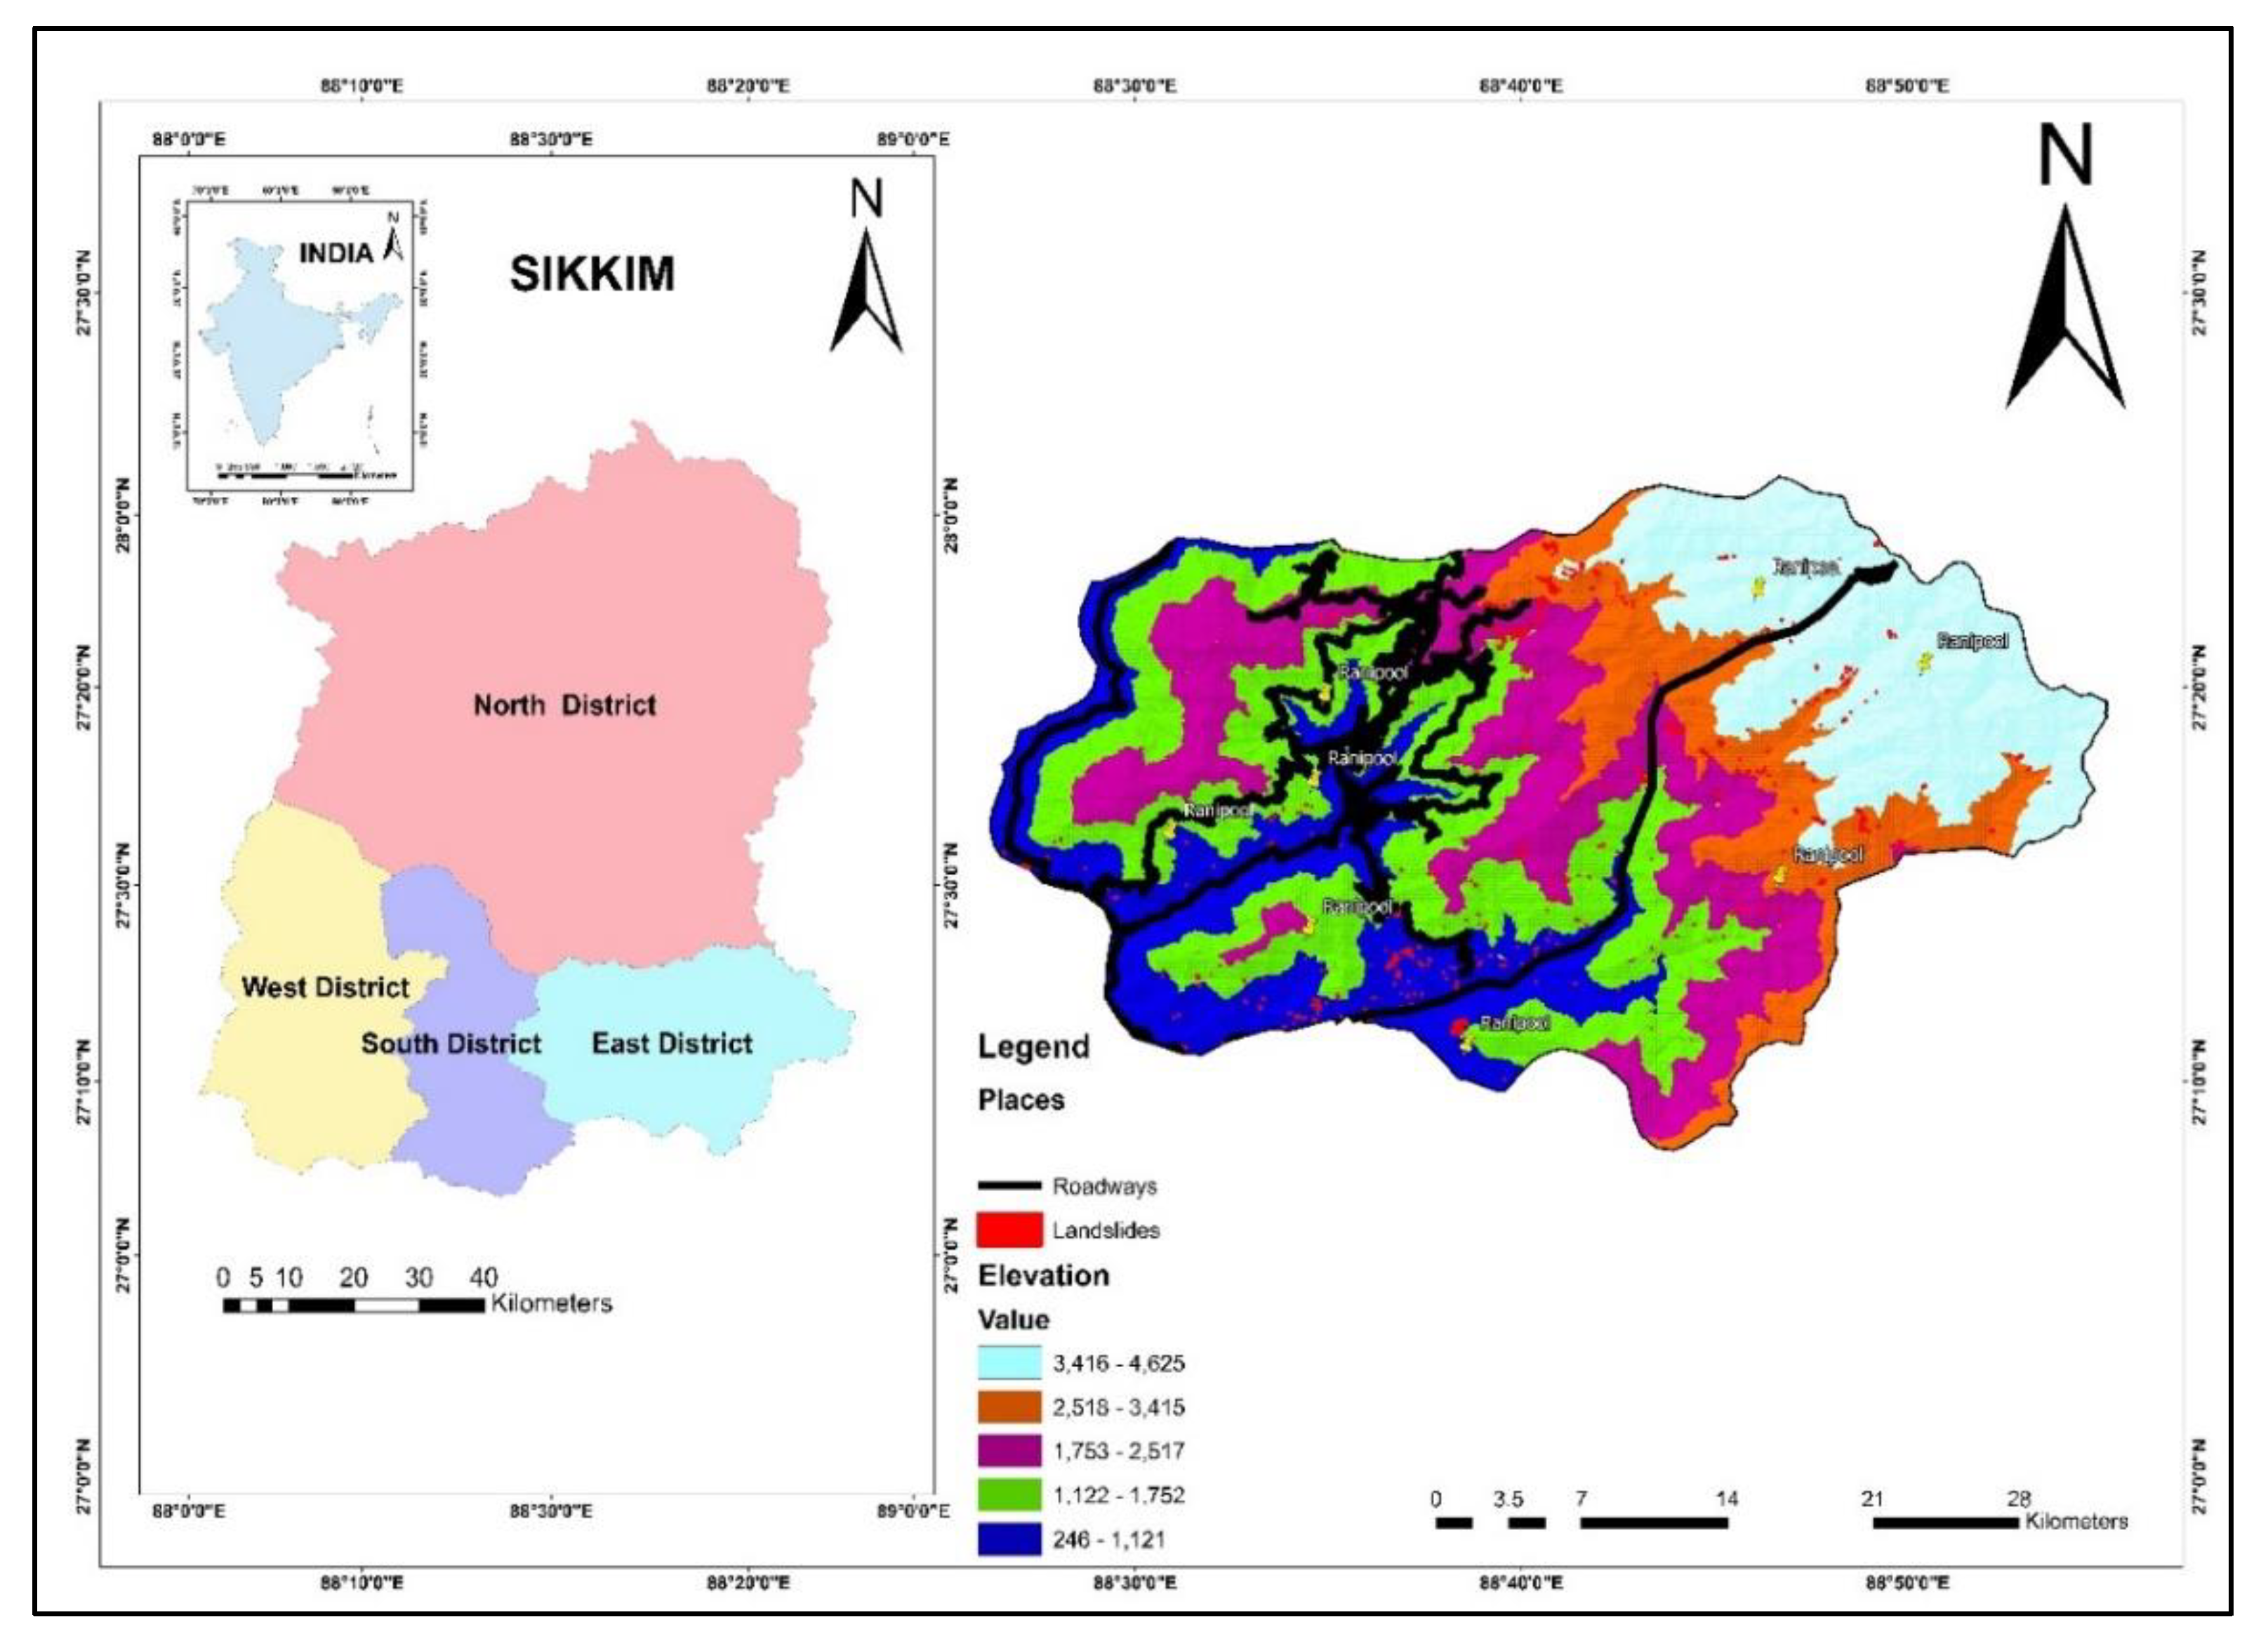
Figure 2.
Annual Precipitation of the study area (Source: IMD,2020).
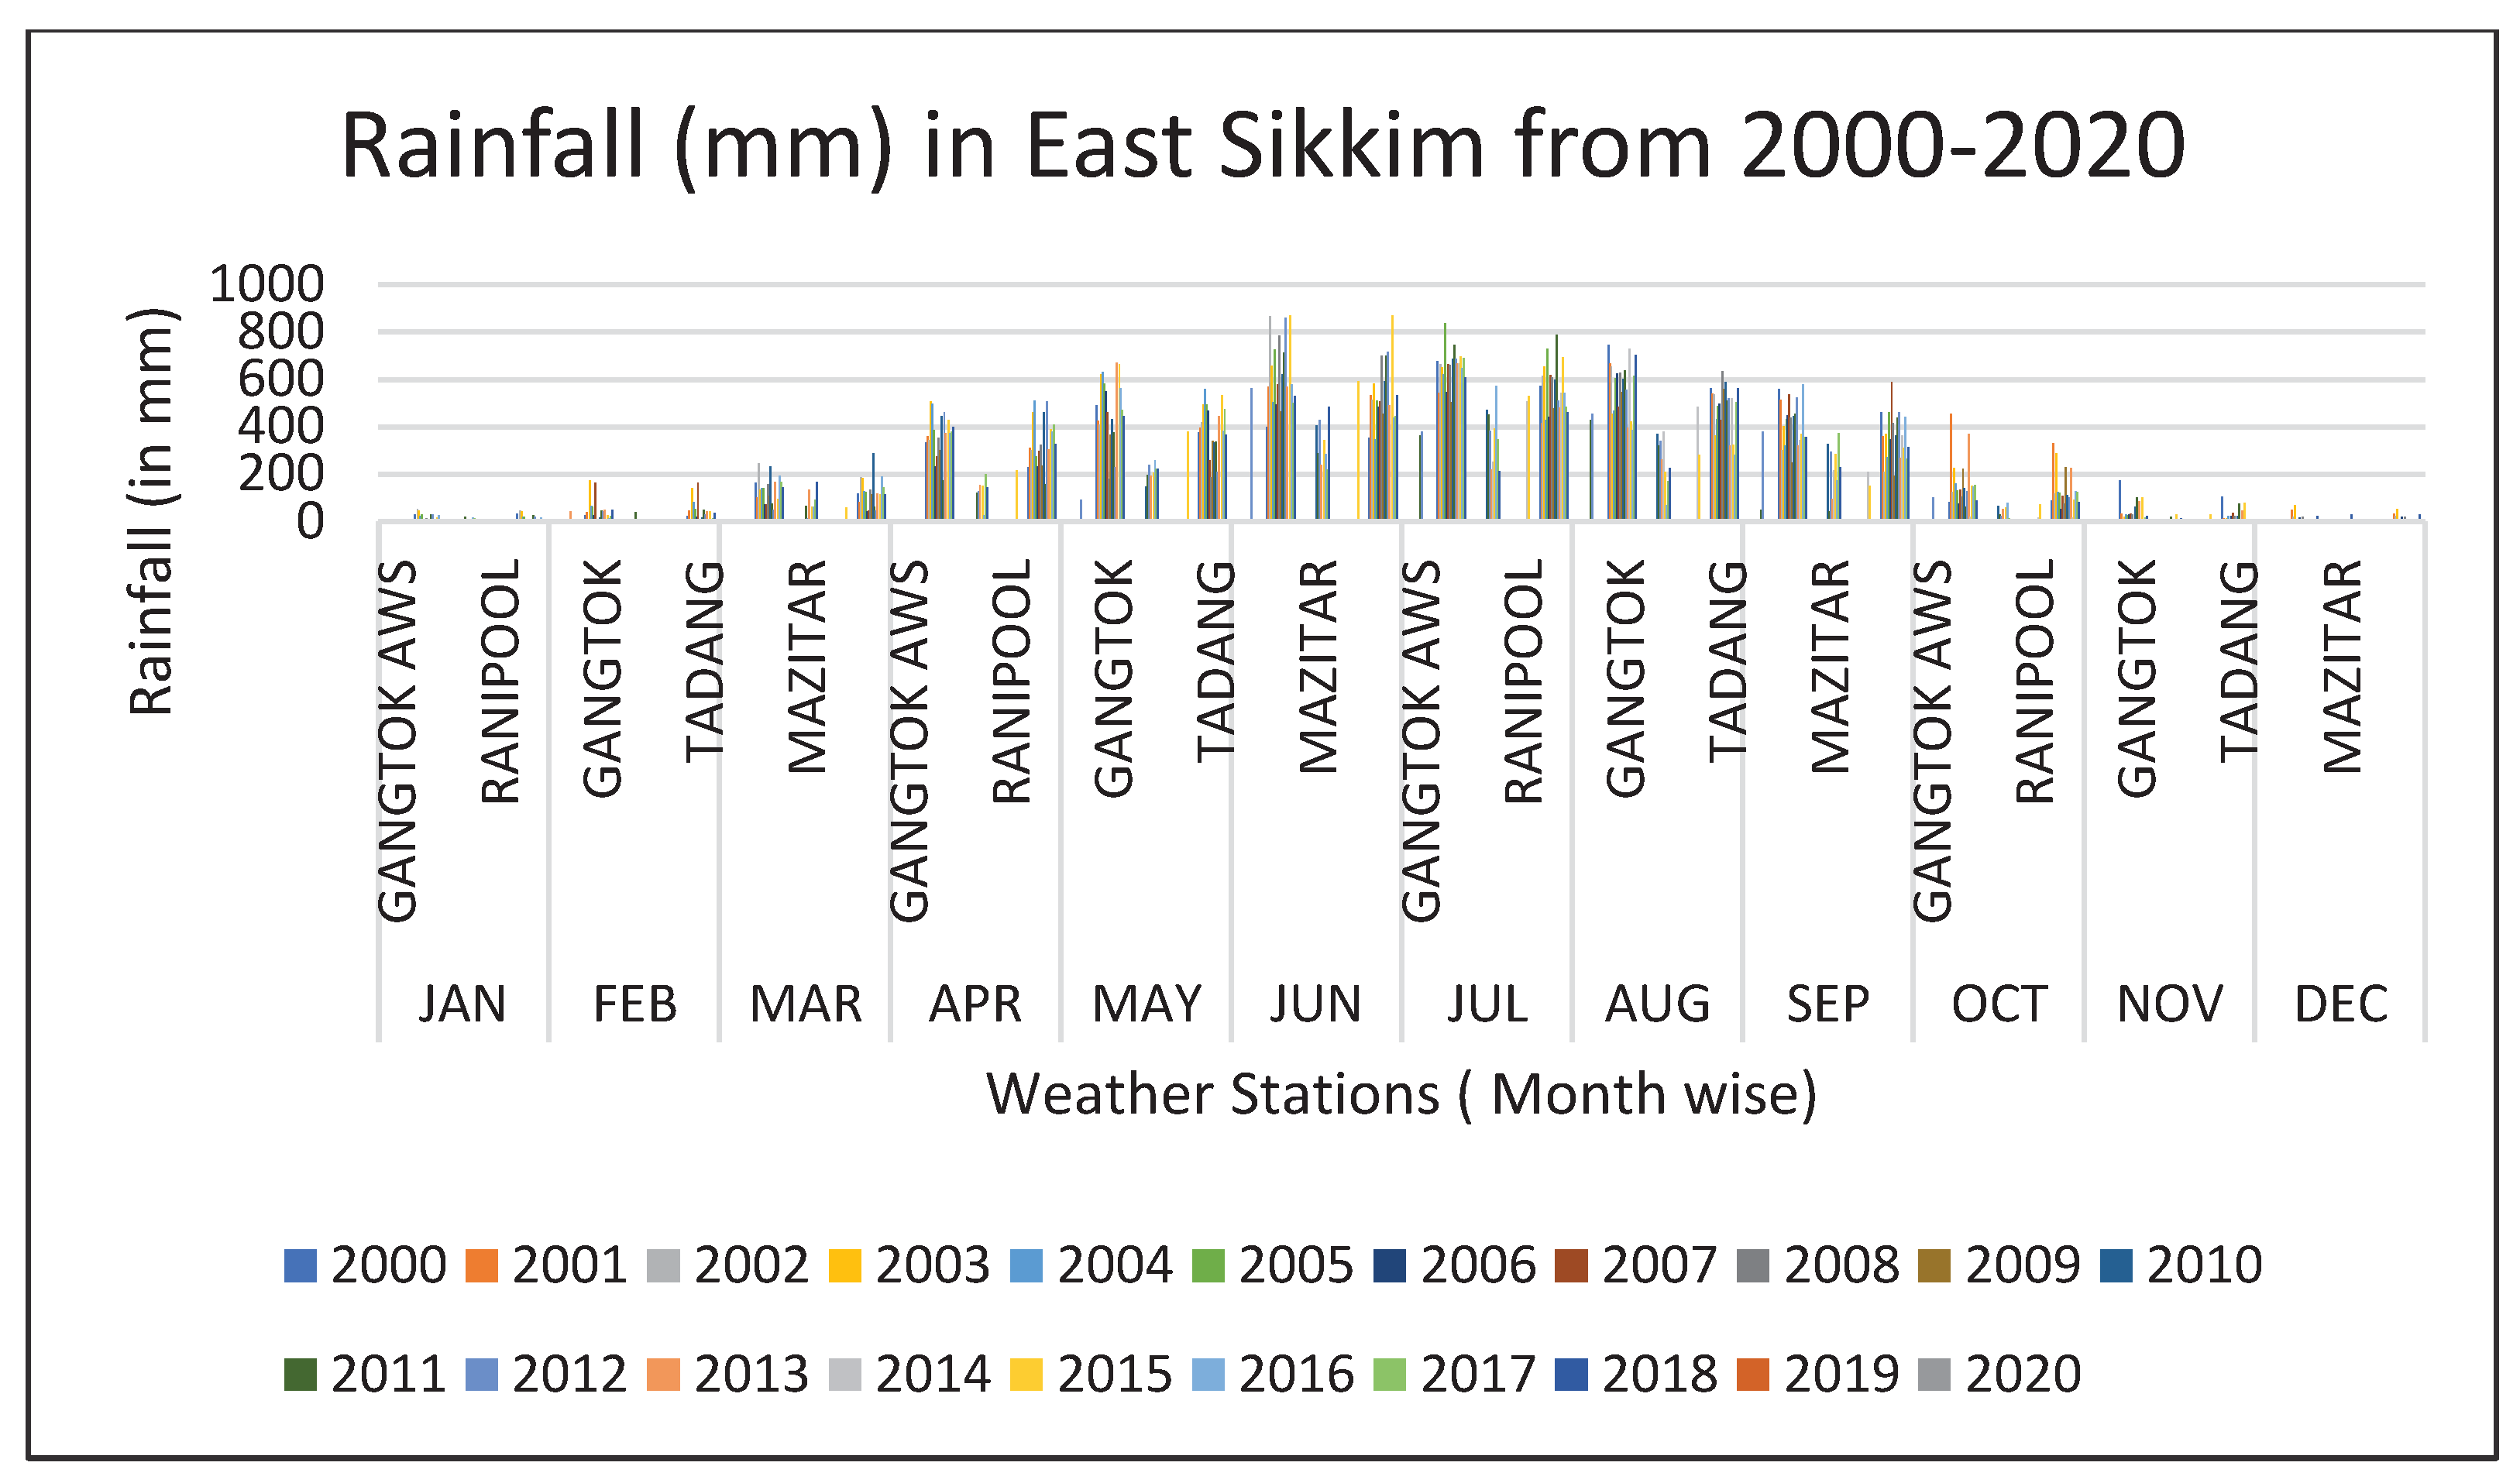
Figure 3.
Schematic diagram shows the landslide susceptibility map development.
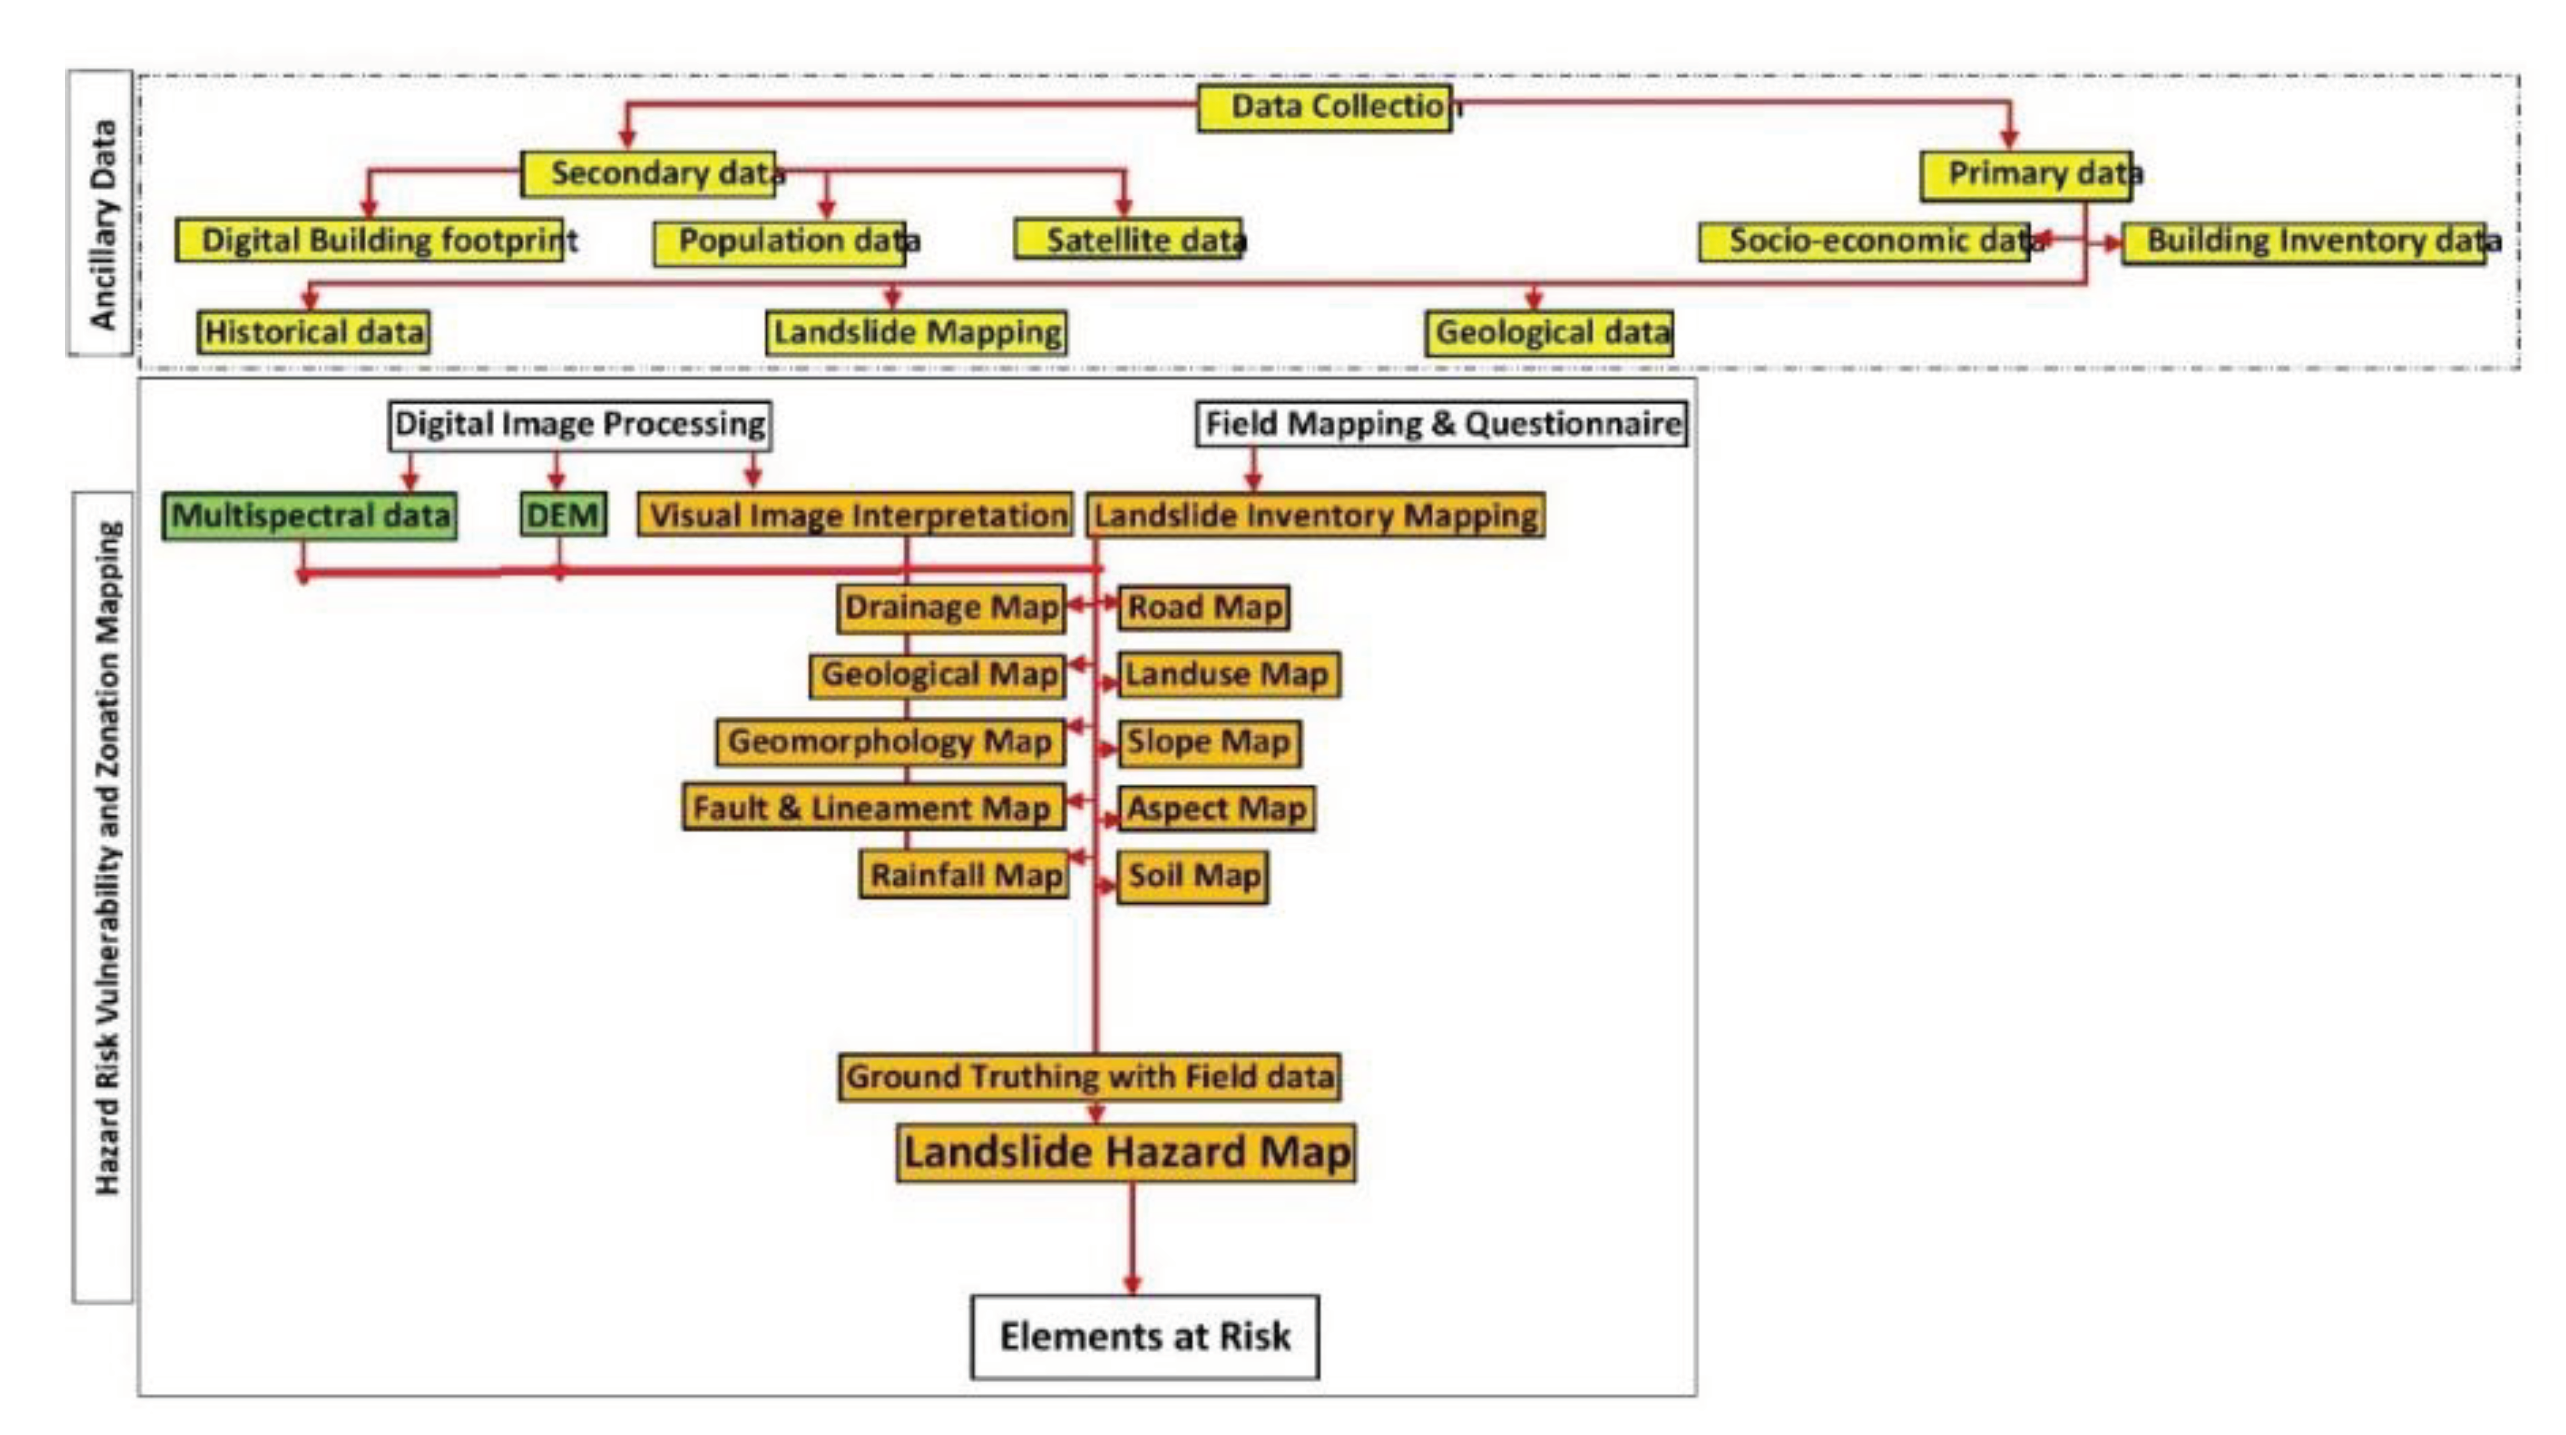
Figure 4.
Photographs during field investigation (a) Affected houses due to Pachey Slide (b) debris flow at Qu Khola Slide (c) Teen taal Slide (d) Devasted vegetation (e) Vulnerable settlements in the Valley (f) Kit Golai Slide (g)Vulnerable road construction (h) Fragile lithology.
Figure 4.
Photographs during field investigation (a) Affected houses due to Pachey Slide (b) debris flow at Qu Khola Slide (c) Teen taal Slide (d) Devasted vegetation (e) Vulnerable settlements in the Valley (f) Kit Golai Slide (g)Vulnerable road construction (h) Fragile lithology.
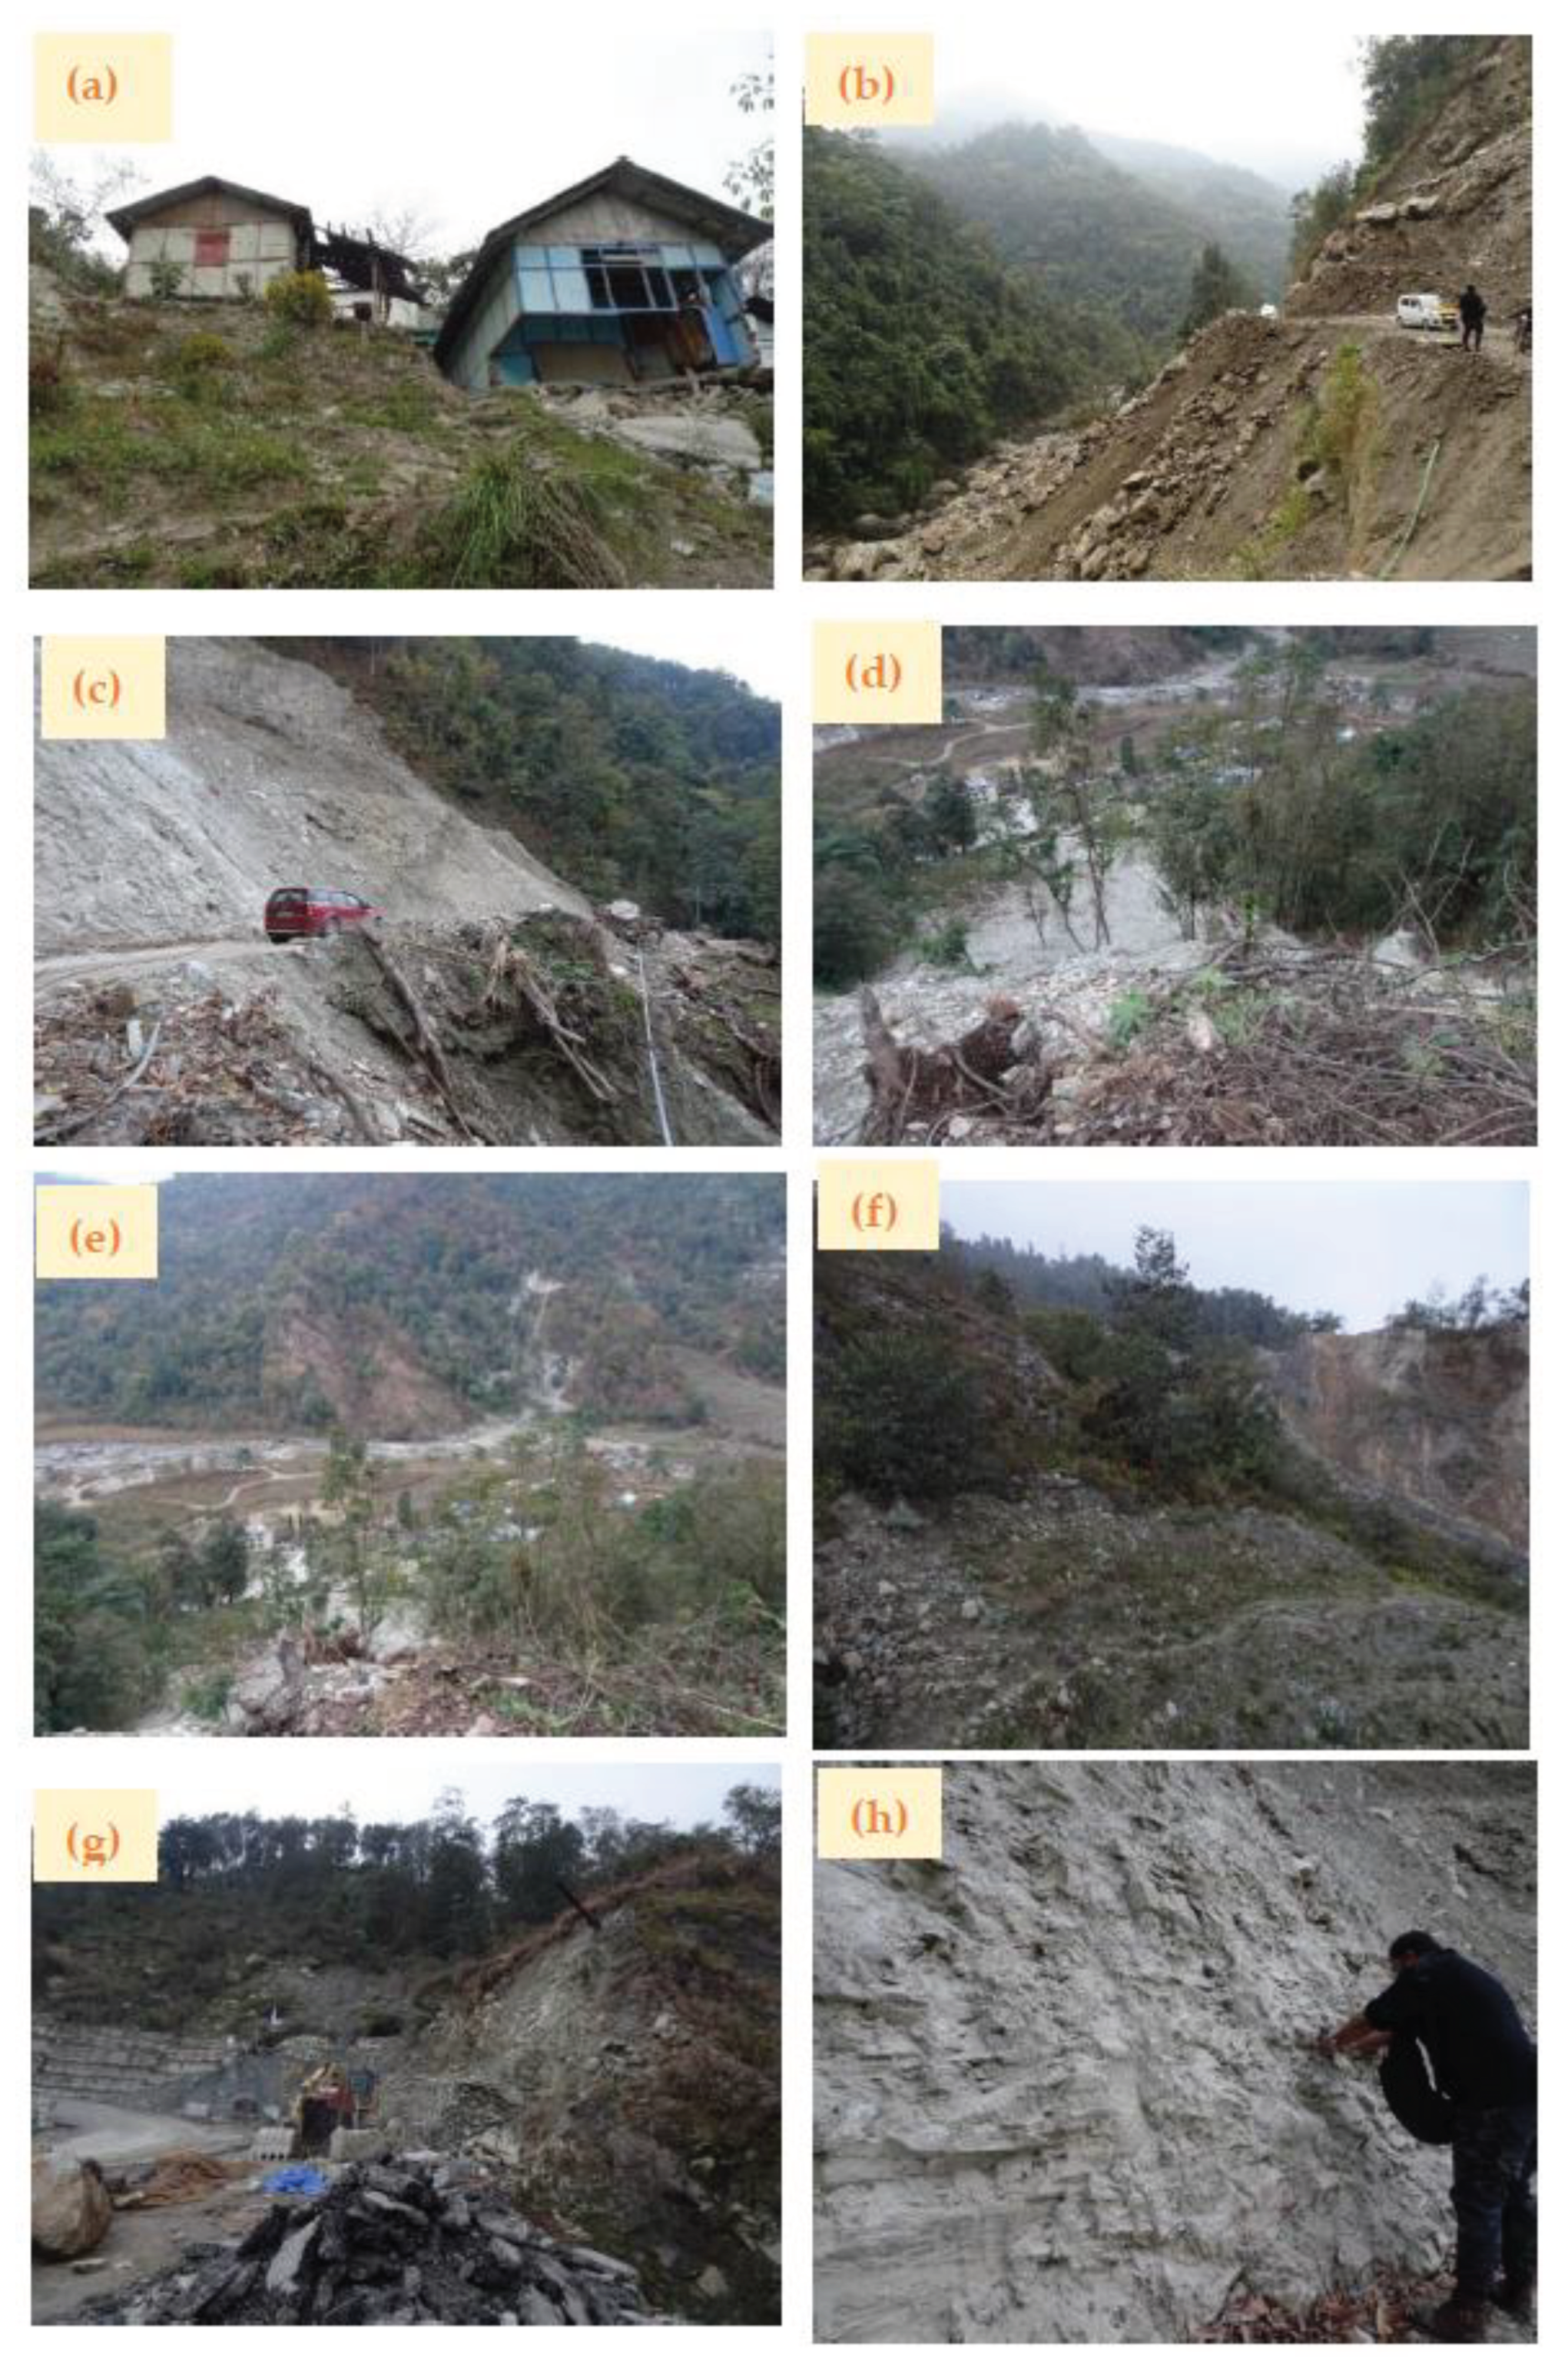
Figure 5.
(a) Map showing Landslide Polygon Inventory (b) Map showing sources of Landslide Inventory.
Figure 5.
(a) Map showing Landslide Polygon Inventory (b) Map showing sources of Landslide Inventory.
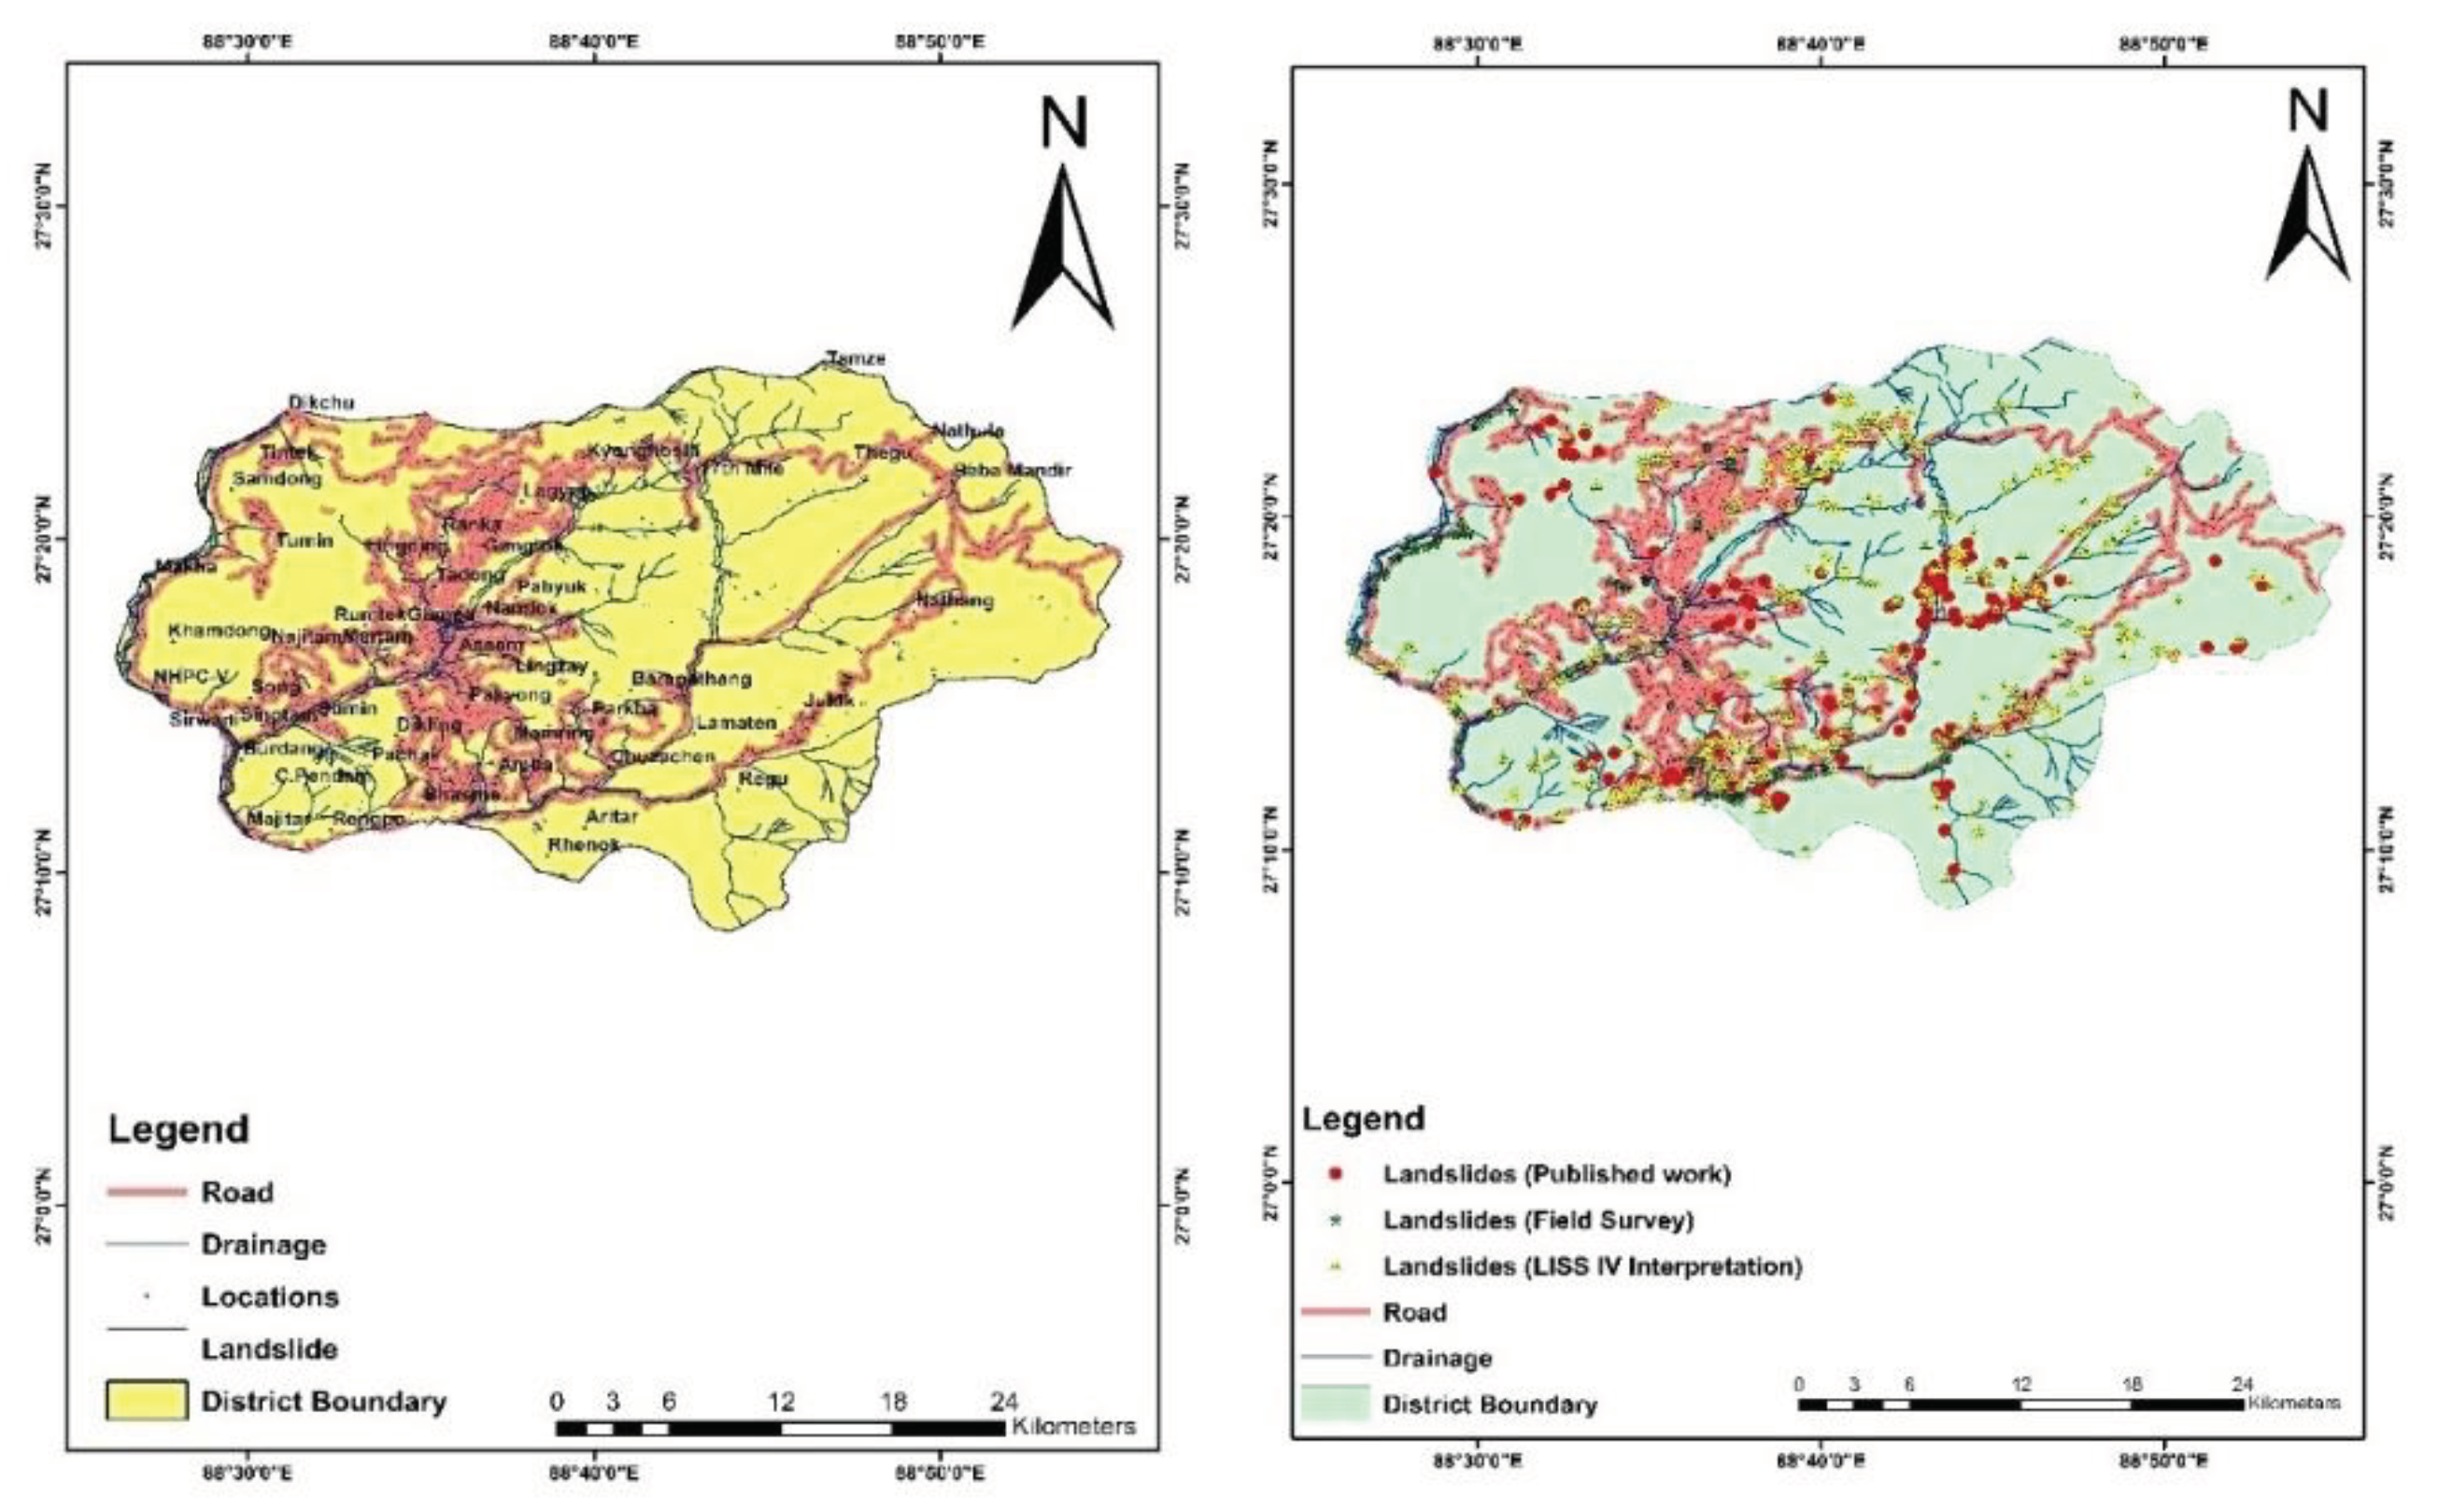
Figure 6.
Map Showing (a) Slope angle (b) Slope aspect (c) Elevation (d) Curvature (e) Plan Curvature (f) Profile Curvature (g) TWI (h) Lithology (i) Seismotectonic.
Figure 6.
Map Showing (a) Slope angle (b) Slope aspect (c) Elevation (d) Curvature (e) Plan Curvature (f) Profile Curvature (g) TWI (h) Lithology (i) Seismotectonic.
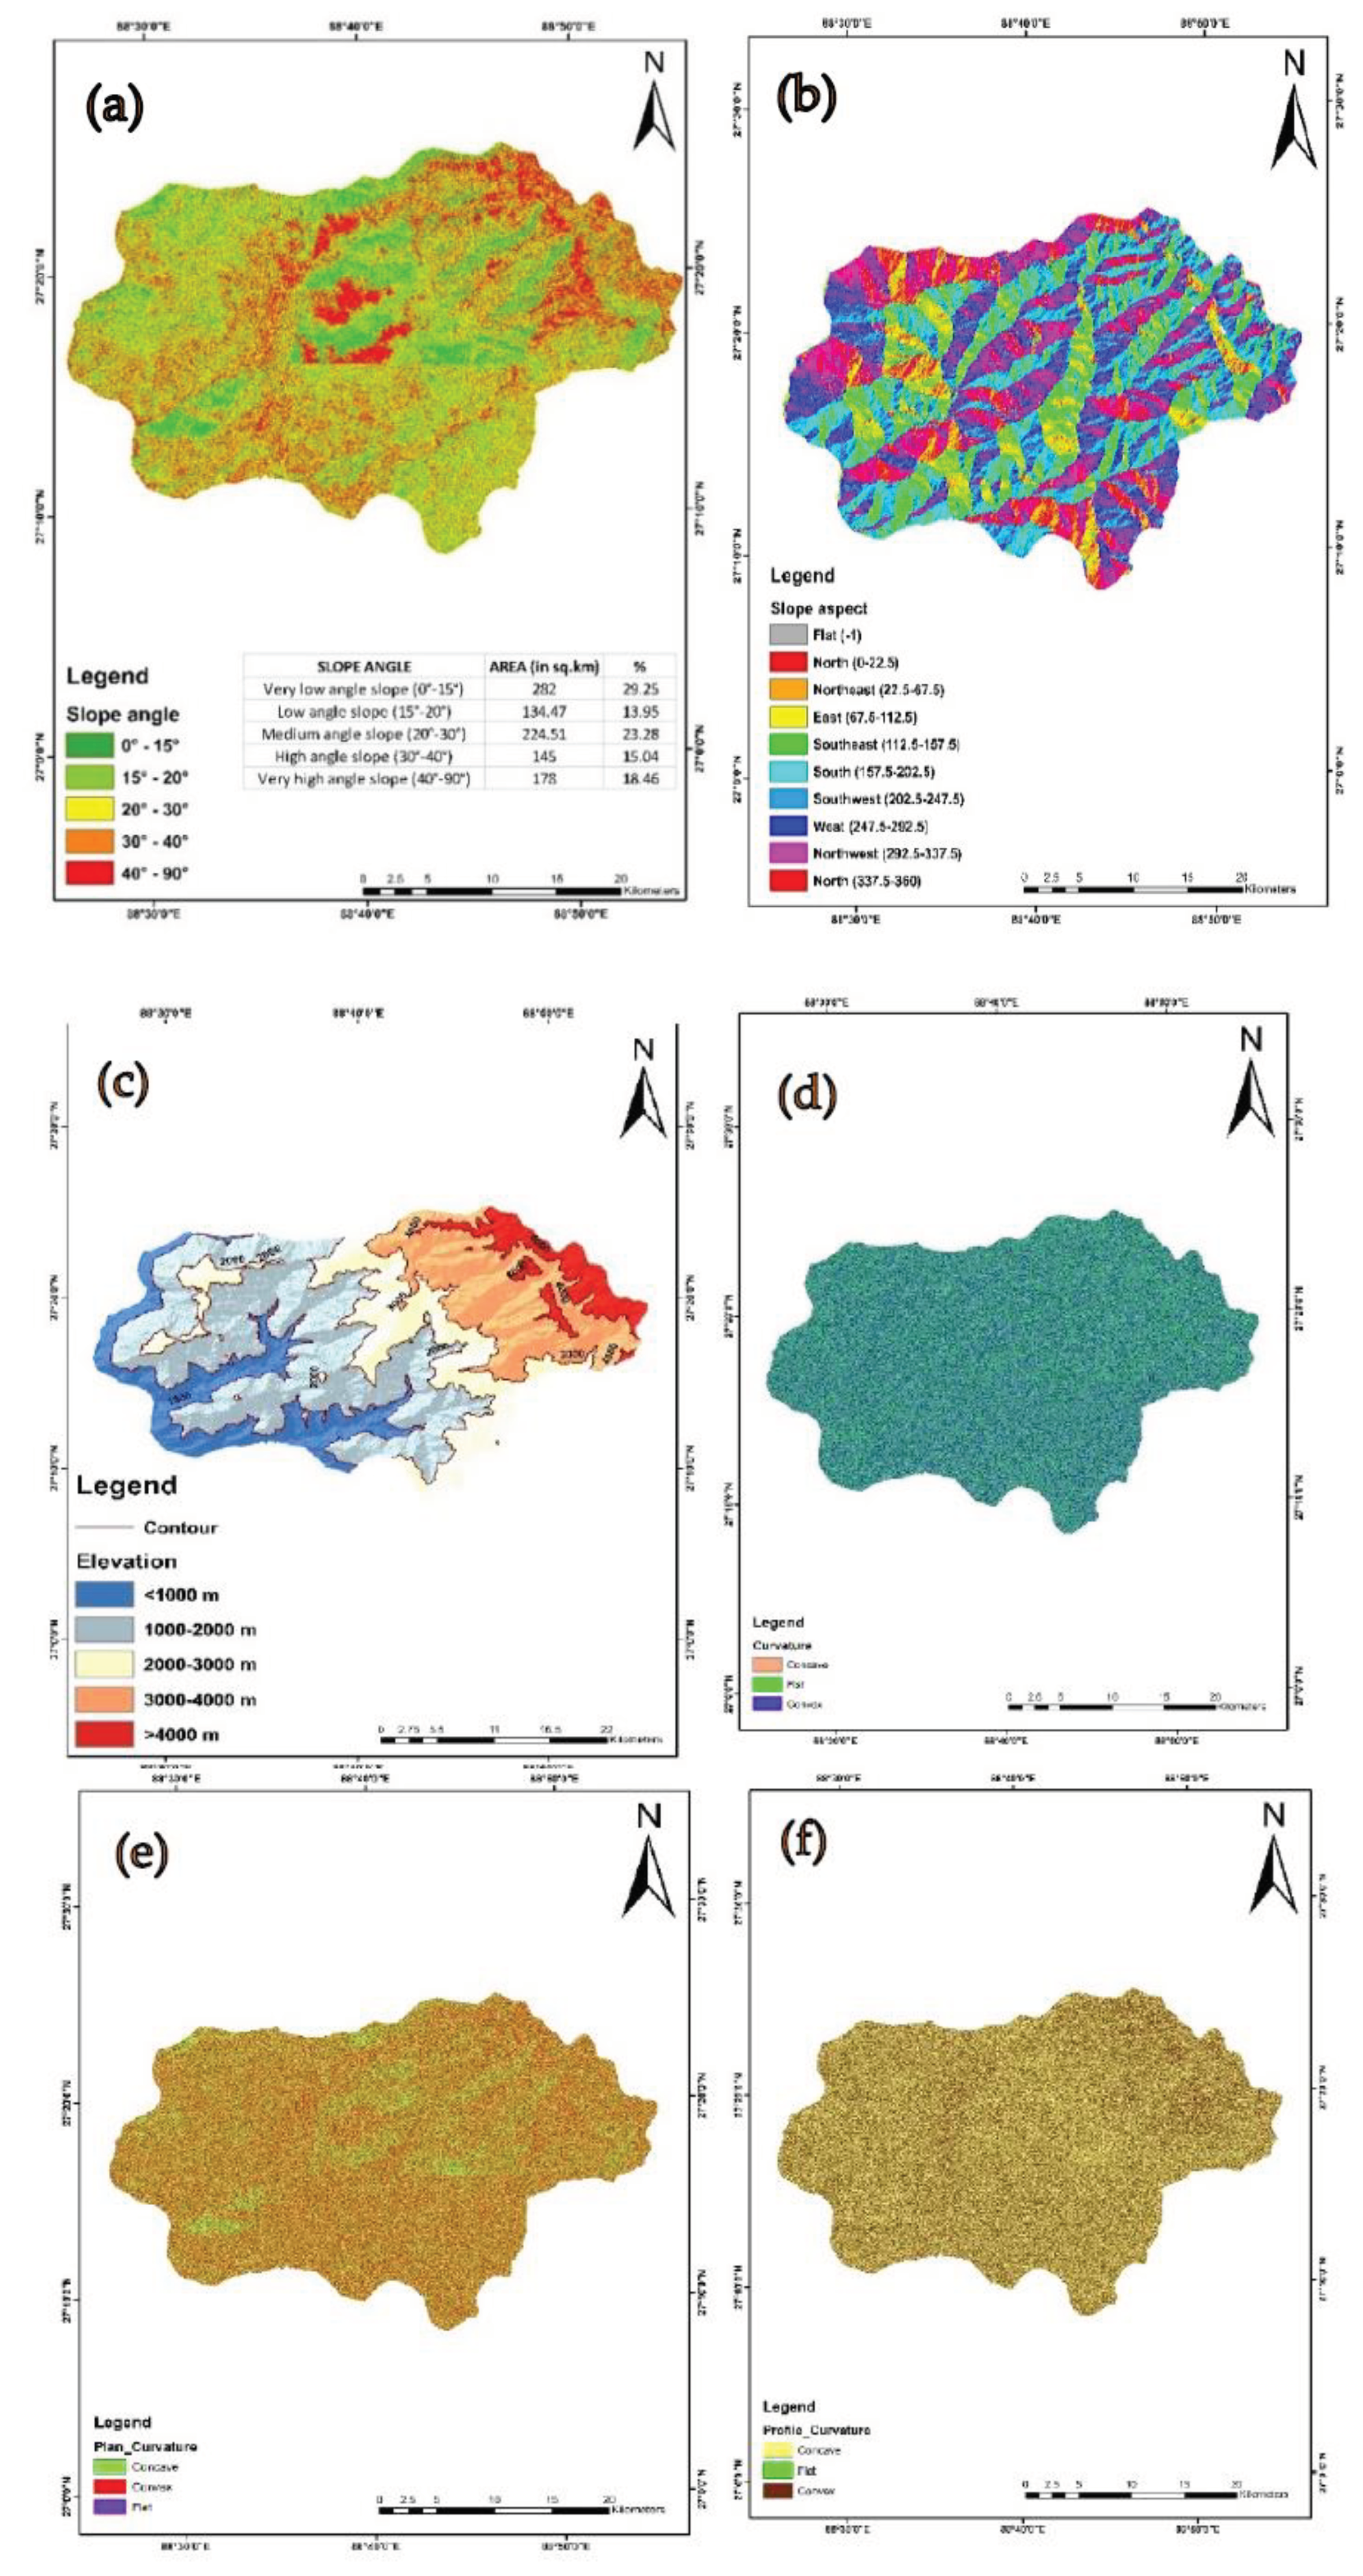
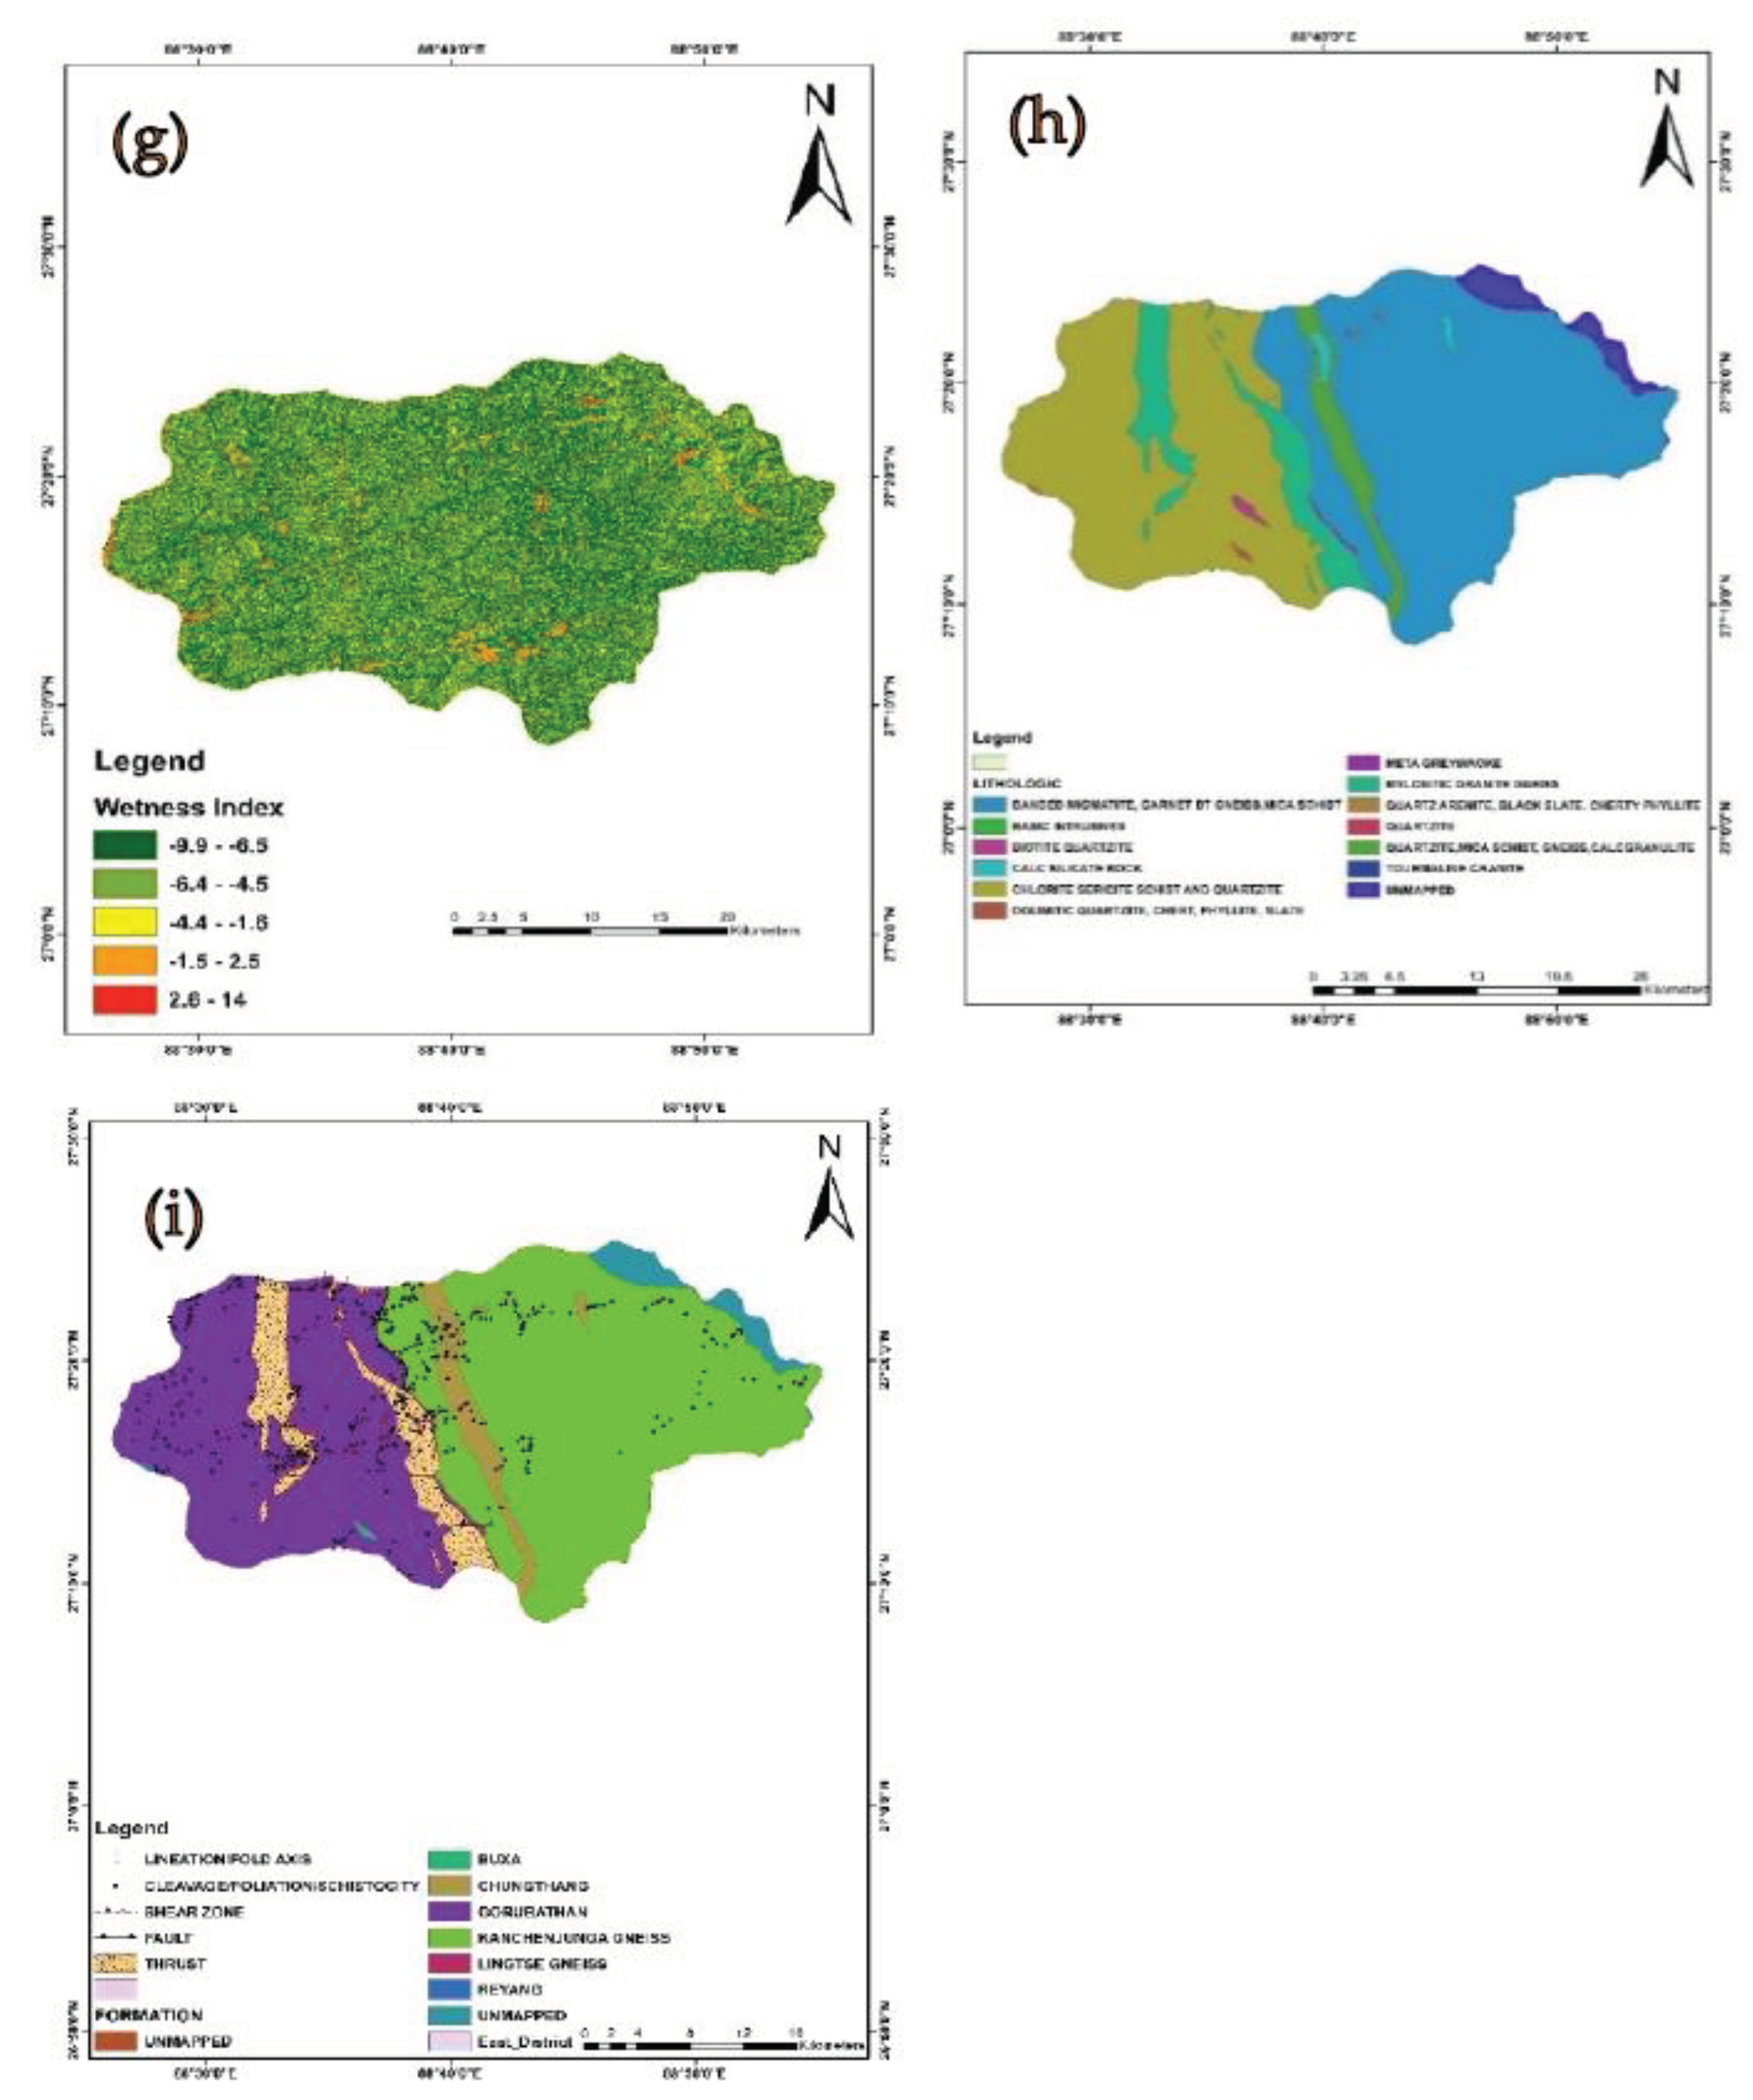
Figure 7.
Map showing (a) NDVI (b) Rainfall (c) Drainage density.
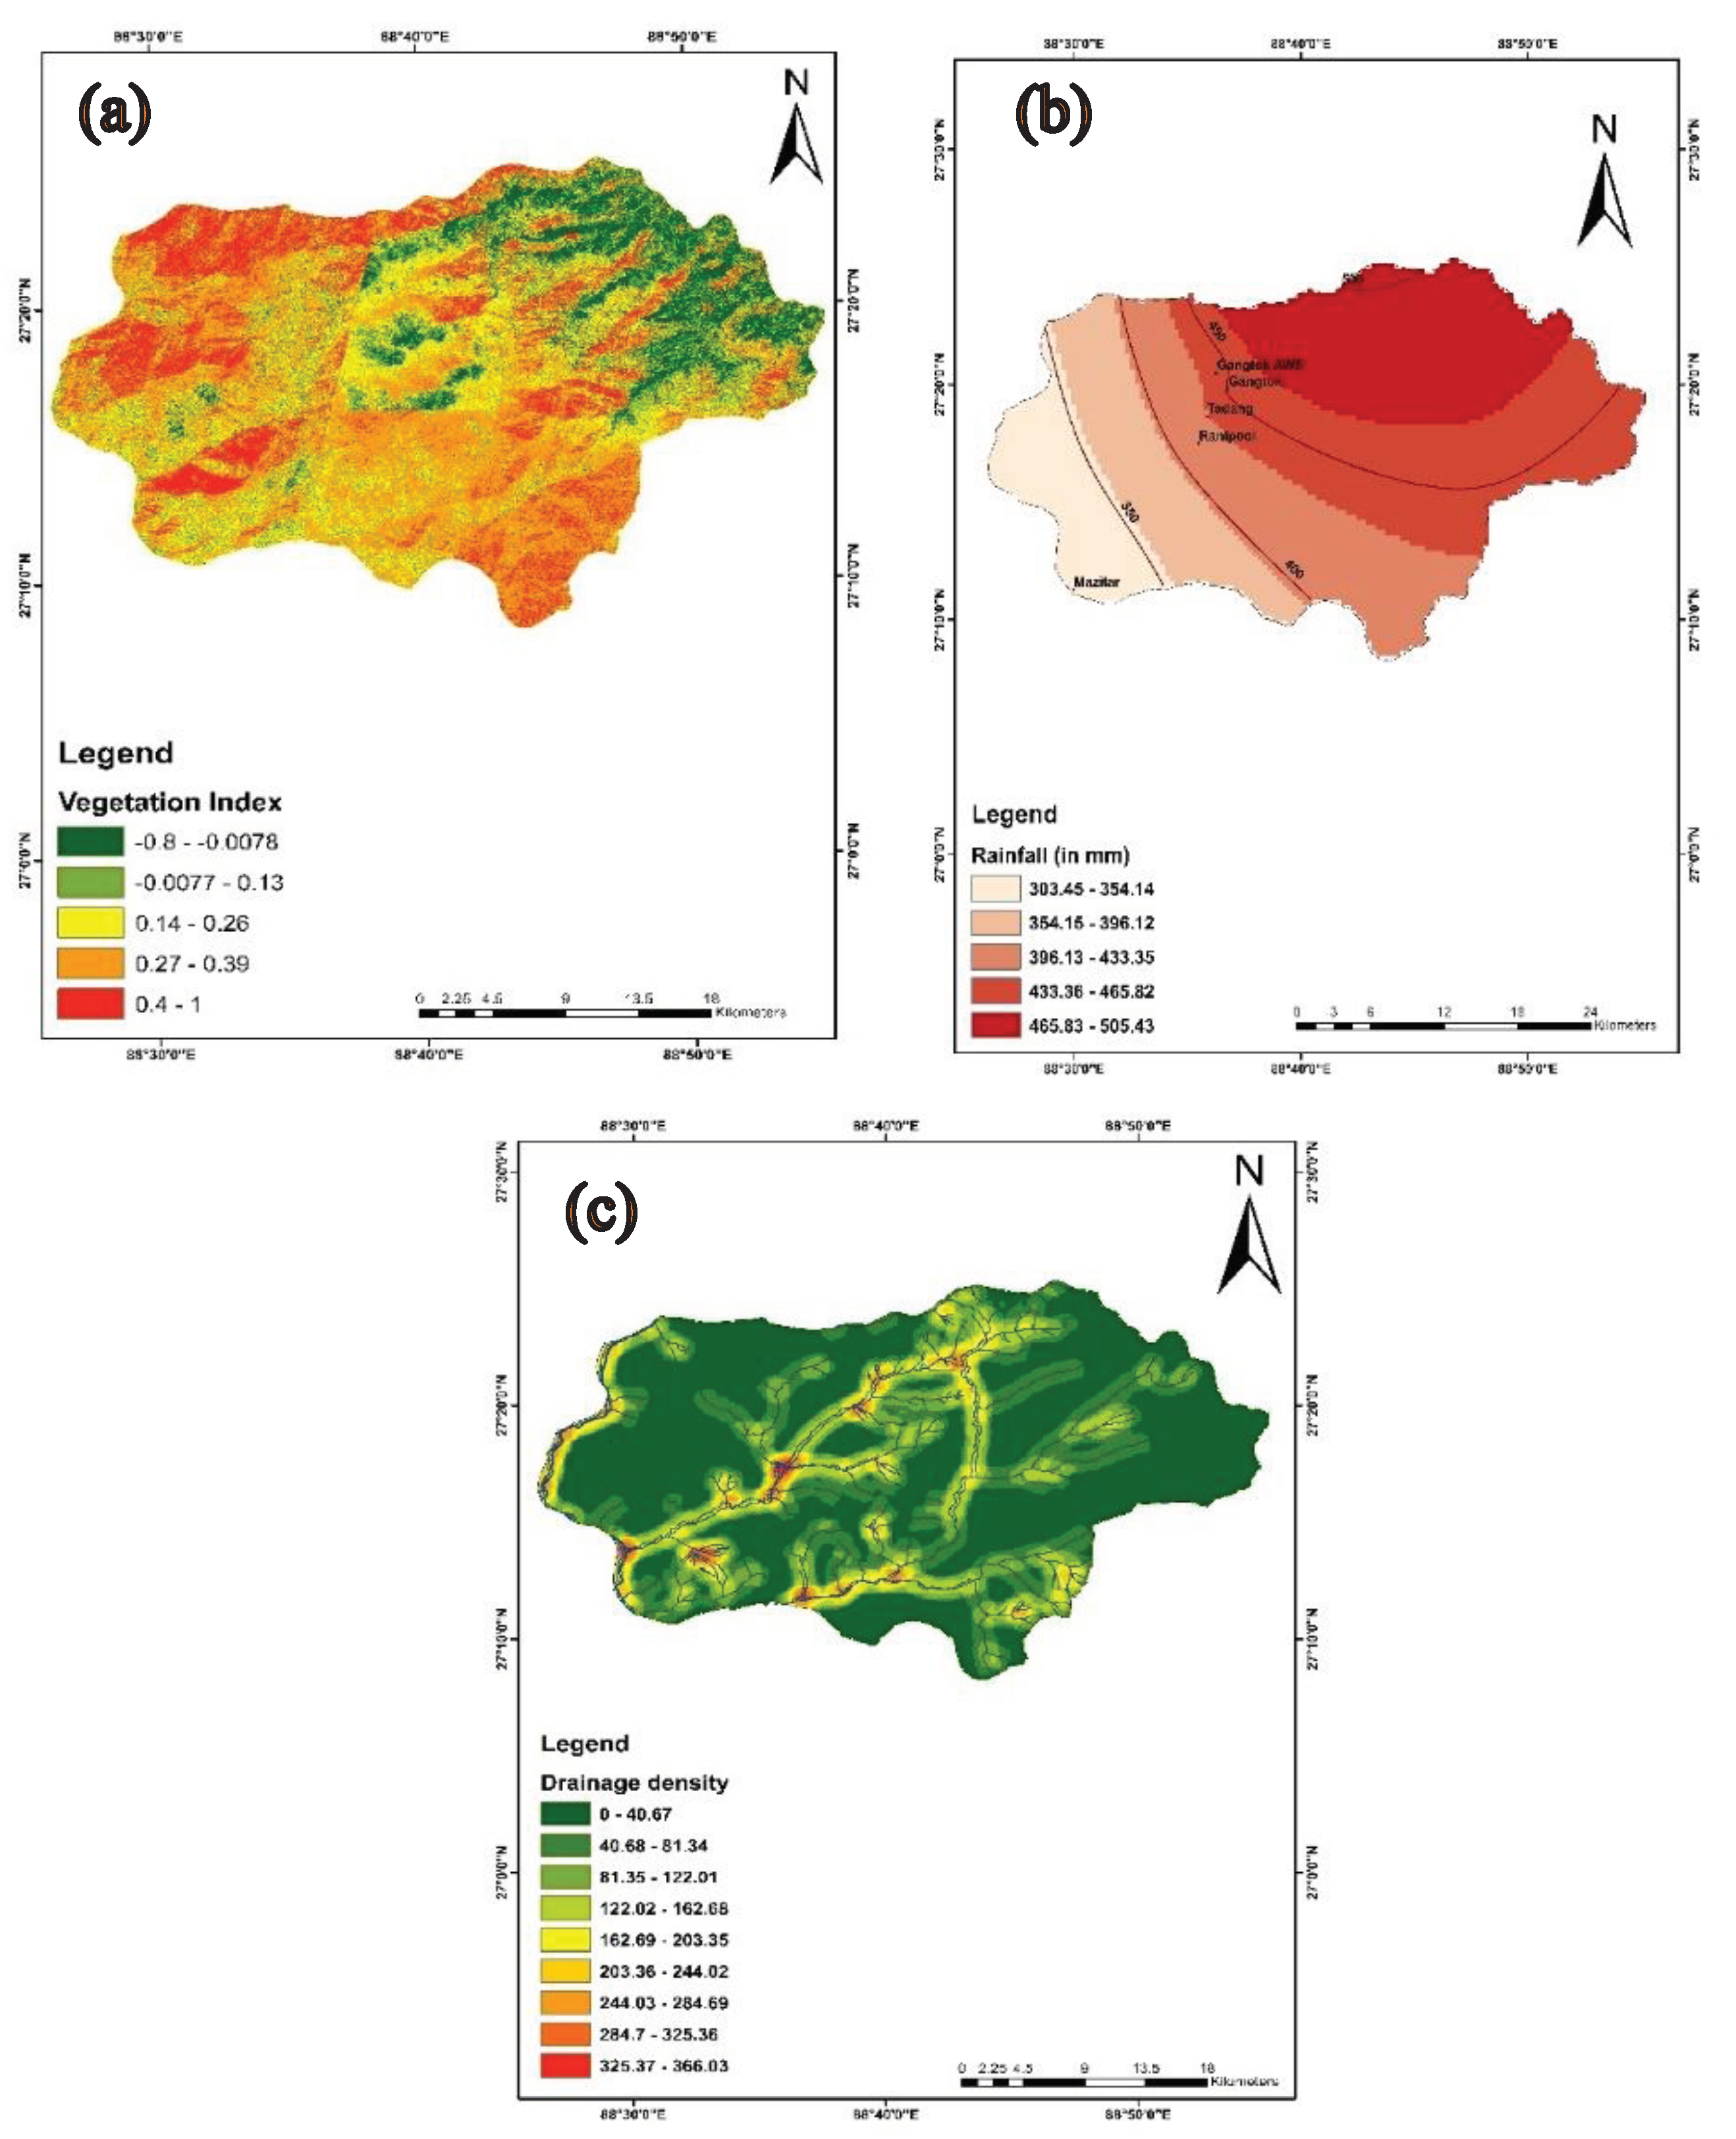
Figure 8.
Map showing (a) LULC (b) Drainage Proximity (c) Road Proximity.
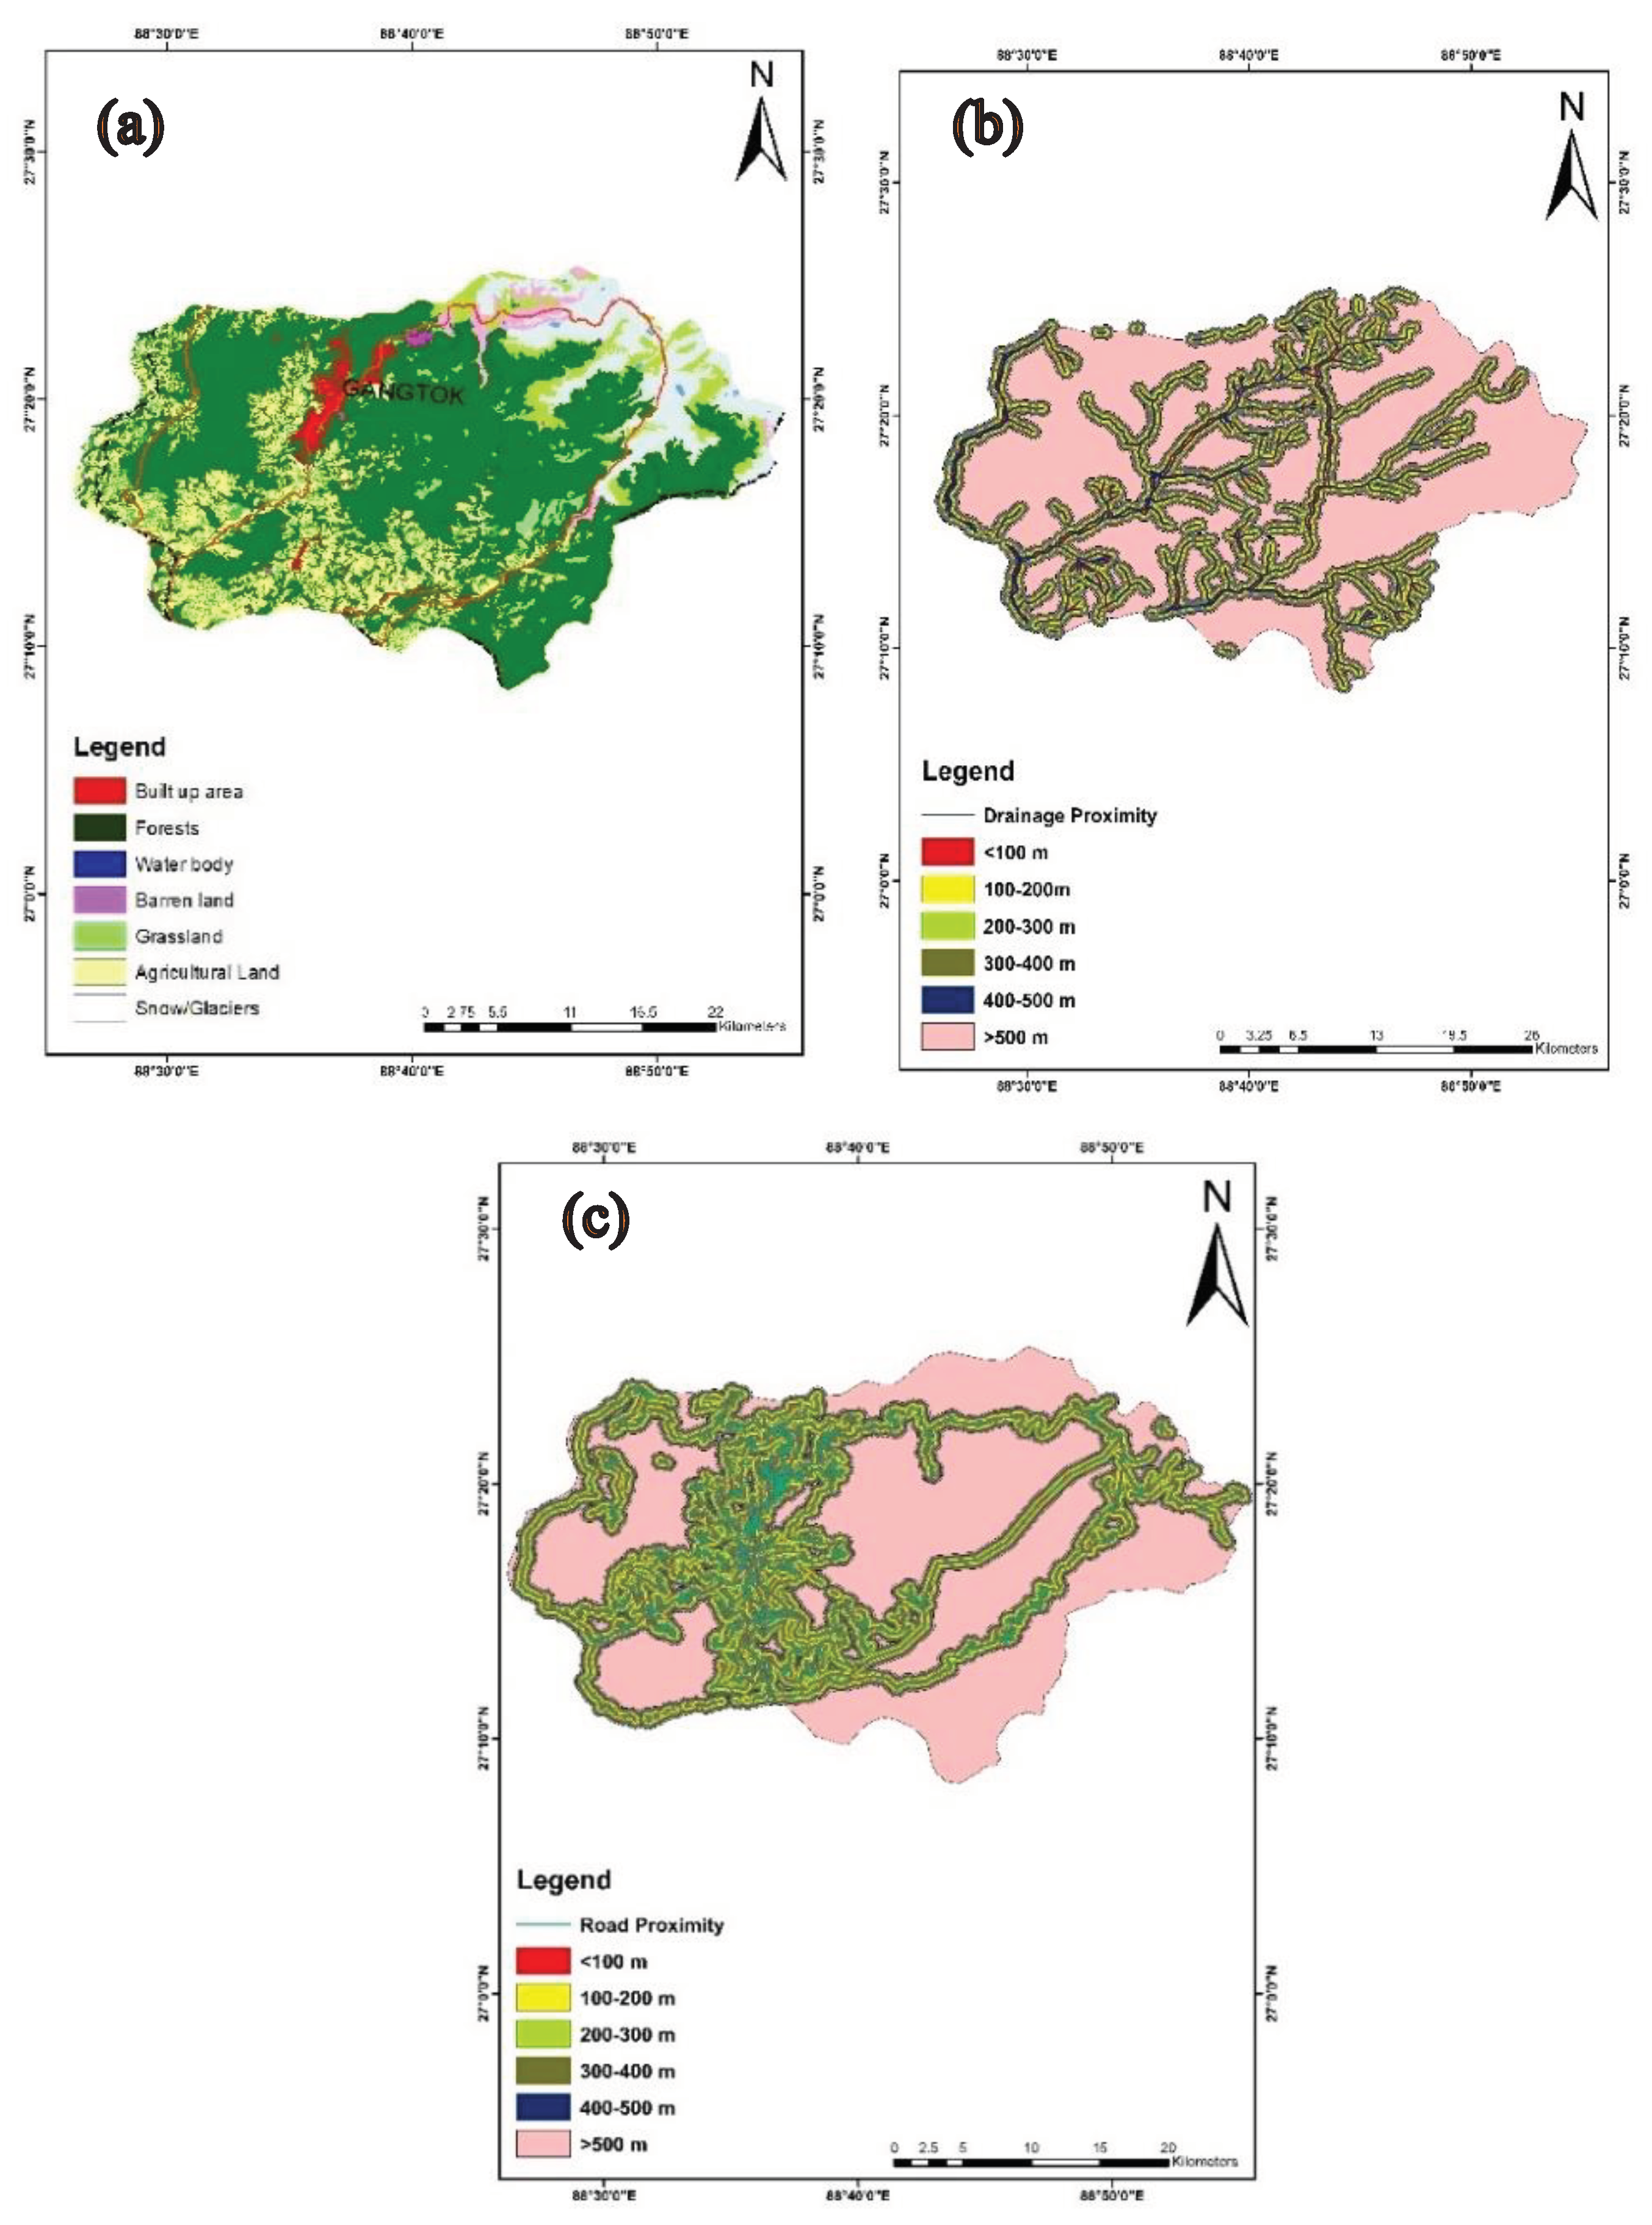
Figure 9.
Landslide Susceptibility Map using IVM Model of the study area.
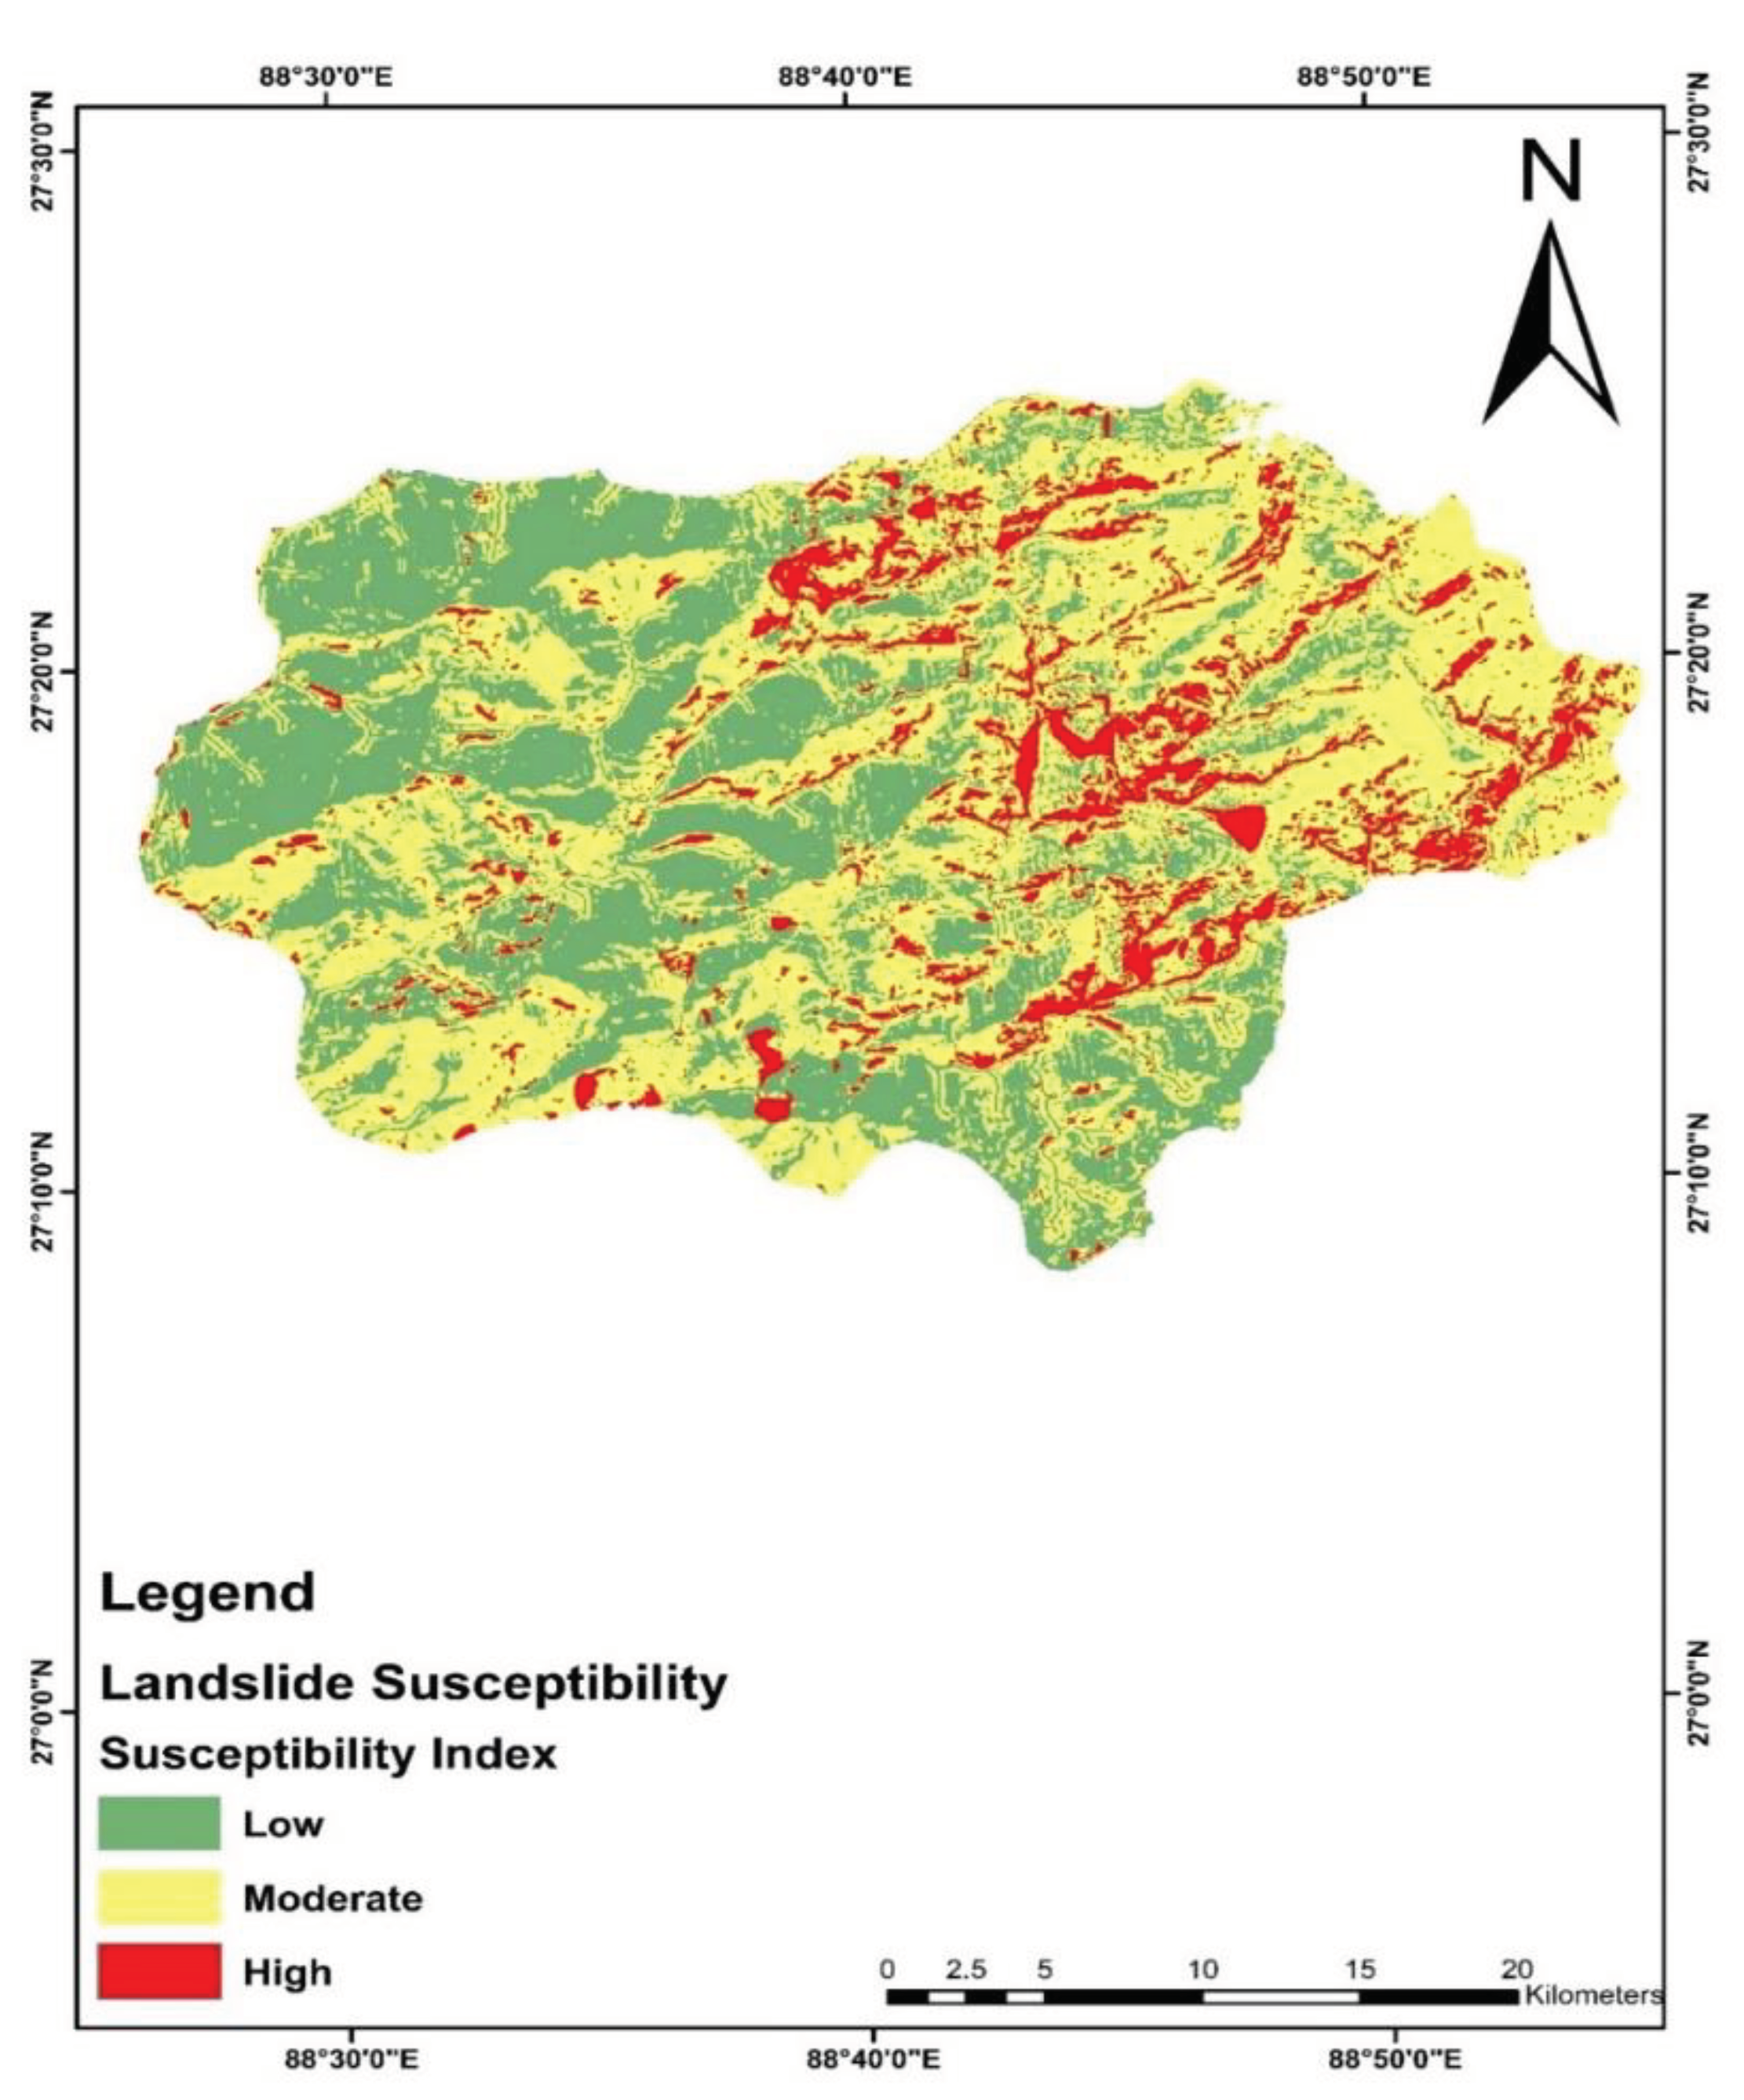
Figure 10.
Landslide Susceptibility area variation in the research region.
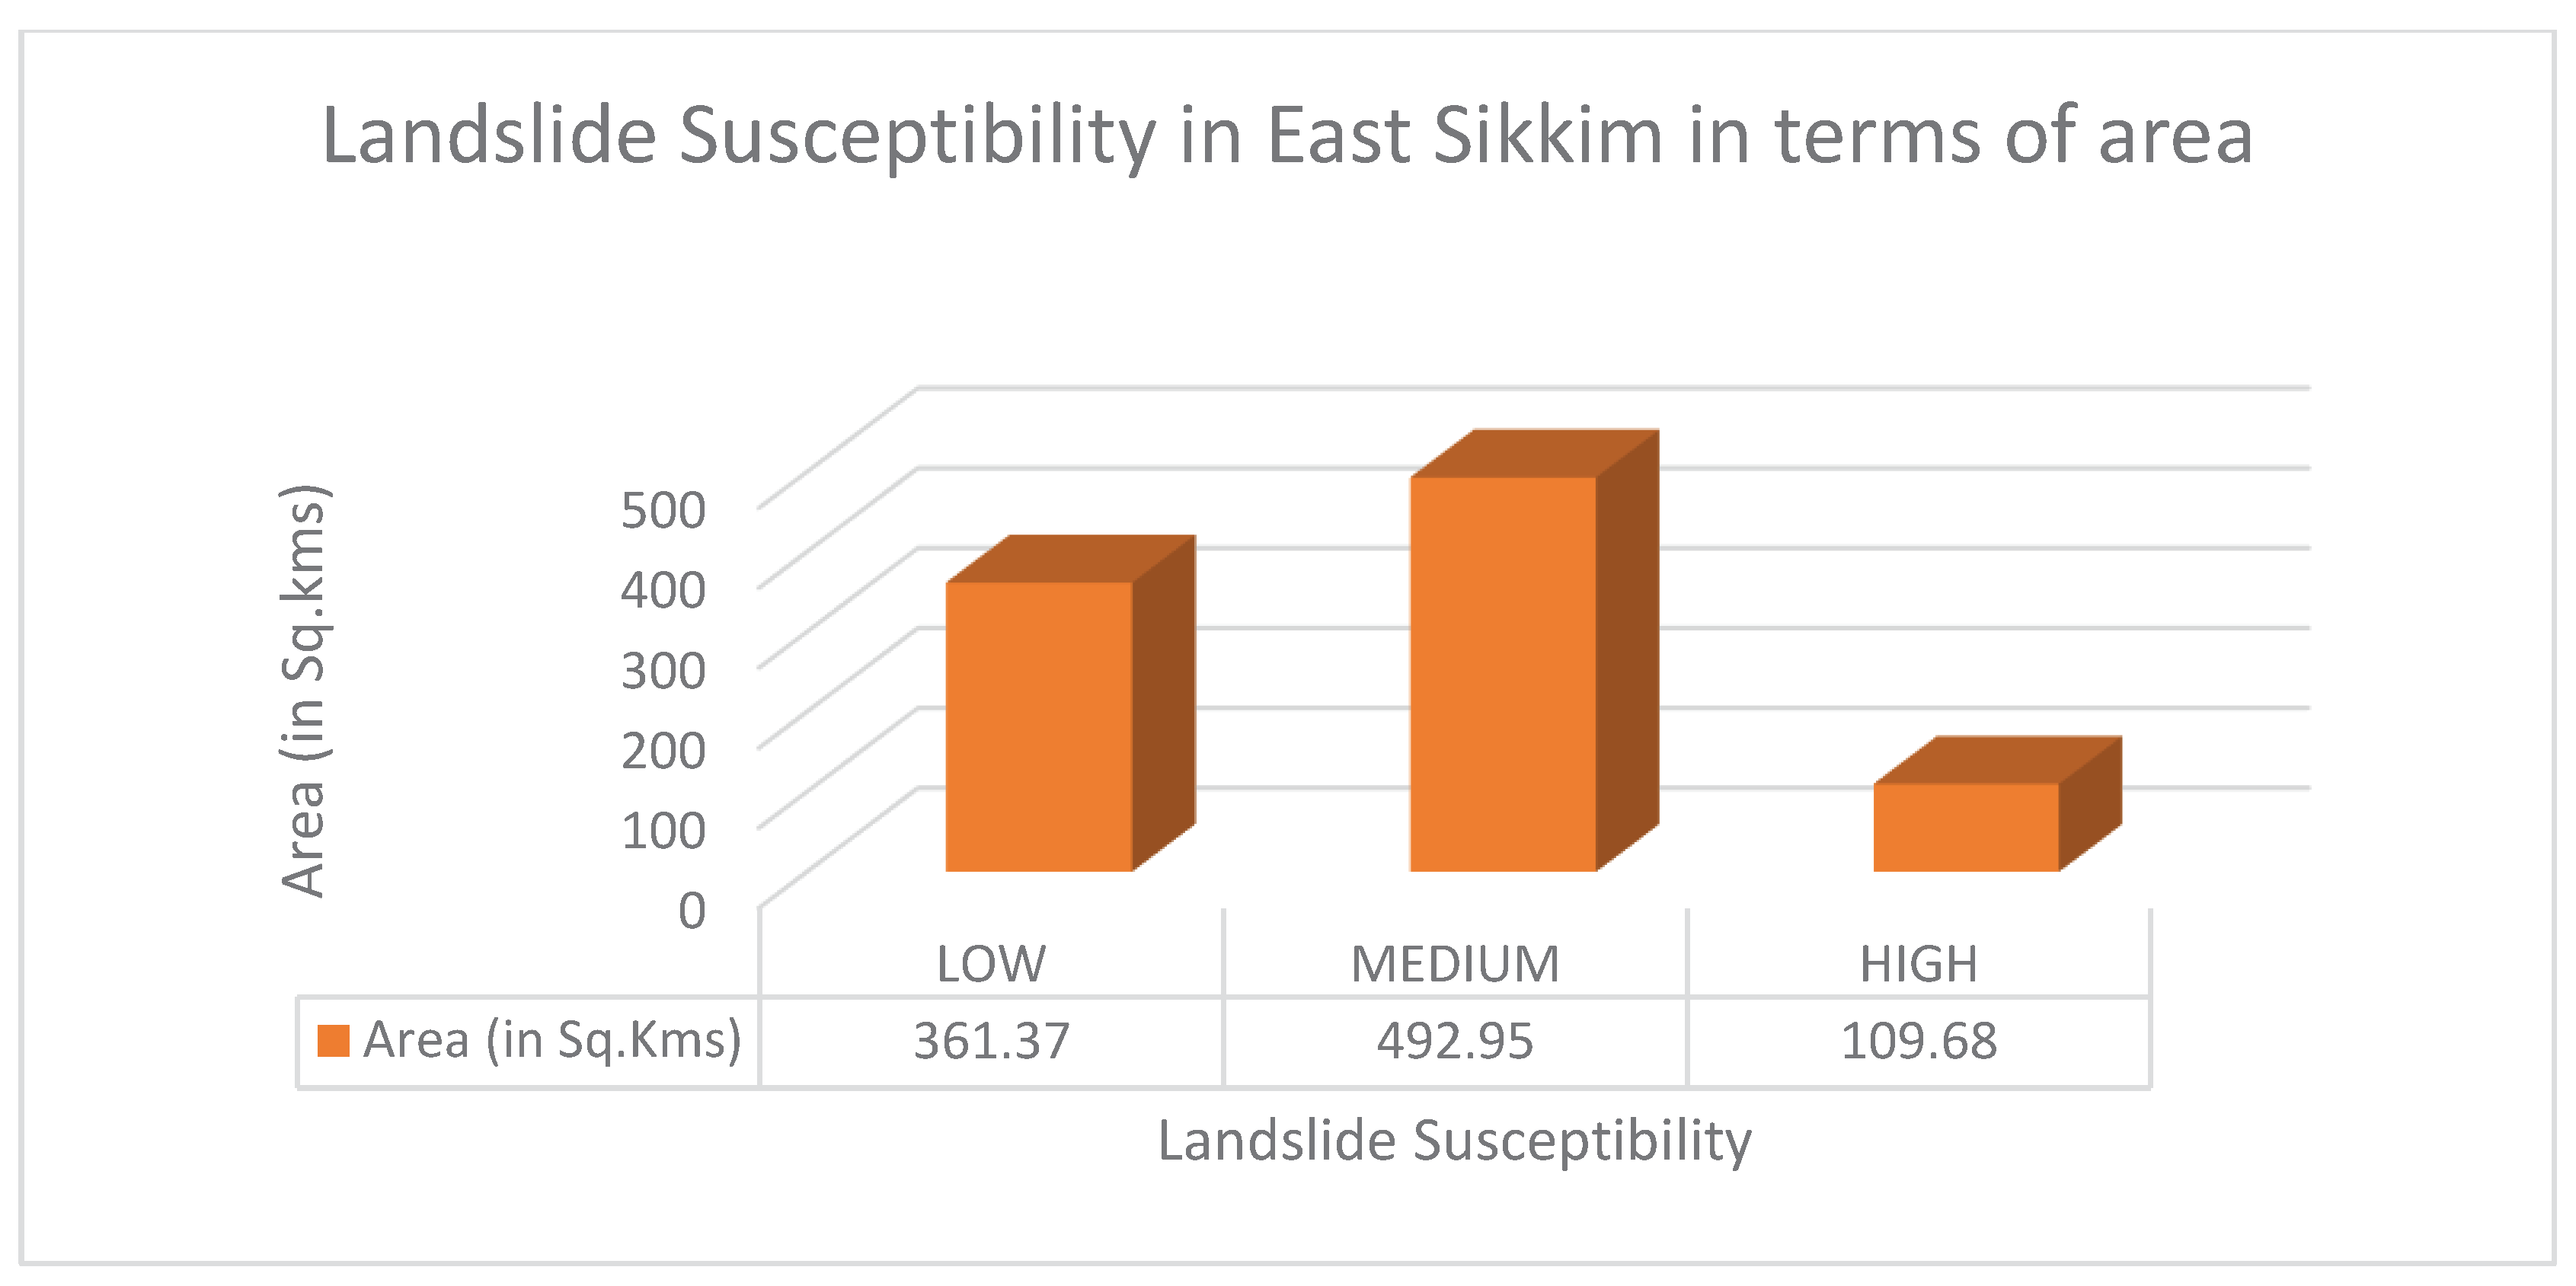
Figure 11.
Landslide Susceptibility percentage variation in the research region.
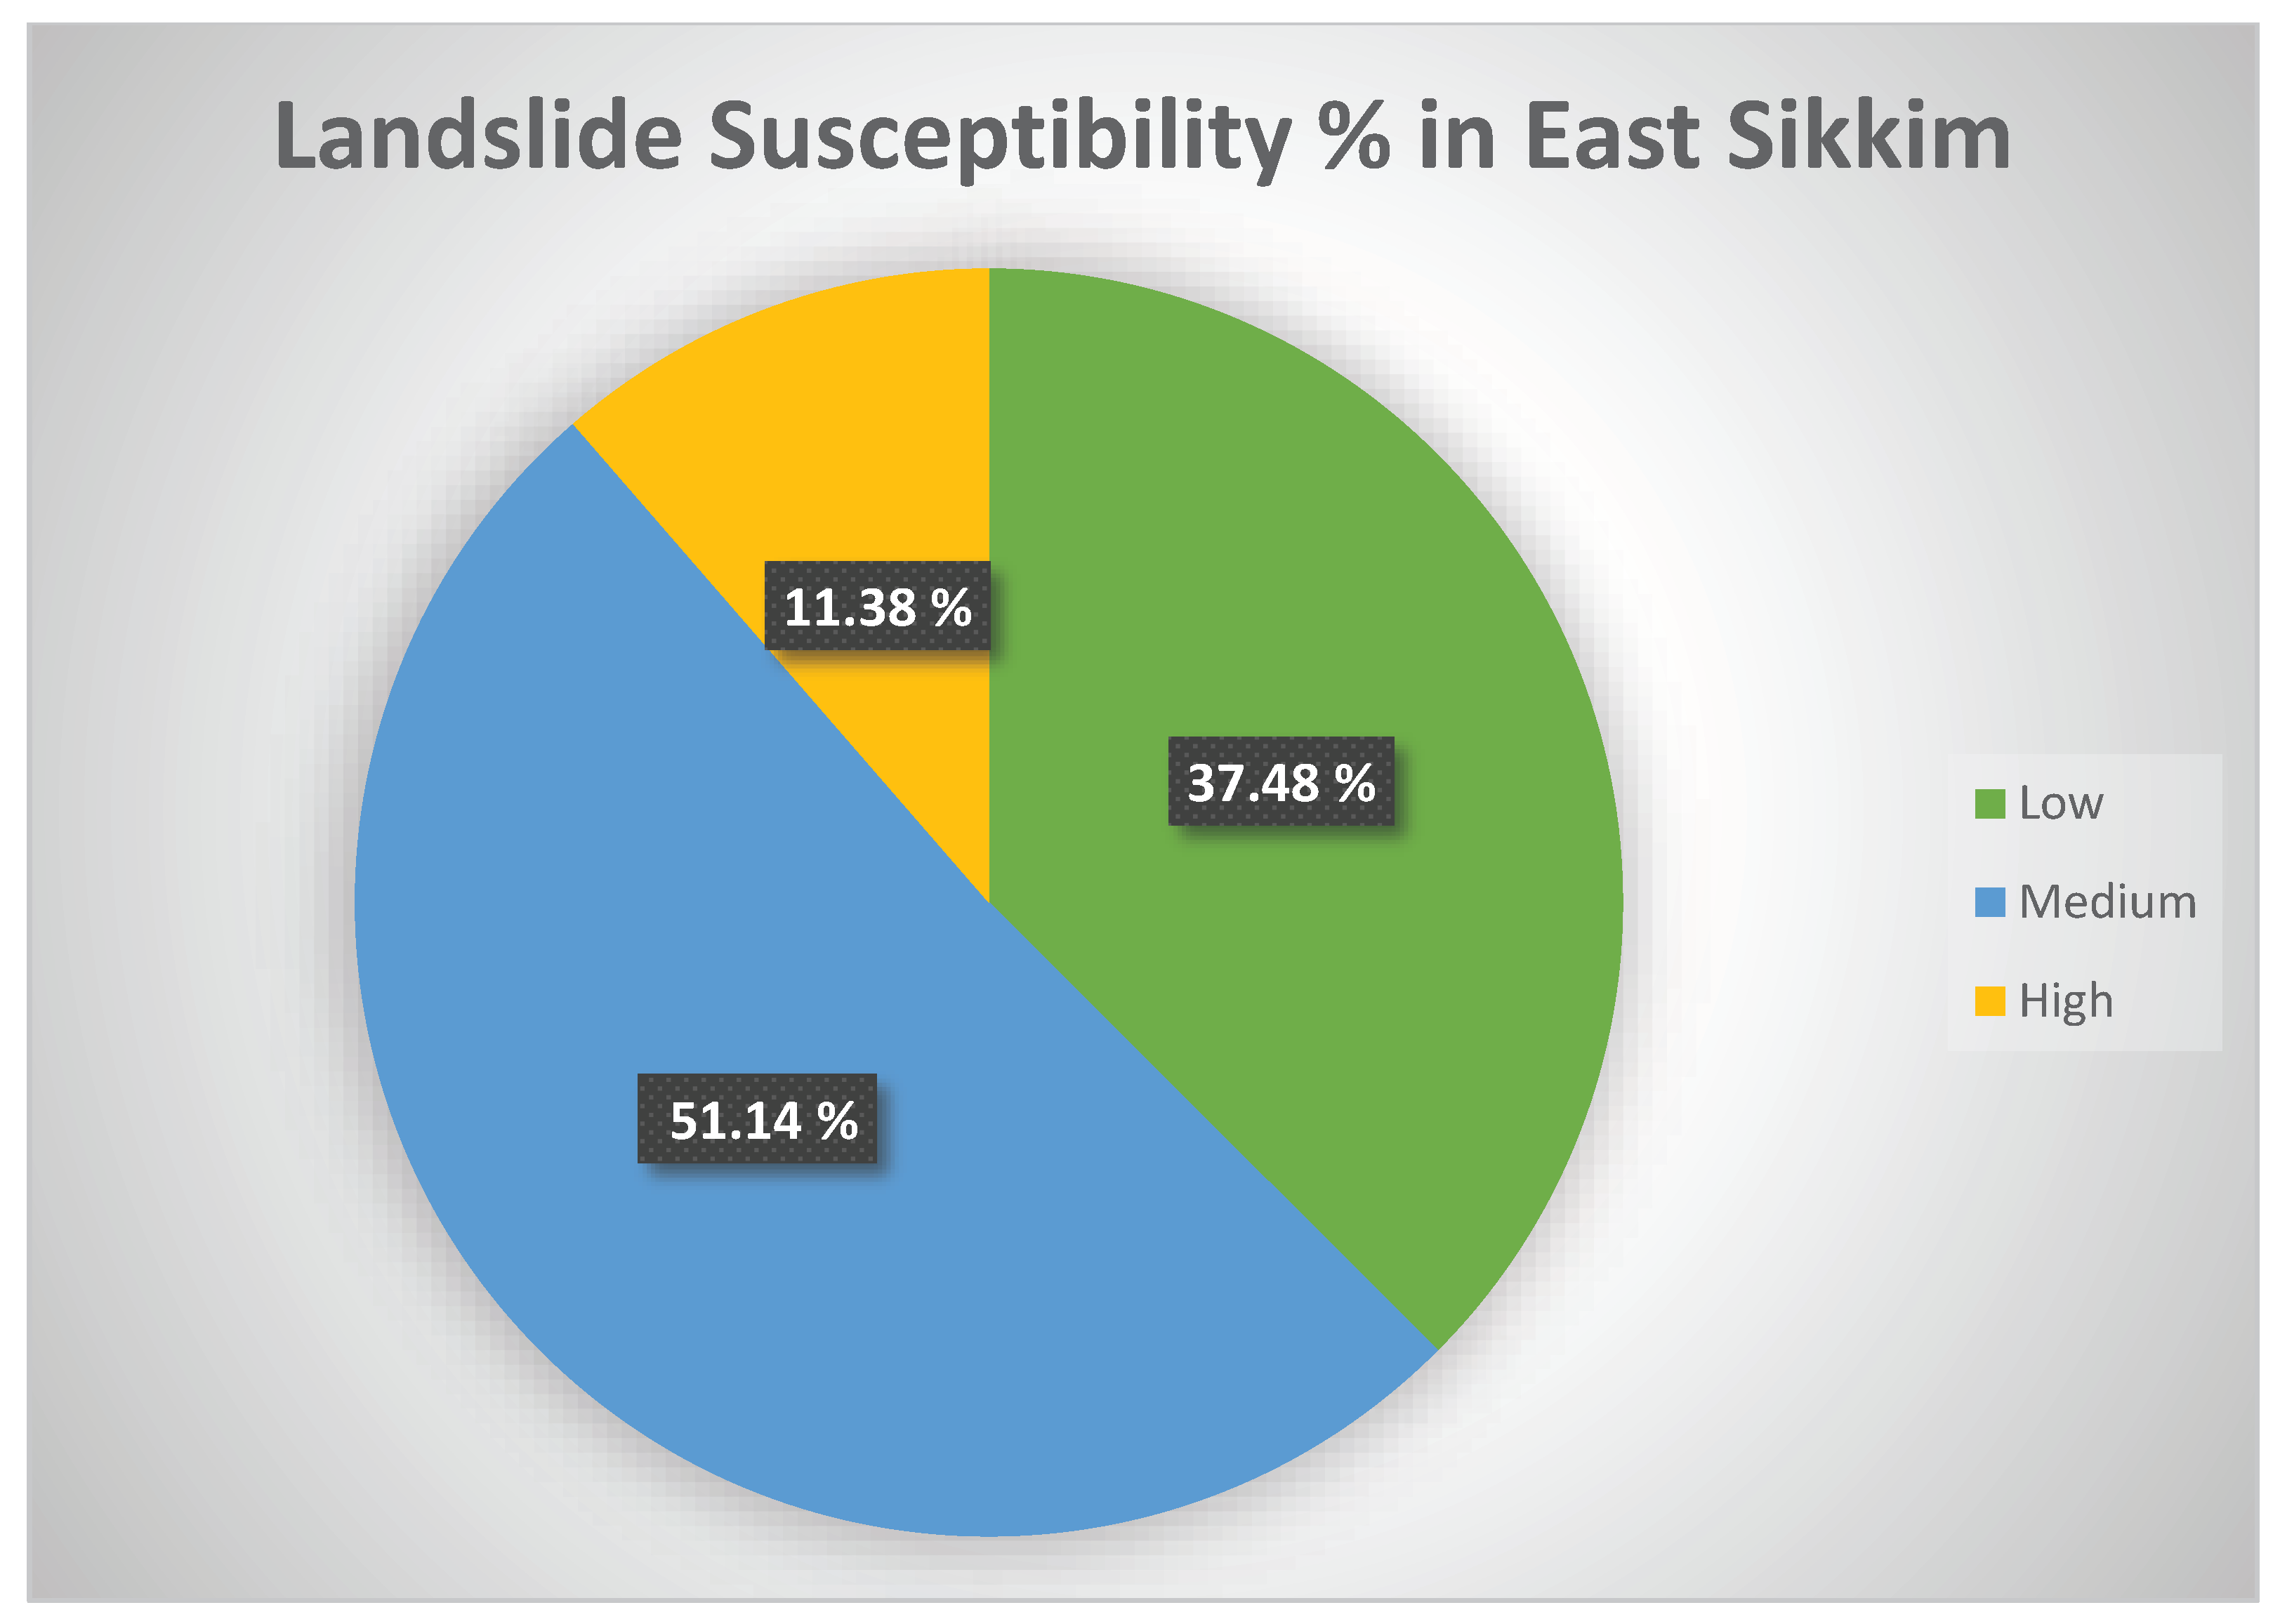

Table 1.
List of the data sources used to compute the landslide inventory and landslide causative factors.
Table 1.
List of the data sources used to compute the landslide inventory and landslide causative factors.
| S.No. | Theme | Data type | GIS Tools | Resolution | Source |
| 1 | Landslide inventory | Visual | IRS P6,LISS 4, | ||
| Polygon | interpretation | 5.8 m | Field visits | ||
| Bhukosh GSI | |||||
| 2 | Rainfall | Grid | IDW | 4*4 Km | IMD, |
| interpolation | Gangtok | ||||
| 3 | Slope gradient | ||||
| Grid | Spatial | 2.5*2.5 m | Cartosat DEM | ||
| Analyst | |||||
| 4 | Slope Aspect | Grid | Spatial | 2.5*2.5 m | Cartosat DEM |
| Analyst | |||||
| 5 | Elevation | Spatial | 2.5*2.5 m | Cartosat DEM | |
| Grid | Analyst | ||||
| 6 | Geology | Visualization | Geological Map | ||
| Polygon | & Interpretation | 1:250000 | GSI | ||
| 7 | Soil | Visualization | |||
| Polygon | & Interpretation | 1:50,000 | NBSSLUP | ||
| 8 | Normalized Difference Vegetation Index (NDVI) | Grid | (NIR-Red /NIR+Red) | 2.5*2.5 m | IRS P6 LISS 4 |
| 9 | Topographic Wetness Index (TWI) | Grid | Hydrology Tool (ArcGIS) | 2.5*2.5 m | Cartosat DEM |
| 10 | Road Proximity | Polygon | Multi ring | 2.5*2.5 m | |
| Buffer Analysis | Bhukosh, GSI | ||||
| 11 | Drainage Proximity | Polygon | Multi ring | 2.5*2.5 m | |
| Buffer | |||||
| Analysis | Cartosat DEM | ||||
| 12 | Drainage Density | Polyline | Hydrology | 2.5*2.5 m | Cartosat DEM |
| 13 | LULC | Grid | Supervised | ||
| Classification | 5.8*5.8 m | IRS P6 , LISS 4 | |||
| 14 | Landslide Susceptibility Map | Grid | Information Value Method | 2.5*2.5 m | Landslide Causative Factors (LCFs) |
| (IVM) |
| Causative factors | Class | Class % | Landslide % | IV Wt. |
|---|---|---|---|---|
| SLOPE ANGLE | 0-15 | 16.32842235 | 2.44 | 1.901 |
| 15-20 | 10.47852403 | 3.46 | 1.107 | |
| 20-30 | 27.91272562 | 17.84 | 0.447 | |
| 30-40 | 25.72418149 | 32.71 | -0.240 | |
| 40-90 | 19.55614651 | 43.54 | -0.800 | |
| SLOPE ASPECT | NORTH (0-22.5) | 9.817483531 | 1.79 | 1.700 |
| NORTH EAST (22.5-67.5) | 10.1795097 | 6.46 | 0.455 | |
| EAST (67.5-112.5) | 11.39699628 | 13.85 | -0.195 | |
| SOUTH EAST (112.5-157.5) | 12.69987768 | 21.12 | -0.508 | |
| SOUTH (157.5-202.5) | 12.17322552 | 19.49 | -0.471 | |
| SOUTH WEST (202.5-247.5) | 12.54464949 | 19.41 | -0.437 | |
| WEST (247.5-292.5) | 10.86736385 | 10.63 | 0.022 | |
| NORTH WEST (292.5-337.5) | 10.29112874 | 4.95 | 0.731 | |
| NORTH (337.5-360) | 10.02976522 | 2.29 | 1.476 | |
| ELEVATION | 0-1000 | 6.516448503 | 13.37 | -0.719 |
| 1000-2000 | 18.45161233 | 15.38 | 0.182 | |
| 2000-3000 | 15.98802483 | 19.28 | -0.187 | |
| 3000-4000 | 15.48094483 | 34.67 | -0.806 | |
| 4000-5000 | 23.10091308 | 17.14 | 0.299 | |
| 5000-6000 | 18.61663863 | 0.17 | 4.701 | |
| 6000-7000 | 1.723727865 | 0.00 | 0.000 | |
| 7000-8000 | 0.121689935 | 0.00 | 0.000 | |
| GEOLOGY | Gondwana Group | 1.682519383 | 0.00 | 0.000 |
| Permafrost Area | 32.67324754 | 27.74 | 0.164 | |
| Tso Lhamo Formation | 0.16785229 | 0.00 | 0.000 | |
| Everest Limestone | 0.709375749 | 0.00 | 0.000 | |
| Central Crystalline | 39.08960115 | 54.01 | -0.323 | |
| Everest Pelite | 2.236032292 | 0.00 | 0.000 | |
| Tourmaline Granite | 0.635440812 | 0.00 | 0.000 | |
| Chungthang Formation | 4.208296699 | 6.57 | -0.445 | |
| Lingtse Gneiss | 2.413875789 | 2.92 | -0.190 | |
| Daling Group | 16.18375829 | 8.76 | 0.614 | |
| LULC | Built up area | 1.068244006 | 1.78 | -0.510 |
| Forest | 33.68697275 | 50.08 | -0.397 | |
| Agricultural land | 2.954938857 | 3.25 | -0.095 | |
| Waterbody | 2.654194351 | 2.86 | -0.074 | |
| Grassland | 9.578374622 | 11.28 | -0.163 | |
| Barren land | 30.18828376 | 18.83 | 0.472 | |
| Snow/Glaciers | 19.86899165 | 11.93 | 0.510 | |
| LITHOLOGY | BANDED MIGMATITE, GARNET BT GNEISS,MICA SCHIST | 41.18118278 | 57.34 | -0.331 |
| BASIC INTRUSIVES | 0.010013418 | 0.00 | 0.000 | |
| BIOTITE GNEISS | 3.582800953 | 0.00 | 0.000 | |
| BIOTITE QUARTZITE | 0.026034887 | 0.00 | 0.000 | |
| BOULDER BED,FOSSILIFEROUS LIMESTONE and SANDSTONE | 1.303747021 | 0.00 | 0.000 | |
| BOULDER SLATE,CONGLOMERATE,PHYLLITE | 0.214287145 | 0.70 | -1.183 | |
| CALC GRANULITE WITH /WITHOUT QUARTZITE | 1.706286424 | 1.40 | 0.199 | |
| CALC SILICATE ROCK | 0.809084173 | 2.10 | -0.953 | |
| CHLORITE SERICITE SCHIST AND QUARTZITE | 16.95071396 | 19.58 | -0.144 | |
| DOLIMITIC QUARTZITE, CHERT, PHYLLITE, SLATE | 0.468627961 | 0.00 | 0.000 | |
| FOSSILIFEROUS LIMESTONE WITH QUARTZITE | 0.45661186 | 0.00 | 0.000 | |
| GARNET, KYANITE,SILLIMANITE,BIOTITE SCHIST | 0.368493782 | 0.70 | -0.641 | |
| META GREYWACKE | 0.096128813 | 0.00 | 0.000 | |
| MYLONITIC GRANITE GNEISS | 1.528047584 | 0.70 | 0.782 | |
| PHYLLITE QUARTZITE | 0.202271043 | 0.00 | 0.000 | |
| PYRITIFEROUS SLATE AND PHYLLITE | 0.080107344 | 0.00 | 0.000 | |
| QUARTZ ARENITE | 0.102136863 | 0.00 | 0.000 | |
| QUARTZ ARENITE, BLACK SLATE, CHERTY PHYLLITE | 0.268359602 | 0.00 | 0.000 | |
| QUARTZITE | 1.514028799 | 0.70 | 0.772 | |
| QUARTZITE,MICA SCHIST, GNEISS,CALCGRANULITE | 2.200949272 | 0.70 | 1.147 | |
| SANDSTONE, SHALE | 0.198265676 | 0.00 | 0.000 | |
| SANDSTONE,SHALE WITH MINOR COAL | 0.961288126 | 0.70 | 0.318 | |
| TOURMALINE GRANITE | 0.552740673 | 1.40 | -0.928 | |
| UNMAPPED | 24.98548054 | 13.99 | 0.580 | |
| VARIEGATED CLAY, SAND AND PEBBLE | 0.232311297 | 0.00 | 0.000 | |
| NDVI | -0.99 | 1.220382936 | 0.32 | 1.330 |
| 0 - 0.2 | 2.620573599 | 42.95 | -2.797 | |
| 0.2 - 0.4 | 15.10630829 | 40.48 | -0.986 | |
| 0.4 - 0.6 | 42.69477715 | 14.31 | 1.093 | |
| 0.6 - 1 | 38.35795802 | 1.94 | 2.986 | |
| RAINFALL | < 100 mm | 15.15975664 | 15.32 | -0.011 |
| 100-200 mm | 15.75003022 | 18.55 | -0.164 | |
| 200-300 mm | 36.4579556 | 15.32 | 0.867 | |
| 300-400 mm | 21.62657641 | 31.45 | -0.375 | |
| > 400 mm | 11.00568113 | 19.35 | -0.565 | |
| DRAINAGE DENSITY | 0-22 | 34.32853862 | 17.74 | 0.660 |
| 23-43 | 20.46617511 | 13.71 | 0.401 | |
| 44-65 | 20.02498086 | 29.84 | -0.399 | |
| 66-87 | 13.14920021 | 25.81 | -0.674 | |
| 88-110 | 6.591724082 | 6.45 | 0.021 | |
| 111-130 | 3.918368991 | 6.45 | -0.499 | |
| 131-150 | 1.041540755 | 0.00 | 0.000 | |
| 151-170 | 0.328377453 | 0.00 | 0.000 | |
| 171-200 | 0.15109392 | 0.00 | 0.000 | |
| TWI | -4.1 | 31.57720433 | 36.77 | -0.152 |
| -1.4 | 34.32563839 | 31.15 | 0.097 | |
| -1.7 | 17.85050556 | 16.33 | 0.089 | |
| -2.4 | 7.816076813 | 7.60 | 0.028 | |
| -2.5 | 3.873006957 | 3.65 | 0.061 | |
| 1.1 - 4.5 | 3.923311075 | 3.78 | 0.038 | |
| 4.5 - 14.1 | 0.63425688 | 0.73 | -0.141 | |
| ROAD PROXIMITY | < 100 m | 4.706306451 | 4.79 | -0.019 |
| 100 -200 m | 3.606833156 | 3.42 | 0.052 | |
| 200 - 300 m | 3.012036128 | 2.74 | 0.095 | |
| 300 - 400 m | 2.577453788 | 4.79 | -0.621 | |
| 400 - 500 m | 2.409228366 | 4.79 | -0.688 | |
| > 500 m | 83.68814211 | 79.45 | 0.052 | |
| DRAINAGE PROXIMITY | < 100 m | 7.194112236 | 4.00 | 0.587 |
| 100 -200 m | 6.053357866 | 4.00 | 0.414 | |
| 200 - 300 m | 5.795768169 | 8.00 | -0.322 | |
| 300 - 400 m | 4.894204232 | 0.00 | 0.000 | |
| 400 - 500 m | 5.170193192 | 12.00 | -0.842 | |
| > 500 m | 70.89236431 | 72.00 | -0.016 |
Table 3.
Classification of landslide susceptibility of different districts of Sikkim.
| DISTRICT | LANDSLIDE SUSCEPTIBILITY CLASS | AREA % | AREA (IN SQ. KMS) |
|---|---|---|---|
| LOW | 37.49 | 361.37 | |
| EAST SIKKIM | MEDIUM | 51.14 | 492.95 |
| HIGH | 11.38 | 109.68 |
Disclaimer/Publisher’s Note: The statements, opinions and data contained in all publications are solely those of the individual author(s) and contributor(s) and not of MDPI and/or the editor(s). MDPI and/or the editor(s) disclaim responsibility for any injury to people or property resulting from any ideas, methods, instructions or products referred to in the content. |
© 2024 by the authors. Licensee MDPI, Basel, Switzerland. This article is an open access article distributed under the terms and conditions of the Creative Commons Attribution (CC BY) license (http://creativecommons.org/licenses/by/4.0/).
Copyright: This open access article is published under a Creative Commons CC BY 4.0 license, which permit the free download, distribution, and reuse, provided that the author and preprint are cited in any reuse.


