Submitted:
29 March 2024
Posted:
29 March 2024
You are already at the latest version
Abstract
This study innovatively assesses the Mun River flow components in Thailand, integrating Artificial Neural Networks (ANN) and Isotopic (18O) End-Member Mixing Analysis (IEMMA). It quantifies the contributions of the Upper Mun River (UMR) and Chi River (CR) to the overall flow, revealing a discrepancy in their estimated contributions. ANN predicts the UMR and CR contribute approximately 70.1% and 29.5% respectively, while IEMMA indicates a more pronounced disparity with 84% from UMR and 16% from CR. This divergence highlights the distinct perspectives of ANN, focusing on hydrological data patterns, and IEMMA, emphasizing isotopic signatures. Despite discrepancies, both methods validate UMR as a significant contributor to the overall flow, highlighting their utility in hydrological research. The findings underscore the complexity of river systems and advocate for an integrated approach of river flow analysis for a comprehensive understanding, crucial for effective water resource management and planning.
Keywords:
river flow component
; end-member mixing method
; artificial neural networks
; Isotope Technique
; hydrochemistry
1. Introduction
The understanding of river flow components, especially in tropical regions, is vital for water resource management, environmental protection, and sustainability. Tropical rivers face specific concerns such as seasonal variability, intense precipitation events, and unique ecological systems. The integration of Artificial Neural Networks (ANN) and Isotopic End-Member Mixing Analysis (IEMMA) is particularly promising in these contexts. It combines advanced computational techniques with precise isotopic measurements to navigate the complexity of hydrological processes and the diversity of water sources, offering a nuanced understanding essential for addressing the challenges unique to tropical river systems [1,2,3,4,5].
The application of hydrogen (δ2H) and oxygen (δ18O) stable isotopes as environmental tracers in hydrology has revolutionized the understanding of river flow dynamics [6,7,8]. These isotopes provide critical insights into various hydrological processes, such as interactions within a basin [9,10,11], evaporative fractionation effects [12,13,14], and river discharge behaviors [15,16]. These isotopic compositions change within the hydrological cycle, enabling the identification of water sources across different seasons through δ2H or δ18O tracers [17,18]. Isotope hydrology enables the precise identification of water sources across seasons, enhancing the analysis of how different water contributions affect river systems [19,20]. The technique of Isotopic End-Member Mixing Analysis (IEMMA) leverages these isotopic signatures to detail the contributions of various sources to river flow, offering a deeper look into the hydrological cycle and tributary-main river interactions [21,22,23,24]. IEMMA has been extensively applied to trace the sources of river water, including rainfall, groundwater, and glacial melt contributions[22,25]. This helps in understanding the seasonal variability of river dynamics and the impact of climatic factors [21]. Research has also explored the impact of human activities, such as agriculture and urbanization, on river water composition. IEMMA serves as a critical tool in distinguishing natural water sources from anthropogenic inputs, aiding in the management of water resources [26]. Furthermore, the integration of isotopic data obtained through IEMMA with hydrological models enhances the understanding of riverine processes. This synergy improves the prediction of flow dynamics and water quality under changing environmental condition [24]. Studies utilizing IEMMA have contributed to the assessment of ecosystem health, particularly in identifying areas of concern due to pollution or over-extraction of water resources. Such insights are crucial for the sustainable management of river basins [23,27].
Artificial Neural Networks (ANN) have emerged as a powerful tool in the study of river dynamics, offering innovative approaches to understanding and predicting complex hydrological processes. This literature review highlights recent advancements in the application of ANN to river studies, emphasizing their role in predicting dissolved oxygen levels, managing reservoir sediments, landslide susceptibility modeling, and river flow prediction. The prediction of dissolved oxygen in the Nyando River basin, Kenya, was significantly improved by implementing ANN alongside Multiple Linear Regression Models, showcasing ANN’s ability to capture the nonlinear dynamics of water quality prediction more effectively than traditional models [28]. In another study, the management of reservoir sediment in the Alpine Saalach River was optimized using ANN, demonstrating a novel approach to sediment flushing that enhances efficiency and effectiveness [29]. For river flow prediction in the Dholai river basin, memory-based ANN provided more accurate forecasts than conventional methods, highlighting the models’ potential in hydrological forecasting [30]. Furthermore, the application of Monte Carlo optimized ANN for virtual water quality monitoring in the Danube River emphasized ANN’s capability in enhancing monitoring efforts at locations lacking physical monitoring infrastructure [31]. These studies collectively illustrate the versatility and efficiency of ANNs in addressing a range of challenges in river dynamics studies. By employing the ability of ANN, researchers can better predict hydrological changes, manage water resources, and understand the environmental impacts on river systems.
In Thailand, the Mun River represents a critical water resource, facing challenges related to water quality [32], allocation [33], and the impacts of climate change [34]. Understanding the contributions of upstream flows and tributaries, such as the Chi River, to the Mun River’s discharge is crucial for addressing these water-related issues effectively. This study seeks to answer two research questions: (1) What are the proportions of upstream Mun River and Chi River contributions to the Mun River’s discharge? (2) How consistent are the findings obtained from ANN and IEMMA methodologies in determining these contributions? By employing a combination of ANN and IEMMA, this research contributes to the hydrological study and water management of the Mun River by providing accurate and reliable estimates of river flow components, thereby supporting informed decision-making for sustainable water management.
2. Materials and Methods
2.1. Study Area and Climate Conditions
The Chi and Mun River Basins, situated in Thailand, present unique geographic, hydrologic, and meteorologic characteristics essential for water resource management and environmental studies. Both basins are surrounded by significant mountain ranges that play a crucial role in their hydrology. The Chi River Basin is bordered by the Dong Phaya Yen, Phetchabun, and Phu Phan mountain ranges, with elevations ranging from 300 to 1,300 meters, contributing to its complex river system [35]. In contrast, the Mun River Basin features the Banthat and Phanom Dong Rak mountains, with the landscape transitioning from elevated plateaus over 1,350 meters above sea level to lower plains towards the Mun River, indicating a varied topography from approximately 100 to 1,350 meters above sea level (Figure 1).
Meteorologically, a clear cyclical pattern of rainfall across the year reflects the seasonal monsoon influences in the region (Figure 2a). For the Chi River Basin, the mean monthly rainfall starts low in January with about 6.75 mm, gradually increases, reaching its peak in August at approximately 317.02 mm, before declining towards the end of the year. This peak reflects the intense rainfall during the monsoon season. The lowest rainfall occurs in December, with a mean of about 0.77 mm, indicating the dry season’s onset. In comparison, the Mun River Basin shows a somewhat similar seasonal pattern but with different mean monthly rainfall values. The rainfall begins with a mean of 5.39 mm in January, peaks in September at 318.19 mm, and then decreases towards the end of the year. The peak rainfall month for the Mun River Basin slightly shifts compared to the Chi River Basin, showcasing regional variations in monsoon impacts [36]. The lowest rainfall here is also in January, similar to the Chi River Basin, but with slightly lesser mean rainfall.
Hydrologically, the monsoon season also markedly elevates river discharge (Figure 2b). For the Chi River Basin, the water flow starts at a moderate level in January, with an average of 56.42 m3/s, and slowly increases as the rainy season progresses, reaching its highest point in September at 896.05 m3/s. This peak shows the maximum impact of the rainy season, after which the flow decreases towards the end of the year. By December, the flow drops to an average of 166.12 m3/s, indicating the start of the dry season. In the Mun River Basin, the pattern is similar, but the numbers are higher, attributed to a larger catchment area collecting rainwater or different characteristics. The flow begins at 70.56 m3/s in January, rises gradually, and hits its highest in September at 1,633.61 m3/s. This higher peak underlines the strong effect of the rainy season on the Mun River. The flow then reduces towards the year’s end, with December seeing an average flow of 252.50 m3/s.
2.2. Isotopes Analysis
Between 2019 and 2021, an extensive sampling campaign was undertaken for stable isotopic analysis in the Chi and Mun River basins of Thailand, focusing on both river water and daily rainwater. This effort was part of a methodology to assess river flow components using Isotopic End-Member Mixing Analysis (IEMMA) and Artificial Neural Networks (ANN). The study involved three strategically chosen stations: the upstream Mun River (UMR) as End-Member 1, the Chi River (CR) as End-Member 2, and the Mun River (MR) as the site for mixing river water samples.
For the collection of precipitation isotopes, the methodology adhered to protocols established by the International Atomic Energy Agency (IAEA). Rainwater was collected daily across the three sites, employing collectors designed to minimize evaporation and atmospheric exchange. These collectors featured a funnel leading into a graduated cylinder within a container, complemented by a table tennis ball to seal against evaporation. Accumulation bottles aggregated the weekly precipitation, representing the integrated rainfall per week. These samples were then stored in 50ml high-density polyethylene bottles at 25°C to avert condensation until their isotopic ratios could be analyzed using Cavity Ring-Down Spectroscopy.
Simultaneously, river water samples were collected weekly from the three designated stations, totaling 468 samples over the study period. The sampling technique involved collecting water from a depth of approximately 20 cm to ensure the purity and flow of the samples, which were then stored in 125-ml high-density polyethylene bottles and frozen to prevent evaporation. The isotopic analysis of these samples also followed IAEA guidelines [37], with the isotopic ratios of both rain and river water standardized against international references and analyzed for their deuterium (δ2H) and oxygen-18 (δ18O) contents. The deuterium-excess (d-excess) was defined as d-excess (‰) = δ2H − 8δ18O [38].
Both sets of samples underwent rigorous analysis at the Thailand Institute of Nuclear Technology, ensuring high precision and accuracy (1σ: ±0.15‰ for δ18O and ±0.5‰ for δ2H) in measuring the isotopic compositions, thereby facilitating a detailed assessment of the hydrologic interactions between precipitation and river flows within these basins. This innovative approach combined with river discharge and rainfall data recorded concurrently.
2.3. Artificial Neural Networks
The Artificial Neural Networks (ANN) methodology, as described, utilizes ANN’s ability to navigate complex, non-linear relationships for assessing river flow contributions from the Upstream Mun River (UMR) and the Chi River (CR) to the Main Mun River (MR) [39]. This approach is crucial for analyzing environmental and hydrological data, leveraging river isotope data (δ18O) and flow rates from 2019 to 2021 [40]. The observed target variables in this context are the fractions of flow rate between the Chi River (CR) and Upstream Mun River (UMR) relative to the Main Mun River (MR), denoted as FCR-Q and FUMR-Q, respectively.
These fractions, FCR-Q and FUMR-Q, represent how much of the Main Mun River’s flow comes from each tributary, providing insights into water distribution and management. They are calculated as the ratio of the flow rate from each tributary to the total flow rate into the Main Mun River. If QCR and QUMR denote the flow rates from CR and UMR, and QMR denotes the total flow rate into MR, the fractions can be expressed mathematically as:
FCR-Q = QCR ÷ QMR
FUMR-Q = QUMR ÷ QMR
The data preparation phase, crucial for the model’s success, involves dividing the dataset into an 80% training and 20% testing set, ensuring effective model training and validation [41]. The ANN architecture, featuring dense layers with the rectified linear unit activation and a sigmoid output layer, is meticulously designed to predict these continuous variables, FCR-ANN and FUMR-ANN, reflecting the river flow fractions [42].
After training with the Adam optimizer and mean squared error loss for 100 epochs, the model’s accuracy and prediction reliability are assessed on the testing set using the coefficient of determination (R²) and the Root Mean Square Error (RMSE) [43]. R² assesses the model’s accuracy in mirroring observed data variance, while RMSE quantifies the average prediction error magnitude, offering insights into the model’s precision and reliability.
2.4. Isotopic End-Member Mixing Analysis
The Isotopic End-Member Mixing Analysis (IEMMA) is a technique used in hydrology to quantify the contributions of different sources (end-members) to a mixture, such as the fractions of river flow from two tributaries to one main river. Isotopes, particularly stable isotopes of water (e.g., δ18O and δ2H), are commonly used as tracers because they can distinguish water from different sources based on their unique isotopic signatures [44].
Apply a mixing model that incorporates the isotopic signatures of the end-members and the mixed water (main river) to calculate the fractions of each tributary’s contribution (Upstream Mun River (UMR) and Chi River (CR)) to the main Mun River flow. The simplest form of the mixing model for two tributaries (UMR: End-member 1 and CR: End-member 2) contributing to Mun River can be represented as:
where FUMR and FCR are the fractions of the river flow contributed by End-member 1 and End-member 2, respectively. Using isotopic data, FUMR and FCR can be solved by applying the conservation of mass for isotopes (δ18O):
where δ18OUMR and δ18OCR are the isotopic signatures of the two end-members, and δ18OMR is the isotopic signature of the river mixture.
FUMR + FCR = 1
FUMR×δ18OUMR + FCR×δ18OCR = δ18OMR
Furthermore, it’s important to assess the uncertainties in measurements and model assumptions. Therefore, this study also employed sensitivity analysis or the use of Monte Carlo simulations to understand how uncertainties in isotopic signatures and other parameters affect the flow component estimates [45].
3. Results and Discussion
3.1. Isotopic Compositions of River Water
The isotopic composition of river water within the Mun River basin, encompassing δ18O, δ2H, and d-excess, has been meticulously analyzed across various locations, including the Upstream Mun River (UMR), Chi River (CR), and Mun River (MR). This comprehensive dataset, covering both wet and dry seasons, unveils profound insights into the basin’s hydrological dynamics (Figure 3). Throughout the period under study, the isotopic values displayed substantial variability: δ18O values ranged from -9.44‰ to 3.11‰, δ2H spanned from -67.69‰ to 2.92‰, and d-excess exhibited significant fluctuations (-22.50‰ to 12.36‰), highlighting the intricate interplay among evaporation, precipitation, and water source mixing that characterizes the basin’s hydrological processes.
To elaborate on the mean isotopic compositions for the entire period, the UMR, CR, and MR have revealed distinct isotopic signatures. The mean river δ18O in the UMR was -4.17‰, in the CR was -4.56‰, and in the MR was slightly more enriched with a mean of -3.84‰ (Figure 3a). Similarly, the mean δ2H values were -36.85‰ for the UMR, -38.76‰ for the CR, and -34.04‰ for the MR, indicating a slight enrichment in the MR relative to the other locations (Figure 3b). The mean river d-excess values further elucidate the differences in hydrological processes across these locations: -3.50‰ for the UMR, -2.28‰ for the CR, and -3.33‰ for the MR (Figure 3c).
These mean values underscore the spatial variability in isotopic compositions across the Mun River basin. The differences between locations can be attributed to a variety of factors, including local evaporation rates [46], the mixing of water sources (e.g., groundwater inputs, tributary influx) [47,48], and the regional climate’s influence on precipitation patterns [8]. The UMR and CR tend to show more depleted isotopic values, which could reflect the impact of higher elevation sources and more direct precipitation inputs, while the MR’s relative enrichment in isotopic values may indicate lower elevation sources, increased evaporation, or the mixing of different water sources as the river progresses downstream. This spatial variability provides essential clues to the hydrological connectivity and water cycle dynamics within the Mun River basin.
Seasonal variations in the isotopic composition of river water within the Mun River basin are marked, with distinct shifts observed between the wet and dry seasons. These shifts indicate the significant role of direct precipitation and the potential modulation of evaporation effects across different times of the year. For instance, the mean δ18O value in the UMR during the wet season is notably more depleted at -4.36‰ compared to a less depleted mean of -3.97‰ during the dry season (Figure 3a). This pattern of depletion in the wet season relative to the dry season is consistent across other locations within the basin, including the CR and the MR, underscoring the pronounced influence of seasonal precipitation on isotopic signatures [11,49].
In addition to δ18O, the seasonal variations in d-excess further illuminate the complexities of hydrological processes at play. The mean d-excess values during the wet and dry seasons reveal differences in evaporation and moisture source conditions across the basin [50,51,52]. For example, the UMR exhibits a mean d-excess of -2.79‰ in the wet season, which shifts to -4.23‰ in the dry season. (Figure 3c) This change suggests that during the dry season, evaporation effects become more pronounced, or there might be a variation in the moisture sources contributing to river water [53].
Comparing seasonal variations between locations, each river demonstrates unique patterns of isotopic changes that reflect local hydrological and meteorological influences. The CR and MR also show differences in their seasonal isotopic values, with generally more depleted δ18O and δ2H values during the wet season, indicative of enhanced precipitation input and potentially reduced evaporation. However, the extent of seasonal variation in d-excess across these locations further points to the differential impact of evaporation and moisture source dynamics within the basin [35,54].
For precipitation, the isotopic values across the basin exhibit significant variability, with δ18O and δ2H reflecting seasonal influences, moisture sources, and atmospheric circulation patterns (Figure 4). The mean δ18O values in precipitation range from -6.53‰ to -5.85‰ across different locations (averaged -6.11‰ for all samples), demonstrating the influence of temperature, altitude, and rainfall amount on isotopic fractionation. δ2H values (-136.01‰ to 26.75‰, averaged -39.65‰) and d-excess in precipitation also vary, with d-excess values (-19.82‰ to 20.85‰, averaged 9.25‰) providing insights into the evaporative conditions at the moisture source regions and during raindrop fall [55,56]. The range of d-excess values, from negative to significantly positive, underscores the complex interplay between local and regional hydrological processes. The rainfall d-excess values (averaged 8.48‰ for CR, 9.42‰ for UMR, and 9.86‰ for MR) suggest that, on average, precipitation in the basin tends to originate from moisture sources with similar characteristics [57].
River water isotopes, by comparison, tend to be more enriched than those in precipitation. This depletion is generally attributed to the evaporative enrichment of heavy isotopes in open water bodies, which results in higher δ18O and δ2H values in river water compared to precipitation. The mean δ18O values in river water for the entire period studied across the UMR, CR, and MR locations indicate this enrichment, alongside variations in d-excess that underscore the differences in evaporation rates and moisture mixing processes between the river and atmospheric water [11,35,44].
The deviations between river water and precipitation isotopic signatures across locations reveal the complex hydrological interactions within the basin (Figure 4). These deviations are particularly pronounced when analyzing the slope and intercept of the regression between δ18O and δ2H of precipitation (forming the Local Meteoric Water Line or LMWL) compared to river water. The LMWL, defined by the linear relationship between δ18O and δ2H in precipitation, serves as a benchmark for understanding hydrological processes. Deviations of river water isotopes from the LMWL indicate evaporation, mixing with different water sources, or both [11,58]. With a slope of 7.66 and an intercept of 7.21, the LMWL represents the isotopic relationship in precipitation across the Mun River basin. These values are indicative of the general atmospheric conditions and moisture sources influencing precipitation isotopes in the region [59].
The regression line for δ18O vs. δ2H in the Mun River has a slope of 5.44 and an intercept of -14.16 (Figure 4). The shallower slope and negative intercept compared to the LMWL suggest significant evaporation effects, altering the isotopic composition of river water [60]. For the Chi River, the slope is 6.23 with an intercept of -10.33. This closer alignment with the LMWL compared to the MR indicates less evaporation influence but still reflects a deviation from the isotopic composition expected from direct precipitation [35]. The UMR features a slope of 5.85 and an intercept of -11.57. These values, while differing from the LMWL, suggest a moderate evaporation effect and possibly different mixing dynamics with groundwater or tributaries [61]. The lower slopes for MR, CR, and UMR compared to the LMWL indicate evaporation’s role in enriching the heavy isotopes in river water. This evaporation effect is most pronounced in the MR, as evidenced by its significantly lower slope and more negative intercept. The intercept values, particularly the negative ones for river locations, hint at the mixing of river water with other water sources that have distinct isotopic signatures, such as groundwater, which may have undergone evaporation or fractionation processes before entering the river system [62].
3.2. Performance of ANN Models
The application of the Artificial Neural Network (ANN) method for analyzing river flow components signifies an advanced approach in comprehending water dynamics within river systems. Focusing on the Main Mun River, this study examines contributions from its tributaries, the Upper Mun River (UMR) and the Chi River (CR), utilizing ANN to unravel the complexities of river flow variations and their contributing factors. The UMR’s contribution to the Main Mun River flow, denoted as FUMR-ANN, showed significant variability (Figure 5). Statistical analysis highlighted a maximum flow contribution rate of 0.78 and a minimum of 0.51, with an average contribution of 0.70. Analysis of the Chi River’s flow contributions, FCR-ANN, revealed a maximum contribution of 0.49 and a minimum of 0.22, with an average contribution of 0.30, illustrating the variability in its contributions to the Main Mun River. The comparative analysis of trained and test results enhances understanding of the ANN model’s performance and reliability in predicting river flow contributions (Figure 5b). Minor deviations between training and testing phases for both UMR (FUMR-ANN) and CR (FCR-ANN) suggest slight variances in model predictions across different datasets [63].
Incorporating aspects of hydrology and tropical meteorology into the study of river flow components substantially enhances our understanding of water dynamics in river systems. The ANN analysis offers insights into river flow contributions during the wet and dry seasons, highlighting the seasonal dynamics of river flow. During the wet season, the analysis indicates that the UMR contributes an average fraction of 0.69 to the Main Mun River flow, while the CR contributes a slightly lower average fraction of 0.29. These findings illustrate the impact of increased precipitation during the wet season on river flows, where both tributaries significantly contribute to the Main Mun River, albeit with slight variations in their contributions [64]. Conversely, in the dry season, the UMR shows a slight increase in contribution, averaging 0.70, suggesting a consistent or slightly enhanced flow to the Main Mun River despite reduced precipitation. In contrast, the CR shows a minor decrease in its contribution, averaging 0.29, indicating a more pronounced sensitivity to seasonal precipitation reductions [34].
The observed seasonal variations in river flow contributions from the UMR and CR provide critical insights into the interaction between hydrological processes and tropical meteorology. The slight increase in the UMR’s contribution during the dry season may be attributed to the catchment area’s characteristics, potentially including its water retention capability during wet periods and consistent release throughout the year. This suggests resilience in the UMR’s flow contributions, possibly mitigating the impacts of seasonal precipitation variability [2]. On the other hand, the slight decrease in the CR’s contribution during the dry season suggests its heightened sensitivity to precipitation patterns, reflecting the catchment’s hydrological responses to tropical meteorological variations [22,64].
Comparing ANN model predictions with observed river flow data for the UMR and CR, using the coefficient of determination (R²) and the Root Mean Square Error (RMSE) [43], provides insight into the model’s precision and areas of uncertainty. For FUMR-ANN versus FUMR-Q, the R2 of 0.33 and RMSE of 0.10 were observed, while for FCR-ANN versus FCR-Q, R2 was 0.31 with an RMSE of 0.10 (Figure 5b). These findings suggest a moderate positive correlation, indicating that as observed flow rates increase, the model’s predictions also tend to increase, although not strongly. This reveals the model’s partial success in capturing observed data trends and highlights areas for significant improvement. This comprehensive analysis underscores the efficacy and potential of ANN in hydrological studies, indicating both its strengths and limitations in capturing the complexities of river flow dynamics. Enhancing the model with more detailed data, such as isotopic signatures, could improve prediction accuracy and provide deeper insights into flow components.
3.3. Isotopic End-Member Mixing Analysis Results
Incorporating Oxygen-18 (δ18O) isotopic signatures through Isotopic End-Member Mixing Analysis (IEMMA) significantly enhances the understanding of river flow dynamics within the Upper Mun River (UMR) and the Chi River (CR), contributing to the Main Mun River. This advanced analysis reveals the substantial contributions of these tributaries, providing a detailed narrative of hydrological interactions in tropical regions. The IEMMA outcomes for the UMR indicate a broad range of flow contributions, with the maximum nearing unity (0.99), suggesting instances where the UMR predominantly sustains the Main Mun River (Figure 6). This variability—from a significant minimum contribution (0.50) to an important average (0.70)—highlights the UMR’s crucial role in the river system’s hydrology. In contrast, the CR’s contributions, while essential, are noticeably lower on average (0.30), with a maximum that coincides with UMR’s minimum and a minimal figure (0.01) emphasizing its intermittent influence [36].
Seasonal variations add complexity to this hydrological narrative. The wet season’s dilution effects and runoff, driven by increased rainfall, might equalize contributions from both tributaries, whereas the dry season’s distinct isotopic signatures could emphasize UMR’s dominance due to its larger catchment area. These insights illustrate the dynamic relationship between hydro-meteorological conditions and river flow contributions in tropical settings [54].
Despite IEMMA’s insightful nature, challenges such as isotopic data resolution, end-member selection, and the assumption of isotopic homogeneity within each end-member limit the analysis’s accuracy. These challenges highlight a complex matrix of factors influencing river flow dynamics, calling for refined methodologies in future research. Addressing these limitations involves enhanced spatial and temporal sampling, advanced end-member characterization, integration with hydrological models, and the application of machine learning techniques to improve isotopic analysis resolution and accuracy, offering a more nuanced understanding of hydrological processes in river systems.
The precision of IEMMA outcomes, influenced by factors like isotopic fractionation [12,65], irrigation return flows [66], and groundwater contributions [25], introduces uncertainties in interpreting isotopic data, crucial for advancing hydrological model accuracy. Isotopic fractionation, the separation of isotopes during physical or chemical processes, can significantly affect δ18O signatures, potentially masking true source contributions [25,47,54]. Irrigation return flows, with distinct isotopic signatures, can alter a river’s isotopic composition, skewing the analysis of tributary contributions [66]. Groundwater contributions, with unique isotopic signatures, can significantly change a river’s isotopic composition, necessitating their inclusion as end-members in the mixing analysis [54].
3.4. Comparative Analysis for River Flow Components
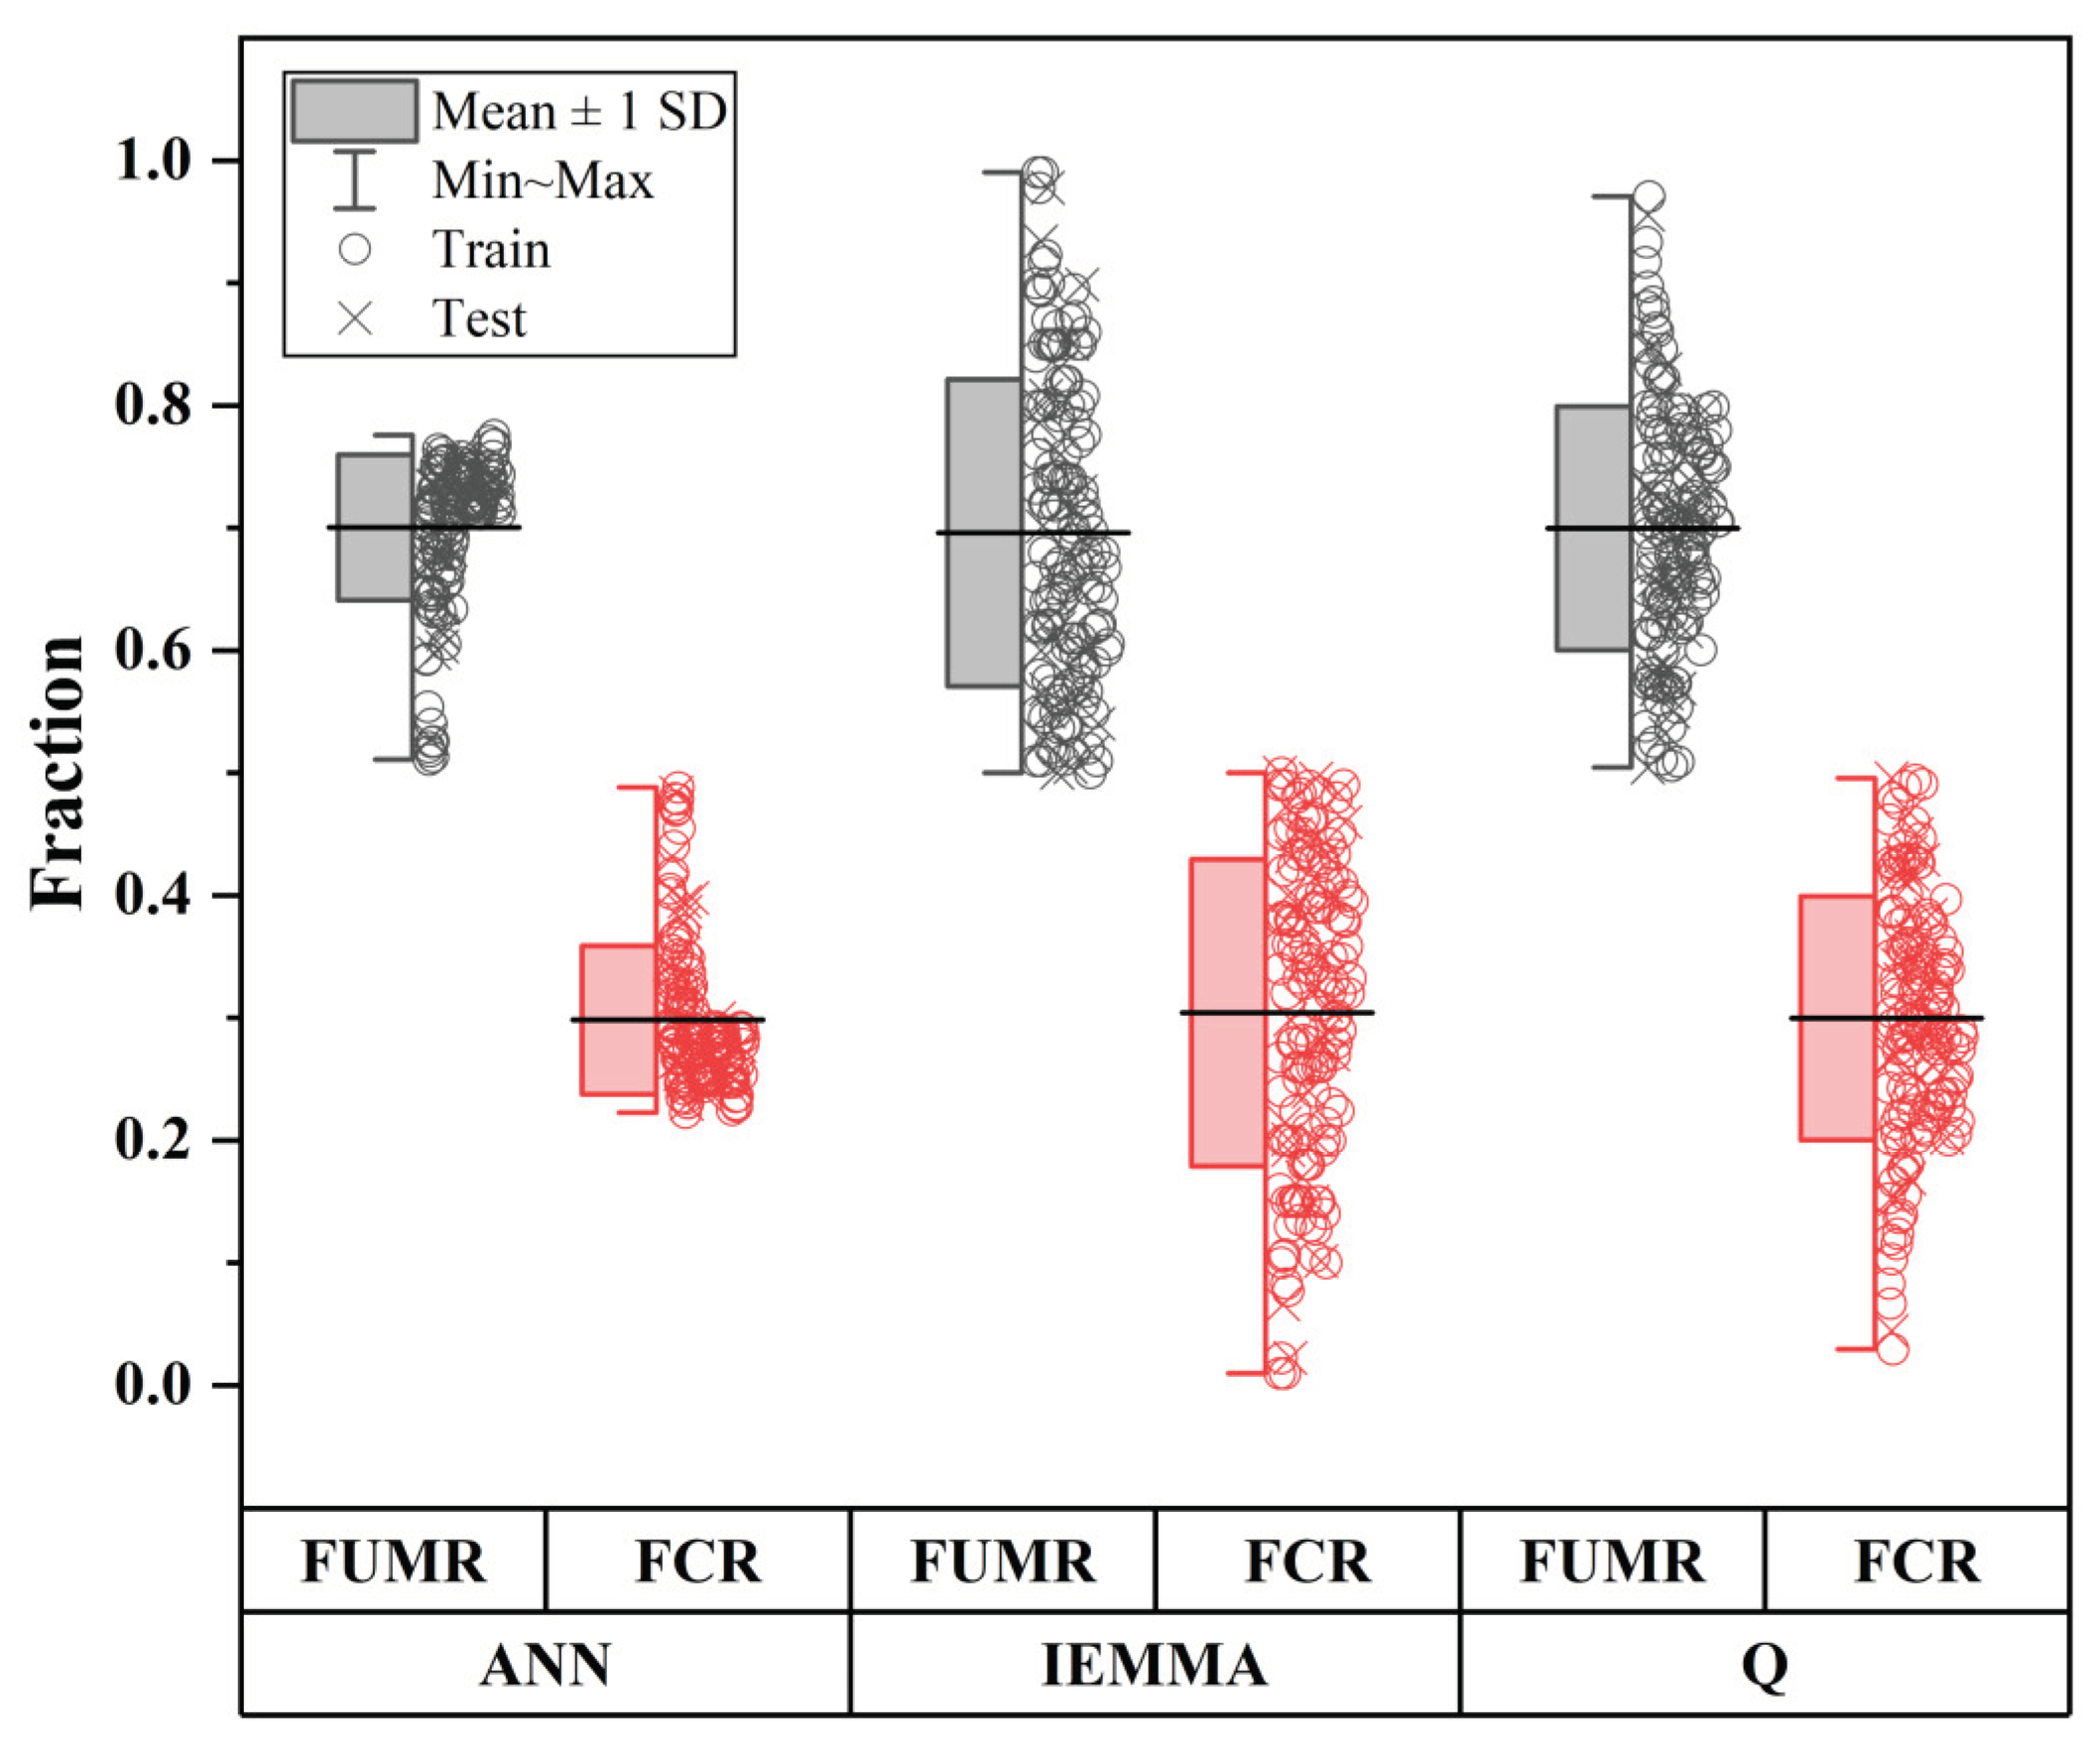
The juxtaposition of ANN (Artificial Neural Networks) and IEMMA (Isotopic End-Member Mixing Analysis) methods in analyzing the contributions of the Upper Mun River (UMR) and Chi River (CR) to the Mun River provides distinct perspectives on the hydrological dynamics within the river basin. Initial observations show general agreement between ANN and IEMMA in recognizing UMR as a significant contributor to the Mun River’s flow (Figure 7), highlighting the methodologies’ effectiveness in identifying overarching hydrological patterns.
However, closer examination reveals discrepancies in the specific fractional contributions attributed to each river by the two approaches. For instance, on an observed date, the ANN model predicts a 70.1% contribution from UMR and a 29.5% contribution from CR, while IEMMA suggests a greater disparity with 84% from UMR and only 16% from CR (Figure 7). These variances illustrate the different perspectives through which ANN and IEMMA view the river’s flow dynamics—ANN through hydrological data patterns and IEMMA through nuanced isotopic signatures reflecting water mixing and source contributions [67,68].
This comparative analysis indicates that the discrepancies between ANN and IEMMA results in estimating river flow fractions stem from differences in data sources, methodologies, and sensitivities to environmental factors. ANN leverages historical hydrological data to predict flow contributions through statistical patterns [5,29], whereas IEMMA uses geochemical isotopic signatures to understand water source contributions based on physical-chemical interactions [2,3,22]. Variabilities in moisture sources, evaporation effects, land use changes, and assumptions about isotopic homogeneity can alter results between the two approaches [50,51]. ANN might not fully account for complex hydrogeochemical interactions, while IEMMA may overlook temporal variations in hydrological data [66]. These differences highlight the complementary nature of using both methods for a holistic understanding of river flow dynamics, suggesting an integrated approach can mitigate individual limitations and provide a comprehensive analysis.
4. Conclusions
The study represents a significant step forward in hydrological research, integrating advanced computational techniques with traditional isotopic analyses to enhance our understanding of river flow dynamics. This comprehensive approach combines the predictive power of Artificial Neural Network (ANN) models with the detailed insights provided by Isotopic End-Member Mixing Analysis (IEMMA) based on Oxygen-18, offering a nuanced understanding of the contributions of various water sources to the Mun River flow, particularly from the Upper Mun River (UMR) and Chi River (CR). The study highlights both consistencies and discrepancies between ANN model predictions and IEMMA outcomes, underscoring the complexity of river flow dynamics. While both methods identify UMR as a major contributor to Mun River flow, they differ in the specific fractions attributed, reflecting their underlying analytical frameworks. It delineates the significant impact of seasonal variations on river flow contributions, with wet and dry seasons influencing the relative inputs from UMR and CR. This seasonal differentiation is crucial for water resource management and planning, especially in the context of climate variability.
The integration of ANN and IEMMA provides a holistic view of river flow components, surpassing traditional methods by combining quantitative data analysis with qualitative isotopic insights. This innovative approach enhances model accuracy, addresses methodological limitations, and facilitates a deeper understanding of hydrological processes. The findings have profound implications for hydrological studies and water management in the Mun River basin and similar contexts. The successful integration of ANN and IEMMA not only enhances our understanding of the Mun River flow components but also sets a precedent for the application of similar methodologies in other river basins globally, marking a significant advancement in the pursuit of sustainable and resilient water systems. Improved insights into flow components support better decision-making regarding water allocation, pollution control, and ecosystem services, contributing to sustainable water resource management and climate change adaptation.
Author Contributions
Conceptualization, J.L. and P.J.; methodology, J.L. and P.C.; software, V.P.; validation, J.L. and P.J; formal analysis, J.L. and P.C.; investigation, J.L. and K.K.; resources, J.L., P.J., and K.K.; data curation, V.P. and K.K.; original manuscript writing, P.C. and V.P.; manuscript review and editing, J.L., P.J., and K.K.; visualization, V.P. and P.C.; supervision, J.L.; project administration, K.K.; funding acquisition, J.L. and P.J. All authors have read and agreed to the published version of the manuscript.
Funding
This research was funded by Faculty of Engineering, Naresuan University [Grant Number: R2567E040] and partially supported by Naresuan University Fund [Grant Number: R2567C005] and Global and Frontier Research Fund, Naresuan University [Grant Number: R2567C001].
Data Availability Statement
Not applicable.
Acknowledgments
The authors acknowledge the Department of Water Resources, Thailand Institute of Nuclear Technology (Public Organization), Thailand Hydo-Informatics Institute (Public Organization), and the Royal Irrigation Department for supporting the supplementary data and their technical support.
Conflicts of Interest
The authors declare no conflict of interest.
References
- Barthold, F.K.; Tyralla, C.; Schneider, K.; Vaché, K.B.; Frede, H.G.; Breuer, L. How many tracers do we need for end member mixing analysis (EMMA)? A sensitivity analysis. Water Resources Research 2011, 47. [Google Scholar] [CrossRef]
- Ali, G.A.; Roy, A.G.; Turmel, M.-C.; Courchesne, F. Source-to-stream connectivity assessment through end-member mixing analysis. Journal of Hydrology 2010, 392, 119–135. [Google Scholar] [CrossRef]
- Burns, D.A.; McDonnell, J.J.; Hooper, R.P.; Peters, N.E.; Freer, J.E.; Kendall, C.; Beven, K. Quantifying contributions to storm runoff through end-member mixing analysis and hydrologic measurements at the Panola Mountain Research Watershed (Georgia, USA). Hydrological processes 2001, 15, 1903–1924. [Google Scholar] [CrossRef]
- Tanty, R.; Desmukh, T.S. Application of artificial neural network in hydrology—A review. Int. J. Eng. Technol. Res 2015, 4, 184–188. [Google Scholar]
- Wang, W.; Van Gelder, P.H.; Vrijling, J.K.; Ma, J. Forecasting daily streamflow using hybrid ANN models. Journal of Hydrology 2006, 324, 383–399. [Google Scholar] [CrossRef]
- Kendall, C.; McDonnell, J.J. Isotope Tracers in Catchment Hydrology; Elsevier Science, 1998. [Google Scholar]
- Hoefs, J.; Hoefs, J. Stable isotope geochemistry; Springer, 2009; Volume 285. [Google Scholar]
- Laonamsai, J.; Ichiyanagi, K.; Kamdee, K.; Putthividhya, A.; Tanoue, M. Spatial and Temporal Distributions of Stable Isotopes in Precipitation over Thailand. Hydrological Processes 2020, n/a. [Google Scholar] [CrossRef]
- Good, S.P.; Noone, D.; Kurita, N.; Benetti, M.; Bowen, G.J. D/H isotope ratios in the global hydrologic cycle. Geophysical Research Letters 2015, 42, 5042–5050. [Google Scholar] [CrossRef]
- Jeelani, G.; Saravana Kumar, U.; Kumar, B. Variation of δ18O and δD in precipitation and stream waters across the Kashmir Himalaya (India) to distinguish and estimate the seasonal sources of stream flow. Journal of Hydrology 2013, 481, 157–165. [Google Scholar] [CrossRef]
- Laonamsai, J.; Ichiyanagi, K.; Patsinghasanee, S. Isotopic temporal and spatial variations of tropical rivers in Thailand reflect monsoon precipitation signals. Hydrological Processes 2021, 35, e14068. [Google Scholar] [CrossRef]
- Haiyan, C.; Yaning, C.; Weihong, L.; Xinming, H.; Yupeng, L.; Qifei, Z. Identifying evaporation fractionation and streamflow components based on stable isotopes in the Kaidu River Basin with mountain–oasis system in north-west China. Hydrological processes 2018, 32, 2423–2434. [Google Scholar]
- Wu, H.; Li, X.; Li, J.; Jiang, Z.; Li, G.; Liu, L. Evaporative enrichment of stable isotopes (δ 18 O and δD) in lake water and the relation to lake-level change of Lake Qinghai, Northeast Tibetan Plateau of China. Journal of Arid Land 2015, 7, 623–635. [Google Scholar] [CrossRef]
- Simpson, H.J.; Herczeg, A.L. Stable isotopes as an indicator of evaporation in the River Murray, Australia. Water Resources Research 1991, 27, 1925–1935. [Google Scholar] [CrossRef]
- Ogrinc, N.; Kanduč, T.; Stichler, W.; Vreča, P. Spatial and seasonal variations in δ18O and δD values in the River Sava in Slovenia. Journal of Hydrology 2008, 359, 303–312. [Google Scholar] [CrossRef]
- Rock, L.; Mayer, B. Isotope hydrology of the Oldman River basin, southern Alberta, Canada. Hydrological Processes: An International Journal 2007, 21, 3301–3315. [Google Scholar] [CrossRef]
- Koeniger, P.; Leibundgut, C.; Stichler, W. Spatial and temporal characterisation of stable isotopes in river water as indicators of groundwater contribution and confirmation of modelling results; a study of the Weser river, Germany. Isotopes in Environmental and Health Studies 2009, 45, 289–302. [Google Scholar] [CrossRef]
- Halder, J.; Terzer, S.; Wassenaar, L.I.; Araguás-Araguás, L.J.; Aggarwal, P.K. The Global Network of Isotopes in Rivers (GNIR): integration of water isotopes in watershed observation and riverine research. Hydrology & Earth System Sciences Discussions 2015, 12. [Google Scholar]
- Laonamsai, J.; Putthividhya, A. Preliminary Assessment of Groundwater and Surface Water Characteristics in the Upper Chao Phraya River Basin Land Using a Stable Isotope Fingerprinting Technique. In Proceedings of the World Environmental and Water Resources Congress 2016; 2016; pp. 367–386. [Google Scholar]
- Putthividhya, A.; Laonamsai, J. Hydrological assessment using stable isotope fingerprinting technique in the Upper Chao Phraya river basin. Lowland technology international : the official journal of the International Association of Lowland Technology 2017, 19, 27–40. [Google Scholar]
- Kim, M.-S.; Lim, B.R.; Jeon, P.; Hong, S.; Jeon, D.; Park, S.Y.; Hong, S.; Yoo, E.J.; Kim, H.S.; Shin, S. Innovative approach to reveal source contribution of dissolved organic matter in a complex river watershed using end-member mixing analysis based on spectroscopic proxies and multi-isotopes. Water Research 2023, 230, 119470. [Google Scholar] [CrossRef]
- Lv, Y.; Gao, L.; Geris, J.; Verrot, L.; Peng, X. Assessment of water sources and their contributions to streamflow by end-member mixing analysis in a subtropical mixed agricultural catchment. Agricultural Water Management 2018, 203, 411–422. [Google Scholar] [CrossRef]
- Romanelli, A.; Soto, D.X.; Matiatos, I.; Martínez, D.E.; Esquius, S. A biological and nitrate isotopic assessment framework to understand eutrophication in aquatic ecosystems. Science of the Total Environment 2020, 715, 136909. [Google Scholar] [CrossRef] [PubMed]
- Soulsby, C.; Birkel, C.; Geris, J.; Dick, J.; Tunaley, C.; Tetzlaff, D. Stream water age distributions controlled by storage dynamics and nonlinear hydrologic connectivity: Modeling with high-resolution isotope data. Water Resources Research 2015, 51, 7759–7776. [Google Scholar] [CrossRef] [PubMed]
- Das, P.; Mukherjee, A.; Hussain, S.A.; Jamal, M.S.; Das, K.; Shaw, A.; Layek, M.K.; Sengupta, P. Stable isotope dynamics of groundwater interactions with Ganges river. Hydrological Processes 2021, 35, e14002. [Google Scholar] [CrossRef]
- Cánovas, C.R.; Macías, F.; Olías, M.; López, R.P.; Nieto, J.M. Metal-fluxes characterization at a catchment scale: Study of mixing processes and end-member analysis in the Meca River watershed (SW Spain). Journal of Hydrology 2017, 550, 590–602. [Google Scholar] [CrossRef]
- Bunn, S.E.; Davies, P.M.; Mosisch, T.D. Ecosystem measures of river health and their response to riparian and catchment degradation. Freshwater biology 1999, 41, 333–345. [Google Scholar] [CrossRef]
- Ouma, Y.O.; Okuku, C.O.; Njau, E.N. Use of Artificial Neural Networks and Multiple Linear Regression Model for the Prediction of Dissolved Oxygen in Rivers: Case Study of Hydrographic Basin of River Nyando, Kenya. Complex. 2020, 2020, 9570789:9570781–9570789:9570723. [Google Scholar] [CrossRef]
- Reisenbüchler, M.; Bui, M.D.; Rutschmann, P. Reservoir Sediment Management Using Artificial Neural Networks: A Case Study of the Lower Section of the Alpine Saalach River. Water 2021. [Google Scholar] [CrossRef]
- Debbarma, S.; Choudhury, P. River flow prediction with memory-based artificial neural networks: a case study of the Dholai river basin. Int. J. Adv. Intell. Paradigms 2020, 15, 51–62. [Google Scholar] [CrossRef]
- Mitrović, T.; Antanasijević, D.; Lazović, S.; Perić-Grujić, A.; Ristić, M. Virtual water quality monitoring at inactive monitoring sites using Monte Carlo optimized artificial neural networks: A case study of Danube River (Serbia). The Science of the total environment 2019, 654, 1000–1009. [Google Scholar] [CrossRef] [PubMed]
- Bridhikitti, A.; Prabamroong, T.; Yu, G.-A. Problem identification on surface water quality in the Mun River Basin, Thailand. Sustainable Water Resources Management 2020, 6, 1–12. [Google Scholar] [CrossRef]
- Prabnakorn, S.; Maskey, S.; Suryadi, F.X.; de Fraiture, C. Assessment of drought hazard, exposure, vulnerability, and risk for rice cultivation in the Mun River Basin in Thailand. Natural Hazards 2019, 97, 891–911. [Google Scholar] [CrossRef]
- Li, C.; Fang, H. Assessment of climate change impacts on the streamflow for the Mun River in the Mekong Basin, Southeast Asia: using SWAT model. Catena 2021, 201, 105199. [Google Scholar] [CrossRef]
- Laonamsai, J.; Ichiyanagi, K.; Patsinghasanee, S.; Kamdee, K.; Tomun, N. Application of Stable Isotopic Compositions of Rainfall Runoff for Evaporation Estimation in Thailand Mekong River Basin. Water 2022, 14, 2803. [Google Scholar] [CrossRef]
- Akter, A.; Babel, M.S. Hydrological modeling of the Mun River basin in Thailand. Journal of Hydrology 2012, 452, 232–246. [Google Scholar] [CrossRef]
- International Atomic Energy, A. IAEA/GNIP precipitation sampling guide V2. 02 September 2014. 2014. [Google Scholar]
- Dansgaard, W. Stable isotopes in precipitation. Tellus 1964, 16, 436–468. [Google Scholar] [CrossRef]
- Hafezparast, M.; Marabi, S. Prediction of Discharge Using Artificial Neural Network and IHACRES Models Due to Climate Change. Journal of Renewable Energy and Environment 2021, 8, 75–85. [Google Scholar]
- Baker, J.C.A.; Cintra, B.B.L.; Gloor, M.; Boom, A.; Neill, D.A.; Clerici, S.J.; Leng, M.J.J.; Helle, G.; Brienen, R.J.W. The Changing Amazon Hydrological Cycle—Inferences From Over 200 Years of Tree-Ring Oxygen Isotope Data. Journal of Geophysical Research: Biogeosciences 2022, 127. [Google Scholar] [CrossRef]
- Agarap, A.F. Deep learning using rectified linear units (relu). arXiv preprint, arXiv:1803.08375 2018.
- Poursaeid, M. An optimized Extreme Learning Machine by Evolutionary Computation for River Flow Prediction and Simulation of Water Pollution in Colorado River Basin, USA. Expert Syst. Appl. 2023, 233, 120998. [Google Scholar] [CrossRef]
- Mutlu, E.; Chaubey, I.; Hexmoor, H.; Bajwa, S.G. Comparison of artificial neural network models for hydrologic predictions at multiple gauging stations in an agricultural watershed. Hydrological Processes: An International Journal 2008, 22, 5097–5106. [Google Scholar] [CrossRef]
- Zhao, X.; Li, F. Isotope evidence for quantifying river evaporation and recharge processes in the lower reaches of the Yellow River. Environmental Earth Sciences 2017, 76, 1–15. [Google Scholar] [CrossRef]
- Xia, C.-A.; Pasetto, D.; Hu, B.X.; Putti, M.; Guadagnini, A. Integration of moment equations in a reduced-order modeling strategy for Monte Carlo simulations of groundwater flow. Journal of Hydrology 2020. [Google Scholar] [CrossRef]
- Laonamsai, J.; Pawana, V.; Chipthamlong, P.; Chomcheawchan, P.; Kamdee, K.; Kimmany, B.; Julphunthong, P. Groundwater Quality Variations in Multiple Aquifers: A Comprehensive Evaluation for Public Health and Agricultural Use. Geosciences 2023, 13. [Google Scholar] [CrossRef]
- Laonamsai, J.; Julphunthong, P.; Chipthamlong, P.; Pawana, V.; Chomchaewchan, P.; Kamdee, K.; Tomun, N.; Kimmany, B. Hydrochemical characteristics and salt intrusion in groundwater of the lower Chao Phraya river basin: Insights from stable isotopes and hydrochemical analysis. Groundwater for Sustainable Development 2023, 23, 101044. [Google Scholar] [CrossRef]
- Putthividhya, A.; Laonamsai, J. SWAT and MODFLOW modeling of spatio-temporal runoff and groundwater recharge distribution. 2017; pp. 51–65.
- Zhong, J.; Chen, S.; Wang, W.; Yan, Z.; Ellam, R.M.; Li, S.L. Unravelling the hydrological effects on spatiotemporal variability of water chemistry in mountainous rivers from Southwest China. Hydrological Processes 2020, 34, 5595–5605. [Google Scholar] [CrossRef]
- Aggarwal, P.K.; Alduchov, O.A.; Froehlich, K.O.; Araguas-Araguas, L.J.; Sturchio, N.C.; Kurita, N. Stable isotopes in global precipitation: A unified interpretation based on atmospheric moisture residence time. Geophysical Research Letters 2012, 39, n. [Google Scholar] [CrossRef]
- Araguás-Araguás, L.; Froehlich, K.; Rozanski, K. Stable isotope composition of precipitation over southeast Asia. Journal of Geophysical Research: Atmospheres 1998, 103, 28721–28742. [Google Scholar] [CrossRef]
- Xia, C.; Liu, G.; Chen, K.; Hu, Y.; Zhou, J.; Liu, Y.; Mei, J. Stable Isotope Characteristics for Precipitation Events and Their Responses to Moisture and Environmental Changes During the Summer Monsoon Period in Southwestern China. Polish Journal of Environmental Studies 2020, 29. [Google Scholar] [CrossRef]
- Yang, Y.-g.; Hu, J.; Xiao, H.; Zou, S.; Yin, Z. [Spatial and temporal variations of hydrological characteristic on the landscape zone scale in alpine cold region]. Huan jing ke xue= Huanjing kexue, 2013; 34 10, 3797–3803. [Google Scholar]
- Yang, K.; Han, G. Controls over hydrogen and oxygen isotopes of surface water and groundwater in the Mun River catchment, northeast Thailand: implications for the water cycle. Hydrogeology Journal 2020, 28. [Google Scholar] [CrossRef]
- Crawford, J.; Hollins, S.E.; Meredith, K.T.; Hughes, C.E. Precipitation stable isotope variability and subcloud evaporation processes in a semi-arid region. Hydrological Processes 2017, 31, 20–34. [Google Scholar] [CrossRef]
- Laonamsai, J.; Ichiyanagi, K.; Patsinghasanee, S.; Kamdee, K. Controls on Stable Isotopic Characteristics of Water Vapor over Thailand. Hydrological Processes 2021, n/a, e14202. [Google Scholar] [CrossRef]
- Jackisch, D.; Yeo, B.X.; Switzer, A.D.; He, S.; Cantarero, D.L.M.; Siringan, F.P.; Goodkin, N.F. Precipitation stable isotopic signatures of tropical cyclones in Metropolitan Manila, Philippines, show significant negative isotopic excursions. Natural Hazards and Earth System Sciences 2022. [Google Scholar] [CrossRef]
- Fritz, M.; Wetterich, S.; McAlister, J.; Meyer, H. A new local meteoric water line for Inuvik (NT, Canada). Earth System Science Data 2021. [Google Scholar] [CrossRef]
- Terzer-Wassmuth, S.; Araguás-Araguás, L.J.; Wassenaar, L.I.; Stumpp, C. Global and local meteoric water lines for δ17O/δ18O and the spatiotemporal distribution of Δ′17O in Earth’s precipitation. Scientific Reports 2023, 13. [Google Scholar] [CrossRef] [PubMed]
- Liu, Y.; Liu, J.; Wang, S.; Zhou, T. A simplified method of developing a local meteoric water line equation for Beijing, China. Journal of Radioanalytical and Nuclear Chemistry 2018, 315, 523–532. [Google Scholar] [CrossRef]
- Welch, C.; Smith, A.A.; Stadnyk, T.A. Linking physiography and evaporation using the isotopic composition of river water in 16 Canadian boreal catchments. Hydrological Processes 2018, 32, 170–184. [Google Scholar] [CrossRef]
- Sang, L.; Zhu, G.-f.; Xu, Y.; Sun, Z.; Zhang, Z.; Tong, H.-l. Effects of Agricultural Large-And Medium-Sized Reservoirs on Hydrologic Processes in the Arid Shiyang River Basin, Northwest China. Water Resources Research 2023, 59. [Google Scholar] [CrossRef]
- Zanial, W.N.C.W.; Malek, M.B.A.; Reba, M.N.M.; Zaini, N.a.; Ahmed, A.N.; Sherif, M.; Elshafie, A. River flow prediction based on improved machine learning method: Cuckoo Search-Artificial Neural Network. Applied Water Science 2022, 13, 1–10. [Google Scholar] [CrossRef]
- Li, R.; Huang, H.; Yu, G.; Yu, H.; Bridhikitti, A.; Su, T. Trends of runoff variation and effects of main causal factors in Mun River, Thailand During 1980–2018. Water 2020, 12, 831. [Google Scholar] [CrossRef]
- Winnick, M.J.; Chamberlain, C.P.; Caves, J.K.; Welker, J.M. Quantifying the isotopic ‘continental effect’. Earth and Planetary Science Letters 2014, 406, 123–133. [Google Scholar] [CrossRef]
- Vallet-Coulomb, C.; Seraphin, P.; Gonçalves, J.C.d.S.I.; Radakovitch, O.; Cognard-Plancq, A.-L.; Crespy, A.; Babic, M.; Charron, F. Irrigation return flows in a mediterranean aquifer inferred from combined chloride and stable isotopes mass balances. Applied Geochemistry 2017, 86, 92–104. [Google Scholar] [CrossRef]
- Zhang, Y.; Ye, A.; You, J.-j.; Jing, X. Quantification of human and climate contributions to multi-dimensional hydrological alterations: A case study in the Upper Minjiang River, China. Journal of Geographical Sciences 2021, 31, 1102–1122. [Google Scholar] [CrossRef]
- Vinogradova, A.A.; Kotova, E.I. Pollution of Russian Northern Seas with Heavy Metals: Comparison of Atmospheric Flux and River Flow. Izvestiya, Atmospheric and Oceanic Physics 2019, 55, 695–704. [Google Scholar] [CrossRef]
Figure 1.
(a) Map of Thailand. (b) Location of Chi and Mun River basins and rainfall runoff stations. (c) Location of isotope sampling sites for rainwater and river water.
Figure 1.
(a) Map of Thailand. (b) Location of Chi and Mun River basins and rainfall runoff stations. (c) Location of isotope sampling sites for rainwater and river water.
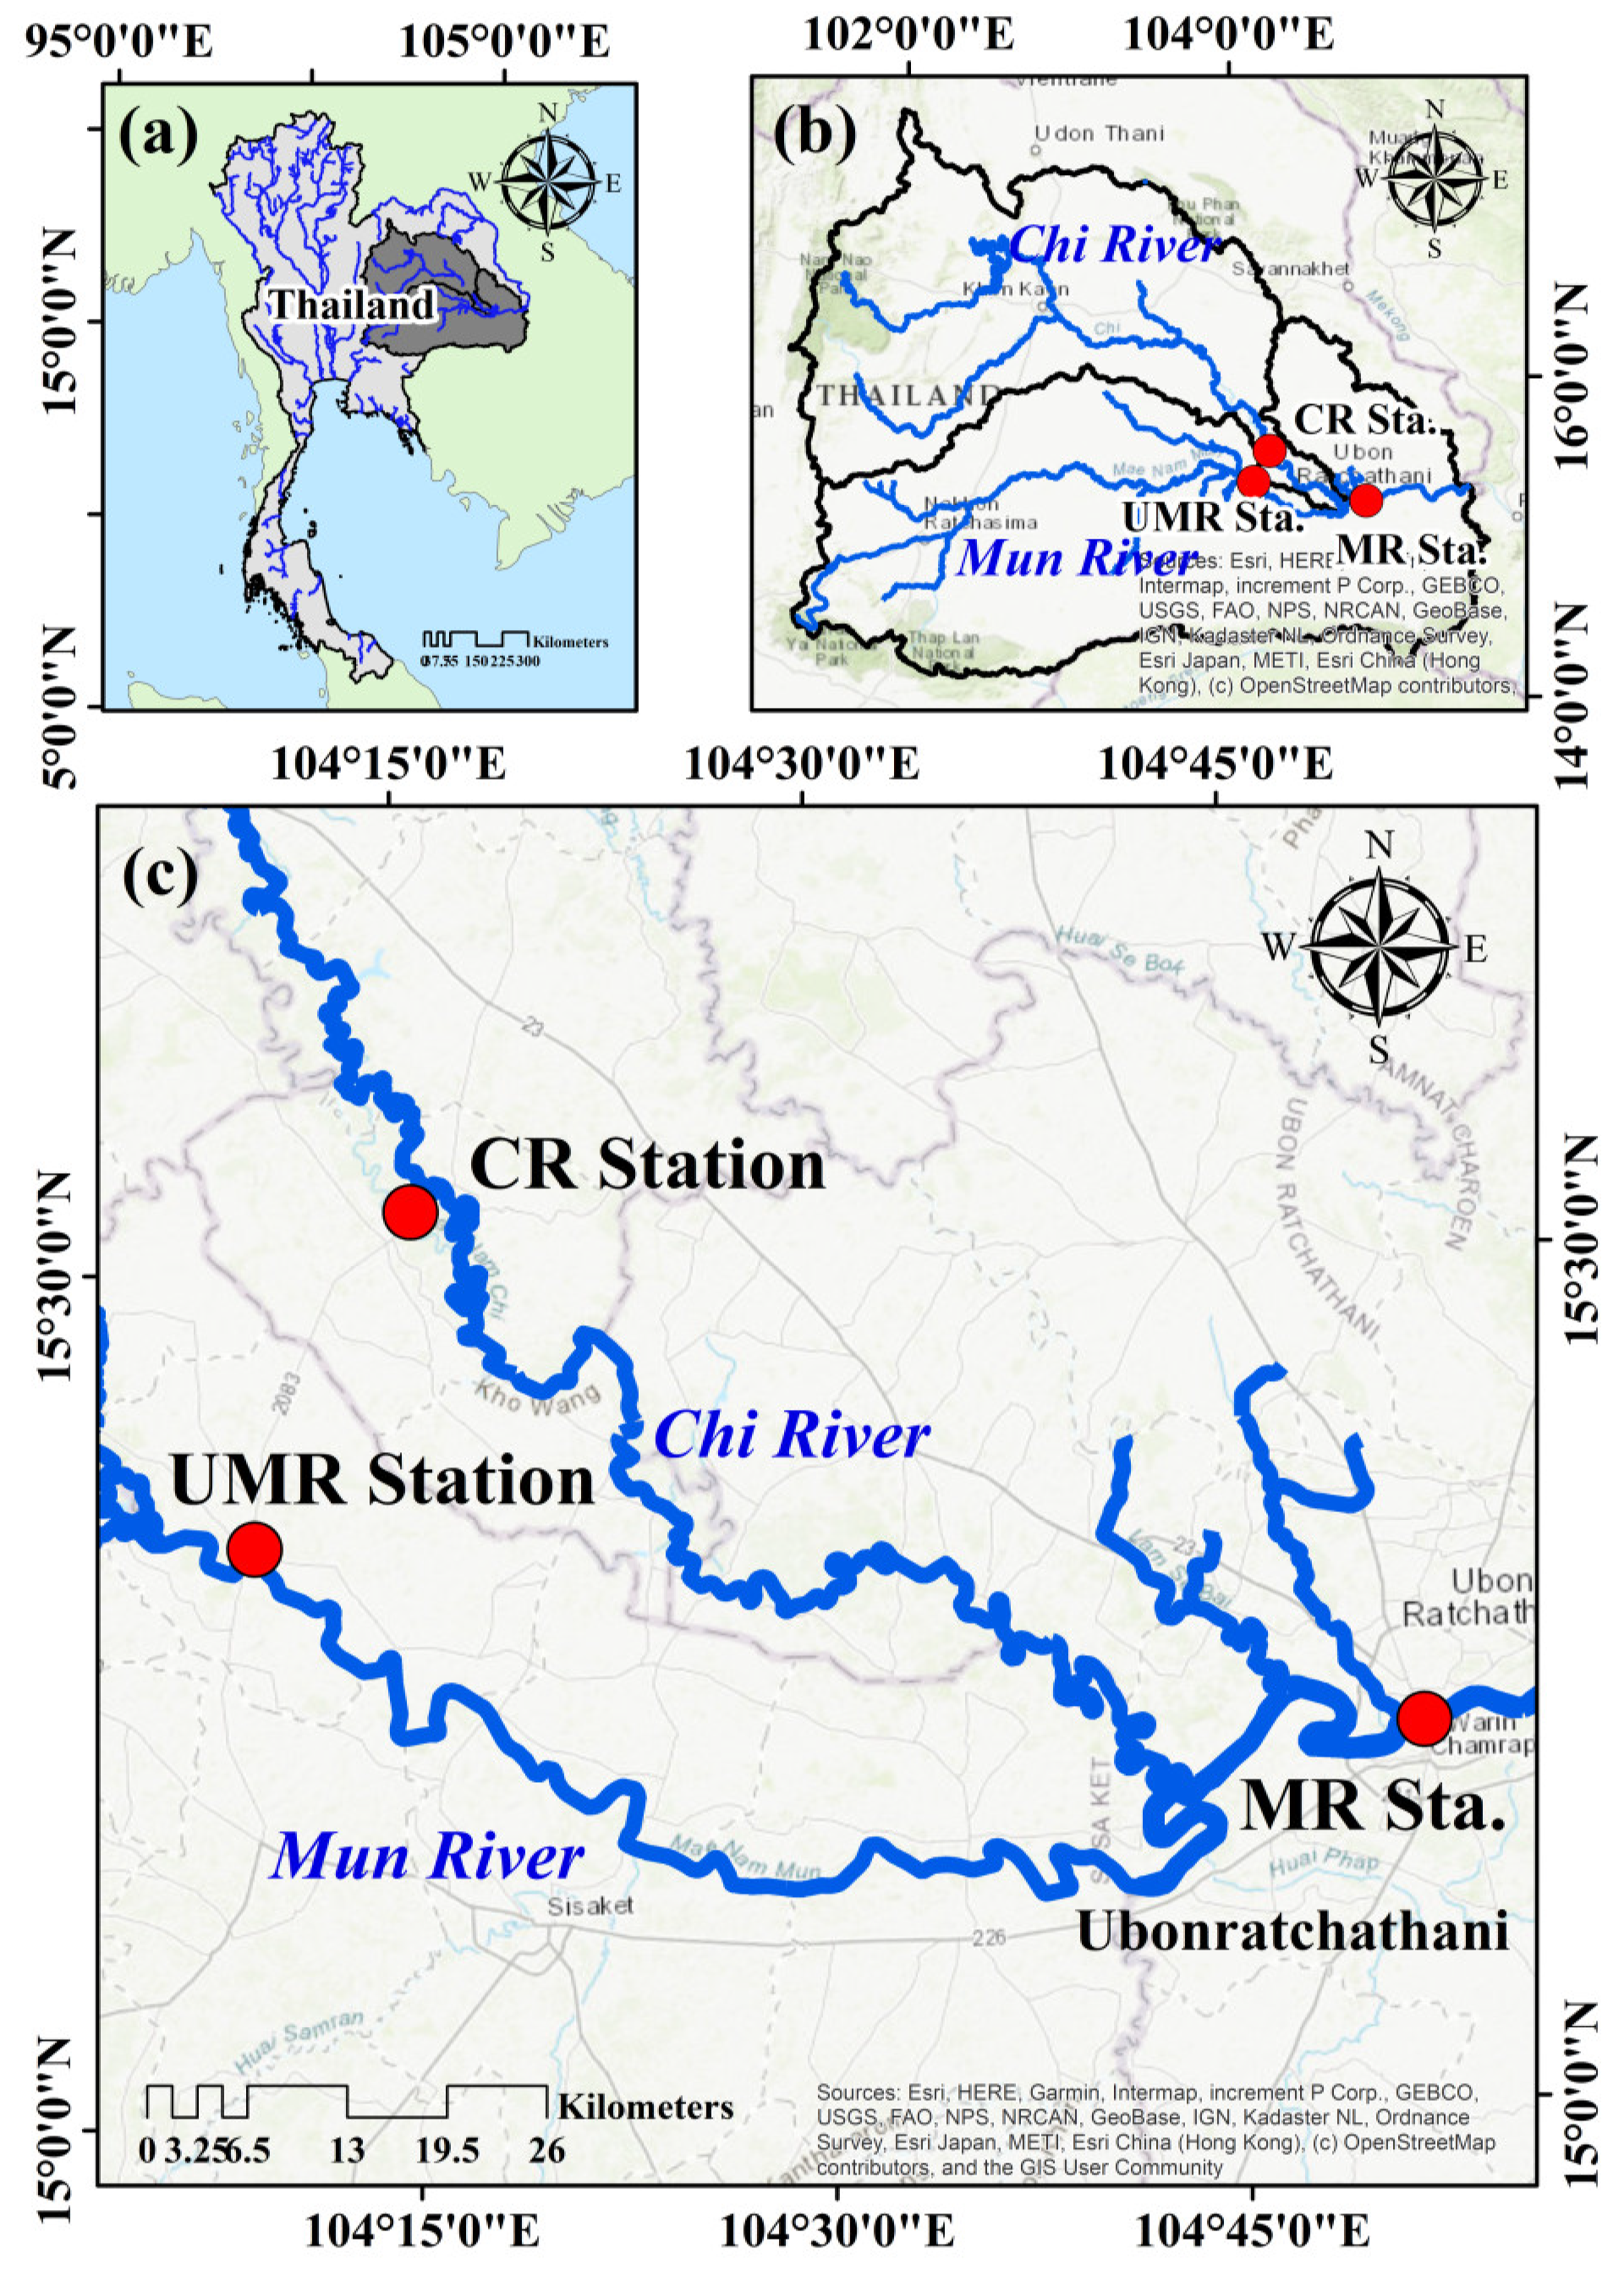
Figure 2.
(a) Mean monthly (2019-2021) rainfall (mm) over Mun and Chi River basins. (b) Mean monthly (2019-2021) river flow rate (m3/s) over Mun and Chi River.
Figure 2.
(a) Mean monthly (2019-2021) rainfall (mm) over Mun and Chi River basins. (b) Mean monthly (2019-2021) river flow rate (m3/s) over Mun and Chi River.
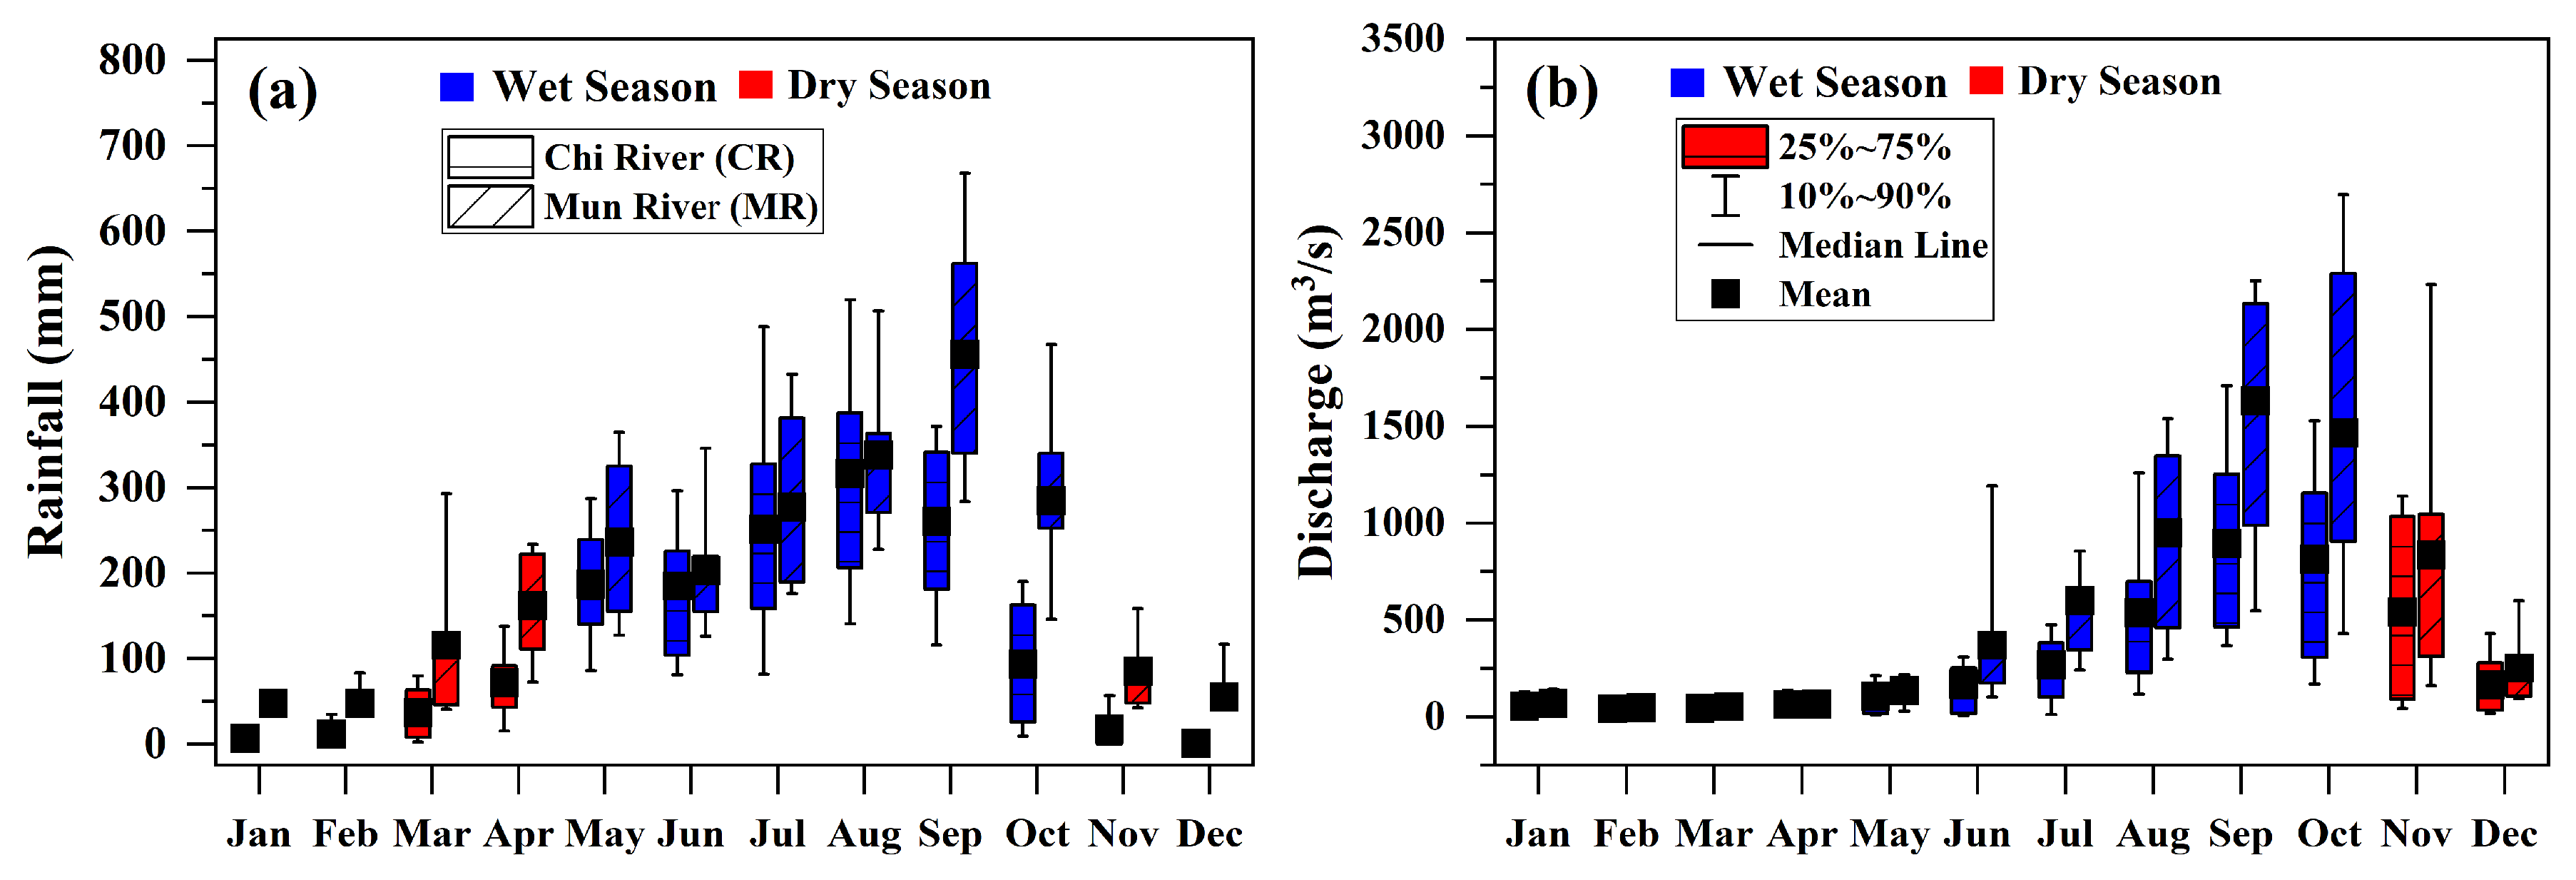
Figure 3.
Timeseries of weekly stable isotopic compositions in river waters in Mun River (MR), Chi River (CR), and Upstream Mun River (UMR); (a) δ18O, (b) δ2H, and (c) d-excess.
Figure 3.
Timeseries of weekly stable isotopic compositions in river waters in Mun River (MR), Chi River (CR), and Upstream Mun River (UMR); (a) δ18O, (b) δ2H, and (c) d-excess.
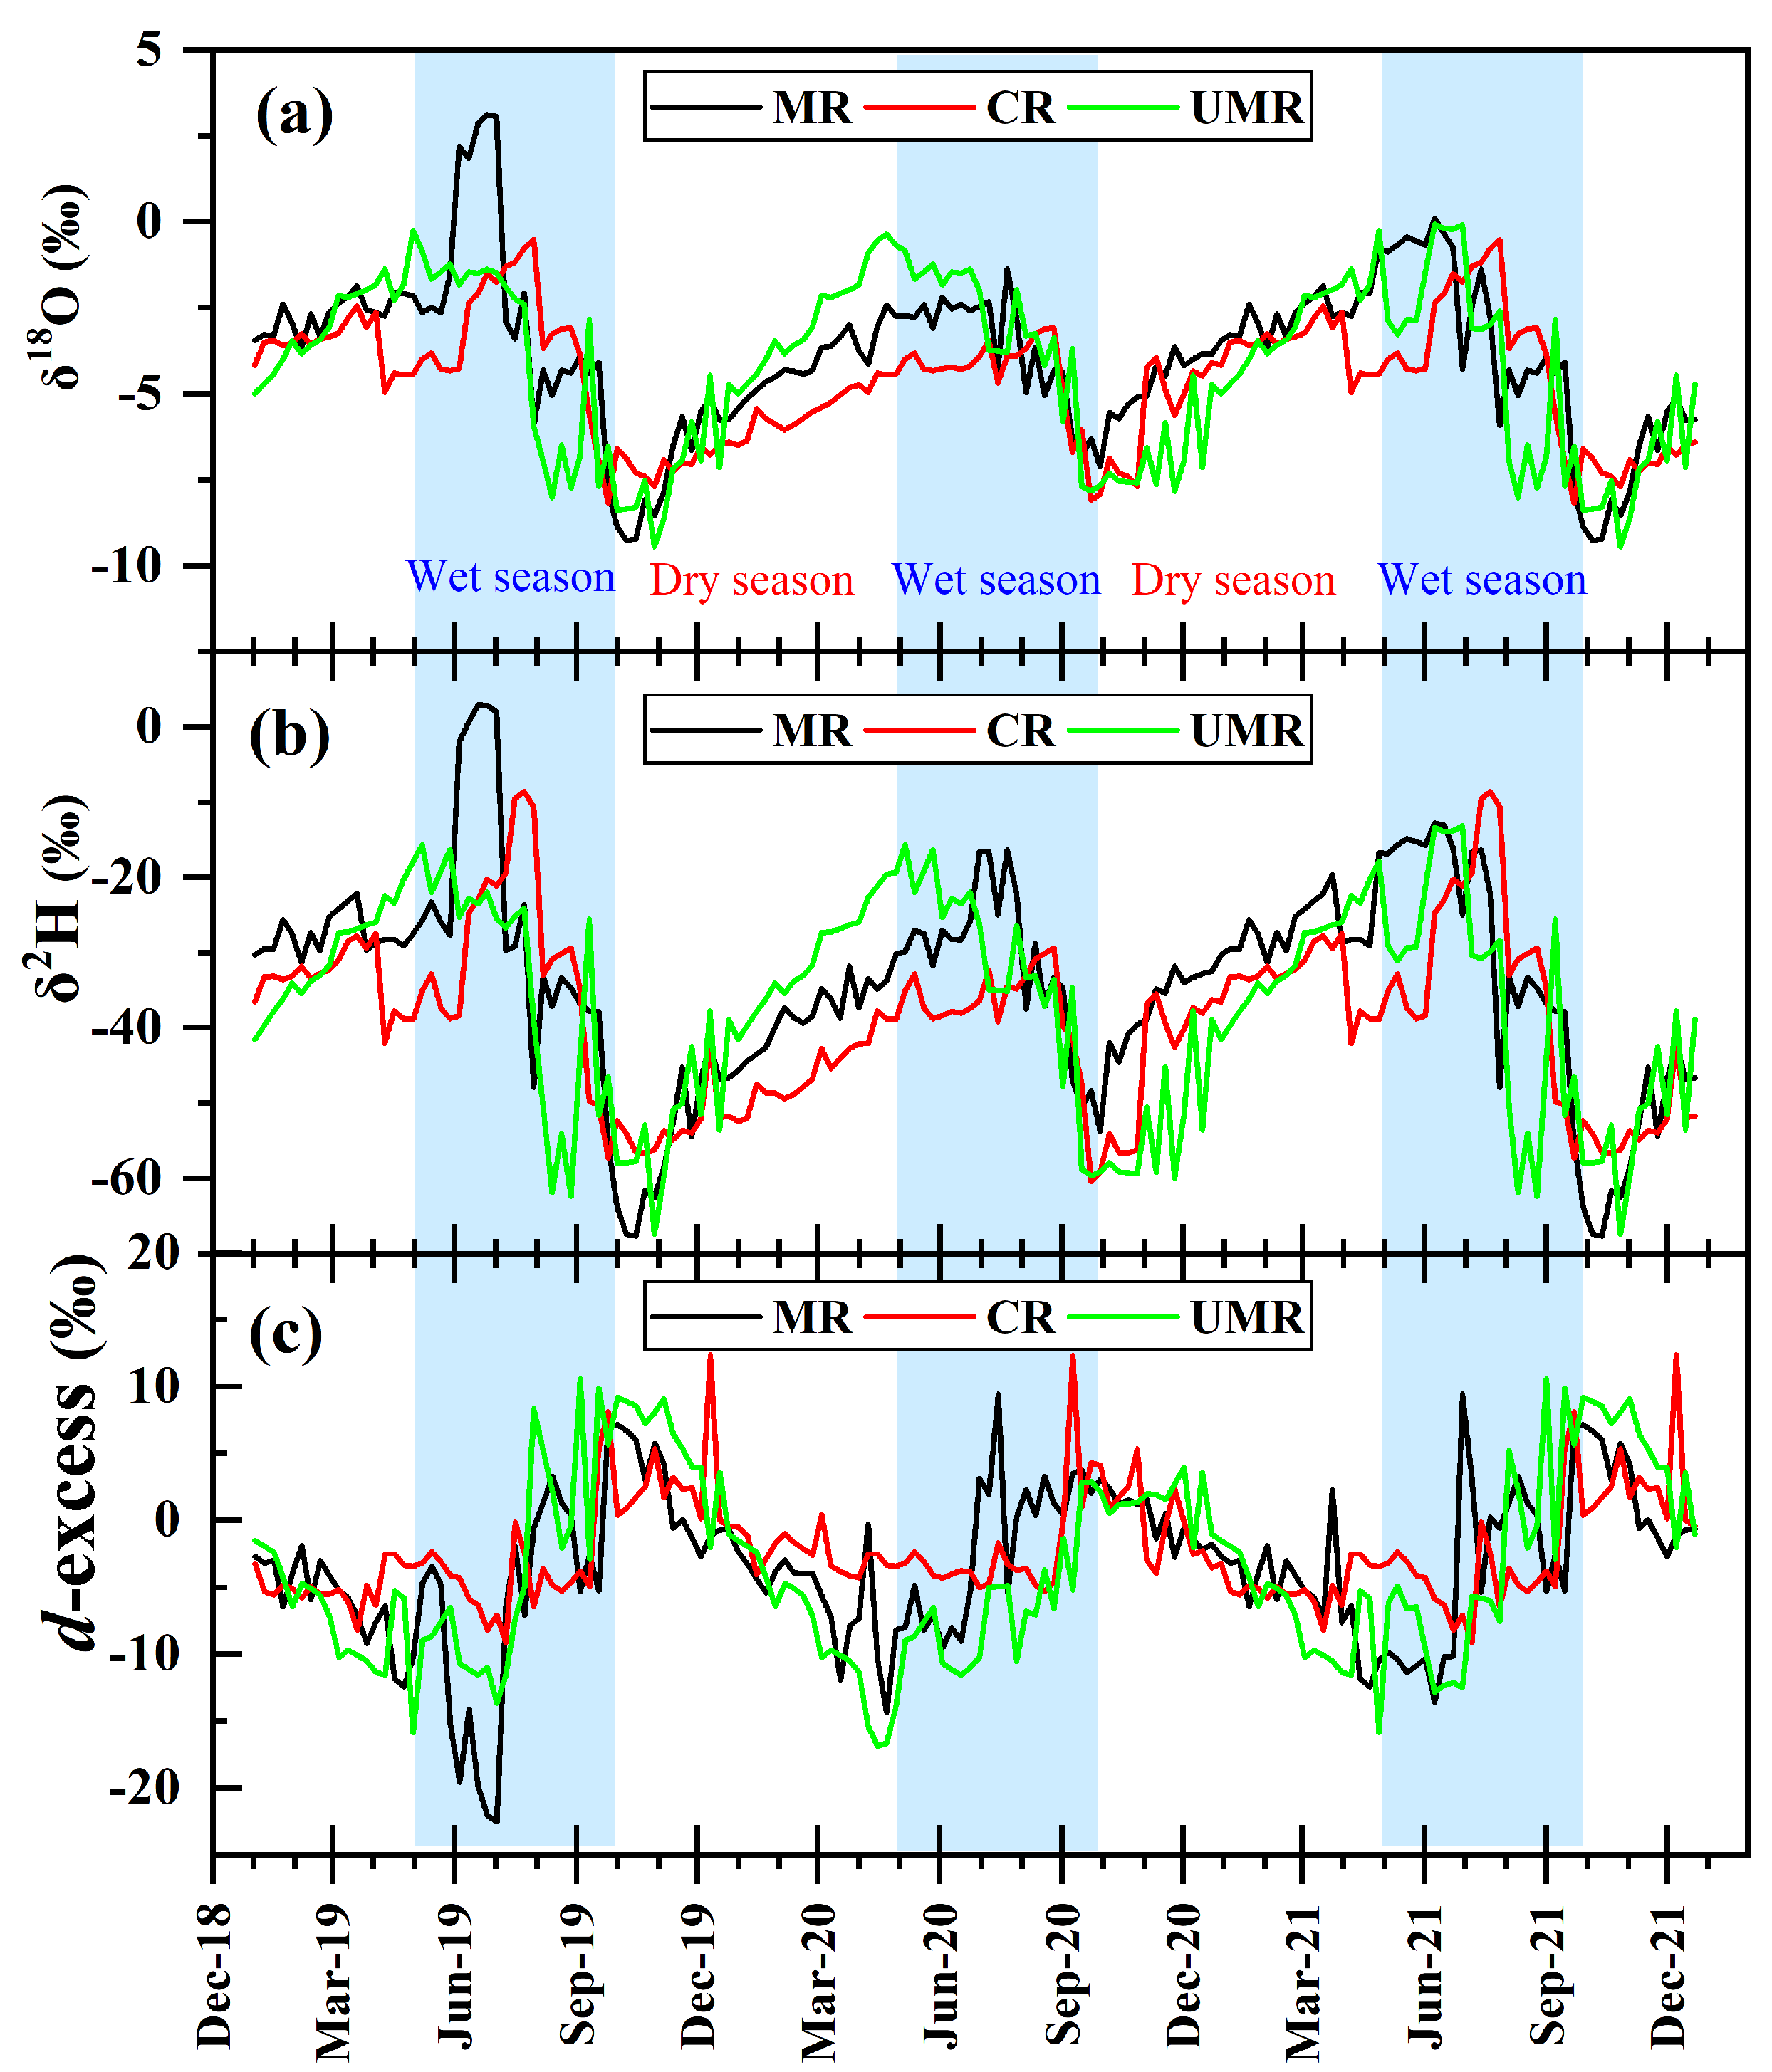
Figure 4.
Isotopic composition of precipitation (light blue ellipsoid with 95% confidence level) and river water including the correlation between δ18O and δ2H (δ18O-δ2H relationship) in both rainfall and each river shown as Local Meteoric Water Line (rainfall, red line), the river trend line (Mun River (MR, black line), Chi River (CR, dot line), and Upstream Mun River (UMR, dash line)), and box plot for δ18O and δ2H.
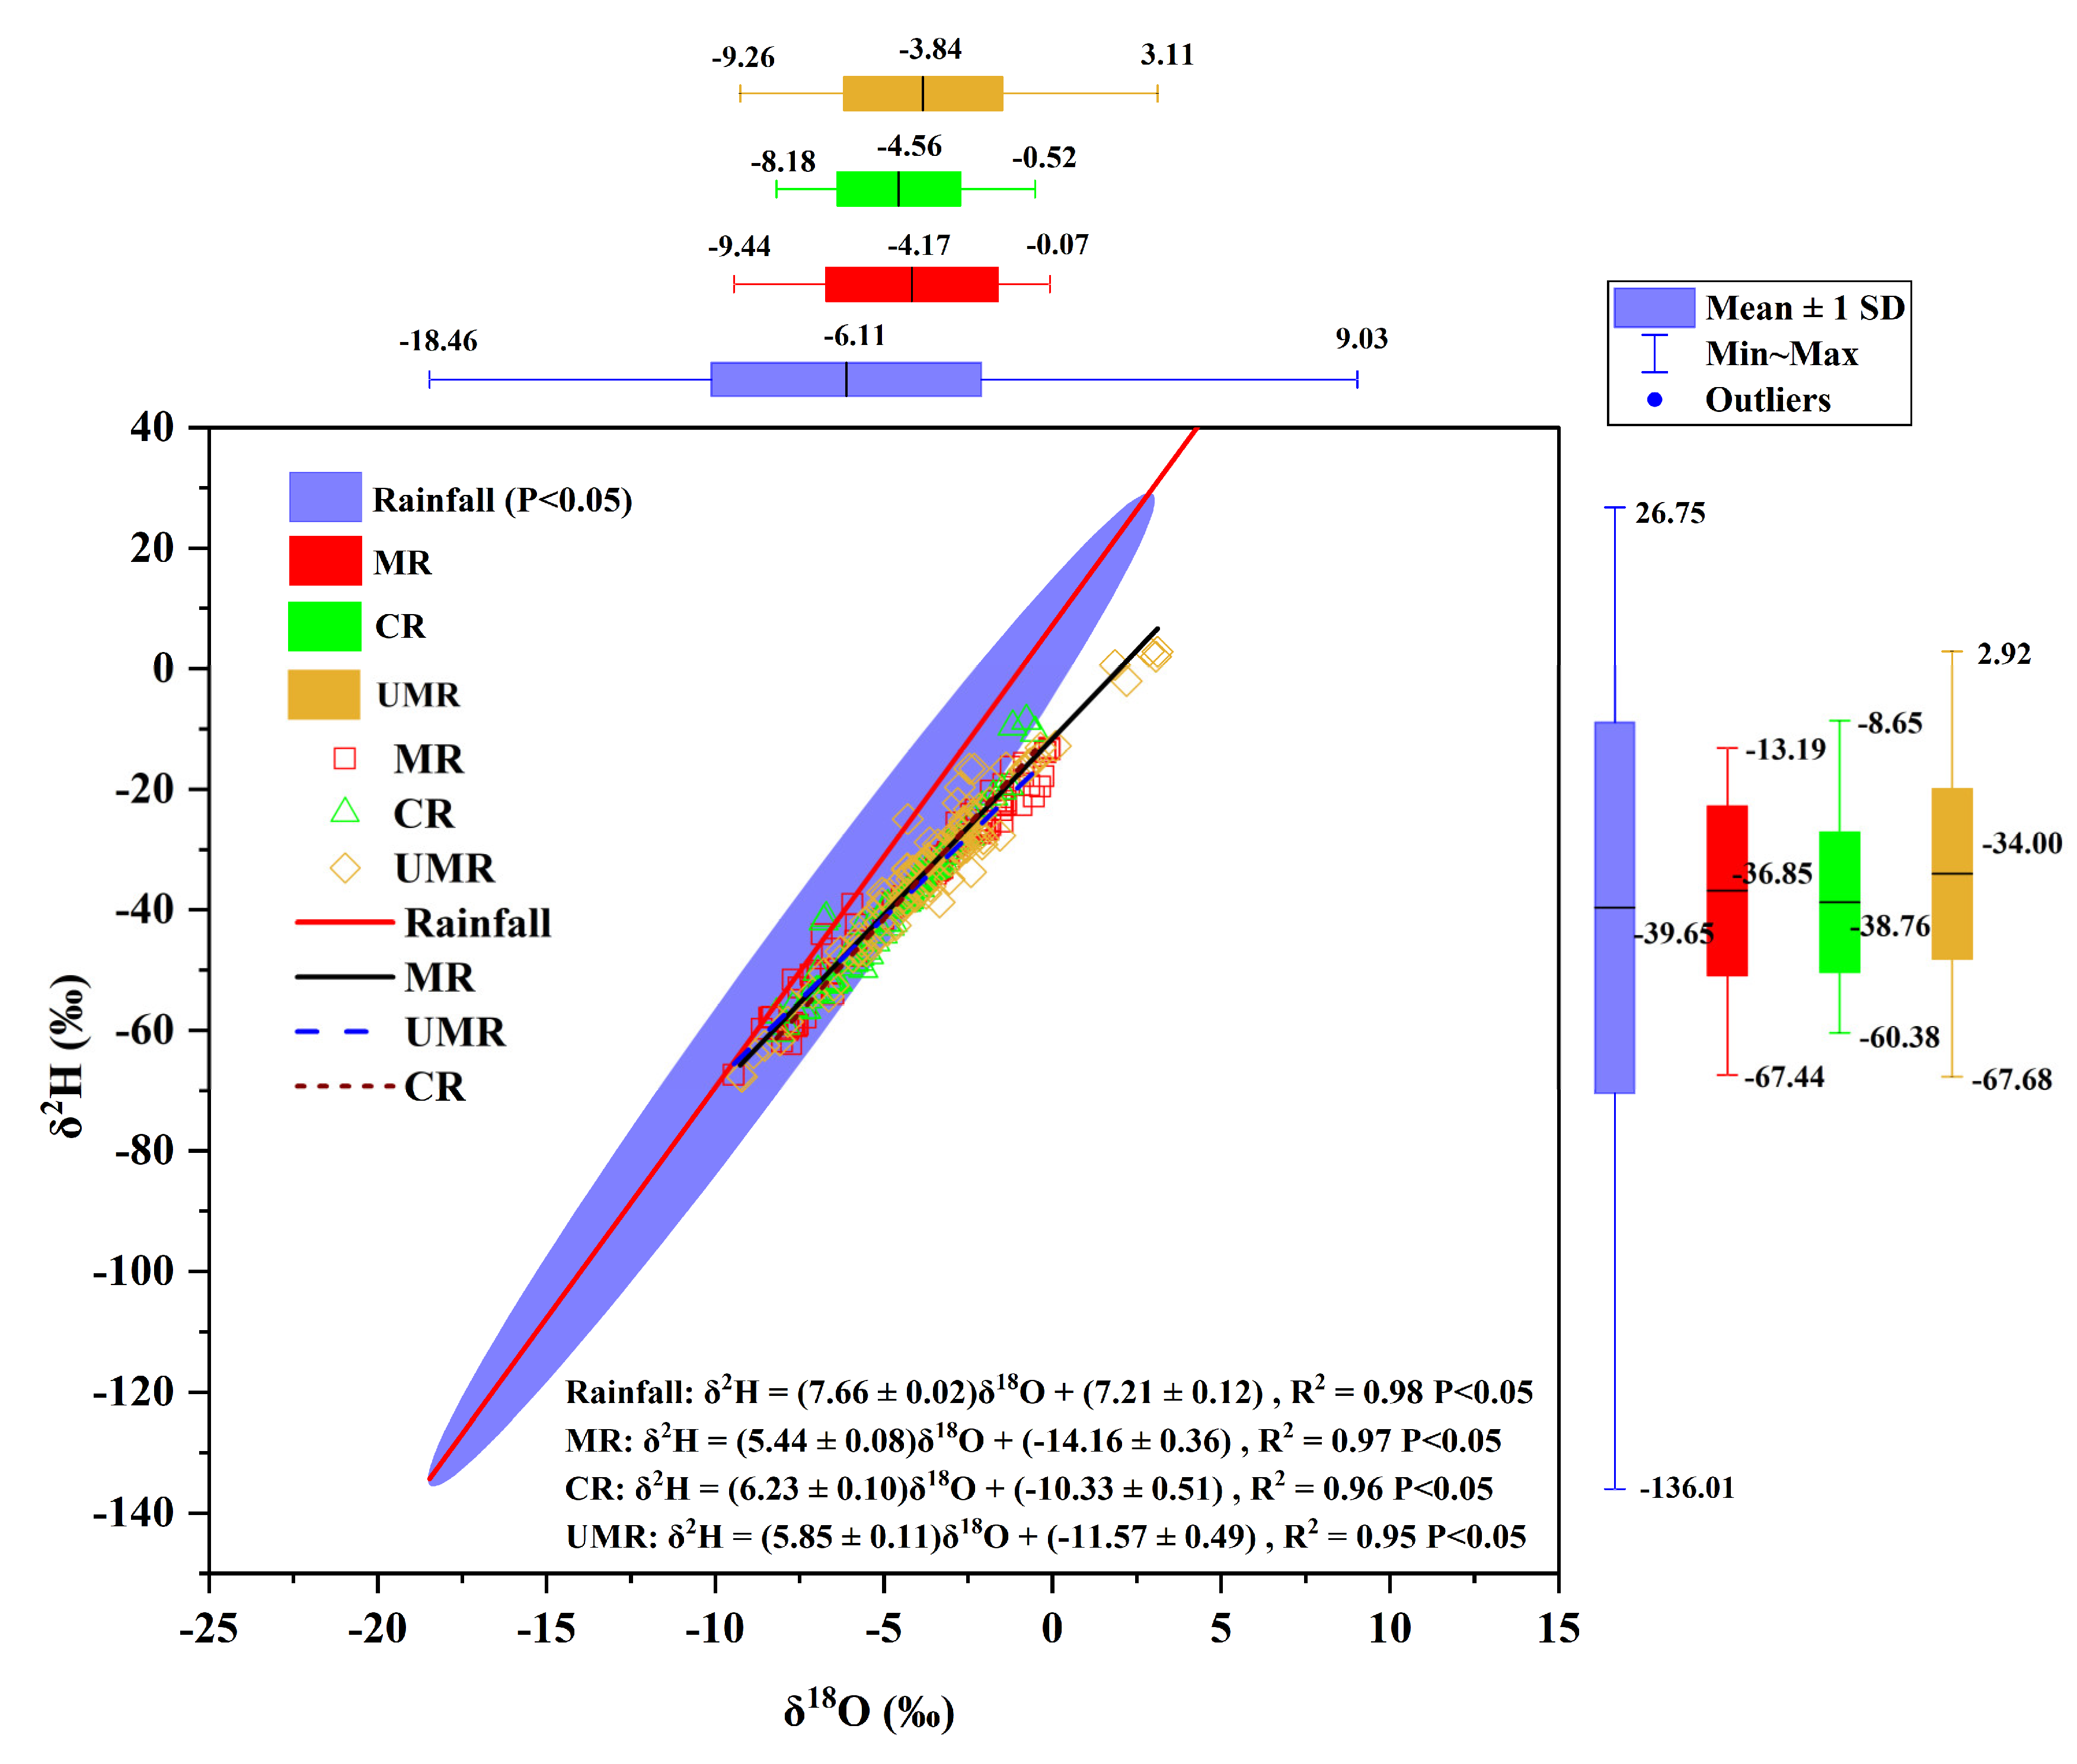
Figure 5.
The fraction of Upper Mun River (FUMR) and Chi River (FCR) to the main Mun River obtained from the observed river discharge (Q) and the ANN results developed by the stable isotopes (δ18O) and flow rate of Upper Mun River and Chi River; (a) Training period (80 percent of whole study period of January 2019 – December 2021), and (b) Testing period (20 percent of whole study period of January 2019 – December 2021).
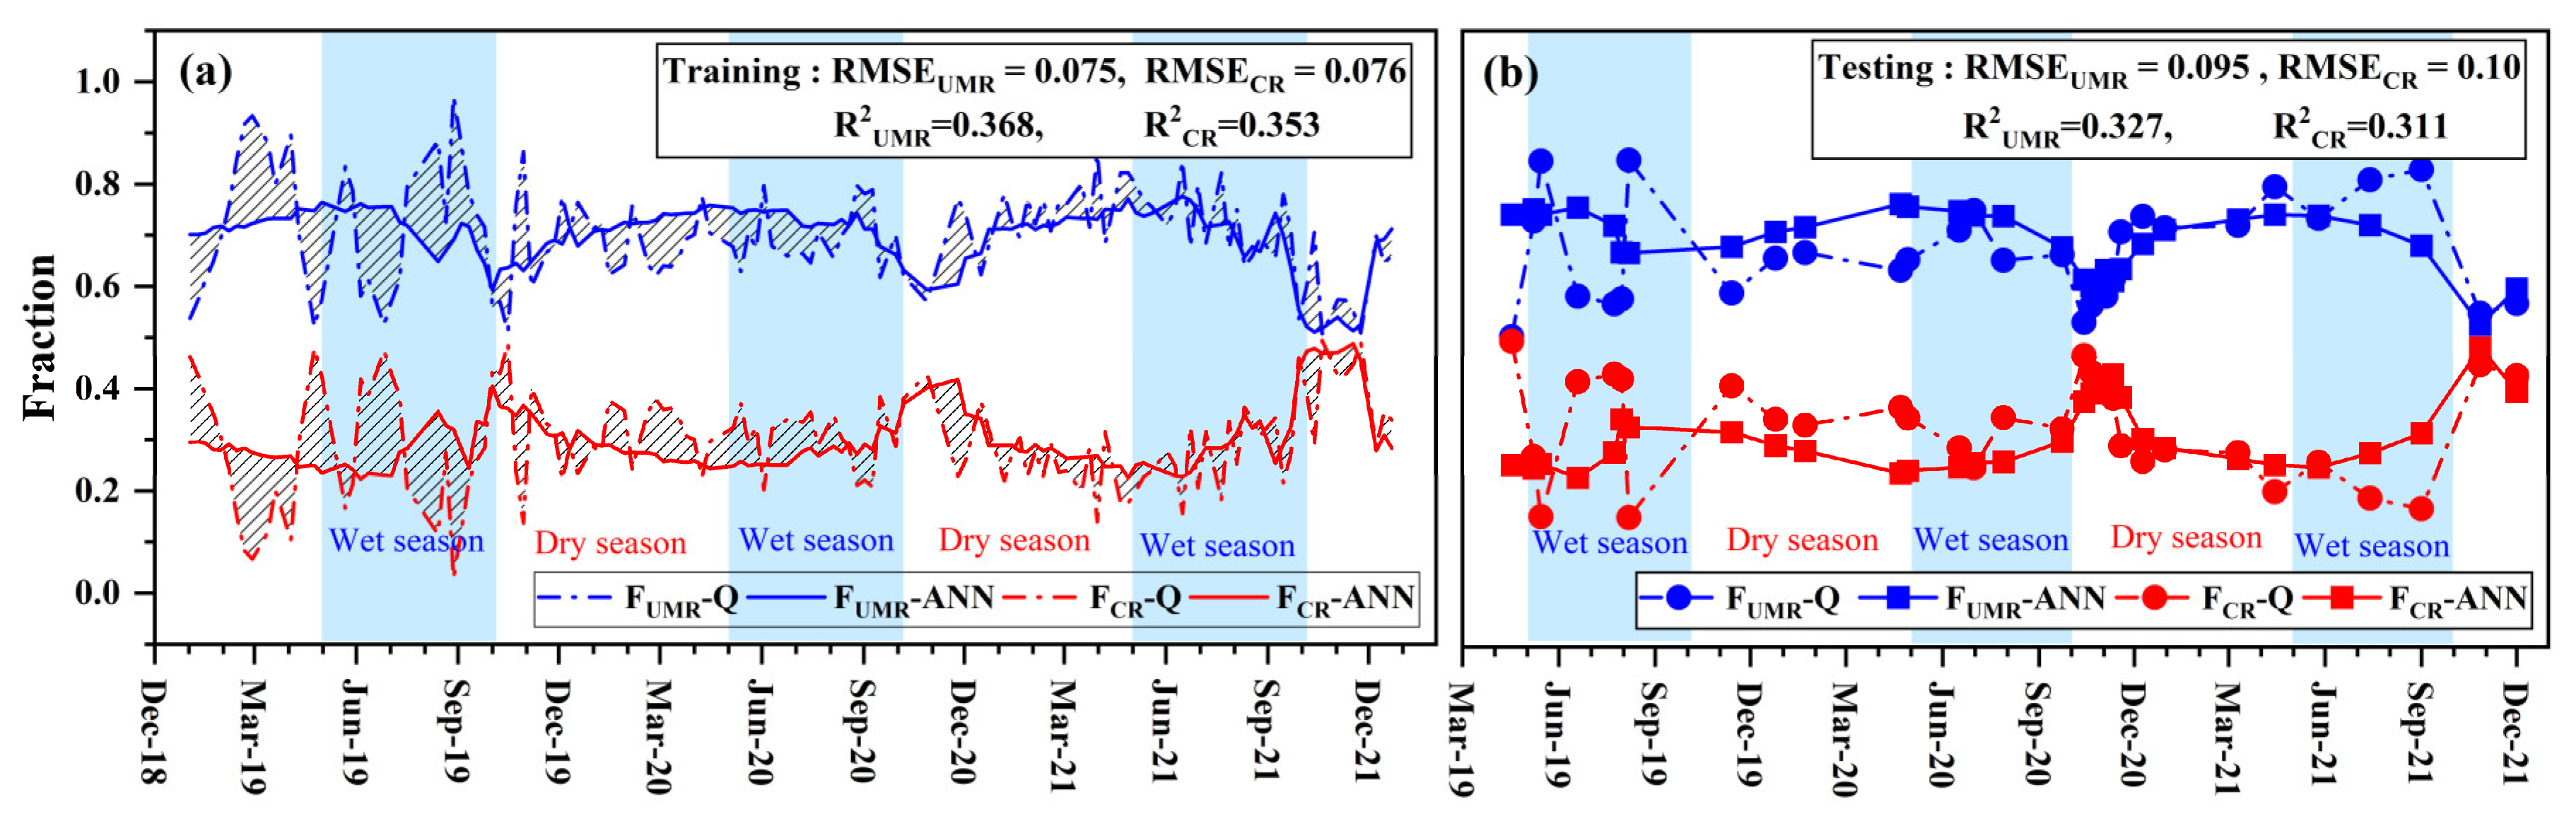
Figure 6.
The fraction of Upper Mun River (FUMR) and Chi River (FCR) to the main Mun River obtained from the observed river discharge (Q) and the IEMMA results.
Figure 6.
The fraction of Upper Mun River (FUMR) and Chi River (FCR) to the main Mun River obtained from the observed river discharge (Q) and the IEMMA results.
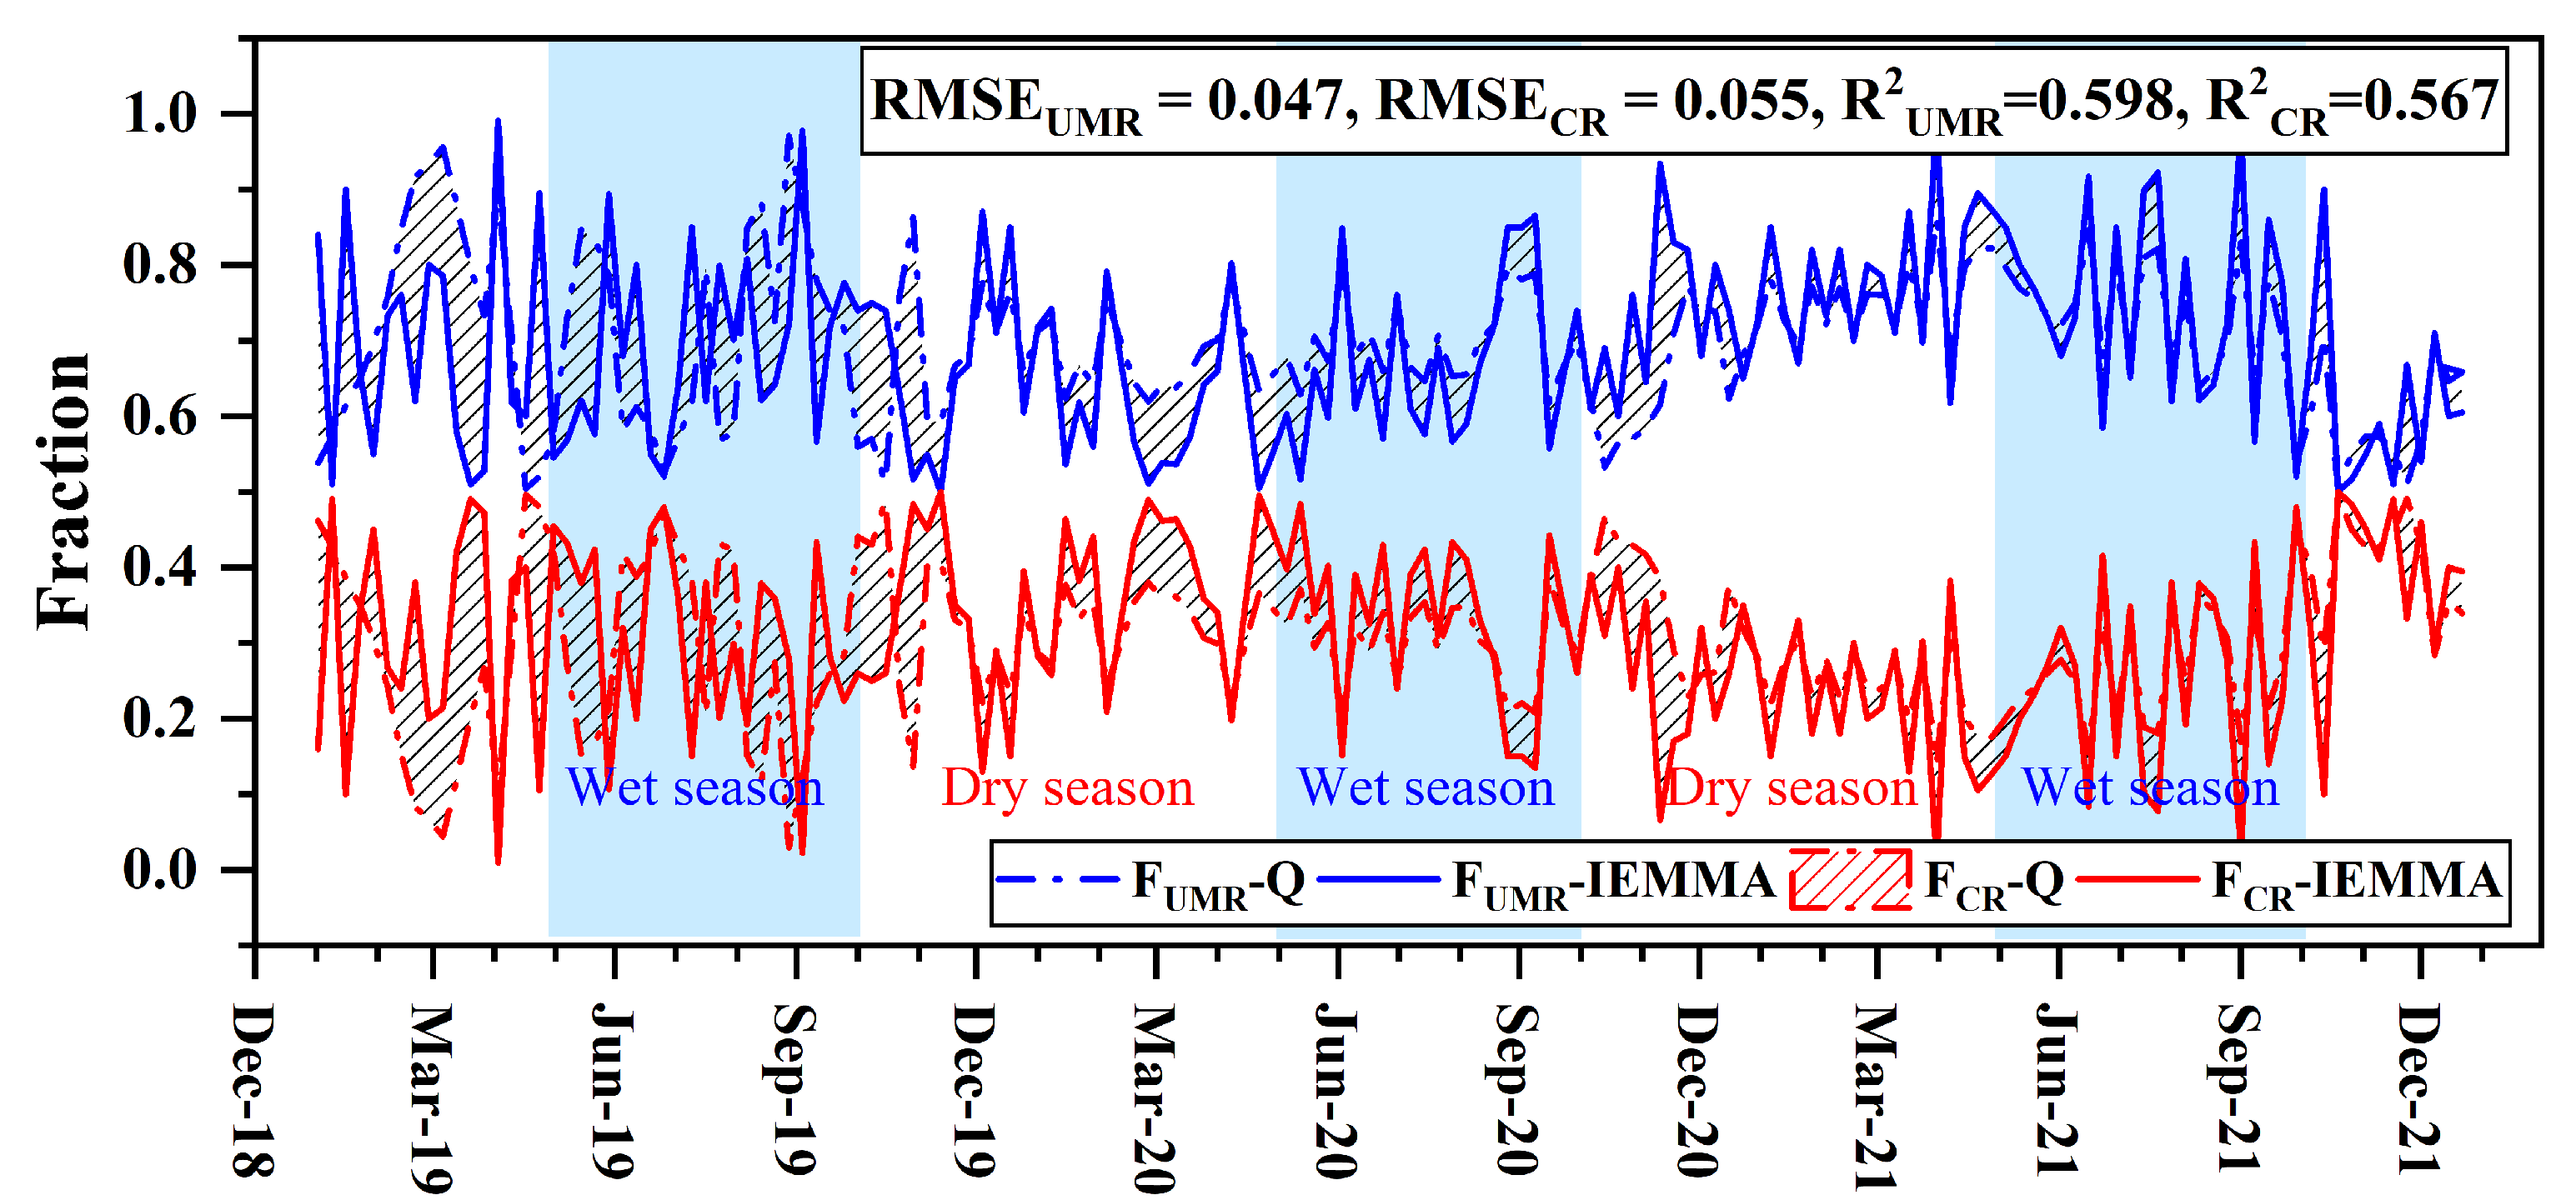
Figure 7.
Boxplot of the fraction of Upper Mun River (FUMR) and Chi River (FCR) to the main Mun River obtained from the ANN results, the IEMMA results, and the observed river discharge (Q).
Figure 7.
Boxplot of the fraction of Upper Mun River (FUMR) and Chi River (FCR) to the main Mun River obtained from the ANN results, the IEMMA results, and the observed river discharge (Q).
Disclaimer/Publisher’s Note: The statements, opinions and data contained in all publications are solely those of the individual author(s) and contributor(s) and not of MDPI and/or the editor(s). MDPI and/or the editor(s) disclaim responsibility for any injury to people or property resulting from any ideas, methods, instructions or products referred to in the content. |
© 2024 by the authors. Licensee MDPI, Basel, Switzerland. This article is an open access article distributed under the terms and conditions of the Creative Commons Attribution (CC BY) license (http://creativecommons.org/licenses/by/4.0/).
Copyright: This open access article is published under a Creative Commons CC BY 4.0 license, which permit the free download, distribution, and reuse, provided that the author and preprint are cited in any reuse.


