Submitted:
28 March 2024
Posted:
28 March 2024
You are already at the latest version
Abstract
Xinjiang, as a climate-sensitive region in northwest China, holds significant importance in studying extreme weather events for agricultural production and socioeconomic development. Based on data from 52 meteorological stations and 23 extreme climate indicators in Xinjiang from 1960 to 2021, the 5a moving average, linear trend estimation, climate tendency rate, and GIS spatial analysis methods are used to analyze the distribution and change characteristics of extreme climate. The results revealed that from 1960 to 2021, TXx, TNx, TXn, TNn, FD, ID, TN10p, TX10p, and WSDI showed a significant upward trend, while SU, TR, TN90p, TX90p, and CSDI showed a significant downward trend. What is more, the range of changes in the extreme temperature indexes from 1990 to 2021 is higher than that of 1960 to 1989. The high-value areas of extreme indexes are primarily concentrated in the northern part, while the high-value areas of cold event indexes are mainly distributed in the southern part. The upward/downward trends all accounting for over 80.00% of the entire region. The Rx1day, Rx5day, PRCPTOT, R95p, R99p, R10, R20, and R25 showed a significant growth trend from 1960 to 2021, and the range of change in the extreme precipitation indexes from 1990 to 2021 was lower than that from 1960 to 1989. Moreover, their high-value areas and high climate tendency areas are mainly concentrated in the northern and western parts of Xinjiang, with upward trends all accounting for over 71.00% of the entire region. The research results provide theoretical foundations for formulating climate risk strategies in the northwest region of China.
Keywords:
extreme climate
; climate tendency rate
; spatial-temporal differentiation
; variation characteristics
1. Introduction
Extreme weather, as a phenomenon where regional weather surpasses the threshold of long-term climate variability within a short period, often triggers a series of natural disasters such as heatwaves due to extreme high temperatures, cold snaps caused by extreme low temperatures, droughts resulting from prolonged insufficient precipitation, and floods caused by intense rainfall [1,2,3]. Although extreme climate events have low statistical occurrence probabilities, they exhibit strong abruptness and destructiveness, leading to significant negative impacts on ecological environments and human socioeconomic systems[4,5,6,7], thus garnering widespread attention from scholars both domestically and internationally. Against the backdrop of global warming, approximately 70% of regions globally, including Greece and Europe, exhibit an increasing trend in extreme warm events, while most extreme cold events tend to decrease[8,9,10,11,12]. In addition, the frequency and intensity of extreme precipitation are continuously increasing in most regions globally, with the phenomenon of enhanced response to extreme precipitation observed in both humid and arid regions[13,14,15,16,17,18,19]. Since the 1960s, extreme low-temperature events in China have significantly decreased while extreme high-temperature events have markedly increased[20,21,22,23]. Regionally, extreme high/low air temperatures in the Yangtze River Basin[24], Wei River Basin[25], and Northwest China[26] have shown an upward trend. Extreme precipitation events in China have notably increased in frequency, while the frequency of precipitation events has decreased somewhat[27]. The trend changes of extreme precipitation events exhibit strong regional differences, with decreasing trends in Northeast and North China, while increases are noted in regions like Northwest China[28]. The increasing frequency and intensity of extreme weather events have already caused significant impacts on agricultural production and socioeconomic conditions in China[29,30], particularly evident in China’s climate-sensitive regions[31].
Xinjiang is not only a crucial agricultural production region in China but also globally renowned as the land of melons and fruits and a prime cotton-producing base, and it holds a strategically significant position in national development and social stability[32]. Xinjiang features a temperate continental arid climate characterized by scarce and highly unevenly distributed precipitation[33]. Its diverse land-forms encompass mountains, basins, plateaus, deserts, gravel plains, and oases, making it one of China’s most ecologically sensitive and climatically vulnerable areas[34]. In recent years, numerous scholars have conducted relevant research on extreme climate in Xinjiang. Chen et al. show a high correlation between extreme temperature changes and climate warming in Hami, Xinjiang, and the increase in TN10p and TX10 is the main reason for the temperature increase[35]. Lv et al. found that the extreme temperature warm indexes in Altay, Xinjiang showed an upward trend, while the extreme temperature cold indexes showed a downward trend, with the change in the warm indexes being smaller than the cold indexes[36]. Ding et al. have shown that the extreme precipitation and humidity indexes in the Abihu Basin of Xinjiang are showing an increasing trend, and most of the extreme precipitation indices are significantly positively correlated with the total annual precipitation[37,38]. Previous studies have mainly focused on a few extreme climate events in a certain region of Xinjiang, and there is relatively little comprehensive research on various extreme climate events, especially in terms of the combination of spatio-temporal distribution and change characteristics of extreme climate events.
Therefore, this article utilizes daily maximum temperature, minimum temperature, and precipitation data from 52 meteorological stations from 1960 to 2021 to quantitatively describe the spatio-temporal distribution and change patterns of 23 extreme climate events in Xinjiang. The aim is to provide theoretical support for reducing the impact of natural disasters in northwest China and formulating climate risk strategies.
2. Materials and Methods
2.1. Study Area
Xinjiang (73°20′E~96°25′E and 34°15′N~49°10′N) is located in the northwest border of China, within the hinterland of the Eurasian continent. It covers one-sixth of China’s total land area, making it the largest province in China[39]. The total area of mountainous areas in Xinjiang is 637100 km2, with 83100 km2 of plateaus, 107300 km2 of inter-mountain basins, 85800 km2 of hills, and 746800 km2 of plains (including deserts and Gobi)[40]. The terrain and land-forms can be summarized as “Three mountains sandwiched by two basins” and the barrier of high mountains makes it difficult for moist ocean air to penetrate inland[41]. Numerous inland rivers originating from high mountain ice and snow melt water flow profusely, giving birth to a unique mountain-oasis-desert ecosystem, which is one of the most fragile ecological environments in China and highly sensitive to extreme weather responses[42]. The distribution of meteorological stations in the study area are illustrated in Figure 1.
2.1. Data and Methods
Before conducting calculations, the station data undergo quality control: if the consecutive days of missing data at a station exceed 5% of the total days, the data from that station are removed. If data for a specific date at a station are missing, interpolation is performed using the average value of the same date from other years at that station[43]. Employing these methods, observation data for daily maximum temperature, minimum temperature, and precipitation from 52 stations are obtained from January 1, 1960, to December 31, 2021. The original observation data is sourced from the China Meteorological Data Service Center (http://data.cma.cn/).
Before processing the meteorological data, rigorous quality control is conducted, including extreme value checks and temporal consistency tests, to remove outliers and ensure temporal correspondence among meteorological elements[44]. The calculation methods for the extreme climate index used in the study are derived from relevant literature[45,46,47,48,49,50,51,52,53,54]. The 14 extreme temperature indexes can fully reflect the changes of extreme temperature events in four aspects: extreme, cold, warm and duration, and the 9 extreme precipitation indexes can fully reflect the changes of extreme precipitation events in three aspects: scale, intensity and precipitation days. All of them are highly representative (Table 1).
Firstly, the moving average method is utilized to process the time series data, eliminating the instability of each index’s time series[31]. Specifically, the moving average is calculated by sequentially adding and subtracting the data of the preceding and subsequent 5 years to compute the moving average value. Next, the linear trend estimation method is employed to infer the inter-annual variation trend and magnitude of the extreme climate index. A positive climate tendency rate indicates an upward trend of the extreme climate index over time, while a negative trend indicates a downward trend[35]. Finally, GIS spatial analysis is employed to analyze the spatial distribution changes characteristics of the extreme climate indices. The significance of changes in extreme climate indices is determined using the P-value significance test method[48].
3. Results
3.1. Spatio-Temporal Pattern and Change of Extreme Temperature
3.1.1. Analysis of Time Characteristics
- (1)
- Extreme Value Index
The extreme value indices of Daily Maximum Temperature Maximum (TXx), Daily Minimum Temperature Maximum (TNx), Daily Maximum Temperature Minimum (TXn), and Daily Minimum Temperature Minimum (TNn) exhibited significant increasing trends (p<0.01) from 1960 to 2021 (Table 2). These four extreme value indices ranged from 34.18 to 38.78°C, 20.65 to 24.93°C, -18.78 to 9.30°C, and -29.72 to 20.97°C, with respective averages of 36.42°C, 22.43°C, -13.51°C, and -24.92°C. The climate tendency rates were measured at 0.14°C/10a, 0.34°C/10a, 0.37°C/10a, and 0.68°C/10a. Notably, the climate tendency rates of TXx and TNx during 1990-2021 exceeded those during 1960-1989, while the trends for the other two indices were opposite. TXx continues its upward trajectory, directly impacting crop growth and subsequently leading to decreased agricultural yield and quality, thereby affecting food safety. The fluctuations in TXn and TNn not only disrupt ecological balance but also potentially prompt alterations in agricultural planting structures in high-latitude areas due to changes in heat distribution.
- (2)
- Cold Event Index
The cold event indices of Frost Day (FD), Frozen Day (ID), Cold Night (TN10p), and Cold Daytime (TX10p) demonstrated significant increasing trends (p<0.01) from 1960 to 2021 (Table 2). These four cold event indices ranged from 141.02 to 176.54d, 52.69 to 88.56d, 8.26 to 43.97d, and 11.11 to 33.47d, with respective averages of 158.49d, 67.76d, 21.18d, and 21.26d. The climate tendency rates were calculated at -3.47d/10a, -1.02d/10a, -3.95d/10a, and -1.06d/10a. Interestingly, the climatic tendency rates of FD and ID during 1990-2021 surpassed those observed during 1960-1989, while the trends for the other two indices were opposite. The decrease in FD results in an increase in accumulated temperature, which proves beneficial for plant growth. Moreover, the reduction of TN10p and TX10p might lead to decreased heating demands for residents and businesses, consequently contributing to energy conservation and a reduction in greenhouse gas emissions.
- (3)
- Warm Event Index
The warm event indices for Summer Day (SU), Hot Nights (TR), Warm Night (TN90p), and Warm Daytime (TX90) displayed significant increasing trends (p<0.01) from 1960 to 2021 (Table 2). These four warm event indices ranged from 95.73 to 124.04d, 10.62 to 26.85d, 4.52 to 42.81d, and 6.17 to 35.10d, respectively, with average values of 110.78d, 17.59d, 19.94d, and 20.07d. The climate tendency rates were measured at 1.85d/10a, 2.03d/10a, 2.07d/10a, and 4.12d/10a. Notably, the climatic tendency rates of all four indices during 1990-2021 exceeded those observed during 1960-1989. On one hand, the continuous rise in warm event indices provides more heat for crop growth, thus promoting improvements in agricultural productivity. On the other hand, it exacerbates high-temperature disasters and heat waves, potentially leading to crop reduction or even total crop failure.
- (4)
- Persistence Index
From 1960 to 2021, the Cold Duration (CSDI) ranged from 0.35 to 21.90d, with an average of 5.80d (Table 2). The climatic tendency rates of the Cold Duration Index during both 1960-1989 and 1990-2021 exhibited significant increasing trends, with rates of -1.79d/10a and -0.08d/10a, respectively (p<0.01). Similarly, the Heat Duration (WSDI) ranged from 0.65d to 17.08d during 1960-2021, with an average of 5.95d and a climatic tendency rate of 1.13d/10a. Notably, the climate tendency rate from 1990 to 2021 (1.15d/10a) surpassed that from 1960 to 1989. The sustained output of high temperatures can lead to adverse effects, including reduced crop yields, etc., as it may surpass the adaptive capacity of people, animals, and plants.
3.1.2. Analysis of Spatial Characteristics
- (1)
- Extreme Value Index
In Xinjiang, the TXx, TNx, TXn, and TNn ranged between 19.85 to 45.62°C, 7.97 to 30.84°C, -28.97 to 5.74°C, and -40.99 to 14.24°C, respectively, with average values of 36.42°C, 22.43°C, -13.51°C, and -24.92°C (Figure 2). The distribution patterns of TXx and TNx exhibited similarities, with high values observed in Bazhou, Tulufan, Yicheng, and other areas, while low values were prevalent in Yili, Bozhou, Kezhou, etc . Similarly, the distribution patterns of TXn and TNn displayed resemblances. High-value regions were typically found in Kashi, Hetian, Bazhou, and other southern areas, whereas low-value regions were concentrated in Aletai and other northern regions. This distribution pattern underscores a geographical trend where the southern region surpassed the northern region in extreme temperature values.
The climate tendency rates of TXx, TNx, TXn, and TNn in Xinjiang over the past 62 years ranged from -0.42°C/10a to 0.61°C/10a, -0.53°C/10a to 1.04°C/10a, -0.08°C/10a to 1.18°C/10a, and -0.06°C/10a to 2.04°C/10a, respectively (Figure 3). These changes spanned from -2.604 to 3.782°C, -3.29 to 6.45°C, -0.50 to 7.32°C, and -0.37 to 12.65°C, with an upward trend accounting for 80.77%, 94.23%, 98.08%, and 98.08%, respectively (Table 3). Specifically, the high-value climate tendency rate of TXx was observed in Aletai, Hami, Bazhou, etc., while low-value areas were evident in Bozhou , Youcheng, etc. Similarly, TNx exhibited high-value climate tendency rates in Aletai , Hami, etc., with low-value areas observed in Aksu, etc. For TXn, high-value climate tendency rate areas were identified in Aletai, Aksu, Yili, etc., while low-value areas included Kezhou, Kashi, Hetian, Bazhou, etc. As for TNn, high-value regions were found in Tulufan, Hami, Aletai, etc., with low-value areas located in Bazhou , Aksu, etc.
- (2)
- Cold Event Index
The FD, ID, TN10p, and TX10p indices ranged from 106.77 to 288.89d, 18.85 to 144.42d, 19.95 to 20.84d, and 20.26 to 20.92d, respectively, with average values of 158.49 d, 67.76d, 20.41d, and 20.53d. All four cold event indices exhibited a geographical distribution pattern characterized by higher values in the north and lower values in the south (Figure 2).
The climate tendency rates of FD, ID, TN10p, and TX10p in Xinjiang over the past 62 years ranged from -9.76 to 2.10d/10a, -3.96 to 1.22d/10a, -8.53 to 2.05d/10a, and -3.09 to 0.70d/10a, respectively, with changes ranging from -60.51 to 13.02d, -24.55 to 7.56d, -52.89 to 12.71d, and -19.16 to 4.34d (Figure 3). The decreasing tendency accounted for 98.08%, 86.54%, 98.08%, and 98.08%, respectively (Table 3). Specifically, the climate tendency rate of FD was higher in Aksu, Bazhou, etc., while being lower in Hami, Tulufan, etc. Similarly, the high-value areas of the climate tendency rate of ID were situated in Aksu, Bazhou, etc., with low-value areas observed in Bozhou, Yili, Tacheng, etc. Regarding TN10p, high-value regions with climate tendency rates were identified in Aksu, Wushi, Changji, etc., while low-value areas were found in Kezhou, Aletai, Tulufan, etc. Similarly, the high-value areas of climate tendency rates for TX10p were located in Youcheng, Changji, Wushi,etc. , whereas areas with low values were observed in Aletai, Hami, Tulufan, etc .
- (3)
- Warm Event Index
The SU, TR, TN90p, and TX90p indices in Xinjiang ranged from 0.00 to 181.77d, 0.00 to 102.42d, 19.84 to 20.59d, and 19.91 to 20.44d, respectively, with average values of 110.78d, 17.59d, 20.16d, and 20.23d (Figure 2). The distribution characteristics of SU showed higher values in the south and lower values in the north. The areas with higher values of TR were clustered in Tulufan, etc., whereas lower values were observed in Aletai, Yili, Kezhou, etc. Similarly, high-value regions of TN90p were situated in Changji, Hami, Tulufan, etc., while low-value areas were found in Bazhou and Akesu, etc. For TX90p, high-value areas were identified in Kezhou, Hetian, Bozhou, Hami, etc., with low-value areas observed in Bazhou, Akesu, etc.
The climate tendency rates of SU, TR, TN90p, and TX90p in Xinjiang ranged from -3.80 to 5.52d/10a, -4.55 to 12.39d/10a, -3.11 to 9.71d/10a, and -3.41 to 4.99d/10a, respectively (Figure 3). These changes spanned from -23.56 to 34.22d, -28.21 to 76.82d, -19.28 to 60.20d, and -21.14 to 30.94d, with upward trends accounting for 90.38%, 84.62%, 96.15%, and 90.38%, respectively (Table 3). Specifically, the climate tendency rates of SU were higher in Aletai, Hami, etc., lower in Bozhou, Wushi, etc., and Tuergate Station in western Kezhou recorded values of 0. The high-value areas of climate tendency rates of TR were located in Tulufan, Hami, etc., while low-value areas were found in Akesu, Aletai, etc., demonstrating a west-to-east decreasing trend, with zero TR occurrences in Zhaosu and four other stations. Similarly, high-value regions of TN90p were situated in Hami, Tulufan, Hetian, etc., while low-value areas were observed in Akesu, Youcheng, Changji, etc. For TX90p, high-value regions were located in Bazhou, Tulufan, Hami, etc., with low-value areas in Bozhou, Youcheng, etc.
- (4)
- Duration Index
The CSDI and WSDI in Xinjiang ranged between 1.68 to 9.82d and 3.34 to 9.27d, respectively, with averages of 5.80d and 5.95d (Figure 2). Areas with higher CSDI values are concentrated in Akesu, Youcheng, Tulufan, etc., while lower values are observed in Aletai, Changji, Hami, and surrounding regions. Meanwhile, the WSDI indicates that higher values are prominent in Akesu, Bazhou, etc., gradually declining towards adjacent areas.
The climatic tendency rates of CSDI and WSDI in Xinjiang ranged between -5.24 to 0.14d/10a and -0.54 to 3.05d/10a (Figure 3), respectively. The variation spans from -32.49 to 0.87d and -3.35 to 18.91d, with upward trends constituting 94.23% and 86.54%, respectively (Table 3). The climatic tendency rates of CSDI are notably high in Bazhou, Changji, etc., whereas they are lower in Bozhou, Tacheng, Tulufan, etc. Similarly, areas with higher WSDI values are concentrated in southern regions such as Hetian and Bazhou, whereas lower values prevail in northern regions like Tacheng, Youcheng, and Aletai, indicating a geographical distribution trend where the south experiences more significant changes compared to the north.
3.2. Spatio-Temporal Pattern and Changes of Extreme Precipitation
3.2.1. Analysis of Temporal Characteristics
- (1)
- Precipitation Scale index
The analysis of precipitation scale indices, including Maximum 1-day precipitation (Rx1day), Maximum 5-day precipitation (Rx5day), and Annual precipitation (PRCPTOT), reveals significant increasing trends (p < 0.01) from 1960 to 2021 (Table 4). Over this period, the values of these indices varied within ranges of 12.59 to 23.93mm, 15.93 to 35.33mm, and 60.57 to 192.54mm respectively, with corresponding average values of 17.26mm, 24.39mm, and 114.20mm. Notably, the climate tendency rates were calculated at 0.72mm/10a, 1.24mm/10a, and 13.22mm/10a. While the Rx1day index did not exhibit a significant increasing trend from 1990 to 2021, the other two indices demonstrated significant increases (p < 0.01) during both 1960-1989 and 1990-2021 periods. Xinjiang, being an inland region characterized by an arid climate and relatively low precipitation, stands to benefit from increased precipitation. This rise in precipitation levels holds promise for alleviating water resource shortages, thereby playing a crucial role in promoting agricultural production and enhancing the ecological environment. However, it’s essential to note that the heightened precipitation may result in extreme hydrological events such as flash floods. These events pose significant risks, potentially damaging farmlands, infrastructure including roads and bridges, and even endangering residents’ lives.
- (2)
- Precipitation Intensity Index
The Precipitation intensity (SDII) exhibited an insignificant downward trend (p≥0.01), while the two indexes of Intense precipitation (R95p) and Extreme precipitation (R99) exhibited significant increasing trends (p<0.01) from 1960 to 2021(Table 4). The values of the three precipitation intensity indexes ranged from 3.65 to 5.25mm/d, 10.22 to 57.46mm, and 1.88 to 21.74mm, with an average of 4.52mm/d, 7.46mm, and 24.82mm. The calculated climate tendency rates were -0.010mm/(d·10a), 1.13mm/10a, and 3.16mm/10a . Interestingly, while SDII exhibited a significant downward trend during 1960-1989, it displayed an insignificant upward trend during 1990-2021. In contrast, both R95p and R99 exhibited significant increasing trends (p < 0.01) throughout the entire period. In mountainous regions, heavy rainfall can precipitate geological disasters such as landslides and mud-rock flows, particularly prevalent in certain mountainous areas of southern Xinjiang, owing to topographic factors.
- (3)
- Precipitation Day Index
The precipitation day indices for Moderate precipitation (R10), Heavy precipitation (R20), and Rainstorm precipitation (R25) have shown significant increasing trends (p<0.01) from 1960 to 2021 (Table 4). These indices ranged from 1.06 to 4.96d, 0.21 to 1.29d, and 0.06 to 0.67d, with respective averages of 2.57d, 0.53d, and 0.25d. The climate tendency rates are measured at 0.31d/10a, 0.07d/10a, and 0.04d/10a. From 1960 to 1989 and 1990 to 2021, all three indices exhibited increasing trends, with significance noted in all cases except for the number of heavy rain days from 1990 to 2021. Across the board, the minimum, maximum, average, and climate tendency rates of the three indices adhere to a consistent pattern: the number of moderate precipitation days (R10) > the number of heavy precipitation days (R20) > the number of rainstorm precipitation days (R25). Despite the relatively small rainfall intensity of Moderate precipitation (R10), prolonged occurrences can lead to delayed ground water discharge, potentially resulting in waterlogging of croplands and adversely affecting agricultural production.
3.2.2. Analysis of Spatial Characteristics
- (1)
- Precipitation Scale Index
The Rx1day, Rx5day, and PRCPTOT in Xinjiang exhibited ranges of 5.34 to 34.93mm, 5.84 to 47.00mm, and 10.69 to 458.15mm, respectively, with average values of 17.26mm, 24.39mm, and 114.20mm. The geographical distribution of these three indices displayed similarities. Areas with higher values were notably present in Bozhou, Yili, and Tacheng, while regions with lower values were observed in Bazhou, Tulufan, and Hetian. This pattern signifies a decreasing geographical distribution from northwest to southeast (Figure 4).
The climate tendency rates of Rx1day, Rx5day, and PRCPTOT in Xinjiang over the past 62 years ranged between -1.14 to 2.11mm/10a, -0.84 to 4.52mm/10a, and -2.81 to 58.19mm/10a, respectively (Figure 5). Changes in these rates spanned from -7.07 to 13.08mm, -5.21 to 28.02mm, and -17.42 to 360.78mm, with upward trends accounting for 84.62%, 88.46%, and 96.16% respectively (Table 5). The geographical distribution of climate tendency rates for these three indices is similar, with high-value areas primarily concentrated in Kezhou, Yili, Aletai, and Hami, while low-value areas are predominantly found in Bazhou and Tulufan. This distribution pattern suggests a trend of higher rates in the west and northeast, and lower rates in the southeast.
- (2)
- Precipitation Intensity Index
The SDII, R95p, and R99p indices in Xinjiang ranged from 3.01 to 7.13mm/d, 2.10 to 89.25mm, and 0.55 to 25.63mm, respectively, with averages of 4.52mm/d, 24.82mm, and 7.46mm (Figure 4). High-value areas of SDII were predominantly distributed in southern regions such as Wushi, Bazhou, and Hetian, whereas low-value areas were found in northern regions like Tulufan and Aletai. The geographical distribution of R95p and R99p exhibits similarities. High-value areas were mainly concentrated in western regions such as Kezhou, Yili, and Bozhou, as well as northern regions like Aletai, while low-value areas were primarily located in southern and eastern regions such as Hetian, Bazhou, Tulufan, and Hami.
The climate tendency rates of SDII, R95p, and R99p in Xinjiang ranged from -0.39 to 0.21mm/(d·10a), -2.86 to 13.05mm/10a, and -1.98 to 5.20mm/10a, respectively (Figure 5). Changes in these rates ranged from -2.42 to 1.30mm/d, -17.73 to 80.91mm, and -12.28 to 32.24mm , with upward trends accounting for 44.23%, 86.54%, and 73.08%, respectively (Table 5). High climatic tendency rates of SDII were observed in Yili, Bozhou, Wushi, Aletai, Hami, etc., while lower rates were noted in Hetian and Bazhou, etc. The geographical distribution pattern for R95p and R99p mirrors each other, with high-value areas encompassing Yili, Aletai, Hami, etc, and low-value areas situated in Tulufan Bazhou, etc.
- (3)
- Precipitation Day Index
The R10, R20, and R25 indices in Xinjiang exhibited range of 0.15 to 12.79d, 0.02 to 2.39d, and 0.00 to 1.34d, respectively, with averages of 2.57d, 0.53d, and 0.25d (Figure 4). The geographical distribution of these indices was similar, with high-value areas clustered in Kezhou, Yili, Bozhou, and other regions, while low-value areas were predominantly distributed in Bazhou and Tulufan, etc.
Over the past 62 years, the climate tendency rates of R10, R20, and R25 in Xinjiang ranged between -0.12 to 1.23d/10a, -0.07 to 0.39d/10a, and -0.05 to 0.17d/10a, respectively (Figure 5). Changes in these rates ranged from -0.74 to 7.63d, -0.43 to 2.42d, and -0.31 to 1.05d, with upward trends accounting for 94.23%, 78.85%, and 71.15%, respectively (Table 5).The climate tendency rate of R10 was notably high in Kezhou, Wushi, Hami, etc., while being low in Tulufan, etc., indicating a decreasing geographical distribution pattern from northwest to southeast. Regions with high values of the climate tendency rate of R20 were concentrated in Yili, Wushi, Aletai, and Hami, while lower values were observed in Tacheng, Tulufan, Aksu, etc. Areas with high values of the climate tendency rate of R25 were located in Yili, Wushi, Aletai, and other regions, with low-value areas situated in Hetian, Aksu, and Bazhou, etc. Notably, in Tulufan Station, notablely, the number of R25 recorded over the 62-year period was zero.
4. Discussion
The world is undergoing notable transformations primarily characterized by climate warming[2]. A study focusing on extreme temperature patterns in Xinjiang from 1960 to 2021 reveals significant trends: the extreme value indexes, warm event indexes, and warm duration index demonstrate a pronounced upward trajectory, while the cold event indexes and cold duration index exhibit a significant decline. This trend aligns with observations in regions such as the Yangtze River Basin[24], the Wei River Basin[25], and Northwest China[26]. Furthermore, analysis indicates that the climate tendency rate of extreme temperatures during 1990-2021 surpasses that of 1960-1989. This suggests that Xinjiang is not only experiencing long-term extreme warming but also witnessing an intensified warming phenomenon over a shorter time scale. Previous studies have demonstrated that in the context of global warming, arid areas experience accelerated warming compared to other regions [55]. Xinjiang, being part of China’s arid zone, exhibits extreme temperature fluctuations significantly exceeding the global land average [56]. Metrics like TXx, TNx, TXn, TNn, FD, and SU demonstrate a faster rise or fall than the global land temperature average. When compared to the rate of extreme temperature change in China [57], indicators such as TNx, TXn, TNn, and TR display higher rates of increase, indicating Xinjiang’s heightened sensitivity to global warming. This heightened sensitivity can be attributed to Xinjiang’s predominantly dry climate with minimal rainfall, low vegetation coverage, and high ground reflectance. These conditions lead to rapid heat absorption and dissipation, resulting in notable daily and seasonal temperature fluctuations. Given the backdrop of intensified global warming in the foreseeable future, the rate of extreme temperature rise in Xinjiang may undergo further acceleration [31]. This could result in an extended growing season and elevated temperatures, potentially shifting the geographical range suitable for crop cultivation northward. Such changes might even enable the growth of a wider variety of crops, thereby expanding agricultural production possibilities. However, it’s crucial to acknowledge the significant negative ramifications associated with these shifts. They not only impact the natural environment but also exert profound effects on human socioeconomic activities and health. Therefore, it becomes imperative for Xinjiang to adjust its development model accordingly. Measures such as reducing emissions and radiation levels are essential to mitigate the trend of extreme temperature changes and alleviate their adverse impacts.
From 1960 to 2021, several extreme precipitation indices in Xinjiang, including Rx1day, Rx5day, PRCPTOT, R95p, R99p, R10, R20, and R25, all exhibit a significant increasing trend. These findings support the conclusion that precipitation in Xinjiang is moving towards extreme levels [38]. Notably, Li Juan’s research highlights a significant increasing trend in extreme precipitation across China, albeit with varying growth rates among different regions [27,28]. Situated in the northwest inland of China, Xinjiang encompasses a vast desert area totaling 430,400 square kilometers, representing nearly 60% of the northern desert sand region [58]. In terms of variation amplitude, indices such as Rx1day, Rx5day, and R20 surpass those observed in northwest China [59]. Moreover, the exponential growth rates of Rx1day, Rx5day, PRCPTOT, R95p, R99p, R10, R20, and R25 in Xinjiang exceed those of the northern desert sandy lands [58]. In comparison to the rain-rich southern regions [60], PRCPTOT in Xinjiang displays a more rapid increase. This suggests that the rising trend of extreme precipitation in Xinjiang aligns with the strengthening of water circulation and the overall surge in extreme weather events amidst global warming. Additionally, this trend is influenced by regional climate characteristics, resulting in a significant range of changes. The study further reveals that the high-value zones of these eight extreme precipitation indices, along with those of climate tendency, are predominantly found in Xinjiang’s northern and western regions, specifically within mountainous and nearby areas. Given Xinjiang’s mountainous terrain with intricate geological structures, excessive precipitation poses a significant risk, potentially leading to a range of disaster events such as mudslides and farmland waterlogging. Such occurrences severely jeopardize the safety of lives and property.Therefore, it is imperative to bolster infrastructure development and systematically enhance disaster prevention and mitigation capabilities in the region.
This article focuses on the combination of spatio-temporal distribution and change characteristics of extreme climate events in Xinjiang. which has a certain marginal contribution to the formulation of disaster prevention and mitigation policies and measures for climate disasters in Xinjiang. However, further refinement of research is needed in the future, closely integrating extreme climate with agricultural production and economic development, in order to effectively promote ecological protection and high-quality development in Xinjiang.
5. Conclusions
(1) From 1960 to 2021, Xinjiang experienced a significant upward trend in the extreme value index (TXx, TNx, TXn and TNn), warm event index (SU, TR, TN90p and TX90p), and duration index (WSDI), while witnessing a significant downward trend in the cold event index (FD, ID, TN10p and TX10p) and duration index (CSDI). Against the backdrop of global warming, Xinjiang is undergoing an increasingly warm process. The overall range of changes in the extreme temperature index from 1990 to 2021 surpasses that of 1960 to 1989. In a relatively short time frame, there is a discernible intensification in the warming phenomenon.
(2) The distribution and changes of extreme temperature events in Xinjiang exhibit regional disparities. The high-value areas of the Xinjiang extreme value index indexes(TXx, TNx, TXn and TNn) are predominantly situated in the northern part, whereas those of the cold event index(FD, ID, TN10p and TX10p) are primarily found in the southern region. Although variations exist in the distribution characteristics of climate tendency rates among different extreme temperature indices in Xinjiang, there is strong consistency in their statistical properties. The 16 extreme temperature indices have all shown an upward/downward trend of over 80.00% in the entire Xinjiang region, Among them, TXn, TNn, FD, TN10p, and TX10p accounting for 98.08% across Xinjiang, indicating pervasive extreme warming.
(3) Apart from Rx1day (1990-2021) and SDII (1960-1989), the nine extreme precipitation indices in Xinjiang all exhibited an upward trend during both 1960-1989 and 1990-2021. Precipitation trends in Xinjiang are veering towards extremism. The growth rate of nine precipitation indices was higher from 1960 to 1989 compared to 1990 to 2021, indicating a deceleration in extreme precipitation over a relatively short period.
(4) Spatial heterogeneity characterizes the distribution and variation of extreme precipitation events in Xinjiang. The high-value areas and the high climate tendency areas of Rx1day, Rx5day, PRCPTOT, R95p, R99p, R10, R20 and R25 are concentrated in the north and west, rendering them pivotal regions for future flood control efforts. With all upward trend accounting for over 71.00% of the entire region, the eight extreme precipitation indices showed an increasing trend in most areas of Xinjiang.
Author Contributions
Y.Y. designed the experiments and analyzed the results. W.C. assisted in paper design and review. All authors have read and agreed to the published version of the manuscript.
Funding
This research was supported by the National Social Science Fund of China (12CJY052), High level Talent Program of Shihezi University (KX019102), Philosophy and Social Science Planning Youth Project of Henan Province (2023CJJ181).
Data Availability Statement
The original observation data is sourced from the China Meteorological Data Service Center (http://data.cma.cn/).
Conflicts of Interest
The authors declare no conflict of interest.
References
- Doktycz, C.; Abkowitz, M. Loss and Damage Estimation for Extreme Weather Events: State of the Practice. Sustainability 2019, 11, 4243. [CrossRef]
- IPCC. Climate change 2013: Managing the risks of extreme events and disaster to advance climate change adaptation[M]. Cambridge: Cambridge University Press, 2013.
- J R W ,A D P ,E M O ; et al.Practical rare event sampling for extreme weather.[J].Chaos (Wood bury, N.Y.),2019,29(5):053109. [CrossRef]
- Lin Q, Wang Y. Spatial and temporal analysis of a fatal landslide inventory in China from 1950 to 2016[J]. Landslides,2018,15(12): 2357-2372. [CrossRef]
- OLIVER E C J, DONAT M G, BURROWS M T; et al..Longer and more frequent marine heatwaves over the past century [J]. Nature Communications, 2018, 9: 1-12.. [CrossRef]
- Zhang W, Yang X. Extreme weather and climate events :Physical drivers , modeling and impact assessment. Journal of Marine Science and Engineering, 2020,8:448. [CrossRef]
- Centre for Research on the Epidemiology of Disasters (CRED), United Nations Office for Disaster Risk Reduction (UNISDR). The Human Cost of Weather-Related Disasters 1995–2015; UNISDR: Geneva, Switzerland,2015; Volume 30.
- Alexander L V, Zhang X, Peterson T C et al. Global observed changes in daily climate extremes of temperature and precipitation[J]. Journal of Geophysical Research, 2006,111(5):85-109. [CrossRef]
- Founda D, Pierros F, Petrakis M; et al. Variations and trends of the Urban Heat Island in Athens (Greece) and its response to heat waves[J]. Atmospheric Research,2015,161:1-13. [CrossRef]
- Alfieri L,Feyen L, Dottori F,et al. Ensemble flood risk assessment in Europe under high end climate scenarios. Global Environmental Change ,2015,35;199-212. [CrossRef]
- Stott P A, Christidis N, Oto F; et al. Attribution of extreme weather and climate-related events[J]. Wiley Interdisciplinary Reviews Climate Change,2016,7(1):23-41. [CrossRef]
- Wolfgang, K, Petra, L, Zbigniew, W.K. Changes in risk of extreme weather events in Europe. Sci. Policy 2019,100,74–83. [CrossRef]
- Donat M G, Alexander L V, Yang H et al. Updated analyses of temperature and precipitation extreme indices since the beginning of the twentieth century: The HadEX2 dataset[J]. Journal of Geophysical Research:Atmospheres, 2013,118(5):2098-2118. [CrossRef]
- Zhang W, Furtado K,Wu P; et al. Increasing precipitation variability on daily-to-multiyear time scales in a warmer world. Science Advances,2021,7(3): 25-50. [CrossRef]
- Junaid D ,Qayoom A D .The Structure of extreme precipitation and flood events over India in association with integrated water vapor transport from 1980 to 2015[J].Arabian Journal of Geosciences,2023,16(3):. [CrossRef]
- Taye, M.T.; Ntegeka, V.; Ogiramoi, N.P.; Willems, P. Assessment of climate change impact on hydrological extremes in two source regions of the Nile River Basin. Hydrol. Earth Syst. Sci. 2011, 15, 209–222. [CrossRef]
- Shuting Y ,Yali L ,Chong W ; et al.Subseasonal Variations of Convective and Microphysical Characteristics of Extreme Precipitation Over the Pearl River Delta at Monsoon Coast[J].Journal of Geophysical Research: Atmospheres,2023,128(3):. [CrossRef]
- Akshay S ,Muhammed J ,K. S J .Spatial connections in extreme precipitation events obtained from NWP forecasts: A complex network approach[J].Atmospheric Research,2023,282. [CrossRef]
- Kay, A.L.; Davies, H.N.; Bell, V.A.; Jones, R.G. Comparison of uncertainty sources for climate change impacts:Flood frequency in England. Clim. Chang. 2009, 92, 41–63. [CrossRef]
- Shuang L ,Ziniu X ,Lu T .Interannual variation of the number of winter extreme low temperature days in southern China and influencing factors[J].Atmospheric Research,2023,294. [CrossRef]
- Qiu J ,Yang X ,Cao B ; et al.Effects of Urbanization on Regional Extreme-Temperature Changes in China, 1960–2016[J].Sustainability,2020,12(16):. [CrossRef]
- Dongxue F ,Yihui D .The study of changing characteristics of the winter temperature and extreme cold events in China over the past six decades[J].International Journal of Climatology,2021,41(4):2480-2494. [CrossRef]
- Weishou T ,Lian Z ,Yakun D ; et al.Long-Term Variations in Warm and Cold Events in Nanjing, China: Roles of Synoptic Weather Patterns and Urbanization[J].Land,2023,12(1):162-162. [CrossRef]
- GUAN Yinghui, ZHANG Xunchang, ZHENG Fenli; et al.Trends and variability of daily temperature extremes during 1960—2012 in the Yangtze River Basin, China[J]. Global and Planetary Change, 2015, 124: 79-94.. [CrossRef]
- LIU Saiyan, HUANG Shengzhi, XIE Yangyang; et al. Spatialtemporal changes of maximum and minimum temperatures in the Wei River Basin, China: Changing patterns, causes and implications[J]. Atmospheric Research, 2018, 204: 1-11.. [CrossRef]
- Pi Y, Yu Y, Zhang Y; et al.Extreme Temperature Events during 1960—2017 in the Arid Region of Northwest China: Spatiotemporal Dynamics and Associated Large-Scale Atmospheric Circulation[J].Sustainability,2020,12(3):1198-1198. [CrossRef]
- Zhai P M, Sun A J, Ren F M; et al.Change of climate extremes in China[J].Climate Change,1999,42:203-218. [CrossRef]
- YANG Jinhu, JIANG Zhihong, WANG Pengxiang; et al. Spatial and temporal distribution of annual extreme precipitation events in China [J]. Climatic and Environmental Research,2008,13(1):75-83.
- Zhao N , Jiao Y , Ma T ,et al.Estimating the effect of urbanization on extreme climate events in the Beijing-Tianjin-Hebei region, China[J].The Science of the Total Environment, 2019,688(20):1005-1015. [CrossRef]
- Horton M R,Mankin S J,Lesk C; et al. A Review of Recent Advances in Research on Extreme Heat Events[J]. Current Climate Change Reports,2016,2(4). [CrossRef]
- SHU Zhangkang, LI Wenxin, ZhANG Jianyun; et al. Historical Changes and Future Trends of Extreme Precipitation and High Temperature in China [J]. Chinese Engineering Science, 2022, 24 (05): 116-125. [CrossRef]
- Tao J ,Qing W ,Shawei Z .Climate, Human Behavior and Settlement Morphology: A Case Study in Kashigar, Xinjiang Autonomous Region[C].Proceedings of the 11th International Symposium on Environmental Behavior Research,2014:7.
- Fang X ,Liang Y ,Gu J ; et al.Study on Potential Geographical Distribution of Diphtheria Aconitum in Xinjiang under the Scenario of Future Climate Change[J].Academic Journal of Environment Earth Science,2023,5(5):. [CrossRef]
- Kang Ziwei, Zhang Zhengyong, Liu Lin; et al. Analysis of spatiotemporal variation characteristics of surface temperature in Xinjiang based on MODIS [J]. Geographical Research, 2022, 41 (04): 997-1017.
- Chen Yueping, Wu Shengli, Zhao Xin; et al. The spatio-temporal variation characteristics of extreme temperatures in Hami City over the past 60 years [J]. Geography of Arid Areas, 2023,46 (06): 868-879.
- Lv Ting, Wu Shengli, Ge Huanhuan; et al. The spatio-temporal variation characteristics of extreme temperatures in Altay, Xinjiang from 1962 to 2013 [J]. Glacier and permafrost, 2020,42 (03): 745-755.
- Ding Zhiyong, Ge Yongxiao, Jilili Abdu; et al. Change trend of extreme temperature and precipitation in the Ebinur Lake basin in Xinjiang from 1957 to 2012 [J]. Journal of University of the Chinese Academy of Sciences, 2018,35 (02): 160-171.
- Huang Y ,Ma Y ,Liu T ; et al.Climate Change Impacts on Extreme Flows Under IPCC RCP Scenarios in the Mountainous Kaidu Watershed, Tarim River Basin[J].Sustainability,2020,12(5):2090-2090. [CrossRef]
- Tao J ,Qing W ,Shawei Z .Climate, Human Behavior and Settlement Morphology: A Case Study in Kashigar, Xinjiang Autonomous Region[C].Proceedings of the 11th International Symposium on Environmental Behavior Research,2014:7.
- Li Jinglin, Pu Zongchao, Zhang Shanqing, 2018. The impact and zoning of climate change on agriculture in Xinjiang [M]. Beijing: Meteorological Publishing House.
- Xiao-ming C ,Xi C ,An-ming B ; et al.Net Primary Productivity(NPP) of Oasis Changes in Trends in Xinjiang and Responses to Climate Change Analysis in 1981-2000[C].Intelligent Information Technology Application Association,2011:8. [CrossRef]
- Yu Jialu, Zhang Jing, Zhang Min; et al. Spatial and temporal evolution characteristics of drought in Xinjiang based on standardized pre precipitation evapotranspiration index [J]. Agricultural Research in Arid Regions, 2023,41 (04): 275-288.
- Yu Shui, Zhang Xiaolong, Liu Zhijuan; et al. The spatio-temporal variation characteristics of extreme climate index in the Songhua River Basin from 1961 to 2020 [J]. Journal of Applied Ecology, 2023,34 (04): 1091-1101.
- Zhou Yuke, Gao Qi. The Extreme Climate Index Data set of the Qinghai Tibet Plateau from 1960 to 2012 [J]. Chinese Science Data, 2017,2 (02): 70-78.
- Jiang C, Mu X, Wang F; et al. Analysis of extreme temperature events in the Qinling Mountains and surrounding area during 1960-2012[J]. Quaternary International, 2016, 392: 155-167. [CrossRef]
- Yang T ,Shao Q ,Hao Z ; et al.Regional frequency analysis and spatio-temporal pattern characterization of rainfall extremes in the Pearl River Basin, China[J].Journal of Hydrology,2009,380(3/4):386-405. [CrossRef]
- Zhanming L ,Hong Y ,Xinghu W ; et al.Spatiotemporal Variation in Extreme Precipitation in Beijiang River Basin, Southern Coastal China, from 1959 to 2018[J].Journal of Marine Science and Engineering,2023,11(1):73-73. [CrossRef]
- Zhang Yihui, Liang Kang, Liu Changming; et al. The spatiotemporal distribution characteristics and possible causes of extreme climate in the Niyang River Basin [J]. Geographical Research, 2022, 41 (10): 2808-2820.
- Luo M ,Liu T ,Meng F ; et al.Proportional coefficient method applied to TRMM rainfall data: Case study of hydrological simulations of the Hotan River Basin (China)[J].Journal of Water and Climate Change,2017,8(4):627-640. [CrossRef]
- Zhang Q ,Gu X ,Singh P V ; et al.Magnitude, frequency and timing of floods in the Tarim River basin, China: Changes, causes and implications[J].Global and Planetary Change,2016,139,44-55. [CrossRef]
- Guoying Z ,Xinyi Z .Changes of extreme climate indices on the Mongolian Plateau during 1981-2020 based on ERA5 reanalysis[J].Theoretical and Applied Climatology,2023,154(1-2):467-482. [CrossRef]
- Jieming C ,Weixing Z ,Jiangnan L ; et al.Changes in Extreme Climate Events in Rice-Growing Regions Under Different Warming Scenarios in China#13;[J].Frontiers in Earth Science,2021,9. [CrossRef]
- Zhang J ,Wang F .Changes in the Risk of Extreme Climate Events over East Asia at Different Global Warming Levels[J].Water,2019,11(12):2535. [CrossRef]
- Xu Yongbing, Lei Qiuliang, Zhou Jiaogen; et al. Study on the Characteristics of Extreme Climate Index Changes in Yunnan Province from 1960 to 2015 [J]. China Agricultural Resources and Regionalization, 2020,41 (11): 15-27.
- Huang I, Yu H, Guan X et al. Accelerated dry land expansion under climate change[J]. Nature Climate Change,2016(6):166-171. [CrossRef]
- Zhang P, Ren G, Xu Y et al. Observed changes in extreme temperature over the global land based on a newly developed station daily dataset[J]. Journal of Climate,2019,32(24):8489-8509. [CrossRef]
- Zhou B, Xu Y, Wu J et al. Changes in temperature and precipitation extreme indices over China: Analysis of a high resolution grid dataset[J]. International Journal of Climatology,2016,36(3):1051-1066. [CrossRef]
- Hou Chengzhi, Huang Danqing, Guidong Wei; et al. Characteristics and influencing factors of extreme climate change in deserts and deserts in northern China from 1961 to 2019 [J]. Geographic Science, 2023,43 (08): 1495-1505.
- Wang Baolong, Zhang Mingjun, Wei Junlin; et al. Changes in extreme events of temperature and precipitation in the northwest region over the past 50 years [J]. Journal of Natural Resources, 2012,27 (10): 1720-1733.
- Chen Qi, Mao Fangjie, Du Huaqiang; et al. The spatiotemporal evolution of subtropical extreme precipitation in China and its impact on potential net primary productivity [J]. Journal of Ecology, 2022, 41 (11): 2117-2127.
Figure 1.
Research area and meteorological stations distribution.
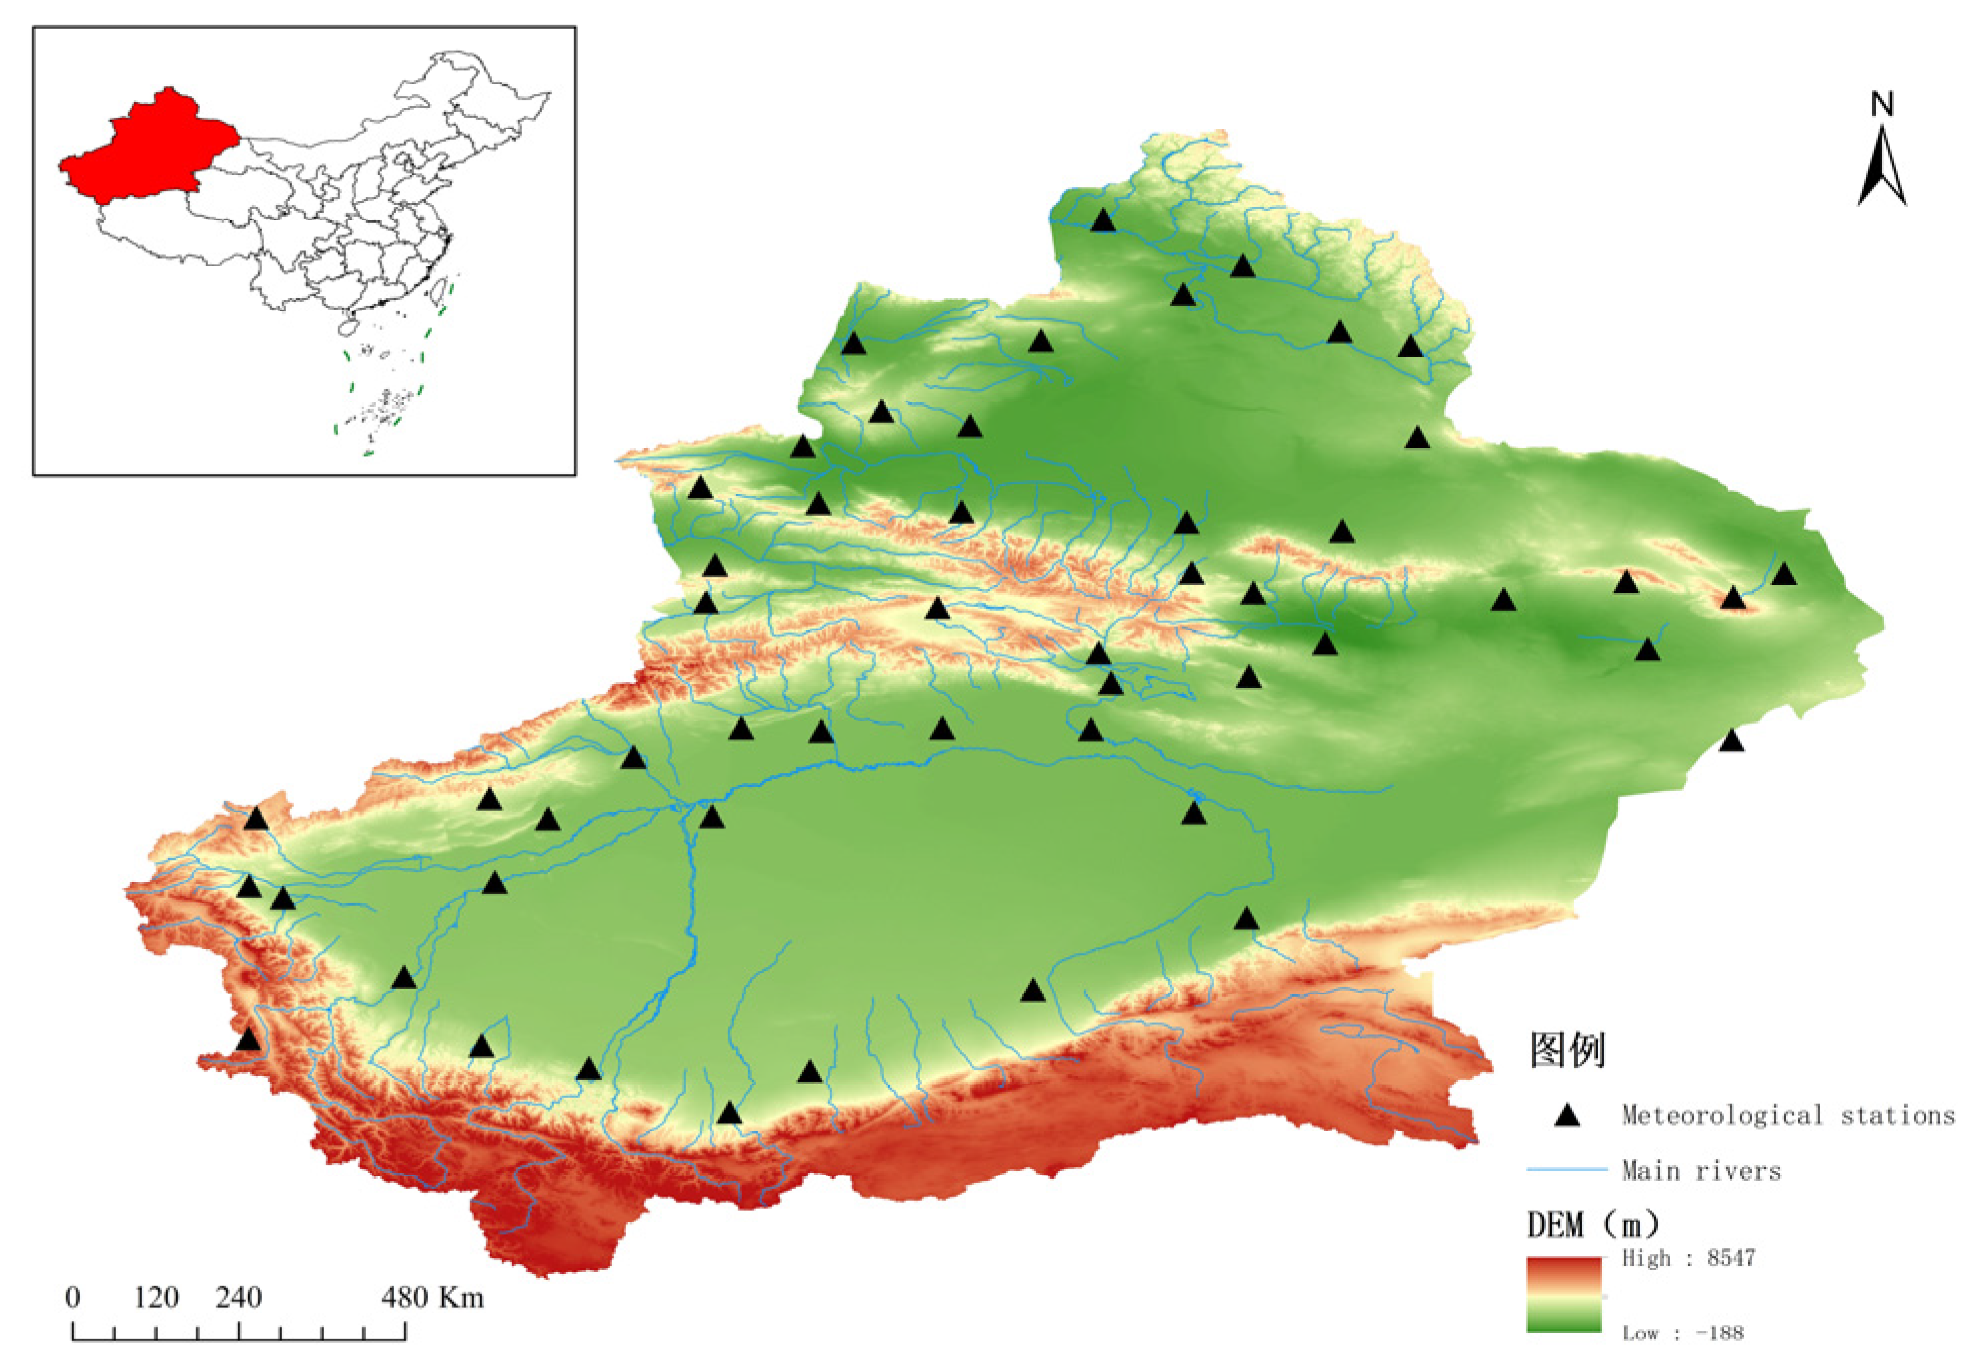
Figure 2.
Spatial distribution characteristics of extreme temperature.
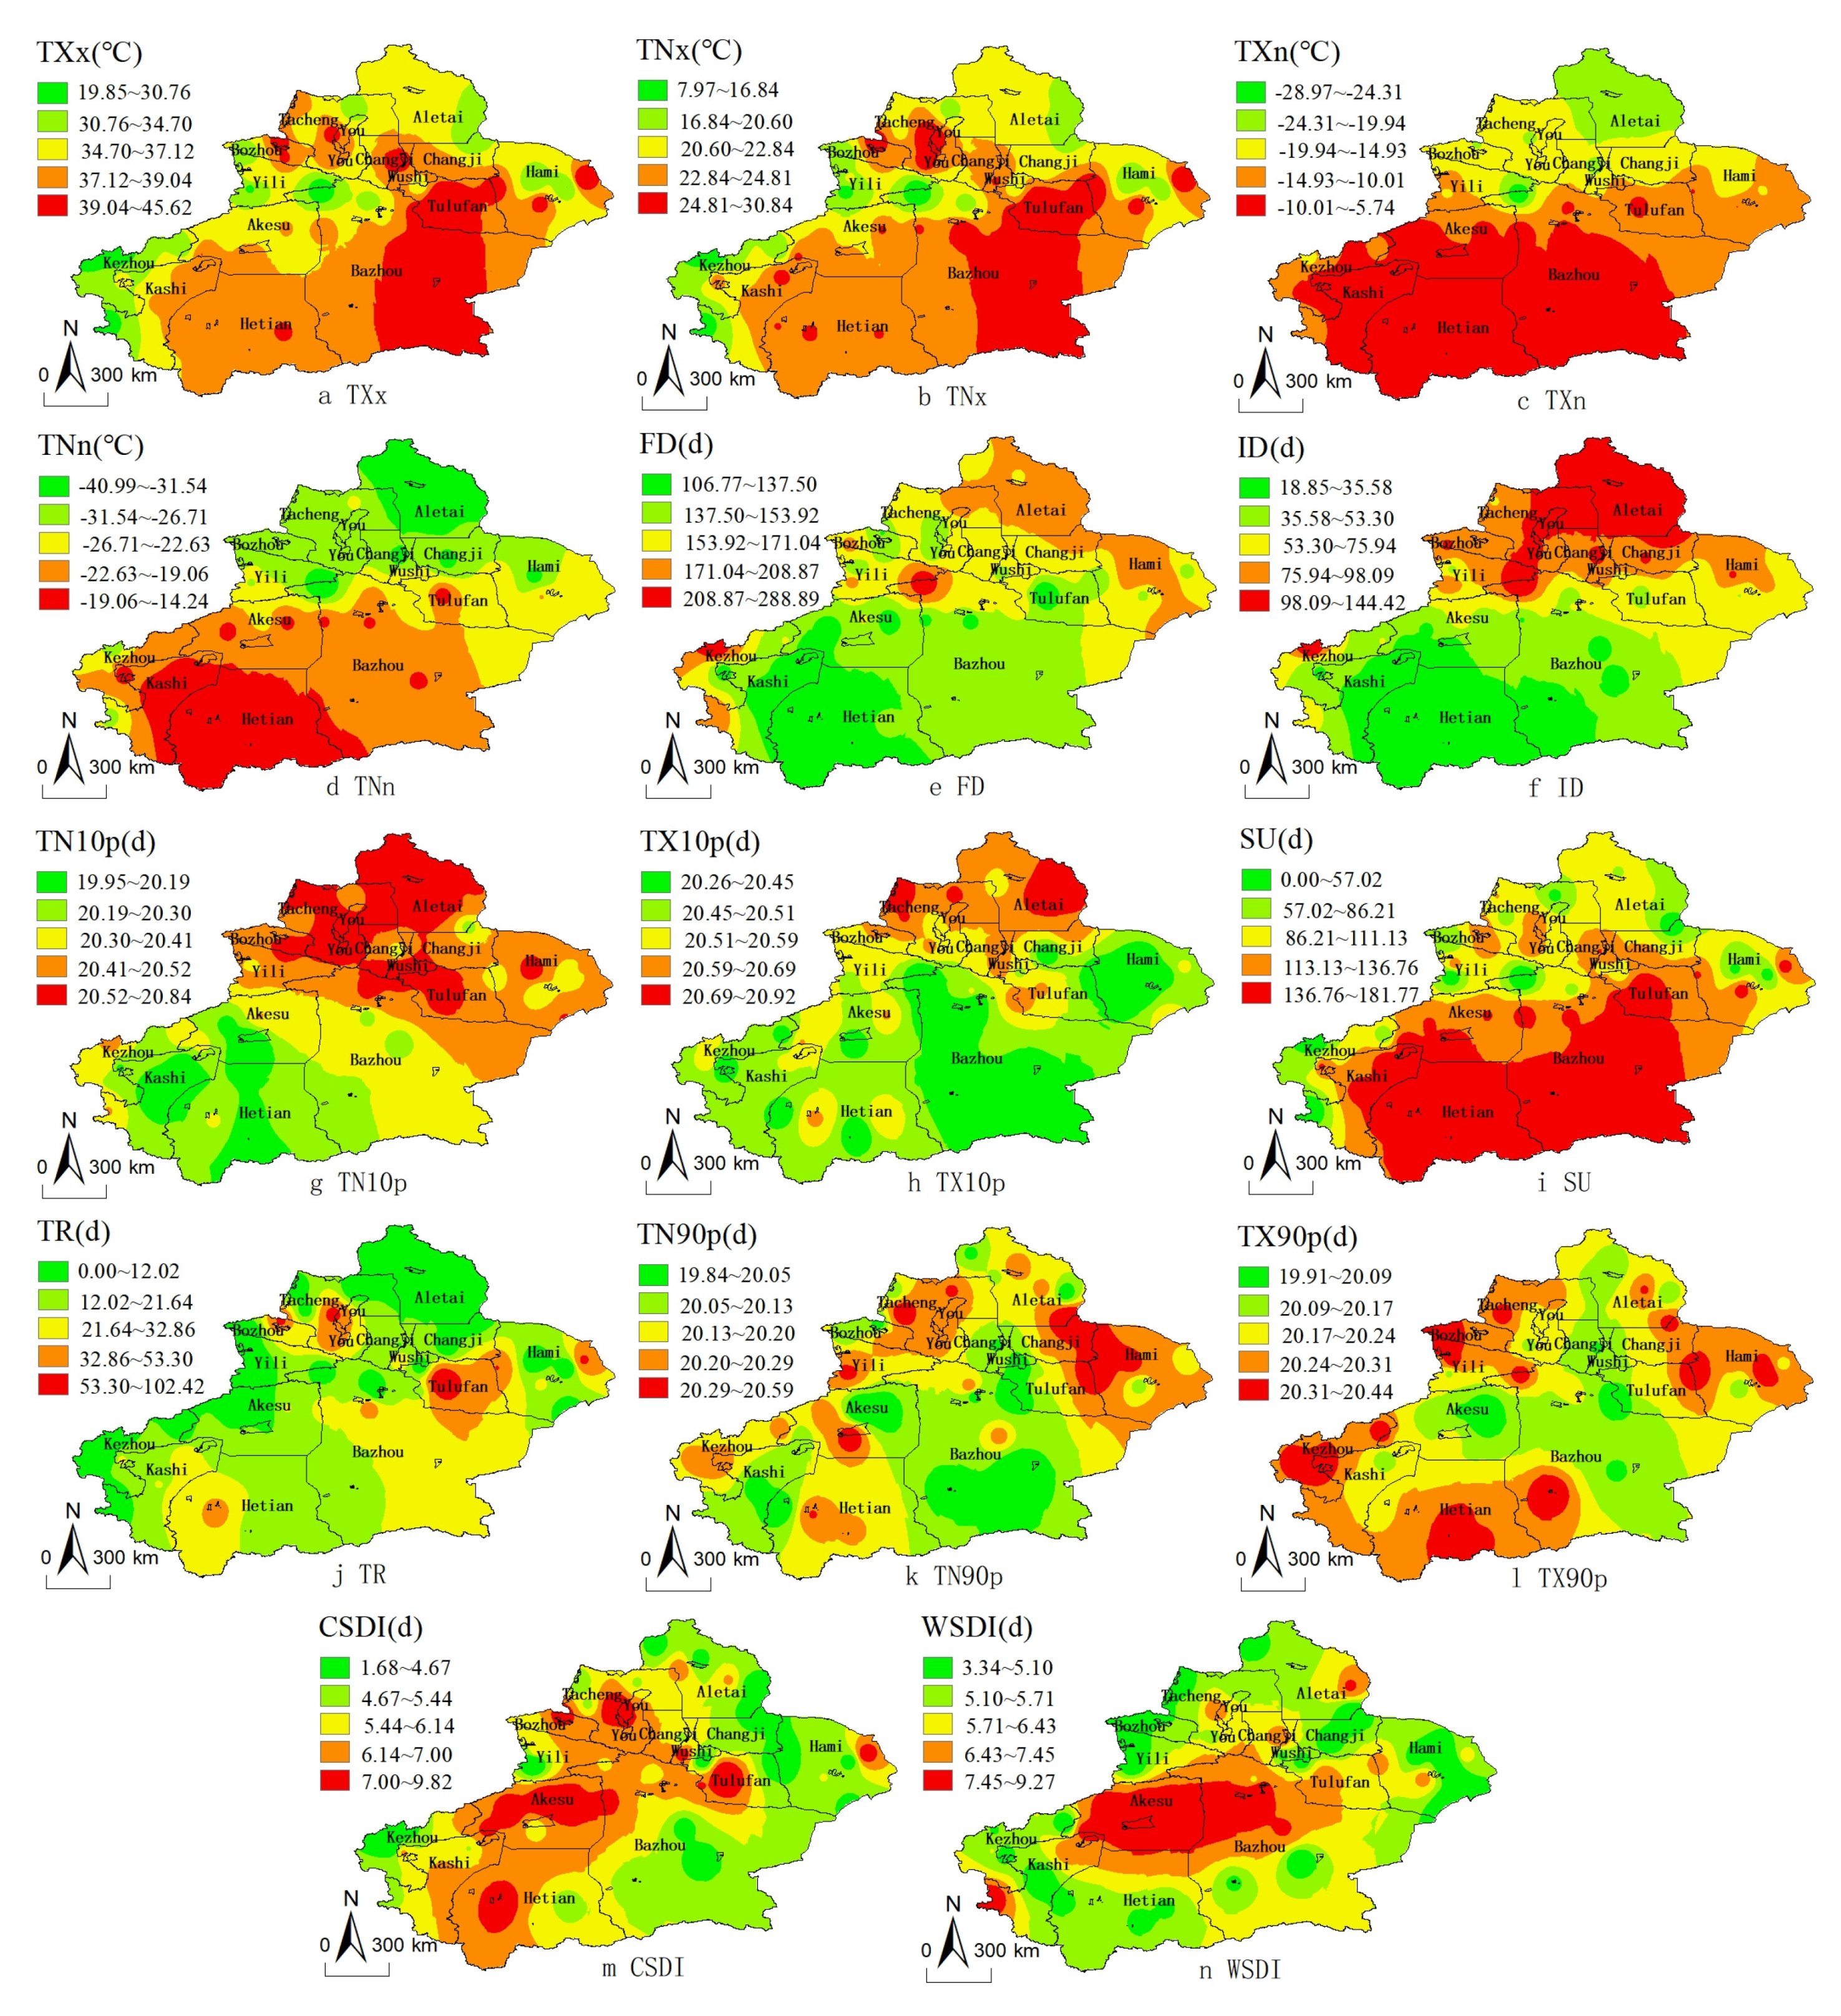
Figure 3.
Spatial variation characteristics of extreme temperature.
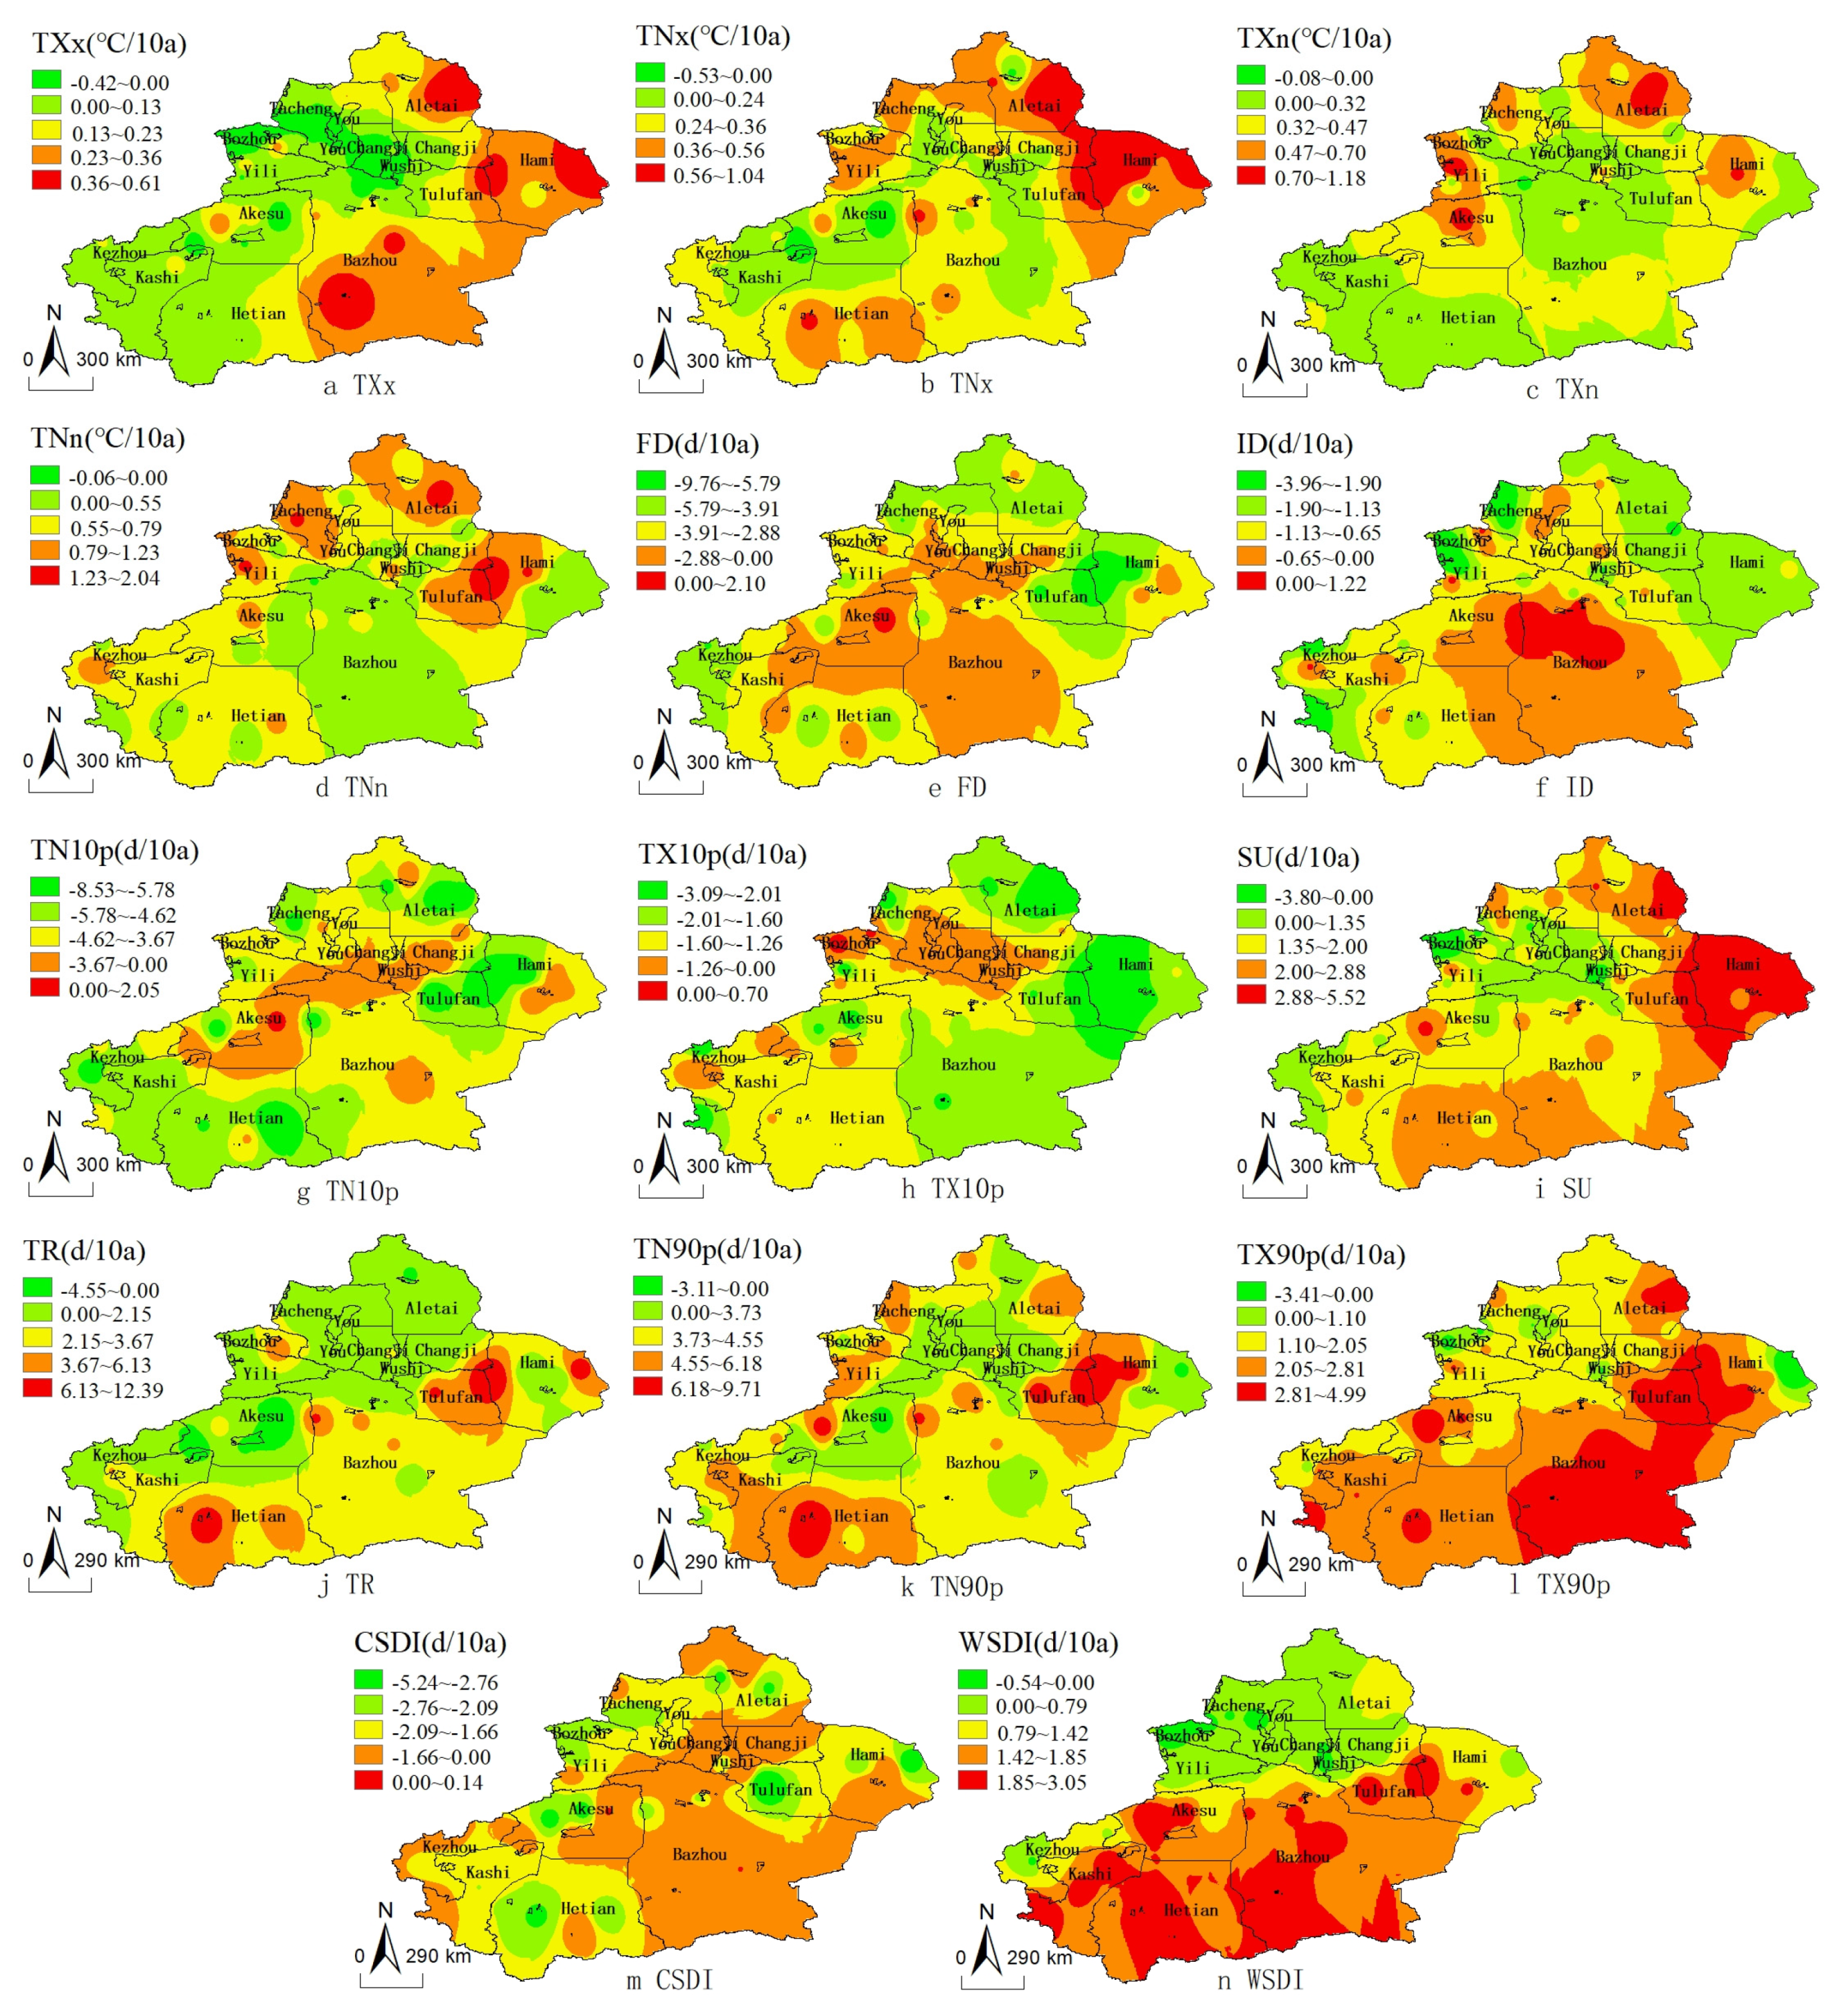
Figure 4.
Spatial distribution characteristics of extreme precipitation.
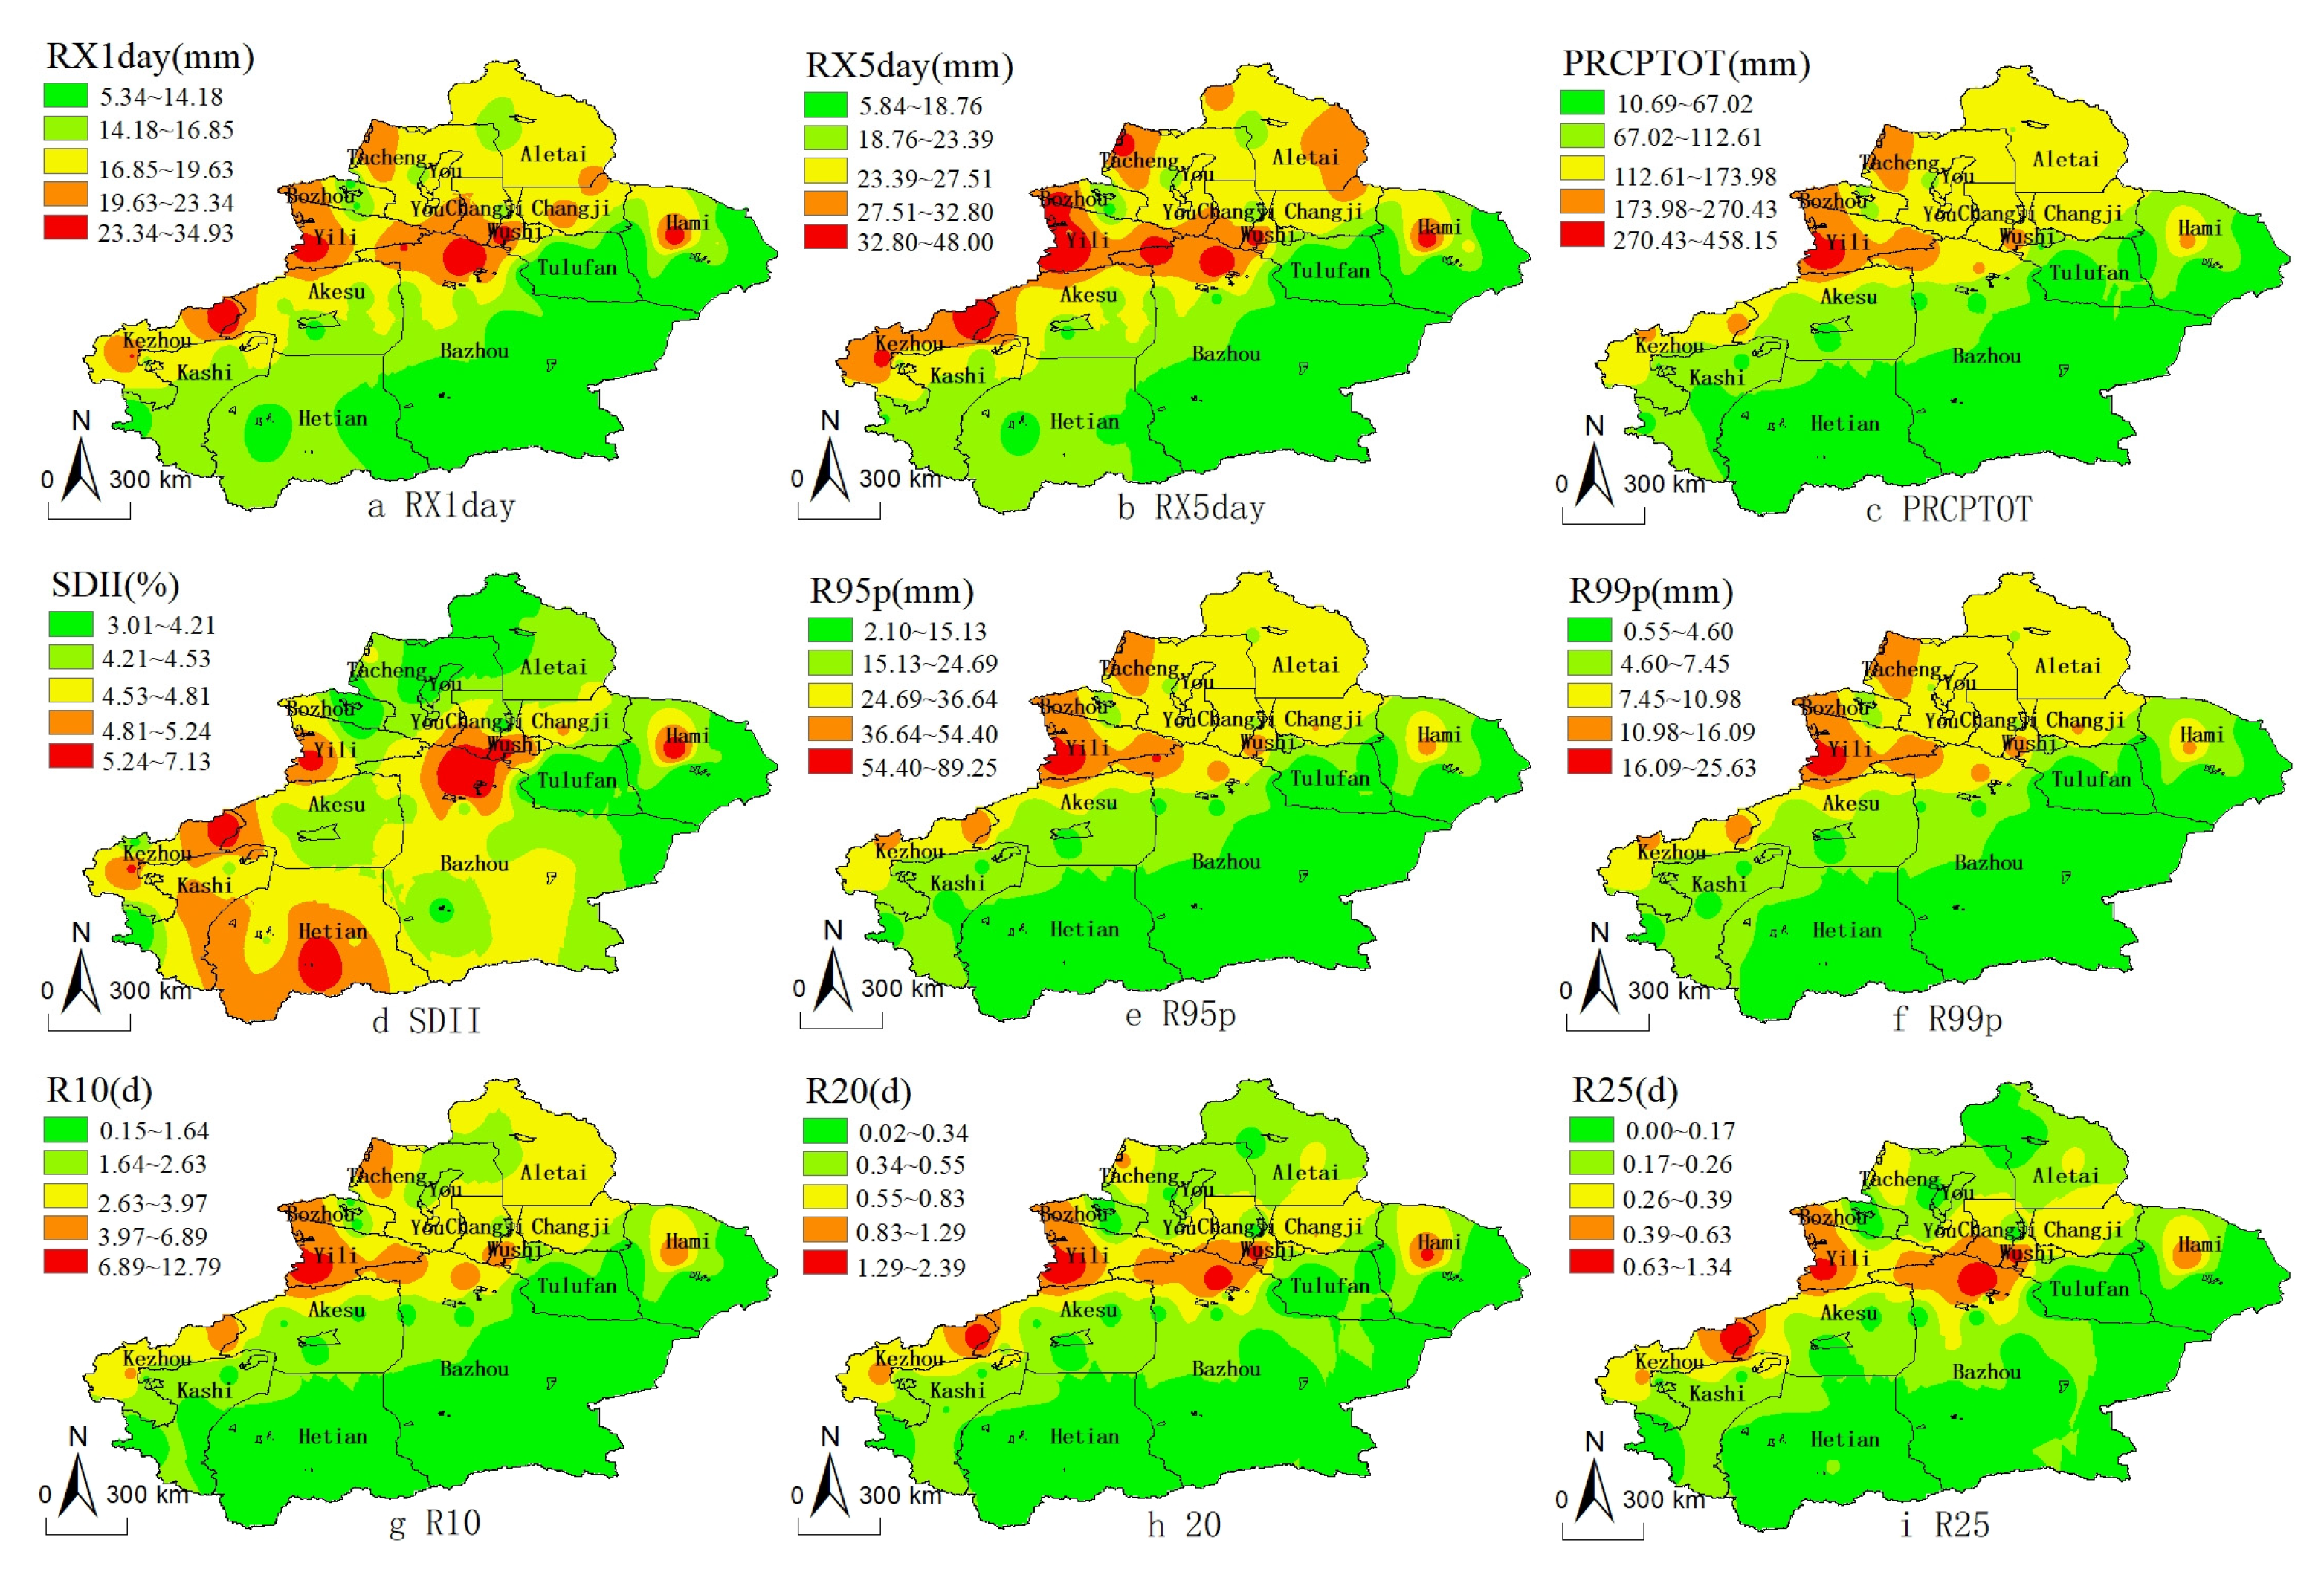
Figure 5.
Spatial variation characteristics of extreme precipitation.


Table 1.
Extreme climate index.
| Categories | Name | Indexes | Definition | Unit |
|---|---|---|---|---|
| Extreme Value Index | Daily Maximum Temperature Maximum | TXx | The maximum daily maximum temperature within each year | ℃ |
| Daily Minimum Temperature Maximum | TNx | The maximum daily minimum temperature within each year | ℃ | |
| Daily Maximum Temperature Minimum | TXn | The minimum daily maximum temperature within each year | ℃ | |
| Daily Minimum Temperature Minimum | TNn | The minimum daily minimum temperature within each year | ℃ | |
| Cold Event Index | Frost Day | FD | Annual count when Tmin < 0℃ | d |
| Frozen Day | ID | Annual count when Tmax < 0℃ | d | |
| Cold Night | TN10p | Number of days when Tmin < 10% percentile | d | |
| Cold Daytime | TX10p | Number of days when Tmax <10% percentile | d | |
| Warm Event Index | Summer Day | SU | Annual count when Tmax > 25℃ | d |
| Hot Nights | TR | Annual count when Tmin >20℃ | d | |
| Warm Night | TN90p | Number of days when Tmin > 90th percentile | d | |
| Warm Daytime | TX90p | Number of days when Tmax > 90th percentile | d | |
| DurationIndex | Cold Duration | CSDI | Annual count of days with at least 6 consecutive days when Tmin < 10th percentile | d |
| Heat Duration | WSDI | Annual count of days with at least 6 consecutive days when Tmax > 90th percentile | d | |
| Precipitation Scale Index | Maximum 1-day Precipitation | Rx1day | Maximum daily precipitation | mm |
| Maximum 5-day Precipitation | Rx5day | Maximum precipitation for 5 consecutive days | mm | |
| Annual Precipitation | PRCPTOT | Total precipitation on rainy days | mm | |
| Precipitation Intensity Index | Precipitation Intensity | SDII | Annual precipitation divided by rainy days | % |
| Intense Precipitation | R95p | Total amount of precipitation > 95th percentile | mm | |
| Extreme Precipitation | R99p | Total amount of precipitation > 99th percentile | mm | |
| Precipitation Day Index | Moderate Precipitation | R10 | Annual count when precipitation of 10-20mm | d |
| Heavy Precipitation | R20 | Annual count when precipitation of 20-25mm | d | |
| Rainstorm Precipitation | R25 | Annual count when precipitation ≥25mm | d |
Table 2.
Analysis of the temporal characteristics of extreme temperature.
| Categories | Name | Indexes | Minimum value | Maximum value | Average | B | B | B |
|---|---|---|---|---|---|---|---|---|
| 1960-1989. | 1990-2021. | |||||||
| Extreme Value Index | Daily Maximum Temperature Maximum | TXx | 34.18 | 38.78 | 36.42 | 0.014*** | 0.010 | 0.036*** |
| Daily Minimum Temperature Maximum | TNx | 20.65 | 24.93 | 22.43 | 0.034*** | 0.026*** | 0.044*** | |
| Daily Maximum Temperature Minimum | TXn | 18.78 | 9.30 | 13.51 | 0.037*** | 0.074*** | 0.039 | |
| Daily Minimum Temperature Minimum | TNn | 29.72 | 20.97 | 24.92 | 0.068*** | 0.111*** | 0.001 | |
| Cold Event Index | Frost Day | FD | 141.02 | 176.54 | 158.49 | 0.347 | 0.112 | 0.441 |
| Frozen Day | ID | 52.69 | 88.56 | 67.76 | 0.102 | 0.018 | 0.127*** | |
| Cold Night | TN10p | 8.26 | 43.97 | 21.18 | 0.395 | 0.421 | 0.218 | |
| Cold Daytime | TX10p | 11.11 | 33.47 | 21.26 | 0.106 | 0.050 | 0.040 | |
| Warm Event Index | Summer Day | SU | 95.73 | 124.04 | 110.78 | 0.185*** | 0.045 | 0.238*** |
| Hot Nights | TR | 10.62 | 26.85 | 17.59 | 0.203*** | 0.084*** | 0.337*** | |
| Warm Night | TN90p | 4.52 | 42.81 | 19.94 | 0.207*** | 0.123*** | 0.495*** | |
| Warm Daytime | TX90p | 6.17 | 35.10 | 20.07 | 0.412*** | 0.026 | 0.235*** | |
| Duration Index | Cold Duration | CSDI | 0.35 | 21.90 | 5.80 | 0.170 | 0.179 | 0.008 |
| Heat Duration | WSDI | 0.65 | 17.08 | 5.95 | 0.113*** | 0.000 | 0.151*** |
Note: *, **, *** means significant at the 10%, 5%, 1% level.
Table 3.
Statistical analysis of spatial characteristics of extreme temperature.
| Categories | Name | Indexes | Significant | uptrend | Significant uptrend | decline | Significant decline | 0 value |
|---|---|---|---|---|---|---|---|---|
| Extreme Value Index | Daily Maximum Temperature Maximum | TXx | 78.85 | 42 | 34 | 10 | 7 | |
| Daily Minimum Temperature Maximum | TNx | 88.46 | 49 | 44 | 3 | 2 | ||
| Daily Maximum Temperature Minimum | TXn | 82.69 | 51 | 43 | 1 | 0 | ||
| Daily Minimum Temperature Minimum | TNn | 92.31 | 51 | 48 | 1 | 0 | ||
| Cold Event Index | Frost Day | FD | 98.08 | 1 | 1 | 51 | 50 | |
| Frozen Day | ID | 63.46 | 7 | 2 | 45 | 31 | ||
| Cold Night | TN10p | 100.00 | 1 | 1 | 51 | 51 | ||
| Cold Daytime | TX10p | 96.15 | 1 | 1 | 51 | 49 | ||
| Warm Event Index | Summer Day | SU | 94.12 | 47 | 46 | 4 | 2 | 1 |
| Hot Nights | TR | 95.83 | 44 | 43 | 4 | 3 | 4 | |
| Warm Night | TN90p | 96.15 | 50 | 49 | 2 | 1 | ||
| Warm Daytime | TX90p | 94.23 | 47 | 47 | 5 | 2 | ||
| Duration Index | Cold Duration | CSDI | 88.46 | 3 | - | 49 | 46 | |
| Heat Duration | WSDI | 84.62 | 45 | 41 | 7 | 3 |
Note: *, **, *** means significant at the 10%, 5%, 1% level.
Table 4.
Analysis of time characteristics of extreme precipitation.
| Categories | Name | Indexes | Minimum value | Maximum | Average | B | B | B |
|---|---|---|---|---|---|---|---|---|
| 1960-1989. | 1990-2021 | |||||||
| Precipitation Scale Index | Maximum 1-day Precipitation | Rx1day | 12.59 | 23.93 | 17.26 | 0.072*** | 0.061*** | 0.002 |
| Maximum 5-day Precipitation | Rx5day | 15.93 | 35.33 | 24.39 | 0.124*** | 0.077*** | 0.037* | |
| Annual Precipitation | PRCPTOT | 60.57 | 192.54 | 114.20 | 1.322*** | 1.495*** | 0.599*** | |
| Precipitation Intensity Index | Precipitation Intensity | SDII | 3.65 | 5.25 | 4.52 | 0.001 | 0.010 | 0.002 |
| Intense Precipitation | R95p | 10.22 | 57.46 | 24.82 | 0.316*** | 0.208*** | 0.146*** | |
| Extreme Precipitation | R99p | 1.88 | 21.74 | 7.46 | 0.113*** | 0.061*** | 0.044** | |
| Precipitation Day Index | Moderate Precipitation | R10 | 1.06 | 4.96 | 2.57 | 0.031*** | 0.025*** | 0.020*** |
| Heavy Precipitation | R20 | 0.21 | 1.29 | 0.53 | 0.007*** | 0.003* | 0.003** | |
| Rainstorm Precipitation | R25 | 0.06 | 0.67 | 0.25 | 0.004*** | 0.002*** | 0.001 |
Note: *, **, *** means significant at the 10%, 5%, 1% level.
Table 5.
Statistical analysis of spatial characteristics of extreme precipitation.
| Categories | Name | Indexes | Significant | uptrend | Significant uptrend | decline | Significant decline | 0 value |
|---|---|---|---|---|---|---|---|---|
| Precipitation Scale Index | Maximum 1-day Precipitation | Rx1day | 69.23 | 44 | 32 | 8 | 4 | |
| Maximum 5-day Precipitation | Rx5day | 73.08 | 46 | 35 | 6 | 3 | ||
| Annual Precipitation | PRCPTOT | 98.08 | 50 | 49 | 2 | 1 | ||
| Precipitation Intensity Index | Precipitation Intensity | SDII | 57.69 | 23 | 15 | 29 | 15 | |
| Intense Precipitation | R95p | 80.77 | 45 | 37 | 7 | 5 | ||
| Extreme Precipitation | R99p | 63.46 | 38 | 27 | 14 | 6 | ||
| Precipitation Day Index | Moderate Precipitation | R10 | 88.46 | 49 | 44 | 3 | 2 | |
| Heavy Precipitation | R20 | 73.08 | 41 | 31 | 11 | 7 | ||
| Rainstorm Precipitation | R25 | 63.46 | 37 | 24 | 14 | 9 | 1 |
Disclaimer/Publisher’s Note: The statements, opinions and data contained in all publications are solely those of the individual author(s) and contributor(s) and not of MDPI and/or the editor(s). MDPI and/or the editor(s) disclaim responsibility for any injury to people or property resulting from any ideas, methods, instructions or products referred to in the content. |
© 2024 by the authors. Licensee MDPI, Basel, Switzerland. This article is an open access article distributed under the terms and conditions of the Creative Commons Attribution (CC BY) license (http://creativecommons.org/licenses/by/4.0/).
Copyright: This open access article is published under a Creative Commons CC BY 4.0 license, which permit the free download, distribution, and reuse, provided that the author and preprint are cited in any reuse.


