Submitted:
26 March 2024
Posted:
27 March 2024
You are already at the latest version
Abstract
Alteration in heparan sulfate (HS) biosynthesis has been described to impact a range of pivotal processes involved in cancer progression. HS 3-O-sulfotransferase 3B1 (HS3ST3B1) catalyzes the reaction of 3-O-sulfation within HS chains. Over the past few years, a growing number of studies has reported a tumor-promoting effect of this HS-modifying enzyme in various cancers. Consistent with these studies, we previously reported that HS3ST3B1 overexpression increased survival and resistance to apoptosis in MDA-MB-231 breast cancer (BrCa) cells. In the present study, we further investigated the biological and clinical significance of HS3ST3B1 expression in BrCa. Interrogation of public databases revealed that high expression levels of HS3STB1 are associated with invasive and mesenchymal-like phenotype in BrCa cells and predict poor clinical outcome in BrCA patients with chemotherapy. In vitro, HS3ST3B1 overexpression increased the invasive properties of MDA-MB-231 cells and enhanced chemo-resistance to conventional anticancer drugs. Mechanistically, we found that the advantage given by HS3ST3B1 was linked to the expression and activation of PDGF-Rβ. Silencing the expression of this receptor reversed the effects driven by HS3ST3B1 overexpression. Altogether, our results suggest that HS3ST3B1 may play an important role in the progression of aggressive BrCa and offer a potentially druggable target for therapeutic application.
Keywords:
heparan sulfate
; sulfotransferase
; breast cancer
; invasion
; survival
; PDGFR-Rβ
; chemo-resistance
1. Introduction
Heparan sulfate (HS) is a sulfated and linear polysaccharide, which is covalently linked to core proteins to form HS proteoglycans. These molecules are present within the extracellular matrix (ECM) and at the membrane of virtually all cells. While the core protein of HS proteoglycans primarily determines their localization, HS moieties are involved in the binding of a plethora of ligand proteins, including growth factors, cytokines, membrane receptors or ECM components. HS-protein interactions have multiple functions, such as protection against degradation, stabilization of receptor-ligand complexes or protein oligomerization. Via these interactions, HS regulates a number of physiological processes involved in tissue development and homeostasis, angiogenesis, blood coagulation or inflammation, but they are also implicated in many pathologies, including cancer, infectious and inflammatory diseases or neurodegenerative disorders [1,2,3,4,5]. Structurally, HS is built from a glycan backbone, which is formed by polymerization of the repeat unit D-glucuronic acid (GlcUA)/N-acetylated D-glucosamine (GlcNAc). This native polysaccharide is then subject to a number of enzymatic modifications: N-deacetylation/N-sulfation of GlcNAc residues., epimerization of some GlcUA into L-iduronic acid (IdoUA), 2-O-sulfation of uronic acids (mainly IdoUA), and 6-O and/or 3-O-sulfations of GlcN residues. One fascinating feature of this family of glycosaminoglycan is that these modifications are region-selective, thus leading to complex patterns with highly N- and O-sulfated sequences, sequences that escape modification and remains N-acetylated, and sequences of transition alternating N-acetylated and N-sulfated disaccharide units. The resulting combination of these modifications lead to a huge structural complexity that governs the interactions with protein ligands. Indeed, HS-protein interactions are not only driven at a first electrostatic level by the global sulfation of HS, but more specifically by the preferential recognition of structural determinants, in particular, the spatial arrangement of sulfate groups in given HS sequences [1,2,3].
The reaction of 3-O-sulfation is one of the last modifications in HS and requires that the substrates for HS 3-O-sulfotransferases (HS3STs) have been already modified at other positions. Consequently, 3-O-sulfation is relatively rare in HS compared to the widespread N-, 6-O-, and 2-O-sulfations. With seven isozymes identified in human, HS3STs represent the largest family among HS-modifying enzymes. Under normal physiological condition, the expression levels of these enzymes are low or non-detectable in adult tissues, with the notable exception of the nervous system. As a result, 3-O-sulfated units are present in only a limited number of HS chains or absent entirely. Moreover, two distinct 3-O-sulfated motifs can be synthesized by these isozymes: HS3ST1 and HS3ST5 participate in the generation of anticoagulant-active HS/heparin binding sequences for antithrombin-III (AT-type), while HS3ST2, HS3ST3A1, HS3ST3B1, HS3ST4, and HS3ST6 were identified for their capability of producing the HS-binding motifs for the glycoprotein gD of herpes simplex virus-1 (HSV-1) (gD-type). Since then, only a few ligands and biological systems have been identified to be selectively influenced by 3-O-sulfated motifs, whereas hundreds of HS-binding proteins have been characterized. Hence, little is known about the physiological mechanisms that are regulated by 3-O-sulfated HS, apart their roles in the anticoagulant properties of antithrombin and HSV-1 infection [6,7,8,9,10].
Expression of the genes encoding HS-modifying enzymes is frequently dysregulated in cancer. Over the past few years, a growing number of studies has reported an aberrant expression of certain HS3STs in various cancers [11]. For example, HS3ST3B1 overexpression has been observed in non-small cell lung cancer (NSCLC) [12], bladder cancer [13], acute myeloid leukemia [14] and glioma [15], and it was associated with a bad prognosis in patients [13,14,15]. High level expression of HS3ST4 was also correlated with poor clinical outcome in patients with gastric cancer [16]. Overexpression of HS3ST3B1 in bladder, pancreas and lung cancer cell lines was demonstrated to promote migration, invasion and epithelial-mesenchymal transition (EMT) in vitro and in experimental in vivo models [12,13,17,18]. HS3ST3B1 also enhanced leukemia cell proliferation and angiogenesis in xenografted mice [19]. Although epigenetic repression of the HS3ST2 gene was described in many cancers [20], a forced expression of this isozyme led to an increase in cell viability and invasion of MDA-MB-231 breast cancer (BrCa) cells [21]. Likewise, we reported that overexpression of HS3ST2, HS3ST3B1 or HS3ST4 similarly increased survival and resistance to apoptosis in MDA-MB-231 cells [22]. In the continuity of this study, we reported that the advantage given by HS3ST3B1 was dependent on the expression of neuropilin-1 (NRP1) [23]. Initially described as a co-receptor of VEGF and class 3 semaphorins in endothelial cells and neurons, there is now evidence that NRP1 is also expressed in a number of cancer cells, wherein it participates in migration, invasion and immune escape [24]. However, the underlying mechanisms and consequences of HS3ST3B1 overexpression in BrCa still remain obscure.
BrCa samples is classically comprised of four main subtypes, luminal A, luminal B, HER2 positive, and triple negative, based on the expression of hormone receptors, i.e., estrogen receptor (ER) and/or progesterone receptor (PR), and HER2 (Human Epidermal Growth Factor Receptor-2). Cell lines with triple negative status of ER, PR and HER2 are generally more aggressive than luminal and HER2-positive tumors, with enhanced capacity to metastasize [25,26]. Moreover, while hormone therapy and HER2-targeting drugs have improved clinical outcome of patients with luminal and HER2-positive BrCa, triple-negative breast cancers (TNBC) are poorly responsive to available targeted therapies. Hence, chemotherapy is the mainstay treatment for TNBC. Nevertheless, resistance develops quickly and TNBC patients still have a relatively poor prognosis with higher recurrence and metastasis rates, and lower survival probability than other subtypes [27,28]. Therefore, there is an urge to identify effective molecular targets as well as combinatorial therapeutic strategies to treat patients with TNBC.
In present study, we aim to investigate the biological and clinical significance of HS3ST3B1 expression in BrCa. Interrogation of public databases revealed that high expression levels of HS3STB1 are associated with invasive and mesenchymal-like phenotype in BrCa and predict shortened time to disease relapse and metastasis in patients with chemotherapy. In vitro analysis revealed that HS3ST3B1 overexpression enhanced the invasive and resistant phenotype of MDA-MB-231 cells. Mechanistically, our results outline a critical role for PDGF-Rβ in driving the effects of HS3ST3B1 expression in BrCa cells.
2. Results
2.1. HS3ST3B1 Is Overexpressed in TNBC Subtype and Associates with Mesenchymal-Like and Invasive Phenotype in BrCa
To investigate whether HS3ST3B1 could be associated with the phenotype of BrCa, we first analyzed its gene expression in a panel of cell lines representative of the luminal (BT-474, MCF-7, T-47D, ZR-75-1), HER2+ (SK-BR-3) and TNBC (BT-20, Hs_578T, MDA-MB-231, SUM-159PT) subtypes. As shown in Figure 1A, we found that the highest expression levels of HS3ST3B1 mRNA were observed in the four TNBC cell lines. To validate these findings, we used a collection of BrCa Cell Lines from a public dataset that can be accessed through the UCSC-Xena data portal [29]. For this analysis, 49 cell lines were classified as luminal (N = 19), HER2+ (N = 8) and TNBC (N = 22), as described in [25,27). We found that HS3ST3B1 expression levels were significantly higher in TNBC and HER2+ subtypes than in the luminal subtype (luminal < HER2+, p < 0.05; luminal < TNBC, p < 0.01) (Figure 1B). Because luminal BrCa cell lines are mainly characterized by positive ER expression, we explored the correlation of HS3ST3B1 with the expression of ER in the same collection of BrCa Cell Lines. As expected, we found that HS3ST3B1 transcript levels were significantly reversely correlated with the transcript levels of ESR1, the gene encoding ER (R = - 0.3335; p = 0.01819) (Supplementary Figure S1A). These results indicated that HS3ST3B1 overexpression in BrCa cell lines might be preferentially associated with ER-negative status. To investigate HS3ST3B1 expression in ER-negative tumors, we assessed HS3ST3B1 transcript levels in the TCGA-BrCa cohorts from the UCSC-Xena database. From a total of 763 tumor samples, analysis showed that the highest HS3ST3B1 expression levels were observed in the ER-negative BrCa patients (p = 0,00576) (Figure 1C). Then, we analyzed the expression of HS3ST3B1 across BrCa subtypes in two other publicly available datasets. Interestingly, HS3ST3B1 expression evaluated with the bc-GenExMiner online platform [30] also revealed higher HS3ST3B1 transcript levels in ER-negative BrCa patients (Supplementary Figure S1B). According to this repository database, we found that the expression levels of HS3ST3B1 in luminal A, luminal B and HER2+ patients were significantly lower than in patients with basal subtype (Supplementary Figure S1C). HS3ST3B1 expression data were also downloaded from the GENT2 database [31] to compare the expression across the different BrCa subtypes. After removal of redundant samples, 489 tumor samples were classified as luminal A, luminal B, HER2+ and TNBC subtypes, respectively. Analysis of HS3ST3B1 expression levels revealed that HS3ST3B1 was preferentially overexpressed in TNBC, when compared with the expression levels in other BrCa subtypes (luminal B < luminal A < HER2+ < TNBC) (Supplementary Figure S1D).
TNBC is the most heterogeneous BrCa subtype and often referred to as basal A and basal B in the literature. Phenotypically, TNBC-basal A cells are more differentiated and may have luminal- or basal-like properties. In contrast, TNBC-basal B cells have a more mesenchymal appearance and overexpress genes associated with tumor invasive and aggressive features. Moreover, it is well-documented that BrCa cells lose their epithelial phenotype during the epithelial-mesenchymal transition (EMT) process and acquire new properties of mesenchymal cells with enhanced aggressiveness. Notably, an increase in cellular migration is part of the phenotype modifications observed during the EMT, which is linked to the ability of cancer cells to invade the surrounding tissues and promote metastasis [25,26]. Hence, we explored the correlation of HS3ST3B1 overexpression with EMT and invasion gene markers in the cohorts TCGA-BrCa and in the collection of BrCa Cell Lines [27] from the UCSC-Xena databases. We analyzed the transcript expression levels of SNAI1, SNAI2, TWIST1 (the genes encoding the EMT regulators SNAI1, SLUG and TWIST), CDH2, FN1, VIM (the genes encoding the mesenchymal markers N-cadherin, fibronectin-1 and vimentin), MMP2, MMP9 and MMP14 (the genes encoding the pro-invasive metalloproteinases MMP2, MMP9 and MT1-MMP) (Figure 1D and Supplementary Table S1). The results revealed that HS3ST3B1 gene expression was positively correlated with the transcript levels of SNAI2, TWIST1, VIM, MMP2, MMP14 in the collection of BrCa cell lines (Pearson’s rho > 0.3). Moreover, CDH2 transcript level showed a trend toward positive correlation with HS3ST3B1 expression. We also found a positive correlation between HS3ST3B1 gene expression and the mRNA levels of SNAI2, FN1 and MMP2 in TCGA-BrCa patients. Despite a Pearson’s coefficient < 0.3, a trend toward positive correlation might be taken into account for the transcript levels of TWIST1, CDH2, VIM and MMP14. Altogether, these results suggest that high HS3ST3B1 expression level is a feature of BrCa cells with mesenchymal-like and invasive phenotype.
We previously showed that HS3ST3B1 overexpression enhanced the proliferation and survival of MDA-MB-231 cells, via a mechanism that was dependent on NRP1 [23]. We therefore analyzed the correlation of HS3ST3B1 with NRP1 in the cohorts TCGA-BrCa and in the collection of BrCa Cell Lines [27]. As expected, the results showed that HS3ST3B1 gene expression was positively correlated with the transcript levels of NRP1 in BrCa cell lines and patients (Figure 1E). This observation further supports the existence of a pathway that links HS3ST3B1 and NRP1 in BrCa cells.
2.2. HS3ST3B1 Overexpression Enhances the Mesenchymal-Like and Invasive Phenotype of MDA-MB-231 Cells
To evaluate the impact of a high HS3ST3B1 expression level on the phenotype of BrCa cells in vitro, we decided to use stably transfected MDA-MB-231 cells with permanent expression of the enzyme [23]. DIC microscopy provides a 3-D image with detailed morphological features obtained from non-invasive label-free cells. By using this approach (Figure 2A), we observed that HS3ST3B1 overexpression modified the morphology of MDA-MB-231 cells. Indeed, stably transfected cells appeared more flattened than parental cells and displayed a spread and elongated morphology, suggesting that overexpression of HS3ST3B1 led to the acquisition of a mesenchymal-like phenotype. In line with this idea, we found that the length-to-width ratio (elongation factor) has more than doubled in HS3ST3B1-overexpressing cells when compared with parental cells (p < 0.001) (Figure 2B). These findings indicate that HS3ST3B1 overexpression induced the acquisition of mesenchymal features by MDA-MB-231 cells. To complete these findings, we analyzed the expression of transcription factors and specific markers of mesenchymal phenotype (Figure 2C,D). MDA-MB-231 cells are poorly differentiated BrCa cells and they already exhibit an enrichment for markers associated with EMT. Indeed, we observed a basal expression of SNAI1, SLUG, TWIST, fibronectin, N-cadherin and vimentin in parental MDA-MB-231 cells. Of importance, we found that the expression of all these EMT-related proteins was increased in stably transfected cells, indicating that high level of HS3ST3B1 has further enhanced the mesenchymal phenotype of MDA-MB-231 cells.
Next, we investigated whether HS3ST3B1 overexpression could enhance cell motility. The migratory properties of MDA-MB-231 cells with or without HS3ST3B1 overexpression were first determined by using the wound healing assay. As shown in Figure 3A, we observed that HS3ST3B1-overexpressing cells migrated towards the scratch at a higher rate than the parental cells (x 1.7, p < 0.01). By using a Transwell assay with collagen-coated wells, we next demonstrated that the stable overexpression of HS3ST3B1 favored the invasive properties of MDA-MB-231 cells. Indeed, we observed a significant increase in the transmigration of HS3ST3B1-overexpressing cells through the collagen monolayer (x 1.9 when compared to parental cells, p < 0.001) (Figure 3B). When compared with parental cells, overexpression of HS3ST3B1 in MDA-MB-431 cells significantly increased the transcript levels of MMP14 and MMP2, but not MMP9 (Figure 3C). These findings are consistent with the in silico analysis and further suggest that HS3ST3B1 overexpression might affect the EMT and invasive pathways in BrCa cells.
2.3. HS3ST3B1 Overexpression Enhances the Activation of PDGF-Rβ and Src/Cortactin Pathway
To further explore the impact of HS3ST3B1 expression in BrCa cells, we analyzed the phosphorylation status of 49 receptors tyrosine kinase (RTKs) by using a phospho-RTK array. To this end, parental and HS3ST3B-overexpressing MDA-MB-231 cells were serum-starved for 3 h and then stimulated in the presence of 10% SVF for 15 min. We identified that EGF-R and Axl were strongly phosphorylated in both cell types, but no difference was observed between the conditions with or without HS3ST3B1 overexpression. In contrast, HS3ST3B-transfected cells displayed higher levels of phosphorylated forms of a number of other RTKs when compared to parental cells. A > 3-fold higher phosphorylation was observed for six RTKs: Insulin-R, PDGF-Rβ, ROR1, EphA1, DDR2 and EphA10 (Figure 4A and Supplementary Figure S2). Because the greatest increase was observed for PDGF-Rβ, we verified the activation status of this RTK by Western blot. As shown in Figure 4B, we confirmed an increase in the phosphorylation level of PDGF-Rβ in HS3ST3B1-overexpressing cells when compared to parental cells. Moreover, we observed a strong increase in the protein level of PDGF-Rβ, meaning that overexpression of HS3ST3B1 in MDA-MB-231 cells was accompanied with an increase not only in the activation but also in the expression of this RTK. In line with these findings, analysis from the UCSC-Xena databases revealed that HS3ST3B1 gene expression was positively correlated with the transcript levels of PDGFRB, the gene encoding PDGF-Rβ, in both the collection of BrCa Cell Lines and the TCGA cohorts of BrCa patients (Supplementary Table S2).
Then, we decided to analyze the activation status of the major signaling proteins involved in cancer cell behavior by using a kinase array (Figure 4C and Supplementary Figure S3). In previous works, we showed that HS3ST3B1 overexpression was associated with an increase in the activation of Akt and Src. In line with these findings, we identified here that HS3ST3B1-overexpressing MDA-MB-231 cells displayed an apparent increase in the phosphorylation of Akt, TOR and p70-S6-kinase, the latter being targets of the Akt signaling pathway. Among the other phosphorylated proteins, we identified a phosphorylation of PDGF-Rβ at the position Y751. This tyrosine residue is part of the binding sequence for phosphatidyl-inositol 3-kinase (PI3K) [32], which completes the idea that the PI3K-Akt axis is a downstream signaling pathway of PDGF-Rβ in HS3ST3B1-overexpressing cells. As expected, we also observed an increase in the phosphorylation of Src, Lyn, Lck, Fyn, Yes and Hck, which are all members of the Src kinase family. We also noticed an increase in the phosphorylation of FAK at the position Y397. It is of note that autophosphorylation of Y397 is observed upon activation of this kinase, which provides a high-affinity binding site for the Src kinases [33]. Importantly, a sustained activation of Src kinases has been associated with increase in the invasive properties of cancer cells. Hence, we examined the status of cortactin (CTTN), which is a target of Src and a marker of invadopodia [34]. As shown in Figure 4D, we observed that overexpression of HS3ST3B1 led to a concomitant increase in the level of phosphorylation of Src and CTTN, when compared to parental cells. To confirm these findings at the cellular level, we analyzed the number of foci that contain phosphorylated CTTN by immunofluorescence microscopy. As expected, we found that overexpression of HS3ST3B1 led to an almost 3-fold increase in the number of CTTN-containing foci when compared to parental cells (Figure 4E). Finally, we found that Dasatinib, which is a potent inhibitor of Src kinase activity, strongly reduced the phosphorylation level of CTTN in HS3ST3B1-expressing cells (Figure 4F). Collectively, these results suggest that overexpression of HS3ST3B1 probably enhanced cell migration and invasion by activating the Src/CTTN axis.
2.4. Enhanced Migration/Invasion of HS3STB1-Overexpressing MDA-MB-231 Cells is Dependent on the Expression of PDGF-Rβ
In the attempt to link PDGF-Rβ to the migratory ability of HS3ST3B-overexpressing MDA-MB-231 cells, we first decided to target it expression with specific siRNA. The efficiency of the siRNA approach was checked by real-time PCR (Figure 5A) and Western blot (Figure 5B). Moreover, we observed that the phosphorylation levels of Src and CTTN were dramatically reduced upon PDGF-Rβ silencing, consistent with the idea they are downstream signaling molecules of PDGF-Rβ. The wound healing assay revealed that silencing of PDGF-Rβ expression retarded the movement towards the scratch in HS3ST3B-overexpressing MDA-MB-231 cells (2-fold less than in control, p < 0.01) (Figure 5C). The Transwell migration assay further indicated that the increased invasive capacity induced by HS3ST3B1 overexpression was considerably reduced by the knockdown of PDGF-Rβ (2.3-fold less than in control, p < 0.001) (Figure 5D).
The role of PDGF- Rβ in the migratory ability of HS3ST3B-overexpressing MDA-MB-231 cells was further determined by using the selective inhibitors Imatinib and CP673451. First, we verified the efficiency of the drugs to inhibit the activation of PDGF-Rβ. Western blot analysis was also conducted to confirm the underlying molecular mechanisms. As expected, inhibition of Src and CTTN phosphorylation was observed when HS3ST3B-expressing MDA-MB-231 cells were treated with both the inhibitory drugs (Figure 6A). Then, we determined whether PDGF-Rβ signaling blockade could impair the effects of HS3ST3B1 in MDA-MB-231 cell migration and invasion. In wound healing assay, we observed that treatment with Imatinib or CP673451 retarded the speed of HS3ST3B-overexpressing cells that moved towards the scratch (Figure 6B). Similarly, the Transwell assay revealed that pharmacological inhibition of PDGF-Rβ attenuated the invasive capacity of HS3ST3B-overexpressing cells compared with the control untreated cells (Figure 6C). Altogether, these findings support the view that the enhancing effect of HS3ST3B1 on the migratory properties of MDA-MB-231 cells is dependent on the activation of the PDGF-Rβ/Src/CTTN pathway.
2.5. HS3ST3B1 Overexpression Is Associated with Poor Survival Outcome and Chemo-Resistance
To investigate the impact of HS3ST3B1 overexpression in a clinical context, we analyzed the association of HS3ST3B1 gene expression with the survival of BrCa patients using KM-Plotter data portal [35]. Relapse-free survival (RFS) is defined as the time from surgery until any cancer recurrence or death, while distant metastasis-free survival (DMFS) was defined as the time from surgery until any distant metastasis or death. We found that high HS3ST3B1-expressing patients (N = 793) exhibited significantly lower probabilities of RFS than low expressing patients (N = 1239) (HR = 1.17, CI 1-1.36, P = 0.048). More importantly, analysis of the RFS of patients with chemotherapy revealed that HS3ST3B1 was a worse factor associated with poor outcome in high (N = 343) versus low (N = 408) expressing patients (HR = 1.36, CI 1.1-1.68, P = 0.0047) (Figure 7A). Similarly, we found that HS3ST3B1 overexpression had a poor prognostic impact in DMFS of unselected BrCa patients (N = 958) (HR = 1.33, CI 1.02-1.73, P = 0.033), with worse outcome in patients with chemotherapy (N = 324) (HR = 2.63, CI 1.56-4.44, P = 0.00018) (Supplementary Figure S4A). Hence, these results suggested that HS3ST3B1 overexpression is a marker of poor prognosis in BrCa and might lead to cancer recurrence in patients with chemotherapy. As PDGF-Rβ expression was described to enhance chemo-resistance in BrCa [36,37], we asked whether it could influence the prognostic impact of HS3ST3B1 expression on the survival of BrCa patients with chemotherapy. To address this question, data from 749 and 322 patient samples were interrogated for RFS and DMFS analysis, respectively. In both analysis, patients were stratified in two subgroups according to the levels of PDGFRB transcripts, above or below the median expression, and the relationships between HS3ST3B1 mRNA expression and survival of BrCa patients from the different subgroups were analyzed independently (Supplementary Figure S4B). Results showed that HS3ST3B1 association with shorter time to RFS was more pronounced in patients with high PDGFRB mRNA expression (HR = 1.65, CI 1.2-2.28, P = 0.002), when compared with patients with PDGFRB mRNA levels below the median expression (HR = 1.29, CI 0.96-1.73, P = 0.085). For DMFS, high HS3ST3B1 transcript levels were most strongly associated with poor outcome in the subgroup with high PDGFRB mRNA expression (HR = 4.19, CI 2.01-8.75, P = 3.6e-05), compared to that of patients with low PDGFRB mRNA levels (HR = 2.14, CI 1-4.58, P = 0.046). Overall, these results showed that elevated levels of HS3ST3B1 expression were indicative of poor BrCa patient outcomes, particularly in the cohorts with high expression of PDGFRB.
To confirm the impact of HS3ST3B1 overexpression in a chemo-resistance mechanism, we exposed parental and stably transfected MDA-MB-231 cells to increasing concentrations of doxorubicin, gemcitabine and paclitaxel. We found that HS3ST3B1-overexpressing cells became significantly more resistant towards the three chemotherapeutic agents (Figure 7B). Then, we asked whether down-regulating the expression of PDGF-Rβ could reverse HS3ST3B1-mediated resistance. To test this hypothesis, MDA-MB-231 cells with or without HS3ST3B1 overexpression were treated with the PDGF-Rβ siRNA and then exposed to doxorubicin, gemcitabine or paclitaxel. Interestingly, we found that interfering with the expression of PDGF-Rβ in HS3ST3B1-overexpressing cells restored chemo-sensitivity towards the three drugs to a level similar to that observed in parental cells (Figure 7C). Altogether, these data suggest a contribution of HS3ST3B1 in mediating resistance upon chemotherapeutic agents probably through modulating the expression and activation of PDGF-Rβ.
3. Discussion
In the current study, we analyzed the biological and clinical significance of HS3ST3B1 expression in BrCa. Results from in silico analysis indicate that high expression levels of this HS-modifying enzyme was associated with an invasive and mesenchymal-like phenotype in BrCa tumor samples and BrCa cell lines, and with poor clinical outcomes in BrCa patients with chemotherapy. In vitro, HS3ST3B1 overexpression increased the invasive and mesenchymal properties of MDA-MB-231 cells and enhanced their chemo-resistance to conventional anticancer drugs. Our results implicate that HS3ST3B1 may play an important role in the progression of aggressive BrCa, and offer a potentially therapeutic target. A number of other studies have already described that HS3ST3B1 was overexpressed in various cancer tissues, and that it promoted angiogenesis, migration, invasion and proliferation of cancer cells [11]. As example, high expression levels of HS3ST3B1 was reported to induce EMT in pancreatic cancer cells and to increase cell invasiveness in vitro [18]. HS3ST3B1 overexpression was also observed in NSCLC cell lines, and silencing its expression reversed the mesenchymal phenotype of NSCLC cells [12]. Our results are consistent with these findings and suggest that HS3ST3B1 is probably a regulator of EMT in BrCa cells in the same way as in pancreatic and NSCLC cells. HS3ST3B1 also promoted proliferation, invasion, and cisplatin resistance in bladder cancer cells [13]. Hence, these findings support our conclusions that HS3ST3B1 may have a critical impact in BrCa progression by enhancing EMT and chemo-resistance in cancer cells.
It is well-known that TGF-β is a potent EMT inducer in many epithelial cancers [38]. Interestingly, HS3ST3B1 was described as a regulator of TGF-β-mediated EMT in NSCLC cells. The authors showed that TGF-β up-regulated the expression of HS3ST3B1 in NSCLC cells, while HS3ST3B1 silencing reversed the mesenchymal phenotype induced by TGF-β [12]. It is also of note that an increase in the expression of HS3ST3B was observed in many cell types exposed to inflammatory stimuli [39,40,41,42]. During cancer progression, cancer cells are exposed to a pro-inflammatory environment that normally contributes to immune anti-tumor response. However, to evade this immune pressure, cancer cells can adapt to this inflammatory environment, thereby resulting in the emergence of variants with increased aggressiveness to facilitate tumor escape [43]. TNF-α is a potent pro-inflammatory cytokine. Interestingly, it was described to cooperate with TGF-β to promote EMT and invasiveness of BrCa cells [44]. These observations suggest that up-regulating the expression of HS3ST3B in response to these cytokines could be a way for cancer cells to adjust to modifications in their tissue environment. This assumption deserves additional works to identify the molecular pathways that control the expression of HS3ST3B1 in BrCa.
HS3ST3B1 was characterized for its participation in the biosynthesis of 3-O-sulfated HS motifs with binding properties for the protein gD of HSV-1. Thus, it belongs to the so-called subfamily of gD-type HS3STs, which also contains HS3ST2, 3A, 4 and 6 [7,8,9]. Besides HS3ST3B1, some studies have described a possible implication of other gD-type HS3STs in cancer [11]. Although normally restricted to the brain, the expression of HS3ST4 was found to be upregulated in various cancer cells carrying an overexpression of the telomerase protein TRF2. The HS3ST4 gene was identified as a transcriptional target of TRF2, and increasing expression of either TRF2 or HS3ST4 in various cancer cell lines similarly resulted in increased tumor growth and inhibition of activation and recruitment of NK cells in xenografted mice [16,45]. In accordance with these findings, we previously reported that HS3ST3B1-overexpressing MDA-MB-231 cells were more resistant to apoptosis induced by NK cells in vitro [22]. Hence, it is tempting to hypothesize that up-regulation of the expression of HS3ST3B or HS3ST4 may be a mechanism that permits cancer cells to bypass immune surveillance. Miyamoto et al. [20] reported that the 5′ region of the HS3ST2 gene was hypermethylated in the majority of human BrCa patient samples, and also in colon, lung and pancreas cancers. As a consequence, the expression of HS3ST2 was not detectable in tumor samples compared with the matched normal counterparts. Moreover, HS3ST2 was not expressed in cell lines representative of the different BrCa subtypes. Reversing methylation in these cells restored the expression of the enzyme, confirming the silencing effect of gene hypermethylation. While these authors concluded that HS3ST2 silencing could be correlated with cancer progression, Vijaya Kumar et al. [21] reported that overexpression of HS3ST2 in MDA-MB-231 cells led to an increase in cell viability and invasion. Likewise, we showed that MDA-MB-231 cells with exogenous HS3ST2 overexpression displayed a significant increase in proliferation and survival. However, HS3ST3B and HS3ST4 overexpression led to the same functional impact as observed in the case of HS3ST2, indicating that the three isozymes had produced the same 3-O-sulfated HS motifs with tumor-promoting activity [22]. Thus, the role of HS3ST2 in BrCa is questionable, because in vitro overexpression of this isozyme could have artificially mimicked the effects of HS3ST3B1 or HS3ST4. Besides HS3ST2, Mao et al. [46] reported that the HS3ST3A1 gene was epigenetically repressed in BrCa cell lines representative of the different subgroups, except in the HER2+ cell lines. Moreover, they found that HS3ST3A1 overexpression enhanced proliferation and survival of HER2+ SKBR3 cells, but had the opposite effect in MDA-MB-231 cells. The authors proposed that the impact of HS3ST3A1 expression in BrCa cells could be different, pro-tumoral in HER2+ cancer cells but anti-oncogenic in other subtypes. However, these results should be regarded with caution, because excessive levels of expression of this HS sulfotransferase could have led to adverse effects, e.g., privation of the sulfate donor PAPS, without being necessarily linked to changes in HS 3-O-sulfation [11,22].
Mechanistically, we found that the advantage given by HS3ST3B1 overexpression in MDA-MB-231 cells was linked to the expression and activation of PDGF-Rβ. Furthermore, we identified that the expression patterns of HS3ST3B1 and PDGFRB correlated positively across a panel of BrCa cell lines and TCGA cohorts of BrCa patient samples. PDGF-Rβ plays key roles in multiple cellular processes in cancer progression, including cell proliferation, migration/invasion, angiogenesis and metastasis. Overexpression of PDGF-Rβ has been described in many cancers, especially in BrCa wherein it was associated with high histopathological grade, ER negativity and shorter patient survival. However, it should be noted that its accumulation was mostly observed in the stromal cellular components of breast tumors, while the majority of BrCa cells express low to none PDGF-Rβ levels [47]. Higher expression levels can nevertheless be observed in EMT-derived cells and mesenchymal-like cells [48]. Notably, the autocrine PDGF/PDGF-R loop was reported to maintain TGF-β-induced EMT and to promote invasiveness and chemo-resistance in late-stage BrCa cells [49]. Here, we provide evidence that PDGF-Rβ expression was up-regulated in MDA-MB-231 cells carrying HS3ST3B1 overexpression. Moreover, we showed that the expression of a number of EMT inducers and mesenchymal markers was increased in HS3ST3B1-overexpressing cells. Thus, it can be postulated that HS3ST3B1 overexpression increased the mesenchymal-like phenotype of MDA-MB-231 cells, which in turn led to an up-regulation of PDGF-Rβ expression.
PDGF ligand binding to PDGF-Rβ results in the recruitment of a number of SH2-domain containing molecules including tyrosine kinases of the Src family, PI3K, phospholipase Cγ, and the GTPase activating protein for Ras, which in turn regulate various signaling pathways that are involved in proliferation, survival and migration/invasion [32,33]. In this report, we demonstrated that HS3ST3B1-overexpressing MDA-MB-231 cells displayed an increase in the activation of the PI3K-Akt signaling pathway. Among the other phosphorylated proteins, we observed an increase in the activation of tyrosine kinases of the Src-family. Importantly, we found that activation of Src was associated to a concomitant increase in the level of phosphorylation of CTTN. This protein is overexpressed in a variety of cancers and plays a pivotal role in invadopodia formation and extracellular matrix degradation. Upon Src activation, CTTN undergoes tyrosine phosphorylation and then contributes to the rearrangement of actin cytoskeleton, which is required for cell migration and invasion [34]. Consistent with this, we showed that blocking PDGF-Rβ pharmacologically or genetically led to a decrease in CTTN phosphorylation and reduced migration and invasion of HS3ST3B1-overexpressing MDA-MB-231 cells. Furthermore, we demonstrated that HS3ST3B1-induced up-regulation of PDGF-Rβ was responsible for an enhanced chemo-resistance in MDA-MB-231 cells. Silencing the expression of PDGF-Rβ abolished the acquired resistance towards the anticancer drugs. In line with these results, high expression levels of HS3ST3B1 were associated with poor clinical outcome in BrCa patients with chemotherapy, especially in the cohorts with the higher expression of PDGFRB gene. Therefore, our results implicate that PDGF-Rβ plays a key role in the effects driven by HS3ST3B1 overexpression in BrCa cells.
Among the few proteins that selectively interact with 3-O-sulfated HS, NRP1 was described as a preferential ligand for gD-type HS3ST-modified motifs [10,50]. NRP1 has been well described as a co-receptor for class 3 semaphorins and VEGF. There is also evidence that NRP1 is expressed in a number of cancer cells, wherein it regulates cell proliferation, migration, invasion and immune escape, by interacting with a broad spectrum of growth factors [24,51]. Importantly, HS was described to assist NRP1 in the formation of a high-affinity complex with VEGF-A and its cognate signaling receptor in endothelial cells [52,53]. However, it is of note that the fine structure of HS was not addressed in these studies, until Thacker et al. [10] described that 3-O-sulfated HS was efficient to inhibit endothelial sprouting induced by VEGF-A, while HS devoid of 3-O-sulfation was much less potent. These results suggested that 3-O-sulfation could be a key modification within HS chains to strengthen and/or stabilize the interactions between NRP1, VEGF-A and its cognate receptors. In their study, Muhl et al. [54] reported that PDGF-D can bind directly to NRP1 in a way that resembles that of VEGF-A. According to these authors, this interaction would induce the formation of a complex with PDGF-Rβ, indicating that NRP1 can also act as a co-receptor for this RTK. Though not mentioned in the study, these findings suggest a possible participation of 3-O-sulfated HS in the interaction between NRP1, PDGF-D and PDGF-Rβ. This idea is further supported by our previous observation showing that silencing of NRP1 in MDA-MB-231 cells reversed the advantage given by HS3ST3B1 overexpression [23]. Hence, we speculate that HS3ST3B1 expression may enhance the formation of a signaling complex containing 3-O-sulfated HS, NRP1, PDGF-Rβ and its ligand in BrCa cells. This assumption is currently under investigation.
The difficulty to combat invasive BrCa has raised extensive efforts in identifying the mechanisms by which cancer cells bypass the effects of anticancer drugs and develop chemo-resistance. Given our results indicating that HS3ST3B1 overexpression increased PDGF-Rβ signaling, invasiveness and chemo-resistance in MDA-MB-231 cells, we anticipate that tumors with high expression levels of HS3ST3B1 might be more invasive and more likely to develop resistance to chemotherapy. Thus, despite the need of further studies to precisely determine the mechanisms that link HS3ST3B1 and PDGF-Rβ, this study uncovers a targetable HS3ST3B1/PDGFRβ partnership with biological and therapeutic importance in aggressive BrCa. Up to now, a lot of attention has focused on the use of HS mimetics to block the interaction between HS and their protein ligands [55,56]. However, it is still difficult to synthesize HS oligosaccharides with complex sulfation patterns. An alternative is the use of a chemo-enzymatic approach, in which controlled 3-O-sulfation of HS oligosaccharides can be achieved with recombinant HS3STs. Some of them have already proven to be effective as anticoagulant molecules and inhibitors of HSV-1 entry [9]. On another hand, a few other molecules, e.g., Roneparstat (SST0001), Muparfostat (PI-88) or Pixatimod (PG545), have been or are currently under clinical trials. These HS mimetics are well-known inhibitors of heparanase [55,56]. Interestingly, they were also reported to inhibit the activation of certain RTKs, including PDGF receptors [57]. The ability of these molecules to interfere with 3-O-sulfated HS-mediated signaling are yet to be explored. Although the consequences of impaired HS biosynthesis are well-documented in a variety of pathologies, it is surprising that the direct targeting of HS sulfotransferases has been less explored for therapeutic strategies. In their study, Byrne et al. [58] screened a library of kinase inhibitors and identified some cell permeable molecules, including the Raf kinase inhibitor GW407323A, with inhibitory activity against HS2ST1. These findings suggest that such molecules could be redesigned for specific inhibition of other HS sulfotransferases, including gD-type HS3STs. On this assumption, identifying specific HS3ST inhibitors via high-throughput screening might be a challenging project to control HS 3-O-sulfation in BrCa cells.
In conclusion, the current study highlights HS3ST3B1 as an important player involved in BrCa invasiveness and chemo-resistance. Further investigations into the regulation and consequences of HS3ST3B1 expression in BrCa cells may provide opportunities to use this enzyme and/or 3-O-sulfated HS motifs as molecular targets to improve therapeutic strategies.
4. Materials and Methods
4.1. Materials
Rabbit antibodies to CTTN, phospho-CTTN (Y421), N-cadherin, PDGF-Rβ, phospho-PDGF-Rβ (Y1021), SLUG, SNAI1, Src, phospho-Src (Y416), TWIST, vimentin and secondary anti-mouse and anti-rabbit antibodies conjugated to horseradish peroxidase (HRP) were purchased from Cell Signaling Technology. Mouse antibodies to fibronectin and to GAPDH were from R&D Systems and Santa Cruz, respectively. Secondary anti-rabbit antibody conjugated to Alexa Fluor 488 was from Life Technologies. Imatinib, Dasatinib, CP673451, doxorubicin, gemcitabine and paclitaxel were from TargetMol. Other chemicals were from Sigma-Aldrich unless otherwise specified.
4.2. Cell Culture
The human BrCa cell lines BT-474, MCF-7, T-47D, ZR-75-1 (luminal subtype), SK-BR-3 (HER2+ subtype) BT-20, Hs_578T, MDA-MB-231 and SUM-159-PT (TNBC subtype) were obtained from the American Type Culture Collection (ATCC). HS3ST3B1-overexpressing MDA-MB-231 cell-derived clones were established and characterized in a previous work [23]. Herein, we decided to retain the clone C for our experiments, because of medium overexpression level of HS3ST3B1, growth rate in complete culture medium similar to that of empty vector control cells and absence of cytotoxicity. BT-20, BT-474, Hs_578T, MDA-MB-231 (with or without HS3ST3B1 overexpression) and ZR-75-1 cells were routinely cultured in Dulbecco’s Modified Eagle Medium (DMEM) supplemented with 10% fetal calf serum (FCS) (Lonza). SK-BR-3 and T-47D cells were cultured in RPMI medium 1640 (Lonza) with 10% FCS. MCF-7 cells were cultured in DMEM with 10% FCS and 10 µg/mL of insulin (Lonza). SUM-159-PT cells were cultured in Ham’s F-12 Nutrient Mix (Gibco) supplemented with 10% FCS, insulin (10 mg/mL) and hydrocortisone (100 mg/mL) (Lonza). Cultured cells were maintained at 37°C in a 95% air-humidified atmosphere containing 5% CO2.
4.3. Microscopy Experiments
For analysis of the morphological changes induced by HS3ST3B1 overexpression, the elongation factor was measured by determining the length-to-width ratio of the cells. To this end, parental and HS3ST3B-overexpressing cells were seeded into 6-well plates (5 × 10⁴ cell per well) and cultured overnight for attachment. After washing with phosphate buffer (PBS), cells were fixed with 4% paraformaldehyde for 30 min and stained with 0.5% crystal violet for 10 min. High-power field pictures were photographed under observation with an inverted microscope and the length-to-width ratios of the cells (30 cells per sample) were determined using ImageJ software. The morphological changes of MDA-MB-231 cells were also observed in parental and HS3ST3B1-overexpressing cells using differential interference contrast (DIC) microscopy. Images were collected using a Leica AF6000 LX microscope. For the detection of phosphorylated CTTN, cells were seeded on glass coverslips in 6-well plates (2 × 10⁵ cells per well), washed with PBS and fixed in 4% paraformaldehyde for 30 min. They were then permeabilized with 0.1% Triton X-100 in PBS for 10 min, treated with a blocking solution containing 0.2% gelatin, 2% BSA and 2% FCS in PBS and incubated with the anti-phospho-CTTN (1/500) in the blocking buffer for 1 h. After washing, cells were incubated for 1 h with Alexa 488-conjugated secondary antibody (1/1000) in blocking buffer. Before analysis, cells were stained with 500 ng/mL of 4,6-diamidino-2-phenylindole (DAPI) for 10 min, in order to visualize cell nuclei. Immunofluorescence was analyzed with an inverted Zeiss LSM 780 microscope equipped with a 63 oil immersion lens. Data were collected using the Zeiss Zen Pro 2.1 software and processed with Image J software.
4.4. RNA Interference
A synthetic small-interfering RNA (siRNA) duplex corresponding to the sequence 5’-CTGACTTCCTCTTG GATAT-3’of the PDGFRB mRNA (NM_002609.4) was designed by Sigma-Aldrich. A control siRNA duplex (MISSION®, Sigma-Aldrich) was used as negative control (si-Ctrl). For silencing experiments, cells were plated at 5 × 10⁵ cells per well (2.5 mL) in DMEM supplemented with 1% FCS and then transfected with siRNA (150 pmoles per well) using Lipofectamine® RNAiMAX (Thermo Fisher), according to the manufacturer’s recommendations.
4.5. RNA Isolation and Real-Time RT-PCR
Total RNA was isolated from 2 × 10⁵ cells using the NucleoSpin RNA II kit, according to the instructions of the manufacturer (Macherey-Nagel). Reverse transcription was performed from 0.5 μg of total RNA by using the Maxima First Strand cDNA Synthesis Kit for RT-qPCR (Thermo Fisher Scientific). Synthetic primer sequences used in this study are described in Supplementary Table S3. They were checked for their specificity by semi-quantitative RT-PCR on a 1.5% (w/v) agarose gel. All of them amplified only one fragment of expected size, for which the sequence was confirmed (GATC Biotech). Real-time PCR amplifications were performed using Mx4000 Multiplex Quantitative PCR system (Agilent Technologies), as described in [40]. The transcript of HPRT was used as a control to normalize the expression of the genes of interest. The amplification efficiency of each primer pair was performed on serial dilutions of cDNA. The point at which the PCR product was first detected above a fixed threshold, termed cycle threshold (Ct), was determined for each sample, and the average Ct of triplicate samples was used for analysis.
4.6. SDS-PAGE and Western Blot
Protein analysis and immunoblotting were performed as described previously [23]. Briefly, cells (4 × 10⁵ per point) were lysed in 150 µL of lysis buffer containing 1% Triton X-100, 0.1% SDS, and a mixture of protease and phosphatase inhibitors (Roche Diagnostics, Meylan, France). Following clarification by centrifugation, protein content of the supernatants was estimated using micro-BCA protein assay kit (Thermo Fisher Scientific). Proteins (equivalent to 20 µg per sample) were separated by SDS-PAGE and transferred onto nitrocellulose membrane (Amersham). The membrane was blocked for 1 h at room temperature with bovine serum albumin (BSA) and then probed with primary antibodies overnight in Tris buffer supplemented with 5% (w/v) BSA. After washing, HRP-conjugated anti-mouse or anti-rabbit secondary antibodies were added for 1 h at room temperature and immunoreactive proteins were detected using ECL prime Western blotting detection reagent (GE Healthcare). Quantification of immunostaining intensity was performed by using ImageJ software.
4.7. Microarray Experiments
Following serum-starvation for 3 h, cells were stimulated for 15 min in the presence of complete culture medium (10% FCS) and then lysed as above. The human phospho-RTK array and phospho-kinase array kits (R&D systems) were used according to the manufacturer’s protocols. Briefly, the arrays were incubated overnight at 4°C with 300 µg of total protein extract. After washing, the arrays were incubated with a horseradish peroxidase-conjugated phospho-tyrosine detection antibody (phospho-RTK arrays) or with detection antibody cocktails (phospho-kinase arrays), for 1 h at room temperature. Detection of immunoreactive proteins and quantification of dot intensity was performed as above.
4.8. Cell Migration and Invasion Assays
Wound healing assay was performed to assess MDA-MB-231 cell migration. Parental and HS3ST3B1-overexpressing cells were seeded in 24-well plates and cultured in DMEM-10% FCS medium until they reached the confluent stage. Next, cell monolayers were wounded by scraping horizontally and vertically with a 20 μL pipet tip, followed by a 20 h-incubation in DMEM-1% FCS. Four images of the wounds were taken under microscopic observation immediately and after 20 h of incubation. The distance covered between the migration fronts was measured using ImageJ software. The invasive ability of MDA-MB-231 cells with or without HS3ST3B1 overexpression was assessed by using a Transwell chamber containing a collagen I-coated membrane (12-well plates, 8-µm pore size) (Corning). A total of 5 × 10⁴ starved cells in serum-free DMEM were seeded into the top chamber, and the lower chamber was filled with DMEM supplemented with 10% FCS. After 20 hours at 37°C, the cells that invaded the lower surface of the membrane were fixed with 4% formaldehyde for 30 min and stained with 0.5% crystal violet for 10 min. Four high-power field pictures of the lower surface of each Transwell membrane were photographed under microscopic observation, and the migrated cell numbers were counted using ImageJ software.
4.9. Measurement of Cell Viability
Cells viability was estimated by using the Cell-Titer 96 Aqueous Non-Radioactive Cell Proliferation Assay kit (Promega). This assay involves conversion of a MTS tetrazolium compound to a colored formazan product by metabolically active cells, thus providing information on the number of viable cells. Briefly, cells were seeded in 96-well plates (5×10³ cells in 200 µL) and cultured for 24 h. Next, cells were treated with increasing concentrations of anticancer drugs, including doxorubicin, gemcitabine and paclitaxel (TargetMol). After 72 h of culture, 20 µL of MTS/PMS (95:5, v/v) solution was added to each well of culture and the reaction was developed at 37°C for 2 h. Absorbance was measured at 490 nm using a BioTek Epoch microplate reader.
4.10. Data acquisition and Analysis from Public Open Databases
Data for gene expression levels in BrCa patients (cohorts TCGA BrCa) and in BrCa cell lines (collection BrCa Cell Lines) were downloaded from the UCSC-Xena data portal (https://xena.ucsc.edu) [29]. These datasets showed the gene expression profiles of a panel of 1247 BrCa patient samples (RNA-sequencing) and of a collection of 54 BrCa cell lines (DNA microarray Affymetrix) [27], respectively. Association between HS3ST3B1 mRNA expression levels and BrCa subtypes was analyzed by using the data analysis portal bc-GenExMiner v4.5 (http://bcgenex.ico.unicancer.fr) [30]. The screening condition in this study was the Affymetrix Jetset probe ID # “227361_at”. Supplemental validation data of correlation between HS3ST3B1 gene expression and BrCa subtypes was analyzed from the GENT2 database (http://gent2.appex.kr) [31]. Correlations of HS3ST3B1 expression with RFS and DMFS were analyzed using Kaplan-Meier Plotter software (https://www.kmplot.com) [35]. Kaplan-Meier plots were generated through the Jetset probes #“227361_at” and #“202273_at” for HS3ST3B1 and PDGFRB transcripts, respectively. Patient specimens were divided into high and low HS3ST3B1 expression groups according to the auto-select best cut-off.
4.11. Statistical Analysis
USC-Xena, bc-GenExMiner and GENT2 online tools were used to generate data related to mRNA expression and to perform comparison between samples. Statistical analysis was performed automatically by the website software or by using a two-sample T-test. A P value of less than 0.05 was considered statistically significant. Correlation between transcript expression levels was evaluated by Pearson correlation analysis. A correlation coefficient R above 0.3 was considered as positive correlation. KM-Plotter online tool was used to generate survival analysis in BrCa patients. Hazard ratios (HR) with 95% confidence intervals and log-rank P values were calculated automatically by the website software. Results from in vitro analysis were obtained from at least three independent experiments conducted with separate preparations of cultured cells. All values are expressed as means ± standard error (SEM). Statistical significance between the different values was analyzed by using one-way ANOVA and two-tailed Student’s t-tests. A threshold of P < 0.05 was considered as significant. Statistical significance is denoted by * for P ≤ 0.05, ** for P ≤ 0.01, *** for P ≤ 0.001, and n.s. = not significant.
5. Conclusions
Over the past few years, a growing number of studies has described a tumor-promoting role of HS3ST3B1 in various cancers. Consistent with these studies, we previously reported that HS3ST3B1 overexpression increased survival and resistance to apoptosis in MDA-MB-231 cells. In the present study, we further investigated the biological and clinical significance of HS3ST3B1 expression in BrCa. Interrogation of public databases revealed that high expression levels of HS3ST3B1 are associated with invasive and mesenchymal-like phenotype in BrCa and predict poor clinical outcome in BrCa patients with chemotherapy. In vitro, HS3ST3B1 overexpression increased the invasive and mesenchymal properties of MDA-MB-231 cells and enhanced their chemo-resistance to conventional anticancer drugs. Mechanistically, we found that the advantage given by HS3ST3B1 in MDA-MB-231 cells was linked to the expression and activation of PDGF-Rβ. Altogether, our results implicate that HS3ST3B1 may play an important role in the progression of invasive BrCa, and offer a potentially druggable target for therapeutic application.
Supplementary Materials
The following supporting information can be downloaded at: www.mdpi.com/xxx/s1, Figure S1. Overexpression of HS3ST3B1 mRNA correlates with mesenchymal-like phenotype in BrCa cell lines and patients. Figure S2. Comparison of the phosphorylation status of RTK in parental versus HS3ST3B1-overexpressing MDA-MB-231 cells. Figure S3. Comparison of the phosphorylation status of the main signaling molecules in parental versus HS3ST3B1-overexpressing MDA-MB-231 cells. Figure S4. Association of high HS3ST3B1 expression with time survival in BrCa patients. Table S1. Analysis of the correlations of HS3ST3B1 mRNA with the transcripts expression levels of the genes encoding EMT regulators, mesenchymal markers and pro-invasive MMP. Table S2. Analysis of the correlations of HS3ST3B1 mRNA with the transcripts expression levels of the genes encoding DDR2, EphA1, EphA10, Insulin-R, PDGF-Rβ and ROR1. Table S3. Sets of primers used for RT-qPCR analysis.
Author Contributions
Conceptualization, A.D. and F.A.; methodology, A.D., E.C. and F.A.; software, A.D., E.C. and F.A.; validation, A.D. and F.A.; formal analysis, A.D., M.D., C.M., E.C. and F.A; investigation, A.D., M.D., C.M., E.C. and F.A.; resources, F.A.; data curation, A.D. and F.A.; writing - original draft preparation, F.A.; writing -review and editing, X.X.; visualization, A.D., M.D., C.M., E.C. and F.A.; supervision, A.D. and F.A.; project administration, F.A.; funding acquisition, F.A. All authors have read and agreed to the published version of the manuscript.
Funding
This study was funded in part by the University of Lille, France, and by the Centre National de la Recherche Scientifique (CNRS).
Institutional Review Board Statement
Not applicable.
Informed Consent Statement
Not applicable.
Data Availability Statement
Publicly available datasets were analyzed in this study. These data are openly available at https://xena.ucsc.edu; http://bcgenex.ico.unicancer.fr; http://gent2.appex.kr; https://www.kmplot.com. Other data presented in this study are available on request from the corresponding author.
Acknowledgments
We thank Corentin Spriet from the TisBio Imaging Platform Facility at UGSF for technical support, and Robert-Allain Toillon (UMR 9020 CNRS, INSERM 1277, University of Lille) for helpful advice and discussion.
Conflicts of Interest
The authors declare no conflicts of interest.
References
- Esko, J.D.; Selleck, S.B. Order out of chaos: assembly of ligand binding sites in heparan sulphate. Annu. Rev. Biochem. 2002, 71, 435–471. [Google Scholar] [CrossRef] [PubMed]
- Hayes, A.J.; Melrose, J. HS, an ancient molecular recognition and information storage glycosaminoglycan, equips HS-proteoglycans with diverse matrix and cell-interactive properties operative in tissue development and tissue function in health and disease. Int. J. Mol. Sci. 2023, 6, 1148. [Google Scholar] [CrossRef] [PubMed]
- Marques, C.; Reis, C.A.; Vivès, R.R.; Magalhães, A. Heparan sulfate biosynthesis and sulfation profiles as modulators of cancer signalling and progression. Front. Oncol. 2021, 11, 778752. [Google Scholar] [CrossRef]
- Groux-Degroote, S.; Cavdarli, S.; Uchimura, K.; Allain, F.; Delannoy, P. Glycosylation changes in inflammatory diseases. Adv. Protein Chem. Struct. Biol. 2020, 119, 111–156. [Google Scholar] [CrossRef] [PubMed]
- Maïza, A.; Chantepie, S.; Vera, C.; Fifre, A.; Huynh, M.B.; Stettler, O.; Ouidja, M.O.; Papy-Garcia, D. The role of heparan sulfates in protein aggregation and their potential impact on neurodegeneration. FEBS Lett. 2018, 592, 3806–3818. [Google Scholar] [CrossRef] [PubMed]
- Liu, J.; Shworak, N.W.; Fritze, L.M.; Edelberg, J.M.; Rosenberg, R.D. Purification of heparan sulfate D-glucosaminyl 3-O-sulfotransferase. J. Biol. Chem. 1996, 271, 27072–27082. [Google Scholar] [CrossRef] [PubMed]
- Shukla, D.; Liu, J.; Blaiklock, P.; Shworak, N.W.; Bai, X.; Esko, J.D.; Cohen, G.H.; Eisenberg, R.J.; Rosenberg, R.D.; Spear, P.G. A novel role for 3-O-sulfated heparan sulfate in herpes simplex virus 1 entry. Cell 1999, 99, 13–22. [Google Scholar] [CrossRef] [PubMed]
- Shworak, N.W.; Liu, J.; Petros, L.M.; Zhang, L.; Kobayashi, M.; Copeland, N.G.; Jenkins, N.A.; Rosenberg, R.D. Multiple isoforms of heparan sulfate D-glucosaminyl 3-O-sulfotransferase - isolation, characterization, and expression of human cDNAs and identification of distinct genomic loci. J. Biol. Chem. 1999, 274, 5170–5184. [Google Scholar] [CrossRef] [PubMed]
- Thacker, B.E.; Xu, D.; Lawrence, R.; Esko, J.D. Heparan sulfate 3-O-sulfation: a rare modification in search of a function. Matrix Biol. 2014, 35, 60–72. [Google Scholar] [CrossRef]
- Thacker, B.E.; Seamen, E.; Lawrence, R.; Parker, M.W.; Xu, Y.; Liu, J.; Vander Kooi, C.W.; Esko, J.D. Expanding the 3-O-sulfate proteome - Enhanced binding of neuropilin-1 to 3-O-sulfated heparan sulfate modulates its activity. ACS Chem. Biol. 2016, 11, 971–980. [Google Scholar] [CrossRef]
- Denys, A.; Allain, F. The emerging roles of heparan sulfate 3-O-sulfotransferases in cancer. Front. Oncol. 2019, 9, 507. [Google Scholar] [CrossRef]
- Zhang, Z.; Jiang, H.; Wang, Y.; Shi, M. Heparan sulfate D-glucosamine 3-O-sulfotransferase 3B1 is a novel regulator of transforming growth factor-beta-mediated epithelial-to-mesenchymal transition and regulated by miR-218 in non-small cell lung cancer. J. Cancer Res. Ther. 2018, 14, 24–29. [Google Scholar] [CrossRef]
- Li, Y.; Shi, B.; Dong, F.; Zhu, X.; Liu, B.; Liu, Y. Long non-coding RNA DLEU1 promotes cell proliferation, invasion, and confers cisplatin resistance in bladder cancer by regulating the miR-99b/HS3ST3B1 axis. Front. Genet. 2019, 10, 280. [Google Scholar] [CrossRef]
- Qi, J., Yan; Idrees, M.; Almutairi, S.M.; Rasheed, R.A.; Hussein, U.A.; Abdel-Maksoud, M.A.; Wang, R.; Huang, J.; Huang, C.; et al. Five EMT-related gene signatures predict acute myeloid leukemia patient outcome. Dis. Markers 2022, 2022, 7826393. [Google Scholar] [CrossRef]
- Liu, G.; Lu, Y.; Gao, D.; Huang, Z.; Ma, L. Identification of an energy metabolism-related six-gene signature for distinguishing and forecasting the prognosis of low-grade gliomas. Ann. Transl. Med. 2023, 11, 146. [Google Scholar] [CrossRef]
- Cherfils-Vicini, J.; Iltis, C.; Cervera, L.; Pisano, S.; Croce, O.; Sadouni, N.; Győrffy, B.; Collet, R.; Renault, V.M.; Rey-Millet, M.; et al. Cancer cells induce immune escape via glycocalyx changes controlled by the telomeric protein TRF2. EMBO J. 2019, 38, e100012. [Google Scholar] [CrossRef]
- Li, Y.; Shi, B.; Dong, F.; Zhu, X.; Liu, B.; Liu, Y. LncRNA KCNQ1OT1 facilitates the progression of bladder cancer by targeting MiR-218-5p/HS3ST3B1. Cancer Gene Ther. 2021, 28, 212–220. [Google Scholar] [CrossRef]
- Song, K.; Li, Q.; Jiang, Z.Z.; Guo, C.W.; Li, P. Heparan sulfate D-glucosaminyl 3-O sulfotransferase-3B1, a novel epithelial-mesenchymal transition inducer in pancreatic cancer. Cancer Biol. Ther. 2011, 12, 388–398. [Google Scholar] [CrossRef]
- Zhang, L.; Song, K.; Zhou, L.; Xie, Z.; Zhou, P.; Zhao, Y.; Han, Y.; Xu, X.; Li, P. Heparan sulfate D-glucosaminyl 3-O-sulfotransferase-3B1 (HS3ST3B1) promotes angiogenesis and proliferation by induction of VEGF in acute myeloid leukemia cells. J. Cell. Biochem. 2015, 116, 1101–1112. [Google Scholar] [CrossRef] [PubMed]
- Miyamoto, K.; Asada, K.; Fukutomi, T.; Okochi, E.; Yagi, Y.; Hasegawa, T.; Asahara, T.; Sugimura, T.; Ushijima, T. Methylation-associated silencing of heparan sulfate D-glucosaminyl 3-O-sulfotransferase-2 (3-OST-2) in human breast, colon, lung and pancreatic cancers. Oncogene 2003, 22, 274–280. [Google Scholar] [CrossRef] [PubMed]
- Vijaya-Kumar, A.; Salem-Gassar, E.; Spillmann, D.; Stock, C.; Sen, Y.P.; Zhang, T.; Van Kuppevelt, T.H.; Hülsewig, C.; Koszlowski, E.O.; Pavao, M.S.G.; et al. HS3ST2 modulates breast cancer cell invasiveness via MAP kinase- and Tcf4 (Tcf7l2)-dependent regulation of protease and cadherin expression. Int. J. Cancer 2014, 135, 2579–2592. [Google Scholar] [CrossRef] [PubMed]
- Hellec, C.; Delos, M.; Carpentier, M.; Denys, A.; Allain, F. The heparan sulfate 3-O-sulfotransferases (HS3ST) 2, 3B and 4 enhance proliferation and survival in breast cancer MDA-MB-231 cells. PLoS One 2018, 13, e0194676. [Google Scholar] [CrossRef] [PubMed]
- Hellec, C.; Diawara, M.; Carpentier, M.; Denys, A.; Allain, F. The pro-tumoral activity of heparan sulfate 3-O-sulfotransferase 3B (HS3ST3B) in breast cancer MDA-MB-231 cells is dependent on the expression of neuropilin-1. Molecules 2018, 23, 2718. [Google Scholar] [CrossRef] [PubMed]
- Prud’homme, G.J.; Glinka, Y. Neuropilins are multifunctional coreceptors involved in tumor initiation, growth, metastasis and immunity. Oncotarget 2012, 3, 921–939. [Google Scholar] [CrossRef] [PubMed]
- Dai, X.; Cheng, H.; Bai, Z.; Li, J. Breast cancer cell line classification and its relevance with breast tumor subtyping. J. Cancer. 2017, 8, 3131–3141. [Google Scholar] [CrossRef]
- Ferlay, J.; Colombet, M.; Soerjomataram, I.; Mathers, C.; Parkin, D.; Pineros, M.; Znaor, A.; Bray, F. Estimating the global cancer incidence and mortality in 2018: GLOBOCAN sources and methods. Int. J. Cancer, 2019, 144, 1941–1953. [Google Scholar] [CrossRef] [PubMed]
- Heiser, L.M.; Sadanandam, A.; Kuo, W.L.; Benz, S.C.; Goldstein, T.C.; Ng, S.; Gibb, W.J.; Wang, N.J.; Ziyad, S.; Tong, F.; et al. Subtype and pathway specific responses to anticancer compounds in breast cancer. Proc. Natl. Acad. Sci. U.S.A. 2012, 109, 2724–2729. [Google Scholar] [CrossRef]
- Barzaman, K.; Karami, J.; Zarei, Z.; Hosseinzadeh, A.; Kazemi, M.H.; Moradi-Kalbolandi, S.; Safari, E.; Farahmand, L. Breast cancer: biology, biomarkers, and treatments. Int. Immunopharmacol. 2020, 84, 106535. [Google Scholar] [CrossRef]
- Goldman, M.J.; Craft, B.; Hastie, M.; Repečka, K.; McDade, F.; Kamath, A.; Banerjee, A.; Luo, Y.; Rogers, D.; Brooks, A.N.; et al. Visualizing and interpreting cancer genomics data via the Xena platform. Nat. Biotechnol. 2020, 38, 675–678. [Google Scholar] [CrossRef]
- Jézéquel, P.; Campone, M.; Gouraud, W.; Guérin-Charbonnel, C.; Leux, C.; Ricolleau, G.; Campion, L. bc-GenExMiner: an easy to-use online platform for gene prognostic analyses in breast cancer. Breast Cancer Res. Treat. 2012, 131, 765–775. [Google Scholar] [CrossRef]
- Park, S.J.; Yoon, B.H.; Kim, S.K.; Kim, S.Y. GENT2: an updated gene expression database for normal and tumor tissues. BMC Med. Genomics 2019, 12, 101. [Google Scholar] [CrossRef]
- Franke, T.F.; Yang, S.I.; Chan, T.O.; Datta, K.; Kazlauskas, A.; Morrison, D.K.; Kaplan, D.R.; Tsichlis, P.N. The protein kinase encoded by the Akt proto-oncogene is a target of the PDGF-activated phosphatidylinositol 3-kinase. Cell 1995, 81, 727–736. [Google Scholar] [CrossRef] [PubMed]
- Schaller, M.D.; Hildebrand, J.D.; Shannon, J.D.; Fox, J.W.; Vines, R.R.; Parsons, J.T. Autophosphorylation of the focal adhesion kinase, pp125FAK, directs SH2-dependent binding of pp60src. Mol. Cell. Biol. 1994, 14, 1680–1688. [Google Scholar] [CrossRef]
- Yin, M.; Ma, W.; An, L. Cortactin in cancer cell migration and invasion. Oncotarget 2017, 8, 88232–88243. [Google Scholar] [CrossRef]
- Lanczky, A.; Gyorffy, B. Web-based survival analysis tool tailored for medical research (KMplot): development and implementation. J. Med. Internet Res. 2021, 23, e27633. [Google Scholar] [CrossRef]
- Meng, F.; Speyer, C.L.; Zhang, B.; Zhao, Y.; Chen, W.; Gorski, D.H.; Miller, F.R.; Wu, G. PDGFRα and β play critical roles in mediating Foxq1-driven breast cancer stemness and chemoresistance. Cancer Res. 2015, 75, 584–593. [Google Scholar] [CrossRef] [PubMed]
- Kalimutho, M.; Sinha, D.; Mittal, D.; Srihari, S.; Nanayakkara, D.; Shafique, S.; Raninga, P.; Nag, P.; Parsons, K.; Khanna, K.K. Blockade of PDGFRβ circumvents resistance to MEK-JAK inhibition via intratumoral CD8+ T-cells infiltration in triple-negative breast cancer. J. Exp. Clin. Cancer Res. 2019, 38, 85. [Google Scholar] [CrossRef]
- Xu, J.; Lamouille, S.; Derynck, R. TGF-β-induced epithelial to mesenchymal transition. Cell Res. 2009, 19, 156–172. [Google Scholar] [CrossRef]
- Krenn, E.C.; Wille, I.; Gesslbauer, B.; Poteser, M.; van Kuppevelt, T.H.; Kungl, A.J. Glycanogenomics: a qPCR-approach to investigate biological glycan function. Biochem. Biophys. Res. Commun. 2008, 375, 297–302. [Google Scholar] [CrossRef]
- Martinez, P.; Denys, A.; Delos, M.; Sikora, A.S.; Carpentier, M.; Julien, S.; Pestel, J.; Allain, F. Macrophage polarization alters the expression and sulfation pattern of glycosaminoglycans. Glycobiology 2015, 25, 502–513. [Google Scholar] [CrossRef]
- Sikora, A.S.; Delos, M.; Martinez, P.; Carpentier, M.; Allain, F.; Denys, A. Regulation of the expression of heparan sulfate 3-O-sulfotransferase 3B (HS3ST3B) by inflammatory stimuli in human monocytes. J. Cell. Biochem. 2016, 117, 1529–1542. [Google Scholar] [CrossRef]
- Sikora, A.S.; Hellec, C.; Carpentier, M.; Martinez, P.; Delos, M.; Denys, A.; Allain, F. Tumour-necrosis factor-α induces heparan sulfate 6-O-endosulfatase 1 (Sulf-1) expression in fibroblasts. Int. J. Biochem. Cell. Biol. 2016, 80, 57–65. [Google Scholar] [CrossRef]
- Dunn, G.P.; Bruce, A.T.; Ikeda, H.; Old, L.J.; Schreiber, R.D. Cancer immunoediting: from immunosurveillance to tumor escape. Nat. Immunol. 2002, 3, 991–998. [Google Scholar] [CrossRef]
- Liao, S.J.; Luo, J.; Li, D.; Zhou, Y.H.; Yan, B.; Wei, J.J.; Tu, J.C.; Li, Y.R.; Zhang, G.M.; Feng, Z.H. TGF-β1 and TNF-α synergistically induce epithelial to mesenchymal transition of breast cancer cells by enhancing TAK1 activation J. Cell Commun. Signal 2019, 13, 369–380. [Google Scholar] [CrossRef]
- Biroccio, A.; Cherfils-Vicini, J.; Augereau, A.; Pinte, S.; Bauwens, S.; Ye, J.; Simonet, T.; Horard, B.; Jamet, K.; Cervera, L.; et al. TRF2 inhibits a cell-extrinsic pathway through which natural killer cells eliminate cancer cells. Nat. Cell Biol. 2013, 15, 818–828. [Google Scholar] [CrossRef]
- Mao, X.; Gauche, C.; Coughtrie, M.W.; Bui, C.; Gulberti, S.; Merhi-Soussi, F.; Ramalanjaona, N.; Bertin-Jung, I.; Diot, A.; Dumas, A.D.; et al. The heparan sulfate sulfotransferase 3-OST3A (HS3ST3A) is a novel tumor regulator and a prognostic marker in breast cancer. Oncogene 2016, 35, 5043–5055. [Google Scholar] [CrossRef]
- Paulsson, J.; Sjöblom, T.; Micke, P.; Pontén, F.; Landberg, G.; Heldin, C.H.; Bergh, J.; Brennan, D.J.; Jirström, K.; Ostman, A. Prognostic significance of stromal platelet-derived growth factor beta-receptor expression in human breast cancer. Am. J. Pathol. 2009, 175, 334–341. [Google Scholar] [CrossRef]
- Hollier, B.G.; Tinnirello, A.A.; Werden, S.J.; Evans, K.W.; Taube, J.H.; Sarkar, T.R.; Sphyris, N.; Shariati, M.; Kumar, S.V.; Battula, V.L.; et al. FOXC2 expression links epithelial-mesenchymal transition and stem cell properties in breast cancer. Cancer Res. 2013, 73, 1981–1992. [Google Scholar] [CrossRef]
- Jechlinger, M.; Sommer, A.; Moriggl, R.; Seither, P.; Kraut, N.; Capodiecci, P.; Donovan, M.; Cordon-Cardo, C.; Beug, H.; Grünert, S. Autocrine PDGFR signaling promotes mammary cancer metastasis J. Clin. Invest. 2006, 116, 1561–1570. [Google Scholar] [CrossRef]
- Chopra, P.; Joshi, A.; Wu, J.; Lu, W.; Yadavalli, T.; Wolfert, M.A.; Shukla, D.; Zaia, J.; Boons, G.J. The 3-O-sulfation of heparan sulfate modulates protein binding and lyase degradation. Proc. Natl. Acad. Sci. U.S.A. 2021, 118, e2012935118. [Google Scholar] [CrossRef]
- West, D.; Rees, C.G.; Duchesne, L.; Patey, S.J.; Terry, C.J.; Turnbull, J.E.; Delehedde, M.; Heegaard, C.W.; Allain, F.; Vanpouille, C.; et al. Interactions of multiple heparin binding growth factors with neuropilin-1 and potentiation of the activity of fibroblast growth factor-2. J. Biol. Chem. 2005, 280, 13457–13464. [Google Scholar] [CrossRef] [PubMed]
- Vander Kooi, C.W.; Jusino, M.A.; Perman, B.; Neau, D.B.; Bellamy, H.D.; Leahy, D.J. Structural basis for ligand and heparin binding to neuropilin B domains. Proc. Nat.l Acad. Sci. U.S.A. 2007, 104, 6152–6157. [Google Scholar] [CrossRef] [PubMed]
- Sarabipour, S.; Mac Gabhann, F. VEGF-A121a binding to neuropilins - A concept revisited. Cell. Adh. Migr. 2018, 12, 204–214. [Google Scholar] [CrossRef]
- Muhl, L.; Folestad, E.B.; Gladh, H.; Wang, Y.; Moessinger, C.; Jakobsson, L.; Eriksson, U. Neuropilin 1 binds PDGF-D and is a co-receptor in PDGF-D-PDGFRβ signaling. J. Cell Sci. 2017, 130, 1365–1378. [Google Scholar] [CrossRef] [PubMed]
- Lanzi, C.; Cassinelli, G. Heparan sulfate mimetics in cancer therapy: the challenge to define structural determinants and the relevance of targets for optimal activity. Molecules 2018, 23, 36. [Google Scholar] [CrossRef] [PubMed]
- Morla, S. Glycosaminoglycans and glycosaminoglycan mimetics in cancer and inflammation. Int. J. Mol. Sci. 2019, 20, 1963. [Google Scholar] [CrossRef] [PubMed]
- Cassinelli, G.; Favini, E.; Dal Bo, L.; Tortoreto, M.; De Maglie, M.; Dagrada, G.; Pilotti, S.; Zunino, F.; Zaffaroni, N.; Lanzi, C. Antitumor efficacy of the heparan sulfate mimic Roneparstat (SST0001) against sarcoma models involves multi-target inhibition of receptor tyrosine kinases. Oncotarget 2016, 7, 47848–47863. [Google Scholar] [CrossRef]
- Byrne, D.P.; Li, Y.; Ramakrishnan, K.; Barsukov, I.L.; Yates, E.A.; Eyers, C.E.; Papy-Garcia, D.; Chantepie, S.; Pagadala, V.; Liu, J.; et al. New tools for carbohydrate sulfation analysis: heparan sulfate 2-O sulfotransferase (HS2ST) is a target for small-molecule protein kinase Inhibitors. Biochem. J. 2018, 475, 2417–2433. [Google Scholar] [CrossRef]
Figure 1.
Overexpression of HS3ST3B1 mRNA correlates with mesenchymal-like phenotype in BrCa. (A) RT-qPCR analysis of HS3ST3B1 mRNA expression in BrCa cell lines representative of luminal (BT-474, MCF-7, T-47D, ZR-75-1), HER2+ (SK-BR-3) and TNBC (BT-20, Hs_578T, MDA-MB-231, SUM-159PT) subtypes. Relative abundance of the HS3ST3B1 transcripts was normalized to endogenous HPRT mRNA. Data are means ± SEM from three independent experiments. (B) Analysis of HS3ST3B1 mRNA data from the collection of BrCa Cell Lines [27] in UCSC-Xena data portal (https://xena.ucsc.edu). BrCa cell lines were categorized according to the luminal (N = 19), HER2+ (N = 8) and TNBC (N = 22) subtypes (*P < 0.05, **P < 0.01; n.s., not significant). (C) Analysis of HS3ST3B1 mRNA data from the TCGA BrCa cohorts in UCSC-Xena data portal. Quantitative expression of HS3ST3B1 was compared in ER+ (N = 592) versus ER- (N = 171) BrCa patients (**P < 0.01). (D) and (E) Analysis of the correlations of HS3ST3B1 mRNA with the transcripts of SNAI2, TWIST1, MMP2 and NRP1. Data were obtained from the collection of BrCa Cell Lines [27] and the TCGA BrCa cohorts (UCSC-Xena data portal). The Pearson correlation coefficient above 0.3 was considered as positive correlation.
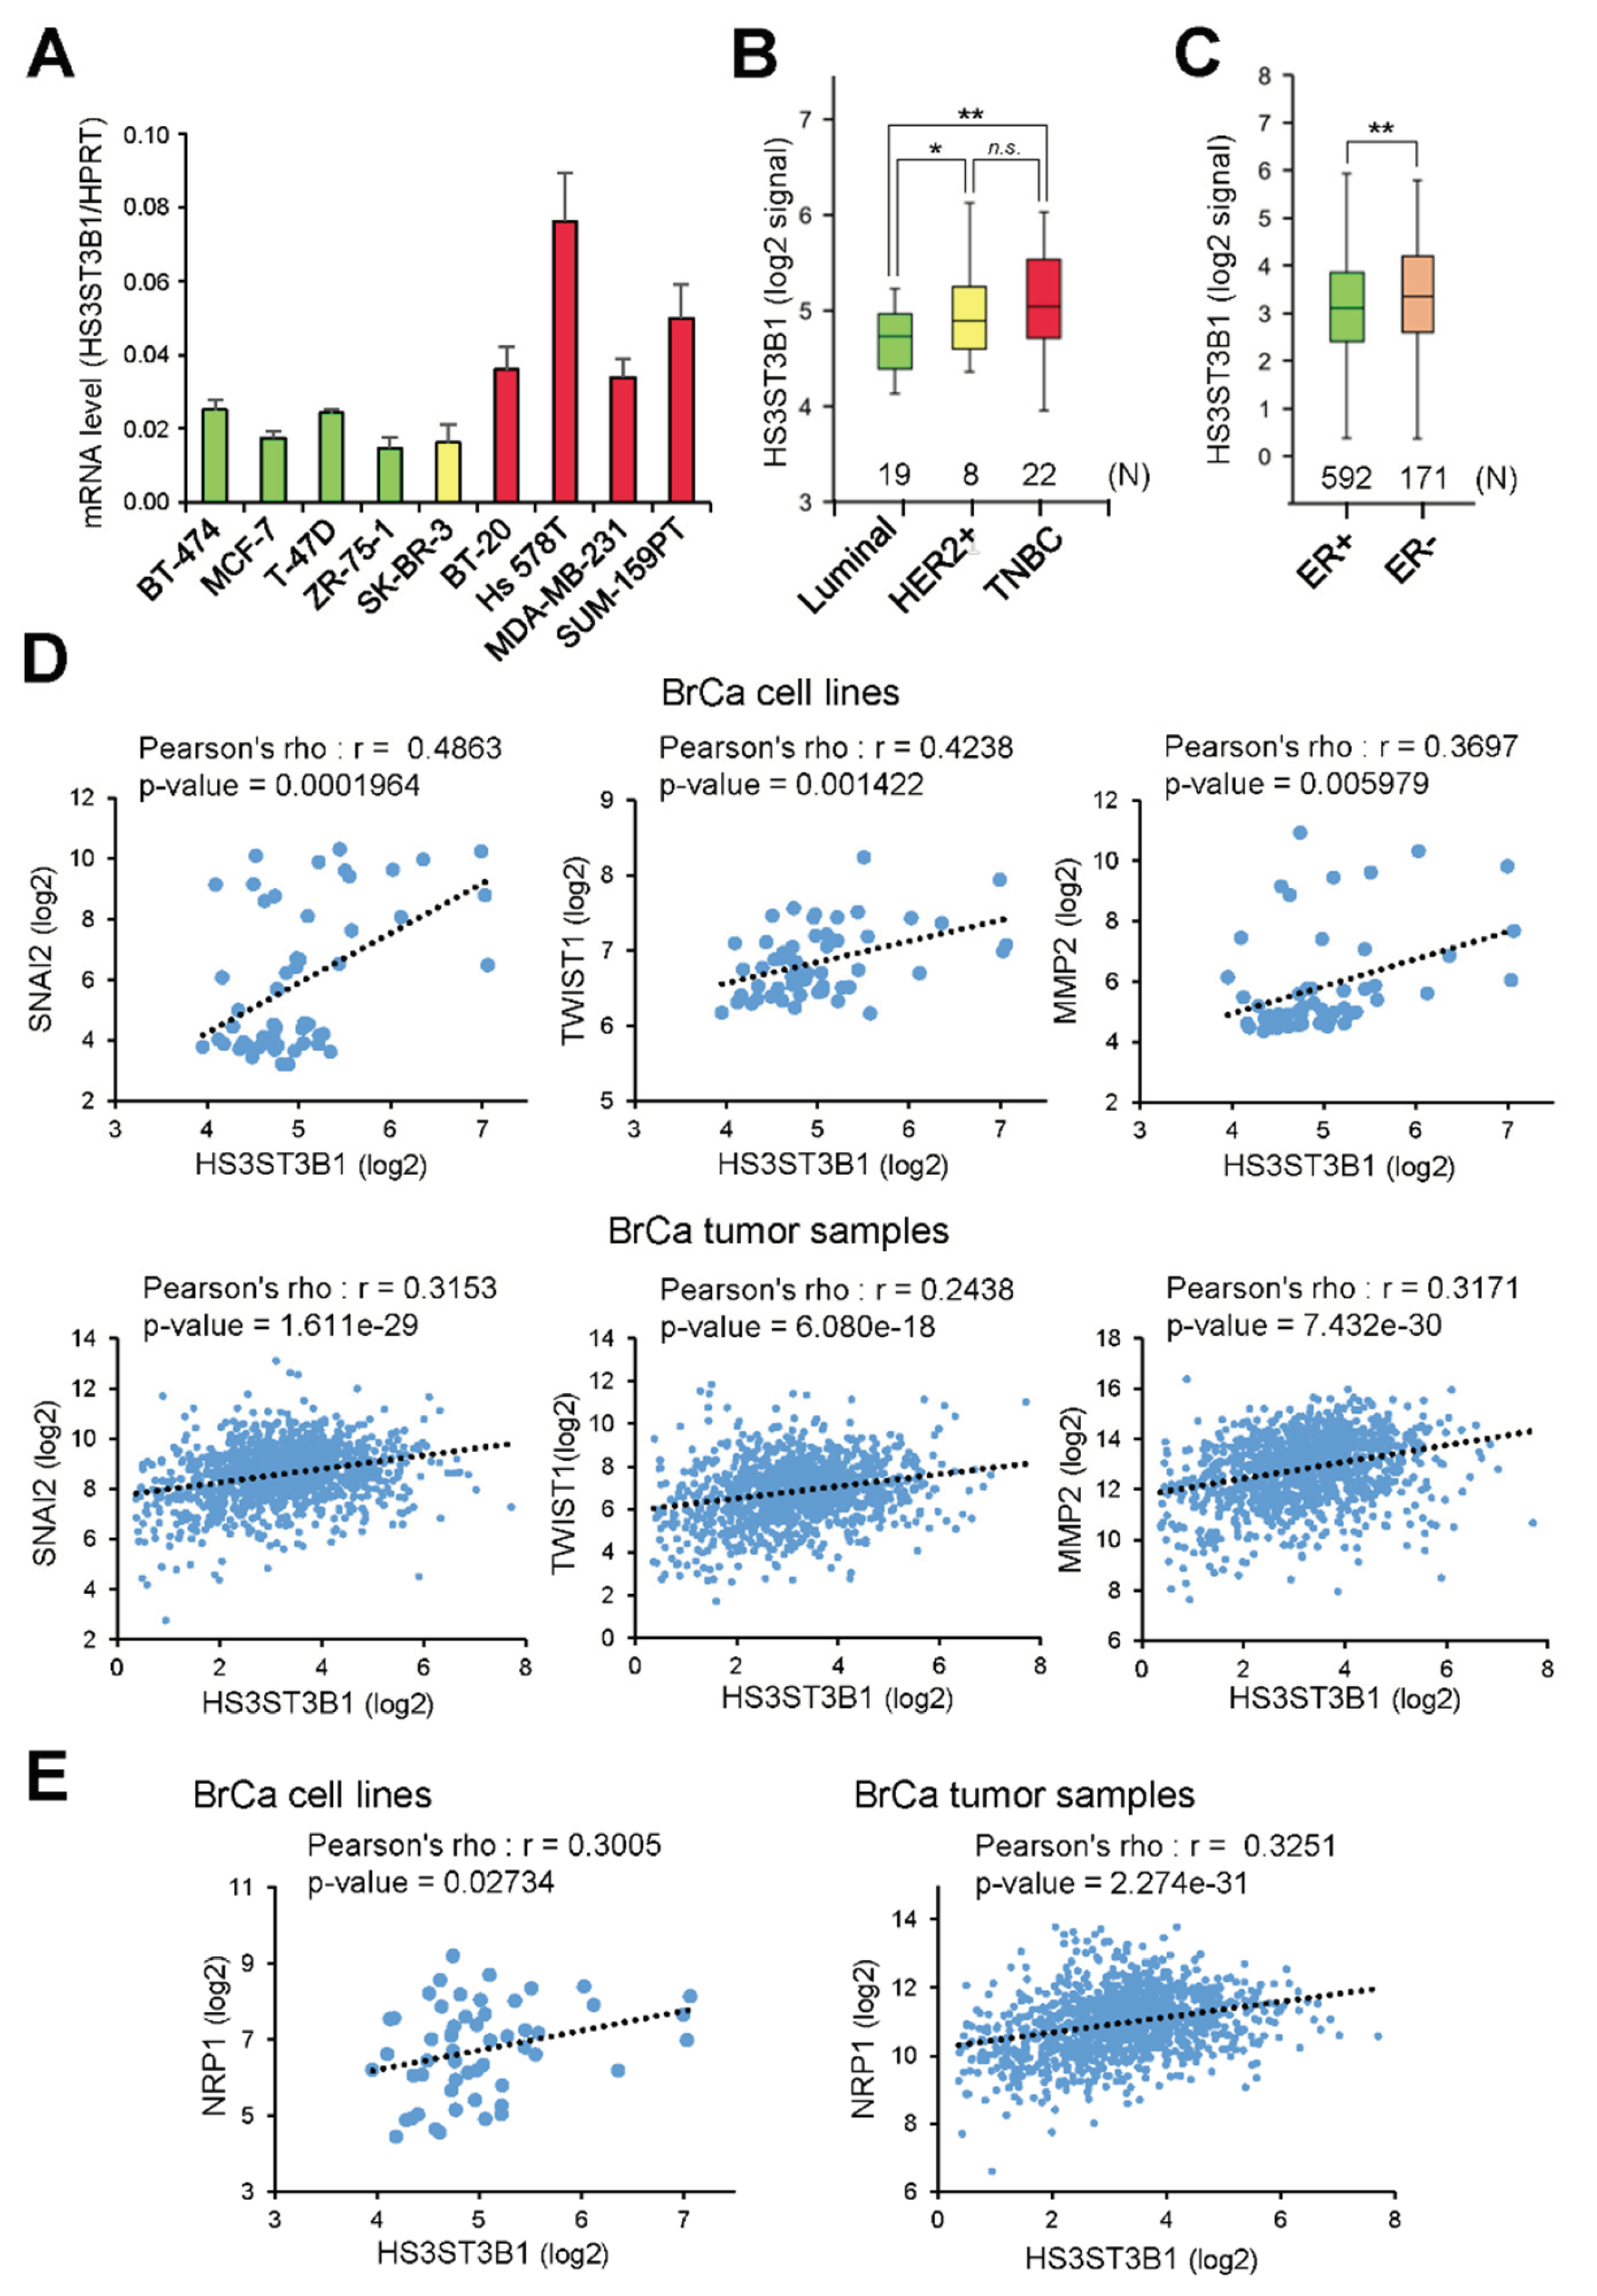
Figure 2.
HS3ST3B1 overexpression enhances the mesenchymal-like phenotype of MDA-MB-231 cells. (A) Representative images of DIC microscopy experiments showing the changes in the morphology of HS3ST3B1-overexpressing cells compared with parental cells (scale bar: 20 µm). (B) Representative images (scale bar: 50 µm) and summarized data showing the variation of the length-to-width ratio induced by HS3ST3B1 overexpression in MDA-MB-231 cells. Images were obtained from three independent experiments. Approximately 30 cells from each sample were taken for the elongation factor quantification (***P < 0.001). (C) The expression of transcription factors and specific markers of mesenchymal phenotype was examined by Western blot in MDA-MB-231 cells with or without HS3ST3B1 overexpression. (D) Densitometric quantification of immunoblot images. Histogram bars are means ± SEM from three experiments performed independently. (*P < 0.05, **P < 0.01, ***P < 0.001, significantly different when compared to parental cells).
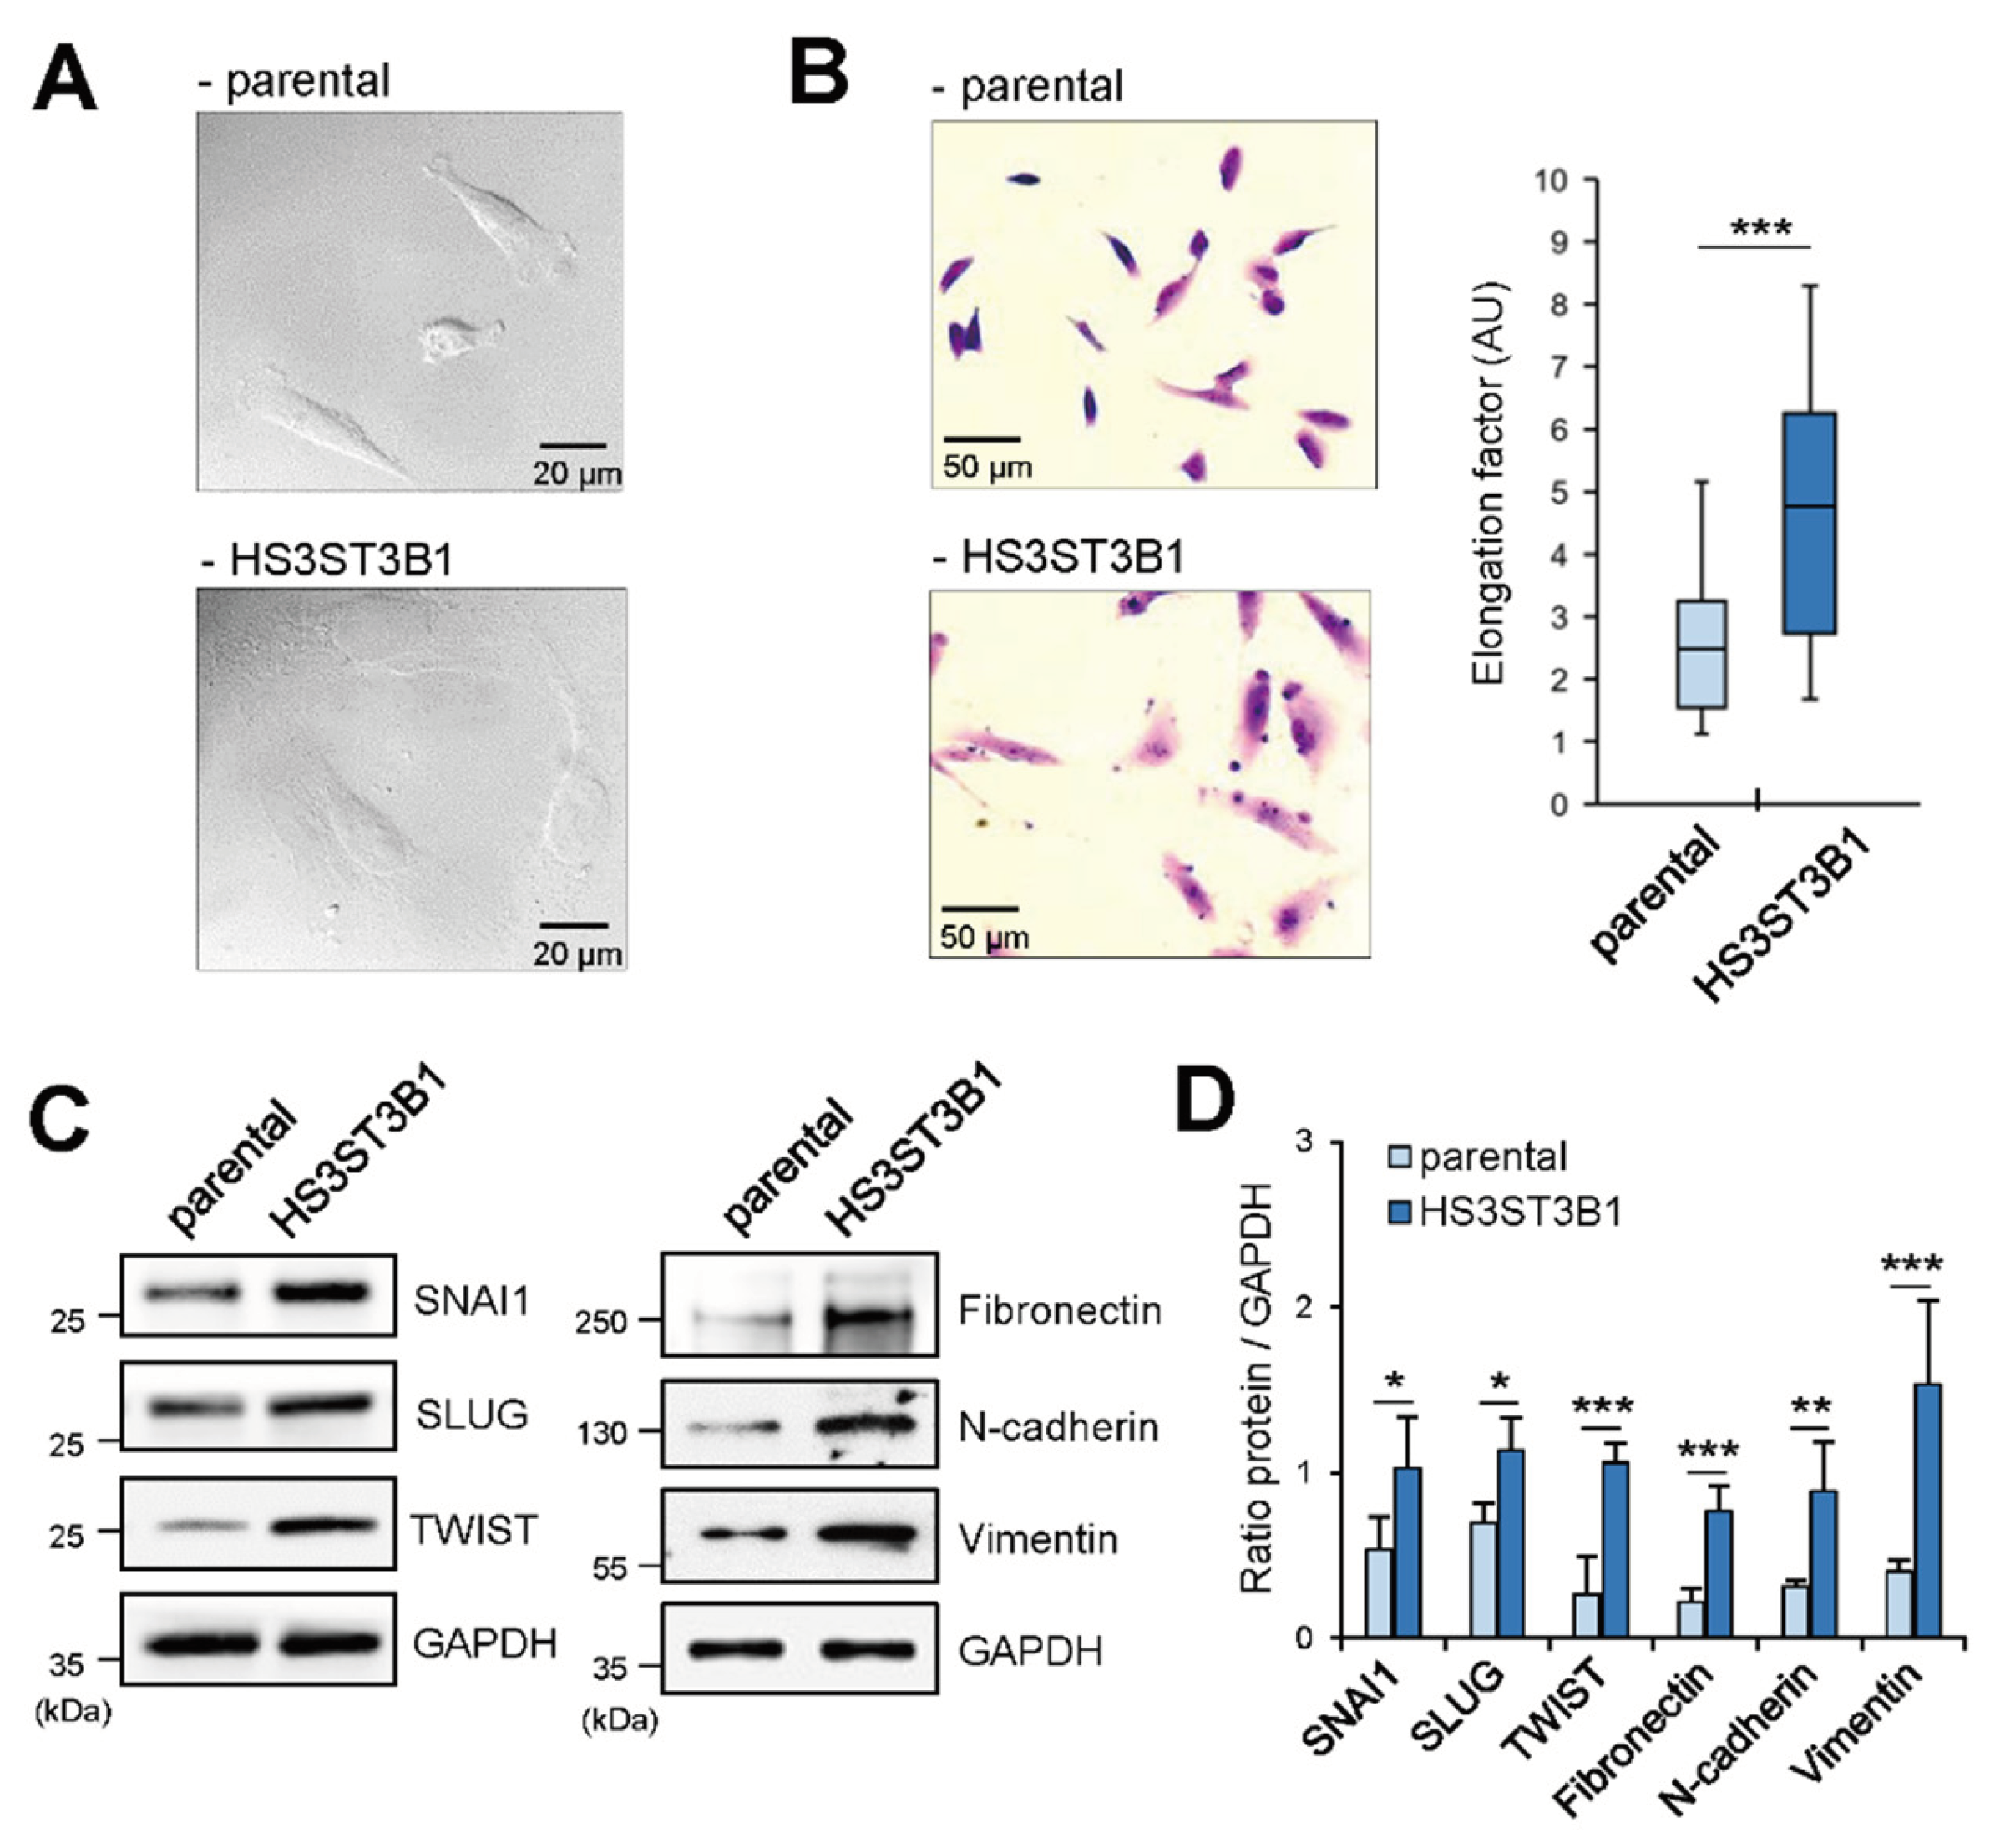
Figure 3.
HS3ST3B1 enhances the migratory and invasive properties of MDA-MB-231 cells. (A) Representative images and summarized data of scratch wound closure assay. Four images of each wound performed with parental and HS3ST3B1-overexpressing cells were taken under microscopic observation at 0 and at 20 hours of incubation. Each bar of histogram represents mean ± SEM of the relative closure from the fronts of the scratch. Data were obtained from three independent experiments (**P < 0.01, significantly different when compared to parental cells). (B). Representative images and summarized data of the transmigration of parental and HS3ST3B1-overexpressing cells through collagen-coated Transwell membrane. After 20 hours of incubation, the cells that invaded the lower surface of the membrane were fixed and stained with crystal violet. Four high-power field pictures of the lower surface of the membrane were photographed under microscopic observation. Each bar of histogram represents mean ± SEM of invasive cells per field. Data were obtained from three independent experiments (***P < 0.001, significantly different when compared to parental cells). (C) The expression of MMP14, MMP2 and MMP9 was analysed by real-time RT-PCR in MDA-MB-231 cells with or without HS3ST3B1 overexpression. Relative abundance of the transcripts was normalized to endogenous HPRT mRNA. Data are means ± SEM from three independent experiments (n.s. non-significant, **P < 0.01, ***P < 0.001, significantly different when compared to parental cells).
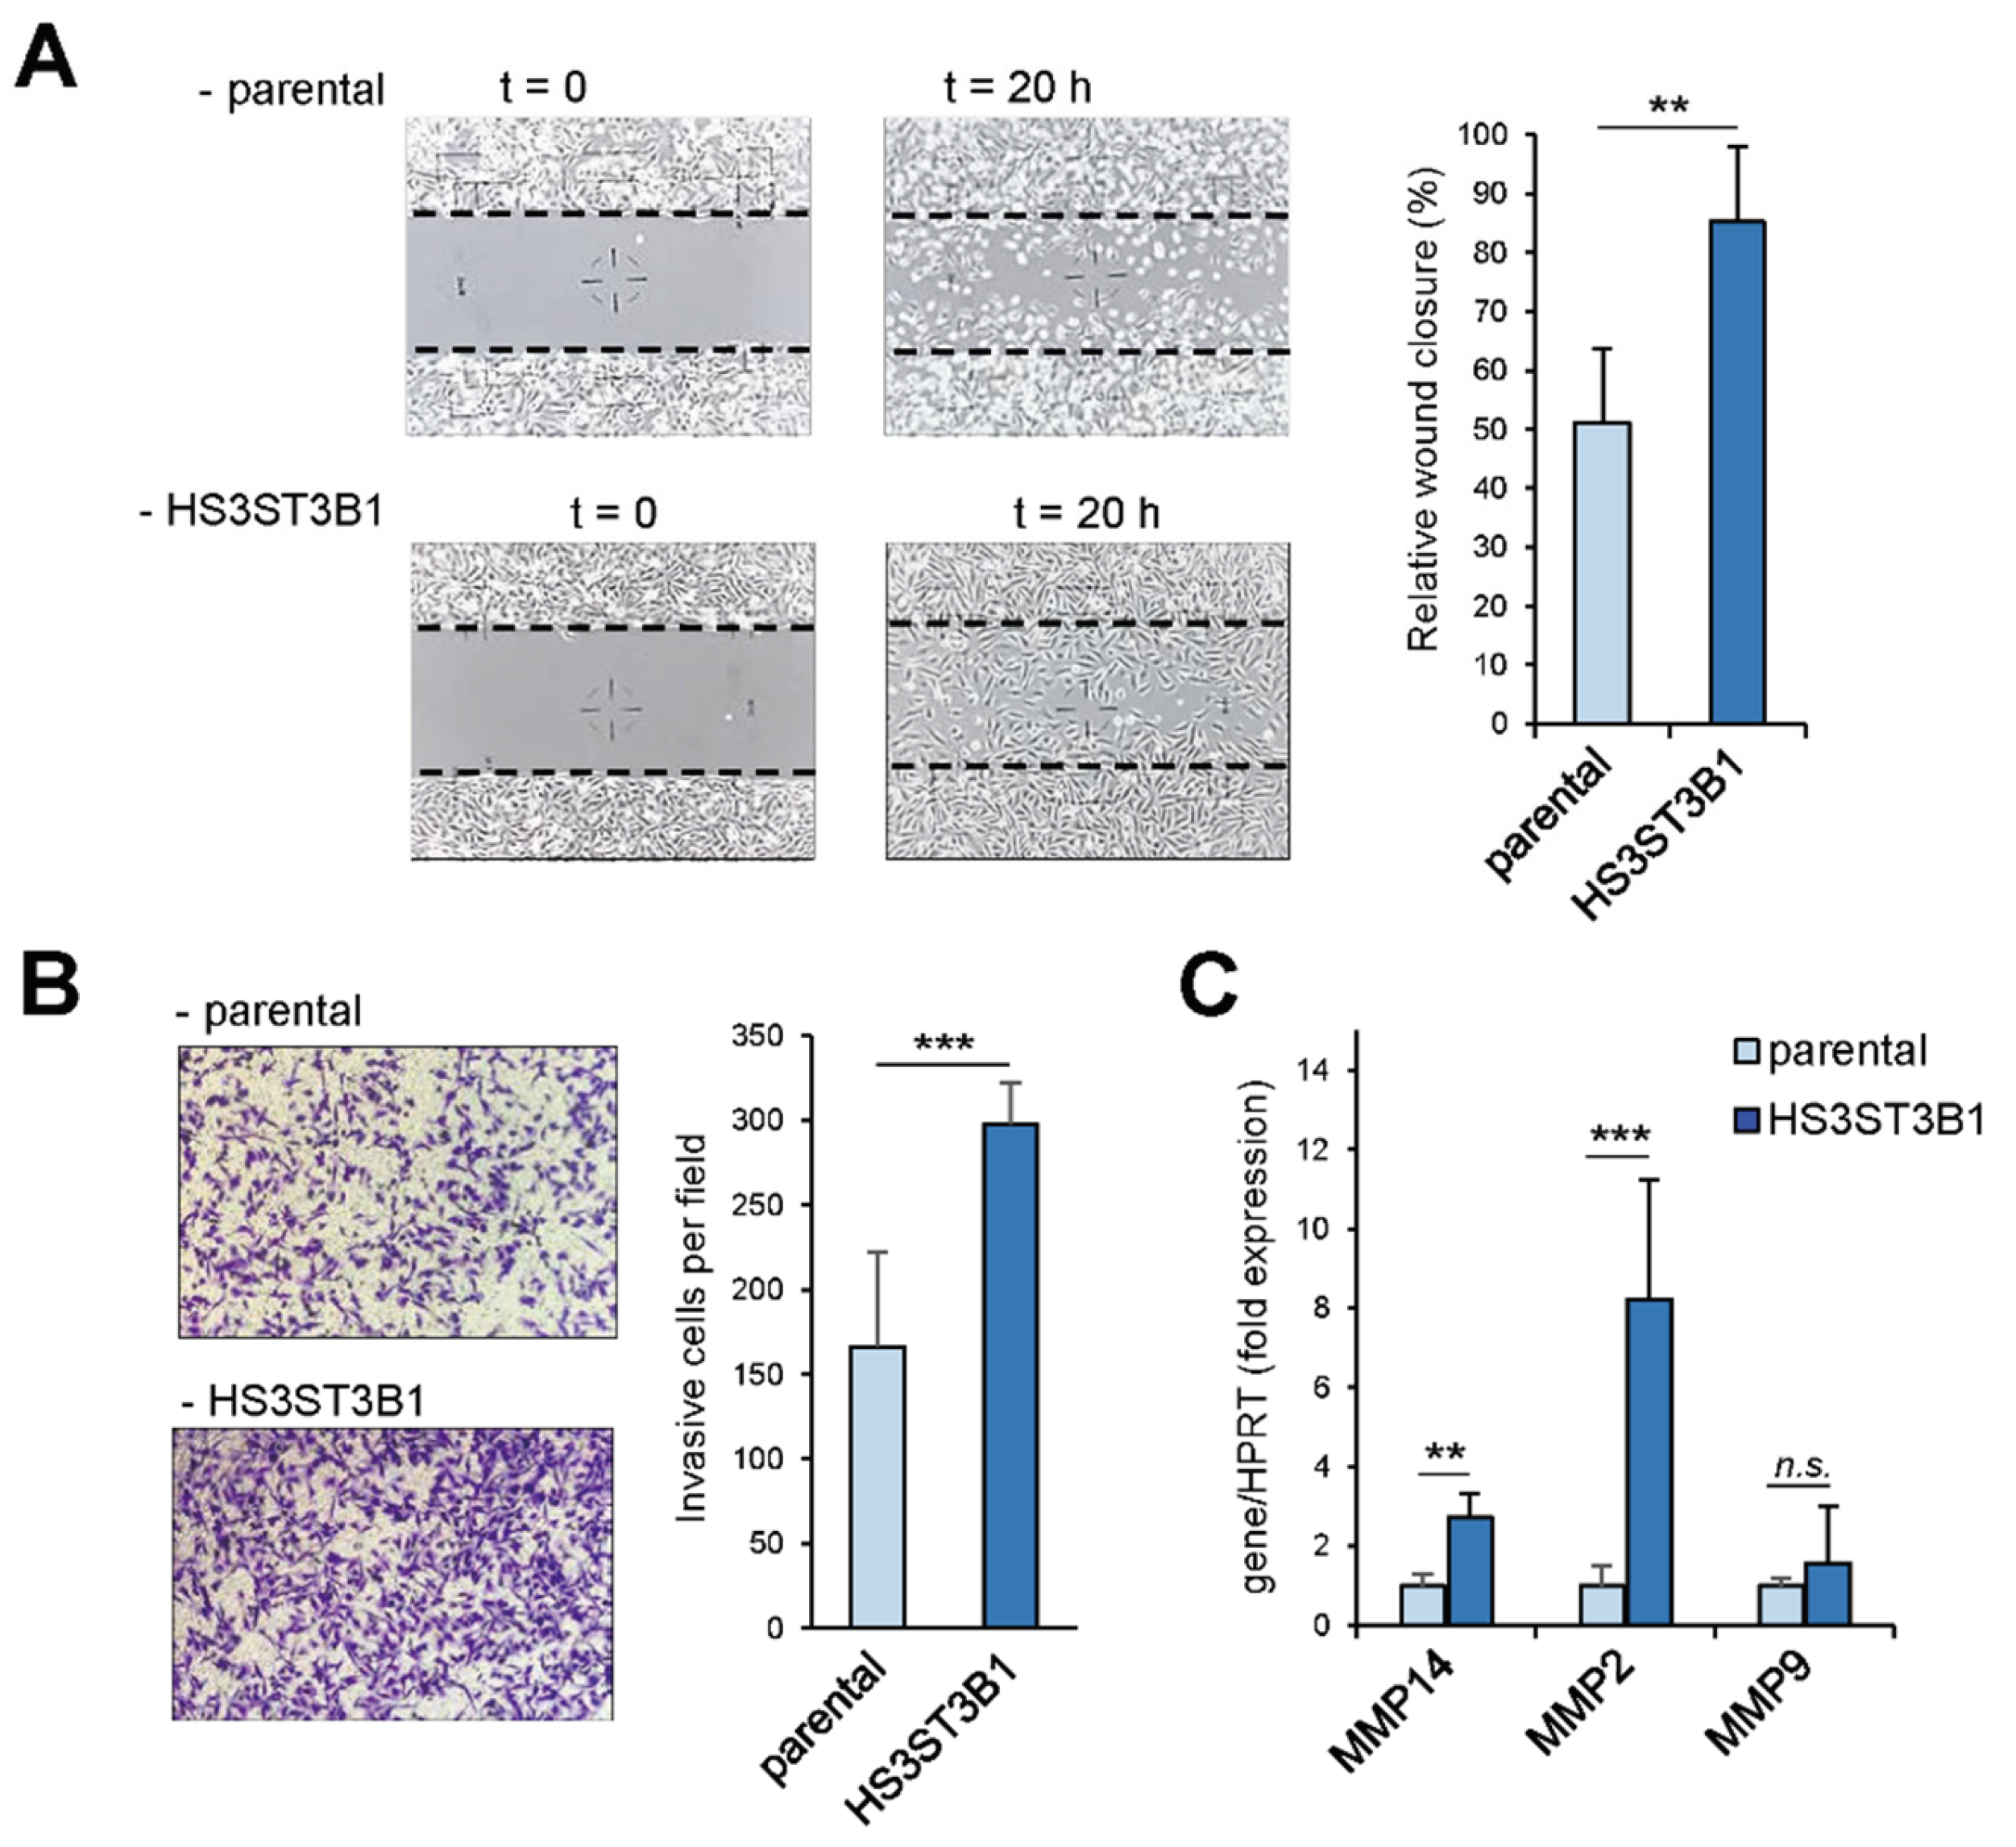
Figure 4.
HS3ST3B1 overexpression is associated with an increase in the activation of PDGF-Rβ and Src/CTTN pathway in MDA-MB-231 cells. Parental and HS3ST3B1-overexpressing cells were serum-starved for 3 hours and then stimulated for 15 min in the presence of complete culture medium containing 10% of FCS. (A) Representative image of RTK array showing the phosphorylation status of a panel of 49 receptors in parental versus HS3ST3B1-overexpressing cells: B17-B18, Insulin-R; C9-C10, PDGF-Rβ; C19-C20, ROR1; D17-D18, EphA1; E17-E18, DDR2; E21-E22, EphA10 (see Supplementary Figure S2 for detailed information). (B) The levels of phosphorylation and expression of PDGF-Rβ in parental and HS3ST3B1-overexpressing cells were analysed by Western blot. For each panel, GAPDH was used as the loading control. (C) Representative image of kinase array showing the phosphorylation status of the major signalling proteins in parental versus HS3ST3B1-overexpressing cells: C1-C2, TOR; D1-D2, Src; D3-D4, Lyn; D5-D6, Lck; D11-D12, p70 S6 kinase; E1-E2, Fyn; E3-E4, Yes; F1-F2, Hck; F5-F6, FAK; F7-F8, PDGF-Rβ ((see Supplementary Figure S3 for detailed information). (D) The levels of expression and phosphorylation of Src and CTTN in parental and HS3ST3B1-overexpressing cells were analysed by Western blot. As above, GAPDH was used as the control. Images were from three experiments performed independently. (E) Representative images and summarized data showing phospho-CTTN containing foci in parental versus HS3ST3B1-overexpressing cells. Following fixation and permeabilization, cells were incubated with anti-phospho-CTTN and then immunostained with Alexa 488-conjugated secondary antibody. Nuclei were stained in blue with DAPI (scale bar: 20 µm). The numbers of fluorescent foci were calculated from 30 randomly chosen cells per condition of three different experiments (***P < 0.001). (F) The inhibitory effect of Dasatinib (0.1 µM) on the activation of the Src/CTTN pathway in HS3ST3B1-overexpressing cells was analysed by Western blot. Results are representative of three independent experiments.
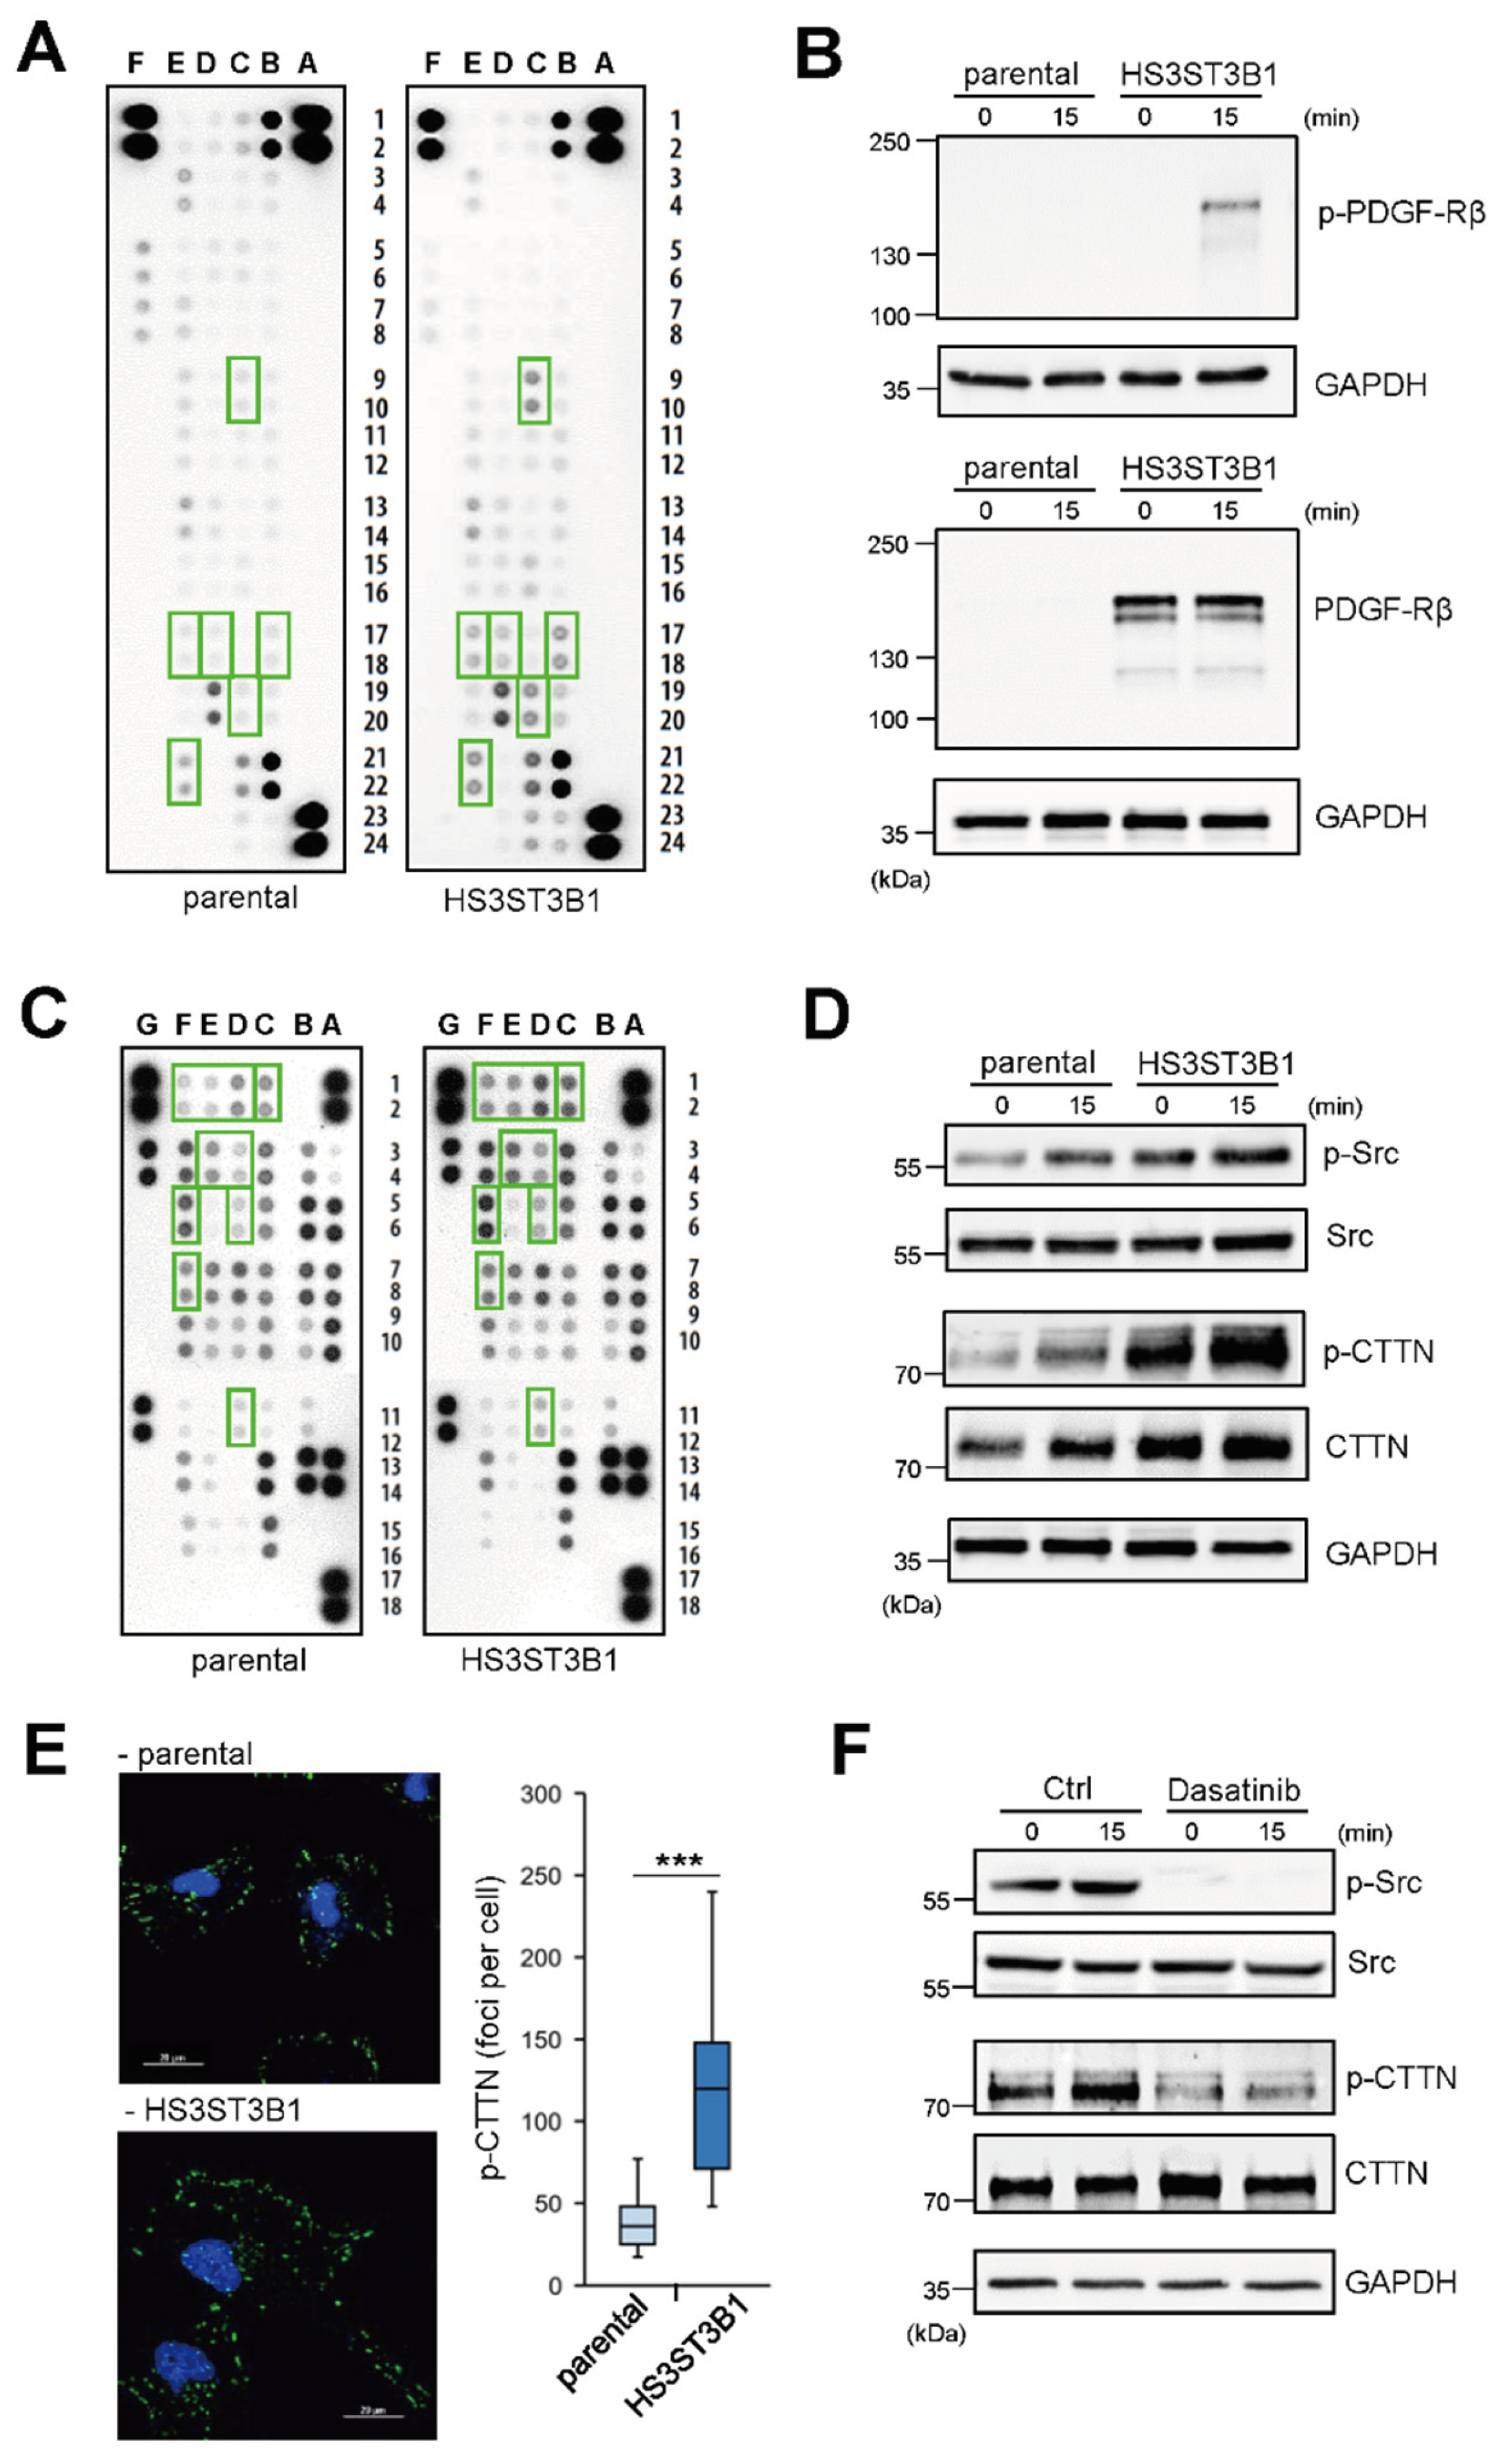
Figure 5.
Inhibition of PDGF-Rβ expression reduces the migratory/invasive properties of HS3ST3B1-overexpressing MDA-MB-231 cells. (A) The expression of PDGF-Rβ was efficiently knocked-down by a specific siRNA (si-PDGF-Rβ), as shown by RT-PCR (*P < 0.05; ***P < 0.001, significantly different when compared to cells treated with si-Ctrl; n = 3). (B) HS3ST3B1-overexpressing cells were treated with either si-Ctrl (control) or si-PDGF-Rβ for 48 h, after which time the levels of expression and phosphorylation of PDGF-Rβ, Src and CTTN were analysed by Western blot. Results are obtained from three independent experiments. (C) Effect of PDGF-Rβ silencing on the migration of HS3ST3B-overexpressing MDA-MB-231 cells towards the scratch in the wound healing assay. Images are representative of three experiments performed independently (**P < 0.01, significantly different when compared to cells treated with si-Ctrl). (D) Effect of PDGF-Rβ silencing on the transmigration of HS3ST3B1-overexpressing cells through Transwell collagen-coated membrane. Representative image and results from three independent experiments are shown (***P < 0.001, significantly different when compared to cells treated with si-Ctrl).
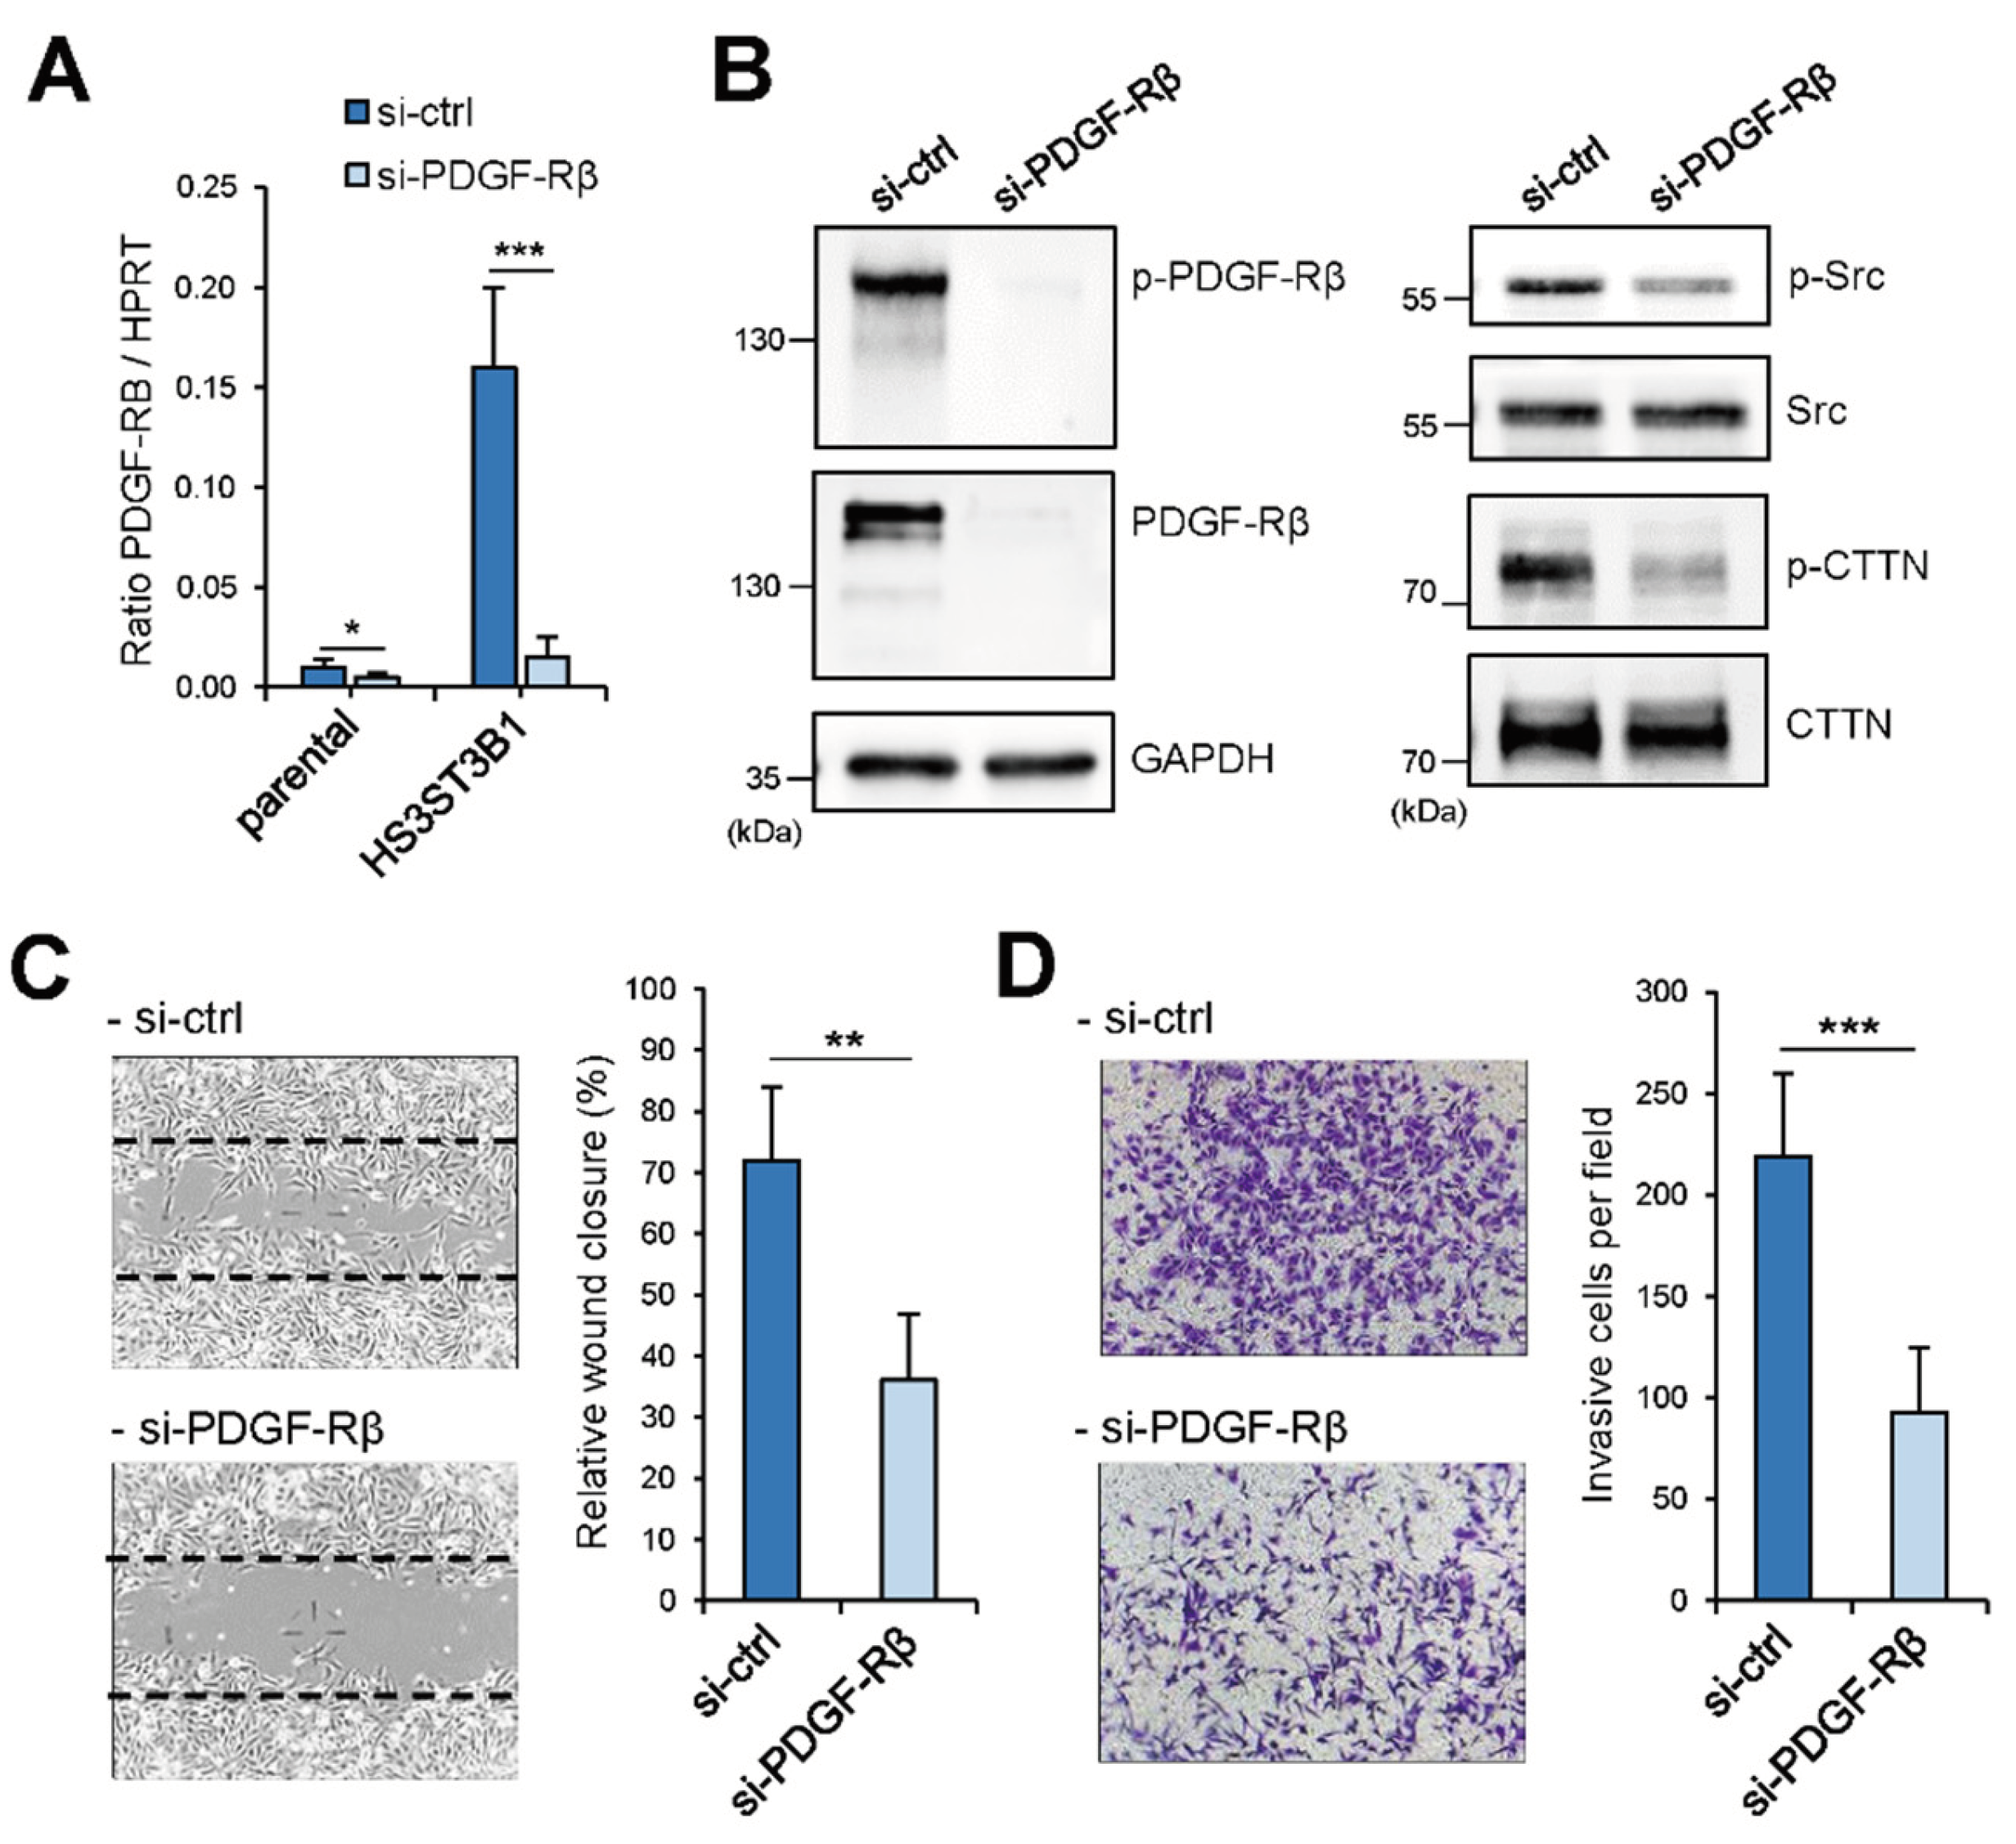
Figure 6.
Pharmacological inhibition of PDGF-Rβ reduces the migratory/invasive properties of HS3ST3B1-overexpressing MDA-MB-231 cells. (A) Cells were incubated with either vehicle (control), Imatinib (1 µM) or CP673451 (0.4 µM) for 24 h, after which time the activation status of PDGF-Rβ, Src and CTTN was analysed by Western blot. Results are representative of three independent experiments. The inhibitory effects of Imatinib (1 µM) and CP673451 (0.4 µM) on the motility of HS3ST3B1-overexpressing cells were analysed using wound healing assay (B) and Transwell transmigration assay (C) Representative images and summarized data were obtained from three separate experiments (***P< 0.001, significantly different when compared to cells treated with vehicle).
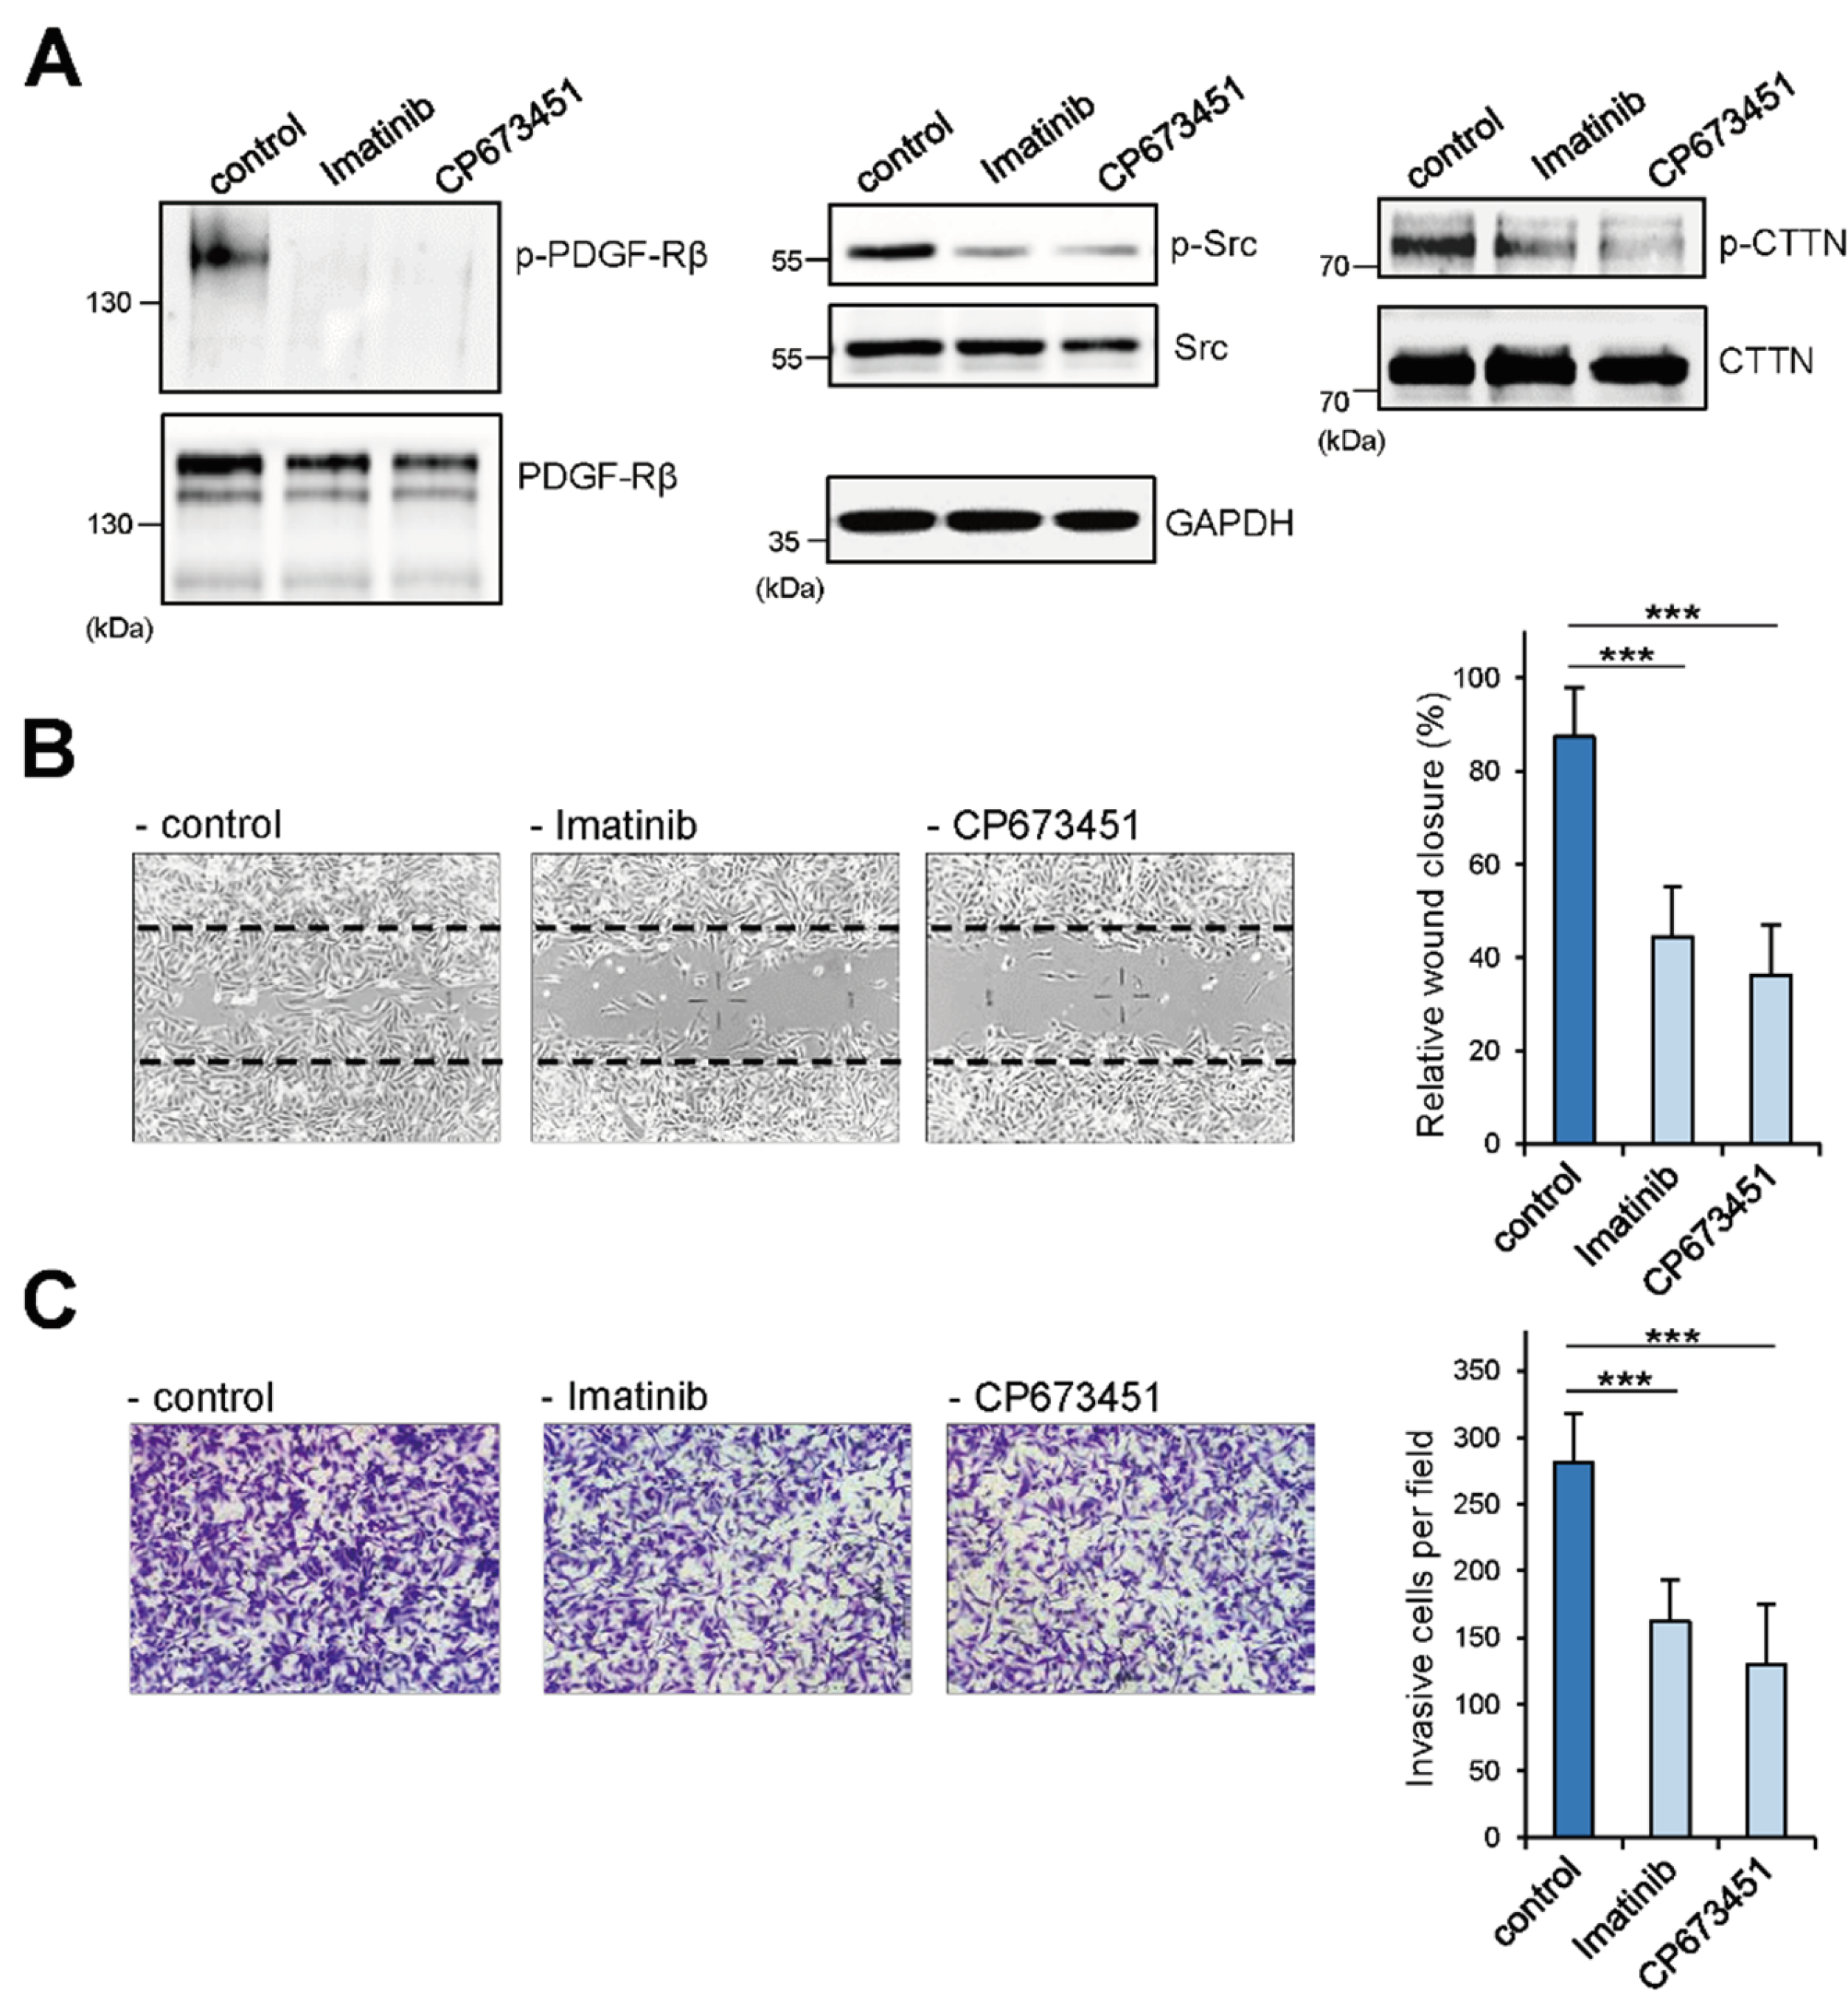
Figure 7.
HS3ST3B1 overexpression affects the chemo-sensitivity to anticancer drugs. (A) Kaplan–Meier analysis of the relationships between of HS3ST3B1 mRNA expression and RFS in patients with BrCa using the public dataset http:// kmplot. com. Panel a: not restricted analysis (N = 2032); panel b: restricted analysis to patients with chemotherapy (N = 751). The screening condition was the Affymetrix Jetset probe ID # “227361_at”. (B) Parental and HS3ST3B1-overexpressing MDA-MB-231 cells were treated with increasing concentrations of either doxorubicin, paclitaxel or gemcitabine for 72 h, after which time the sensitivity to the drugs was estimated by MTT assay. Results are expressed as percentage of cell viability compared to untreated control cells and correspond to means ± SEM from three independent experiments (*P < 0.05, **P < 0.01, ***P < 0.001). (C) Effect of PDGF-Rβ silencing on the sensitivity of MDA-MB-231 cells to anticancer drugs. Parental and HS3ST3B1-overexpressing cells were treated with either si-Ctrl or si-PDGF-Rβ for 24 h, after which time they were exposed to doxorubicin (200 nM), paclitaxel (50 nM) or gemcitabine (1 µM) for 72 h. Each bar of histogram represents mean ± SEM of the percentage of remaining cell viability, as determined by MTT assay. Results were from three independent experiments D (**P < 0.01, ***P < 0.001; n.s., not significant).
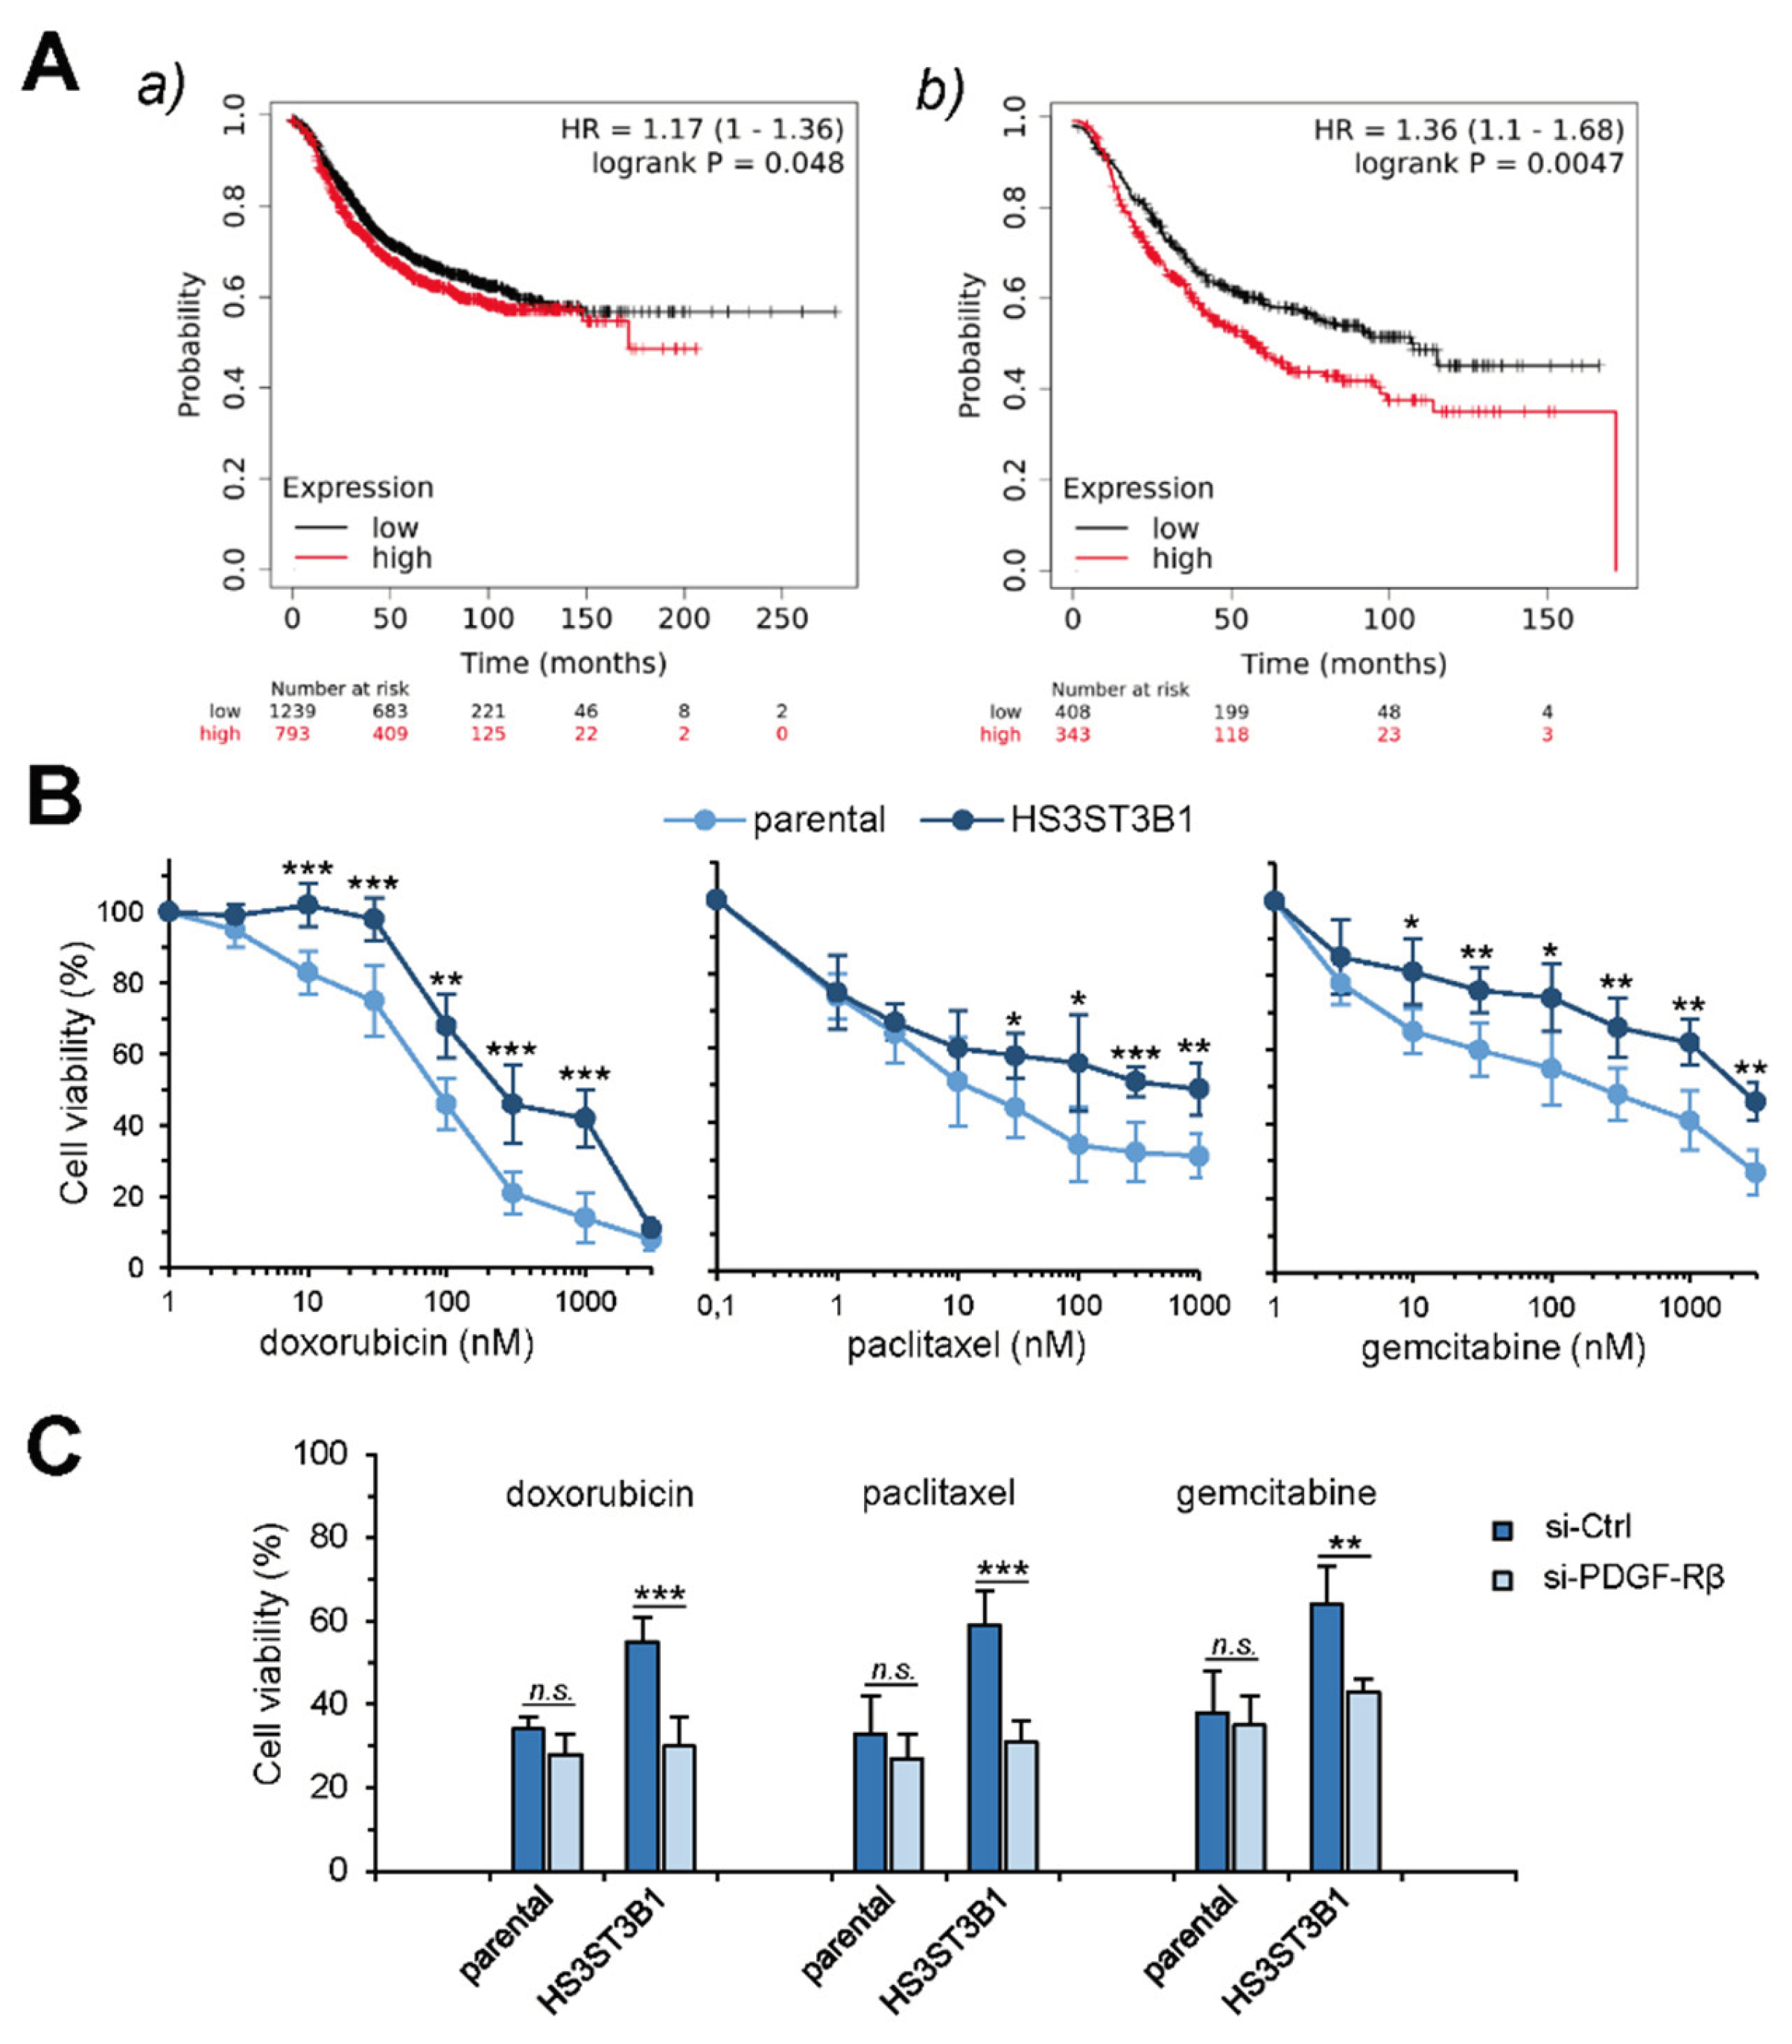
Disclaimer/Publisher’s Note: The statements, opinions and data contained in all publications are solely those of the individual author(s) and contributor(s) and not of MDPI and/or the editor(s). MDPI and/or the editor(s) disclaim responsibility for any injury to people or property resulting from any ideas, methods, instructions or products referred to in the content. |
© 2024 by the authors. Licensee MDPI, Basel, Switzerland. This article is an open access article distributed under the terms and conditions of the Creative Commons Attribution (CC BY) license (http://creativecommons.org/licenses/by/4.0/).
Copyright: This open access article is published under a Creative Commons CC BY 4.0 license, which permit the free download, distribution, and reuse, provided that the author and preprint are cited in any reuse.


