
Submitted:
23 June 2024
Posted:
24 June 2024
You are already at the latest version
Abstract
In this study, we investigate how dataset composition influences the performance and bias of age estimation models across different ethnic groups. We utilized pre-trained Convolutional Neural Networks (CNNs) such as VGG19, fine-tuning them on two datasets: UTKFace and APPA-REAL. UTKFace comprises 23,705 samples (12,391 males, 11,314 females) including 10,078 White, 4,526 Black, and 3,434 Asian individuals. APPA-REAL consists of 7,591 samples (3,818 males, 3,773 females) with 6,686 White, 231 Black, and 674 Asian individuals. We adjusted dataset composition by oversampling minority groups and reducing samples from the majority group to evaluate effects on model performance, measured using Mean Absolute Error (MAE) and standard deviation. Our findings demonstrate that oversampling alone does not guarantee equitable performance across ethnicities; reducing samples from the majority group often resulted in more balanced performance, evidenced by lower MAE standard deviations. These results underscore the importance of a nuanced approach to achieve fairness, including combining various sampling techniques. This study emphasizes the critical need for tailored dataset compositions to mitigate bias and suggests exploring more refined data processing methods and algorithmic adjustments for enhanced model fairness and accuracy in facial recognition technologies.
Keywords:
Facial recognition
; Age prediction
; Convolutional Neural Network (CNN)
; Ethnicity bias
1. Introduction
Bias in facial recognition systems is a critical issue, impacting fairness, transparency, and accuracy. This bias can manifest in various forms, including age, gender, and ethnicity disparities, often resulting from the inherent assumptions and decision-making processes embedded within the model architecture. For example, there are studies that analyzed the impact of age [1,2], which demonstrated worse performance on children’s faces. There are also studies comparing face recognition performance between males and females [3,4], which showed that face recognition systems performance is worse for females, one reason for that is that women’s faces are slightly more covered generally than males due to their longer hair.
Addressing bias in facial recognition systems is essential to ensure these technologies are equitable and just, respecting the rights and dignity of all individuals also complying with various regulations aimed at preventing discrimination. These include the Universal Declaration of Human Rights, the European Convention on Human Rights, and the General Data Protection Regulation (GDPR) [5,6].
Public training datasets often exacerbate the issue of bias by being heavily skewed towards certain ethnic groups, particularly White/Caucasian faces. This lack of diversity can result in less accurate recognition for individuals from underrepresented ethnic groups. Models trained on such biased datasets fail to generalize well across different demographic groups, leading to systematic inaccuracies and unfair outcomes.
As automatic age estimation becomes increasingly used in applications like forensics [7] and surveillance, this facial recognition sub-task has garnered significant research attention. This study focuses on improving the fairness of age estimation models, specifically addressing racial bias.
Utilizing the UTKFace and APPA-REAL datasets, which we have chosen for their demographic diversity and inclusion of labels such as real age and ethnicity which we needed for this research, we investigate the impact of unbalanced training data on model performance and bias. Rather than focusing on outperforming the state-of-the-art on these two datasets, we aim to:
- Analyze the relationship between dataset composition and both overall and ethnicity-specific model performance.
- Quantify the extent to which dataset rebalancing can mitigate bias in age estimation models.
- Determine whether dataset rebalancing alone is sufficient or if it should be combined with other bias mitigation techniques.
By addressing these objectives, this study aims to contribute to the development of fairer and more accurate age estimation models, ultimately enhancing the reliability and equity of facial recognition technology.
Age estimation can be approached through various methods, including manual feature extraction techniques or using deep learning models such as a Convolutional Neural Network (CNN). Different factors influencing facial aging, both intrinsic (genetic) and extrinsic (environmental), have been extensively studied. Various methods for image representation and age modeling, including anthropometric models, active shape models (ASMs), active appearance models (AAMs), aging pattern subspace (AGES), age manifolds, appearance models, and hybrid models, have been explored. Feature extraction techniques like Gabor filters, linear discriminant analysis (LDA), local binary patterns (LBP), local directional patterns (LDP), local ternary patterns (LTP), gray-level co-occurrence matrix (GLCM), spatially flexible patches (SFP), Grassmann manifolds, and biologically inspired features (BIFs) have also been investigated [8]. Angulu et al. (2018) surveyed these age estimation techniques, summarizing the Mean Absolute Error (MAE) and Cumulative Score (CS) of various age or age-group estimation models. This survey revealed that hybrid approaches, combining classification and regression, generally outperform using either method alone. Furthermore, deep learning methods, particularly CNNs, have demonstrated promising results, often surpassing traditional methods [8]. These findings were supported by ELKarazle et al. (2022) that also provides a comprehensive overview of machine learning techniques for estimating age from facial images. They present some of the same general challenges in this task such as variations in aging patterns among individuals due to genetics, lifestyle, health conditions and environmental factors, the availability of diverse and high-quality facial image datasets that cover a wide range of ages, genders and ethnicities being limited, and variations in lightning, pose and facial expressions are all factors that influence the overall age estimation accuracy as well as for different ethnic groups. They have also concluded that deep learning models, especially those based on transfer learning, generally outperform handcrafted models due to their ability to learn complex features automatically [9]. This was again supported by another study where manual feature extraction techniques were tried on the facial-age dataset and the UTK Face dataset, the resulting filtered images converted to scalars and fed to a Random Forest classifier and Support Vector classifier and compared with a Convolutional Neural Network, showing that the CNN outperformed traditional machine learning techniques for age classification by up to 40% [10]. This proven track record of CNNs is the reason we have also chosen to use them for our research purposes. As we have mentioned earlier, the age estimation problem has garnered a lot of attention from researchers, and an in-depth comparison of studies on age estimation can be seen in Table 1.
Previous works, such as the Analysis of Race and Gender Bias in Deep Age Estimation Models by Puc et al. (2020) [11] analyze the performance of two pre-trained age estimation models on two datasets UTKFace and APPA-REAL across different race and gender groups. The study finds that age estimation models tend to be more accurate for males than females, suggesting a gender bias in the models or the datasets. They also found performance differences across different race but had inconsistent variations in the results between datasets, indicating that factors other than race, such as image quality and pose might also have an impact. While Puc et al. (2020) acknowledge the potential impact of dataset imbalance on model bias, they do not actively manipulate the dataset to mitigate the issue. Our paper specifically investigates the effects of rebalancing the dataset to achieve a more equitable representation of different racial groups, and to quantify the extent to which dataset rebalancing can reduce bias in age estimation models. Thus, providing concrete evidence of the effectiveness of rebalancing as a bias mitigation strategy.
Furthermore, Karkkainen and Joo (2019) [12] do not directly implement the methods proposed in our research. They introduced the FairFace dataset to mitigate racial bias in facial attribute datasets, but did not investigate the impact of unbalanced training data on model performance and bias as we have. Their use of an age range rather than exact ages (approximately 10-year intervals) makes direct comparison with our work challenging, given that precise age regression is considerably more complex. Despite achieving relatively comparable performance across different racial groups, their reported accuracy remains around 60%.
Abdolrashidi et al. (2020) [13] do not explicitly address the issues of fairness and bias in age estimation models that we are focusing on. Their primary goal is to improve the accuracy of age and gender prediction using an ensemble of attentional and residual convolutional neural networks. They utilize the UTKFace dataset, which is demographically diverse, but they do not analyze the impact of dataset imbalance on model performance across different ethnicities or genders. They also do not explore techniques for dataset rebalancing or other bias mitigation strategies. The paper indirectly touches upon potential issues in existing methods by highlighting the challenges in age and gender prediction due to intra-class variations in facial images, such as variations in lighting, pose, scale, and occlusion. These variations could potentially lead to biased performance across different demographic groups, but this aspect is not explicitly investigated in the paper. Therefore, while Abdolrashidi et al. (2020) contribute to improving the accuracy of age and gender prediction, they do not directly address the issues of fairness and bias that our research aims to tackle. Our work aims to extend their findings by specifically investigating the impact of dataset imbalance and exploring techniques to mitigate bias, thus contributing to the development of fairer and more equitable age estimation models.
Sathyavathi and Baskaran (2023) [14] do not explicitly address the issue of racial bias in age estimation models, nor do they investigate the impact of unbalanced training data on model performance and bias across different ethnicities. Their primary focus is on improving the accuracy of age prediction using a deep learning framework that combines a Deep Convolutional Neural Network (DCNN) with a Cuckoo Search (CS) algorithm. They utilize the UTKFace, FGNET, and CACD datasets, which are diverse in terms of age and ethnicity, but they do not analyze the effect of dataset composition on model performance for specific ethnic groups. They also do not explore techniques for dataset rebalancing or other bias mitigation strategies.
The paper indirectly mentions a potential issue in existing methods by stating that “Human age is determined by facial structure and it may be different from that detected using our human eye.” This suggests that existing methods might not be capturing all the relevant features for accurate age estimation, potentially leading to biased results for certain individuals or groups. However, the paper does not delve deeper into this issue or investigate its potential causes.
Therefore, while Sathyavathi and Baskaran (2023) propose a method to improve the accuracy of age prediction, they do not directly address the issues of fairness and racial bias that our research aims to tackle.
Amelia and Wahyono (2022) [15] also did not explicitly focus on addressing bias and fairness, or the impact of unbalanced training data on model performance. Their primary focus is on improving the accuracy of age estimation using texture-based features and Support Vector Regression (SVR). They utilize the face-age.zip and UTKFace datasets.
This paper indirectly mentions a potential issue in existing methods by acknowledging the limitations of their dataset, which primarily consists of images from Western countries and may not perform as well on images from Asian countries due to the lack of representation in the training data. This suggests a potential bias in their model due to the underrepresentation of certain ethnic groups. However, the paper does not delve deeper into this issue or investigate its potential causes.
The survey on age estimation [8] paper touches upon dataset challenges but does not deeply explore imbalances related to ethnicity. In contrast, our research specifically targets the critical issue of dataset imbalance, especially concerning ethnicity. This focus is crucial for ensuring fairness and accuracy across diverse ethnic groups.
Moreover, while the deep learning model diagnosis [17] paper explores model architectures, it does not extensively evaluate performance across diverse ethnic groups. Our research goes beyond by meticulously assessing accuracy degradation concerning ethnicity. This nuanced analysis provides valuable insights into the impact of underrepresentation on age prediction accuracy, enhancing the understanding of algorithmic biases in facial recognition systems.
Clapes et al. (2018) [16] do not directly address the impact of unbalanced training data on model performance and bias in age estimation models. Their primary focus is on analyzing the biases present in apparent age estimation (how old people look) and leveraging this information to improve real age estimation (chronological age). They utilize the APPA-REAL dataset, which contains both real and apparent age labels, and augment it with additional annotations for gender, ethnicity, makeup, time of photo, and facial expression.
While the authors do not explicitly investigate the impact of unbalanced training data, their work indirectly touches upon the issue of bias in age estimation models. They identify two main categories of bias:
- Target bias: Biases inherent to the target subject, such as gender, ethnicity, makeup, and facial expression.
- Guess bias: Biases introduced by the people guessing the apparent age, which can be influenced by their own age and gender.
The authors analyze these biases and show that they can significantly affect the accuracy of age estimation models. For example, they find that makeup tends to make people look younger, while old photos tend to make people look older. They also find that female guessers are generally more accurate at estimating age than male guessers.
Jacques et al. (2019) [18] focus on improving real age estimation by incorporating apparent age and facial attributes (gender, race, happiness, and makeup) into an end-to-end deep learning model. While they do not explicitly address dataset imbalance or rebalancing techniques, their work highlights the importance of considering biases related to facial attributes in age estimation. The paper identifies several issues in existing methods such as bias in age perception which can be influenced by various factors including gender, race, facial expression and makeup. All of which can affect the accuracy of age estimation models. Limited use of apparent age is another one, while some previous works have explored the use of apparent age (perceived age) to improve real age estimation, Jacques et al. (2019) argue that these methods often rely on post-processing bias correction schemes rather than incorporating bias correction directly into the model training process.
In summary, previous research has highlighted the presence of gender and potential racial bias in age estimation models. However, these studies have not systematically investigated the impact of unbalanced training data on model performance and fairness across different racial groups. The lack of balanced representation in datasets can lead to biased models that perform poorly for certain demographics, perpetuating existing inequalities and raising concerns about the reliability and equity of facial recognition technology.
Addressing bias in age estimation models is crucial for ensuring fair and equitable outcomes in various applications, such as law enforcement, marketing, and healthcare. Biased models can lead to discriminatory practices and disproportionately affect marginalized groups. This study contributes to developing fairer and more accurate age estimation models by identifying the impact of dataset imbalance and exploring effective mitigation strategies.
This study fills a gap in the existing literature by explicitly focusing on the impact of dataset imbalance on racial bias in age estimation models. It provides a comprehensive analysis of the relationship between dataset composition and model performance and quantifies the effectiveness of rebalancing techniques. We have been able to identify a link between different dataset compositions and varying performance for specific demographic groups. The findings of this study will inform the development of more equitable and reliable age estimation models, ultimately contributing to the advancement of facial recognition technology that is fair and unbiased across all demographics.
2. Materials and Methods
As briefly mentioned above, we have utilized two publicly available datasets for our experiments: the UTKFace dataset [19] and the APPA-REAL dataset [20]. These datasets were chosen for their demographic diversity and the inclusion of labels such as real age, ethnicity, and gender. Although both datasets contain images of White, Black, and Asian groups, these groups are not equally represented, which is a common issue across publicly available datasets. Detailed information about the composition of both datasets can be found in Table 2.
The UTKFace dataset contains 23,705 samples, while the APPA-REAL dataset contains 7,591 samples. We split the UTKFace dataset into training and test sets, whereas the APPA-REAL dataset comes pre-split into training, test, and validation sets. As shown in Table 1, both datasets have an equal number of male and female samples, and they cover a wide age range from 1 to 116 years.
However, there are disparities in racial representation. Both datasets are heavily weighted towards the White race. Although the UTKFace dataset does not have an equal number of samples across different race groups, it has more samples of Black and Asian groups compared to the APPA-REAL dataset. The UTKFace dataset also includes images of the Indian group and others, representing ethnicities such as Hispanic, Latino, and Middle Eastern.
Since the APPA-REAL dataset contains only three ethnic groups, we combined the Black and Indian groups from the UTKFace dataset into one and discarded the “Others” group. This decision was made to facilitate comparison, as the “Others” group contains a mix of ethnicities.
The only preprocessing steps applied to these images involved scaling them to a size of 224x224x3, as required by the VGG19 model [21], and using its preprocess_input function, which centers the color channels at zero and converts the images from RGB to BGR. Figure 1 shows a few example images from both the UTKFace and APPA-REAL datasets.
Due to the proven track record of CNNs and their superior performance compared to manual feature extraction techniques, we chose to utilize them in our experiments. CNNs are deep learning models specifically designed to process and analyze visual data by automatically detecting features such as edges, textures, and shapes from raw pixel data through layers of convolutional filters. This enables CNNs to effectively recognize patterns and objects, making them particularly suited for tasks such as image classification, object detection, and age estimation from facial images.
We opted to employ CNNs with transfer learning for several advantages. Transfer learning harnesses knowledge acquired from a pre-trained model on a large dataset for a related task, significantly reducing training time and data requirements. Pre-trained models have already gleaned valuable features from extensive datasets, enhancing performance on new tasks, particularly with smaller datasets. Additionally, transfer learning enables the utilization of sophisticated models without the need for extensive computational resources to train from scratch. Moreover, earlier layers of transfer learning models, designed for extracting generic features, can be fine-tuned for specific applications.
We employed widely recognized CNN models extensively used in scientific studies: VGG16 [21], VGG19 [21], ResNet50 [22], and MobileNetV2 [23], all pretrained on the ImageNet [24] dataset. These models were selected for their proven effectiveness in feature extraction from complex visual data, including facial images, which is crucial for accurate age estimation. Specifically:
- VGG19 and ResNet50 are known for their deep architectures, allowing them to capture intricate features through multiple layers of convolutions. This depth can be advantageous in learning hierarchical representations of facial features relevant to age.
- MobileNetV2 is chosen for its efficiency and suitability for mobile and embedded applications, offering a balance between computational efficiency and performance, which is valuable for practical deployment scenarios.
- VGG16 offers a simpler architecture compared to VGG19 but still maintains strong performance in various computer vision tasks, making it a reliable benchmark in our comparative analysis.
Our primary objective was to optimize the models for predicting real age using the UTKFace and APPA-REAL datasets. To achieve this, we conducted grid search cross-validation, varying hyperparameters within empirically justified ranges:
- Learning Rate: Ranging from 0.1 to 0.000001, to find a balance between convergence speed and fine-grained model adjustments. Lower rates allow for finer adjustments during training, potentially leading to better generalization.
- Batch Size: Explored from 16 to 128, balancing between computational efficiency and gradient noise reduction. Larger batch sizes often accelerate training but can lead to poorer generalization compared to smaller batches.
- Number of Epochs: Explored from 30 to 100, considering the trade-off between model convergence and overfitting. More epochs may capture complex patterns but risk overfitting, especially with limited data.
Additionally, we evaluated different optimizers such as Adam and SGD, assessing their impact on training dynamics and convergence speed. The configuration of fully connected layers at the model’s top was also varied to optimize age prediction performance. Throughout our experiments, we progressively opened layers one by one and eventually the entire base model for training, to evaluate and optimize performance comprehensively.
During training, Mean Absolute Error (MAE) served as our primary performance metric to evaluate model accuracy in age prediction. The VGG19 model consistently outperformed others on both datasets, leveraging its robust architecture and ability to learn intricate facial features crucial for age estimation. Following the identification of the best-performing model from our initial evaluation on the original dataset composition, all subsequent tests were conducted exclusively on this model. Its architecture is illustrated in Figure 2.
As illustrated in Figure 2, our model takes an input size of 224x224x3. The architecture starts with a block containing two convolutional layers followed by a max pooling layer. Max pooling is a downsampling technique used to reduce the spatial dimensions of the input representation, which helps to lower computational load, control overfitting, and enhance the network’s robustness. This step is essential in CNN architectures to simplify the representation while preserving important features.
Next, we have another block with two convolutional layers and a max pooling layer. This is followed by a third block with four convolutional layers and a max pooling layer. The fourth and fifth blocks each consist of four convolutional layers and a max pooling layer. This totals to 16 convolutional layers in the network.
After the convolutional and pooling layers, a flattening layer converts the multi-dimensional tensor into a one-dimensional vector. This transformation is crucial because it allows the output from the convolutional and pooling layers to be fed into fully connected (dense) layers for final classification or regression tasks, effectively bridging the two parts of the network.
Following the flattening layer are two dense layers with 4096 nodes each, then another dense layer with 100 nodes, and finally, the output layer with a single node. The hidden convolutional and dense layers utilize the ReLU (Rectified Linear Unit) activation function, which is widely used in CNNs. ReLU introduces non-linearity into the model, enabling it to learn complex patterns and functions. It is computationally efficient, involving a simple operation of setting negative values to zero while keeping positive values unchanged, and it also helps mitigate the vanishing gradient problem. Since we are dealing with a regression task, the activation function used in the output layer is the linear activation function. The linear activation function does not transform its input, meaning the output of the neuron is directly equal to its input.
The best-performing hyperparameters for both datasets included a learning rate of 1e-4. The model trained on the APPA-REAL dataset completed training in 60 epochs, while the UTKFace dataset required 50 epochs. Both models used a batch size of 64 and were optimized using the Adam optimizer. Fine-tuning of the base model improved performance on both datasets; however, the specific layers unlocked for training differed. In the APPA-REAL dataset, fine-tuning commenced from layer 17, whereas for UTKFace, optimal results were achieved by fine-tuning from layer 7 onwards. To mitigate overfitting due to the relatively small dataset sizes, we applied data augmentation techniques including image rotation (with a range of 40 degrees), width and height shift (0.2), zoom (0.2), and horizontal flip. Additionally, a random state of 42 was set for both oversampling and data augmentation.
Now that we have fine-tuned our base model architectures and hyperparameters, we proceeded with the experiment. To thoroughly assess the influence of dataset composition on model performance—both overall and for specific demographic groups—we oversampled both datasets until the number of samples in the Black and Asian groups matched that of the dominant White group. This oversampled dataset serves as our baseline, alongside the original dataset composition results.
The purpose of oversampling the minority groups to match the dominant group was to facilitate controlled reduction experiments, where we systematically reduced each group’s sample size from 10% to 100%. This allowed us to measure performance differences for the reduced group and observe how other groups were affected. We compared these results against the original dataset composition, the equally oversampled dataset composition, and all variations in between.
This method enabled us to identify which variations in dataset composition minimized performance variance between groups.
3. Results
In our analysis, we used Mean Absolute Error (MAE) and Standard Deviation (SD) to evaluate the performance of our VGG19 model across different dataset compositions and ethnic groups. The formula for Mean Absolute Error (MAE) is given by:
Where is the actual age, is the predicted age, and n is the total number of samples.
To assess the variability in model performance between the ethnic groups (White, Black, and Asian), we calculated the standard deviation of the MAEs for these groups. The MAE for each group was computed separately and then used to determine the standard deviation.
The standard deviation (SD) of the MAEs is given by:
- represents the MAE for the j-th group (White, Black, or Asian).
- is the mean MAE across the three groups.
Calculating the SD of the MAEs helps in understanding the extent of performance variability among different groups, highlighting any potential biases or inconsistencies in the model’s predictions.
The APPA-REAL dataset, which is highly unbalanced with the Black and Asian groups together accounting for less than 10% of the available data, surprisingly shows relatively good results in terms of MAE variations across these groups, with a standard deviation of 0.19 on a model trained on the dataset’s original form. It might be assumed that oversampling to equalize group sizes would result in equal performance across these groups or at least reduce the MAE deviation. However, our findings suggest otherwise.
The model trained with 20% fewer samples from the White group exhibited the smallest standard deviation of 0.04, with the White and Black groups performing almost equally well, having MAEs of 7.1676 and 7.1663 respectively, and the Asian group slightly better at 7.0736. The original dataset composition resulted in only the 7th smallest standard deviation among groups, with the oversampled equal dataset ranking 8th.
This indicates that six other dataset compositions performed better in terms of reducing MAE variation across groups, with the 20% reduced White group dataset achieving a standard deviation reduction of 78.94% compared to the original dataset, and an 80.95% reduction compared to the equally oversampled dataset. The overall best MAE was achieved with the original dataset composition (6.45), whereas the most equal model had an overall MAE of 7.16, suggesting that achieving equal performance across groups comes at a small cost to overall performance.
The worst performing model was trained with the dataset composition where the White group was completely omitted, resulting in an overall MAE of 8.89 and a standard deviation of 0.94. In comparison, the most equal model had a 95.74% smaller variation. Table 3 presents these results, sorted by the least standard deviation.
Diving deeper into separate groups we can observe in Table 4 how the MAE of a group is responding to reductions in samples, we will first discuss the White group. The performance of the White group alone is like for the other groups the best with the original dataset composition with an MAE of 6.42, the second best performing is the equal dataset, where again all the samples are still present. As can be seen in Table 4, there is a definite worsening of performance the more samples we remove. The increase in MAE is not linear. A reaction to a 10% decrease in samples can vary from 0.20% increase in MAE for the group or 8.79%. It is clear however that decreasing the number of samples by 10% does not automatically equate to a 10% decrease in performance. Most of the time the worsening is far below 10% and never even reaching such an immediate decrease. The standard deviation increase as well follows closely our pattern of more and more samples being removed during training. With the performance of the White group when not being used for training at all equates to a 42.06% higher MAE during testing compared to the original dataset and 41.38% compared to the equally oversampled dataset. Clearly the presence of these samples does matter. What is also very interesting to see is that the Black group’s performance also worsens as more and more samples of the White group are removed. With the highest MAE increase for that group at 26.85% compared to the performance on the original dataset, when 80% of samples from the White group are removed. Interestingly, performance starts to get better again as 90% or a 100% of White group samples are removed. With the MAE increase for the Black group compared to original performance being 13.42% when 100% of White group samples are removed. The Black group is less reactive compared to its performance on the equally oversampled dataset, with variations in performance never reaching a 20% increase but usually being somewhere around 5%. When 100% of White samples are removed, the performance for the Black group compared to the Equal dataset is worse by only 5.05% The Asian group performance stays relatively the same regardless of the number of White group samples removed, with the increase in its MAE varying from -3.55% to 3.12% compared to the original dataset performance. The Asian group seems to be a bit more reactive compared with the performance on the Equal dataset, with MAE increases around 6%. Clearly the White and Black group are more correlated.
Examining the performance of the Black group, as shown in Table 5, reveals a noticeable degradation as a percentage of its samples are removed. Surprisingly, there isn’t a linear correlation between increased sample removal and worsening performance. For instance, removing 10% of samples results in a 12.80% increase in MAE, while removing 20% leads to a 22.09% increase compared to the original dataset performance. However, beyond this point, the MAE increase fluctuates between 5.09% and 20.49%, suggesting that performance stabilizes or even improves when more samples are removed, rather than just 10% or 20%. Notably, only when the Black group is entirely excluded from training do we observe the highest MAE increase, reaching 25.97% compared to the original dataset. This increase is significantly lower than that observed for the White group, indicating greater resilience to underrepresentation among Black group samples.
Interestingly, the Black group’s performance appears more resilient compared to the Equal dataset, with MAE increases averaging around 10% across different tests, peaking at a 16.97% increase when all samples are removed during testing. Regarding how other groups react to reductions in Black group samples, there isn’t a clear correlation. The White group’s MAE increase ranges from 4.97% to 10.27% and does not consistently show higher increases when more Black group samples are removed. The Asian group shows a slightly more reactive response to the removal of Black group samples compared to White group samples, albeit not significantly. Removing Black group samples actually improves Asian group performance, with MAE decreases ranging from -0.58% to -9.40% compared to the original dataset when 20% of Black group samples are removed.
Regarding the Asian group, as reflected in Table 6, it appears to be the least reactive to sample reductions. Interestingly, removing 70% of its samples results in a decrease of 9.40% in MAE compared to the original dataset performance, suggesting improved accuracy in some cases. Only when all samples are removed does the MAE increase by 9.98% compared to the original dataset, and by 14.76% compared to the equal model. In contrast, the White group shows little reaction to reductions in Asian group samples, with MAE increases ranging consistently between 5% and 10%, regardless of the number of Asian samples removed.
Conversely, the Black group exhibits more noticeable reactions, experiencing MAE increases ranging from 3.84% to 24.75% when 80% of Asian group samples are removed compared to the original dataset performance. Interestingly, the Black group’s performance remains more stable compared to the equal oversampled dataset, suggesting that oversampling generally helps stabilize performance.
The UTK Face dataset, while more balanced initially compared to the APPA REAL dataset with a higher representation of Black and Asian groups, surprisingly does not achieve equitable performance across groups as effectively as models trained on the APPA REAL dataset. Overall MAE is lower on the UTK dataset due to the larger number of samples available for training. The top-performing model remains the one trained on the original dataset, achieving an overall MAE of 4.89, followed closely by the equally oversampled dataset at an MAE of 4.98.
Notably, the standard deviation across groups in the original dataset is 0.74. Contrary to expectation, the equally oversampled dataset shows increased variation with a standard deviation of 0.85, ranking 18th in terms of variation compared to the original dataset’s 5th place. This underscores that mere equalization of dataset proportions is insufficient for achieving balanced performance across demographic groups.
The model demonstrating the least deviation across groups involves removing 90% of Asian group samples during training, resulting in a standard deviation of 0.30. Although this model exhibits a higher overall MAE of 5.48 compared to the original (a 12.06% increase) and the equally oversampled (a 10.04% increase) models, it significantly reduces performance variation across groups by 59.45% compared to the original and by 64.70% compared to the equally oversampled model. Clearly, the benefits of reduced group-wise variation outweigh the slight increase in overall MAE.
Interestingly, the top four models in terms of variation reduction all involve some reduction of Asian group samples during training, demonstrating that models perform better as more Asian samples are removed. This approach also proved effective on the APPA REAL dataset, ranking third in terms of group variation with a standard deviation of 0.11.
Conversely, models that removed all samples from the White group during training exhibited the highest variation (1.36), mirroring findings in the APPA REAL dataset. The lowest five ranks also shared similarities with APPA REAL, with complete removal of Black group samples resulting in the fourth worst variation on the UTK dataset, akin to its fifth place in APPA REAL.
Throughout our tests on the UTK dataset, a consistent trend emerged: the White group typically exhibited the highest MAE (~5), closely followed by the Black group (~5), slightly lower than the White group. Surprisingly, despite its initially lower sample count, the Asian group consistently performed the best with an MAE around 3. However, it was the performance degradation of this group that ultimately led to more equitable performance across all groups.
For a detailed overview of the experiment results on the UTK Face dataset sorted by standard deviation, refer to Table 7.
Turning our attention to the performance of each group individually, we begin with the White group. As depicted in Table 8, a noticeable trend emerges where a 10% decrease in sample size does not necessarily translate to a 10% decline in group performance. Instead, we observe performance changes typically ranging between 1% to 3%. The most significant increase in MAE, approximately 10.26%, occurs only when reducing White group samples from a 90% cut to complete omission.
Comparing these results with the equal and original datasets, similar to the APPA REAL dataset findings, the White group exhibits a more subdued reaction to sample reductions in the equal dataset compared to the original. The highest MAE increase, compared to the equal dataset, reaches 28.94%, and compared to the original dataset, it reaches 33%.
Interestingly, akin to observations from the APPA REAL dataset, the White group shows notable sensitivity to reductions in its sample size during training. Conversely, other groups exhibit less pronounced reactions to changes in the White group’s sample composition. The Black group’s performance worsens by approximately 1% to 4%, irrespective of the percentage of White samples removed. Similarly, the Asian group shows a consistent performance decline of around 6%, regardless of whether 20% or 90% of White group samples are removed. This pattern suggests, similar to findings in the APPA REAL dataset, that the Asian group remains relatively unaffected by such changes.
However, in contrast to the APPA-REAL dataset, we observe a weaker correlation in performance between the White and Black groups in this dataset analysis.
Examining the performance of the Black group, detailed in Table 9, reveals a clear trend where increasing sample removal correlates with higher MAE. The highest MAE increase occurs when all Black group samples are excluded during training, resulting in a 17.07% increase compared to the original performance. Interestingly, this increase is slightly lower at 14.31% when compared to the equal model performance, indicating that oversampling benefits the Black group by stabilizing its performance.
Similar to observations with the White group, a 10% reduction in sample size does not linearly equate to a 10% increase in MAE for the Black group. Instead, we observe a high single-digit increase, with a 14.31% increase when moving from a 90% reduction to complete removal of Black group samples.
In contrast, other groups show minimal reaction to changes in the Black group’s sample size. The White group’s MAE increases by approximately 1% to 6%, regardless of the percentage of Black group samples removed. Similarly, the Asian group exhibits varying MAE increases of 2% to 8%, showing a consistent pattern with the findings from the APPA REAL dataset tests for the Black group.
Turning to the Asian group, as detailed in Table 10, we observe a pattern similar to that seen in the results from the APPA-REAL dataset. Reductions in sample size generally result in minor fluctuations in MAE, typically ranging from a slight decrease to an increase of 1-4%. An exception occurs when reducing samples from 80% to 90%, where we see a significant jump in MAE by 25.07%. Surprisingly, the performance change between 90% of samples removed and 100% is actually a 4.12% improvement in performance, indicating a complex relationship between sample size and performance for the Asian group.
Comparing these outcomes with the original and equal dataset performances, the Asian group shows a response pattern akin to the White group. Removing 100% of Asian group samples results in a 34.35% increase in MAE compared to the equal dataset and a 30.82% increase compared to the original dataset. This reaction is notably more pronounced compared to findings from the APPA REAL dataset.
Regarding the reactions of other groups to reductions in Asian group sample size, we observe consistent increases in MAE ranging from 1% to 8%, regardless of the extent of Asian sample reductions. This contrasts somewhat with findings from the APPA REAL dataset, where the Black group exhibited more significant MAE increases not strictly correlated with reductions in Asian sample size. The most substantial reaction in the APPA REAL dataset saw a 24.75% increase in MAE for the Black group.
We were intrigued by the distinct performance of the Asian group within the UTK dataset compared to other groups, consistently showing a smaller MAE by approximately 2 points. To investigate this further, we conducted an analysis using our trained models, evaluating example images from all groups within both the UTK dataset and the APPA REAL dataset. Our findings, illustrated in Figure 3, reveal an interesting observation.
When examining examples from the UTK dataset, the model demonstrates a preference for certain facial features across different groups. For the White and Black groups, there is a notable focus on the eyes, nose, and mouth, with stronger activations within these regions. Additionally, some emphasis is placed on outlining the edges of the face. In contrast, activations for the Asian group predominantly concentrate on the edges of the face, particularly around the shape of the cheeks, in addition to the mouth, nose, and eyes. While the model analyzes similar facial features across all groups, the intensity and distribution of these activations vary.
This distinction in activation patterns may help explain why the Asian group shows different performance characteristics compared to the White and Black groups within the UTK dataset. In contrast, the performance of the White and Black groups appears more aligned across various tests.
Now, let’s explore why we don’t observe the same relationship in the APPA REAL results. This can be explained by examining the feature maps. As shown in Figure 4, the feature maps of the APPA REAL dataset reveal that the model exhibits a consistent pattern of activations across all ethnic groups. Significant activations are observed within the face, particularly highlighting the cheeks, smile, eyes, and nose, along with some background details. This uniform pattern of feature extraction across different ethnicities likely contributes to the relatively equal performance results observed across these groups in the APPA REAL dataset.
This difference in feature detection and model performance can be attributed to several factors. One possibility is that the more visible background in APPA REAL images leads the model to follow a different path in recognizing images, thereby treating them more uniformly.
By analyzing the feature maps, we gain valuable insights into how the model processes images from different datasets and why there might be variations in performance across different ethnic groups.
To provide a comprehensive evaluation of our model’s performance, we compare our results with those from other related works, focusing on overall MAE, race-specific accuracies, and standard deviation. While previous studies have reported different accuracies for various ethnicities, none have explicitly addressed the disparities in performance across different demographic groups. Table 11 below presents a summary of our findings alongside related work.
As observed, our model achieves a significantly lower overall MAE and standard deviation on both the UTKFace and APPA-REAL datasets compared to previous studies. This indicates a more balanced performance across different ethnic groups, emphasizing the effectiveness of our approach in addressing performance disparities.
4. Discussion
In this study, we investigated the impact of dataset composition on the performance of age estimation models, focusing on mitigating bias across different ethnic groups. We employed a transfer learning approach, utilizing pre-trained CNN models (VGG16, VGG19, ResNet50, and MobileNetV2) and fine-tuning them on the UTKFace and APPA-REAL datasets, chosen for their demographic diversity and inclusion of relevant labels, such as real age and ethnicity.
Our methodology involved systematically manipulating the dataset composition by oversampling minority groups to match the majority group and then gradually reducing the sample size of each group. This allowed us to analyze the relationship between dataset composition and model performance, both overall and for specific ethnic groups. We used Mean Absolute Error (MAE) and standard deviation as our primary evaluation metrics.
Our findings reveal that simply balancing the dataset by oversampling minority groups does not necessarily lead to equitable performance across ethnicities. This aligns with the observations of Puc et al. (2020), who found performance discrepancies across different racial groups in age estimation models but did not actively manipulate the datasets to mitigate these biases. In contrast, our research demonstrated that reducing the number of samples from the majority group (White) led to a more balanced performance across ethnic groups, as indicated by a lower standard deviation of MAE. This suggests that oversampling may not always be the most effective strategy for mitigating bias, and a more nuanced approach is needed.
The analysis of feature maps provided further insights into the model’s behavior. For the UTKFace dataset, we observed distinct activation patterns for the Asian group compared to the White and Black groups, which could explain the performance differences. This finding aligns with Abdolrashidi et al. (2020), who highlighted challenges in age prediction due to intra-class variations. In contrast, the APPA-REAL dataset showed consistent activation patterns across all ethnic groups, contributing to the more balanced performance observed in this dataset.
These results highlight the complexity of achieving equal performance among different demographic groups. It is clear that equal performance among groups or classes is a very complex problem without a simple solution. Oversampling the dataset to make distributions even should not be the only step taken; it is just an introduction to more granular processing that needs to be done. Although we have seen some patterns shared between the two datasets and how performance among groups varies in different scenarios, the reactions are not identical. One dataset composition that works for one dataset may not work for another due to various factors, such as lighting and contrast.
Our findings suggest that a balanced approach, such as undersampling the majority class or using a combination of oversampling and undersampling, may be more effective in mitigating bias than simply oversampling minority groups.
Future research should explore additional bias mitigation techniques beyond dataset rebalancing. Potential strategies include algorithmic adjustments and incorporating diverse facial features. Although existing studies have focused on classifying race based on images, similar approaches could potentially be adapted for age estimation to address bias. Additionally, expanding the range of datasets used in future studies would provide a more comprehensive understanding of model performance across diverse demographic groups, helping to validate and generalize the findings.
In conclusion, our study demonstrates the effectiveness of our proposed method in improving the fairness of age estimation models by reducing performance disparities across ethnic groups. This approach offers a promising avenue for developing more equitable and accurate age estimation models, ultimately enhancing the reliability and equity of facial recognition technology. As with cross-validation and other techniques used to fine-tune our models for the best overall performance, we must also treat our training datasets with the same level of granularity and test different compositions to achieve the most equal performance among groups.
Author Contributions
Conceptualization, Nenad Panić and Marina Marjanović; Data curation, Nenad Panić; Formal analysis, Nenad Panić; Investigation, Nenad Panić; Methodology, Nenad Panić and Marina Marjanović; Project administration, Marina Marjanović; Resources, Nenad Panić and Marina Marjanović; Software, Nenad Panić; Supervision, Marina Marjanović; Validation, Marina Marjanović and Timea Bezdan; Visualization, Nenad Panić; Writing – original draft, Nenad Panić; Writing – review & editing, Nenad Panić.
Funding
This research was supported by the Science Fund of the Republic of Serbia, Grant No. 7502, Intelligent Multi-Agent Control and Optimization applied to Green Buildings and Environmental Monitoring Drone Swarms - ECOSwarm.
Data Availability Statement
The data were derived from the following resources available in the public domain: https://susanqq.github.io/UTKFace/ & https://chalearnlap.cvc.uab.cat/dataset/26/description/ (Accessed on 19 Jun 2024).
Conflicts of Interest
The authors declare no conflicts of interest.
References
- Michalski, D; Yiu, S. Y.; Malec, C. The Impact of Age and Threshold Variation on Facial Recognition Algorithm Performance Using Images of Children. Proceedings of the International Conference on Biometrics (ICB), Gold Coast, QLD, Australia, 20-23 Feb. 2018; 217-224.
- Srinivas, N.; Ricanek, K.; Michalski, D.; Bolme, D. S.; King, M. Face recognition algorithm bias: Performance differences on images of children and adults. Proceedings of the EEE/CVF Conference on Computer Vision and Pattern Recognition (CVPR) Workshops, Long Beach, CA, USA, June 16-20, 2019.
- Albiero, V.; Bowyer, K. W. Is face recognition sexist? no, gendered hairstyles and biology are, arXiv preprint arXiv:2008.06989 2020.
- Albiero, V.; Zhang, K.; Bowyer, K. W. How does gender balance in training data affect face recognition accuracy. Proceedings of the IEEE International Joint Conference on Biometrics (IJCB), Houston, TX, USA, 2020; 1-10.
- Terhörst, P.; Kolf, J. N.; Huber, M.; Kirchbuchner, F.; Damer, N.; Moreno, A. M.; Fierrez, J.; Kuijper, A. A Comprehensive Study on Face Recognition Biases Beyond Demographics. IEEE Transactions on Technology and Society 2022, 3, 16–30. [Google Scholar] [CrossRef]
- Voigt, P.; Bussche, A.V.D. The EU General Data Protection Regulation (GDPR): A Practical Guide, 1st ed.; Springer: Cham, Switzerland, 2017; pp. 141–187. [Google Scholar]
- Albert, A. M.; Ricanek, K.; Patterson, E. A review of the literature on the aging adult skull and face: Implications for forensic science research and applications. Forensic Science International 2007, 172, 1–9. [Google Scholar] [CrossRef] [PubMed]
- Angulu, R.; Tapamo, J. R.; Adewumi, A. O. Age estimation via face images: a survey. J. Image Video Proc. 2018, 2018, 42. [Google Scholar] [CrossRef]
- Khaled, E.K.; Valliappan, R.; Patrick, T. Facial Age Estimation Using Machine Learning Techniques: An Overview. Big Data Cogn. Conput. 2022, 6, 128. [Google Scholar]
- Age Detection using Facial Images: traditional Machine Learning vs. Deep Learning, towardsdatascience.com. Available online: https://towardsdatascience.com/age-detection-using-facial-images-traditional-machine-learning-vs-deep-learning-2437b2feeab2 (Accessed on 18 Jun 2024).
- Andraz, P.; Vitomir, S.; Klemen, G. Analysis of Race and Gender Bias in Deep Age Estimation Models. Proceedings of the 8th European Signal Processing Conference (EUSIPCO), Amsterdam, Netherlands, 2021.
- Kimmo, K.; Jungseock, J. FairFace: Face Attribute Dataset for Balanced Race, Gender, and Age. arXiv preprint arXiv: 1908.04913 2019.
- Abdolrashidi, A.; Minaei, M.; Azimi, E. Age and Gender Prediction From Face Images Using Attentional Convolutional Network. arXiv preprint arXiv: 2010.03791 2020.
- Sathyavathi, S.; Baskaran, K. R. An Intelligent Human Age Prediction from Face Image Framework Based on Deep Learning Algorithms. Information Technology and Control 2023, 52, 245–257. [Google Scholar] [CrossRef]
- Amelia, J. S.; Wahyono. Age Estimation on Human Face Image Using Support Vector Regression and Text-Based Features. Intl. Journal of Adv. Comp. Science and Applications 2022, 13. [CrossRef]
- Clapes, A.; Bilici, O.; Temirova, D.; Avots, E.; Anbarjafari, G.; Escalera, S. From Apparent to Real Age: Gender, Age, Ethnic, Makeup, and Expression Bias Analysis in Real Age Estimation. Proceedings of the IEEE Conference on Computer Vision and Pattern Recognition (CVPR) Workshops, Salt Lake City, Utah, USA, June 18-22, 2018; 2373-2382.
- Xing, J.; Li, K.; Hu, W.; Yuan, C.; Ling, H. Diagnosing deep learning models for high accuracy age estimation from a single image. Pattern Recognition 2017, 66, 106–116. [Google Scholar] [CrossRef]
- Jacques, J. C. S.; Ozcinar, C.; Marjanovic, M.; Baró, X.; Anbarjafari, G.; Escalera, S. On the effect of age perception biases for real age regression. Proceedings of the 14th IEEE International Conference on Automatic Face & Gesture Recognition, Lille, France, 2019; 1-8.
- UTKFace, github.io. Available online: https://susanqq.github.io/UTKFace/ (Accessed on 19 Jun 2024).
- APPA-REAL, chalearnlap.cvc.uab.cat. Available online: https://chalearnlap.cvc.uab.cat/dataset/26/description/ (Accessed on 19 Jun 2024).
- Simonyan, K.; Zisserman, A. Very deep convolutional networks for large-scale image recognition. arXiv preprint arXiv:1409.1556 2014. [CrossRef]
- Kaiming, H.; Xiangyu, Z.; Shaoqing, R.; Jian, S. Deep Residual Learning for Image Recognition. arXiv preprint arXiv:1512.03385 2015. [CrossRef]
- Howard, A. G.; Zho, M.; Chen, B.; Kalenichenko, D.; Wang, W; Weyand, T.; Andreetto, M.; Hartwig, A. MobileNets: Efficient Convolutional Neural Networks for Mobile Vision Applications. arXiv preprint arXiv:1704.04861 2017. [CrossRef]
- ImageNet. Available online: https://www.image-net.org (Accessed on 19 Jun 2024).
Figure 1.
Example images from both datasets.
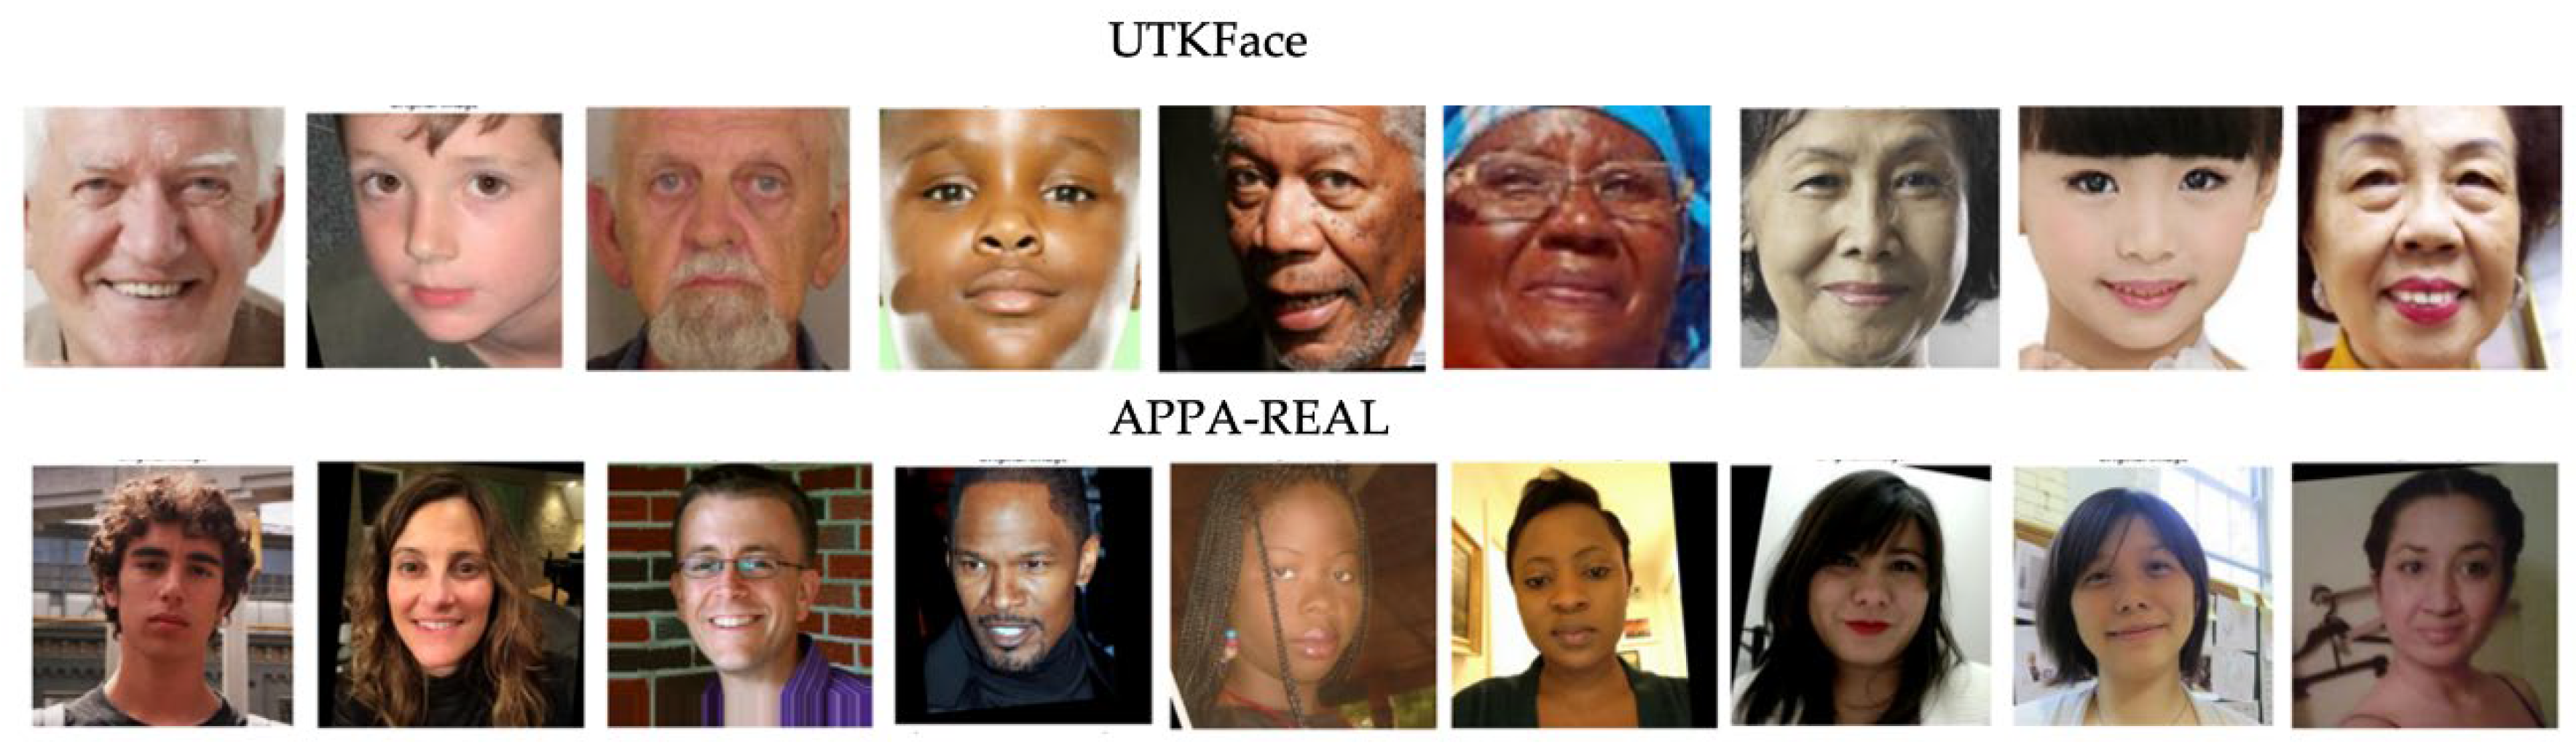
Figure 2.
Representation of the VGG-19 architecture used in this research.
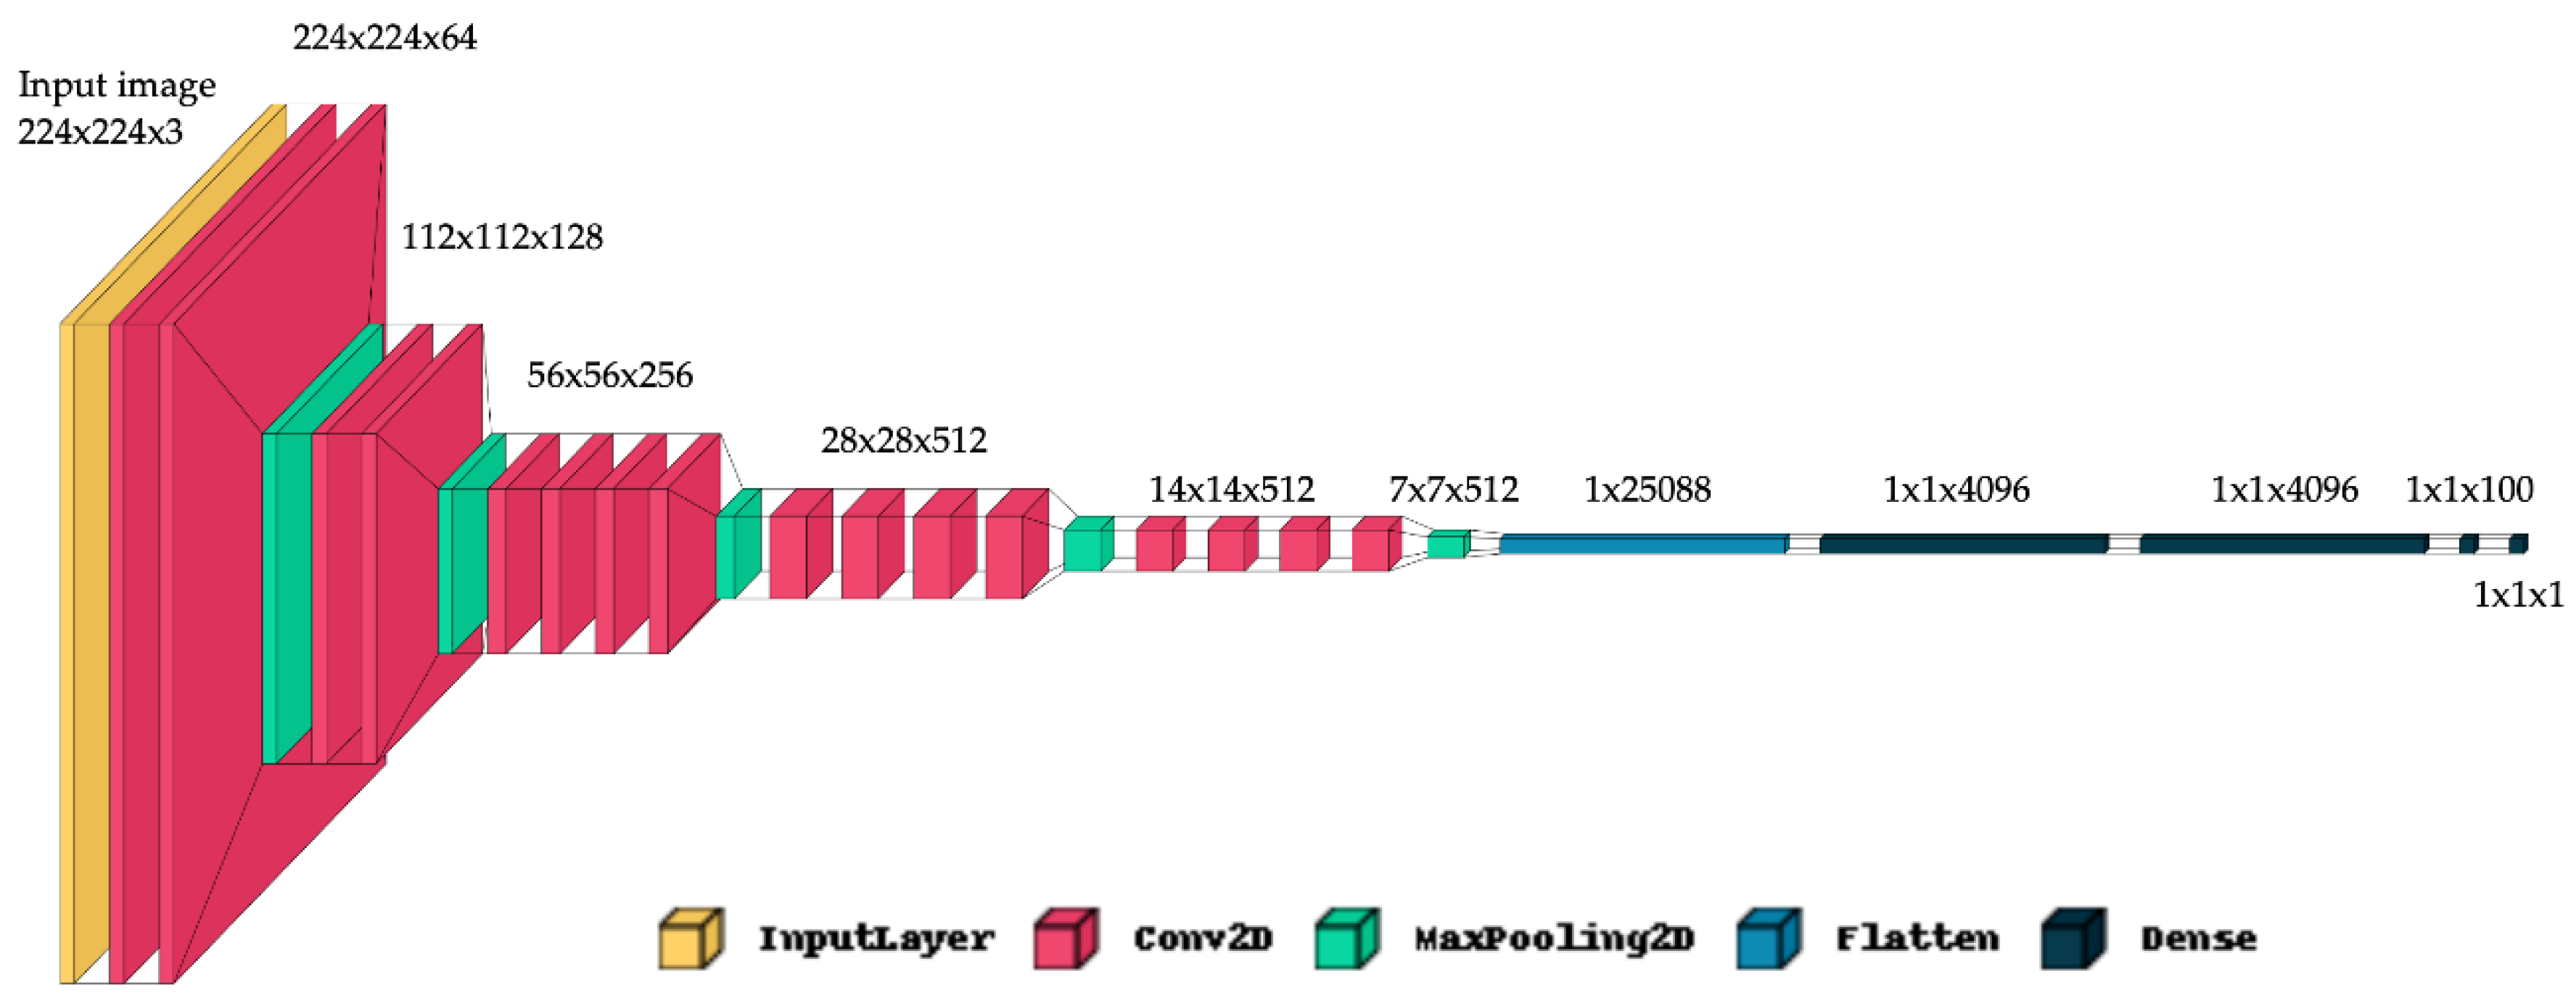
Figure 3.
Example images from the UTKFace dataset and their feature maps through layers.
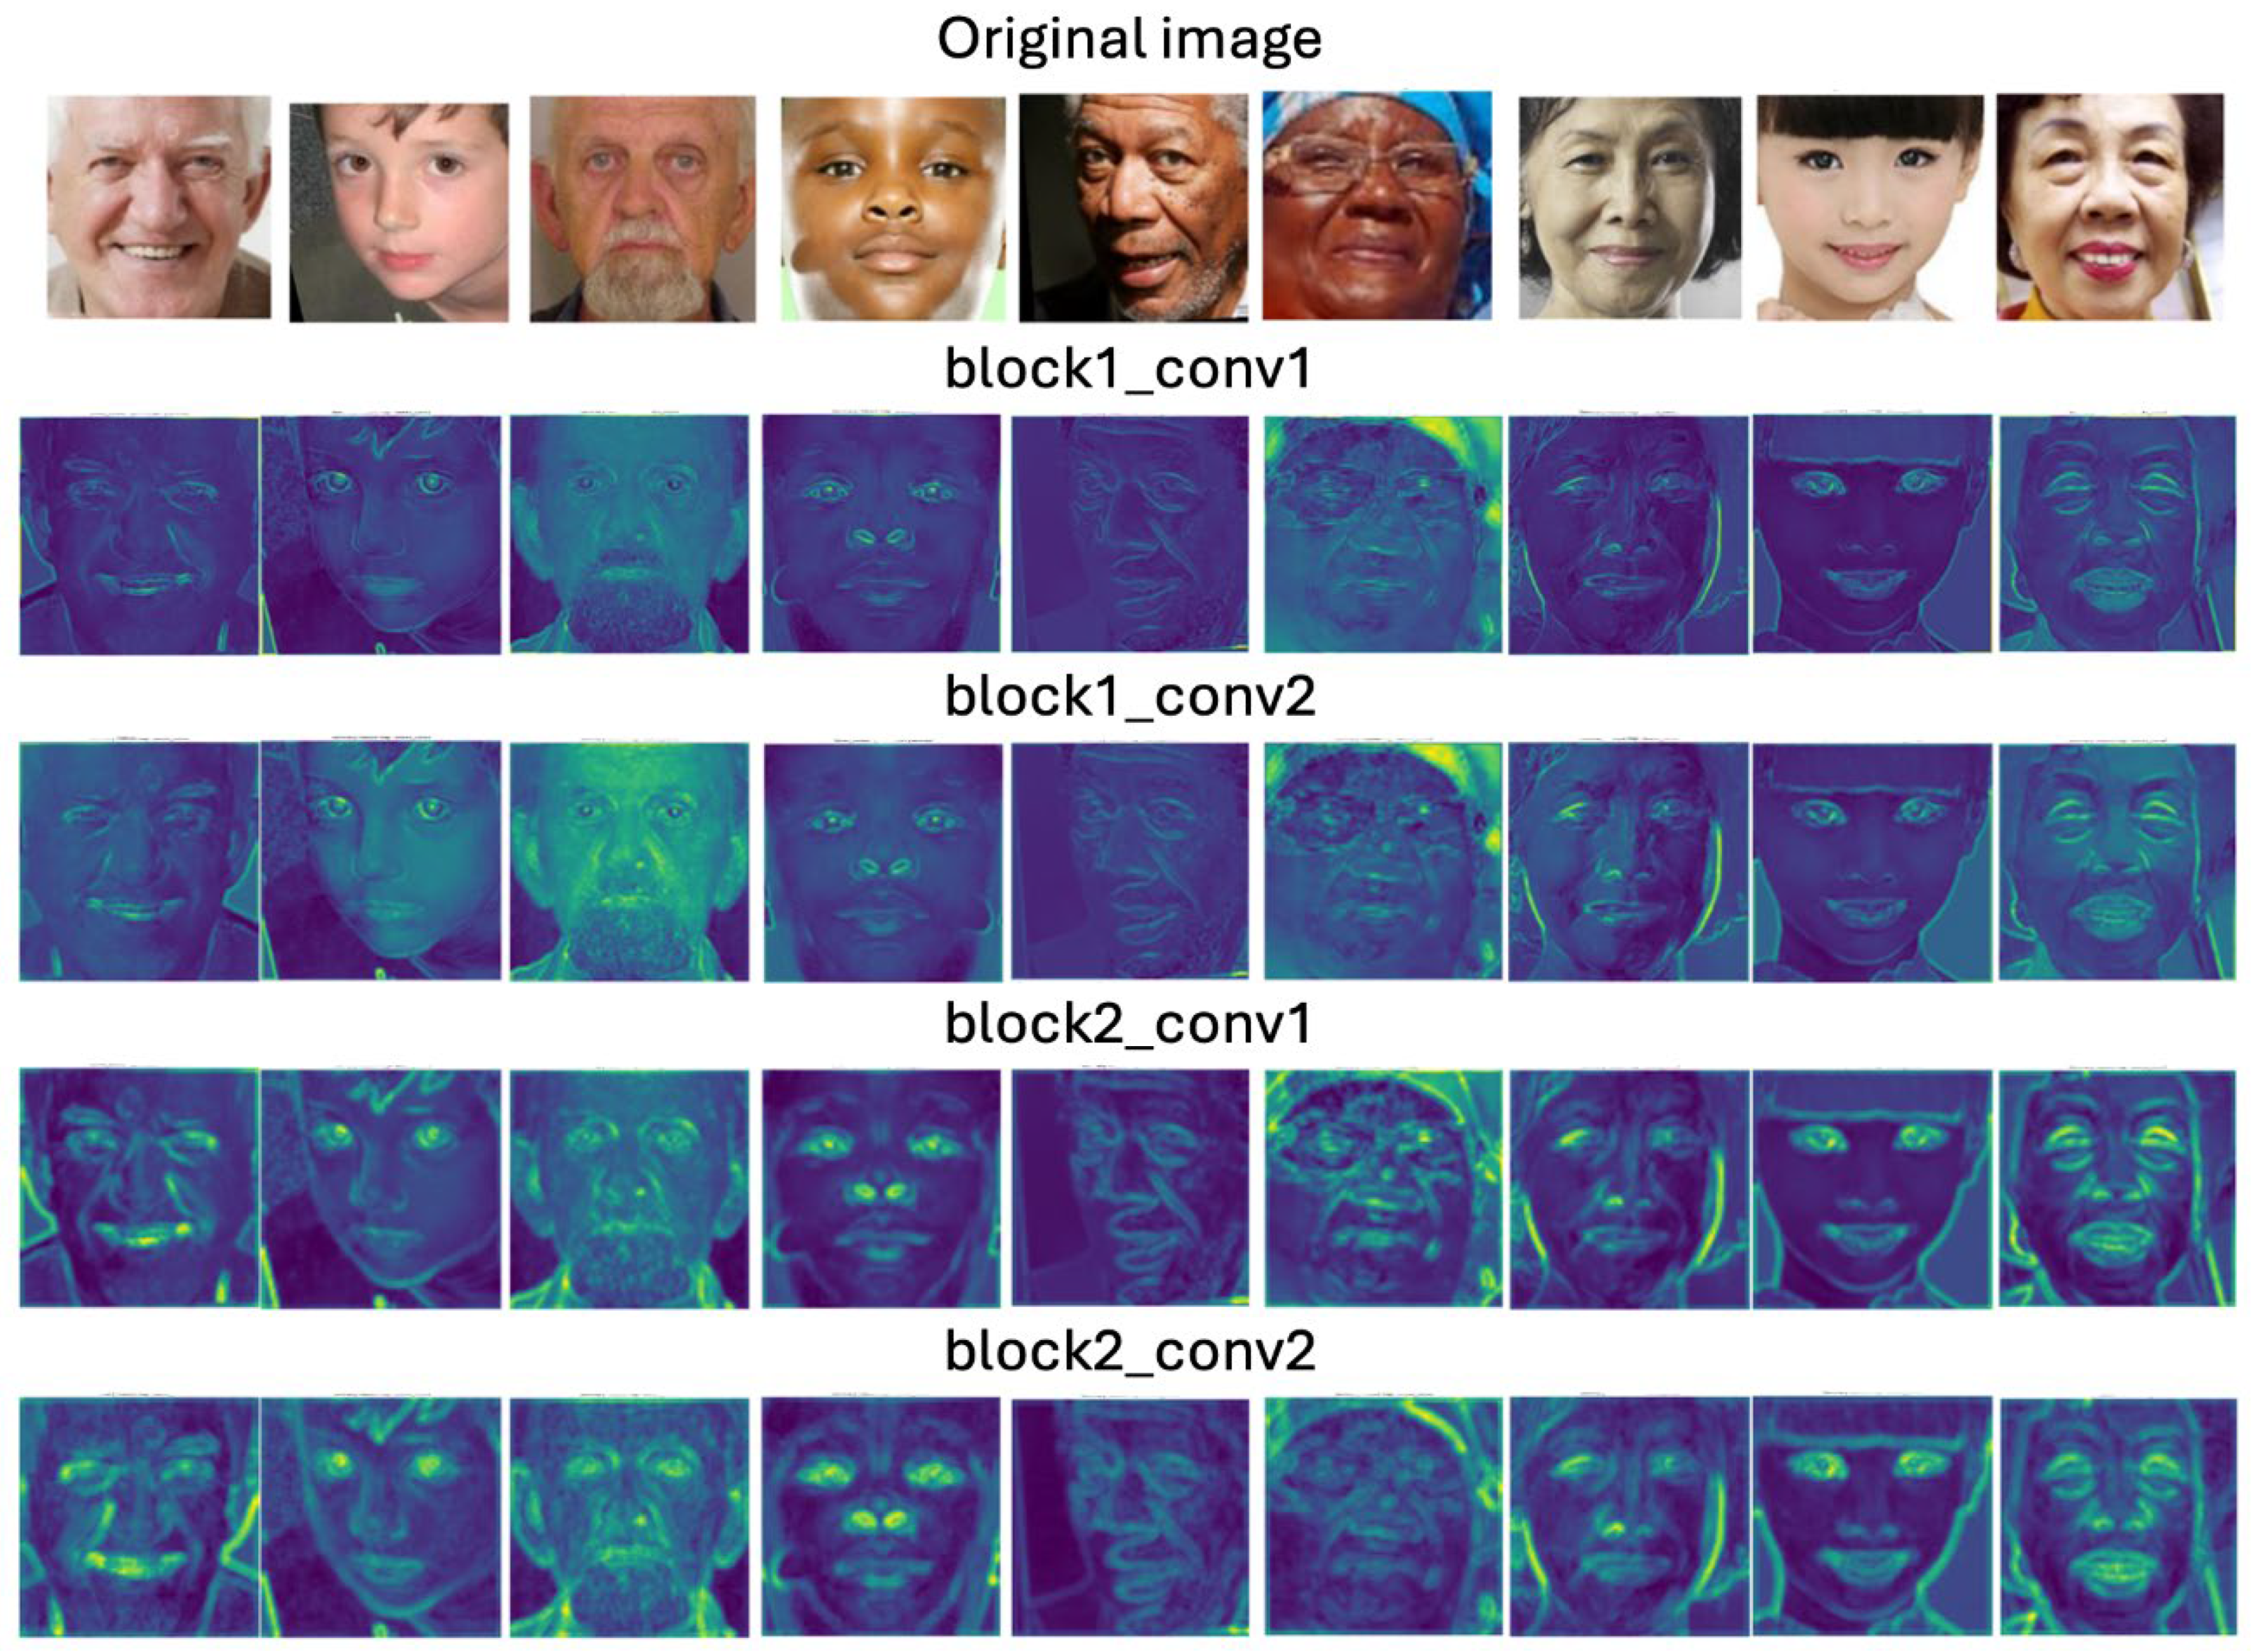
Figure 4.
Example images from the APPA-REAL dataset and their feature maps through layers.
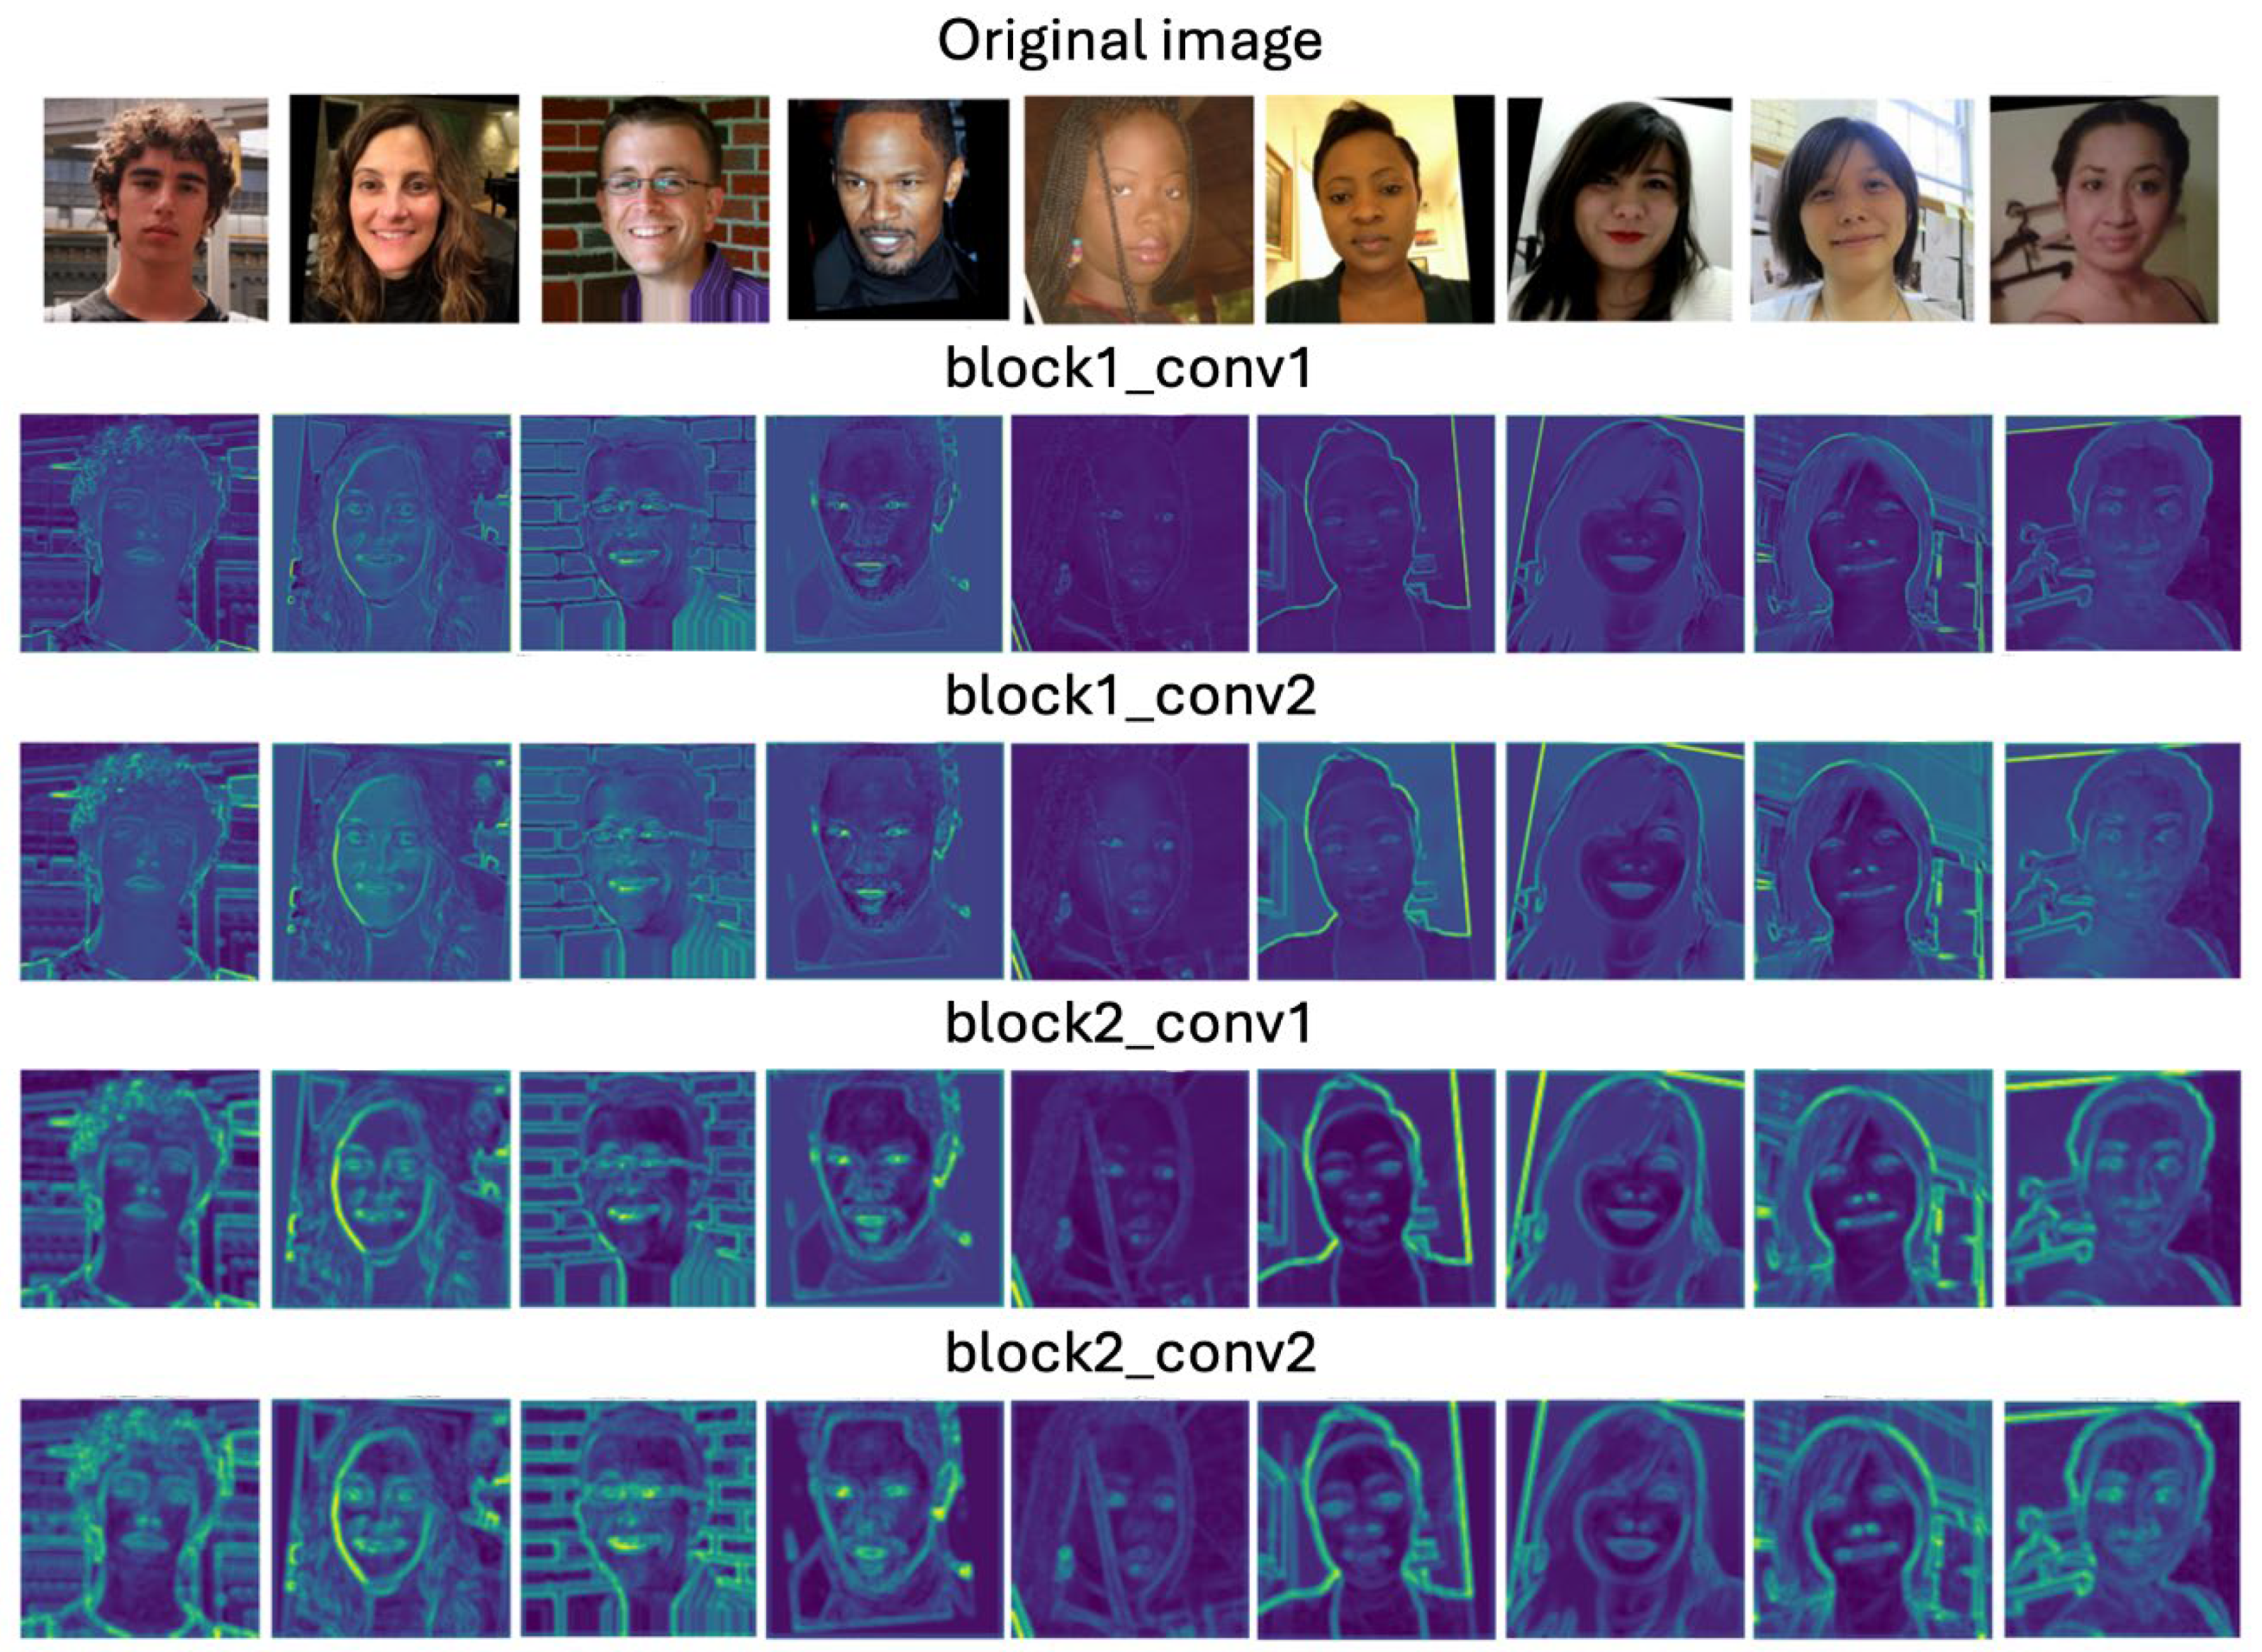

Table 1.
Comparison of previous work.
| Paper | Methodologies | Datasets | Conclusions |
|---|---|---|---|
| Analysis of Race and Gender Bias in Deep Age Estimation Models [11] | The authors employ two pre-trained age estimation models: WideResNet: Two variants trained on UTKFace (WideResNet-UTK) and IMDB-WIKI (WideResNet-IMDB) datasets. FaceNet: Based on the FaceNet architecture and fine-tuned on the IMDB-WIKI dataset. The evaluation involves partitioning the datasets into subgroups based on gender, race, and combined gender-race categories. The models’ performance is assessed using Mean Absolute Error (MAE) and Root Mean Squared Error (RMSE) metrics |
UTKFace APPA-REAL |
Gender Bias: The study finds that age estimation tends to be more accurate for male subjects than females across both datasets, particularly with the WideResNet models. The authors suggest that makeup usage among females might contribute to this discrepancy. Race Bias: While performance differences are observed across race groups, these variations are inconsistent between the two datasets. This suggests that other factors, such as image quality and pose, might have a more significant impact than race on age estimation accuracy. Gender-Race Subgroup Analysis: The analysis of combined gender-race subgroups reveal some exceptions to the general trends. For instance, male subjects perform worse than females in the Asian group on the UTKFace dataset. |
| FairFace: Face Attribute Dataset for Balanced Race, Gender, and Age [12] | The authors use a ResNet-34 architecture to train their models. They compare the performance of models trained on FairFace with models trained on other existing datasets, such as UTKFace, LFWA+, and CelebA. The evaluation involves cross-dataset classification and testing on novel datasets collected from Twitter, online media outlets, and a protest activity study. | The authors primarily use the YFCC-100M Flickr dataset, a large publicly available image dataset. They also incorporate images from other sources like Twitter and online newspapers. The dataset is carefully balanced across seven racial groups: White, Black, Indian, East Asian, Southeast Asian, Middle East, and Latino. It contains 108,501 facial images, each labeled with race, gender, and age group. | The results demonstrate that the model trained on FairFace consistently outperforms models trained on other datasets across various metrics, including accuracy and consistency across different racial groups. The FairFace model shows less than 1% accuracy discrepancy between male/female and White/non-White classifications for gender. In contrast, other models exhibit significant biases, particularly towards the male and White categories. |
| Age and Gender Prediction From Face Images Using Attentional Convolutional Network [13] | The proposed framework consists of two main components: Residual Attention Network (RAN): This network uses attention mechanisms to focus on important facial regions for age and gender prediction. It consists of attention modules that adaptively weight features as the network goes deeper. ResNet Model: This model is a residual convolutional network (ResNet) used for gender classification. The predicted gender is then concatenated with the features from the RAN for age prediction. The final prediction is obtained by ensembling the outputs of the RAN and ResNet models. |
UTKFace | The authors evaluate their model on the UTKFace dataset and compare its performance with individual models (RAN and ResNet) and previous work. The ensemble model outperforms both individual models in terms of gender and age prediction accuracy. It also achieves a higher gender classification accuracy than the previous work. |
| An Intelligent Human Age Prediction from Face Image Framework Based on Deep Learning Algorithms [14] | The proposed framework combines a Deep Convolutional Neural Network (DCNN) with a Cuckoo Search (CS) algorithm. Preprocessing: Images are converted to grayscale, histogram equalized, and denoised. Face Edge Detection: Gabor filters are used to extract facial edges. Feature Extraction: Principal Component Analysis (PCA) is employed to reduce dimensionality and extract relevant features. Age Estimation: A DCNN, specifically ResNet, is used for age prediction. The CS algorithm optimizes the model’s weights to improve accuracy. |
UTKFace FGNet CACD |
The authors evaluate their model using various metrics, including Mean Absolute Error (MAE), Root Mean Squared Error (RMSE), Pearson correlation coefficient, precision, recall, F1-score, and computation time. The proposed DCNN-CS model outperforms other methods like CNN, DNN, LSTM, and SVR in terms of accuracy and computational efficiency. |
| Age Estimation on Human Face Image Using Support Vector Regression and Texture-Based Features [15] | The proposed framework consists of the following steps: Preprocessing: Images are resized and converted to grayscale. Feature Extraction: Three texture-based feature extraction methods are used: Local Binary Pattern (LBP), Local Phase Quantization (LPQ), and Binarized Statistical Image Features (BSIF). The authors also experiment with combinations of these methods. Feature Reduction: Principal Component Analysis (PCA) is applied to reduce the dimensionality of the extracted features. Age Estimation: Support Vector Regression (SVR) is used to predict age based on the extracted features. |
Face-age UTKFace |
The authors evaluate their model using Mean Absolute Error (MAE). They experiment with different image sizes, feature extraction methods, and PCA dimensions. The best results are achieved using a combination of BSIF and LPQ features with a PCA dimension of 70, resulting in an MAE of 9.766 for the first age rounding strategy and 9.754 for the second strategy. |
| Age estimation via face images: a survey [8] |
This study investigates methods for facial age estimation, discussing validation challenges and approaches. Techniques include dataset splitting with rotational exclusion, density-preserving sampling, cross-validation, and bootstrap strategies. It explores k-fold cross-validation and leave-one-out (LOO) strategies. Moreover, it examines multi-manifold metric learning and hierarchical models for age estimation. |
FG-NET MORPH Gallagher’s web collected database YGA LHI HOIP Iranian face database |
The study emphasizes comprehensive approaches and stresses the importance of validation strategies to avoid overfitting and enhance generalization. The paper summarizes recent studies, evaluation protocols, datasets, age estimation approaches, and feature extraction methods, offering a comprehensive overview of age estimation research. |
| From apparent to real age: gender, age, ethnic, makeup, and expression bias analysis in real age estimation [16] | The study examines real age estimation in facial still images, focusing on the transition from apparent to real age. It enriches the APPA-REAL dataset with attributes like gender, ethnicity, makeup, and facial expression. Experiments with a basic Convolutional Neural Network (CNN) illustrate the influence of apparent labels on real age prediction. Bias correction on CNN predictions reveals consistent biases introduced by attributes, suggesting potential for enhanced age recognition performance. | APPA-REAL | The study suggests using apparent labels for training improves real age estimation compared to training with real ages alone. Bias correction on CNN predictions enhances age recognition performance. The analysis reviews state-of-the-art methods, emphasizing the importance of addressing biases. |
| Diagnosing deep learning models for high accuracy age estimation from a single image [17] | In this study, researchers explored age estimation from face images using deep learning. They examined training and evaluation procedures with deep learning models on two large datasets. They investigated three age estimation formulations, five loss functions, and three multi-task architectures. | Morph II WebFace |
The study significantly advances age estimation from face images using deep learning. Through systematic diagnosis, researchers pinpointed key factors affecting deep age estimation models, favoring a regression-based approach with Mean Absolute Error (MAE) loss. Their proposed deep multi-task learning architecture, addressing age, gender, and race simultaneously, outperformed other models. The final deep age estimation model surpassed previous solutions on Morph II and WebFace datasets. |
| On the effect of age perception biases for real age regression [18] | The paper proposes an end-to-end architecture for age estimation from still images using deep learning. It adapts the VGG16 model, pre-trained on ImageNet, to integrate face attributes like gender, race, happiness, and makeup levels during training. The architecture predicts both real and apparent age labels from facial images, considering human perception bias and attribute-based information. Training involves two stages: fine-tuning the last layers initially and then training the entire model end-to-end using the Adam optimization algorithm | APPA-REAL | The paper finds that incorporating face attributes into deep learning models notably enhances both real and apparent age estimation from facial images. Modifying the VGG16 model to include attributes like gender, race, happiness, and makeup levels during training yields superior performance over baseline models. Additionally, attribute-based analysis sheds light on how gender, race, happiness, and makeup influence age perception. |
Table 2.
Overview of the two datasets.
| Name | Total number of samples | Gender | Race | Age Range | |||||||
|---|---|---|---|---|---|---|---|---|---|---|---|
| Male | Female | White | Black | Asian | Indian | Others | |||||
| UTKFace | 23,705 | 12,391 | 11,314 | 10,078 | 4,526 | 3,434 | 3,975 | 1,692 | 1 - 116 | ||
| APPA-REAL | 7,591 | 3,818 | 3,773 | 6,686 | 231 | 674 | 1 - 100 | ||||
Table 3.
Comparison of all variations on the APPA-REAL dataset sorted by lowest standard deviation between groups performance.
Table 3.
Comparison of all variations on the APPA-REAL dataset sorted by lowest standard deviation between groups performance.
| Dataset variations | Overall MAE | White Group MAE | Black Group MAE | Asian Group MAE | Standard deviation |
|---|---|---|---|---|---|
| White 20% | 7,1603 | 7,1676 | 7,1663 | 7,0736 | 0,0440 |
| Black 60% | 6,7788 | 6,764 | 6,7813 | 6,9478 | 0,0828 |
| Asian 90% | 6,9338 | 6,956 | 6,9148 | 6,6874 | 0,1181 |
| Black 70% | 6,7632 | 6,7431 | 7,1447 | 6,8198 | 0,1740 |
| Black 30% | 6,7834 | 6,7537 | 7,2087 | 6,9303 | 0,1872 |
| White 10% | 6,8679 | 6,8687 | 7,1783 | 6,7177 | 0,1917 |
| Original | 6,4588 | 6,4241 | 6,4529 | 6,8593 | 0,1987 |
| Equal | 6,7129 | 6,4547 | 6,9672 | 6,5739 | 0,2189 |
| White 40% | 7,1286 | 7,153 | 7,3405 | 6,7528 | 0,2451 |
| Asian 50% | 6,6626 | 6,6547 | 7,1479 | 6,5305 | 0,2666 |
| White 70% | 7,3275 | 7,3464 | 7,625 | 6,9741 | 0,2666 |
| Asian 100% | 6,8969 | 6,8269 | 7,2377 | 7,5441 | 0,2938 |
| Black 10% | 6,7724 | 6,77 | 7,2787 | 6,5685 | 0,2988 |
| Asian 70% | 6,8689 | 6,9326 | 6,7004 | 6,2145 | 0,2991 |
| Black 40% | 7,1176 | 7,0839 | 7,7754 | 7,2036 | 0,3017 |
| Asian 10% | 6,6531 | 6,6385 | 7,2428 | 6,5518 | 0,3073 |
| Asian 40% | 6,7736 | 6,731 | 7,5072 | 6,927 | 0,3295 |
| White 30% | 7,1779 | 7,2144 | 7,49 | 6,6156 | 0,3650 |
| Black 90% | 6,8216 | 6,8529 | 7,2218 | 6,2795 | 0,3877 |
| Asian 30% | 6,8468 | 6,8523 | 7,4678 | 6,4999 | 0,3999 |
| Asian 60% | 7,1463 | 7,1156 | 8,0009 | 7,1076 | 0,4192 |
| Asian 20% | 6,7844 | 6,7327 | 7,733 | 6,9448 | 0,4303 |
| White 50% | 7,224 | 7,2357 | 7,9872 | 6,7413 | 0,5122 |
| White 60% | 7,6724 | 7,7254 | 8,1431 | 6,8498 | 0,5389 |
| Black 80% | 6,7672 | 6,762 | 7,7404 | 6,3828 | 0,5719 |
| Black 50% | 6,8294 | 6,845 | 7,7236 | 6,2425 | 0,6081 |
| White 90% | 8,2641 | 8,3888 | 8,039 | 6,9359 | 0,6191 |
| Black 100% | 6,8285 | 6,7755 | 8,1289 | 6,8429 | 0,6227 |
| White 80% | 7,6813 | 7,7504 | 8,1856 | 6,6583 | 0,6424 |
| Black 20% | 6,8741 | 6,8916 | 7,8781 | 6,2144 | 0,6831 |
| Asian 80% | 6,7975 | 6,7792 | 8,0498 | 6,4349 | 0,6944 |
| White 100% | 8,8956 | 9,1258 | 7,3192 | 6,9751 | 0,9432 |
Table 4.
Performance changes upon APPA-REAL White group reduction.
| Dataset variations | Overall MAE | White Group MAE | Black Group MAE | Asian Group MAE | Standard deviation | MAE Change compared to previous | Compared to equal | Compared to original | Black group compared to original | Black group compared to equal | Asian group compared to original | Asian group compared to equal |
|---|---|---|---|---|---|---|---|---|---|---|---|---|
| Original | 6,4588 | 6,4241 | 6,4529 | 6,8593 | 0,1987 | |||||||
| Equal | 6,7129 | 6,4547 | 6,9672 | 6,5739 | 0,2189 | 0,48% | 0,48% | 7,97% | -4,16% | |||
| 10% | 6,8679 | 6,8687 | 7,1783 | 6,7177 | 0,1917 | 6,41% | 6,41% | 6,92% | 11,24% | 3,03% | -2,06% | 2,19% |
| 20% | 7,1603 | 7,1676 | 7,1663 | 7,0736 | 0,0440 | 4,35% | 11,04% | 11,57% | 11,06% | 2,86% | 3,12% | 7,60% |
| 30% | 7,1779 | 7,2144 | 7,49 | 6,6156 | 0,3650 | 0,65% | 11,77% | 12,30% | 16,07% | 7,50% | -3,55% | 0,63% |
| 40% | 7,1286 | 7,153 | 7,3405 | 6,7528 | 0,2451 | -0,85% | 10,82% | 11,35% | 13,76% | 5,36% | -1,55% | 2,72% |
| 50% | 7,224 | 7,2357 | 7,9872 | 6,7413 | 0,5122 | 1,16% | 12,10% | 12,63% | 23,78% | 14,64% | -1,72% | 2,55% |
| 60% | 7,6724 | 7,7254 | 8,1431 | 6,8498 | 0,5389 | 6,77% | 19,69% | 20,26% | 26,19% | 16,88% | -0,14% | 4,20% |
| 70% | 7,3275 | 7,3464 | 7,625 | 6,9741 | 0,2666 | -4,91% | 13,81% | 14,36% | 18,16% | 9,44% | 1,67% | 6,09% |
| 80% | 7,6813 | 7,7504 | 8,1856 | 6,6583 | 0,6424 | 5,50% | 20,07% | 20,65% | 26,85% | 17,49% | -2,93% | 1,28% |
| 90% | 8,2641 | 8,3888 | 8,039 | 6,9359 | 0,6191 | 8,24% | 29,96% | 30,58% | 24,58% | 15,38% | 1,12% | 5,51% |
| 100% | 8,8956 | 9,1258 | 7,3192 | 6,9751 | 0,9432 | 8,79% | 41,38% | 42,06% | 13,42% | 5,05% | 1,69% | 6,10% |
Table 5.
Performance changes upon APPA-REAL Black group reduction.
| Dataset variations | Overall MAE | White Group MAE | Black Group MAE | Asian Group MAE | Standard deviation | MAE Change compared to previous | Compared to equal | Compared to original | White group compared to original | White group compared to equal | Asian group compared to original | Asian group compared to equal |
|---|---|---|---|---|---|---|---|---|---|---|---|---|
| Original | 6,4588 | 6,4241 | 6,4529 | 6,8593 | 0,1987 | |||||||
| Equal | 6,7129 | 6,4547 | 6,9672 | 6,5739 | 0,2189 | 7,97% | 7,97% | 0,48% | -4,16% | |||
| 10% | 6,7724 | 6,77 | 7,2787 | 6,5685 | 0,2988 | 4,47% | 4,47% | 12,80% | 5,38% | 4,88% | -4,24% | -0,08% |
| 20% | 6,8741 | 6,8916 | 7,8781 | 6,2144 | 0,6831 | 8,23% | 13,07% | 22,09% | 7,28% | 6,77% | -9,40% | -5,47% |
| 30% | 6,7834 | 6,7537 | 7,2087 | 6,9303 | 0,1872 | -8,50% | 3,47% | 11,71% | 5,13% | 4,63% | 1,04% | 5,42% |
| 40% | 7,1176 | 7,0839 | 7,7754 | 7,2036 | 0,3017 | 7,86% | 11,60% | 20,49% | 10,27% | 9,75% | 5,02% | 9,58% |
| 50% | 6,8294 | 6,845 | 7,7236 | 6,2425 | 0,6081 | -0,67% | 10,86% | 19,69% | 6,55% | 6,05% | -8,99% | -5,04% |
| 60% | 6,7788 | 6,764 | 6,7813 | 6,9478 | 0,0828 | -12,20% | -2,67% | 5,09% | 5,29% | 4,79% | 1,29% | 5,69% |
| 70% | 6,7632 | 6,7431 | 7,1447 | 6,8198 | 0,1740 | 5,36% | 2,55% | 10,72% | 4,97% | 4,47% | -0,58% | 3,74% |
| 80% | 6,7672 | 6,762 | 7,7404 | 6,3828 | 0,5719 | 8,34% | 11,10% | 19,95% | 5,26% | 4,76% | -6,95% | -2,91% |
| 90% | 6,8216 | 6,8529 | 7,2218 | 6,2795 | 0,3877 | -6,70% | 3,65% | 11,92% | 6,67% | 6,17% | -8,45% | -4,48% |
| 100% | 6,8285 | 6,7755 | 8,1289 | 6,8429 | 0,6227 | 12,56% | 16,67% | 25,97% | 5,47% | 4,97% | -0,24% | 4,09% |
Table 6.
Performance changes upon APPA-REAL Asian group reduction.
| Dataset variations | Overall MAE | White Group MAE | Black Group MAE | Asian Group MAE | Standard deviation | MAE Change compared to previous | Compared to equal | Compared to original | White group compared to original | White group compared to equal | Black group compared to original | Black group compared to equal |
|---|---|---|---|---|---|---|---|---|---|---|---|---|
| Original | 6,4588 | 6,4241 | 6,4529 | 6,8593 | 0,1987 | |||||||
| Equal | 6,7129 | 6,4547 | 6,9672 | 6,5739 | 0,2189 | -4,16% | -4,16% | 0,48% | 7,97% | |||
| 10% | 6,6531 | 6,6385 | 7,2428 | 6,5518 | 0,3073 | -0,34% | -0,34% | -4,48% | 3,34% | 2,85% | 12,24% | 3,96% |
| 20% | 6,7844 | 6,7327 | 7,733 | 6,9448 | 0,4303 | 6,00% | 5,64% | 1,25% | 4,80% | 4,31% | 19,84% | 10,99% |
| 30% | 6,8468 | 6,8523 | 7,4678 | 6,4999 | 0,3999 | -6,41% | -1,13% | -5,24% | 6,67% | 6,16% | 15,73% | 7,19% |
| 40% | 6,7736 | 6,731 | 7,5072 | 6,927 | 0,3295 | 6,57% | 5,37% | 0,99% | 4,78% | 4,28% | 16,34% | 7,75% |
| 50% | 6,6626 | 6,6547 | 7,1479 | 6,5305 | 0,2666 | -5,72% | -0,66% | -4,79% | 3,59% | 3,10% | 10,77% | 2,59% |
| 60% | 7,1463 | 7,1156 | 8,0009 | 7,1076 | 0,4192 | 8,84% | 8,12% | 3,62% | 10,76% | 10,24% | 23,99% | 14,84% |
| 70% | 6,8689 | 6,9326 | 6,7004 | 6,2145 | 0,2991 | -12,57% | -5,47% | -9,40% | 7,92% | 7,40% | 3,84% | -3,83% |
| 80% | 6,7975 | 6,7792 | 8,0498 | 6,4349 | 0,6944 | 3,55% | -2,11% | -6,19% | 5,53% | 5,03% | 24,75% | 15,54% |
| 90% | 6,9338 | 6,956 | 6,9148 | 6,6874 | 0,1181 | 3,92% | 1,73% | -2,51% | 8,28% | 7,77% | 7,16% | -0,75% |
| 100% | 6,8969 | 6,8269 | 7,2377 | 7,5441 | 0,2938 | 12,81% | 14,76% | 9,98% | 6,27% | 5,77% | 12,16% | 3,88% |
Table 7.
Comparison of all variations on the UTKFace dataset sorted by lowest standard deviation between groups performance.
Table 7.
Comparison of all variations on the UTKFace dataset sorted by lowest standard deviation between groups performance.
| Dataset variations | Overall MAE | White Group MAE | Black Group MAE | Asian Group MAE | Standard deviation |
|---|---|---|---|---|---|
| Asian 90% | 5,4808 | 5,7351 | 5,4583 | 5,0036 | 0,3015 |
| Asian 100% | 5,3499 | 5,6983 | 5,2564 | 4,7976 | 0,3677 |
| Asian 80% | 5,1197 | 5,5972 | 5,2153 | 4,0006 | 0,6807 |
| Asian 70% | 5,178 | 5,5635 | 5,2437 | 3,908 | 0,7170 |
| Original | 4,8925 | 5,3772 | 5,0445 | 3,6674 | 0,7401 |
| Asian 60% | 5,1361 | 5,7023 | 5,2071 | 3,877 | 0,7707 |
| Black 10% | 4,9504 | 5,4966 | 5,072 | 3,6505 | 0,7894 |
| White 10% | 5,028 | 5,5884 | 5,1332 | 3,7261 | 0,7926 |
| Asian 40% | 5,0608 | 5,6095 | 5,1833 | 3,7543 | 0,7934 |
| White 20% | 5,0549 | 5,6 | 5,1896 | 3,7361 | 0,7996 |
| Asian 50% | 5,2064 | 5,8149 | 5,2504 | 3,9063 | 0,8005 |
| Black 50% | 5,1155 | 5,5867 | 5,3529 | 3,7797 | 0,8024 |
| Asian 20% | 4,9849 | 5,5227 | 5,1505 | 3,6308 | 0,8183 |
| Black 30% | 5,2779 | 5,821 | 5,4611 | 3,8847 | 0,8408 |
| Asian 30% | 5,088 | 5,6537 | 5,2456 | 3,6904 | 0,8458 |
| Black 60% | 5,1542 | 5,6783 | 5,3728 | 3,7417 | 0,8501 |
| White 40% | 5,1123 | 5,7115 | 5,2279 | 3,7152 | 0,8503 |
| Equal | 4,9879 | 5,5465 | 5,1663 | 3,5711 | 0,8557 |
| White 50% | 5,152 | 5,7823 | 5,2317 | 3,7499 | 0,8582 |
| Asian 10% | 5,0262 | 5,6409 | 5,1295 | 3,6179 | 0,8588 |
| White 30% | 5,0891 | 5,6989 | 5,2045 | 3,6709 | 0,8634 |
| Black 70% | 5,1646 | 5,5988 | 5,5342 | 3,6896 | 0,8851 |
| Black 20% | 5,0512 | 5,6157 | 5,2732 | 3,5516 | 0,9031 |
| Black 90% | 5,2389 | 5,6447 | 5,6612 | 3,7357 | 0,9038 |
| Black 80% | 5,3513 | 5,8564 | 5,6689 | 3,8171 | 0,9203 |
| White 60% | 5,1887 | 5,8597 | 5,2998 | 3,6538 | 0,9362 |
| White 70% | 5,3421 | 6,0802 | 5,3782 | 3,7933 | 0,9565 |
| Black 40% | 5,3027 | 5,92 | 5,535 | 3,6802 | 0,9778 |
| Black 100% | 5,3681 | 5,7606 | 5,9055 | 3,7052 | 1,0048 |
| White 80% | 5,3377 | 6,1819 | 5,2886 | 3,7123 | 1,0209 |
| White 90% | 5,5117 | 6,4859 | 5,3614 | 3,7876 | 1,1066 |
| White 100% | 5,8152 | 7,1516 | 5,3912 | 3,803 | 1,3676 |
Table 8.
Performance changes upon UTKFace White group reduction.
| Dataset variations | Overall MAE | White Group MAE | Black Group MAE | Asian Group MAE | Standard deviation | MAE Change compared to previous | Compared to equal | Compared to original | Black group compared to original | Black group compared to equal | Asian group compared to original | Asian group compared to equal |
|---|---|---|---|---|---|---|---|---|---|---|---|---|
| Original | 4,8925 | 5,3772 | 5,0445 | 3,6674 | 0,7401 | |||||||
| Equal | 4,9879 | 5,5465 | 5,1663 | 3,5711 | 0,8557 | 3,15% | 3,15% | 2,41% | -2,63% | |||
| 10% | 5,028 | 5,5884 | 5,1332 | 3,7261 | 0,7926 | 0,76% | 0,76% | 3,93% | 1,76% | -0,64% | 1,60% | 4,34% |
| 20% | 5,0549 | 5,6 | 5,1896 | 3,7361 | 0,7996 | 0,21% | 0,96% | 4,14% | 2,88% | 0,45% | 1,87% | 4,62% |
| 30% | 5,0891 | 5,6989 | 5,2045 | 3,6709 | 0,8634 | 1,77% | 2,75% | 5,98% | 3,17% | 0,74% | 0,10% | 2,79% |
| 40% | 5,1123 | 5,7115 | 5,2279 | 3,7152 | 0,8503 | 0,22% | 2,97% | 6,22% | 3,64% | 1,19% | 1,30% | 4,04% |
| 50% | 5,152 | 5,7823 | 5,2317 | 3,7499 | 0,8582 | 1,24% | 4,25% | 7,53% | 3,71% | 1,27% | 2,25% | 5,01% |
| 60% | 5,1887 | 5,8597 | 5,2998 | 3,6538 | 0,9362 | 1,34% | 5,65% | 8,97% | 5,06% | 2,58% | -0,37% | 2,32% |
| 70% | 5,3421 | 6,0802 | 5,3782 | 3,7933 | 0,9565 | 3,76% | 9,62% | 13,07% | 6,62% | 4,10% | 3,43% | 6,22% |
| 80% | 5,3377 | 6,1819 | 5,2886 | 3,7123 | 1,0209 | 1,67% | 11,46% | 14,97% | 4,84% | 2,37% | 1,22% | 3,95% |
| 90% | 5,5117 | 6,4859 | 5,3614 | 3,7876 | 1,1066 | 4,92% | 16,94% | 20,62% | 6,28% | 3,78% | 3,28% | 6,06% |
| 100% | 5,8152 | 7,1516 | 5,3912 | 3,803 | 1,3676 | 10,26% | 28,94% | 33,00% | 6,87% | 4,35% | 3,70% | 6,49% |
Table 9.
Performance changes upon UTKFace Black group reduction.
| Dataset variations | Overall MAE | White Group MAE | Black Group MAE | Asian Group MAE | Standard deviation | MAE Change compared to previous | Compared to equal | Compared to original | White group compared to original | White group compared to equal | Asian group compared to original | Asian group compared to equal |
|---|---|---|---|---|---|---|---|---|---|---|---|---|
| Original | 4,8925 | 5,3772 | 5,0445 | 3,6674 | 0,7401 | |||||||
| Equal | 4,9879 | 5,5465 | 5,1663 | 3,5711 | 0,8557 | 2,41% | 2,41% | 3,15% | -2,63% | |||
| 10% | 4,9504 | 5,4966 | 5,072 | 3,6505 | 0,7894 | -1,83% | -1,83% | 0,55% | 2,22% | -0,90% | -0,46% | 2,22% |
| 20% | 5,0512 | 5,6157 | 5,2732 | 3,5516 | 0,9031 | 3,97% | 2,07% | 4,53% | 4,44% | 1,25% | -3,16% | -0,55% |
| 30% | 5,2779 | 5,821 | 5,4611 | 3,8847 | 0,8408 | 3,56% | 5,71% | 8,26% | 8,25% | 4,95% | 5,93% | 8,78% |
| 40% | 5,3027 | 5,92 | 5,535 | 3,6802 | 0,9778 | 1,35% | 7,14% | 9,72% | 10,09% | 6,73% | 0,35% | 3,06% |
| 50% | 5,1155 | 5,5867 | 5,3529 | 3,7797 | 0,8024 | -3,29% | 3,61% | 6,11% | 3,90% | 0,72% | 3,06% | 5,84% |
| 60% | 5,1542 | 5,6783 | 5,3728 | 3,7417 | 0,8501 | 0,37% | 4,00% | 6,51% | 5,60% | 2,38% | 2,03% | 4,78% |
| 70% | 5,1646 | 5,5988 | 5,5342 | 3,6896 | 0,8851 | 3,00% | 7,12% | 9,71% | 4,12% | 0,94% | 0,61% | 3,32% |
| 80% | 5,3513 | 5,8564 | 5,6689 | 3,8171 | 0,9203 | 2,43% | 9,73% | 12,38% | 8,91% | 5,59% | 4,08% | 6,89% |
| 90% | 5,2389 | 5,6447 | 5,6612 | 3,7357 | 0,9038 | -0,14% | 9,58% | 12,23% | 4,97% | 1,77% | 1,86% | 4,61% |
| 100% | 5,3681 | 5,7606 | 5,9055 | 3,7052 | 1,0048 | 4,32% | 14,31% | 17,07% | 7,13% | 3,86% | 1,03% | 3,76% |
Table 10.
Performance changes upon UTKFace Asian group reduction.
| Dataset variations | Overall MAE | White Group MAE | Black Group MAE | Asian Group MAE | Standard deviation | MAE Change compared to previous | Compared to equal | Compared to original | White group compared to original | White group compared to equal | Black group compared to original | Black group compared to equal |
|---|---|---|---|---|---|---|---|---|---|---|---|---|
| Original | 4,8925 | 5,3772 | 5,0445 | 3,6674 | 0,7401 | |||||||
| Equal | 4,9879 | 5,5465 | 5,1663 | 3,5711 | 0,8557 | -2,63% | -2,63% | 3,15% | 2,41% | |||
| 10% | 5,0262 | 5,6409 | 5,1295 | 3,6179 | 0,8588 | 1,31% | 1,31% | -1,35% | 4,90% | 1,70% | 1,69% | -0,71% |
| 20% | 4,9849 | 5,5227 | 5,1505 | 3,6308 | 0,8183 | 0,36% | 1,67% | -1,00% | 2,71% | -0,43% | 2,10% | -0,31% |
| 30% | 5,088 | 5,6537 | 5,2456 | 3,6904 | 0,8458 | 1,64% | 3,34% | 0,63% | 5,14% | 1,93% | 3,99% | 1,53% |
| 40% | 5,0608 | 5,6095 | 5,1833 | 3,7543 | 0,7934 | 1,73% | 5,13% | 2,37% | 4,32% | 1,14% | 2,75% | 0,33% |
| 50% | 5,2064 | 5,8149 | 5,2504 | 3,9063 | 0,8005 | 4,05% | 9,39% | 6,51% | 8,14% | 4,84% | 4,08% | 1,63% |
| 60% | 5,1361 | 5,7023 | 5,2071 | 3,877 | 0,7707 | -0,75% | 8,57% | 5,72% | 6,05% | 2,81% | 3,22% | 0,79% |
| 70% | 5,178 | 5,5635 | 5,2437 | 3,908 | 0,7170 | 0,80% | 9,43% | 6,56% | 3,46% | 0,31% | 3,95% | 1,50% |
| 80% | 5,1197 | 5,5972 | 5,2153 | 4,0006 | 0,6807 | 2,37% | 12,03% | 9,09% | 4,09% | 0,91% | 3,39% | 0,95% |
| 90% | 5,4808 | 5,7351 | 5,4583 | 5,0036 | 0,3015 | 25,07% | 40,11% | 36,43% | 6,66% | 3,40% | 8,20% | 5,65% |
| 100% | 5,3499 | 5,6983 | 5,2564 | 4,7976 | 0,3677 | -4,12% | 34,35% | 30,82% | 5,97% | 2,74% | 4,20% | 1,74% |
Table 11.
Comparison of our results with related work.
| Paper | Dataset | Overall MAE | Race | Standard deviation | ||
|---|---|---|---|---|---|---|
| White | Black | Asian | ||||
| [11] [11] |
UTKFace | 9,79 | 7,71 | 9,56 | 0,931 | |
| APPA-REAL | 7,79 | 8,23 | 7,85 | 0,1948 | ||
| [18] | APPA-REAL | 7,356 | 7,40 | 7,73 | 6,59 | 0,4789 |
| [16] | APPA-REAL | 13,5774 | 13,6386 | 14,1607 | 12,4729 | 0,7055 |
| Our results | UTKFace | 5,4808 | 5,7351 | 5,4583 | 5,0036 | 0,3015 |
| Our results | APPA-REAL | 7,1603 | 7,1676 | 7,1663 | 7,0735 | 0,044 |
Disclaimer/Publisher’s Note: The statements, opinions and data contained in all publications are solely those of the individual author(s) and contributor(s) and not of MDPI and/or the editor(s). MDPI and/or the editor(s) disclaim responsibility for any injury to people or property resulting from any ideas, methods, instructions or products referred to in the content. |
© 2024 by the authors. Licensee MDPI, Basel, Switzerland. This article is an open access article distributed under the terms and conditions of the Creative Commons Attribution (CC BY) license (http://creativecommons.org/licenses/by/4.0/).
Copyright: This open access article is published under a Creative Commons CC BY 4.0 license, which permit the free download, distribution, and reuse, provided that the author and preprint are cited in any reuse.


