Submitted:
24 March 2024
Posted:
25 March 2024
You are already at the latest version
Abstract
Different bacterial species have dramatically different generation times, from 20-30 minutes in Escherichia coli to about two weeks in Mycobacterium leprae. The translation machinery in a cell needs to synthesize all proteins for a new cell in each generation. The three subprocesses of translation, i.e., initiation, elongation, and termination, are expected to be under stronger selection pressure to optimize in short-generation bacteria (SGB) such as Vibrio natriegens than in the long-generation Mycobacterium leprae. The initiation efficiency depends on the start codon decoded by the initiation tRNA, the optimal Shine-Dalgarno (SD) decoded by the anti-SD (aSD) sequence on small subunit rRNA, and the secondary structure that may embed the initiation signals and prevent them from being decoded. The elongation efficiency depends on the tRNA pool and codon usage. The termination efficiency in bacteria depends mainly on the nature of the stop codon and the nucleotide immediately downstream of the stop codon. By contrasting SGB with long-generation bacteria (LGB), we predict that 1) SGB to have more ribosome RNA operons to produce ribosomes, and more tRNA genes for carrying amino acid to ribosomes, 2) SGB to have a higher percentage of genes using AUG as start codon and UAA as stop codon than LGB, 3) SGB to exhibit better codon and anticodon adaptation than LGB, and 4) SGB to have weaker secondary structure near translation initiation signals than LGB. These differences between SGB and LGB should be more pronounced in highly expressed genes than lowly expressed genes. We present empirical evidence in support of these predictions.
Keywords:
Mycobacterium leprae
; Mycobacterium tuberculosis
; translation efficiency
; translation initiation
; translation elongation
; translation termination
; RNA secondary structure
; rrn operons
; tRNA
1. Introduction
“The dream of a bacterium is to become two bacteria” [1], but the realization of this dream is often delayed by the rate of biosynthesis, especially the rate of translation [2,3,4,5,6,7,8,9], partly because most of the cellular dry weight is contributed by proteins. In well-studied enterobacteria, proteins account for more than half of the cell dry mass [10,11]. In Escherichia coli, the ratio of dry weight to wet weight is 0.2294 [12], and the ratio of protein weight to wet weight is about 0.2 [13]. Thus, proteins contribute about 87% (=0.2/0.2294) to the cellular dry biomass. It is not surprising that the growth rate of E. coli increases with the rate of protein production [11]. One therefore would expect a strong selection on the efficiency of the translation machinery and mRNA features to increase translation efficiency.
1.1. Empirical Studies on Selection Optimizing Translation Efficiency
Efficient translation requires efficient initiation, elongation, and termination, as well as mRNA stability, and limits the rate of biosynthesis in both bacteria [3,6,7,14] and phage [5,15,16,17]. Translation initiation is often the limiting step [2,4,18,19,20]. Efficient initiation in bacteria generally requires (1) AUG as a start codon, (2) a well-positioned base-pairing between Shine-Dalgarno (SD) sequence and the anti-SD (aSD) of the free 3’ end of the small ribosomal rRNA [21,22,23,24,25,26], and (3) no strong secondary structure that would embed the start codon or SD and consequently obscure them from being decoded by initiation tRNA and aSD, respectively [27].
With efficient translation initiation, translation elongation becomes rate-limiting [7,14]. Codon-anticodon adaptation is invariably observed in rapidly replicating organisms [2,6,28,29], especially in highly expressed genes [6,7,28,29,30,31,32,33,34]. The same pattern was also found in phages [5,9,16,17,35]. Experimental replacement of minor codons by major codons or vice versa typically leads to an increased or decreased translation rate in bacteria [7,36,37,38,39,40] and viruses [41,42]. Eukaryotic viruses such as HIV-1 tend to have the codon usage of their early and late genes adapted to their respective tRNA pools [43]. These results have led to the explicit formulation of codon-anticodon coevolution and adaptation theory e.g., [6,44,45,46,47] and codon adaptation indices [7,48,49,50]. Although the relationship between codon usage optimization and protein production was briefly challenged [3], the relationship was fully reestablished by more detailed data analysis [7,14].
Translation termination in bacterial species is mediated by one or two release factors RF1 (decoding UAA and UAG) and RF2 (decoding UAA and UGA). All three stop codons can be misread by tRNAs in bacterial species [51,52]. The readthrough frequency is at least 10-3 to 10-2 for UGA in Salmonella typhimurium [53] and E. coli [54,55], and 1.1×10⁻⁴ to 7×10⁻³ for UAG, depending on the nature of the downstream nucleotides [52,56,57,58]. The readthrough rate is the lowest for UAA, at frequencies from 9 ×10⁻⁴ to less than 1×10⁻⁵ [52]. The readthrough error rate in the order of UGA > UAG > UAA has been consistently observed in multiple studies [55,59,60,61,62,63,64]. Empirical evidence supports the hypothesis that highly expressed genes prefer UAA stop codons [65].
Termination efficiency also depends on the nucleotide immediately downstream of the stop codon [66,67,68], leading to the proposal of the tetranucleotide stop signal including the +4 site [66,68,69,70,71,72]. The best-documented case involves the translation of prfB mRNA (encoding RF2) in E. coli in which an inframe UGA stop codon is followed by nucleotide C [73,74,75]. When RF2 is abundant, the inframe UGA is decoded correctly to terminate translation, generating a short non-functional peptide. When RF2 is rare, the inframe UGA is not decoded. A +1 frameshift leads to the translation of GAC at a different coding frame, generating a functional RF2.
Almost all studies reviewed above focus on the optimization of mRNA but not on the translation machinery which consists mainly of ribosomes, translation initiation factors, tRNAs, tRNA-charging enzymes, and release factors, as well as the energy that drives the translation machinery [9,76], pp. 522-635. Given that ribosomes represent parallel translation machines, there are two lines of empirical evidence suggesting that short-generation bacteria (SGB) should produce more ribosomal proteins, rRNA [77,78], and tRNA [79] than LGB. First, bacterial growth rate increases with the number of ribosomes in the cell [80,81,82,83]. Second, the number of ribosomes increases with rRNA abundance [84]. More ribosomes imply a greater need for tRNAs [85]. There should be more rRNA operons and tRNA genes in SGB than in LGB.
1.2. Two Approaches in Studying Selection on Translation Optimization
The first approach to identify the effect of selection on translation optimization is by within-species comparisons, especially by contracting between highly expressed and lowly expressed genes (HEGs and LEGs) in rapid replicating bacteria [5,8,9,31,47,65]. Because AUG and UAA represent stronger start and stop signals, respectively, than their alternatives, one would predict that HEGs should exhibit a stronger preference for AUG and UAA as start and stop codons than LEGs [5,8,9,65]. Because a strong secondary structure embedding translation signals such as start codon, SD sequence, and stop codon, one would predict that HEGs should have a weaker secondary structure in sequence flanking these translation signals than LEGs [15,86]. Because early genes and late genes are translated with dramatically different tRNA pools, the two groups of genes should exhibit different codon optimizations [43]. The studies reviewed above constitute empirical tests of such predictions involving different groups of genes within individual species.
This paper focuses on differential selection for translation optimization among species. Relatively few studies are available, partly because of the difficulty in identifying differential selection. Occasionally, codon usage itself was taken as a proxy of selection [77], which is not a satisfactory approach. However, in at least four cases, such differential selection can be identified with little controversy. The first case involves mitochondrial tRNA and protein-coding genes. Mitochondrial genomes of most multicellular eukaryotes encode only a single tRNAMet/CAU (where Met is amino acid methionine and CAU is the tRNA anticodon for Watson-Crick base-pairing with Met codon AUG) to decode both Met codons AUG and AUA (through wobble-pairing). In contrast, mitochondrial genomes in some bivalve species and tunicate species encode an additional tRNAMet/UAU gene which can decode AUA codons without wobble-pairing. One can predict that AUA codons should be used more frequently in mitochondrial protein-coding genes in those bivalve and tunicate species, which is true [29,87,88].
The second case of identifiable differential selection involves stop codons and release factors (RF1 decoding UAA and UAG, and RF2 decoding UAA and UGA) in bacteria [65]. If bacterial species X has more RF2 but less RF1 than species Y, then we would predict more UGA usage in species X than in species Y. This predicted pattern has also been documented in multiple bacterial species [65].
The third case involves phages differing in the presence of a lysogenic phase. Phage genomes in a lysogenic phase generally are not under selection for translation efficiency because the phage genome replicates by hitchhiking on the host genome. In contrast, phages without a lysogenic phase will be more selected for translation optimization. This leads to the prediction that the former should exhibit stronger translation optimization than the latter, which is consistent with the empirical evidence [5,16].
The fourth case involves a key component of the translation machinery, i.e., small subunit rRNA whose functions depend on stable secondary structures. Thermophiles are expected to have longer and more GC-rich stems than mesophiles, and this prediction is empirically supported [89]. The difference in growth temperature between thermophiles and mesophiles also affects the proportion of SD-led genes [90].
1.3. Hypothesized Differential Selection on Translation among Bacterial Species
Bacterial species differ dramatically in generation time. Under optimal culture conditions, the generation time is ~10 min in Vibrio natriegens [91,92], 16-20 min in Vibrio cholerae [93], 20-30 minutes in Escherichia coli [94], 30-70 minutes Bacillus subtilis [95], 103-107 minutes in Haemophilus influenzae [96], about two hours in Mycobacterium smegmatis [97], 4-5 hours in M. abscessus [98], 20-30 hours in M. tuberculosis [99,100,101] and more than seven days in Mycobacterium leprae [100,102]. Such dramatic differences in generation time have been dichotomized into r- and K-selection [103,104]. However, the evolutionary consequence of such differential selection has rarely been explored at the molecular level.
Translation machinery that needs to complete the task of protein synthesis in 10 minutes, as in the case of V. natriegens, should be under stronger selection for optimizing translation than that in seven days, as in the case of M. leprae. The fitness of some parasitic bacteria is more related to survival against host attacks than to efficient translation. For example, M. tuberculosis cells build their private niches essentially isolated from the surrounding environment. This protective environment, while beneficial for the survival of the pathogen, also makes it difficult for the pathogen to gain nutrients and oxygen. If protein production is not the limiting factor in growth and reproduction, then one would not expect strong selection optimizing the translation machinery. Thus, we predict that selection for optimizing translation should leave much stronger signatures in rapidly replicating species such as V. natriegens than in slowly replicating species such as M. tuberculosis and M. leprae.
2. Materials and Methods
We include nine bacterial species with completely sequenced genomes and a well-documented generation time from the shortest to the longest among mesophiles under optimal growth conditions (Table 1). Generation time has typically been quantified only in model organisms (e.g., E. coli as a model species for gram-negative bacteria and Bacillus subtilis as a model species for gram-positive bacteria) and very harmful pathogens, so the sample of nine species is not representative of all bacteria. Also, the optimal growth condition from an experimenter’s perspective may not be the true optimal, so the generation time in Table 1 might be overestimated. However, the rank of the relative length of generation time (Table 1) should be reasonable, and subsequent analysis will be mainly based on the rank of generation time. Our general prediction is that SGB should have more efficient protein-production systems than long-generation bacteria (LGB).
The RefSeq genomic sequences for the nine species were downloaded from GenBank by using the accession numbers in Table 1 Software DAMBE [105] was used to extract coding sequences (CDSs), rRNA, and tRNA genes from the GenBank files. We classified the bacterial host genes into two expression groups: 1) known highly expressed protein-coding genes (HEGs) including small and large ribosomal protein genes, RNA polymerases, and some other genes known to be highly expressed (Supplemental Table S1), and 2) the rest of protein-coding genes not in the HEG group (REST). Pseudogenes were excluded from all analyses.
RNA secondary structure could embed important translation signals such as start codon, SD sequence, and stop codon and prevent them from being decoded by the translation machinery. We measured secondary structure stability by the minimum folding energy (MFE) implemented in DAMBE [105] which uses the Vienna RNA fold library [106] for secondary structure characterization. A sliding window of 40 nt along the CDSs was used to characterize the change of MFE along the sequence. Codon adaptation was measured by the index of translation efficiency (ITE) which generalizes the conventional codon adaptation index (CAI) [48,49] to accommodate background mutation rate [7].
The base-pairing between the SD sequence on mRNA and the aSD sequence on the small subunit (ssu) rRNA was hypothesized to position the start codon at the P-site to pair with the initiation tRNA [5,9,15,107]. The distance between the end of the ssu rRNA and the start codon (DtoStart) is highly constrained in bacterial genes, especially highly expressed ones. A narrow distribution of DtoStart values suggests a stronger selection on the SD/aSD pairing than a wide distribution. DAMBE [86] implements the calculation of DtoStart
3. Results
3.1. Differential Investment in Translation Machinery
Ribosomes represent parallel protein-production factories and their abundance in E. coli and their abundance increases linearly with growth rate [108,109]. Short-generation species may have not only more efficient factories but also more factories than LGB. Each ribosome features a set of 16S, 23S, and 5S rRNAs that are transcribed from the same operon and processed into individual rRNAs [110]. E. coli has seven rRNA operons (rrnA to rrnE, rrnG, rrnH) with promotors that are almost identical to the -10 and -35 consensus [111,112], suggesting a high demand for rRNA molecules met by both efficient and parallel transcription of multiple rRNA operons. The production of ribosomes in E. coli is limited by rRNA production [113], which explains why E. coli maintains multiple rrn operons in its genome for parallel transcription. A generalization of this would lead to the prediction that SGB should have more rrn operons than LGB. This prediction should also apply to tRNA genes because, with more ribosomes, more tRNA molecules are needed [114].
The two predictions are both supported by empirical evidence (Table 2), with the number of rRNA and tRNA genes decreasing highly significantly with increasing generation time (p < 0.0001 for any rank-based nonparametric tests). The observation that SGB maintains more rRNA and tRNA genes in their genomes than LGB is consistent with the interpretation of stronger selection for translation efficiency in SGB than in LGB.
Note that an organism needs at least one rrn operon for translation, so the number of rrn operons cannot be smaller than 1. Also, there should be a minimum set of tRNA genes to decode all 61 sense codons. One might use the following two equations to model the number of rrn operons and tRNA genes, respectively:
where x is RankGT in Table 2 Eq. (1) ensures a minimum Nrrn of 1, and Eq. (2) ensures a minimum NtRNA of c. The parameters were estimated by the least-squares approach, and the fitted equations were plotted in Figure 1.
3.2. Differential Preference of Start Codon AUG
Among the three canonical start codons (AUG, GUG, and UUG), translation initiation efficiency is consistently in the order of AUG > GUG > UUG [115,116]. HEGs in bacteria and bacteriophages tend to prefer AUG as a start codon [5,9,18,115,116,117]. This is true for all nine bacterial species in which the percentage of AUG (AUG%, Table 3) is consistently higher in HEGs than those in REST (Table 3) which includes all genes not in the HEGs group and consequently contains both highly expressed and lowly expressed genes. This suggests that AUG is the most efficient start codon and is consistent with previous empirical studies based on within-species comparisons [5,8,9].
Given that AUG is the most efficient start codon, one would predict that SGB should use more AUG as start codons than LGB. AUG% in Table 3 is indeed strongly associated with ranked generation time in Table 1 as predicted. However, AUG% is also affected by genomic GC% because GC-rich genomes tend to have more GC-rich codons [29]. In terms of start codon usage, GC-rich genomes may use more GUG as start codons than AUG. Because the four LGB all have higher GC% than the five species with relatively short generations, they may use fewer AUG and more GUG as start codons simply because of their genomic GC-richness. For this reason, it is necessary to include genomic GC as a control variable. Also, HEGs and REST genes may differ in the relationship. A conceptually more comprehensive and explicit model is therefore needed.
Here the dependent variable is AUG%, and independent variables include ranked generation time (RankGT), genomic GC content (GC%), and gene expression (GE with two categories, HEGs and REST encoded as 0 and 1, respectively). The input data (Table 4) is used to fit the model.
A regression analysis of the input data in Table 4 shows that all three independent variables are statistically significant, but interaction terms are not (Table 5). The regression model was then fitted without interaction terms. This reduced model accounts for 82.0% of the variation in the dependent variable AUG%. The two regression equations derived from the regression coefficients in Table 5, one for HEGs and the other for REST, are
Eqs. (3) and (4) and Table 5 show that AUG% decreases highly significantly with generation time, and that AUG% is significantly higher in HEGs than REST genes (Table 5). This is consistent with the interpretation of stronger selection operating on SGB than on LGB. That is, a non-AUG start codon mutating to AUG is more strongly favored by natural selection in SGB than in LGB.
We should emphasize that Eqs. (3) and (4) are descriptive models. They do not explicitly prevent AUG% from taking values smaller than 0 or larger than 1. A sigmoidal function would have been more appropriate if there were enough data for parameter estimation.
3.3. Differential Preference of Stop Codon UAA
As reviewed previously, stop codon UAA exhibits the smallest readthrough error rate among the three nonsense codons [55,59,60,61,62,63,64]. Consequently, HEGs favor stop codon UAA over other stop codons in multiple bacterial species [9,65,72]. This is true for all nine bacterial species (data not shown). Given that UAA is the best stop codon, we predict that SGB should use more UAA as stop codons than LGB. Similar to our analysis of the start codon AUG usage, the dependent variable now is UAA%, and independent variables include ranked generation time (RankGT), genomic GC content (GC%), and gene expression (GE with two categories, HEGs and REST encoded as 0 and 1, respectively). The genomic GC% is particularly relevant in studying UAA usage because protein-coding genes in a GC-rich genome tend to use more UGA and UAG stop codons than those in an AT-rich genome [65].
A regression analysis shows that all three independent variables are statistically significant (Table 6). The model accounts for 94.7% of the total variation in UAA%. The two regression equations derived from the regression coefficients in Table 6, one for HEGs and the other for REST, are
Eqs. (5) and (6) and Table 6 show that UAA% decreases highly significantly with generation time, and that HEGs use UAA significantly more frequently than REST genes (Table 6, a 17.35326% difference between the two). This is consistent with the interpretation of stronger selection operating on SGB than on LGB. A non-UAA stop codon mutating to UAA is more strongly favored by natural selection in SGB than in LGB.
UAA usage also decreases significantly with genomic GC% (Table 6), which is understandable. As genomic GC% increases, GC-biased mutations would favor UAG and UGA codons against UAA codons [65]. It is for this reason that the genomic GC content needs to be taken into consideration when assessing codon usage bias.
3.4. Differential Selection on Sense Codons
It is difficult to evaluate tRNA-mediated selection on codon usage across species because the codon adaptation index (CAI) [48,49] and the index of translation efficiency (ITE) [7] are both for comparing genes within-species. The effective number of codons (ENC) [50,118] could potentially be used for among-species comparisons, but all these indices are strongly affected by genomic mutation bias [119,120]. For example, protein-coding genes in strongly GC-biased genomes will have mostly G-ending and C-ending codons, leading to a reduced ENC that has little to do with selection.
It is reasonable to assume that mutation bias affects both HEGs and REST genes. Thus, the difference in mean ITE between HEGs and REST, i.e.,
, should be relatively independent of mutation bias. should increase with selection intensity for translation elongation efficiency. If there is no selection for translation elongation efficiency, then is expected to be 0. With increasing strong selection for translation elongation efficiency, should also increase because the selection is expected to be stronger for HEGs than for REST genes. In other words, strong selection for translation efficiency in SGB should drive HEGs towards better codon adaptation than the REST genes, thereby increasing .
The values and its ranks (Rank , Table 7 ) are depends strongly on generation time (RankGT, Table 7). The relationship is best illustrated with two ranked variables, i.e., ranked generation time (RandGT) and ranked (Figure 2). The fitted regression line accounts for 87.84% of the total variation in ranked (Figure 2).
3.5. Differential Selection Drives tRNA Adaptation
Codon and tRNA are expected to coevolve and adapt to each other [2,6,28,29], especially in highly expressed genes [6,7,28,29,30,31,32,33,34,121]. Given the better codon optimization in SGB than in LGB (Figure 2 and Table 7), one would predict more tRNA genes for highly used codons than rarely used codons. If we focus on the anticodon of tRNA genes, then the prediction above implies a smaller effective number of anticodons (NAC), equivalent to the concept of the effective number of codons [50,118], in SGB than in LGB. Specifically, NAC should increase with RankGT (ranked generation time).
We calculated NAC in the same way the effective number of codons is calculated [50] except that codons in coding sequences are replaced by anticodons in tRNA genes. The ranked NAC increases highly significantly with ranked RankGT (Table 8 and Figure 3A), consistent with our prediction that SGB should have a smaller NAC than LGB. One should note the difference between a codon replacement and an anticodon replacement. A codon replacement may have only a minor effect on the translation of a single gene, but an anticodon replacement would affect the translation of numerous codons. For this reason, anticodons are strongly constrained and much less affected by genomic GC%.
NAC also exhibits a statistically highly significant (p =0.00015, Figure 3B) positive correlation with Rank (Table 7) which measures codon adaptation. This is consistent with our prediction. The major codons are strongly favored, more tRNAs with the corresponding decoding anticodon will be needed to translate such overused codons, leading to decreased NAC.
The analysis above assumes that tRNA gene copy numbers in the bacterial genomes are proportional to the abundance of tRNA molecules in the cell. With the availability of transcriptomic data, it has been found that the assumption is generally true, i.e., the copy number of a tRNA is highly correlated with the transcriptomic representation of the tRNA [122].
3.6. Secondary Structure Stability Near the Start and Stop Codons
Sequences immediately flanking translation signals in bacteria (e.g., Shine-Dalgarno sequence, and start and stop codons) tend to have reduced secondary structure to avoid embedding translation signals in a stable secondary structure [18,27,107,116,123,124]. This pattern has also been observed in bacteriophage genes [5,9,15]. The weakening of the secondary structure near, or immediately upstream of, the start codon has also been observed in highly expressed eukaryotic mRNAs [8,125], especially in mRNAs requiring internal ribosome entry for translation [126].
Secondary structure stability in RNA is typically measured by the minimum folding energy (MFE). MFE equal to 0 means no secondary structure, and a stronger secondary structure corresponds to a more negative MFE value. Experiments involving engineered E. coli genes have shown that translation initiation efficiency depends heavily on MFE of the sequence upstream and including the start codon [3,7,14]. We follow the convention of previous studies [5,9,15] measuring MFE with a sliding window of 40 nt along mRNA sequences to quantify the change of secondary structure stability
Secondary structure stability, as measured by MFE, decreases near the start codon, but the weakest secondary structure is observed slightly upstream of the start codon (Figure 4), corresponding to the SD sequence. This pattern has been observed before in bacteriophage genes and their host genes [5,9,15], and is consistent with the interpretation that a strong secondary structure embedding the SD sequence or the start codon is selected against because it prevents the translation initiation signal (SD and start codon) from being decoded by the aSD sequence and the initiation tRNA, respectively.
One might argue against the interpretation that the reduced secondary structure near the translation initiation is to avoid embedding crucial translation initiation signals such as SD sequences and start codons in a stable secondary structure. The SD sequences are purine-rich and cannot form a secondary structure within them. Thus, the reduced secondary structure near the SD sequence (Figure 4) is a direct consequence of the purine-richness in the SD sequences, with nothing to do with the hypothesized avoidance of secondary structure embedding important translation initiation signals. To test this possibility, we simulated equivalent sequences with a purine-rich core about 10 nt upstream of the start codon, with the rest of the upstream sequences randomly drawn from a nucleotide pool derived from intergenic sequences. The result (not shown) does not support this possibility. The purine-rich core decreases the secondary structure stability only negligibly.
All nine bacterial species exhibited decreased secondary structure (Figure 4), and the minor differences in MFE among species are not straightforward to interpret, partly because MFE is strongly affected by GC content, i.e., stronger secondary structure with higher GC content in mRNA. As we can see from Table 9, H. influenzae has the lowest genomic GC% (38.2%), and its mean MFE is the closest to 0 (which means no secondary structure). In contrast, M. smegmatis and M. tuberculosis have the highest genomic GC%, and their mRNAs tend to have more negative MFE values (Figure 4). For this reason, without controlling for GC%, the observation that the LGB have a stronger secondary structure than the SGB cannot be attributed to a reduced selection in these LGB against stable secondary structure.
Given that a weak secondary structure near the SD sequence and the start codon is favorable (Figure 4), one would predict that SGB should have weaker secondary structures (larger MFE values) than LGB. In order to test this prediction, we characterized the MFE plot of sliding windows for each species by a single value. That is, for each plot in Figure 4, we calculated the mean value for mid-window-sites 46-65 (with the start codon occupying sites 58-60). These sites should include both the SD sequence and the start codon. The mean MEF (Table 9) is now the dependent variable. It is expected to 1) decrease with increasing generation time (RankGT), 2) decrease with increasing GC%, and 3) change with gene expression (GE, i.e., be greater for HEGs than for REST genes). These three independent variables are also included in Table 9.
The best model, which accounts for 98.2% of the total variation in MeanMFE in Table 9, includes the three dependent variables and an interaction term (Table 10). The two-tailed p for RankGT is 0.064 (Table 10). However, because we have an explicit one-tailed prediction of a negative slope (i.e., MeanMFE should decrease with increasing RankGT), p should be half of 0.064, i.e., 0.032. Other regression terms for GC%, GE and their interaction are highly significant (Table 10).
As before, we write the two regression equations separately for HEGs and REST from regression coefficients in Table 10:
Eqs. (8) and (9) show that, for both HEGs and REST genes, secondary structure stability increases with generation time (MFE becomes more negative with increasing generation time). This is consistent with our prediction that selection against secondary structure near the translation start signals (SD sequence and start codon) is stronger in SGB than LGB.
MeanMFE decreases more sharply with GC% in Eq. (9) than in Eq. (8), i.e., secondary structure stability increases more rapidly with GC% for the REST genes than for HEGs. This is easy to understand if the selection against secondary structure stability is on average stronger in HEGs than in REST genes. MeanMFE decreases by only 0.10038 (Eq. 8) for an increase of GC% by 1% with the strong selection in HEGs, but decreases by 0.21009 (Eq. 9) for the same change in GC% with the relatively weak selection in REST genes.
The selectionist interpretation above does not consider the effect of mutations which offers an alternative interpretation. In general, spontaneous mutations in AT-rich genomes tend to be AT-biased, based on comparison between pseudogenes and their functional counterparts [127,128], on mutation pattern of pathogenic bacteria with relaxed selection [129,130], and on nucleotide bias at the three codon sites across multiple bacterial species [131]. H. influenzae has an AT-rich genome, suggesting AT-biased mutation, in contrast to M. smegmatis which has a GC-rich genome. However, protein-coding genes in both species have SD sequences that are purine-rich (especially G-rich) (Figure 5). The G-rich SD will form base pairs with nearby C nucleotides so MFE will not go to 0. In pseudogenes where selection for maintaining the G-rich SD sequence is absent or in lowly expressed genes where the selection is weak, the AT-rich H. influenzae will lose these G nucleotides in the SD sequence, leading to an MFE closer to 0. Indeed, the MeanMFE value for the 19 pseudogenes in H. influenzae -2.2887, closer to 0 than all MeanMFE values in Table 9. Similarly, the MeanMFE is -3.2660 for HEGs and -2.5466 for REST genes (Table 9). This is consistent with the interpretation that the G-rich SD is more likely to be hit by G→A and G→T mutations and lose G/C base pairs in REST genes than in HEGs. For example, H. influenzae has a GC% of 37.9329% for HEGs but only 33.7986% for REST genes, leading to a MeanMFE value closer to 0 in REST genes than in HEGs.
In short, although the purine rich SD sequences (Figure 5) can hardly form secondary structures within itself, the dramatically increased G nucleotides within the SD sequence could base-pair with the neighboring C nucleotides and contribute to secondary structure stability. If there is no selection maintaining the G-richness in the SD sequences, then these G nucleotides may be replaced by A and T, leading to a further decrease in secondary structure stability. Thus, both selection and mutation could contribute to secondary structure stability in sequences near the translation initiation signals (the SD sequence and the start codon). The models in Eqs. (8) and (9) are therefore oversimplified and should be interpreted with caution. The secondary structure in sequences near the stop codon exhibits a similar pattern as those near the start codon (Figure 6).
The decrease in secondary structure stability may not necessarily be related to the avoidance of embedding SD sequences and start codons. Efficiently translated yeast mRNAs (i.e., mRNAs in polysomes with high ribosome density) often have a short poly(A) tract before the start codon [125], with the poly(A) interpreted as long enough to recruit translation initiation factors but short enough to avoid binding by the poly(A)-binding proteins. However, the presence of poly(A) also weakens the secondary structure stability as a secondary consequence.
4. Discussion
Our assumption that SGB are under stronger selection for translation efficiency than LGB appears to be valid because multiple predictions based on the assumption are consistent with the empirical evidence. First, the number of ribosome RNA operons, as well as the number of tRNA genes, increases as decreasing generation time (Table 2 and Figure 1). Second, AUG was known to be the most efficient start codon, and SGB genes exhibit a stronger preference for AUG as a start codon than LGB, especially in highly expressed genes (HEGs) (Table 3-Table 5). This is also true in the usage of stop codon UAA (Table 6) which is known to be the most efficient termination signal with the smallest readthrough error rate as a stop codon. Third, SGB, especially their HEGs, exhibits better codon and anticodon adaptation than LGB (Table 7 and Figure 2 for codons, and Table 8 and Figure 3). Finally, SGB genes have weaker secondary structure near translation initiation signals than LGB (Figure 4 and Tables Table 9-Table 10). A similar pattern was observed with sequence secondary structure near the stop codon (Figure 6). However, as we discussed previously, the selectionist interpretation is sometimes confounded by biased mutations.
Modern biological research aims to formulate and validate quantitative and mechanistic models. In this context, this study has several shortcomings. The first shortcoming is the inherent inaccuracy of generation time. The experimentally measured generation time sometimes varies widely among strains and among different studies. For example, the generation time is ~21 hours in drug-sensitive strains of M. tuberculosis, but ~35 hours in the multi-drug-resistant strains [132]. This suggests a cost to the pathogen in developing multi-drug resistance, i.e., the resistance is at the cost of longer generations. However, the observation also highlights the inherent variation in measured generation time. Particularly controversial is what generation time to use. For example, the generation time in E. coli is only about 20-30 minutes under favorable culture conditions but could be 15 hours in the natural habitat of the mammalian intestine estimated by the rate of mutation accumulation [133]. For modeling the joint effect of mutation and selection, the generation time under natural conditions would seem more appropriate than that under optimal experimental conditions. Unfortunately, the generation time in bacterial populations in nature cannot be measured accurately. For example, the estimated generation of 15 hours for E. coli [133] is associated with a 95% confidence interval of 0-30 hours. Another uncertainty with generation time is that we do not know if long-generation species such as M. leprae really cannot replicate fast or if they could grow fast but microbiologists have not been able to shift them into the fact-growing mode. Because of the uncertainty generation time among the bacterial species, we ranked generation time in the hope that the relative generation time is in proper order. It is for this reason that we have chosen species widely different generation times characterized experimentally, so that our ranking of the generation time would not be controversial.
The second shortcoming of the study is the small number of bacterial species, partly because of our conscious effort to avoid species with uncertain generation time. There are various tables of bacterial generation times for more than nine bacterial species, but they often do not include original references or do not have fully sequenced genomes. Some bacterial species in Mollicutes have known generation times, e.g., ~6 hours in Mycoplasma pneumoniae [134],[135], as well as fully sequenced genomes. However, their genetic code (i.e., translation table 4) differs from the rest of the bacteria (translation table 11). This complicates comparisons. Consequently, they are not included in this study. The small number of bacterial species included here results in two limitations. First, it does not permit the validation of parameter-rich models. Second, it would not allow a phylogeny-based inference [136,137,138] to alleviate the issue of data dependence. We have previously used such phylogeny-based inference to quantify relationships between body temperature and genome size [139] and between optimal growth temperature and ribosomal RNA secondary structure stability (i.e., the stem length and GC% in the stem-loop structure in rRNA) [89]. In this context, we may highlight two points. First, our results are highly consistent with the prediction that increasing generation time decreases selection on translation efficiency. Second, the bacterial species we use are highly divergent. Even the two most closely related species, M. tuberculosis and M. leprae, have an evolutionary distance of more than 0.3 even for conserved ribosomal protein genes [140], so phylogenetic inertia might not affect the quantified relationships, i.e., the data points might be considered to be roughly independent.
The third shortcoming is the lack of a general conceptual framework of mutation and selection on translation optimization that can be used across species. Protein production from an mRNA depends on the ribosomal recruitment rate, the efficiency in forming the 70S initiation complex, elongation efficiency and accuracy, termination efficiency and accuracy, the stability of the mRNA, differential amino acid and tRNA availability, and the energy level of the cell [4,141,142,143]. How do these variables interact with each other affect protein production? For example, when translation is not efficient, codon usage optimization has little effect on protein production. However, protein production increases significantly with codon optimization in mRNAs with efficient initiation [3,7,14]. Similarly, there are conflicts between maximizing transcription efficiency and translation efficiency. An RNA would be transcribed efficiently if it maximize the usage of the abundant nucleotide A and minimize the rare nucleotide C [144,145]. However, this would drive up the usage of A-ending codons that may not be the optimal codon for translation. There are also factors affecting codon usage that are not related to translation. For example, mammalian species have zinc-finger antiviral proteins (ZAP) against RNA viruses by targeting CpG dinucleotides in the viral RNA [146,147,148,149,150]. Many human RNA viruses, including SARS-CoV-2, exhibit much reduced CpG dinucleotides [151,152]. Most of the CpG reduction occurs at the di-codon configuration, from NNC GNN to NNT GNN (i.e., a synonymous replacement). This NNC to NNU change has nothing to do with codon optimization. What would be the functional relationship among all these variables? The model would be even more complicated if we consider not only HEGs, but also genes whose optimal protein level is not the maximal, such as the autoregulated level of release factor 2 in E. coli [73,74] or many others [153]. We highlight such questions in the hope that they will motivate researchers to address them.
5. Conclusions
Detection of selection on translation efficiency is mostly done by contrasting highly expressed genes and lowly expressed genes within rapidly replicating species. We generalized such studies to understand how differential selection on translation optimization among different species would leave its footprints on the species-specific translation machinery. Our results suggest that selection for translation optimization is stronger in short-generation species than long-generation species, and that this differential selection strongly shapes the evolutionary trajectories of translation machinery in these species, affecting translation initiation, elongation and termination.
Supplementary Materials
The following supporting information can be downloaded at the website of this paper posted on Preprints.org.
Author Contributions
Conceptualization, H.F. and X.X.; methodology, H.F. and X.X.; software, H.F. and X.X.; validation, X.X.; formal analysis, H.F. and X.X.; investigation, H.F. and X.X.; resources, X.X.; data curation, H.F. and X.X.; writing—original draft preparation, H.F. and X.X.; writing—review and editing, H.F and X.X.; visualization, X.X.; supervision, X.X.; project administration, X.X.; funding acquisition, X.X. All authors have read and agreed to the published version of the manuscript.
Funding
This research was funded by Discovery Grant from Natural Science and Engineering Research Council (NSERC) of Canada, grant number RGPIN/2018-03878.
Institutional Review Board Statement
Not applicable.
Informed Consent Statement
Not applicable.
Data Availability Statement
Not applicable.
Acknowledgments
We thank Xia Lab members for discussion and comments.
Conflicts of Interest
The author declares no conflict of interest.
References
- Jacob, F. , Génétique cellulaire: Leçon inaugurale prononcée le vendredi 7 mai 1965. Collège de France: 2013.
- Bulmer, M. , The selection-mutation-drift theory of synonymous codon usage. Genetics 1991, 129, 897–907. [Google Scholar] [CrossRef] [PubMed]
- Kudla, G.; Murray, A.W.; Tollervey, D.; Plotkin, J.B. , Coding-Sequence Determinants of Gene Expression in Escherichia coli. Science 2009, 324, 255–258. [Google Scholar] [CrossRef] [PubMed]
- Liljenstrom, H.; von Heijne, G. , Translation rate modification by preferential codon usage: intragenic position effects. J Theor Biol 1987, 124, 43–55. [Google Scholar] [CrossRef]
- Prabhakaran, R.; Chithambaram, S.; Xia, X. , Escherichia coli and Staphylococcus phages: effect of translation initiation efficiency on differential codon adaptation mediated by virulent and temperate lifestyles. J Gen Virol 2015, 96, 1169–1179. [Google Scholar] [CrossRef] [PubMed]
- Xia, X. , How optimized is the translational machinery in Escherichia coli, Salmonella typhimurium and Saccharomyces cerevisiae? Genetics 1998, 149, 37–44. [Google Scholar] [CrossRef]
- Xia, X. , A Major Controversy in Codon-Anticodon Adaptation Resolved by a New Codon Usage Index. Genetics 2015, 199, 573–579. [Google Scholar] [CrossRef] [PubMed]
- Xia, X. , Detailed Dissection and Critical Evaluation of the Pfizer/BioNTech and Moderna mRNA Vaccines. Vaccines 2021, 9, 734. [Google Scholar] [CrossRef]
- Xia, X. , Optimizing Protein Production in Therapeutic Phages against a Bacterial Pathogen, Mycobacterium abscessus. Drugs and Drug Candidates 2023, 2, 189–209. [Google Scholar] [CrossRef]
- Bremer, H.; Dennis, P. Bremer, H.; Dennis, P., Modulation of chemical composition and other parameters of the cell by growth rate. Escherichia coli and Salmonella: cellular and molecular biology. In Escherichia coli and Salmonella: Cellular and Molecular Biology 2nd ed.; Neidhardt, F.C., Ed. American Society for Microbiology: Washington DC, 1996; pp 1553-1568.
- Valgepea, K.; Adamberg, K.; Seiman, A.; Vilu, R. , Escherichia coli achieves faster growth by increasing catalytic and translation rates of proteins. Molecular bioSystems 2013, 9, 2344–2358. [Google Scholar] [CrossRef] [PubMed]
- Glazyrina, J.; Materne, E.M.; Dreher, T.; Storm, D.; Junne, S.; Adams, T.; Greller, G.; Neubauer, P. , High cell density cultivation and recombinant protein production with Escherichia coli in a rocking-motion-type bioreactor. Microb Cell Fact 2010, 9, 42. [Google Scholar] [CrossRef]
- Milo, R. , What is the total number of protein molecules per cell volume? A call to rethink some published values. Bioessays 2013, 35, 1050–1055. [Google Scholar]
- Tuller, T.; Waldman, Y.Y.; Kupiec, M.; Ruppin, E. , Translation efficiency is determined by both codon bias and folding energy. Proc. Natl. Acad. Sci. U S A 2010, 107, 3645–3650. [Google Scholar] [CrossRef] [PubMed]
- Xia, X. , Optimizing Phage Translation Initiation. OBM Genetics 2019, 3, 16. [Google Scholar] [CrossRef]
- Chithambaram, S.; Prabhakaran, R.; Xia, X. , Differential Codon Adaptation between dsDNA and ssDNA Phages in Escherichia coli. Molecular Biology and Evolution 2014, 31, 1606–1617. [Google Scholar] [CrossRef] [PubMed]
- Chithambaram, S.; Prabhakaran, R.; Xia, X. , The Effect of Mutation and Selection on Codon Adaptation in Escherichia coli Bacteriophage. Genetics 2014, 197, 301–315. [Google Scholar] [CrossRef] [PubMed]
- Gualerzi, C.O.; Pon, C.L. , Initiation of mRNA translation in bacteria: structural and dynamic aspects. Cellular and molecular life sciences : CMLS 2015, 72, 4341–4367.
- Andersson, D.I.; Kurland, C.G. , Ram ribosomes are defective proofreaders. Mol Gen Genet 1983, 191, 378–381. [Google Scholar] [CrossRef] [PubMed]
- Bulmer, M. , The effect of context on synonymous codon usage in genes with low codon usage bias. Nucleic Acids Res 1990, 18, 2869–2873. [Google Scholar] [CrossRef] [PubMed]
- Shine, J.; Dalgarno, L. , The 3'-terminal sequence of Escherichia coli 16S ribosomal RNA: complementarity to nonsense triplets and ribosome binding sites. Proc. Natl. Acad. Sci. U S A 1974, 71, 1342–1346. [Google Scholar] [CrossRef]
- Shine, J.; Dalgarno, L. Identical 3'-terminal octanucleotide sequence in 18S ribosomal ribonucleic acid from different eukaryotes. A proposed role for this sequence in the recognition of terminator codons. Biochem J 1974, 141, 609–615. [Google Scholar] [CrossRef]
- Shine, J.; Dalgarno, L. , Determinant of cistron specificity in bacterial ribosomes. Nature 1975, 254, 34–38. [Google Scholar] [CrossRef]
- Hui, A.; de Boer, H.A. , Specialized ribosome system: preferential translation of a single mRNA species by a subpopulation of mutated ribosomes in Escherichia coli. Proc. Natl. Acad. Sci. U S A 1987, 84, 4762–4766. [Google Scholar] [CrossRef]
- Steitz, J.A.; Jakes, K. , How ribosomes select initiator regions in mRNA: base pair formation between the 3' terminus of 16S rRNA and the mRNA during initiation of protein synthesis in Escherichia coli. Proc. Natl. Acad. Sci. U S A 1975, 72, 4734–4738. [Google Scholar] [CrossRef]
- Taniguchi, T.; Weissmann, C. , Inhibition of Qbeta RNA 70S ribosome initiation complex formation by an oligonucleotide complementary to the 3' terminal region of E. coli 16S ribosomal RNA. Nature 1978, 275, 770–772. [Google Scholar]
- Nakamoto, T. , A unified view of the initiation of protein synthesis. Biochem Biophys Res Commun 2006, 341, 675–678. [Google Scholar] [CrossRef]
- Ikemura, T. , Correlation between the abundance of Escherichia coli transfer RNAs and the occurrence of the respective codons in its protein genes. J. Mol. Biol. 1981, 146, 1–21. [Google Scholar] [CrossRef]
- Xia, X. , Bioinformatics and Translation Elongation. In Bioinformatics and the Cell: modern computational approaches in genomics, proteomics and transcriptomics, Springer, Cham: Switzerland, 2018; pp 197-238.
- Ikemura, T. Correlation between the abundance of yeast transfer RNAs and the occurrence of the respective codons in protein genes. Differences in synonymous codon choice patterns of yeast and Escherichia coli with reference to the abundance of isoaccepting transfer RNAs. J Mol Biol 1982, 158, 573–597. [Google Scholar]
- Gouy, M.; Gautier, C. , Codon usage in bacteria: correlation with gene expressivity. Nucleic Acids Res. 1982, 10, 7055–7064. [Google Scholar] [CrossRef]
- Coghlan, A.; Wolfe, K.H. , Relationship of codon bias to mRNA concentration and protein length in Saccharomyces cerevisiae. Yeast 2000, 16, 1131–1145. [Google Scholar] [CrossRef]
- Comeron, J.M.; Aguade, M. , An evaluation of measures of synonymous codon usage bias. J. Mol. Evol. 1998, 47, 268–274. [Google Scholar] [CrossRef]
- Duret, L.; Mouchiroud, D. , Expression pattern and, surprisingly, gene length shape codon usage in Caenorhabditis, Drosophila, and Arabidopsis. Proc. Natl. Acad. Sci. U S A 1999, 96, 4482–4487. [Google Scholar] [CrossRef]
- Prabhakaran, R.; Chithambaram, S.; Xia, X. , Aeromonas phages encode tRNAs for their overused codons. International journal of computational biology and drug design 2014, 7, 168–182. [Google Scholar] [CrossRef] [PubMed]
- Robinson, M.; Lilley, R.; Little, S.; Emtage, J.S.; Yarranton, G.; Stephens, P.; Millican, A.; Eaton, M.; Humphreys, G. , Codon usage can affect efficiency of translation of genes in Escherichia coli. Nucleic Acids Res 1984, 12, 6663–6671. [Google Scholar] [CrossRef] [PubMed]
- Sorensen, M.A.; Kurland, C.G.; Pedersen, S. , Codon usage determines translation rate in Escherichia coli. J Mol Biol 1989, 207, 365–377. [Google Scholar] [CrossRef]
- Andersson, D.I.; Bohman, K.; Isaksson, L.A.; Kurland, C.G. , Translation rates and misreading characteristics of rpsD mutants in Escherichia coli. Mol Gen Genet 1982, 187, 467–472. [Google Scholar] [CrossRef] [PubMed]
- Andersson, S.G.; Buckingham, R.H.; Kurland, C.G. , Does codon composition influence ribosome function? Embo J 1984, 3, 91–94. [Google Scholar] [CrossRef]
- Andersson, S.G.; Kurland, C.G. , Codon preferences in free-living microorganisms. Microbiol Rev 1990, 54, 198–210. [Google Scholar] [CrossRef]
- Haas, J.; Park, E.-C.; Seed, B. , Codon usage limitation in the expression of HIV-1 envelope glycoprotein. Curr. Biol. 1996, 6, 315–324. [Google Scholar] [CrossRef] [PubMed]
- Ngumbela, K.C.; Ryan, K.P.; Sivamurthy, R.; Brockman, M.A.; Gandhi, R.T.; Bhardwaj, N.; Kavanagh, D.G. , Quantitative Effect of Suboptimal Codon Usage on Translational Efficiency of mRNA Encoding HIV-1 gag in Intact T Cells. PLoS ONE 2008, 3, e2356. [Google Scholar] [CrossRef] [PubMed]
- van Weringh, A.; Ragonnet-Cronin, M.; Pranckeviciene, E.; Pavon-Eternod, M.; Kleiman, L.; Xia, X. , HIV-1 Modulates the tRNA Pool to Improve Translation Efficiency. Molecular Biology and Evolution 2011, 28, 1827–1834. [Google Scholar] [CrossRef]
- Akashi, H. , Synonymous codon usage in Drosophila melanogaster: natural selection and translational accuracy. Genetics 1994, 136, 927–935. [Google Scholar] [CrossRef]
- Xia, X. , The cost of wobble translation in fungal mitochondrial genomes: integration of two traditional hypotheses. BMC Evol. Biol. 2008, 8, 211. [Google Scholar] [CrossRef] [PubMed]
- Moriyama, E.N.; Powell, J.R. , Codon usage bias and tRNA abundance in Drosophila. J. Mol. Evol. 1997, 45, 514–523. [Google Scholar] [CrossRef] [PubMed]
- Ran, W.; Higgs, P.G. , Contributions of speed and accuracy to translational selection in bacteria. PLoS One 2012, 7, e51652. [Google Scholar] [CrossRef] [PubMed]
- Sharp, P.M.; Li, W.H. , The codon Adaptation Index--a measure of directional synonymous codon usage bias, and its potential applications. Nucleic Acids Res 1987, 15, 1281–1295. [Google Scholar] [CrossRef] [PubMed]
- Xia, X. , An Improved Implementation of Codon Adaptation Index. Evolutionary Bioinformatics 2007, 3, 53–58. [Google Scholar] [CrossRef] [PubMed]
- Sun, X.Y.; Yang, Q.; Xia, X. , An Improved Implementation of Effective Number of Codons (Nc). Molecular Biology and Evolution 2013, 30, 191–196. [Google Scholar] [CrossRef] [PubMed]
- Davies, J.; Jones, D.S.; Khorana, H.G. , A further study of misreading of codons induced by streptomycin and neomycin using ribopolynucleotides containing two nucleotides in alternating sequence as templates. J Mol Biol 1966, 18, 48–57. [Google Scholar] [CrossRef] [PubMed]
- Ryden, S.M.; Isaksson, L.A. , A temperature-sensitive mutant of Escherichia coli that shows enhanced misreading of UAG/A and increased efficiency for some tRNA nonsense suppressors. Mol Gen Genet 1984, 193, 38–45. [Google Scholar] [CrossRef] [PubMed]
- Roth, J.R. , UGA nonsense mutations in Salmonella typhimurium. J Bacteriol 1970, 102, 467–475. [Google Scholar] [CrossRef]
- Sambrook, J.F.; Fan, D.P.; Brenner, S. , A strong suppressor specific for UGA. Nature 1967, 214, 452–453. [Google Scholar] [CrossRef]
- Strigini, P.; Brickman, E. , Analysis of specific misreading in Escherichia coli. J Mol Biol 1973, 75, 659–672. [Google Scholar] [CrossRef] [PubMed]
- Bossi, L. , Context effects: translation of UAG codon by suppressor tRNA is affected by the sequence following UAG in the message. J Mol Biol 1983, 164, 73–87. [Google Scholar] [CrossRef] [PubMed]
- Bossi, L.; Roth, J.R. , The influence of codon context on genetic code translation. Nature 1980, 286, 123. [Google Scholar] [CrossRef] [PubMed]
- Miller, J.H.; Albertini, A.M. , Effects of surrounding sequence on the suppression of nonsense codons. J Mol Biol 1983, 164, 59–71. [Google Scholar] [CrossRef] [PubMed]
- Geller, A.I.; Rich, A. , A UGA termination suppression tRNATrp active in rabbit reticulocytes. Nature 1980, 283, 41–46. [Google Scholar] [CrossRef] [PubMed]
- Jorgensen, F.; Adamski, F.M.; Tate, W.P.; Kurland, C.G. , Release factor-dependent false stops are infrequent in Escherichia coli. J Mol Biol 1993, 230, 41–50. [Google Scholar] [CrossRef] [PubMed]
- Parker, J. , Errors and alternatives in reading the universal genetic code. Microbiol Rev 1989, 53, 273–298. [Google Scholar] [CrossRef] [PubMed]
- Tate, W.P.; Mansell, J.B.; Mannering, S.A.; Irvine, J.H.; Major, L.L.; Wilson, D.N. , UGA: a dual signal for 'stop' and for recoding in protein synthesis. Biochemistry (Mosc) 1999, 64, 1342–1353. [Google Scholar]
- César Sánchez, J.; Padrón, G.; Santana, H.; Herrera, L. , Elimination of an HuIFN alpha 2b readthrough species, produced in Escherichia coli, by replacing its natural translational stop signal. J Biotechnol 1998, 63, 179–186. [Google Scholar] [CrossRef]
- Meng, S.Y.; Hui, J.O.; Haniu, M.; Tsai, L.B. , Analysis of translational termination of recombinant human methionyl-neurotrophin 3 in Escherichia coli. Biochem Biophys Res Commun 1995, 211, 40–48. [Google Scholar] [CrossRef]
- Wei, Y.; Wang, J.; Xia, X. , Coevolution between Stop Codon Usage and Release Factors in Bacterial Species. Molecular Biology and Evolution 2016, 33, 2357–2367. [Google Scholar] [CrossRef]
- Tate, W.P.; Brown, C.M. , Translational termination: "stop" for protein synthesis or "pause" for regulation of gene expression. Biochemistry (Mosc). 1992, 31, 2443–2450. [Google Scholar] [CrossRef]
- Tate, W.P.; Mannering, S.A. , Three, four or more: the translational stop signal at length. Mol. Microbiol. 1996, 21, 213–219. [Google Scholar] [CrossRef]
- Wei, Y.; Xia, X. , The Role of +4U as an Extended Translation Termination Signal in Bacteria. Genetics 2017, 205, 539–549. [Google Scholar] [CrossRef]
- Konecki, D.S.; Aune, K.C.; Tate, W.; Caskey, C.T. , Characterization of reticulocyte release factor. J. Biol. Chem. 1977, 252, 4514–4520. [Google Scholar] [CrossRef]
- McCaughan, K.K.; Brown, C.M.; Dalphin, M.E.; Berry, M.J.; Tate, W.P. , Translational termination efficiency in mammals is influenced by the base following the stop codon. Proc. Natl. Acad. Sci. U S A 1995, 92, 5431–5435. [Google Scholar] [CrossRef]
- Brown, C.M.; Stockwell, P.A.; Trotman, C.N.; Tate, W.P. , Sequence analysis suggests that tetra-nucleotides signal the termination of protein synthesis in eukaryotes. Nucleic Acids Res 1990, 18, 6339–6345. [Google Scholar] [CrossRef]
- Xia, X. , Bioinformatics and Translation Termination in Bacteria. In Bioinformatics and the Cell: modern computational approaches in genomics, proteomics and transcriptomics, Springer, Cham: Switzerland, 2018; pp 239-254.
- Craigen, W.J.; Caskey, C.T. , Expression of peptide chain release factor 2 requires high-efficiency frameshift. Nature 1986, 322, 273–275. [Google Scholar] [CrossRef]
- Craigen, W.J.; Cook, R.G.; Tate, W.P.; Caskey, C.T. , Bacterial peptide chain release factors: conserved primary structure and possible frameshift regulation of release factor 2. Proc. Natl. Acad. Sci. U S A 1985, 82, 3616–3620. [Google Scholar] [CrossRef]
- Curran, J.F.; Yarus, M. , Use of tRNA suppressors to probe regulation of Escherichia coli release factor 2. J Mol Biol 1988, 203, 75–83. [Google Scholar] [CrossRef]
- Weaver, R.F. , Molecular Biology., 5th ed.; McGraw-Hill: Boston, 2012. [Google Scholar]
- Sharp, P.M.; Bailes, E.; Grocock, R.J.; Peden, J.F.; Sockett, R.E. , Variation in the strength of selected codon usage bias among bacteria. Nucleic Acids Res 2005, 33, 1141–1153. [Google Scholar] [CrossRef]
- Klappenbach, J.A.; Dunbar, J.M.; Schmidt, T.M. , rRNA operon copy number reflects ecological strategies of bacteria. Appl Environ Microbiol 2000, 66, 1328–1333. [Google Scholar] [CrossRef]
- Rocha, E.P. , Codon usage bias from tRNA's point of view: redundancy, specialization, and efficient decoding for translation optimization. Genome Res. 2004, 14, 2279–2286. [Google Scholar] [CrossRef]
- Kjeldgaard, N.; Kurland, C. , The distribution of soluble and ribosomal RNA as a function of growth rate. J. Mol. Biol. 1963, 6, 341–348. [Google Scholar] [CrossRef]
- Moller, S.; Kristensen, C.S.; Poulsen, L.K.; Carstensen, J.M.; Molin, S. , Bacterial growth on surfaces: automated image analysis for quantification of growth rate-related parameters. Appl Environ Microbiol 1995, 61, 741–748. [Google Scholar] [CrossRef]
- Poulsen, L.K.; Ballard, G.; Stahl, D.A. , Use of rRNA fluorescence in situ hybridization for measuring the activity of single cells in young and established biofilms. Appl Environ Microbiol 1993, 59, 1354–1360. [Google Scholar] [CrossRef]
- Schaechter, M.; Maaloe, O.; Kjeldgaard, N.O. , Dependency on medium and temperature of cell size and chemical composition during balanced grown of Salmonella typhimurium. J Gen Microbiol 1958, 19, 592–606. [Google Scholar] [CrossRef]
- Yang, L.; Haagensen, J.A.; Jelsbak, L.; Johansen, H.K.; Sternberg, C.; Høiby, N.; Molin, S. , In situ growth rates and biofilm development of Pseudomonas aeruginosa populations in chronic lung infections. J Bacteriol 2008, 190, 2767–2776. [Google Scholar] [CrossRef]
- Ran, W.; Kristensen, D.M.; Koonin, E.V. , Coupling between protein level selection and codon usage optimization in the evolution of bacteria and archaea. MBio 2014, 5, e00956–e00914. [Google Scholar] [CrossRef]
- Xia, X. , DAMBE6: New Tools for Microbial Genomics, Phylogenetics, and Molecular Evolution. J Hered 2017, 108, 431–437. [Google Scholar] [CrossRef]
- Xia, X. Xia, X., Rapid evolution of animal mitochondria. In Evolution in the fast lane: Rapidly evolving genes and genetic systems, Singh, R.S.; Xu, J.; Kulathinal, R.J., Eds. Oxford University Press: Oxford, 2012; pp 73-82.
- Xia, X.; Huang, H.; Carullo, M.; Betran, E.; Moriyama, E.N. , Conflict between Translation Initiation and Elongation in Vertebrate Mitochondrial Genomes. PLoS ONE 2007, 2, e227. [Google Scholar] [CrossRef] [PubMed]
- Wang, H.C.; Xia, X.; Hickey, D.A. , Thermal adaptation of ribosomal RNA genes: a comparative study. J. Mol. Evol. 2006, 63, 120–126. [Google Scholar] [CrossRef] [PubMed]
- Hockenberry, A.J.; Stern, A.J.; Amaral, L.A.N.; Jewett, M.C. , Diversity of Translation Initiation Mechanisms across Bacterial Species Is Driven by Environmental Conditions and Growth Demands. Molecular Biology and Evolution 2017, 35, 582–592. [Google Scholar] [CrossRef] [PubMed]
- Eagon, R.G. , Pseudomonas natriegens, a marine bacterium with a generation time of less than 10 minutes. J Bacteriol 1962, 83, 736–737. [Google Scholar] [CrossRef] [PubMed]
- Yin, M.; Ye, B.; Jin, Y.; Liu, L.; Zhang, Y.; Li, P.; Wang, Y.; Li, Y.; Han, Y.; Shen, W. , et al. , Changes in Vibrio natriegens Growth Under Simulated Microgravity. Frontiers in microbiology 2020, 11, 2040. [Google Scholar]
- Dryselius, R.; Izutsu, K.; Honda, T.; Iida, T. , Differential replication dynamics for large and small Vibrio chromosomes affect gene dosage, expression and location. BMC Genomics 2008, 9, 559. [Google Scholar] [CrossRef] [PubMed]
- Sezonov, G.; Joseleau-Petit, D.; D'Ari, R. , Escherichia coli physiology in Luria-Bertani broth. J Bacteriol 2007, 189, 8746–8749. [Google Scholar] [CrossRef] [PubMed]
- Sharpe, M.E.; Hauser, P.M.; Sharpe, R.G.; Errington, J. , Bacillus subtilis cell cycle as studied by fluorescence microscopy: constancy of cell length at initiation of DNA replication and evidence for active nucleoid partitioning. J Bacteriol 1998, 180, 547–555. [Google Scholar] [CrossRef] [PubMed]
- Artman, M.; Domenech, E.; Weiner, M. , Growth of Haemophilus influenzae in simulated blood cultures supplemented with hemin and NAD. J Clin Microbiol 1983, 18, 376–379. [Google Scholar] [CrossRef]
- Cook, G.M.; Berney, M.; Gebhard, S.; Heinemann, M.; Cox, R.A.; Danilchanka, O.; Niederweis, M. , Physiology of mycobacteria. Adv Microb Physiol 2009, 55, 81–182, 318-189.
- Cortes, M.A.; Nessar, R.; Singh, A.K. , Laboratory maintenance of Mycobacterium abscessus. Current protocols in microbiology 2010, Chapter 10, Unit 10D.11.
- Cole, S.T. , Comparative and functional genomics of the Mycobacterium tuberculosis complex. Microbiology 2002, 148, 2919–2928. [Google Scholar] [CrossRef]
- Zhu, M.; Dai, X. , On the intrinsic constraint of bacterial growth rate: M. tuberculosis’s view of the protein translation capacity. Crit. Rev. Microbiol. 2018, 44, 455–464.
- Gengenbacher, M.; Kaufmann, S.H. , Mycobacterium tuberculosis: success through dormancy. FEMS Microbiol Rev 2012, 36, 514–532. [Google Scholar] [CrossRef]
- Change, Y.T.; Andersen, R.N.; Vaituzis, Z. , Growth of Mycobacterium lepraemurium in cultures of mouse peritoneal macrophages. J Bacteriol 1967, 93, 1119–1131. [Google Scholar] [CrossRef]
- Andrews, J.H.; Harris, R.F. , r- and K-Selection and Microbial Ecology. In Advances in Microbial Ecology, Marshall, K.C., Ed. Springer US: Boston, MA, 1986; pp 99-147.
- Brzeszcz, J.; Steliga, T.; Kapusta, P.; Turkiewicz, A.; Kaszycki, P. , r-strategist versus K-strategist for the application in bioremediation of hydrocarbon-contaminated soils. International Biodeterioration & Biodegradation 2016, 106, 41–52.
- Xia, X. , DAMBE7: New and improved tools for data analysis in molecular biology and evolution. Molecular Biology and Evolution 2018, 35, 1550–1552. [Google Scholar] [CrossRef]
- Hofacker, I.L. , Vienna RNA secondary structure server. Nucleic Acids Res 2003, 31, 3429–3431. [Google Scholar] [CrossRef] [PubMed]
- Xia, X. , Bioinformatics and Translation Initiation. In Bioinformatics and the Cell: modern computational approaches in genomics, proteomics and transcriptomics, Springer, Cham: Switzerland, 2018; pp 173-195.
- Gausing, K. , Regulation of ribosome production in Escherichia coli: synthesis and stability of ribosomal RNA and of ribosomal protein messenger RNA at different growth rates. J Mol Biol 1977, 115, 335–354. [Google Scholar] [CrossRef] [PubMed]
- Verma, A.; Sampla, A.K.; Tyagi, J.S. , Mycobacterium tuberculosis rrn promoters: differential usage and growth rate-dependent control. J Bacteriol 1999, 181, 4326–4333. [Google Scholar] [CrossRef] [PubMed]
- Deutscher, M.P. , Twenty years of bacterial RNases and RNA processing: how we've matured. RNA 2015, 21, 597–600. [Google Scholar] [CrossRef]
- Keener, J.; Nomura, M. Keener, J.; Nomura, M., Regulation of ribosome synthesis. In Escherichia coli and Salmonella: cellular and molecular biology, Neidhardt, F.C.; III, R.C.; Ingraham, J.L.; Lin, E.C.C.; Low, K.B.; Magasanik, B.; Reznikoff, W.S.; Riley, M.; Schaechter, M.; Umbarger, J.E., Eds. ASM Press,: Washington, D.C., 1996; Vol. 1, pp 1417-1428.
- Murray, H.D.; Appleman, J.A.; Gourse, R.L. , Regulation of the Escherichia coli rrnB P2 promoter. J Bacteriol 2003, 185, 28–34. [Google Scholar] [CrossRef]
- Nomura, M.; Gourse, R.; Baughman, G. , Regulation of the synthesis of ribosomes and ribosomal components. Annu Rev Biochem 1984, 53, 75–117. [Google Scholar] [CrossRef]
- Du, M.-Z.; Wei, W.; Qin, L.; Liu, S.; Zhang, A.-Y.; Zhang, Y.; Zhou, H.; Guo, F.-B. , Co-adaption of tRNA gene copy number and amino acid usage influences translation rates in three life domains. DNA Res. 2017, 24, 623–633. [Google Scholar] [CrossRef]
- Hecht, A.; Glasgow, J.; Jaschke, P.R.; Bawazer, L.A.; Munson, M.S.; Cochran, J.R.; Endy, D.; Salit, M. , Measurements of translation initiation from all 64 codons in E. coli. Nucleic Acids Res 2017, 45, 3615–3626. [Google Scholar] [CrossRef]
- Hartz, D.; McPheeters, D.S.; Gold, L. , Influence of mRNA determinants on translation initiation in Escherichia coli. J Mol Biol 1991, 218, 83–97. [Google Scholar] [CrossRef] [PubMed]
- Belinky, F.; Rogozin, I.B.; Koonin, E.V. , Selection on start codons in prokaryotes and potential compensatory nucleotide substitutions. Scientific reports 2017, 7, 12422. [Google Scholar] [CrossRef] [PubMed]
- Wright, F. , The 'effective number of codons' used in a gene. Gene 1990, 87, 23–29. [Google Scholar] [CrossRef]
- Xia, X. , Characterizing translation efficiency. In Bioinformatics and the Cell: Modern Computational Approaches in Genomics, Proteomics and Transcriptomics, Xia, X., Ed. Springer US: Boston, MA, 2007; pp 173-206.
- Palidwor, G.A.; Perkins, T.J.; Xia, X. , A general model of codon bias due to GC mutational bias. PLoS One 2010, 5, e13431. [Google Scholar] [CrossRef]
- Carullo, M.; Xia, X. , An Extensive Study of Mutation and Selection on the Wobble Nucleotide in tRNA Anticodons in Fungal Mitochondrial Genomes. J. Mol. Evol. 2008, 66, 484–493. [Google Scholar] [CrossRef]
- Wei, Y.; Silke, J.R.; Xia, X. , An improved estimation of tRNA expression to better elucidate the coevolution between tRNA abundance and codon usage in bacteria. Scientific reports 2019, 9, 3184. [Google Scholar] [CrossRef]
- de Smit, M.H.; van Duin, J. , Control of prokaryotic translational initiation by mRNA secondary structure. Prog Nucleic Acid Res Mol Biol 1990, 38, 1–35. [Google Scholar] [PubMed]
- Scharff, L.B.; Childs, L.; Walther, D.; Bock, R. , Local absence of secondary structure permits translation of mRNAs that lack ribosome-binding sites. PLoS Genet 2011, 7, e1002155. [Google Scholar] [CrossRef]
- Xia, X.; MacKay, V.; Yao, X.; Wu, J.; Miura, F.; Ito, T.; Morris, D.R. , Translation Initiation: A Regulatory Role for Poly(A) Tracts in Front of the AUG Codon in Saccharomyces cerevisiae. Genetics 2011, 189, 469–478. [Google Scholar] [CrossRef]
- Xia, X.; Holcik, M. , Strong Eukaryotic IRESs Have Weak Secondary Structure. PLoS ONE 2009, 4, e4136. [Google Scholar] [CrossRef]
- Li, W.-H. , Evolution of duplicate genes and pseudogenes. Sinauer: Sunderland, MA, 1983; p 14-37.
- Li, W.H.; Gojobori, T.; Nei, M. , Pseudogenes as a paradigm of neutral evolution. Nature 1981, 292, 237–239. [Google Scholar] [CrossRef]
- Hershberg, R.; Petrov, D.A. , Evidence That Mutation Is Universally Biased towards AT in Bacteria. PLOS Genetics 2010, 6, e1001115. [Google Scholar] [CrossRef]
- Lind, P.A.; Andersson, D.I. , Whole-genome mutational biases in bacteria. Proc. Natl. Acad. Sci. U S A 2008, 105, 17878–17883. [Google Scholar] [CrossRef]
- Muto, A.; Osawa, S. , The guanine and cytosine content of genomic DNA and bacterial evolution. Proc. Natl. Acad. Sci. USA. 1987, 84, 166–169. [Google Scholar] [CrossRef]
- Mukherjee, T.; Goswami, A.; Chakraborty, U.; Majumdar, M.; Sinha, S.; Pal, N.K. , A Study on Generation Time of Sensitive and Resistant Mycobacterium tuberculosis Isolates. J Evolution Med Dent. Sci. 2019, 8, 2489–2494. [Google Scholar] [CrossRef]
- Gibson, B.; Wilson, D.J.; Feil, E.; Eyre-Walker, A. , The distribution of bacterial doubling times in the wild. Proc Biol Sci 2018, 285. [Google Scholar] [CrossRef] [PubMed]
- Waites, K.B.; Talkington, D.F. , Mycoplasma pneumoniae and its role as a human pathogen. Clin Microbiol Rev 2004, 17, 697–728, table of contents.
- Kashyap, S.; Sarkar, M. , Mycoplasma pneumonia: Clinical features and management. Lung India 2010, 27, 75–85. [Google Scholar] [CrossRef] [PubMed]
- Felsenstein, J. , Phylogenies and the comparative method. Amer. Nat. 1985, 125, 1–15. [Google Scholar] [CrossRef]
- Harvey, P.H.; Pagel, M.D. , The comparative method in evolutionary biology. Oxford University Press: Oxford., 1991.
- Xia, X. , Comparative genomics. Springer: Berlin/Heidelberg, Germany, 2013; p VIII, 67 p.
- Xia, X. , Body temperature, rate of biosynthesis and evolution of genome size. Molecular Biology and Evolution 1995, 12, 834–842. [Google Scholar]
- Xia, X. , Horizontal Gene Transfer and Drug Resistance Involving Mycobacterium tuberculosis. Antibiotics 2023, 12, 1367. [Google Scholar] [CrossRef] [PubMed]
- Gualerzi, C.O.; Pon, C.L. , Initiation of mRNA translation in bacteria: structural and dynamic aspects. Cell Mol Life Sci 2015, 72, 4341–4367. [Google Scholar] [CrossRef] [PubMed]
- Maitra, A.; Dill, K.A. , Bacterial growth laws reflect the evolutionary importance of energy efficiency. Proceedings of the National Academy of Sciences 2015, 112, 406–411. [Google Scholar] [CrossRef] [PubMed]
- Rodnina, M.V. , Translation in Prokaryotes. Cold Spring Harb Perspect Biol 2018, 10. [Google Scholar] [CrossRef] [PubMed]
- Xia, X. , Maximizing transcription efficiency causes codon usage bias. Genetics 1996, 144, 1309–1320. [Google Scholar] [CrossRef] [PubMed]
- Xia, X.; Wang, H.; Xie, Z.; Carullo, M.; Huang, H.; Hickey, D. , Cytosine usage modulates the correlation between CDS length and CG content in prokaryotic genomes. Molecular Biology and Evolution 2006, 23, 1450–1454. [Google Scholar] [CrossRef] [PubMed]
- Takata, M.A.; Gonçalves-Carneiro, D.; Zang, T.M.; Soll, S.J.; York, A.; Blanco-Melo, D.; Bieniasz, P.D. , CG dinucleotide suppression enables antiviral defence targeting non-self RNA. Nature 2017, 550, 124–127. [Google Scholar] [CrossRef] [PubMed]
- Ficarelli, M.; Antzin-Anduetza, I.; Hugh-White, R.; Firth, A.E.; Sertkaya, H.; Wilson, H.; Neil, S.J.D.; Schulz, R.; Swanson, C.M. , CpG Dinucleotides Inhibit HIV-1 Replication through Zinc Finger Antiviral Protein (ZAP)-Dependent and -Independent Mechanisms. J Virol 2020, 94. [Google Scholar] [CrossRef] [PubMed]
- Ficarelli, M.; Wilson, H.; Pedro Galão, R.; Mazzon, M.; Antzin-Anduetza, I.; Marsh, M.; Neil, S.J.; Swanson, C.M. , KHNYN is essential for the zinc finger antiviral protein (ZAP) to restrict HIV-1 containing clustered CpG dinucleotides. eLife 2019, 8. [Google Scholar]
- Meagher, J.L.; Takata, M.; Gonçalves-Carneiro, D.; Keane, S.C.; Rebendenne, A.; Ong, H.; Orr, V.K.; MacDonald, M.R.; Stuckey, J.A.; Bieniasz, P.D.; et al. Structure of the zinc-finger antiviral protein in complex with RNA reveals a mechanism for selective targeting of CG-rich viral sequences. Proc. Natl. Acad. Sci. U S A 2019, 116, 24303–24309. [Google Scholar] [CrossRef]
- Nchioua, R.; Kmiec, D.; Müller, J.A.; Conzelmann, C.; Groß, R.; Swanson, C.M.; Neil, S.J.D.; Stenger, S.; Sauter, D.; Münch, J.; et al. SARS-CoV-2 Is Restricted by Zinc Finger Antiviral Protein despite Preadaptation to the Low-CpG Environment in Humans. MBio 2020, 11. [Google Scholar] [CrossRef] [PubMed]
- Xia, X. , Extreme genomic CpG deficiency in SARS-CoV-2 and evasion of host antiviral defense. Molecular Biology and Evolution 2020, 37, 2699–2705. [Google Scholar] [CrossRef] [PubMed]
- Wei, Y.; Silke, J.R.; Aris, P.; Xia, X. , Coronavirus genomes carry the signatures of their habitats. PLoS One 2020, 15, e0244025. [Google Scholar] [CrossRef] [PubMed]
- Betney, R.; de Silva, E.; Krishnan, J.; Stansfield, I. , Autoregulatory systems controlling translation factor expression: thermostat-like control of translational accuracy. RNA 2010, 16, 655–663. [Google Scholar] [CrossRef] [PubMed]
Figure 1.
Fitted nonlinear equations. (A) Relationship between Nrrn and RankGT in Table 2. (B) Relationship between NtRNA and RankGT in Table 2.
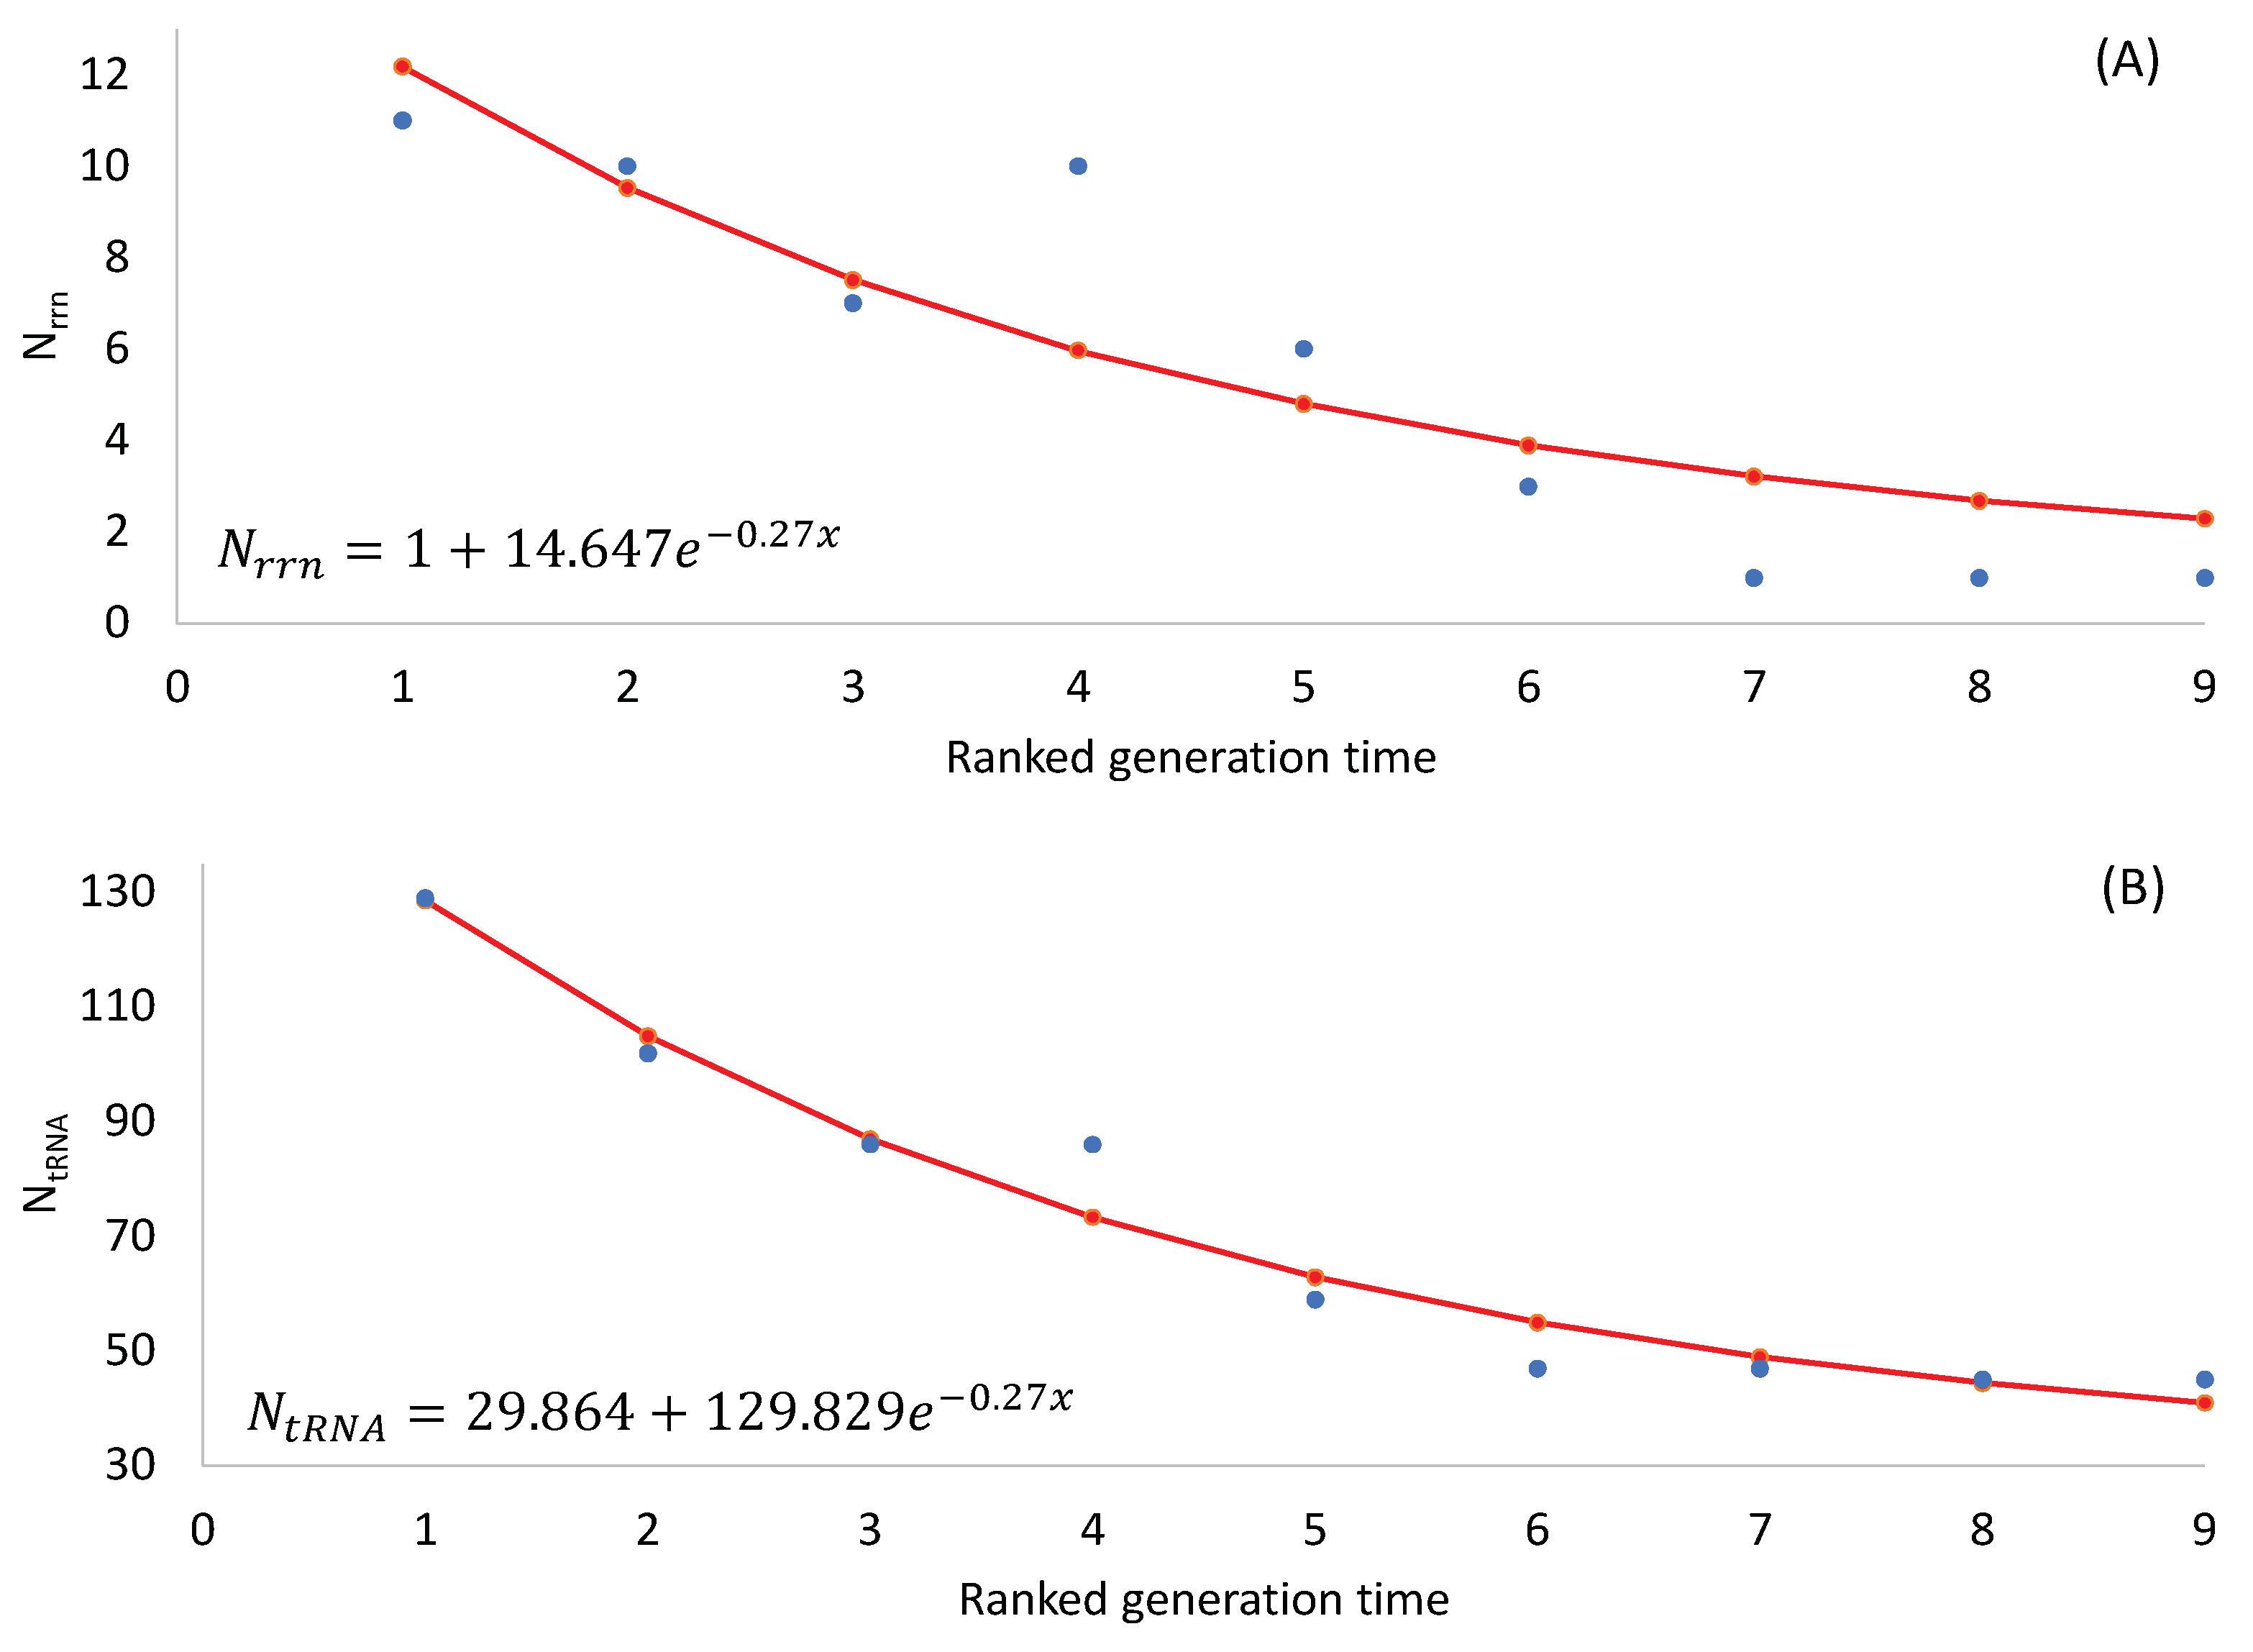
Figure 2.
Selection for codon optimization, measured by ranked ( in Eq. (7), decreases with increasing generation time in nine bacterial species.
Figure 2.
Selection for codon optimization, measured by ranked ( in Eq. (7), decreases with increasing generation time in nine bacterial species.
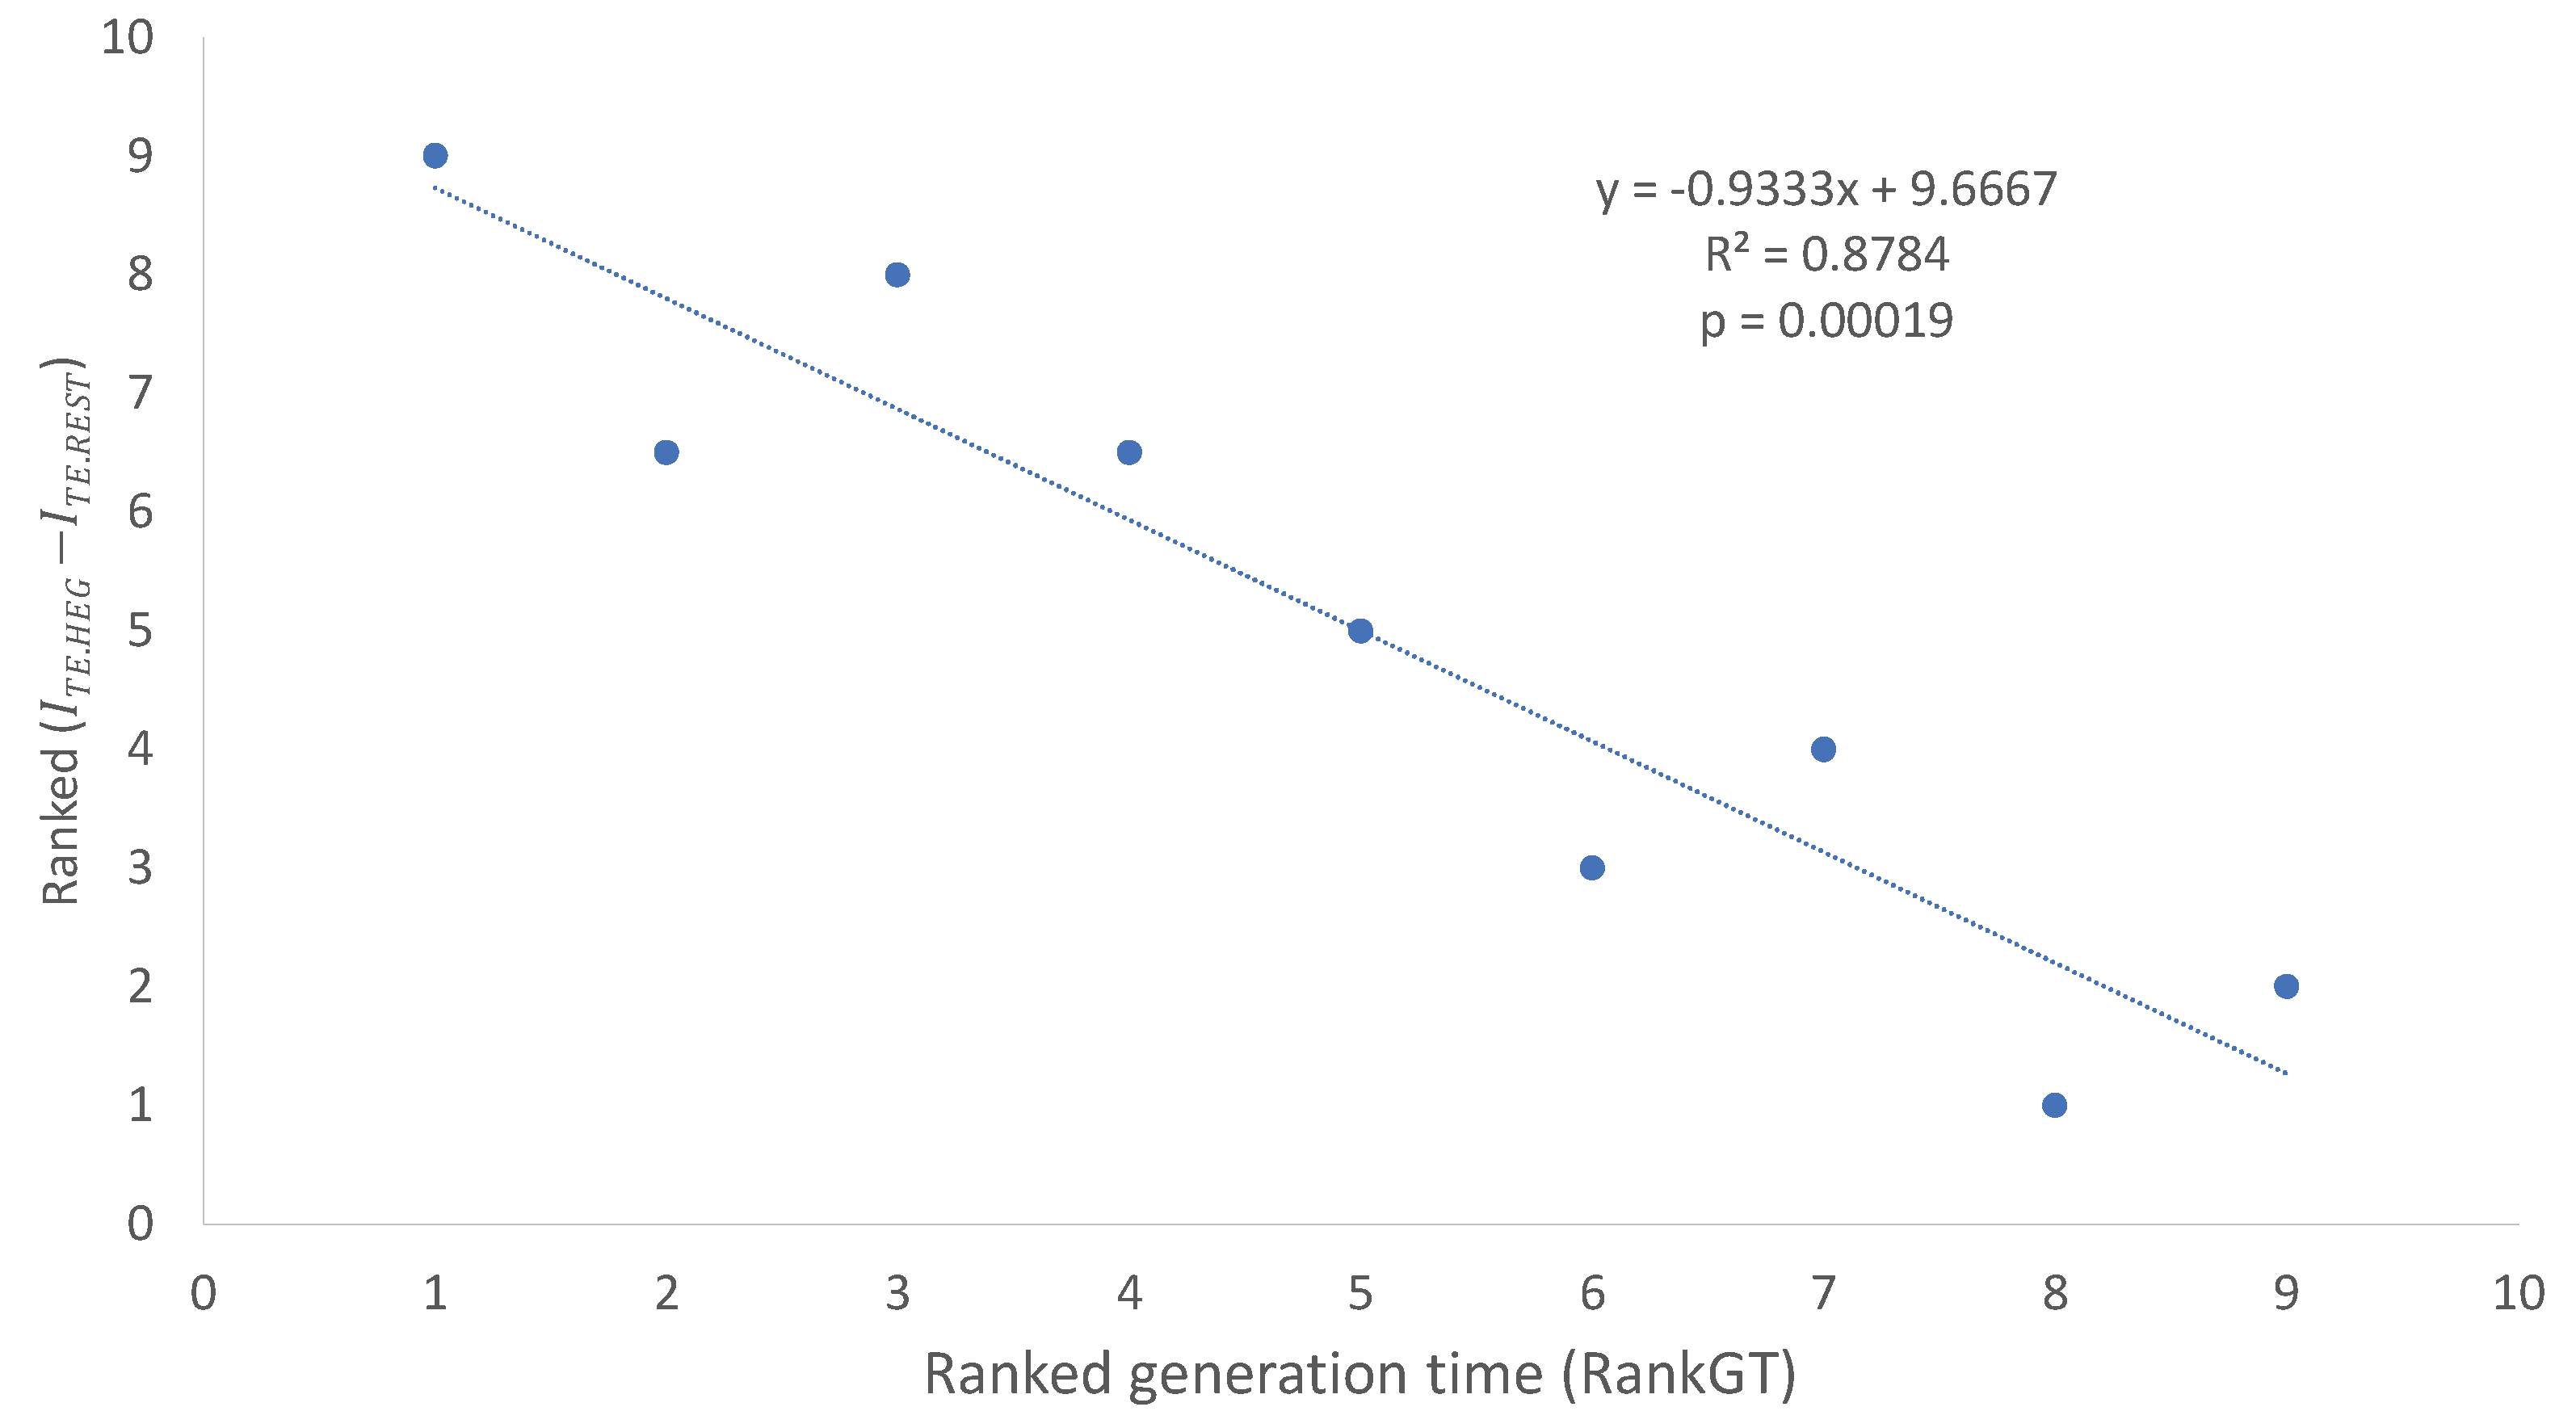
Figure 3.
The ranked effective number of anticodons (Rank NAC) increases with ranked generation time (RankGT) (A) and decreases with gene expression (Rank in Table 7)
Figure 3.
The ranked effective number of anticodons (Rank NAC) increases with ranked generation time (RankGT) (A) and decreases with gene expression (Rank in Table 7)
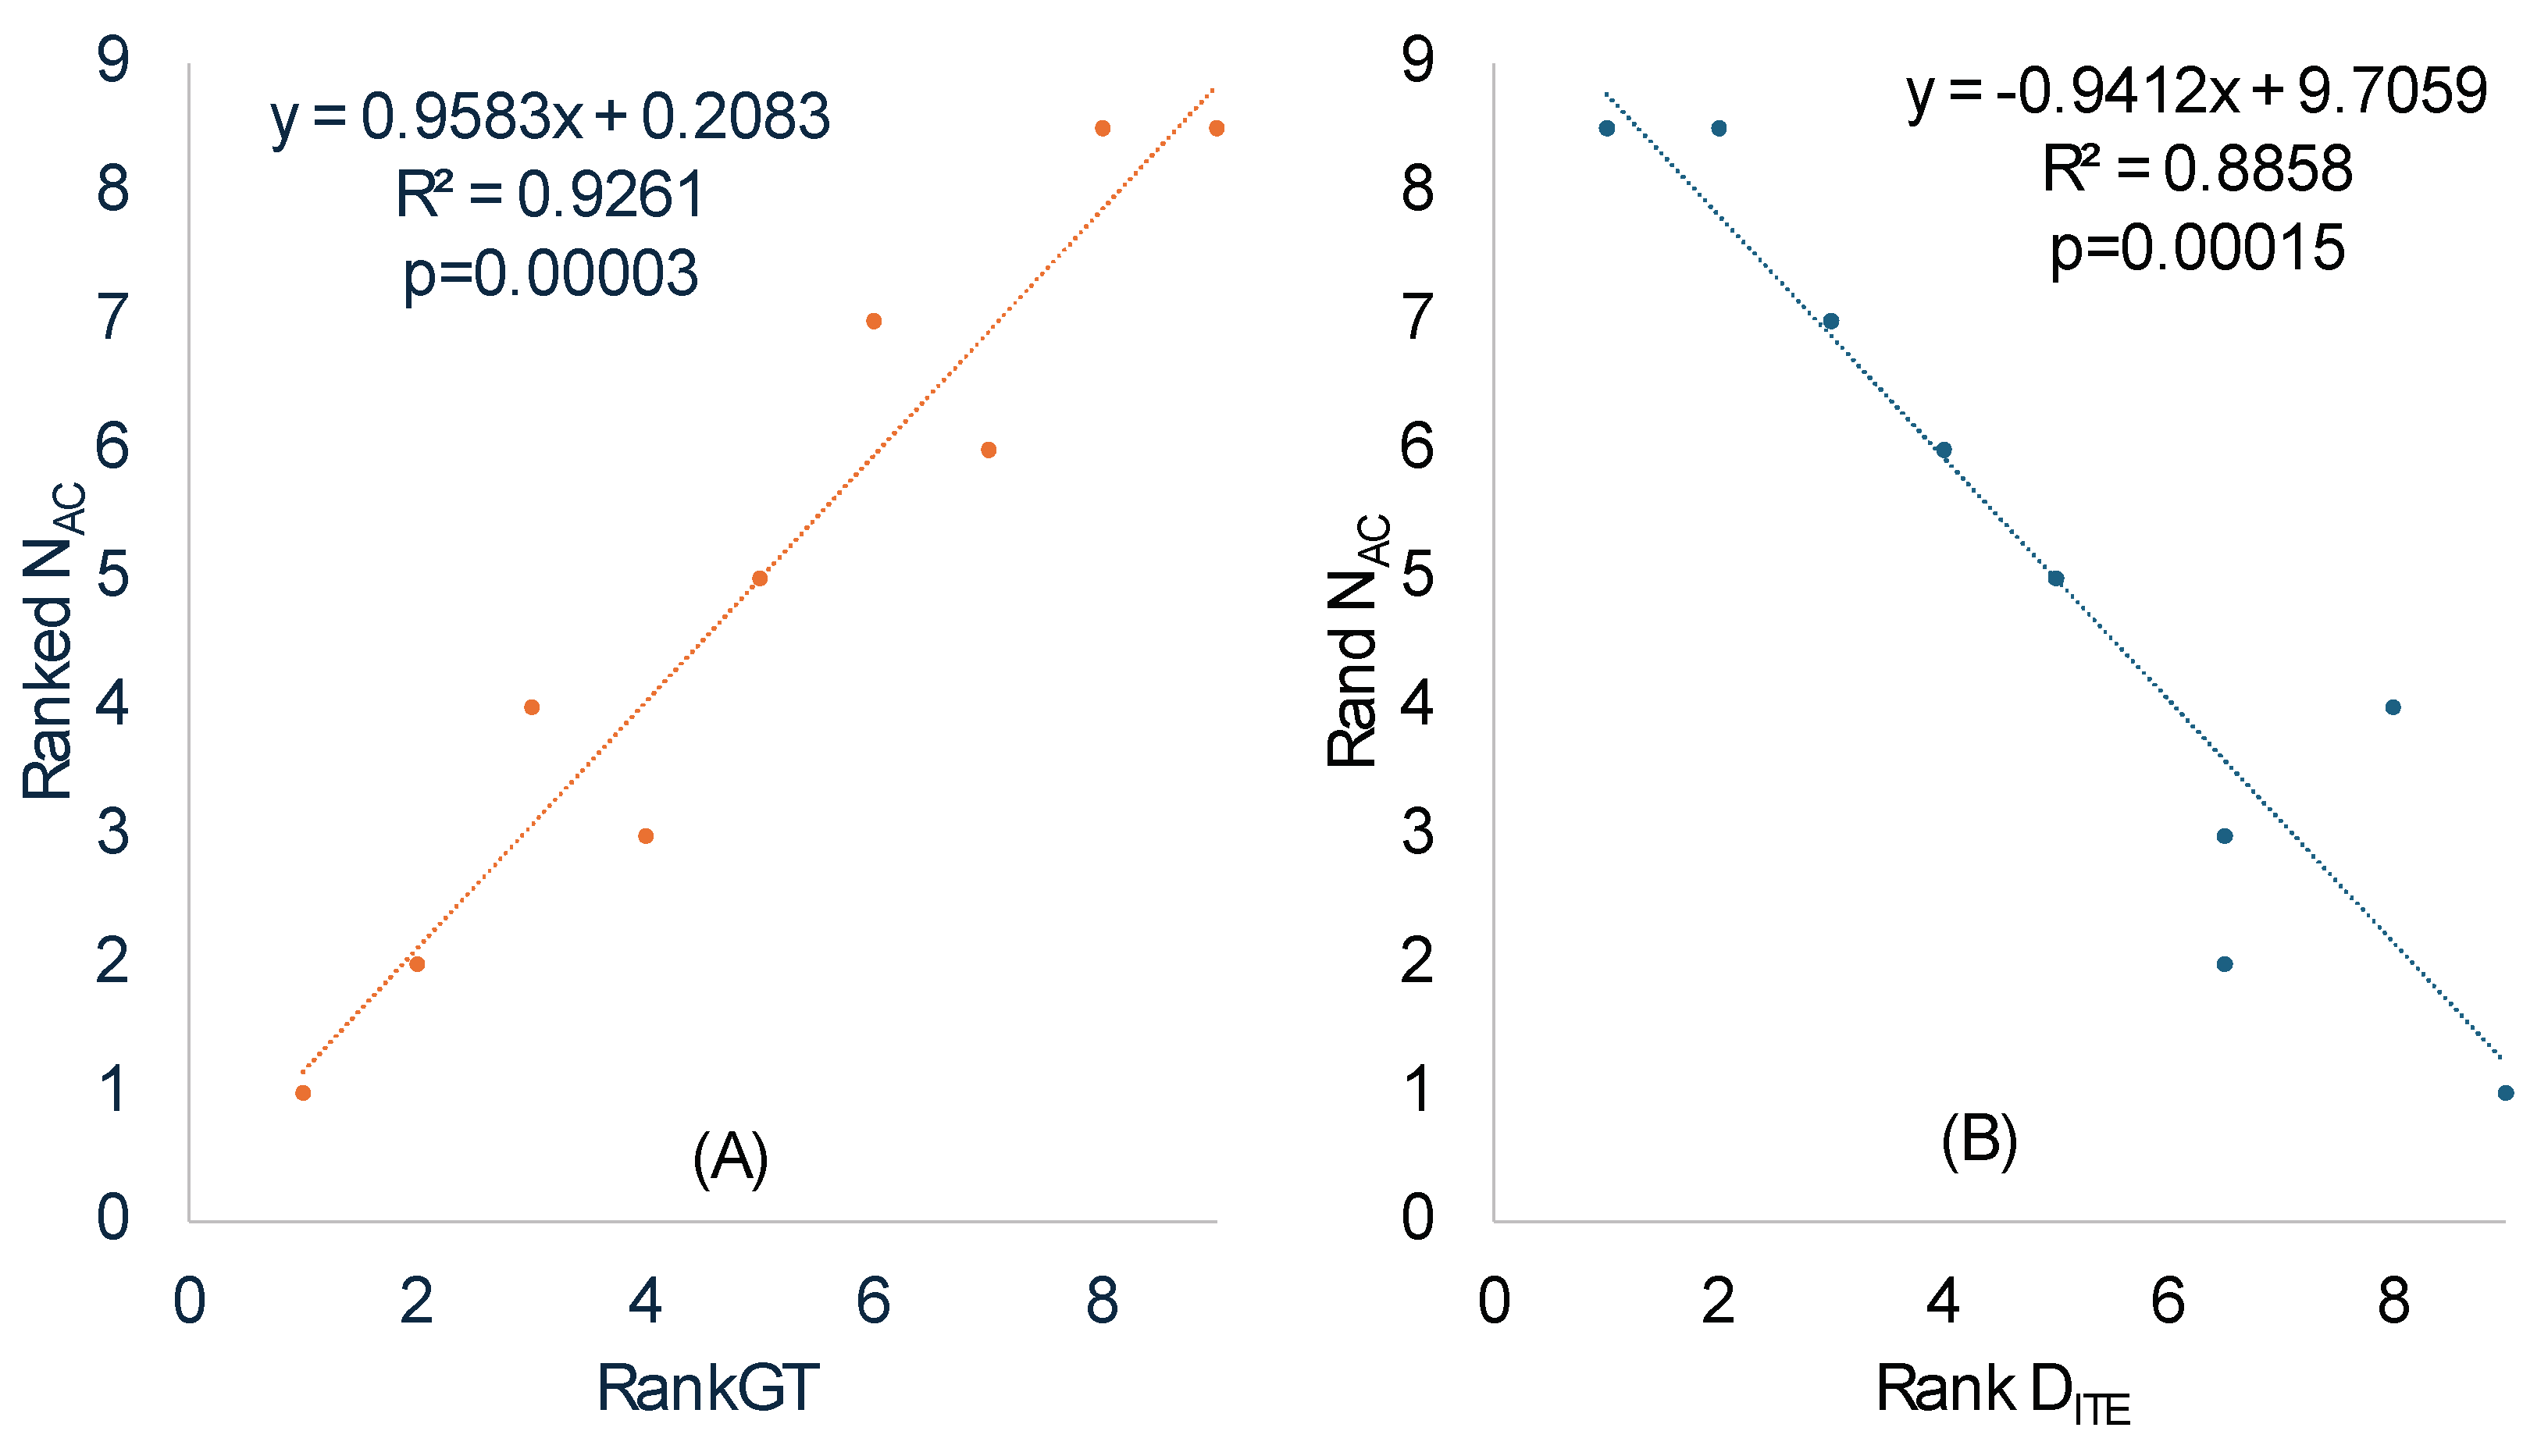
Figure 4.
Change of MFE (minimum folding energy) over a sliding window of 40 nt in HEGs of the nine bacterial species (one sub-figure for each species). The start codon occupies sites 61-63. The Mid-window site (horizontal axis) indicates the middle of the sliding window of 40 nt. The middle blue curve is the mean MFE of all HEGs (e.g., each point in the mean curve for V. nitriegens is the average of 76 HEGs). The two curves above and below the mean curve are the 95% upper and lower limits (UL and LL).
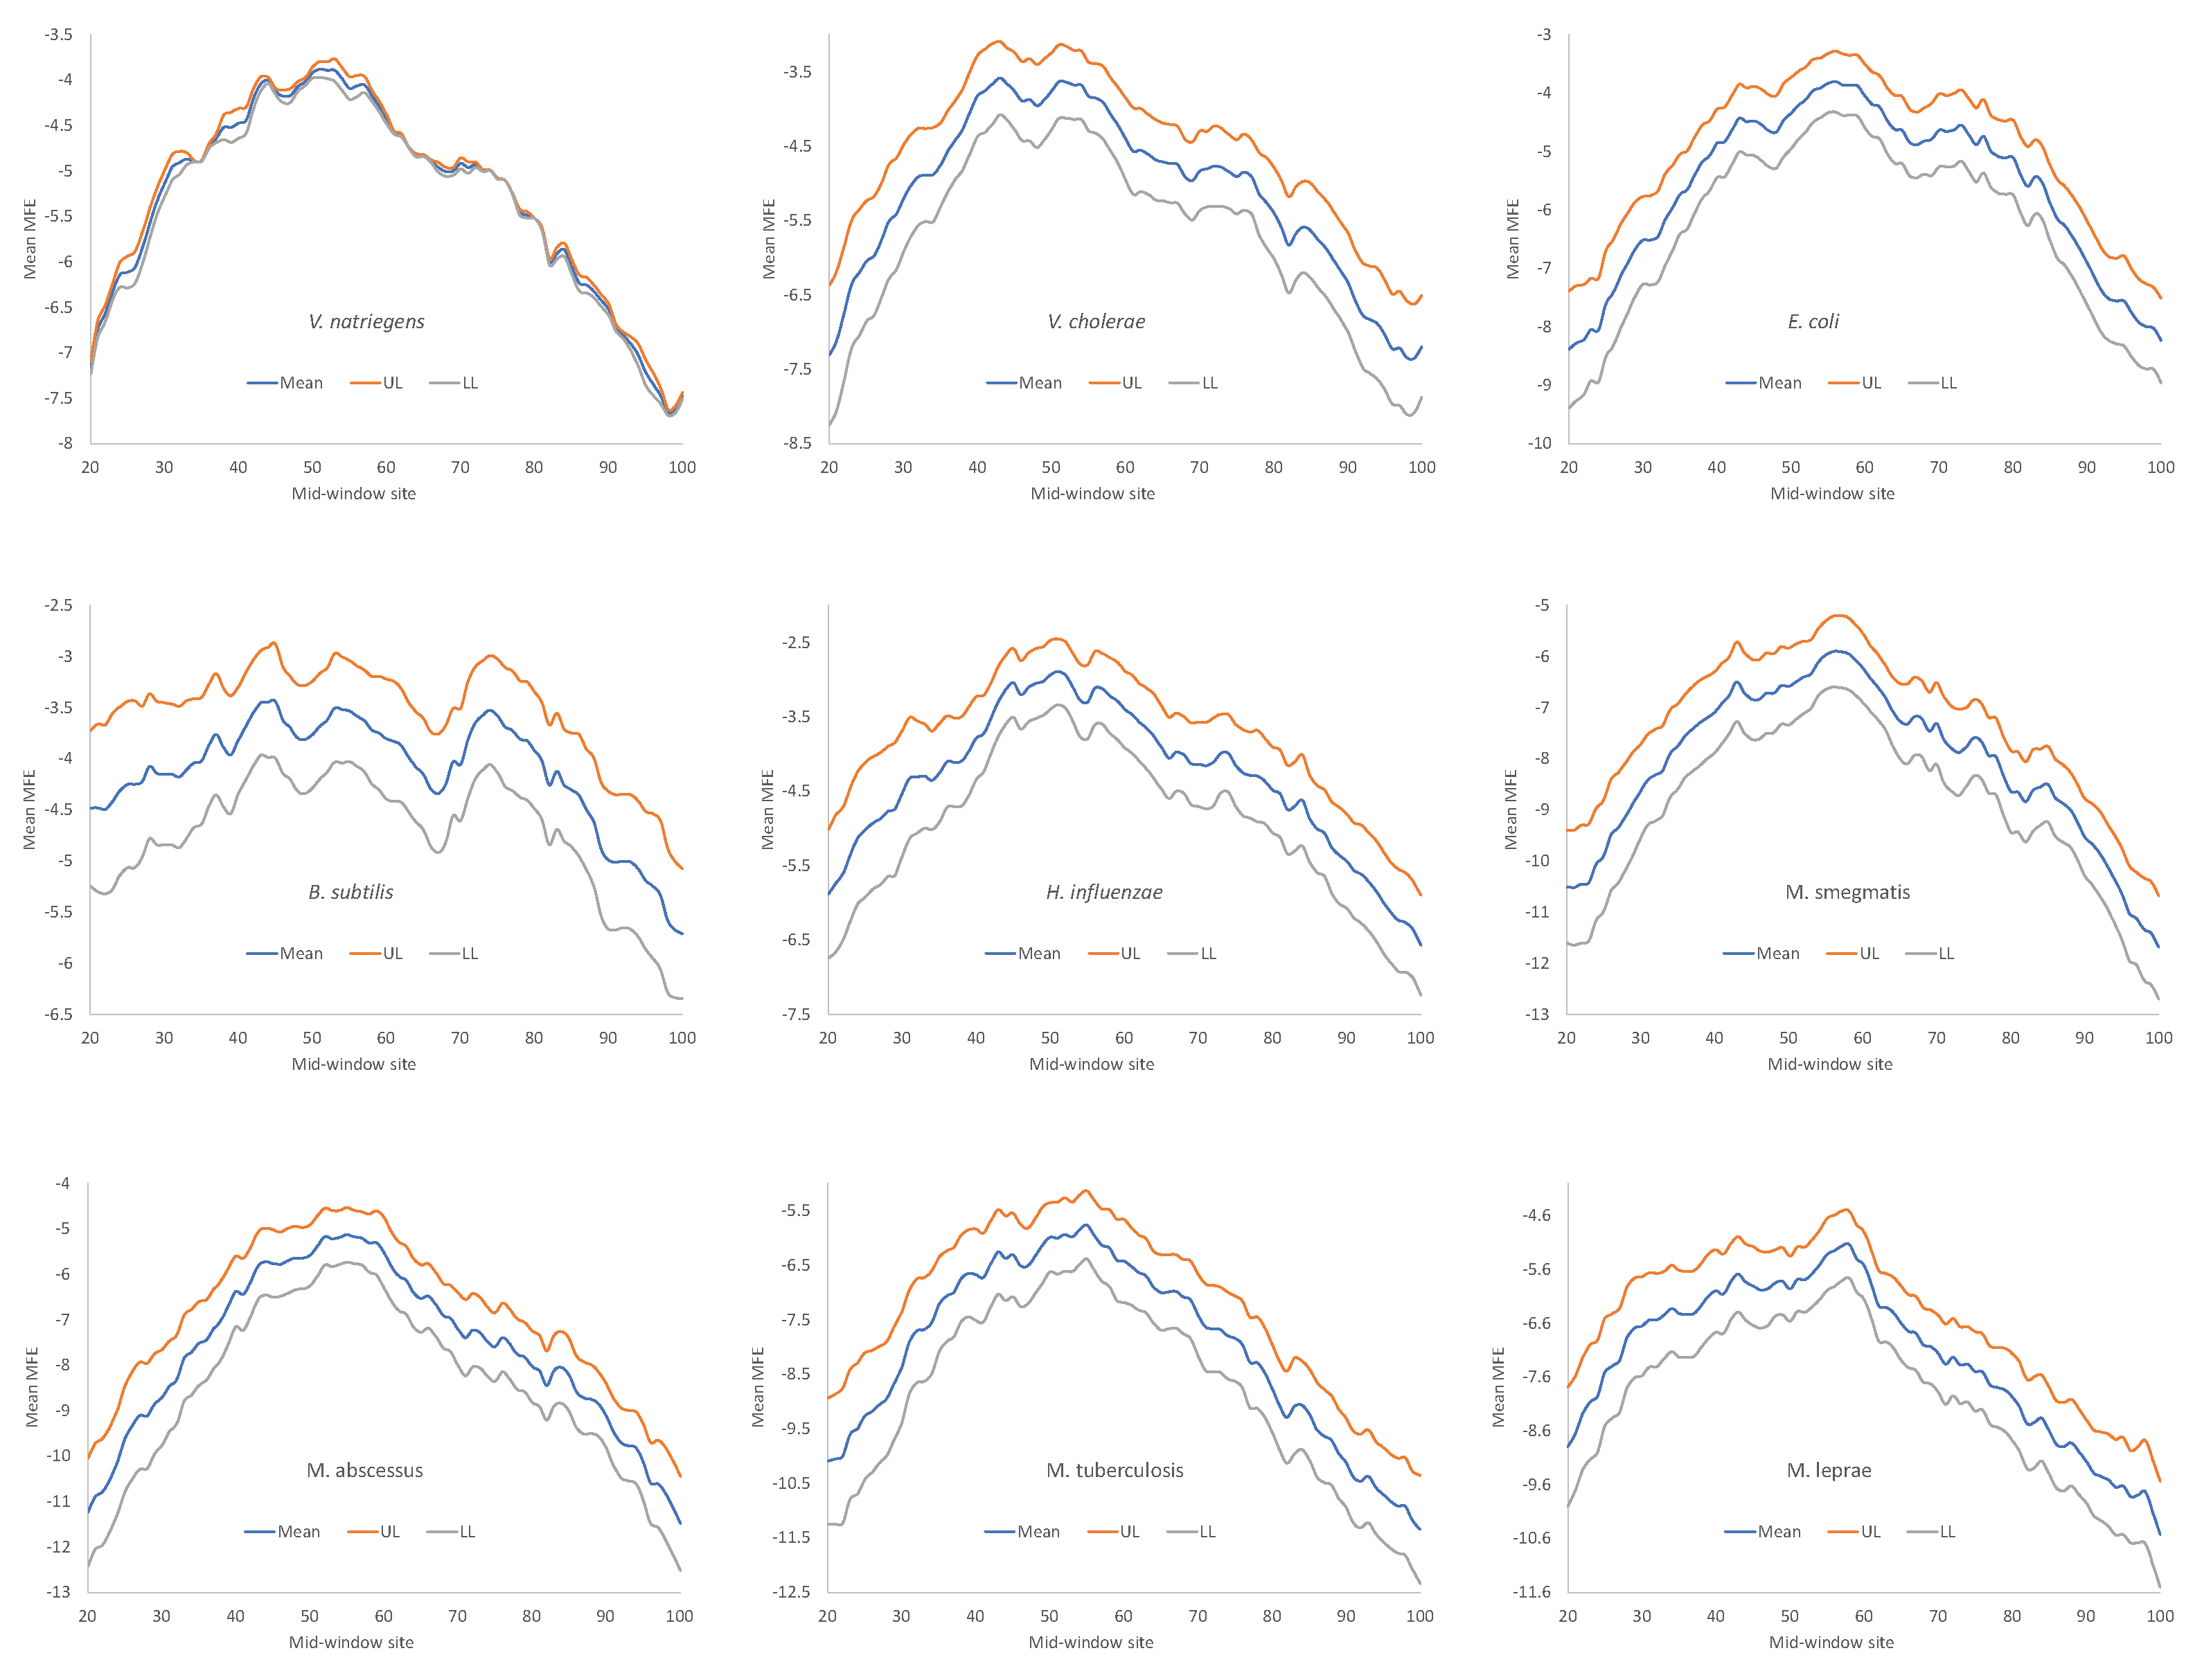
Figure 5.
Changes in nucleotide frequencies in sequences immediately upstream of the start codon (at sites 61063) in highly expressed genes (HEGs). Note the sharp increase in nucleotide G and concurrent decrease in nucleotides C and U near site 50 corresponding to the Shine-Dalgarno (SD) sequence (shaded). (A) the AT-rich H. influenzae. (B) the GC-rich M. smegmatis.
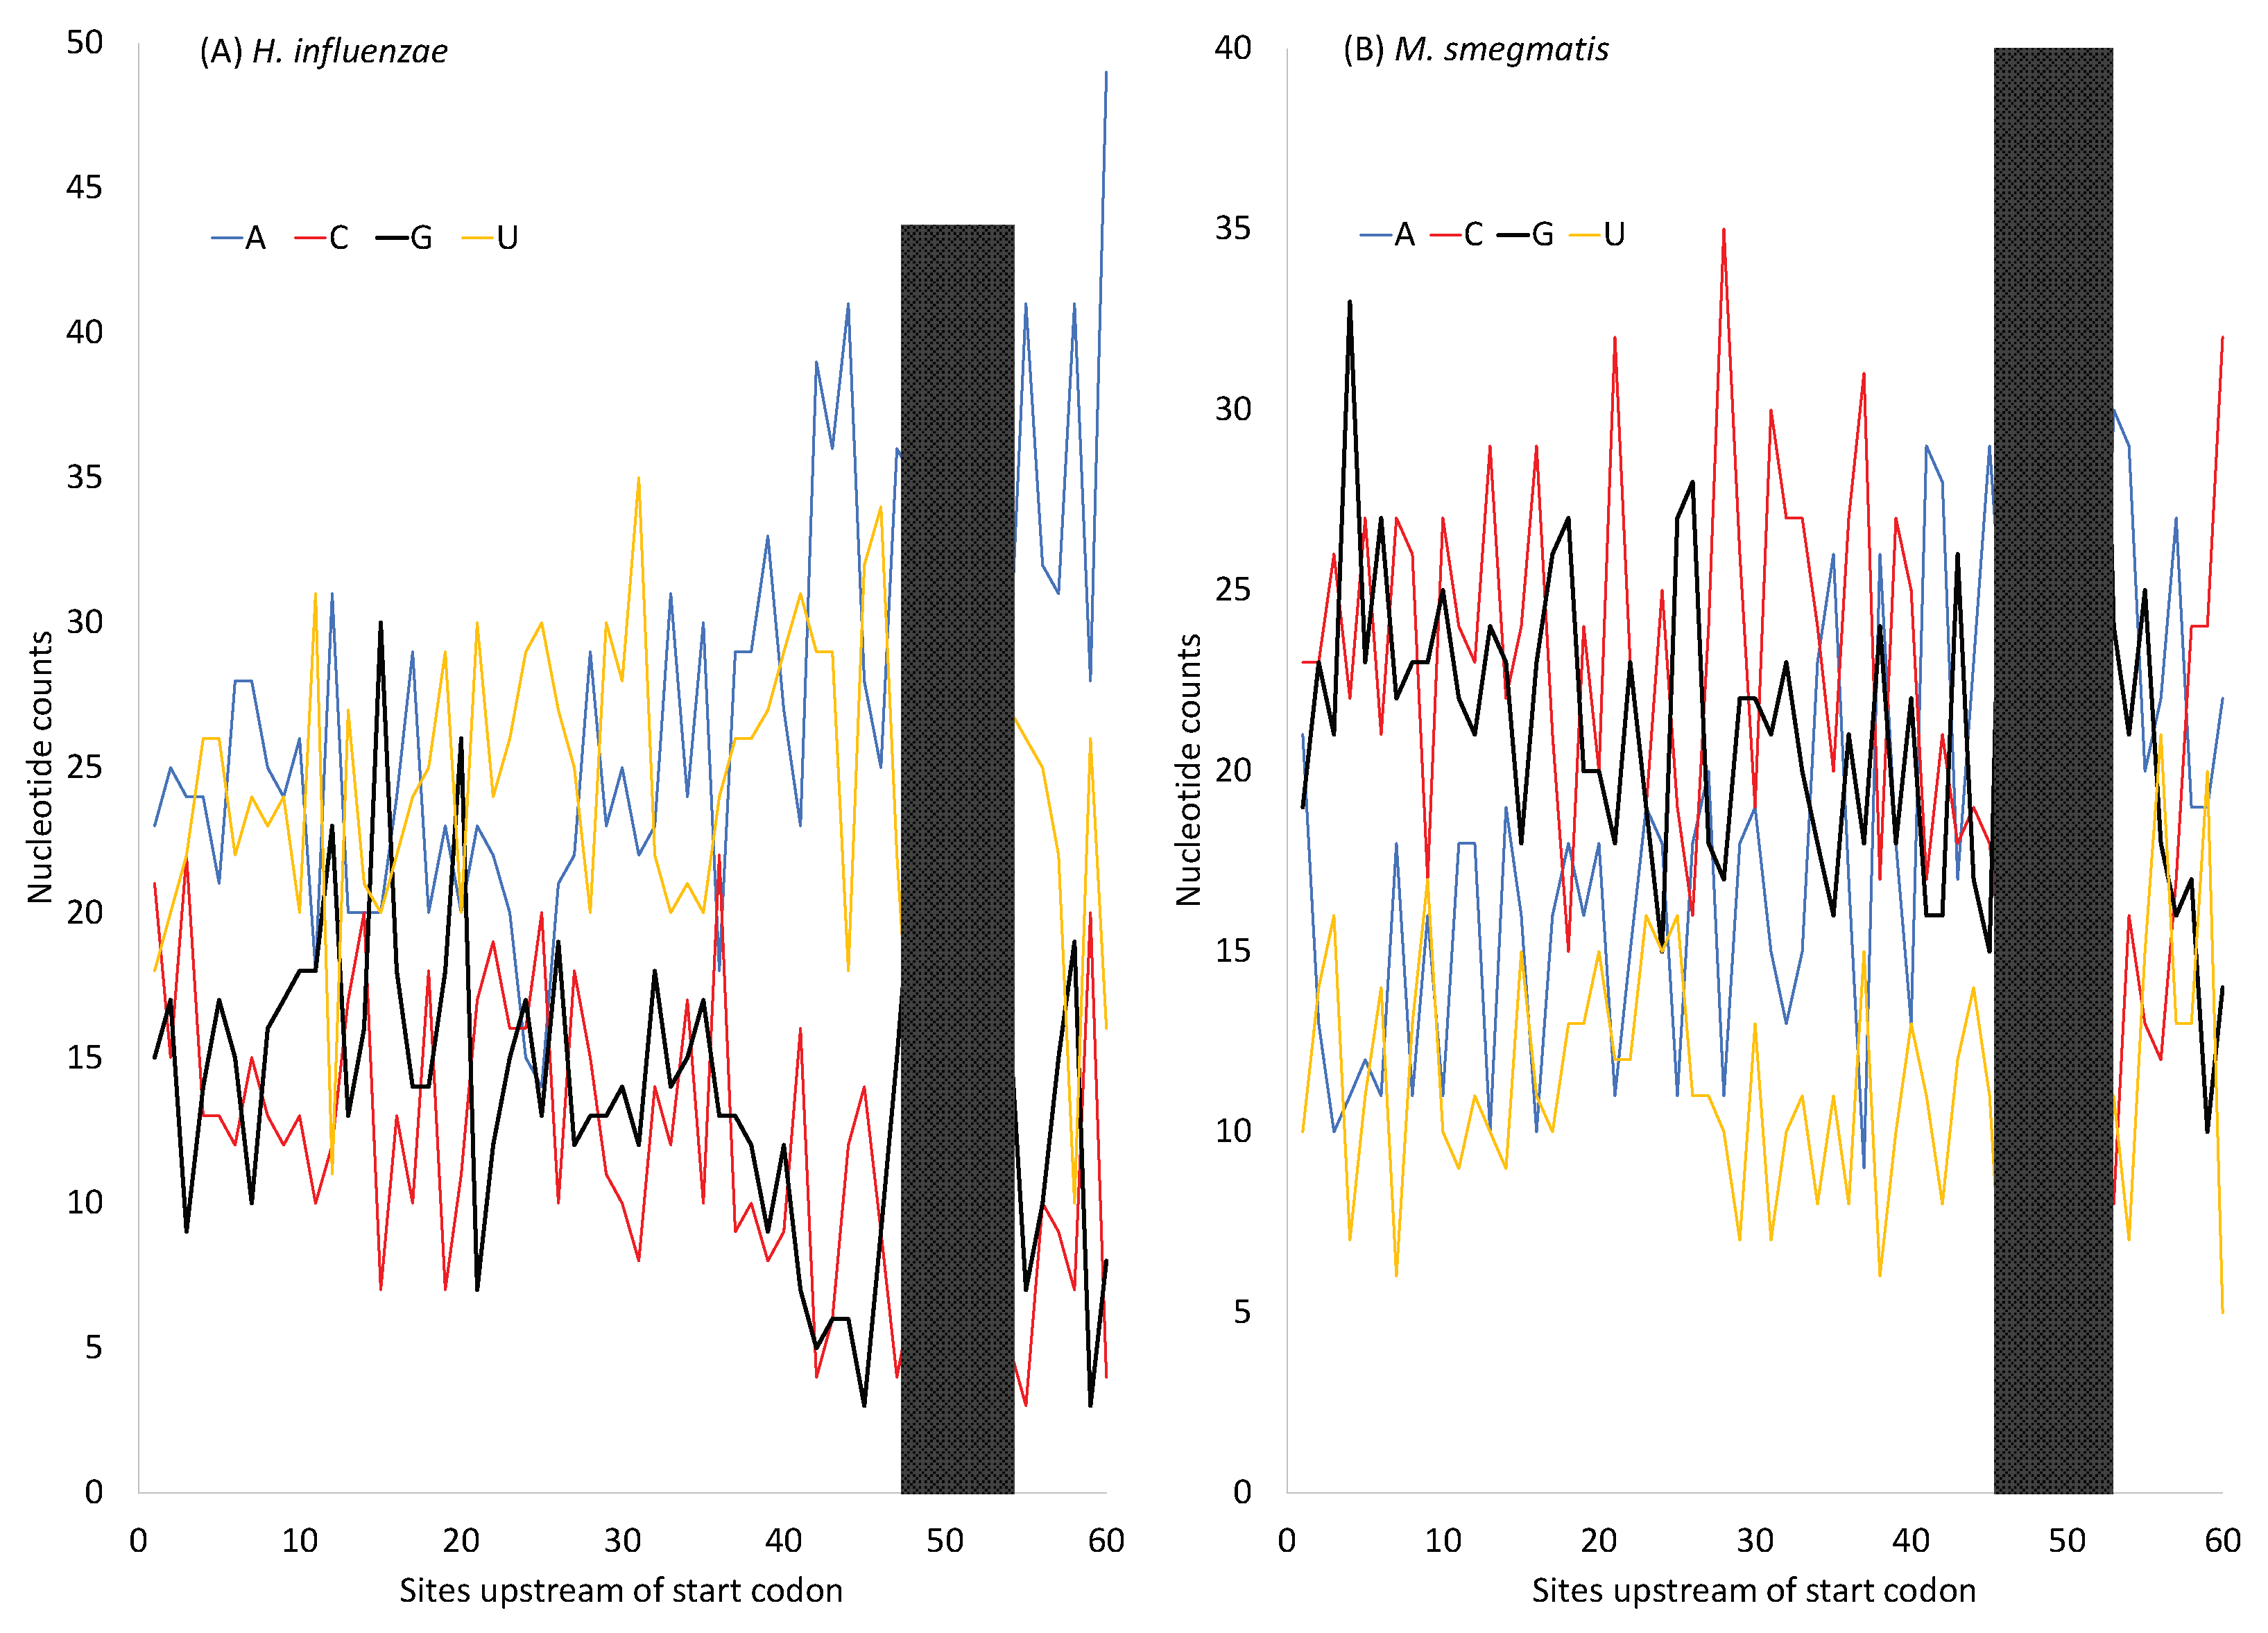
Figure 6.
Change of MFE (minimum folding energy) over a sliding window of 40 nt in HEGs of the nine bacterial species. The stop codon occupies sites 58-60. Other annotations are identical to those in Figure 4.
Figure 6.
Change of MFE (minimum folding energy) over a sliding window of 40 nt in HEGs of the nine bacterial species. The stop codon occupies sites 58-60. Other annotations are identical to those in Figure 4.
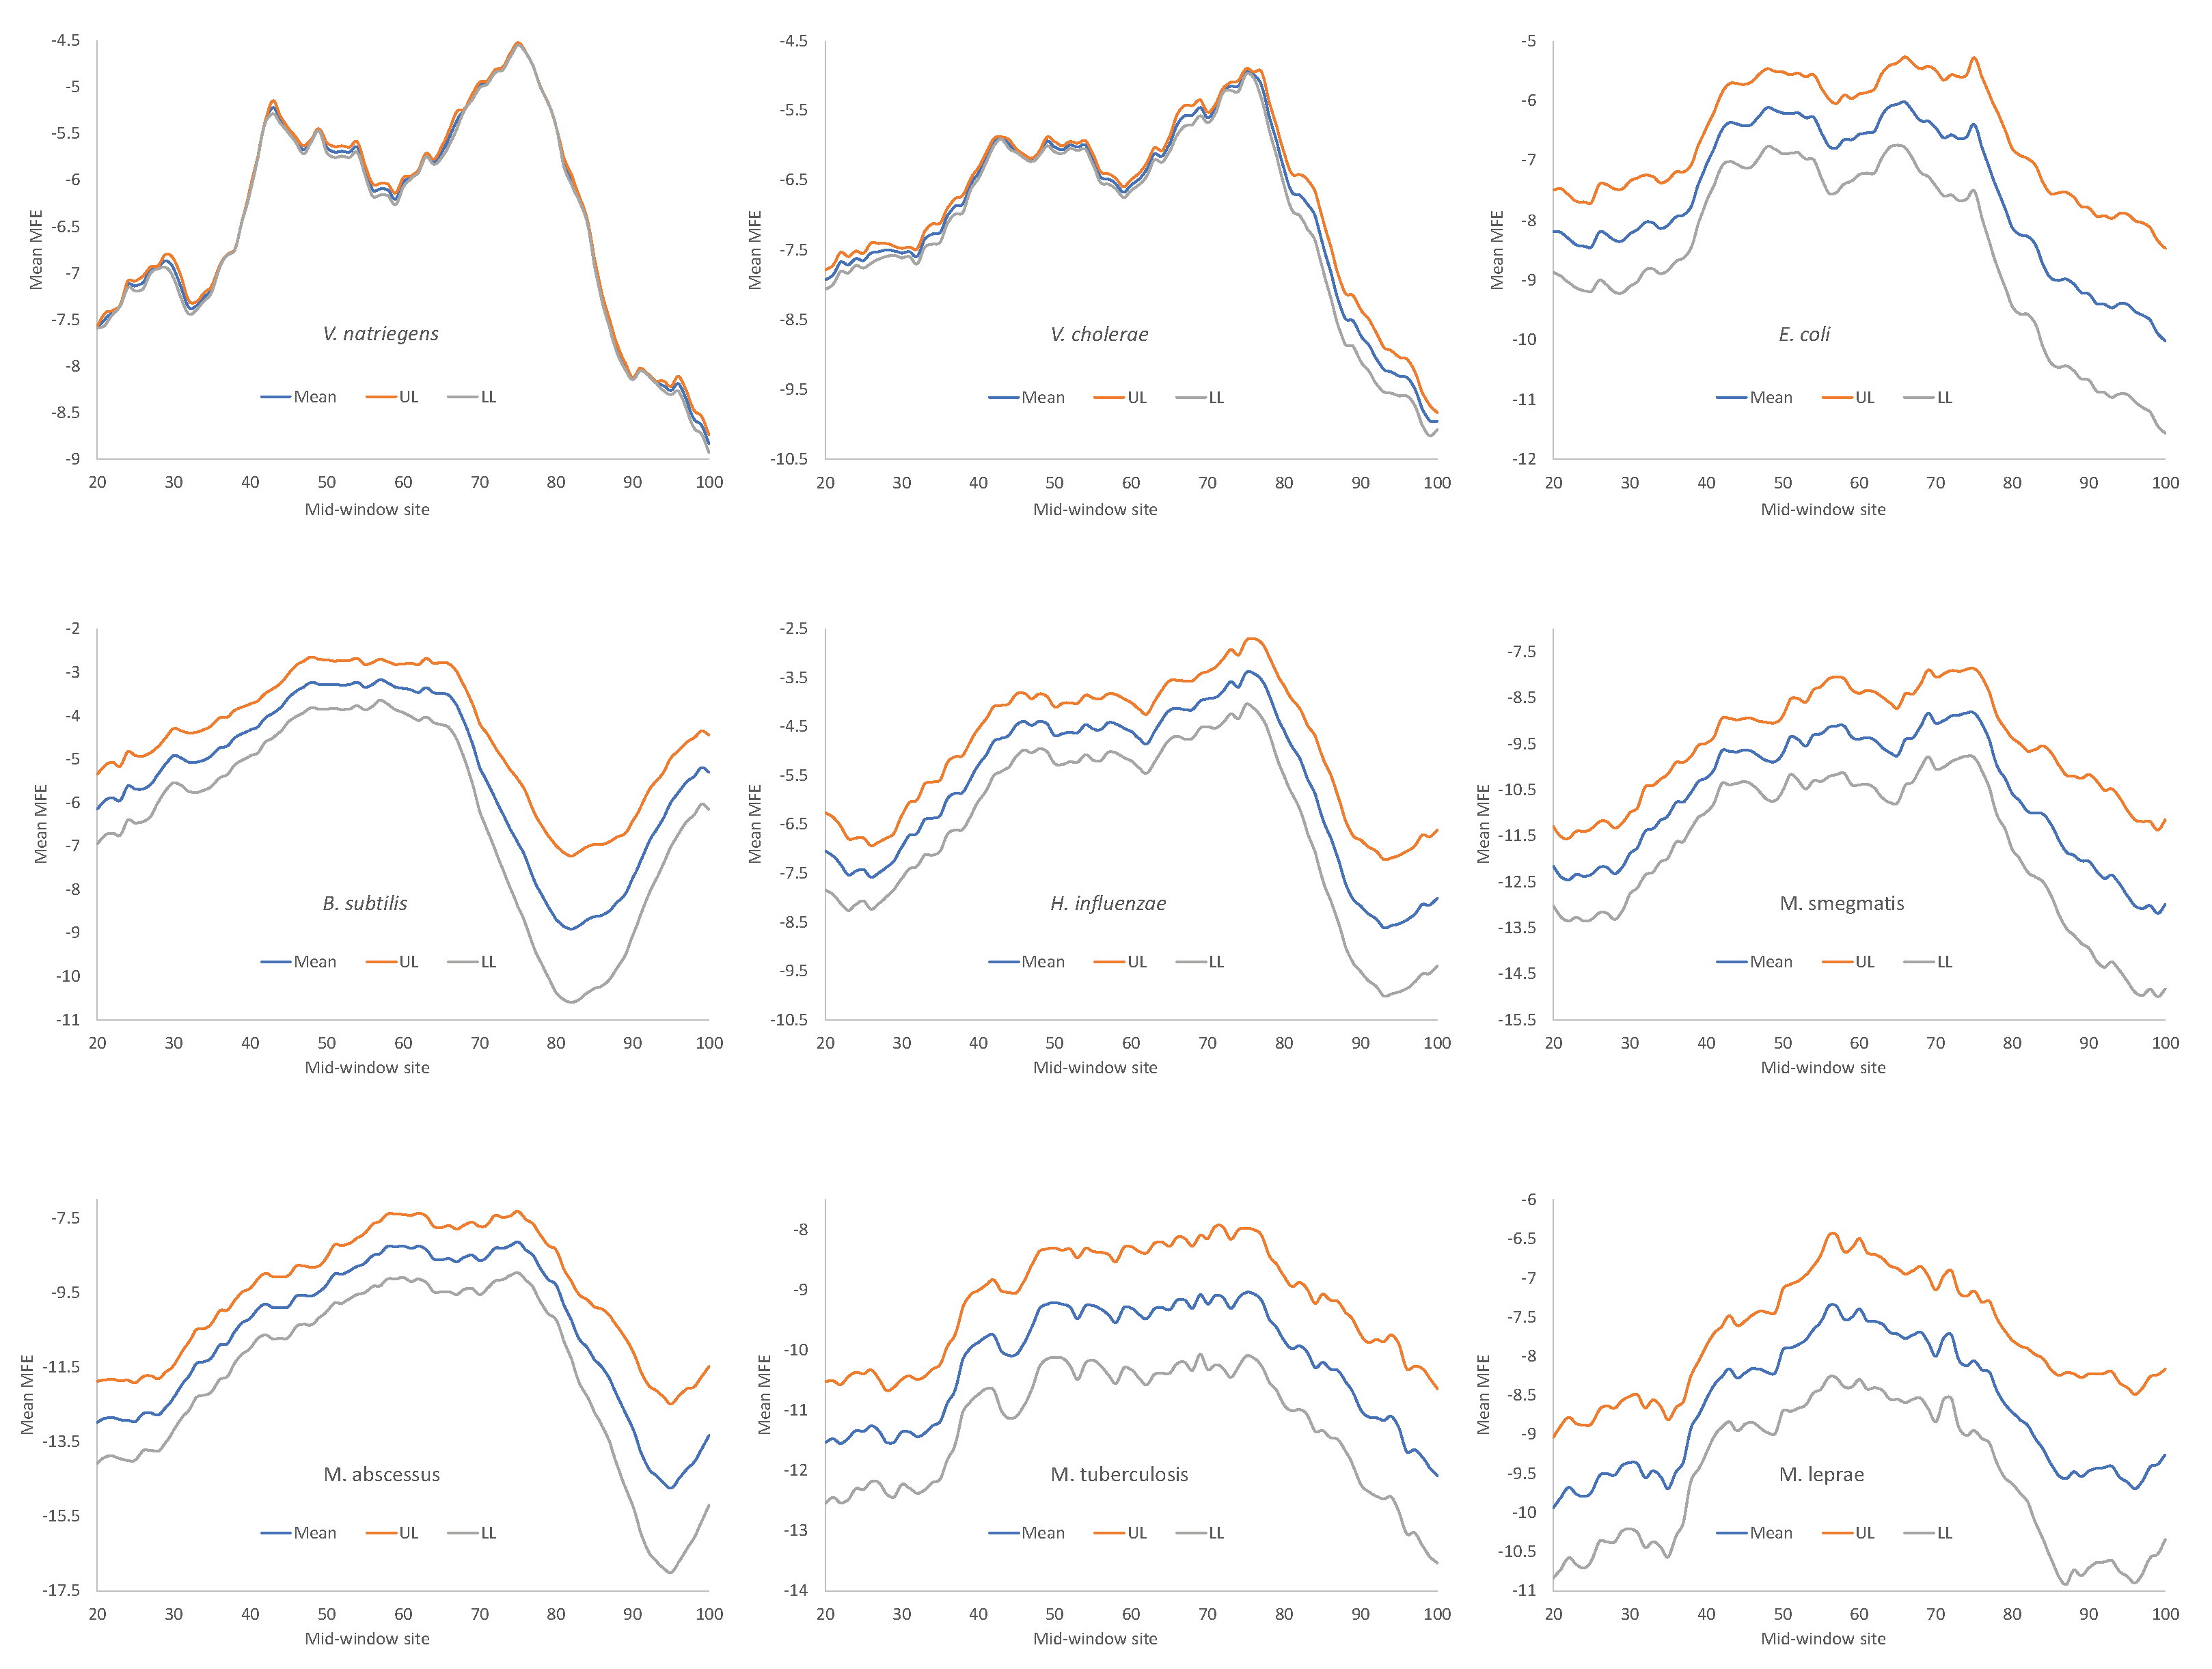

Table 1.
Nine species with complete genomes and well-documented generation time (GT) under optimal growth conditions.
Table 1.
Nine species with complete genomes and well-documented generation time (GT) under optimal growth conditions.
| Species | Accession(1) | GT(2) | Rank(3) | Reference(4) |
|---|---|---|---|---|
| Vibrio natriegens | NZ_CP009977.1, NZ_CP009978.1 | 10 min. | 1 | [91,92] |
| Vibrio cholerae | NZ_CP043554.1, NZ_CP043556.1 | 16-20 min. | 2 | [93] |
| Escherichia coli | NC_000913.3 | 20-30 min. | 3 | [94] |
| Bacillus subtilis | NC_000964.3 | 30-70 min. | 4 | [95] |
| Haemophilus influenzae | NZ_CP007470.1 | 103-107 min. | 5 | [96] |
| Mycolicibacterium smegmatis | NZ_CP054795.1 | ~2 hrs | 6 | [97] |
| Mycobacterioides abscessus | NZ_CP034181.1 | 4-5 hrs | 7 | [98] |
| Mycobacterium. Tuberculosis | NC_000962.3 | 20-30 hrs | 8 | [99,100,101] |
| M. leprae | NZ_CP029543.1 | 7 days | 9 | [100,102] |
(1) GenBank accession number. (2) Generation time under optimal growth conditions. (3) Ranking of generation time from the smallest to largest. (4)References pertaining to the generation time.
Table 2.
Short generation time is associated with increased genomic investment in ribosomal RNA and tRNA.
Table 2.
Short generation time is associated with increased genomic investment in ribosomal RNA and tRNA.
| Species | GT(1) | LGenome(2) | Nrrn(3) | NtRNA(4) |
| Vibrio natriegens | 1 | 5175153 | 11 | 129 |
| Vibrio cholerae | 2 | 4089299 | 10 | 102 |
| Escherichia coli | 3 | 4641652 | 7 | 86 |
| Bacillus subtilis | 4 | 4215606 | 10 | 86 |
| Haemophilus influenzae | 5 | 1846259 | 6 | 59 |
| Mycolicibacterium smegmatis | 6 | 6993871 | 3 | 47 |
| Mycobacterioides abscessus | 7 | 5067231 | 1 | 47 |
| Mycobacterium tuberculosis | 8 | 4411532 | 1 | 45 |
| Mycobacterium leprae | 9 | 3187112 | 1 | 45 |
(1) Rank of generation time from the shorted to the longest. (2) Genome length. The two Vibrio species each have two chromosomes. The genome length is the sum of the two chromosomes. (3) Number of rrn operons in the genome. (4) Number of tRNA genes in the genome.
Table 3.
Start codon usage and percentage of AUG (AUG%) in highly expressed protein-coding genes (HEGs) and the rest of protein-coding genes (REST).
Table 3.
Start codon usage and percentage of AUG (AUG%) in highly expressed protein-coding genes (HEGs) and the rest of protein-coding genes (REST).
| HEGs | REST | ||||||||||
| Species | AUG | GUG | YUG(1) | NHEG(2) | AUG% | AUG | GUG | YUG(1) | AUH(1) | NREST(2) | AUG% |
| V. natriegens | 71 | 3 | 2 | 76 | 93.42 | 3976 | 297 | 124 | 15 | 4412 | 90.12 |
| V. cholerae | 70 | 3 | 3 | 76 | 92.11 | 3166 | 253 | 131 | 18 | 3568 | 88.73 |
| E. coli | 69 | 3 | 1 | 73 | 94.52 | 3805 | 335 | 81 | 4 | 4225 | 90.06 |
| B. subtilis | 58 | 5 | 3 | 66 | 87.88 | 3225 | 382 | 555 | 9 | 4171 | 77.32 |
| H. influenzae | 68 | 1 | 1 | 70 | 97.14 | 1554 | 51 | 28 | 10 | 1643 | 94.58 |
| M. smegmatis | 54 | 18 | 0 | 72 | 75.00 | 4255 | 1998 | 187 | 26 | 6466 | 65.81 |
| M. abcessus | 53 | 14 | 1 | 68 | 77.94 | 3255 | 1458 | 145 | 14 | 4872 | 66.81 |
| M. tuberculosis | 49 | 13 | 0 | 62 | 79.03 | 2357 | 1306 | 177 | 4 | 3844 | 61.32 |
| M. leprae | 48 | 16 | 3 | 67 | 71.64 | 1162 | 782 | 276 | 43 | 2263 | 51.35 |
(1) YUG includes CUG and UUG; AUH includes AUA, AUC and AUU. (2) NHEG: The number of highly expressed genes; HREST: The number of all other genes not in the HEG group.
Table 4.
The percentage of AUG (AUG%) as start codons depends on generation time (RankGT), genomic GC content (GC%), and gene expression (GE).
Table 4.
The percentage of AUG (AUG%) as start codons depends on generation time (RankGT), genomic GC content (GC%), and gene expression (GE).
| Species | AUG% | RankGT | GC% | GE |
| V. natriegens | 93.4211 | 1 | 45.0 | HEG |
| V. cholerae | 92.1053 | 2 | 47.3 | HEG |
| E. coli | 94.5205 | 3 | 50.8 | HEG |
| B. subtilis | 87.8788 | 4 | 43.5 | HEG |
| H. influenzae | 97.1429 | 5 | 38.2 | HEG |
| M. smegmatis | 75.0000 | 6 | 67.4 | HEG |
| M. abcessus | 77.9412 | 7 | 64.1 | HEG |
| M. tuberculosis | 79.0323 | 8 | 65.6 | HEG |
| M. leprae | 71.6418 | 9 | 57.8 | HEG |
| V. natriegens | 90.1179 | 1 | 45.0 | REST |
| V. cholerae | 88.7332 | 2 | 47.3 | REST |
| E. coli | 90.0592 | 3 | 50.8 | REST |
| B. subtilis | 77.3196 | 4 | 43.5 | REST |
| H. influenzae | 94.5831 | 5 | 38.2 | REST |
| M. smegmatis | 65.8058 | 6 | 67.4 | REST |
| M. abcessus | 66.8103 | 7 | 64.1 | REST |
| M. tuberculosis | 61.3163 | 8 | 65.6 | REST |
| M. leprae | 51.3478 | 9 | 57.8 | REST |
Table 5.
Regression analysis of data in Table 4, with AUG% as the dependent variable, and ranked generation time (RankGT), genomic GC content (GC%), and gene expression (with HEG and REST encoded as 0 and 1, respectively) as independent variables.
Table 5.
Regression analysis of data in Table 4, with AUG% as the dependent variable, and ranked generation time (RankGT), genomic GC content (GC%), and gene expression (with HEG and REST encoded as 0 and 1, respectively) as independent variables.
| Coefficients | Standard Error | t Stat | p-value | |
| Intercept | 125.85528 | 8.60272 | 14.62970 | 0.00000 |
| RankGT | -2.53863 | 0.76412 | -3.32229 | 0.00503 |
| GC% | -0.52069 | 0.19491 | -2.67147 | 0.01825 |
| GE | -9.17674 | 2.94435 | -3.11673 | 0.00758 |
Table 6.
Regression analysis of UAA% on three independent variables: ranked generation time (RankGT), genomic GC content (GC%), and gene expression (with HEG and REST encoded as 0 and 1, respectively).
Table 6.
Regression analysis of UAA% on three independent variables: ranked generation time (RankGT), genomic GC content (GC%), and gene expression (with HEG and REST encoded as 0 and 1, respectively).
| Coefficients | Standard Error | t Stat | p-value | |
| Intercept | 197.94875 | 11.48080 | 17.24172 | 0.00000 |
| RankGT | -3.77935 | 1.01976 | -3.70611 | 0.00235 |
| GC% | -2.21876 | 0.26012 | -8.52992 | 0.00000 |
| GE | -17.35326 | 3.92940 | -4.41627 | 0.00059 |
Table 7.
Differences in mean ITE values between HEGs and REST () for the nine bacterial species of different generation time (RankGT).
Table 7.
Differences in mean ITE values between HEGs and REST () for the nine bacterial species of different generation time (RankGT).
| Species | RankGT | Rank | |
| V. natriegens | 1 | 0.2516 | 9 |
| V. cholerae | 2 | 0.2380 | 6.5 |
| E. coli | 3 | 0.2465 | 8 |
| B. subtilis | 4 | 0.2380 | 6.5 |
| H. influenzae | 5 | 0.2092 | 5 |
| M. smegmatis | 6 | 0.1266 | 3 |
| M. abscessus | 7 | 0.1806 | 4 |
| M. tuberculosis | 8 | 0.0267 | 1 |
| M. leprae | 9 | 0.0689 | 2 |
Table 8.
The effective number of anticodons (NAC and its ranked NAC) increases with ranked generation time (RankGT).
Table 8.
The effective number of anticodons (NAC and its ranked NAC) increases with ranked generation time (RankGT).
| Species | RankGT | NAC | Rank NAC |
| V. natriegens | 1 | 40.2129 | 1 |
| V. cholerae | 2 | 44.2802 | 2 |
| E. coli | 3 | 49.0127 | 4 |
| B. subtilis | 4 | 45.8531 | 3 |
| H. influenzae | 5 | 50.4305 | 5 |
| M. smegmatis | 6 | 59.0667 | 7 |
| M. abscessus | 7 | 58.8153 | 6 |
| M. tuberculosis | 8 | 59.3744 | 8.5 |
| M. leprae | 9 | 59.3744 | 8.5 |
Table 9.
Secondary structure stability (measured by MeanMFE) is expected to change with generation time (RankGT), GC%, and gene expression (GE).
Table 9.
Secondary structure stability (measured by MeanMFE) is expected to change with generation time (RankGT), GC%, and gene expression (GE).
| Species | RankGT | GC% | GE | MeanMFE |
| V. natriegens | 1 | 42.8557 | HEG | -4.2351 |
| V. cholerae | 2 | 43.7813 | HEG | -4.0721 |
| E. coli | 3 | 46.5955 | HEG | -4.2153 |
| B. subtilis | 4 | 38.7556 | HEG | -3.7484 |
| H. influenzae | 5 | 37.9329 | HEG | -3.2660 |
| M. smegmatis | 6 | 60.4224 | HEG | -6.4462 |
| M. abscessus | 7 | 60.4048 | HEG | -5.5966 |
| M. tuberculosis | 8 | 61.5043 | HEG | -6.2934 |
| M. leprae | 9 | 56.5344 | HEG | -5.7794 |
| V. natriegens | 1 | 40.4234 | REST | -3.5238 |
| V. cholerae | 2 | 43.3125 | REST | -4.0330 |
| E. coli | 3 | 45.6418 | REST | -4.4059 |
| B. subtilis | 4 | 38.6014 | REST | -3.7406 |
| H. influenzae | 5 | 33.7986 | REST | -2.5466 |
| M. smegmatis | 6 | 63.6954 | REST | -8.6708 |
| M. abscessus | 7 | 61.2667 | REST | -8.3538 |
| M. tuberculosis | 8 | 63.0856 | REST | -9.1141 |
| M. leprae | 9 | 57.1858 | REST | -7.9865 |
Table 10.
Regression output based on data in Table 9, with GE encoded as a binary dummy variation (0 for HEG and 1 for REST).
Table 10.
Regression output based on data in Table 9, with GE encoded as a binary dummy variation (0 for HEG and 1 for REST).
| Coefficients | Standard Error | t Stat | P-value | |
| Intercept | 0.57408 | 0.61265 | 0.93704 | 0.36582 |
| RankGT | -0.08382 | 0.04142 | -2.02386 | 0.06404 |
| GC% | -0.10038 | 0.01414 | -7.09756 | 0.00001 |
| GE | 4.46040 | 0.75315 | 5.92236 | 0.00005 |
| GC%*GE | -0.10972 | 0.01483 | -7.39673 | 0.00001 |
Disclaimer/Publisher’s Note: The statements, opinions and data contained in all publications are solely those of the individual author(s) and contributor(s) and not of MDPI and/or the editor(s). MDPI and/or the editor(s) disclaim responsibility for any injury to people or property resulting from any ideas, methods, instructions or products referred to in the content. |
© 2024 by the authors. Licensee MDPI, Basel, Switzerland. This article is an open access article distributed under the terms and conditions of the Creative Commons Attribution (CC BY) license (http://creativecommons.org/licenses/by/4.0/).
Copyright: This open access article is published under a Creative Commons CC BY 4.0 license, which permit the free download, distribution, and reuse, provided that the author and preprint are cited in any reuse.


