Submitted:
24 March 2024
Posted:
25 March 2024
You are already at the latest version
Abstract
This paper presents a study to accurately evaluate defects in reinforced concrete decks using ultrasonic pulse-echo signals. Two validation specimens were designed and tested where reinforced concrete deck slab specimens included planned voids and defects. A commercial Ultrasonic Pulse-Echo (UPE) device obtains 2-D images of the void/defect locations of the reinforced concrete deck. The UPE is based on the ultrasonic shear-wave test method using dry-point-contact transmitting and receiving transducers and employing a synthetic aperture focusing technique. The authors analyzed the recorded UPE A-scan data to enhance the accuracy of estimating the defects' locations using the synthetic aperture focusing technique imaging method. The analysis benefitted from an advanced denoising approach and defect echo peak extraction based on empirical modal decomposition, Hurst exponent characterization, and Hilbert envelope estimation. While output from conventional UPC devices can only provide qualitative results, the new method provides quantitative information on the anomalies inside the reinforced concrete deck. The developed approach accurately assists with assessing the location and depth of the voids/defects in the reinforced concrete deck slabs.
Keywords:
Nondestructive testing (NDT)
; Ultrasonic Pulse-Echo (UPE)
; synthetic aperture focusing technique
; Mira
; Reinforced concrete deck
; Anomalies
; Void defect
; Denoise
; EMD
; Hurst exponent
; Hilbert transfor
1. Introduction
In construction, poor-quality concrete can lead to a reduction in the load-carrying capacity of a structure. One common issue is the occurrence of cavities, which are internal voids that are not viewable from outside the structure. These defects can significantly impact the integrity of the concrete and weaken its properties. One way to detect these flaws is through nondestructive testing (NDT), a group of analysis techniques that can evaluate specific conditions and properties of concrete without damaging the specimen.
The American Concrete Institute report 12.2R3 provides valuable insights into the various NDT methods used for concrete analysis. Among these methods, using ultrasonic pulse-echo waves to detect flaws is a highly effective technique [1]. With pulse-echo equipment, operators can quickly analyze a particular element on a single face without needing to access the concrete element's opposite side. The pulse-echo technique uses the synthetic aperture focusing technique (SAFT), a signal post-processing method that improves the accuracy of an area scan to detect concrete defects. This technique has proved to be highly reliable and has been employed in many studies to locate voids in concrete [2,3,4].
The UPE testing principle involves a transmitter that converts electrical voltage energy into an ultrasonic wave and then travels through the concrete at a velocity determined by its properties. The wave continues to travel until it hits a concrete void or defect, reflecting the signal. The reflected signal then travels back through the material to the receiver, where it is converted into electrical energy, amplified as an echo, and recorded as an A-scan [5,6,7].
Figure 1 shows the schematic of a typical ultrasound reflection principle in a UPE device, with a transmitting and a receiving transducer. Equation 1 allows an accurate calculation of the depth of the reflecting interface of the defect, Z. Cs refers to the material's shear-wave speed, Δt is the travel time measured, and X is the horizontal spacing between the transmitter and the defect location (Equation 1). To understand the physical properties of material better, it is essential to consider its density (φ), Poisson's ratio (µ), modulus of elasticity (E), and shear modulus (G). By analyzing these factors, we can gain valuable insights into the behavior and characteristics of the material (Equation 2).
If applied effectively, UPE devices can be employed in the construction industry to inspect and evaluate the quality of reinforced concrete structures. Commercially available UPE devices, such as MIRA, EyeCon, and Pundit, utilize the tomography technique to generate images of the interior concrete, which can help identify potential imperfections. In this study, the dry-point-contact transducer array unit was used to enhance the accuracy of the inspection further. The UPE device used in this study is a low-frequency ultrasonic shear-wave tomography device with a surface longitudinal spacing of 30 mm, making it an excellent tool for detecting even the smallest defects in concrete structures.
Conventional software of UPE devices has limited the application to image concrete structures because of the assumption of a single-layer homogeneous, isotropic medium for concrete. A concrete bridge deck is a complex structure with multiple layers of different materials, each with varying shear-wave velocities. Due to this variation, the software used for inspection may provide inaccurate information about the multi-layered bridge deck, including depth, thickness, and internal defects. Furthermore, the software's signal processing may not accurately present reflected waves at the surface and defects. The accurate inhomogeneous materials may result in the generation of nonlinear features in wave propagation. The irregular surface texture may cause sensor contact variation and create a stochastic signal.
Pulse-echo testing is a non-destructive technique that uses ultrasonic waves to detect material defects. The technique works by analyzing the amplitude of the echo signal and the time it takes for the signal to reach the receiver. This information helps determine the defect's presence, size, and location. One of the primary advantages of the pulse-echo technique is its flexibility in testing large and irregularly shaped objects. However, the technique has a significant drawback: the loss of sensitivity near the test surface due to the coupling of the transducer with the test specimen. The ultrasonic signal passes through several materials before reaching the test specimen, including a coupling element and a transducer body. The reflected signals create near-field noise in the A-scan, which shows a reflector at each material interface.
The amplitude of the received echo depends on several factors, such as the transmitter power, direction of the transmission, size of the reflector, surface irregularities of the reflector, the reflector's position and orientation, the receiver's size and orientation, loss of signal at the receiver due to re-reflection and lack of coupling, attenuation of the sound wave due to absorption and scattering, and shadow effects, to name a few [8,9,10,11,12,13].
Ultrasonic testing is an effective method for detecting internal defects in concrete structures. However, interpreting ultrasonic testing data is a crucial task requiring extensive expertise. Various methods have been developed to overcome this challenge, including the widely used mature industrial ultrasonic imaging method, SAFT. These methods have shown promising results in detecting internal defects of concrete structures. However, it is essential to note that most of these methods can only qualitatively determine the presence of defects in concrete and cannot quantitatively detect the position and size of these defects.
Accurate positioning, precise evaluation, and clear visualization of void defects are essential for assessing the safety and performance of concrete structures. Unfortunately, the conventional SAFT method is often plagued by background noise and image artifacts, primarily due to the low-frequency ultrasonic pulse with a long wavelength. Consequently, the resulting image tends to droop, resulting in suboptimal quality outcomes.
Ultrasonic array devices are now widely employed to visualize the insides of concrete structures non-destructively. However, the data collected by these devices may sometimes need to be clarified, requiring the use of image reconstruction algorithms to achieve clear images. Low-frequency UPE devices can combat the issue of signal attenuation in concrete structures. These devices emit low-frequency ultrasonic pulses that reduce signal attenuation, pulse duration, and image sagging, resulting in fewer image distortions and an overall improvement in quality.
The UPE device has an impressive collection of ultrasonic transducers that can measure multiple pulse-echo signals in a single scan. This advanced process results in a comprehensive cross-sectional image of the tested object. The device runs on the cutting-edge SAFT-C algorithm, which uses a time-domain approach that relies on the delay-and-sum method to focus on delayed reflections effectively. This algorithm was selected for its user-friendliness and low-performance requirements, making it an excellent microprocessor option.
While the interpolated image provides an intuitive and immediate visualization of the inside of concrete structures, the reliability of the information in the interpolated area decreases as the spacing between 2D images increases. Using a polarized shear wave by the UPE device makes it highly unlikely for a reflector to be arranged in a specific direction. Additionally, the UPE device software cannot combine data collected from multiple orientations to generate an image.
These UPEs require greater precision in quantitatively measuring internal defects within concrete structures. Additionally, detecting beyond a reflector area is challenging due to the high reflectivity of the shear wave. The UPE devices may not be sensitive enough to vertical crack-type defects because of the shallow frequency, resulting in a longer wavelength. Varying ultrasonic wave propagation characteristics like velocity, amplitude, attenuation, and frequency are utilized to measure the thickness and detect defects in concrete structures.
Commonly used methods for detecting voids, imperfections, and defects in concrete structures utilize ultrasonic body waves. Concrete is a homogeneous medium with a consistent shear-wave velocity, and the SAFT technique has been implemented in the UPE devices to achieve this. However, certain modifications can be introduced to improve the results obtained through SAFT, such as calibrating the sagging in the resulting images due to the long wavelength of the pulse (as suggested in references [14,15,16,17,18,19]). Such enhancements can significantly improve the efficacy of SAFT in detecting and characterizing concrete anomalies, thereby increasing the safety and durability of concrete structures.
Two-time indices are called t1 and t2 in the ultrasonic transmission, reflection, and receiving process. By precisely analyzing the designated timings, we can effectively discern reflections originating from the front surface and any imperfections (Figure 1). This pulse type is instrumental in generating an A-scan that meets rigorous quality standards. The data derived from this scan is the time differential tf, which is represented as tf = t2 - t1 and commonly known as the ultrasonic time-of-flight (TOF). Knowing the propagation speed of bulk waves in the material, the TOF is invaluable in determining the location of the defect.
TOF-based methods have proven effective in detecting, locating, and sizing faults in ultrasonic nondestructive testing and evaluation. However, echo signals in UPC testing often contain significant noise. The intensity of this noise can vary depending on the medium's properties and the distance of ultrasonic wave transmission, resulting in low signal-to-noise ratios and peak variations in the time domain. These factors pose a challenge in accurately locating and extracting peak amplitudes from defect echo signals.
Various signal processing techniques enhance the detection capabilities of ultrasonic NDT applications, where signals are often mixed with noise. The ultrasonic signals should be denoised, which is feasible using short-time Fourier transform, wavelet transform, improved wavelet transforms, adaptive filtering, and empirical mode decomposition (EMD) [20,21,22,23,24,25,26]. Each technique has its strengths and weaknesses, which are considered when selecting the appropriate method for the given application.
Originating from concrete defect echoes in UPC testing; the resulting intense noise makes identifying and quantifying defect echoes difficult. Therefore, the conventional averaging and filtering techniques could be more helpful for pulse-echo noise reduction. Denoising assists with filtering the noise components and retaining the original signal's details.
The most used denoising algorithm thus far is the wavelet threshold algorithm. However, the wavelet threshold denoising has a severe drawback. It requires appropriate wavelet base, threshold, and decomposition level values, thus allowing different parameters to affect the denoising performance remarkably. Empirical Mode Decomposition (EMD) works for nonlinear, stochastic, and non-stationary signal processing. The EMD denoising algorithm does not require presetting the base and decomposition level and is more adaptable than the wavelet threshold algorithm. Furthermore, the EMD denoising algorithm can result in high-frequency resolution.
The electrical noise and piezoelectric signal primarily determine the position of the initial pulses in the UPE device. The signal can travel along a straight line when the distance is short and the temperature variation is slight. The TOF of the echo wave determines the position of the scatter.
The Hilbert transform has been used in signal processing to map an actual signal into an analytical signal with a complex envelope to obtain specific signal features [27,28]. The Hilbert transform converts a given signal into an analytical signal with a complex envelope, which facilitates the evaluation of the signal envelope and the determination of the TOF of the defect echo signal. This transformation is beneficial when the magnitude of the defect echo signal is relatively small and gets merged with a superimposed signal.
This paper proposes an approach to denoise ultrasonic pulse-echo signals using advanced EMD and Hilbert transform to identify and quantify the defect echo signal. This advancement complements the commercial UPE device results and accurately calibrates defect locations. This study's experimental program shows testing to validate the proposed denoizing approach.
2. Experimental Setup
Two validation specimens were designed and fabricated to evaluate the capabilities of the UPE device and the effectiveness of the developed method in accurately assessing internal defects and voids. The reinforced concrete (RC) deck slab specimens were designed with artificial defects, as shown in Figure 2a. Each specimen includes a pair of foam voids to simulate embedded void scenarios. The dimensions of the RC deck slab specimens were precisely measured to be 114.3 cm in width, 121.9 cm in length, and 17.8 cm in thickness. The artificial voids, depicted as V1 and V2 in Figure 2, were created using rectangular prisms of expanded polystyrene (EPS) foam, which possessed the same dielectric properties as the surrounding air. The EPS foam has the same dielectric properties as the surrounding air. The artificial void is 102 × 30 mm (width × thickness), and the top surface of the foam is placed 83 mm down from the top surface of the deck specimen. This approach allowed us to accurately simulate the behavior of the voids in the slab and evaluate their impact on the overall performance of the structure.
Figure 2b depicts the commercial UPC device, an ultrasonic low-frequency, shear-wave tomography device that rapidly images the subsurface concrete condition. The device boasts 48 dry-point-contact (DPC) transmitting and receiving transducers with ceramic wear-resistant tips arranged in a matrix. Its antenna array comprises 12 channels, C1 through C12, at a longitudinal spacing of 30 mm, with each channel featuring four transducers at a transverse spacing of 25 mm. Each transducer can transmit and receive low-frequency (55 kHz) shear waves.
Utilizing DPC transducers, the device mentioned above can provide a consistent level of impact and wavefront penetration for diagnostics up to 3ft deep while dealing with concrete surface textures. The device uses a shear-wave pulse velocity of 2450 m/s for concrete for the SAFT reconstruction. Figure 3 illustrates the fundamental principles of the UPE device.
3. Formulation for Accurate Assessment of Defects and Voids
Most ultrasonic measurements exhibit perplexity, as the results are subject to severe disturbances such as signal deviation, nonlinearity, stochastic surface status, and mode conversion due to anisotropic and heterogeneous domains in the concrete. These are reflected in the UPE signal as spurious echoes and noise.
The UPE testing data analysis contains ambient noise or signals corrupted by non-stationary acoustic noises, reducing the analysis efficiency. Denoising of the signals appears in several studies reported in the literature, many of which have certain limitations. Most studies relied on prior signal knowledge to enhance denoising, resulting in the loss of important data during filtering.
Typical signal processing methods may not be effective in detecting fault features. However, combining various signal processing techniques can improve fault detection and analysis. To more accurately analyze the behavior of non-linear and non-stationary signals, many researchers have utilized Empirical Mode Decomposition (EMD) to identify faults. The EMD is capable of removing signals from non-linear and non-stationary signals.
Research conducted [29,30] highlighted that the EMD denoising method surpasses both median filtering and wavelet denoising in effectiveness. Nonetheless, when heavy noise is a factor, selecting the intrinsic mode function (IMF) in EMD can be difficult. The Hurst exponent is a valuable resource for detecting multifractality that may be disguised in nonlinear and non-stationary signals. The Hurst analysis technique was employed to choose the appropriate IMF with the EMD method [31,32].
This study presents a novel approach to removing noise from a UPE signal using data-driven analysis. The method involves breaking down the noisy signal into IMF components using EMD analysis, and then examining each IMF's Hurst exponent to determine which components require filtering. The filtered components are then reconstructed to eliminate the noise from the data.
By utilizing the Hurst exponent to identify the threshold for maximum signal noise suppression, the method applies thresholding techniques to the IMFs for optimal noise removal. This method has proven more effective than traditional techniques, especially for low SN signals.
A comprehensive understanding of IMF statistics in noise-only situations is essential in identifying the significance of a given mode. The estimation of the noise Hurst exponent is achieved using the aggregated variance method. This exponent is then utilized to evaluate the energies of IMFs within the noise model, a crucial step in determining the threshold of IMFs. Understanding the statistics of IMFs in noise-only scenarios can help determine the importance of a specific mode. Thus, the aggregated variance method is employed to estimate the noise Hurst exponent, which is then applied to evaluate the IMF energies and establish the IMF threshold.
Ultrasonic nondestructive testing can present challenges when it comes to detecting echoes caused by defects in backscattered signals due to backscattering and electronic noise. However, there is a solution in the form of the EMD algorithm. The EMD algorithm breaks down a non-linear and non-stationary signal into a series of zero-mean amplitude-modulation and frequency modulation components. By doing so, it can accurately represent the observation's characteristic time scale. This means that a multi-component, non-linear, and non-stationary signal can be represented with precision using the EMD within the context of ultrasonic theory.
To decompose a signal using the EMD approach, we represent the instantaneous amplitude and instantaneous phase of the jth component as and , respectively, and n as the number of components. This is done through an iterative sifting process, resulting in zero-mean AM-FM components called IMFs. These IMFs must satisfy two requirements: (a) The number of extremes and zero crossings in the IMF must be equal or differ at most by one, and (b) The mean value of the envelopes defined by the local maxima and local minima must be zero at any point. In essence, the signal must be locally symmetrical around the time axis. To find the IMFs for a given signal, we conduct the sifting process to find the IMFs for the signal , which involves the following steps:
- (1)
- To accurately process the input signal, we must initially identify all local maxima and minima, along with their respective positions and amplitudes. Following this, we can employ cubic spline interpolation to generate an upper envelope consisting of the local maxima and a lower envelope using the local minima.
- (2)
- After calculating these envelopes, the envelope mean signal, known as , can be determined by taking their mean. Lastly, to finalize the processing, we need to subtract the envelope mean signal from the original input signal (Equation 4).
- (3)
- Check if meets the IMF requirements. Treat the data as new data and repeat the process if it does not meet the IMF requirements (Equation 5).
- (4)
- Repeat the sifting procedure k times until the resulting component is an IMF, which becomes the first IMF (Equation 6).
- (5)
- A standard method for extracting and analyzing a signal's underlying components is residual analysis. This process involves subtracting the component from the input signal and defining the resulting remainder as the first residual. Given that the first residual may contain information relating to longer-period components, it is treated as a new data stream. The procedure is repeated for this new signal. This process may be iterated j times, resulting in the generation of j residuals. By following this approach, it is possible to obtain a refined understanding of the signal and identify the underlying components contributing to its overall structure.
- (6)
- The sifting process is interrupted once either of the two criteria mentioned above is fulfilled: firstly, when the component or the residual is reduced to such a minuscule size that it can be regarded as insignificant, or secondly, when the residual (R) becomes a monotonic function that precludes the extraction of the IMF—the objective IMF can be obtained by adding Equations (4) and (5). The original signal can be expressed as a combination of IMFs and a residual, producing significant implications in signal processing and analysis. This observation has been accepted in the academic community.
- (7)
- EMD-based denoising, similar to other decomposition-based denoising techniques like wavelet transforms, requires a reliable and robust threshold to distinguish between noise and authentic signal components. In cases where irregularity or noise is present in a time series, the Hurst exponent plays a crucial role in determining the irregularity in the signal. This methodology is more efficient than traditional approaches such as autocorrelation, ANOVA, and spectral analysis in many applications. The Hurst exponent value, whether greater or less than 0.5, indicates the pattern of the nonlinearity of the data set. Some white noise signals have a flat spectrum and are determined by the Hurst exponent H. The autocorrelation function for a zero-mean Gaussian stationary process is expressed as:
- (8)
- Equation 10 represents the interdependence of process variance (σ), Hurst exponent (H), and correlation lag (k). Notably, when H equals 0.5, the process is classified as uncorrelated white noise, whereas for other H values, it is labeled as colored Gaussian noise. Moreover, when a generalized white noise signal is subjected to EMD, it acts as a dyadic filter bank. It is important to note that the log-variance of the IMFs follows a simple linear model, which the Hurst exponent of the process ultimately governs.
- (9)
- The energy of each of the IMFs, for k≥ 2 and ρH ≈ 2, can be parameterized as a function of the first IMF energy (Equation 11). The energy of the first IMF is given by Equation 12.
- (10)
- This particular model can execute denoising BMD-based techniques. The process entails breaking down the noisy signal into IMFs and gauging their energy levels about the estimated noise-only IMF energies derived from Equation10. From there, the signal reconstruction is accomplished by adding up the IMFs whose energy levels deviate from the expected noise model.
- (11)
- Peak detection techniques are typically employed to estimate TOF, thereby differentiating between the reflection signal from the front surface and the reflection signal from the defect. Despite the denoising process, the defect echo signals may still exhibit dispersion and weakness, requiring specialized methods for identification and estimation. Techniques such as filtering, cross-correlation, envelop moment analysis, and matching pursuit decomposition with dispersion compensation are necessary for accurate defect detection in such scenarios. The envelope of an echo signal constitutes a vital characteristic that can be employed to extract information regarding the location of the echo waveform.
The Hilbert transform facilitates the computation of instantaneous features of a time series, including the envelope amplitude and instantaneous frequency. The instantaneous envelope denotes the amplitude of the complex Hilbert transform, which can be utilized to identify the dynamic characteristics of nonlinear systems by improving the accuracy of envelope detection through the use of local-maxima interpolation.
The Hilbert transform involves casting the actual signal a(t) into an analytical signal (i.e., complex envelope) ã(t). The ã(t) is a complex-valued time-domain signal, where the original actual signal a(t) is the genuine part, and the Hilbert transformed signal â(t) is the imaginary part (Equation 13). By leveraging this approach, one can obtain a complex-valued time-domain signal that provides a more comprehensive representation of the underlying physical phenomenon.
ã(t) = a(t) + 𝑗 â(t),
- (12)
- In Equation 14, j is the imaginary number, while H[·] denotes the Hilbert transform operation. In the time domain, the Hilbert transform is defined as the convolution of a(t) with 1/πt, where â(t)= H[a(t)]. The envelope of a signal is the magnitude of the analytical signal, which is the same as the magnitude of the real signal. The complex signal ã(t) is formed by the Hilbert transform, a(t), and â(t) as shown in Equation 15. Then, the envelope of the real signal can be given by Equation 16.
4. Results and Discussion
Figure 4a shows the 2D reconstructed image with an artificial void, reconstructed using the developed software. The voids’ locations and horizontal dimensions are precisely indicated. Figure 4b displays a reconstructed image of the artificial void #1, including its exact frame. Finally, Figure 4c shows the advanced SAFT-produced color spectrum for signal amplitudes, which can be positive or negative. These values range from black (minimum negative to zero) to dark red (maximum positive). The color spectrum is “dark,” representing black to blue, and “bright,” indicating light blue to dark-red colors.
It can be seen from Figure 4b that the location of the detected void is 70-75 mm below the concrete front surface. Whereas the actual location of the constructed artificial void is 83 mm below the surface (distance of concrete surface to the top surface of the artificial void form), as specified by the black frame in Figure 4b.
Figure 5 shows the A-scans for the cases measured on the concrete deck without void defect (a) and void defect (b) below the UPE device. In Figure 5b, the peak at about 80 microseconds is slightly smaller than the last peak at about 60 microseconds; it could be interpreted as the reflection echo peak from a decayed surface wave or the reflected echo from a defect void.
Accurately identifying the defect echo wave requires eliminating noise and distinguishing between the surface reflection wave and scattered wave from the defect. The analysis of the transient ultrasonic field distribution reveals that the received signal is dominated by surface wave energy.
The presence of the surface wave signal poses a significant challenge to detecting internal defects and image quality [14,15,16,17,18,19,33]. The A-scan signal constitutes reflections from the surface and scattered waves from defects. Figure 5 shows A-scans for RC slab specimens with and without void defects. Figure 6 shows the original and denoised A-scans of the echo signal for the RC slab specimen that does not have voids. Figure 7 shows the original and denoised A-scans of the echo signal for the RC slab specimen with a void.
Figure 8 shows the denoised A-scan of the case with a defect void and the extracted envelope from denoised A-scans without void. The envelope represents the standard surface wave decay, which can be used to calibrate any abnormal wave peak that is not from the surface wave.
In Figure 8, the yellow circle indicates that the denoised A-scan's peak is around 80 microseconds, significantly higher than the envelope that denotes the surface wave threshold. This peak can be recognized as the echo peak of the internal defect void reflection wave. Using this identified defect echo peak and peak surface, the delayed time of relevance can be determined. From there, Equation (1) can compute the defect void's location or depth. The outcomes are presented in Table 1 and compared with the UPE device results and the specimen void fabrication location. The new approach provides more precise results than the UPE device map.
5. Conclusions
This study aims to quantitatively evaluate defects in the concrete deck slabs using the ultrasonic pulse-echo technique. Advanced signal processing methods are used to accurately evaluate the location of the defects in concrete decks, whereas commercialized ultrasonic devices usually give qualitative information about defects. The study involved designing and testing two validation concrete deck slab specimens containing artificial void defects. To map the internal void defect of these specimens, a commercial ultrasonic pulse-echo device based on the ultrasonic shear-wave test method, employing dry-point-contact transmitting and receiving transducers, was employed.
By utilizing this approach, the researchers were able to obtain a comprehensive understanding of the internal void defect of the concrete deck slab specimens. The recorded data from the ultrasonic pulse-echo device was analyzed using the proposed methods to accurately evaluate the defects’ locations in the concrete deck slab specimens. The new method consists of benchmark envelope estimation and the denoise of the echo signal, which identifies the weak stochastic and non-stationary echo signal from defects. The study’s findings indicate that the proposed approach accurately identified the voids and defects within the concrete deck slab specimen. In contrast, the commercial ultrasonic pulse-echo device’s map for the void defects of the concrete deck slabs can only give qualitative results.
Acknowledgments
The authors wish to extend their gratitude for the financial backing provided by the West Virginia Department of Transportation (WVDOT) in support of the research project titled “Corrosion Research to Maintain and Sustain Infrastructure in West Virginia.” It is worth noting that the findings, conclusions, or recommendations expressed in this study are solely those of the author and do not necessarily reflect the opinions or perspectives of the WVDOT. Additionally, the authors would like to thank Dr. Hai Nguyen, Dr. Tu Nguyen, Dr. Kien Dinh, and Dr. Cumhur Cosgun for their invaluable assistance throughout this research project’s experiments.
References
- ACI Committee 228, Nondestructive Test Methods for Evaluation of Concrete in Structures (ACI 228.2R-13), American Concrete Institute Farmington Hills, MI, 2013, 82 pp.
- Hosseini, Z., Momayez, M., Hassani, F., Lévesque, D.; Thompson, D.; and Chimenti, D. E., Detection of Inclined Cracks inside Concrete Structures by Ultrasonic SAFT, AIP Conference Proceedings, V. 975, 2008, pp. 1298-1304. [CrossRef]
- Tong, J. H., Chiu, C. L., and Wang, C. Y., Improved Synthetic Aperture Focusing Technique by Hilbert-Huang Transform for Imaging Defects inside a Concrete Structure, IEEE Transactions on Ultrasonics, Ferroelectrics, and Frequency Control, 2010., V. 57, No. 11.
- De La Haza, A., Samokrutov, A., and Samokrutov, P., Assessment of Concrete Structures Using the Mira and Eyecon Ultrasonic Shear Wave Devices and the SAFT-C Image Reconstruction Technique, Construction and Building Materials, V. 38, 2013, pp. 1276–1291. [CrossRef]
- Felice, M., and Fan, Z., Sizing of Flaws using Ultrasonic Bulk Wave Testing: A Review, Ultrasonics, Volume 88,2018, pp. 26–42.
- Blitz, J., and Simpson, G. Ultrasonic Methods of Nondestructive Testing, Springer: Berlin/Heidelberg, Germany, 1995.
- Karaiskos, G.; Deraemaeker, A.; Aggelis, D.; Van Hemelrijck, D. Monitoring of Concrete Structures using the Ultrasonic Pulse Velocity Method. Smart Mater. Struct. 2015, 24, 113001. [Google Scholar] [CrossRef]
- Hoegh, K.; Khazanovich, L.; Maser, K.; Tran, N. Evaluation of Ultrasonic Technique for Detecting Delamination in Asphalt Pavements, Transportation Research Record. Journal of the Transportation Research Board 2012, 2306, 105–110. [Google Scholar] [CrossRef]
- Hoegh, K., Khazanovich, L., Ferraro, C., and Clayton, D., Ultrasonic Linear Array Validation via Concrete Test Blocks, AIP Conference Proceedings 1650, 83 (2015). [CrossRef]
- Samokrutov, A., Bishko, A., and Shevaldykin, V., Ultrasonic Echo-Pulse Tomography of Concrete Using Shear Waves Low-Frequency Phased Antenna Arrays, NDT.net Issue: 2008-11, Special Issue of e-Journal of Nondestructive Testing, 2008, Vol. 13(11).
- Bishko, A., Samokrutov, A., and Shevaldykin, V., Ultrasonic Echo-Pulse Tomography of Concrete Using Shear Waves Low-Frequency Phased Antenna Arrays, 17th World Conference on Nondestructive Testing, 2008, pp. 25–28, Shanghai, China.
- Zhao, H., Song, P., Urban, M., Kinnick, R., Yin, M., Greenleaf, J., and Chen Shigao, S., Bias Observed in Time-of-Flight Shear Wave Speed Measurements Using Radiation Force of a Focused Ultrasound Beam, Ultrasound in Medicine and Biology, 2011, 37(11), pp. 1884-1892.
- Deng, Y., Rouze, N., Palmeri, M., and Nightingale, K., System Dependent Sources of Error in Time-of-Flight Shear Wave Speed Measurements, 2015 IEEE International Ultrasonics Symposium (IUS), Taipei, Taiwan, 2015, pp. 1–4. [CrossRef]
- Haslinger, S., Lowe, M., Huthwaite, P., Craster, R., and Shi, F., Elastic Shear Wave Scattering by Randomly Rough Surfaces, Journal of the Mechanics and Physics of Solids, V. 137, 2020, 103852.
- Yufeng Deng, Ned C. Rouze, Mark L. Palmeri, and Kathryn R. Nightingale, On System Dependent Sources of Uncertainty and Bias in Ultrasonic Quantitative Shear Wave Imaging, IEEE Trans Ultrason Ferroelectr Frequency Control. 2016, 63(3), pp. 381–393.
- De La Haza, A., Samokrutov, A., and Samokrutov, P., Assessment of Concrete Structures using the Mira and Eyecon Ultrasonic Shear Wave Devices and the SAFT-C Image Reconstruction Technique, Construction and Building Materials, 38, 2013, pp.1276–1291.
- Lin, S.; Shams, S., Choi, H., and Azari, H., Ultrasonic Imaging of Multi-Layer Concrete Structures, NDT & E International, Volume 98, 2018, pp. 101–109.
- Kwon, H.; Joh, c.; Chin, W. Pulse Peak Delay-Total Focusing Method for Ultrasonic Tomography on Concrete Structure. Appl. Sci. 2021, 11, 1741. [Google Scholar] [CrossRef]
- Harshit, J.; Patankar, V. Advances in Ultrasonic Instrumentation for Inspection of Concrete/RCC Structures; Elsevier: Amsterdam, the Netherlands, 2019. [Google Scholar]
- Zatar, A., Nguyen, H., and Nghiem, h., Ultrasonic Pitch and Catch Technique for Non-destructive Testing of Reinforced Concrete Slabs, Journal of Infrastructure Preservation and Resilience, 2020, pp. 1–12.
- Ohara, Y.; Kikuchi, K.; Tsuji, T.; Mihara, T. Development of Low-Frequency Phased Array for Imaging Defects in Concrete Structures. Sensors 2021, 21, 7012. [Google Scholar] [CrossRef]
- San Emeterio, J., and Rodriguez-Hernandez, M., Wavelet Denoising of Ultrasonic A-Scans for Detection of Weak Signals, 2012, 19th International Conference on Systems, Signals and Image Processing (IWSSIP), Vienna, Austria, 2012, pp. 48–51.
- Hoseini, M., Zuo, M., and Wang, X., Denoising Ultrasonic Pulse-echo Signal using Two-dimensional Analytic Wavelet Thresholding, Measurement, Vol. 45, Issue 3, 2012, pp. 255–267.
- Sharma, G., Kumar, A., and Jayakumar, T., Ensemble Empirical Mode Decomposition-Based Methodology for Ultrasonic Testing of Coarse Grain Austenitic Stainless Steels, Ultrasonics, 2015, 57: pp. 167–178.
- Traitement du Signal, Vol. 36, No. 2, 2019, pp. 139-145.
- Orcid, Z., Xu, H., Jiang, B., and Han, F., Wavelet Threshold Ultrasound Echo Signal Denoising Algorithm Based on CEEMDAN, Electronics, 2023, 12(14), 3026.
- Bouchair, A., Selouani, S.A., AND Amrouche, A., Improved Empirical Mode Decomposition Using Optimal Recursive Averaging Noise Estimation for Speech Enhancement, Circuits System Signal Process 41, 2022, pp. 196–223. [CrossRef]
- Zhang, Z., Xie, H., Tong, X., Zhang, H., Liu Y., and Li, B., Denoising for Satellite Laser Altimetry Full-waveform Data Based on EMD-Hurst Analysis, International Journal of Digital Earth, 2020, 13:11, pp. 1212–1229.
- Luo, H., Fang, X., and Ertas, B., Hilbert Transform and its Engineering Applications, AIAA Journal, 2009, 47(4), pp. 923–932.
- Yoo, J.; Cho, S. Advanced Synchronization Check Method Using Hilbert Transform-based Voltage Envelope Analysis. Journal of Electrical Engineering Technology 2023, 18, 4463–4471. [Google Scholar] [CrossRef]
- Zhang, M., and Wei, G., An Integrated EMD Adaptive Threshold Denoising Method for Reduction of Noise in ECG. PLoS One, 2020, 15;15(7):e0235330. [CrossRef]
- Feng, W.; Zhou, X.; Zeng, X.; Yang, C. Ultrasonic Flaw Echo Enhancement Based on Empirical Mode Decomposition. Sensors 2019, 19, 236. [Google Scholar] [CrossRef]
- Duan, D., Ma, H., Yan, Y., and Yang, Q., A Fault Diagnosis Scheme Using Hurst Exponent for Metal Particle Faults in GIL/GIS, Sensors, 2022, 22(3), 862.
- Haider, N., Respiratory sound denoising using Empirical Mode Decomposition, Hurst analysis and Spectral Subtraction, Biomedical Signal Processing and Control, 2021, Volume 64, 102313.
- Zhu, W.; Chen, X.; Li, Z.; Meng, X.; Fan, G.; Shao, W.; Zhang, H. A SAFT Method for the Detection of Void Defect inside a Ballastless Track Structure Using Ultrasonic Array Sensors. Sensors 2019, 19, 4677. [Google Scholar] [CrossRef] [PubMed]
Figure 1.
Schematic of the principles of UPC device.
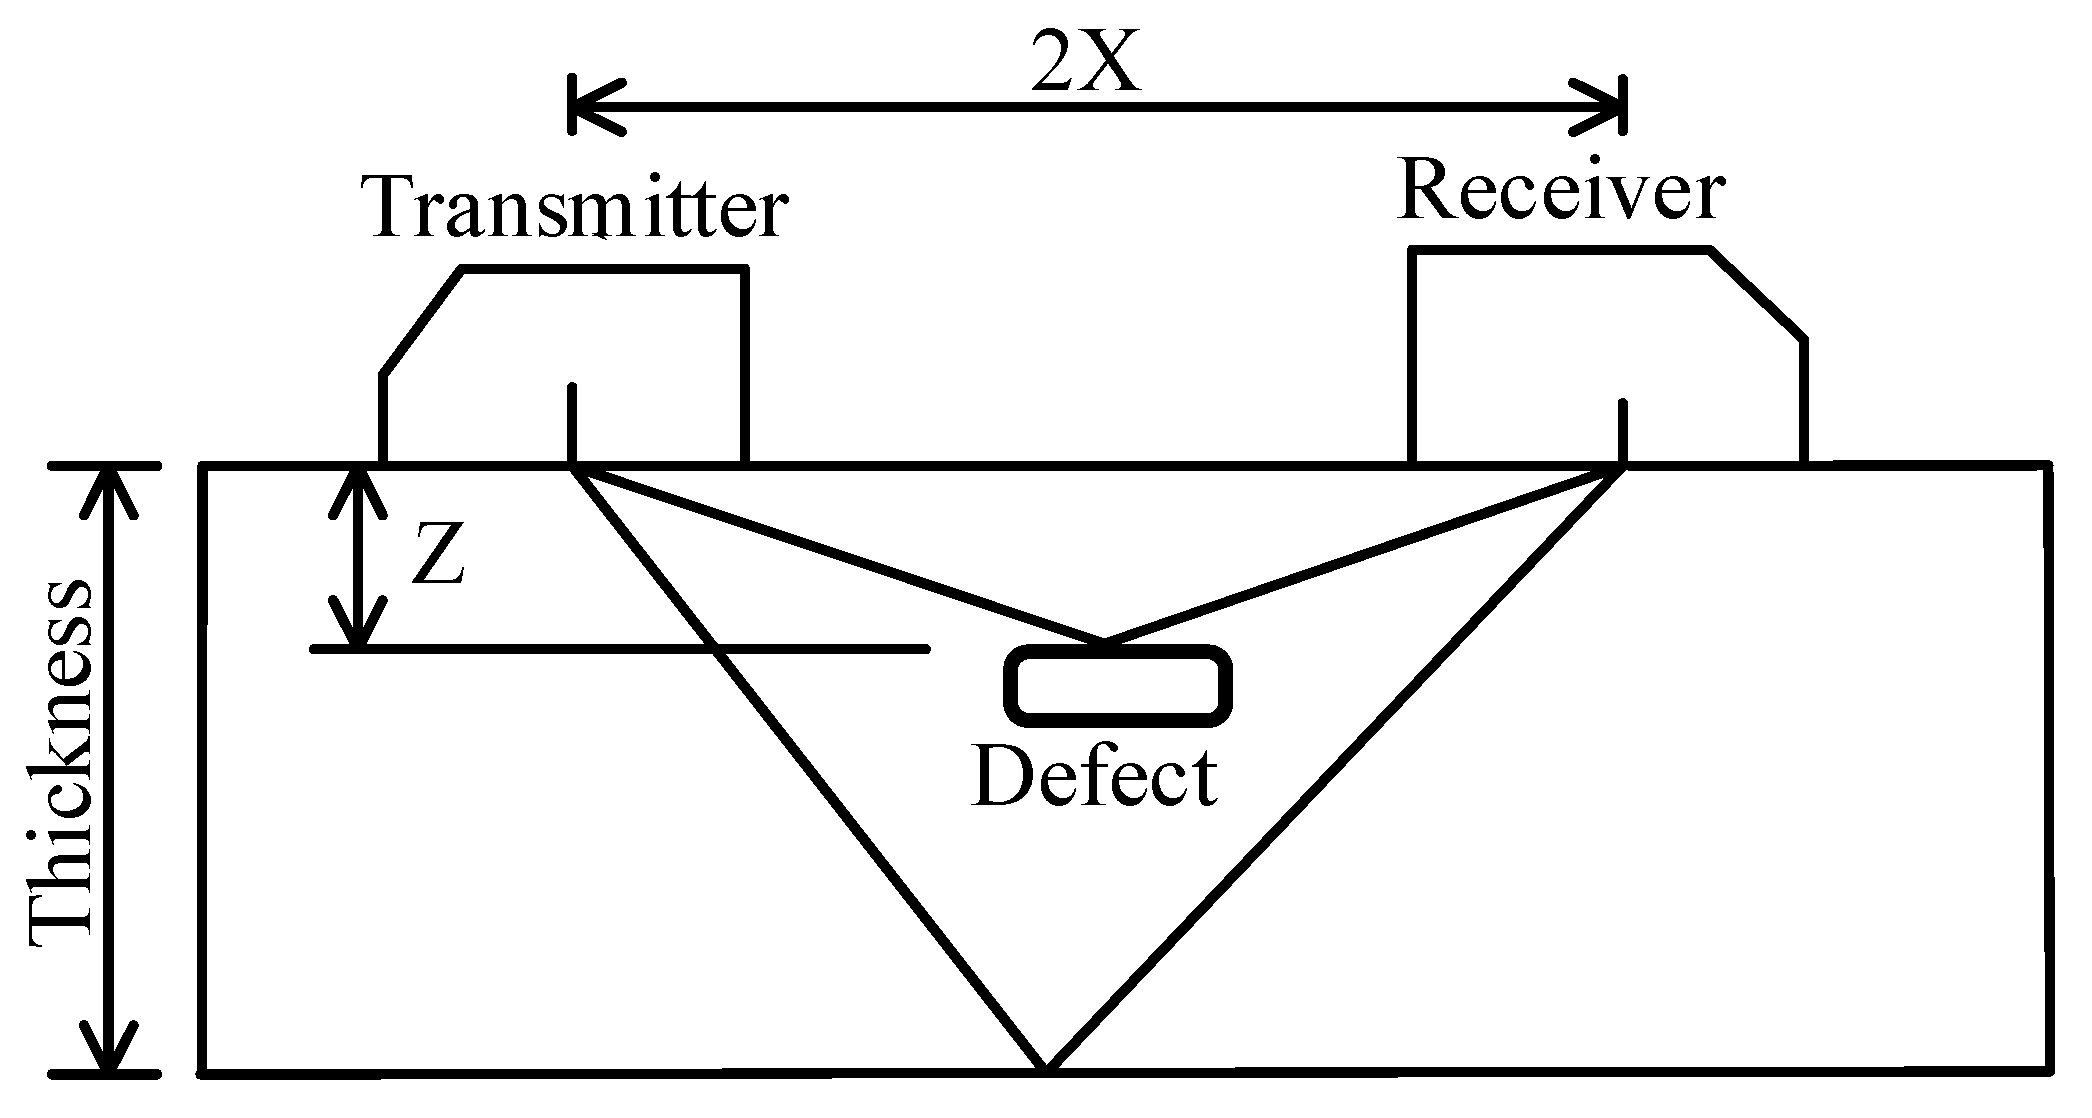
Figure 2.
(a) Reinforced concrete deck slab specimen before concrete placement; (b) Front panel of the UPC device and 48 low-frequency dry-point-contact transducers.
Figure 2.
(a) Reinforced concrete deck slab specimen before concrete placement; (b) Front panel of the UPC device and 48 low-frequency dry-point-contact transducers.
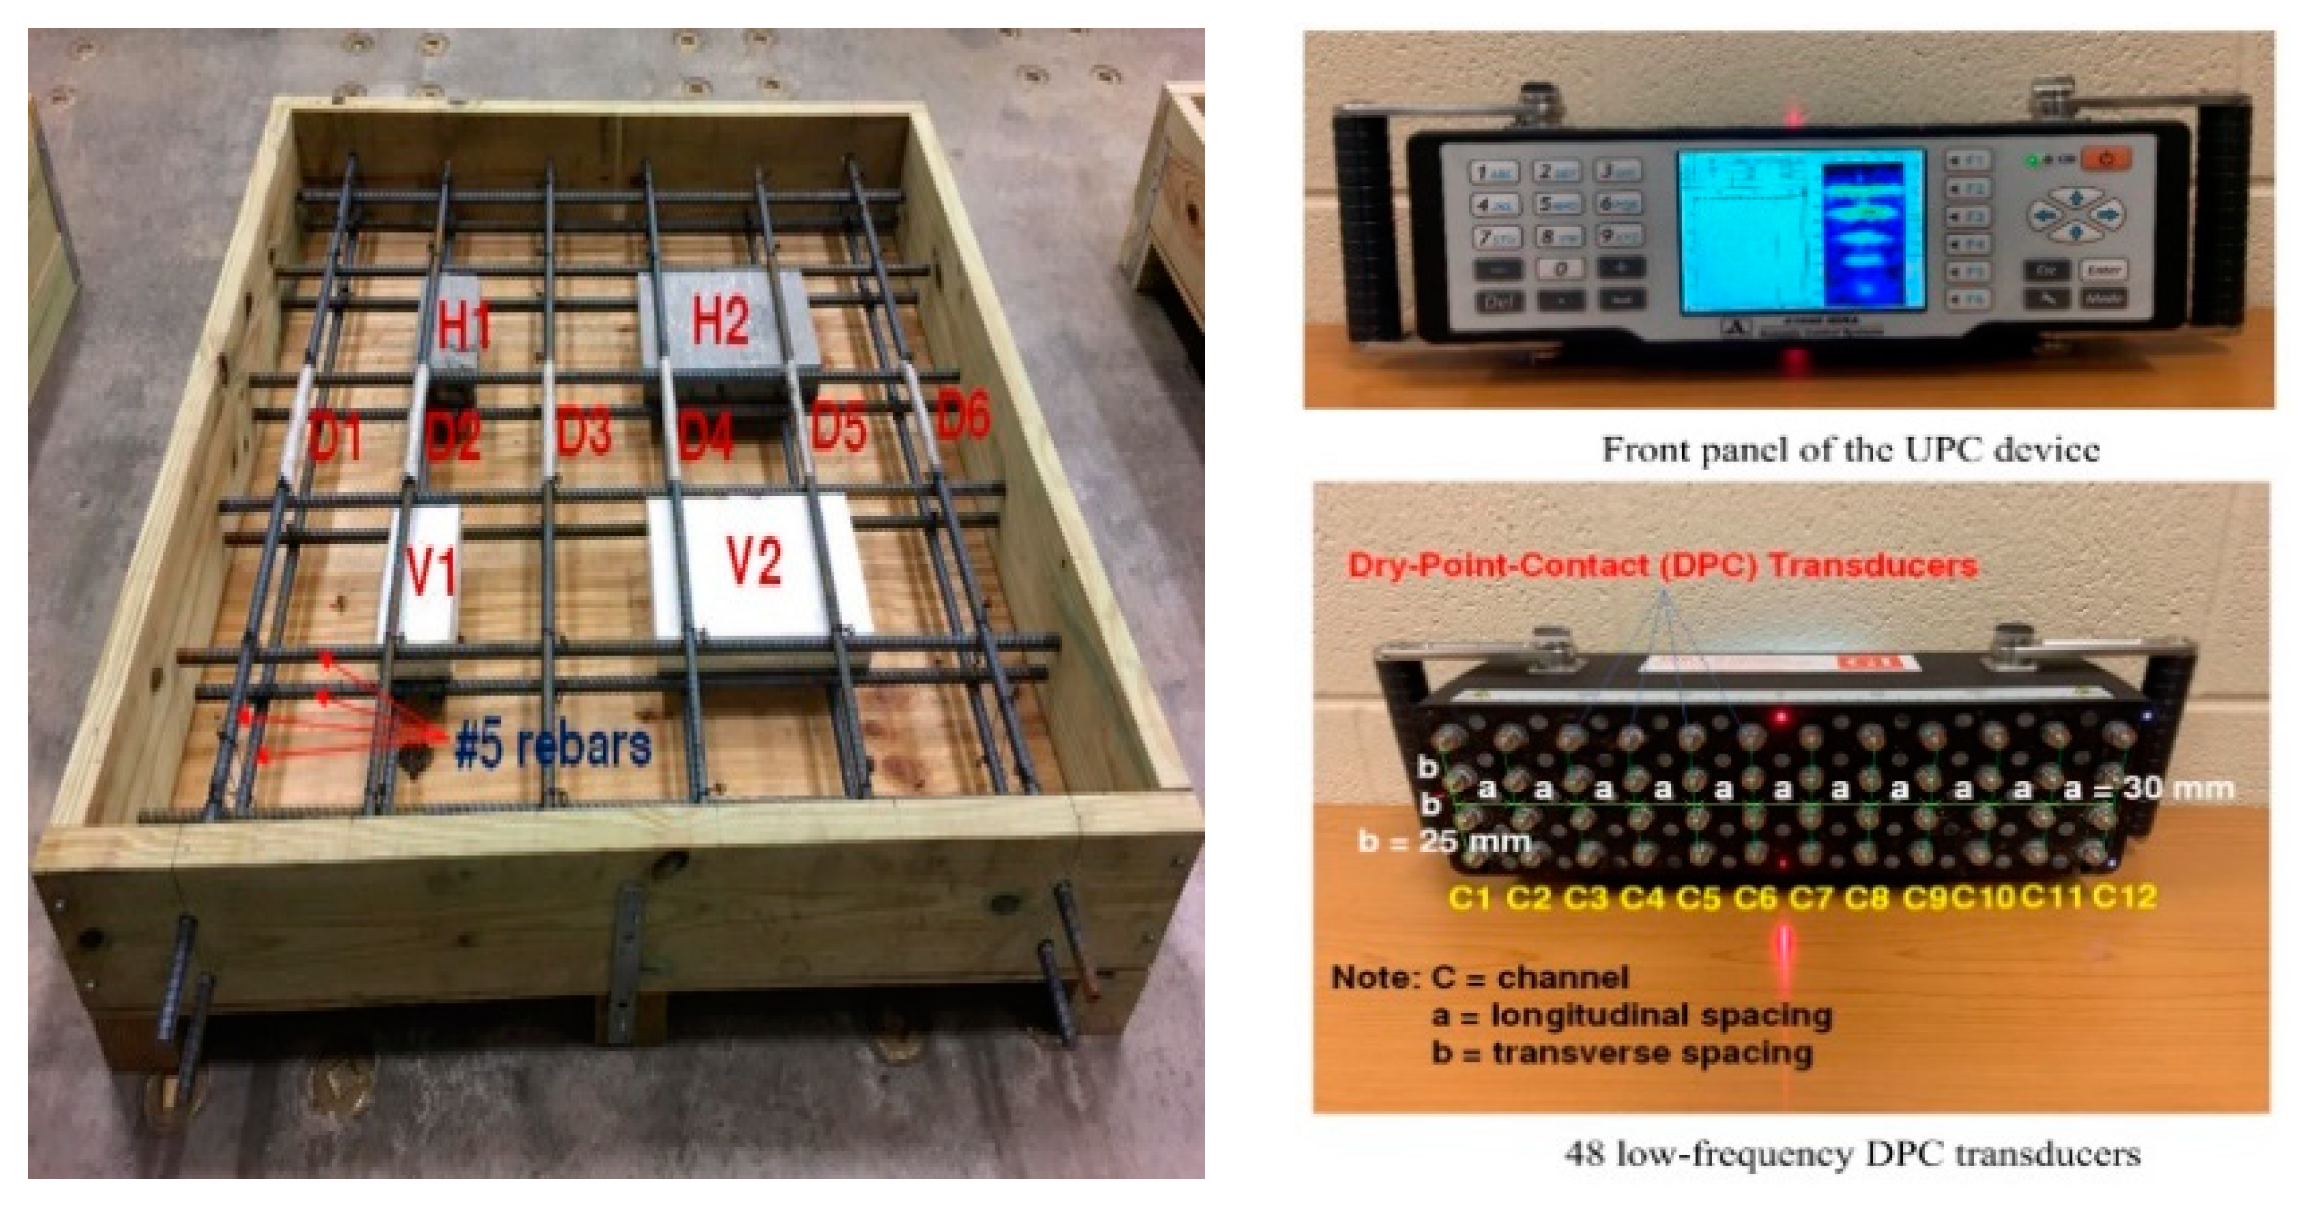
Figure 3.
Basic principles of the UPE device: (A) The first channel of transducers transmits signals that are subsequently received by other channels; (B) A transmitting and a receiving transducer produce an A-scan for void defection.
Figure 3.
Basic principles of the UPE device: (A) The first channel of transducers transmits signals that are subsequently received by other channels; (B) A transmitting and a receiving transducer produce an A-scan for void defection.
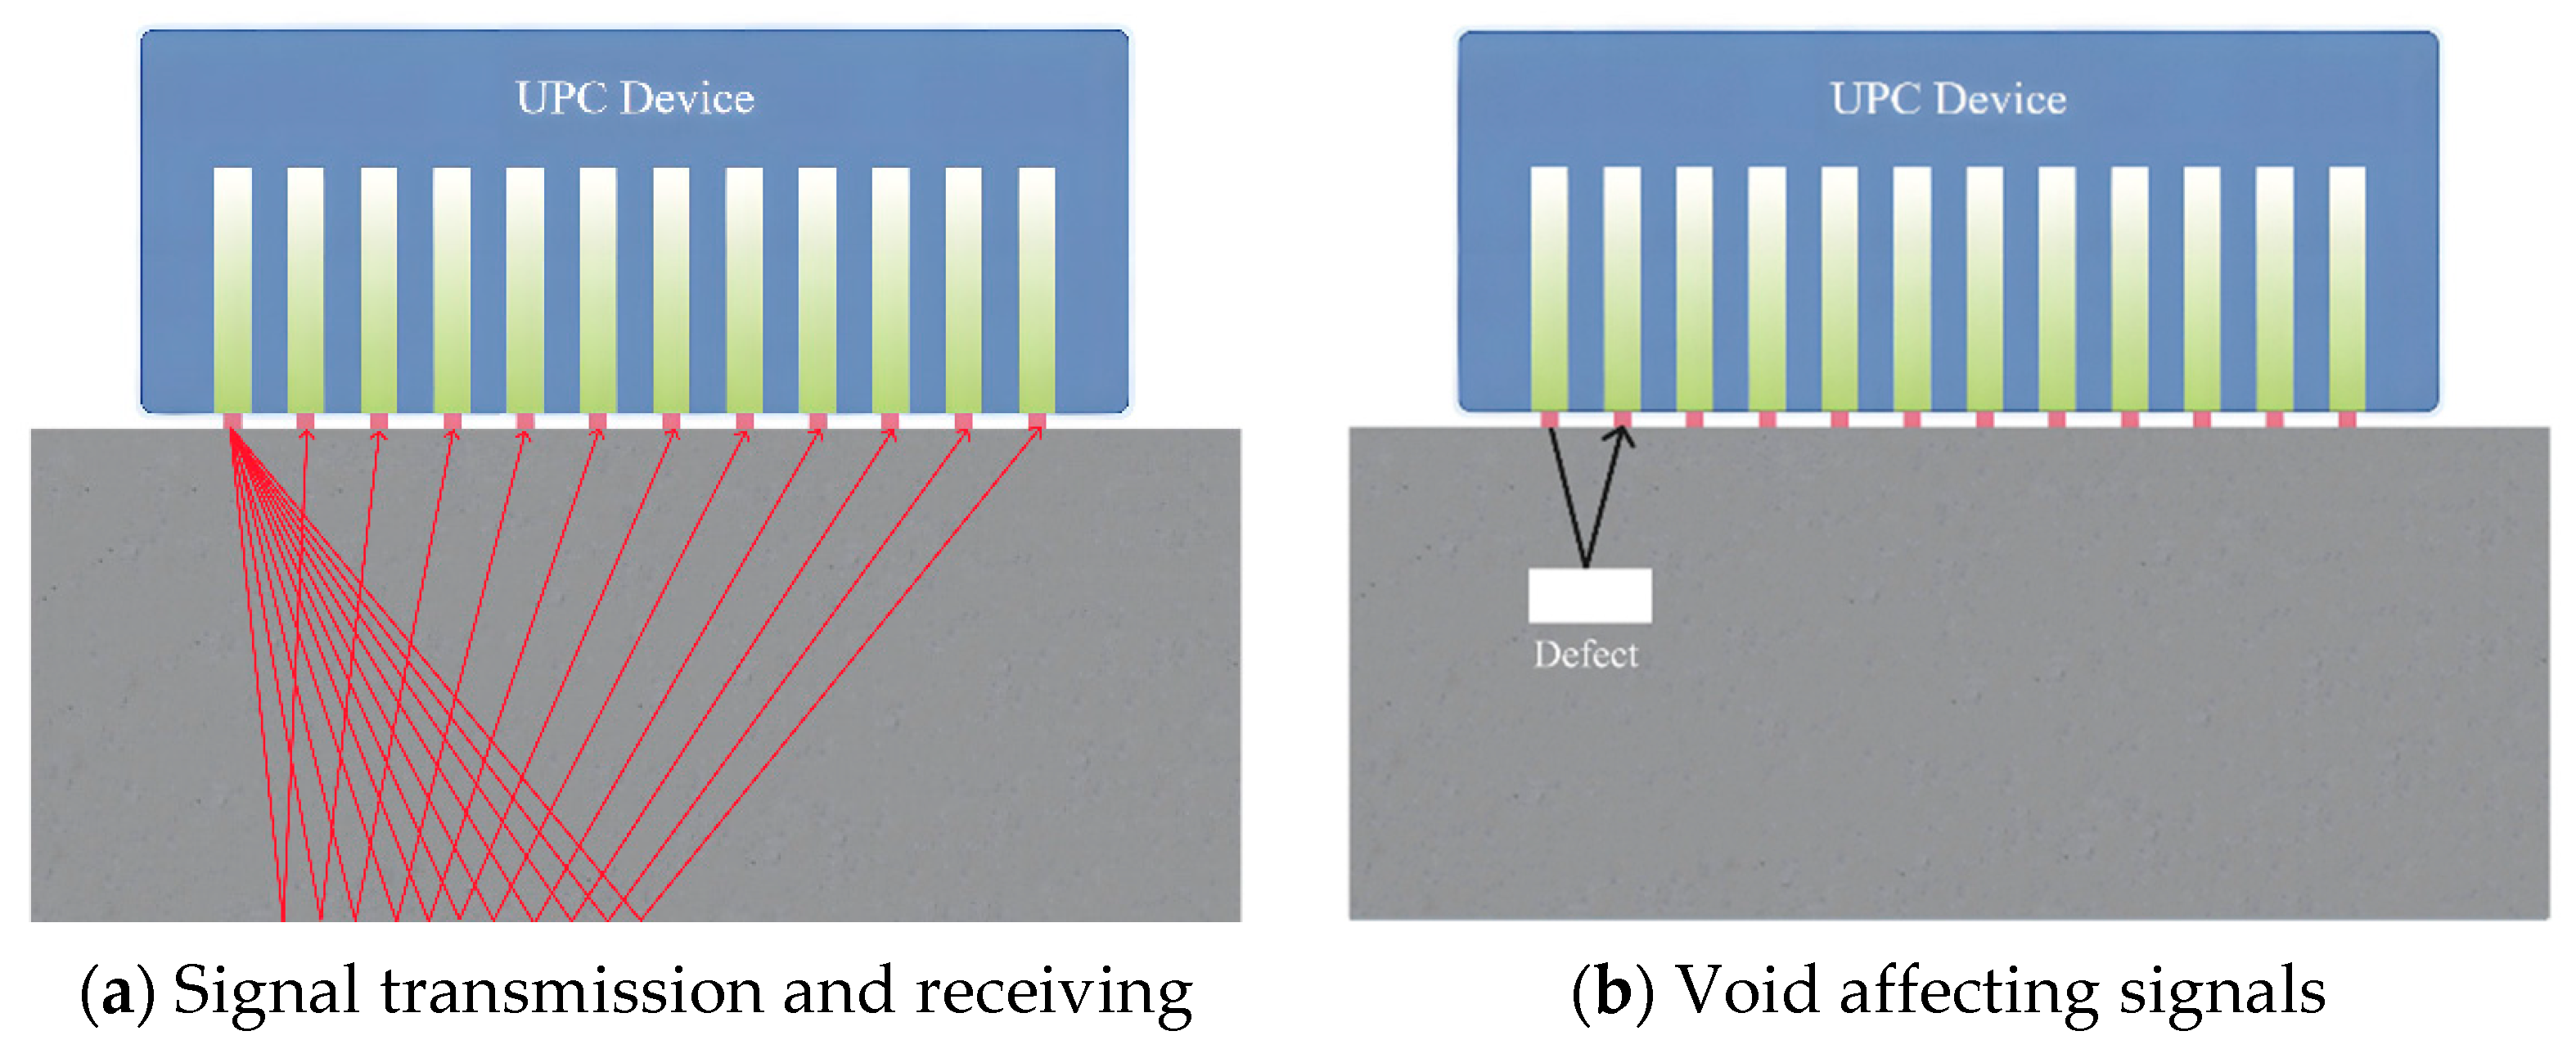
Figure 4.
a) 2D reconstructed image including the voids; b) reconstructed image of void #1; c) color spectrum for signal amplitudes.
Figure 4.
a) 2D reconstructed image including the voids; b) reconstructed image of void #1; c) color spectrum for signal amplitudes.
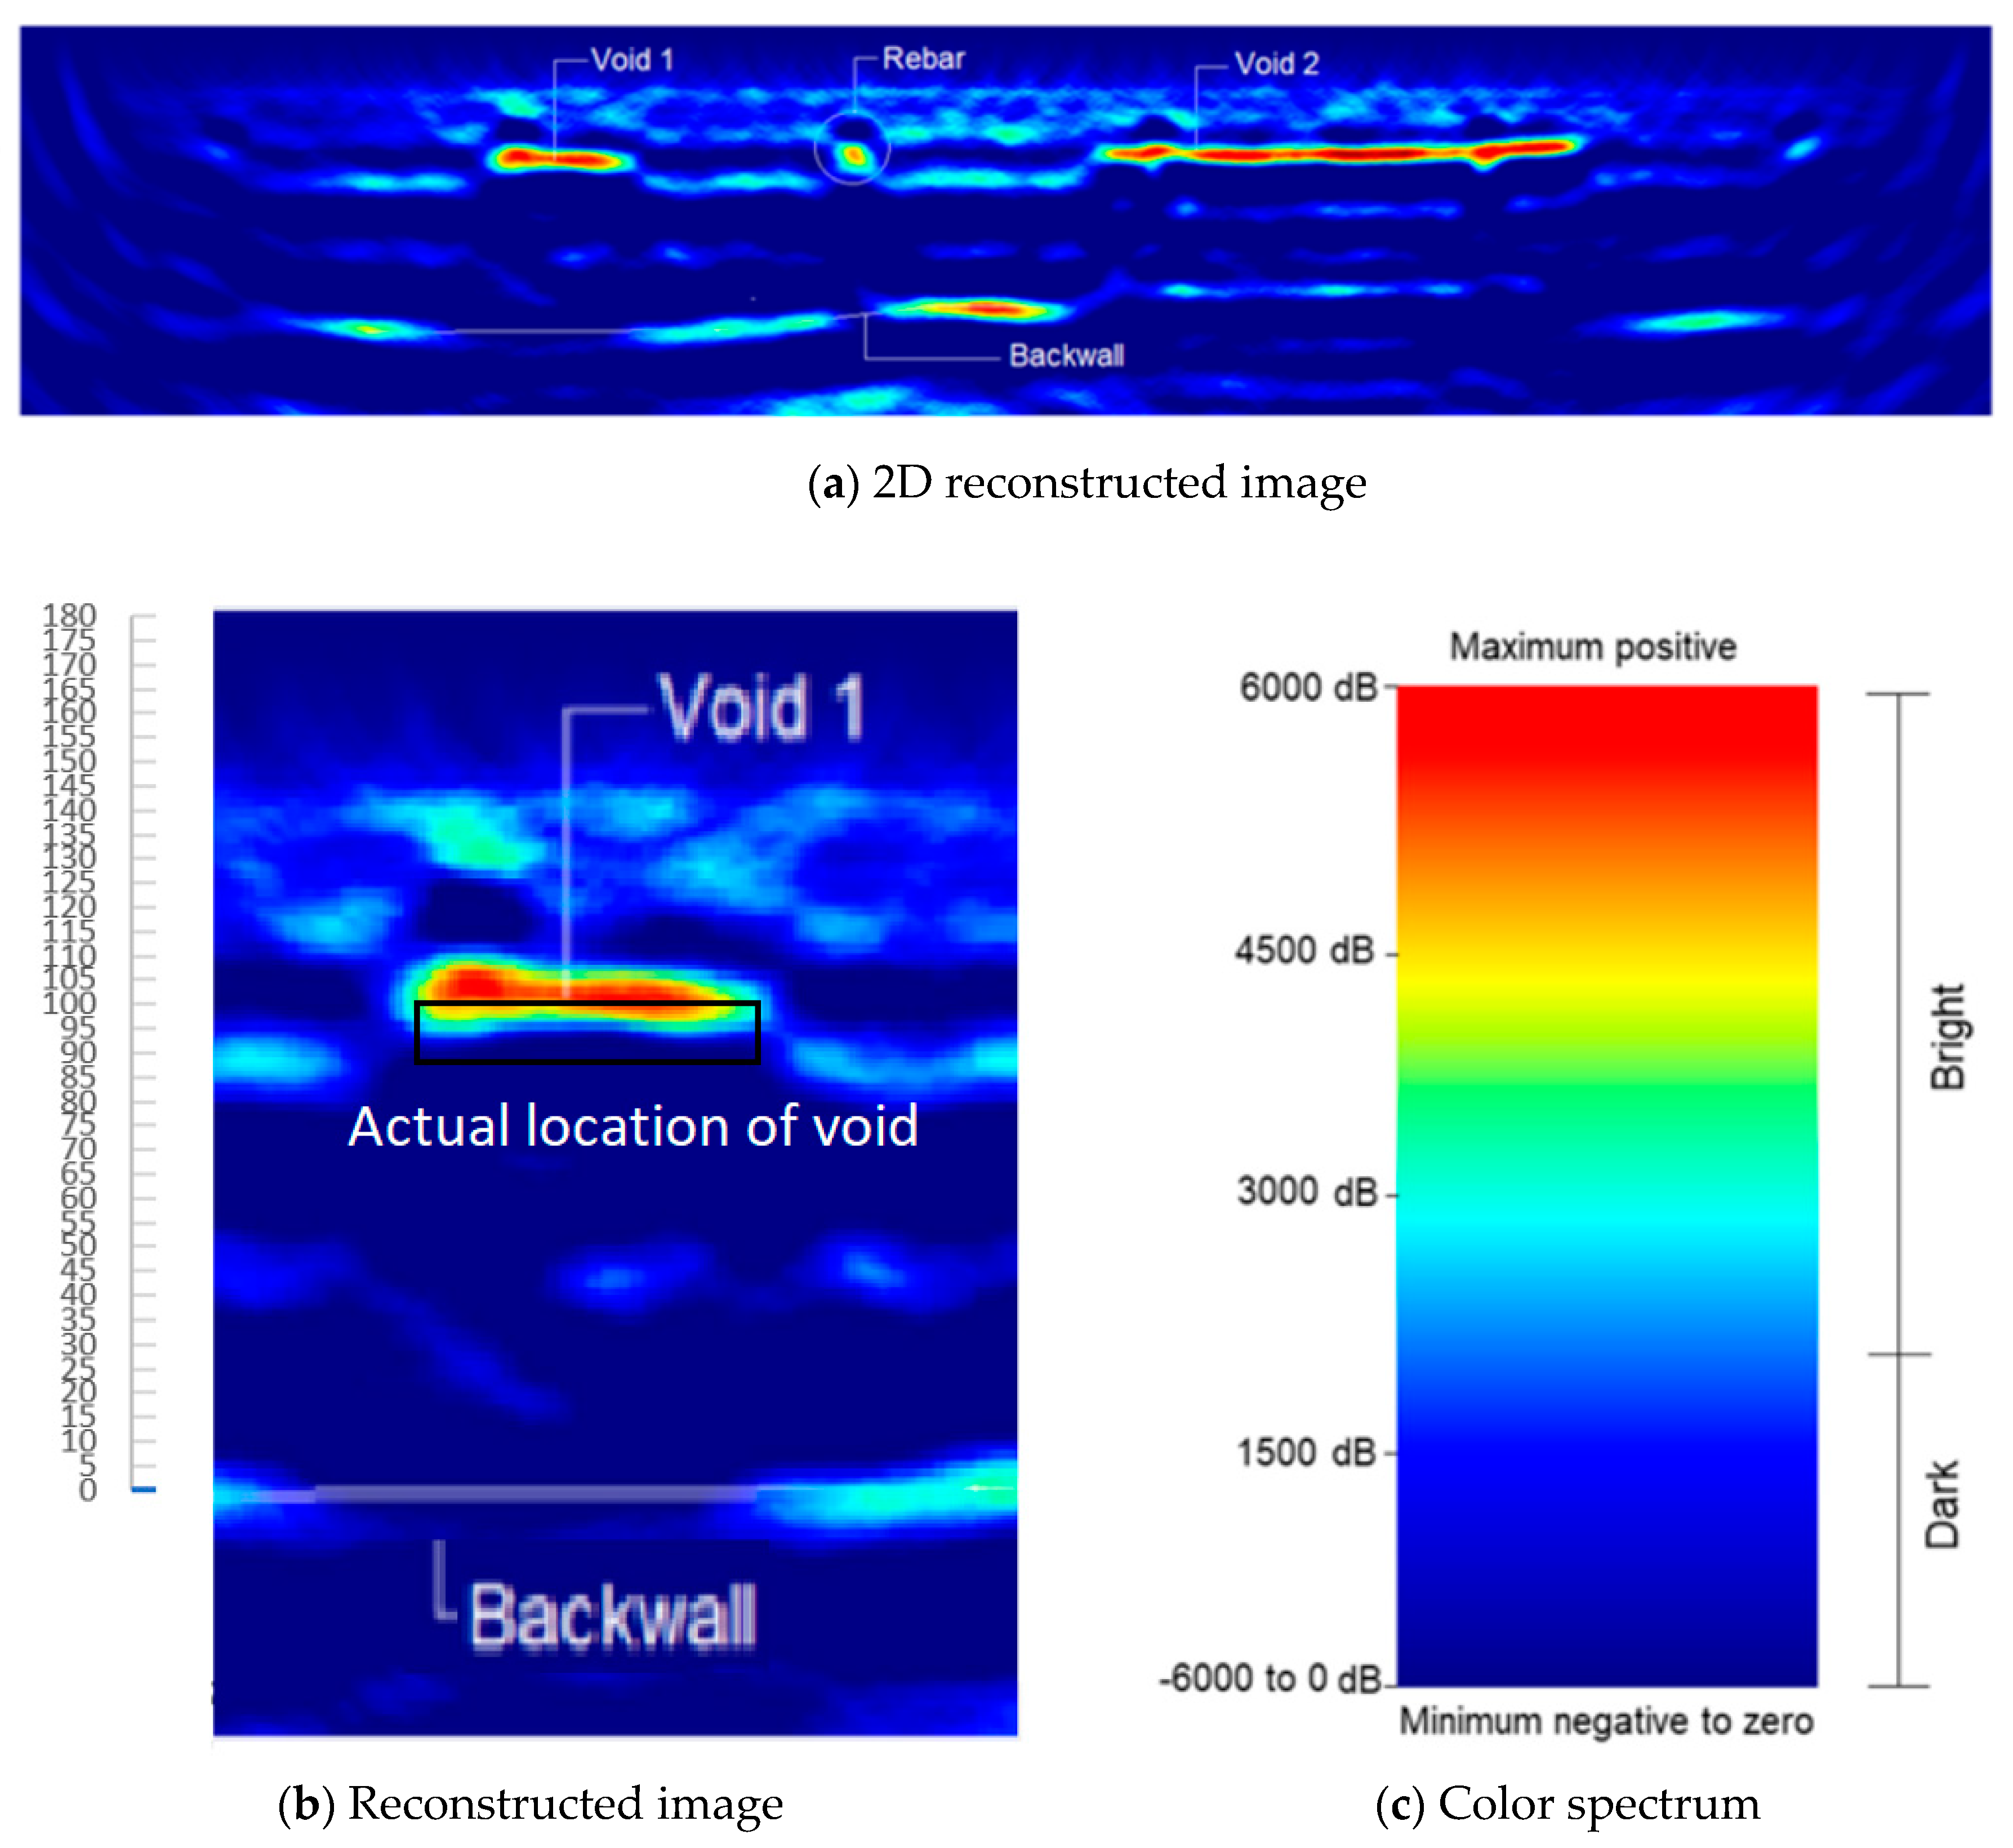
Figure 5.
A-scans for the case without and with voids.
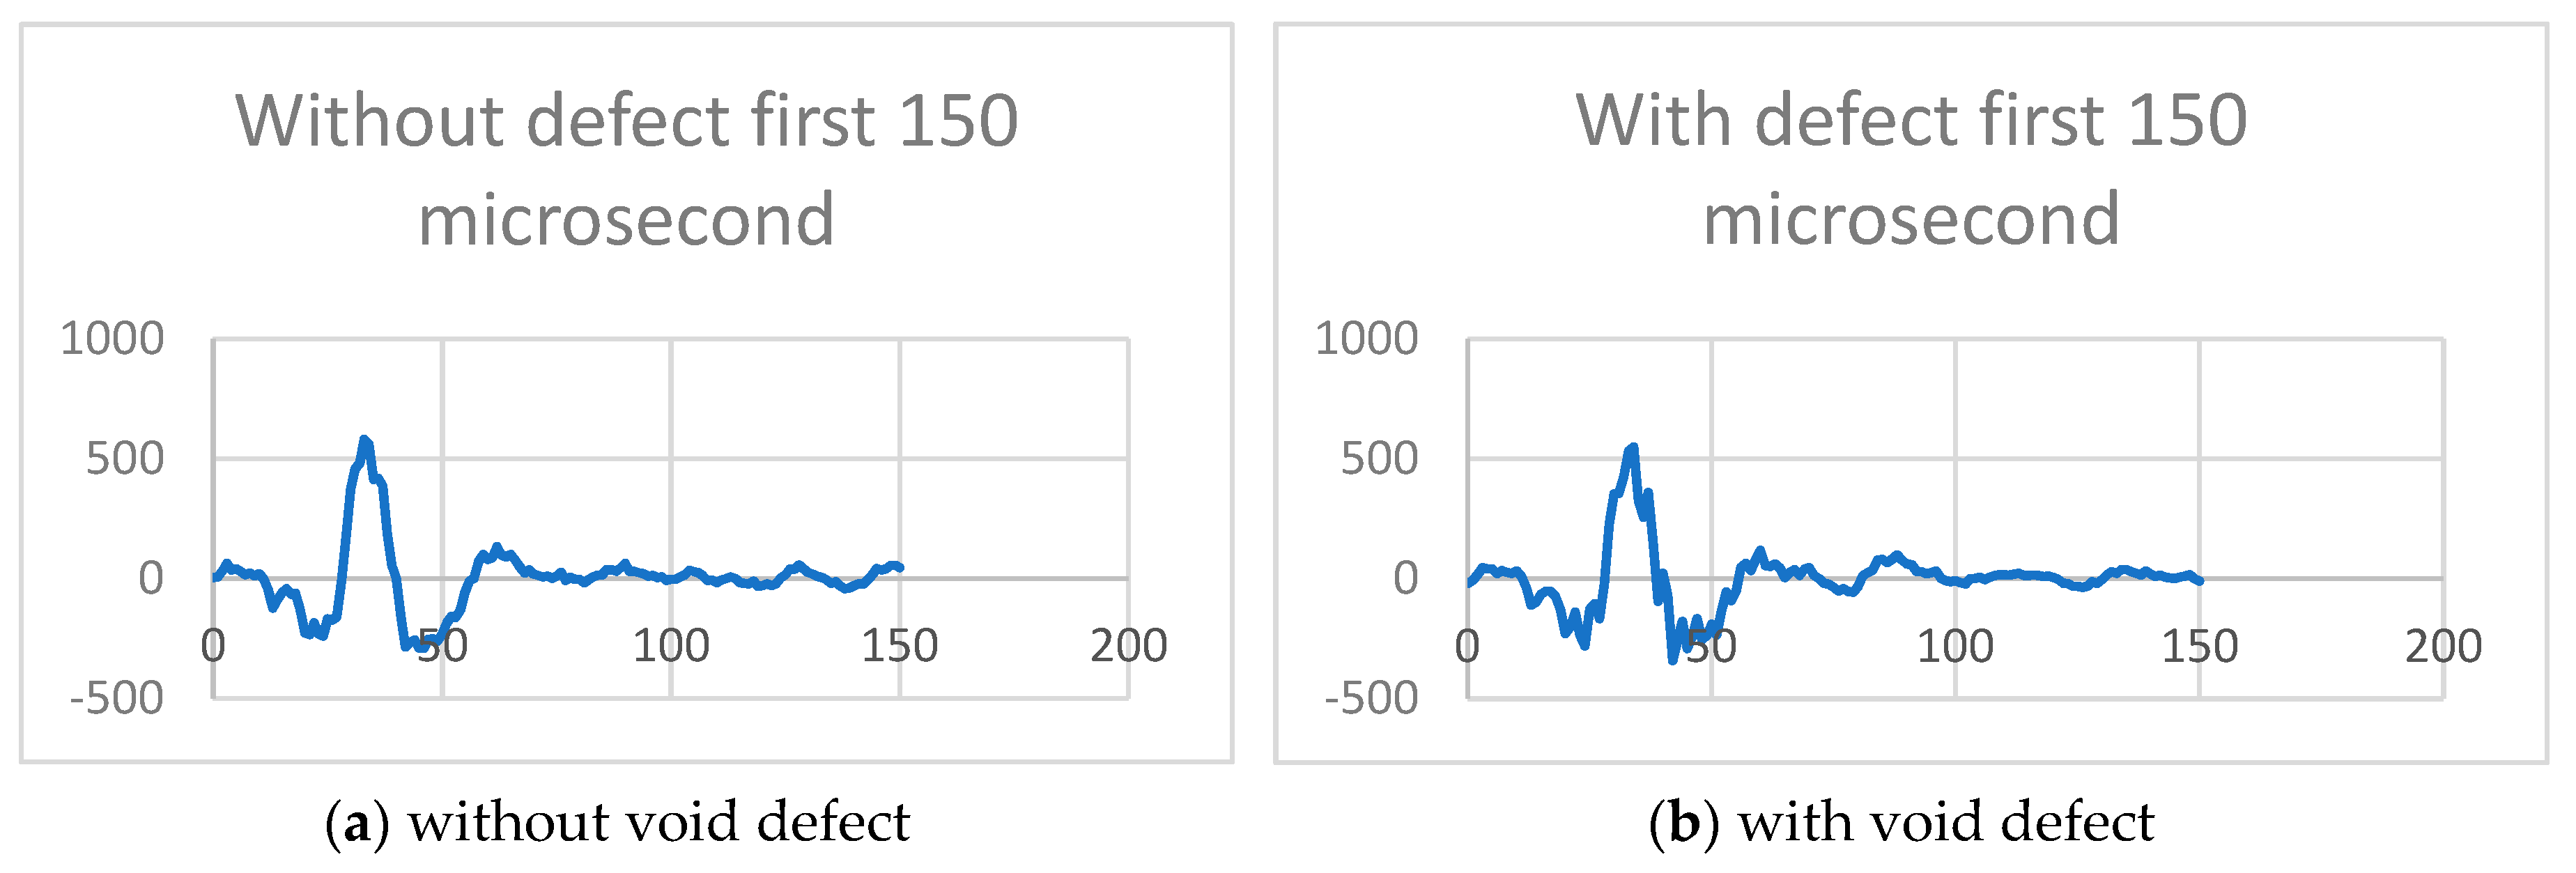
Figure 6.
Original and denoised A-scans of echo signal for RC specimen without void.
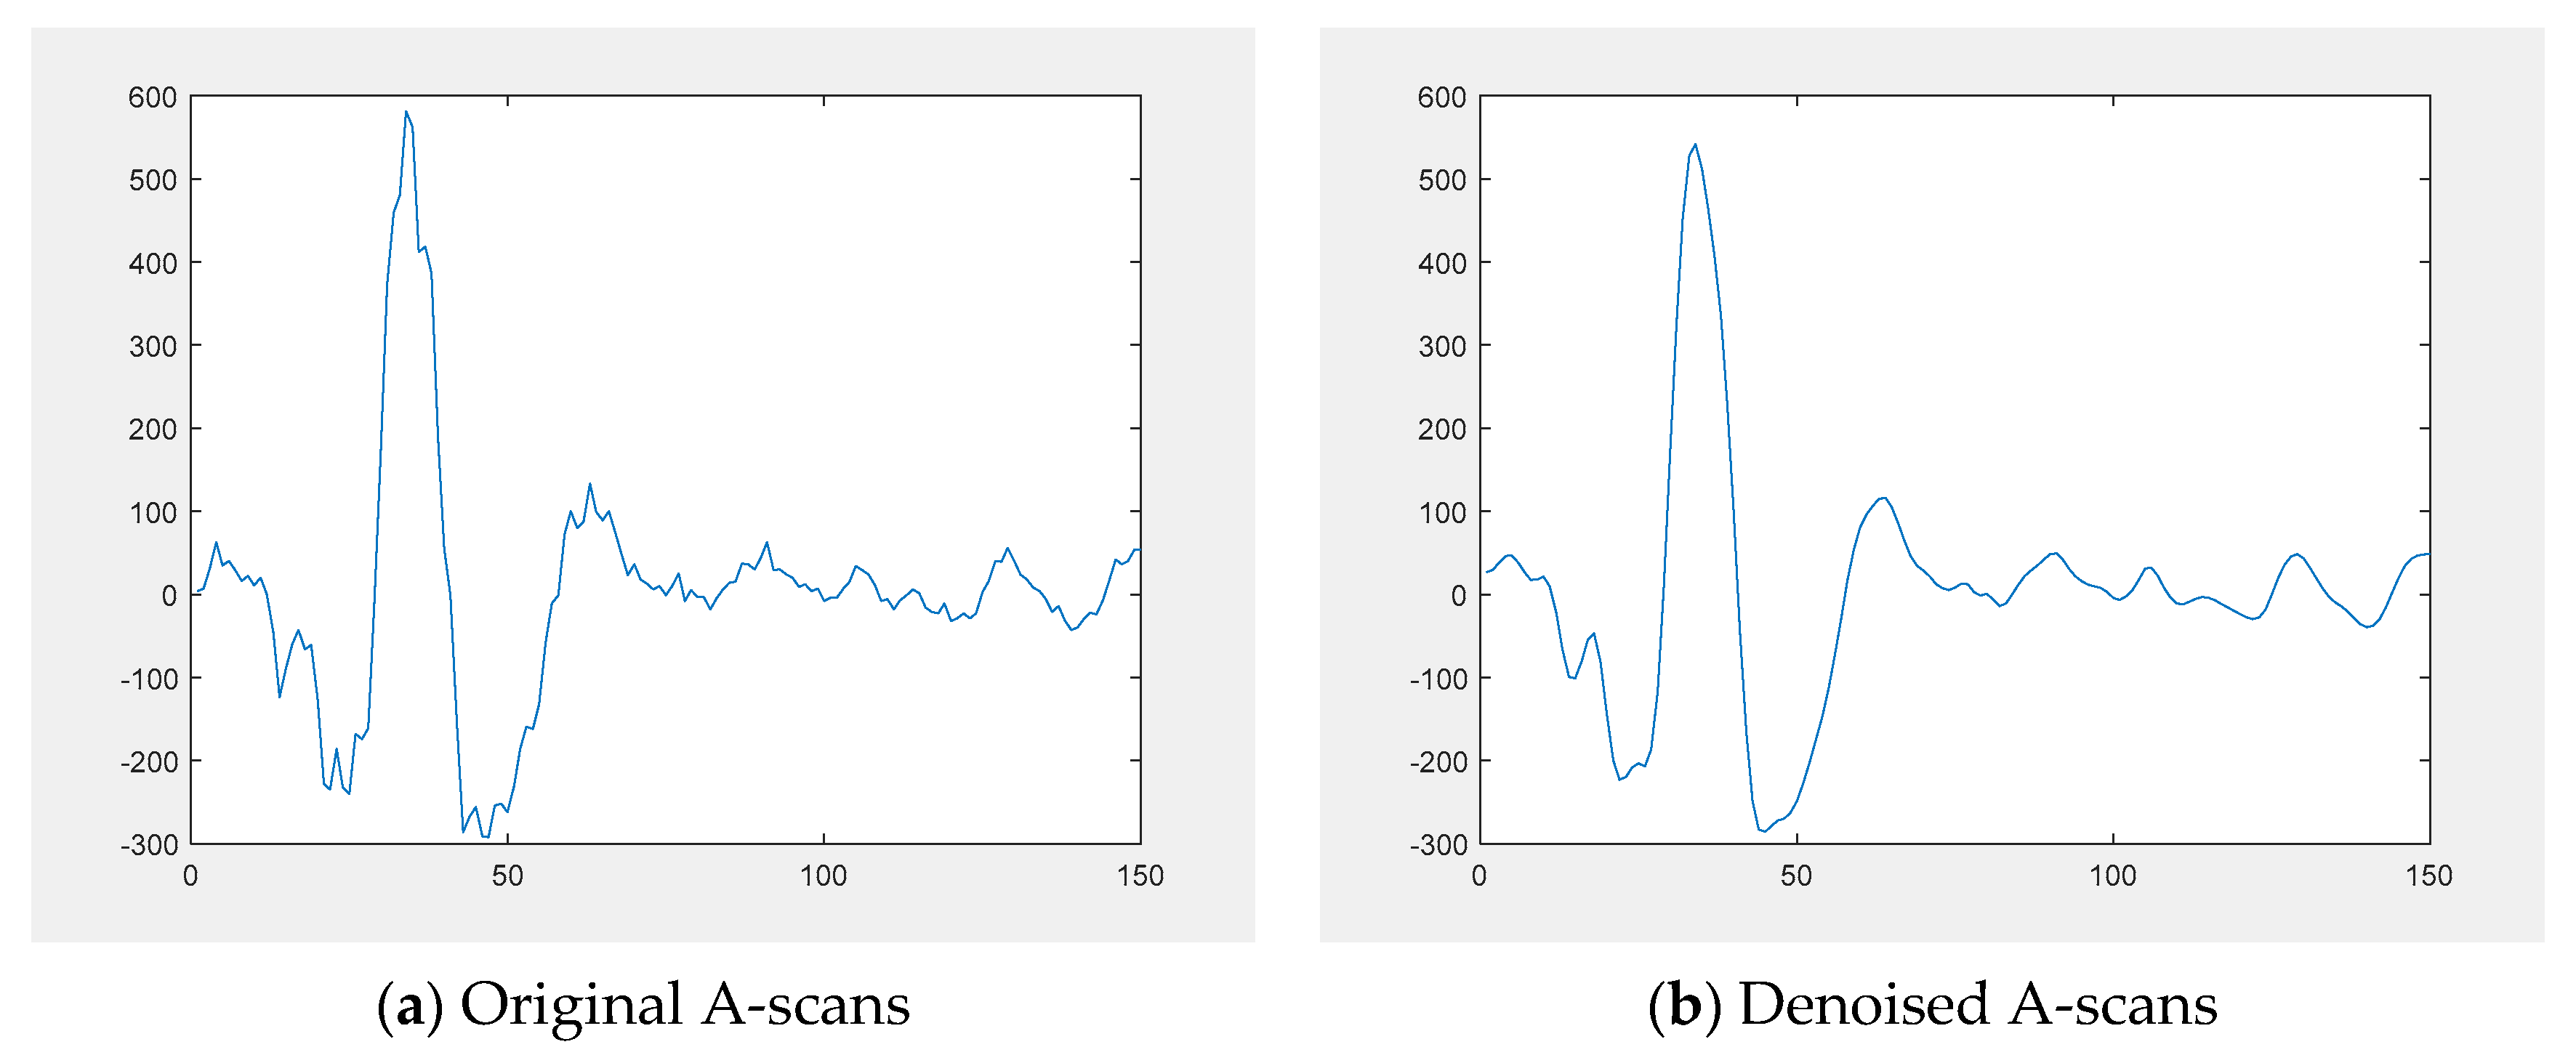
Figure 7.
Original and denoised A-scans of the echo signal for RC specimen with a defect void.
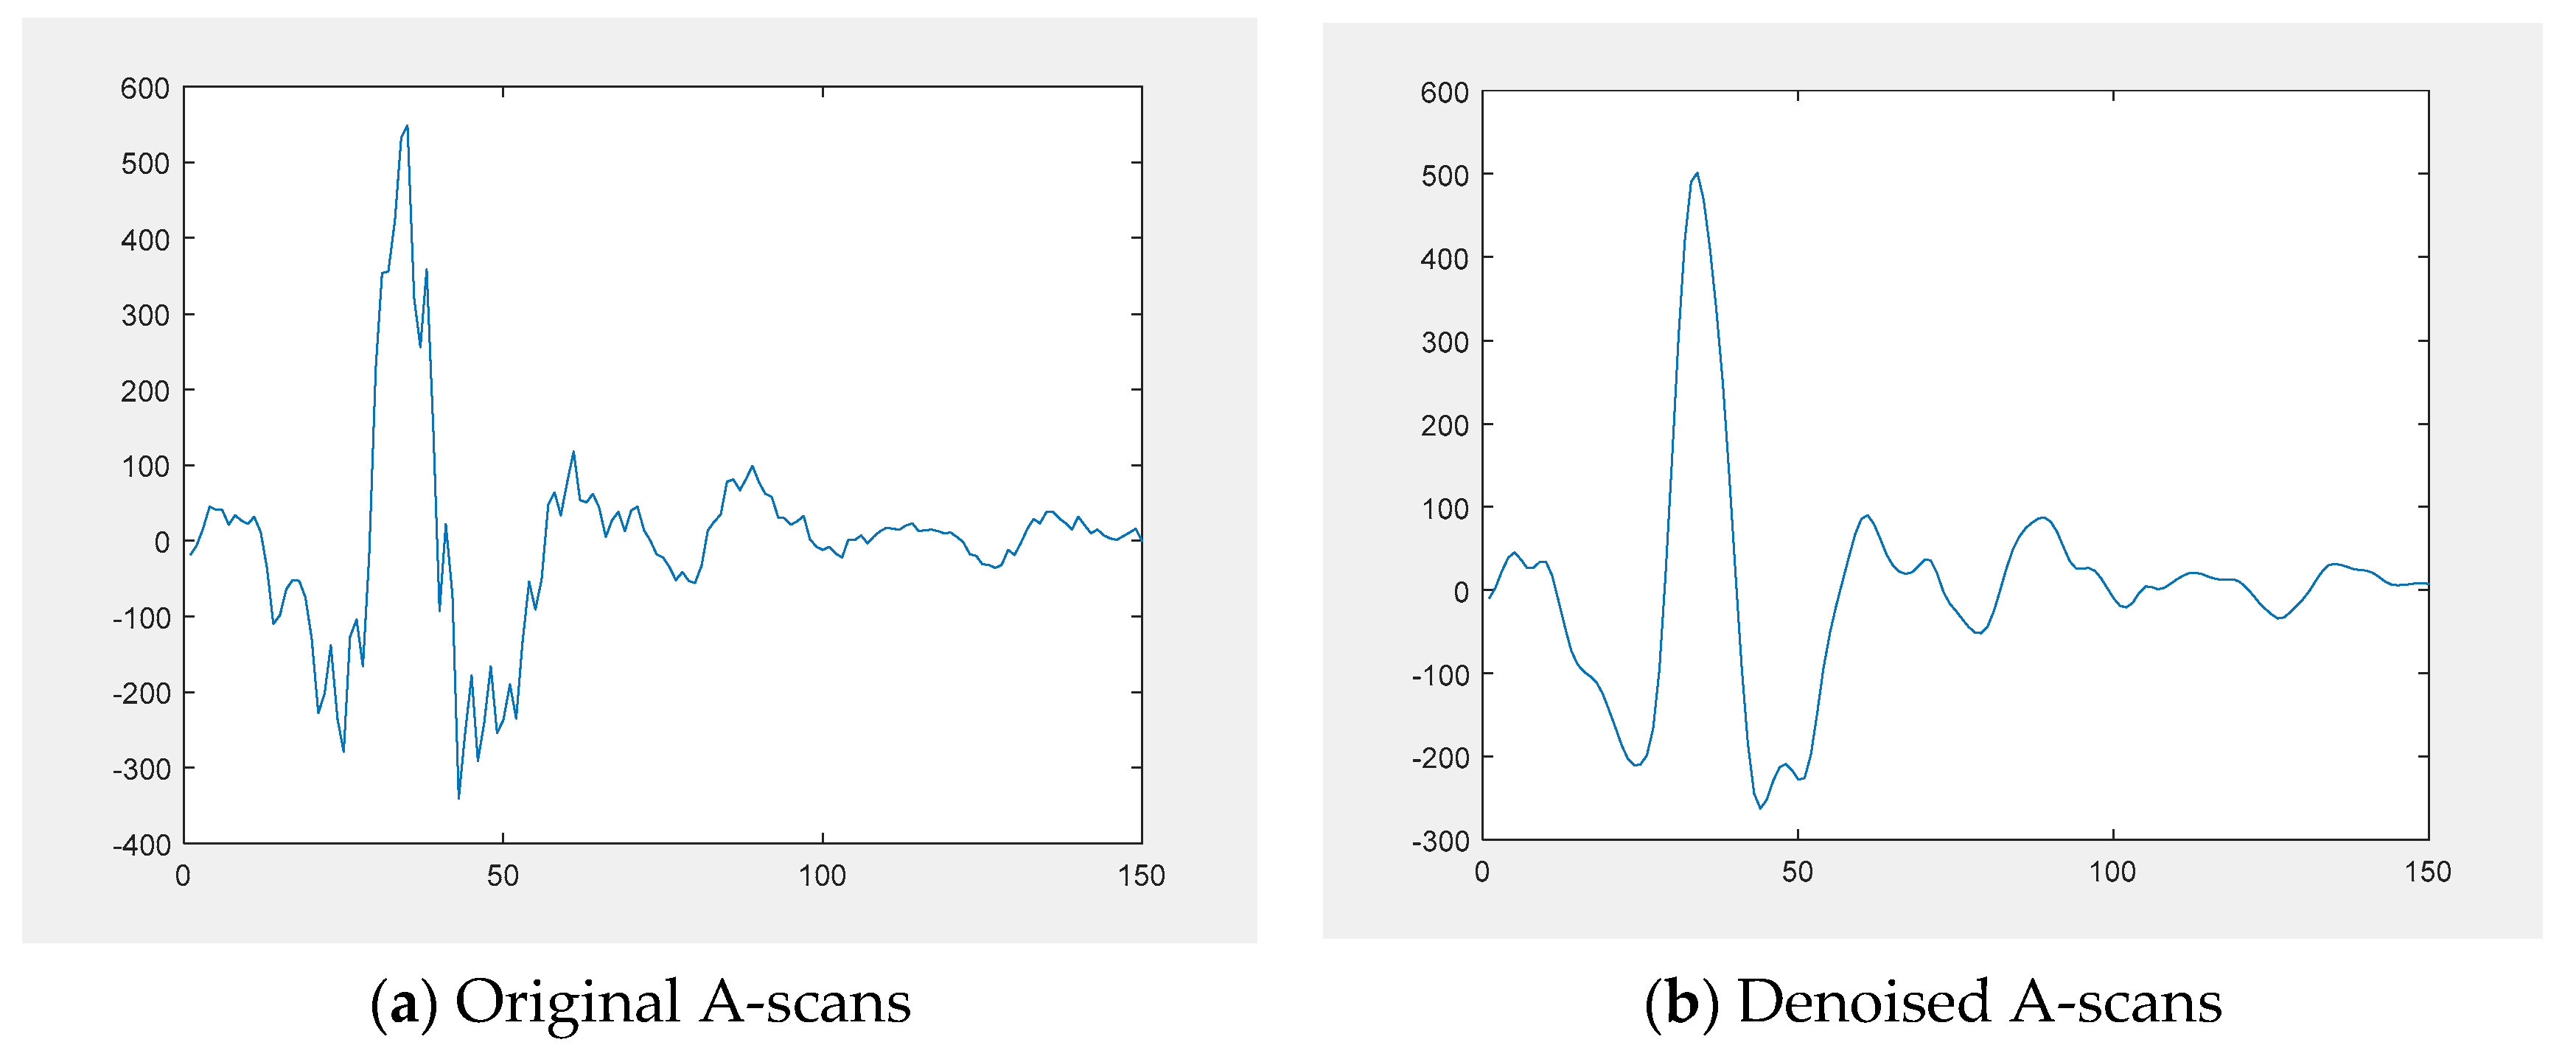
Figure 8.
A-scan of RC specimen with void and the extracted envelope from A-scans without void.
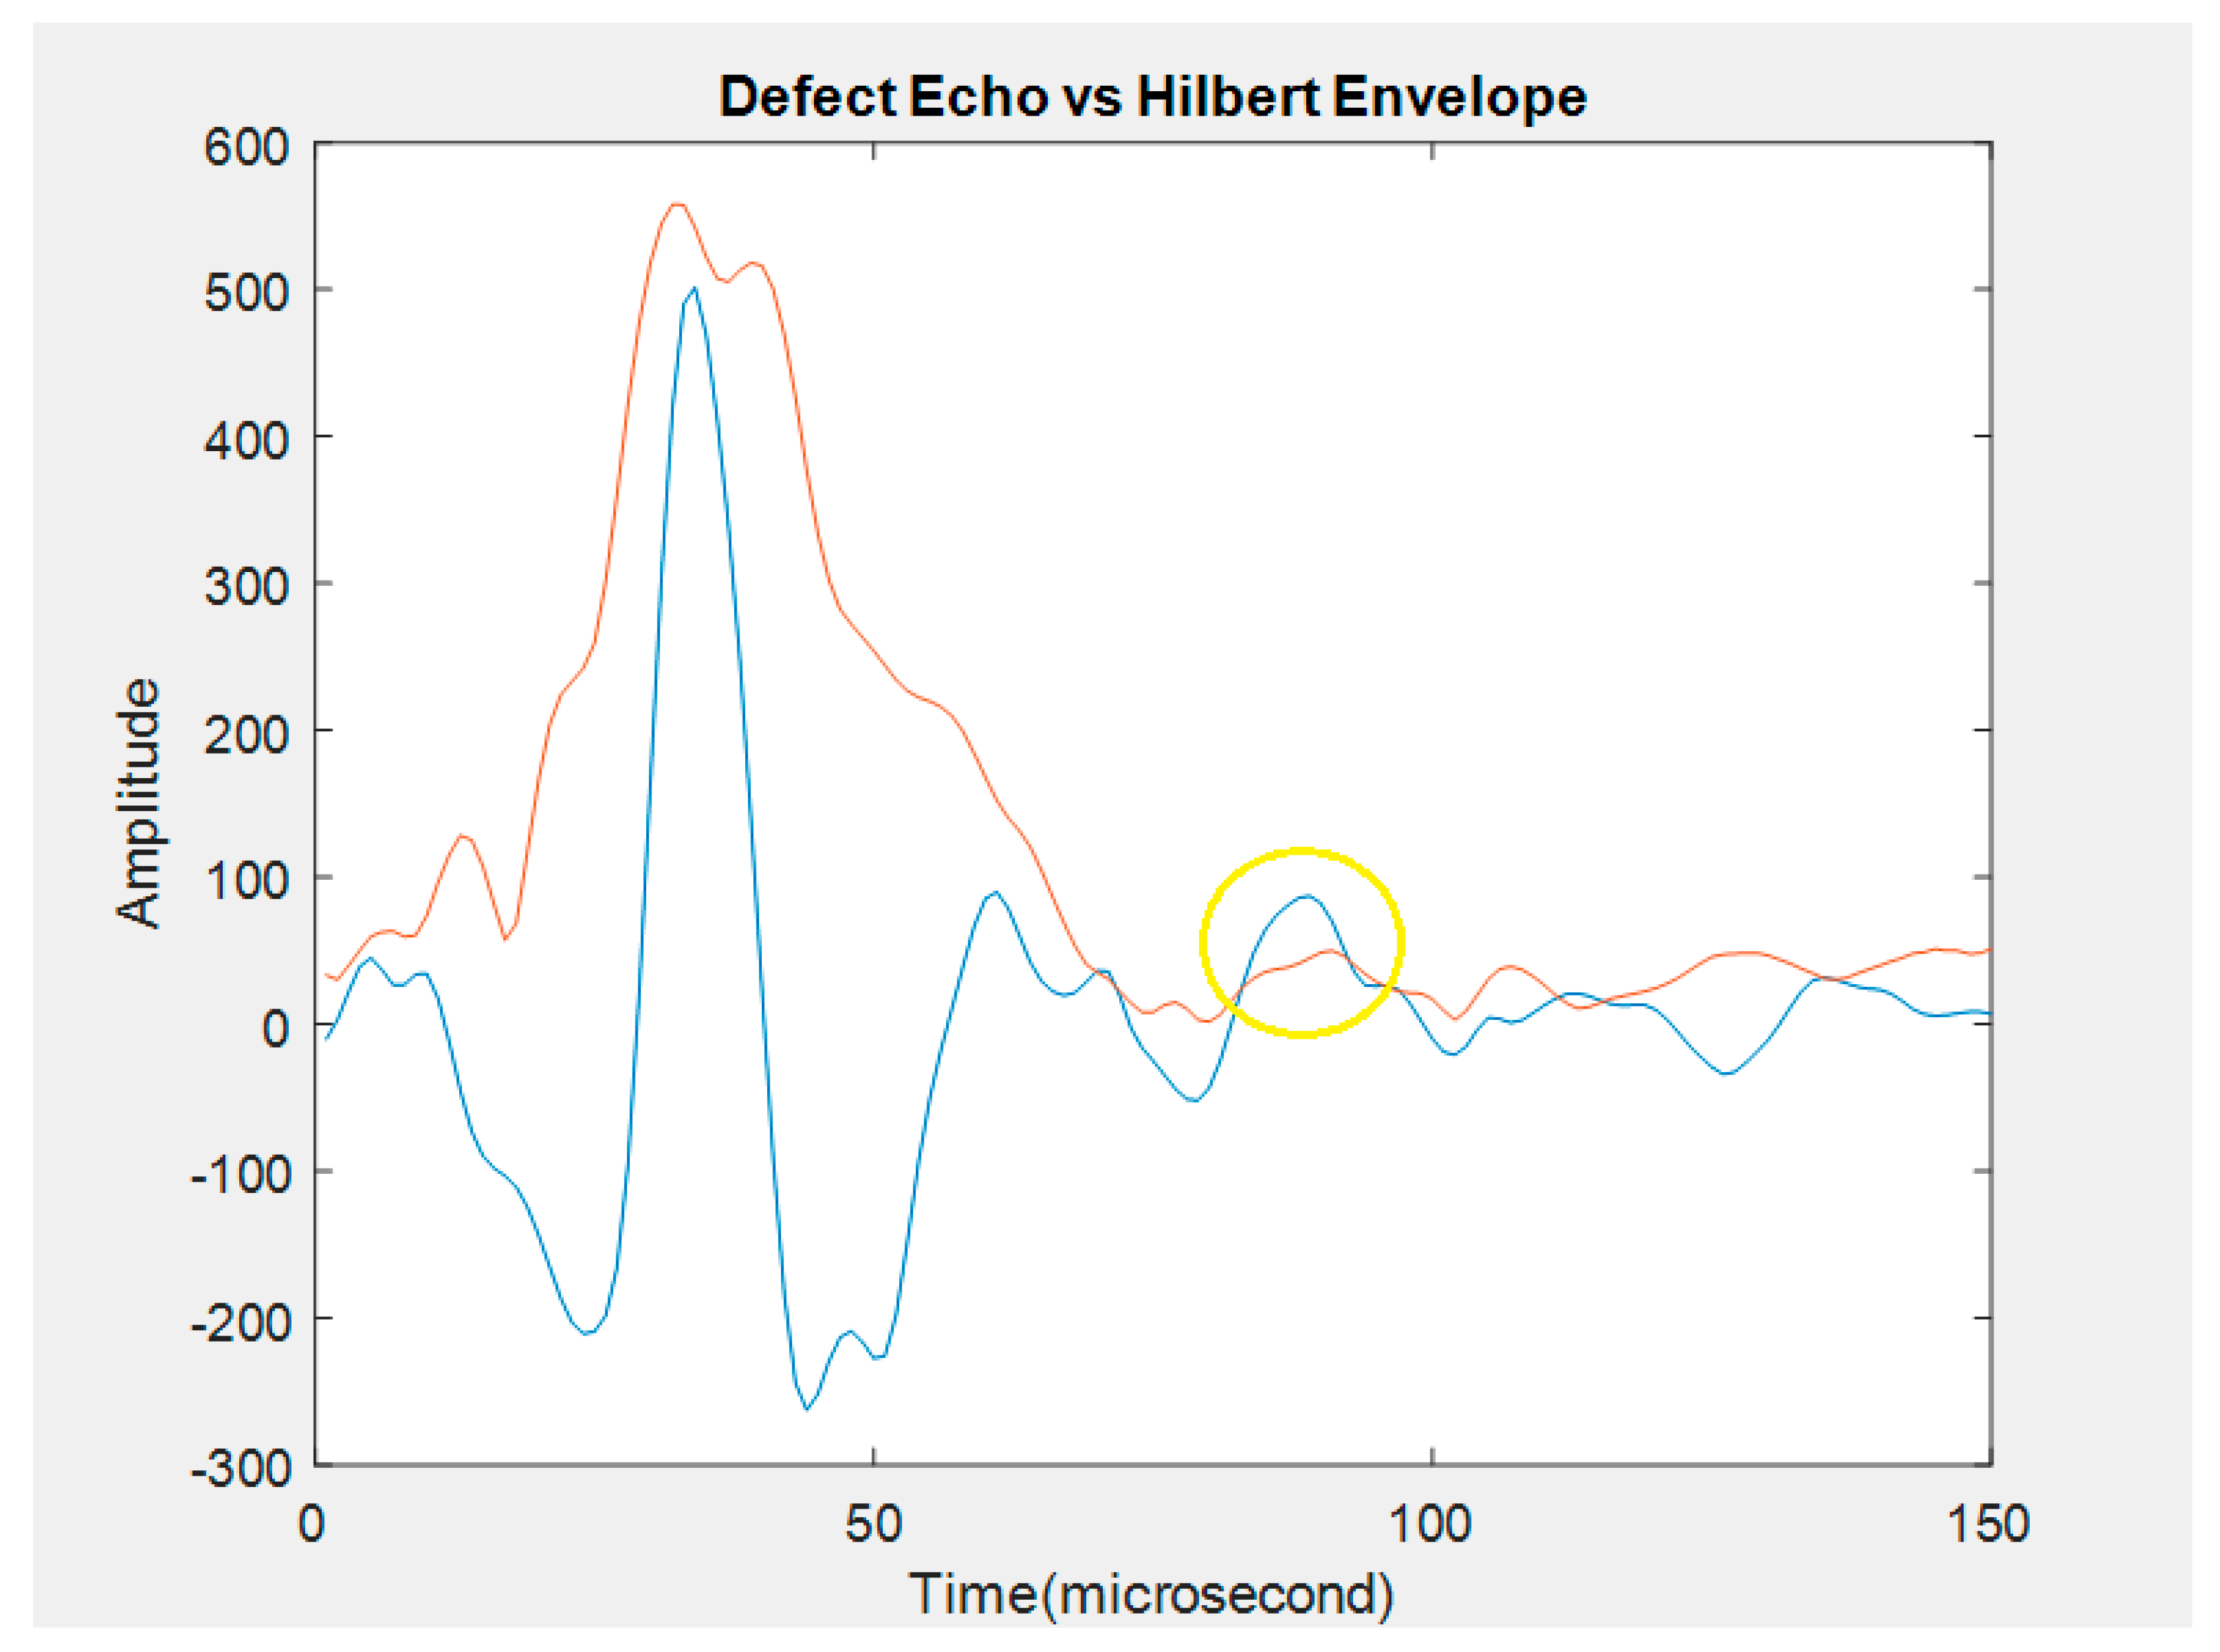

Table 1.
Comparison of the void location.
| Method | Experimental specimen | UPE device | New method |
|---|---|---|---|
| Distance from surface (mm) | 83 | 70-75 | 82 |
Disclaimer/Publisher’s Note: The statements, opinions and data contained in all publications are solely those of the individual author(s) and contributor(s) and not of MDPI and/or the editor(s). MDPI and/or the editor(s) disclaim responsibility for any injury to people or property resulting from any ideas, methods, instructions or products referred to in the content. |
© 2024 by the authors. Licensee MDPI, Basel, Switzerland. This article is an open access article distributed under the terms and conditions of the Creative Commons Attribution (CC BY) license (http://creativecommons.org/licenses/by/4.0/).
Copyright: This open access article is published under a Creative Commons CC BY 4.0 license, which permit the free download, distribution, and reuse, provided that the author and preprint are cited in any reuse.


