
Submitted:
20 March 2024
Posted:
21 March 2024
You are already at the latest version
Abstract
This work aimed to elucidate how O3 pollution causes loss of regulation of the immune response in both the brain and the intestine. In this work, we studied the effect of exposing rats to low doses of O3 on the association between the antioxidant response of superoxide dismutase (SOD) levels and nuclear factor kappa light chains of activated B cells (NFκB) as a marker of inflammation. Method: 72 Wistar rats were used, divided into six groups that received the following treatments: Control, 7, 15, 30, 60, and 90 days at O3, respectively. After treatment, tissues were extracted and processed using Western blotting, biochemical, and immunohistochemical techniques. The results indicated an increase in 4-hydroxynonenal (4HNE) and Cu/Zn-SOD, a decrease in Mn-SOD, and SOD activity in the substantia nigra, jejunum, and colon decrease. Furthermore, the translocation of NFκB to the nucleus increased in the different organs studied.
In conclusion, repeated exposure to ozone alters the regulation of the antioxidant and inflammatory response in the substantia nigra and the intestine. This suggests that these responses are critical in the loss of regulation of the inflammatory response, and they respond to ozone pollution, which could be occurring in the progression of chronic degenerative diseases.
Keywords:
O3
; oxidative stress
; substantia nigra
; intestine
; 4HNE
; NFκB
; superoxide dismutase
1. Introduction
Environmental pollution by O3 is a public health problem in highly polluted regions [1]. O3, when repeatedly inhaled at low doses, as in the case of environmental pollution, raises the formation of reactive oxygen species (ROS) in the body [2,3,4]. Enzymatic antioxidant systems, such as SOD, catalase, glutathione system, thioredoxin, etc. [5], cannot counteract ROS produced at low doses. Therefore, this causes a state of chronic oxidative stress, which is a key factor in the evolution of degenerative diseases like cancer, diabetes, autoimmune diseases, neurodegenerative diseases, etc. [2,5,6]. Currently, a large number of works describe the pathophysiological mechanisms of environmental pollution in the central nervous system and other organs and systems. In addition, there is a wealth of evidence on the effect of environmental contamination by O3 on the brain and, in particular, on the substantia nigra [4,7,8,9]. These works show that O3 contamination, by inducing oxidative stress, plays a fundamental role in the oxidation of dopamine and the alteration of antioxidant systems, leading to the formation of dopamine adducts and triggering the death of dopaminergic neurons [4,7,10]. This degenerative process is accompanied by alterations in the intestine and an inflammatory response [11] that has lost its signaling, making the progressive neurodegeneration process irreversible [2].
On the other hand, the architecture of the intestinal epithelium is very complex; it is formed by a monolayer of cells connected by different cell junctions. This barrier fulfills multiple functions, including the absorption of nutrients, some electrolytes, and an immune response. Therefore, it is considered a highly selective semi-permeable barrier to prevent the free passage of certain toxins, antigens, and microbial products [2,12]. In addition, the loss of homeostasis of the intestinal barrier components allows the free passage of substances that can be harmful to the organism, promoting the activation of immune response mechanisms, both cellular and molecular [13,14,15,16]. However, studies show that the loss of regulation of the inflammatory response is a critical factor in the loss of intestinal permeability and the generation of chronic pathologies, including neurodegenerative diseases [2,11,17]. Among the main proinflammatory responses is the transcription NFκB, which is essential in regulating intestinal epithelial homeostasis and its pathophysiology [18,19].
NFκB is a transcription factor that regulates the expression of genes associated with immune and inflammatory responses, survival, antioxidant systems, and other cellular processes. Oxidative stress activates NFκB synthesis through the following several mechanisms: 1) ROS, such as hydrogen peroxide (H2O2), can directly activate an inhibitor of kappa kinase (IKK) B, which phosphorylates the inhibitory protein IκB; 2) The NFκB factor is activated by oxidative stress, genotoxic stress, and DNA damage through several different pathways. One of the known routes is through SUMOylation of nuclear factor (NF)-κB essential modulator (NEMO, IKK-γ), which is translocated to the nucleus and forms the ataxia-telangiectasia mutated (ATM) kinase ATM/NEMO; when this complex translocated to the cytoplasm, ATM phosphorylates IKKs, releasing NFκB, allowing translocation NFκB to the nucleus and initiating cytokine synthesis [20,21,22,23]. Some works associate the participation of NFκB in intestinal and brain structures disorder related to damage to the substantia nigra, especially in Parkinson's disease.
A complex functional relationship between the brain and the intestine has been widely demonstrated, which is established through the vagus nerve, as well as neurotransmitters, hormones, and cytokines that modify the functions in both systems [11]. The brain-gut axis uses chemical messengers like adrenaline, acetylcholine, neurohormones, cortisol, dopamine, peptides that regulate eating behavior, as well as serotonin and peptides that participate in digestion [24,25]. The loss of regulation of the gut-brain axis is caused by both intrinsic factors (antibiotics, stress, unhealthy diets, etc.) as well as extrinsic factors (environmental pollution), which produce changes in the microbiota directly affecting the intestinal wall, which contributes to the loss of regulation of the inflammatory response and the increase in the permeability of the intestinal wall, changing the signaling that reaches the brain through different pathways [23,26,27].
The role of chronic oxidative stress produced by pollution on the loss of intestinal permeability and the process of progressive neurodegeneration in brain structures is still unclear. The objective of this work was to elucidate how O3 contamination causes the loss of regulation of the immune response both in the intestine and in the substantia nigra. For this purpose, the effect of oxidative stress caused by exposure to low doses of O3, on the association between the antioxidant response of SOD and translocation of the NFκB to the nucleus is explored as a marker of inflammation in the mentioned structures.
2. Materials and Methods
2.1. Animals
Seventy-two rats males of the Wistar strain (they were obtained from the vivarium of the Facultad de Medicina, UNAM), weighing 250 to 300 g were used, which were kept individually in acrylic boxes, fed with croquettes for rodents (LabDiet 5001) ad libitum, under constant temperature and humidity conditions, and with a light photoperiod-12:12 dark. The care of the animals used in this study strictly complied with the Guide for the Care and Use of Laboratory Animals National Research Council [28] and the Official Mexican Standard NOM-062-ZOO-1999 on the "Technical specifications for the production, care, and use of laboratory animals" and adjusted to the international guidelines of ethics and animal management aimed at minimizing the number of animals used and their suffering. The project was submitted to the research committee and research ethics committee of the Facultad de Medicina, UNAM, based on Comité Interno para el Cuidado y Uso de Animales de Laboratorio. División de Investigación. Facultad de Medicina 2018 (CICUAL) Registry 019-2023 [29], the project was approved with registration number FM/DI/063/2023.
2.1. Exposure to Ozone
The exposure method to low doses of O3 is described in Pereyra-Muñoz N et al., 2006 [4] and Rivas-Arancibia et al., 2010 [30]. Briefly, the rats were placed in a transparent acrylic chamber, and through a generator of O3, the independent groups were exposed to 0.25 ppm of O3 for 4 h daily for 7, 15, 30, 60, and 90 days, respectively. O3 levels were kept constant and controlled throughout the experiment with an O3 monitor. (PCI Systems de O3 and Control, West Caldwell, NJ).
2.2. Western Blot
Lipid oxidation and abundance of Cu/Zn SOD and Mn SOD in substantia nigra, jejunum, and colon were evaluated:
The substantia nigra, jejunum, and colon samples were homogenized in lysis buffer with protease inhibitors (Complete, Roche® Basel, Switzerland), and protein quantification was performed using the BCA method (Micro BCA Protein Assay Kit ®, Thermo Scientific, Waltham, Massachusetts). The proteins were then separated by electrophoresis on a 10% SDS acrylamide gel under reducing conditions. Blotting was done using a PVDF membrane and blocked using 5% skim milk in TBST. The primary antibody Anti-4HNE (MA5-27570) of Invitrogen®, SOD1 (GTX100554, Irvine, Ca.), SOD2 (GTX116093, Irvine, Ca.) and Beta-Actin (GTX110564, Irvine, Ca.) by GENETEX® they were incubated overnight at 4°C at a concentration of 1:1000. After three washes with TBST, the membranes were incubated with the appropriate secondary antibodies, mouse anti-rabbit or goat anti-mouse diluted 1:10,000 (Santa Cruz Biotechnology). Membranes were developed using 1 mL of Immobilon® Forte Western HRP Substrate Reagent (Millipore® Corporation Bedford, MA, EE.UU) for 1 minute and digitized using the GelCapture® program (v 7.0.5. DNR Bio-Imaging System). Densitometric analysis was performed using Image Studio ® software (v 5.2.5. LI-COR Bioscience). All bands were quantified based on their molecular weight, except for 4HNE, which, due to its characteristics, used the entire band for analysis.
2.3. Superoxide Dismutase Activity
Measurement of total SOD activity involves inhibition of nitroblue tetrazolium (NTB) reduction by xanthine oxidase used as a superoxide generator. It is calculated as U/µg of tissue (SOD unit is defined as the amount of enzyme which inhibits the reduction of NTB by 50%) [31]. The substantia nigra, jejunum, and colon tissue fragments were homogenized in a protein extraction buffer to which protease inhibitors (Roche®, Basel, Switzerland) were added and centrifuged at 15,000 rpm for 20 min at 4 °C. The supernatants were recovered, and the quantification of total proteins was carried out using the Micro BCA Kit (Thermo Scientific, Waltham, Massachusetts). The reaction medium was prepared with 0.3 mM xanthine solution (Sigma, St. Louis, MO), 0.6 mM EDTA (J.T. Baker, Matsonford Road Radnor, PA), 150 µM nitroblue tetrazolium solution (Sigma, St. Louis, MO), 400 mM Na2CO3 solution and 0.1 % bovine serum albumin. (MP Biochemicals, Irvine, CA). Xanthine oxidase (Sigma, St. Louis, MO) was prepared in 2 M (NH4)2SO4. The tissue and the reaction medium were mixed in a tube; xanthine oxidase was added at 15-second intervals between each tube. Each sample was incubated for 15 min at 27 °C, and the reaction was stopped by adding 0.8 mM CuCl2. Blank solutions containing deionized water were used instead of tissue. The absorbance of each sample was determined at 560 nm on an Epoch spectrophotometer. (Biotek, Winooski, Vermont).
2.4. Immunohistochemistry
The animals were deeply anesthetized (NOM-033-SAG-ZOO-2014), and with sodium pentobarbital (50 mg/Kg), the brains and intestines were extracted, which were fixed in 4% paraformaldehyde. Subsequently, the tissues were dehydrated and embedded in paraffin blocks, and 5 µm-thick sections were made and mounted on slides. The tissues were deparaffinized and then hydrated, and an antigen retriever was used. (Biocare Medical, Concord, California). Peroxidase activity was inhibited with 3 % H2O2, and blocking was done to reduce background (Background Sniper, 4plusDetection). Antibodies against SOD1 (GTX100554, Irvine, Ca.), SOD2 (GTX116093, Irvine, Ca.), and NFκB (GTX102090, Irvine, Ca.) were incubated overnight at 4°C. Slides were treated with biotinylated secondary antibody (Universal Link, Biocare Medical). They were then incubated with streptavidin (4plus Detection Component, Streptavidin-HRP, Biocare Medical) incubated with 3,3-Diaminobenzidine Substrate chromogen (DAB Kit, ScyTek, West Logan, Utah) and stained with hematoxylin. Each slide was analyzed with the BX41 Olympus Microscope and photographed with an Evolution-QImagin Digital Camera Kit (MediaCybernetics, Silver Spring, Maryland).
2.5. Statistical Analysis
A Kolmogorov-Smirnov normality test analyzed all results. Results are presented as median and interquartile ranges for non-parametric variables. As the data did not give a normal distribution, the Kruskal-Wallis test was used to see differences between groups, followed by the Mann-Whitney U test to compare the control group with the groups that received different treatments. Differences between groups were considered statistically significant, with a p ≤ 0.05. All statistical analysed were performed using the GraphPad Prism® version 5.00 program for Windows (GraphPad Software, San Diego California USA, www.graphpad.com).
3. Results
3.1. Lipid Oxidation: 4-Hydroxynonenal
Lipid peroxidation indices were assessed by western blot with an antibody against 4HNE. Using the Mann-Whitney U test, the results of the substantia nigra showed a significant increase at 7, 15, and 90 days of exposure to O3 with respect to the control group (Figure 1A). The jejunum presented a significant increase in 4HNE at 15, 30, 60, and 90 days of exposure compared to the control group (Figure 1B). The colon presented a significant increase in 4HNE at 7, 60, and 90 days when comparing the groups treated with O3 with the control group (Figure 1C). All significant differences were considered with a p ≤ 0.05.
3.2. Determination of Cu/Zn-SOD in Substantia nigra, Jejunum and Colon
The relative abundance of Cu/Zn-SOD proteins was evaluated by western blot (Figure 2). The densitometric analysis showed a statistically significant increase with the Mann-Whitney U test (p ≤ 0.05) in Cu/Zn-SOD levels at 30, 60, and 90 days of exposure to O3 in substantia nigra and jejunum compared to the control group (Figure 2A,B). The results obtained for the colon showed a significant increase (p ≤ 0.05) in the protein levels after 30 days of treatment compared to the control group (Figure 2C).
3.3. Determination of Mn-SOD in Substantia nigra, Jejunum and Colon
3.4. SOD Activity in Substantia nigra, Jejunum and Colon
The total activity of SOD in the substantia nigra of the rat shows us that these enzymes tend to increase their activity after 7 days of exposure to O3 and significantly decrease their activity at 30 days compared to control animals (Figure 4). The SOD activity in the jejunum shows that the observed changes are not statistically significant. However, the activity of total SOD in the colon decreases at 7, 15, 60, and 90 days of exposure to O3, compared to the control group. (p ≤ 0.05).
3.5. Immunohistochemical Tests against NFκB
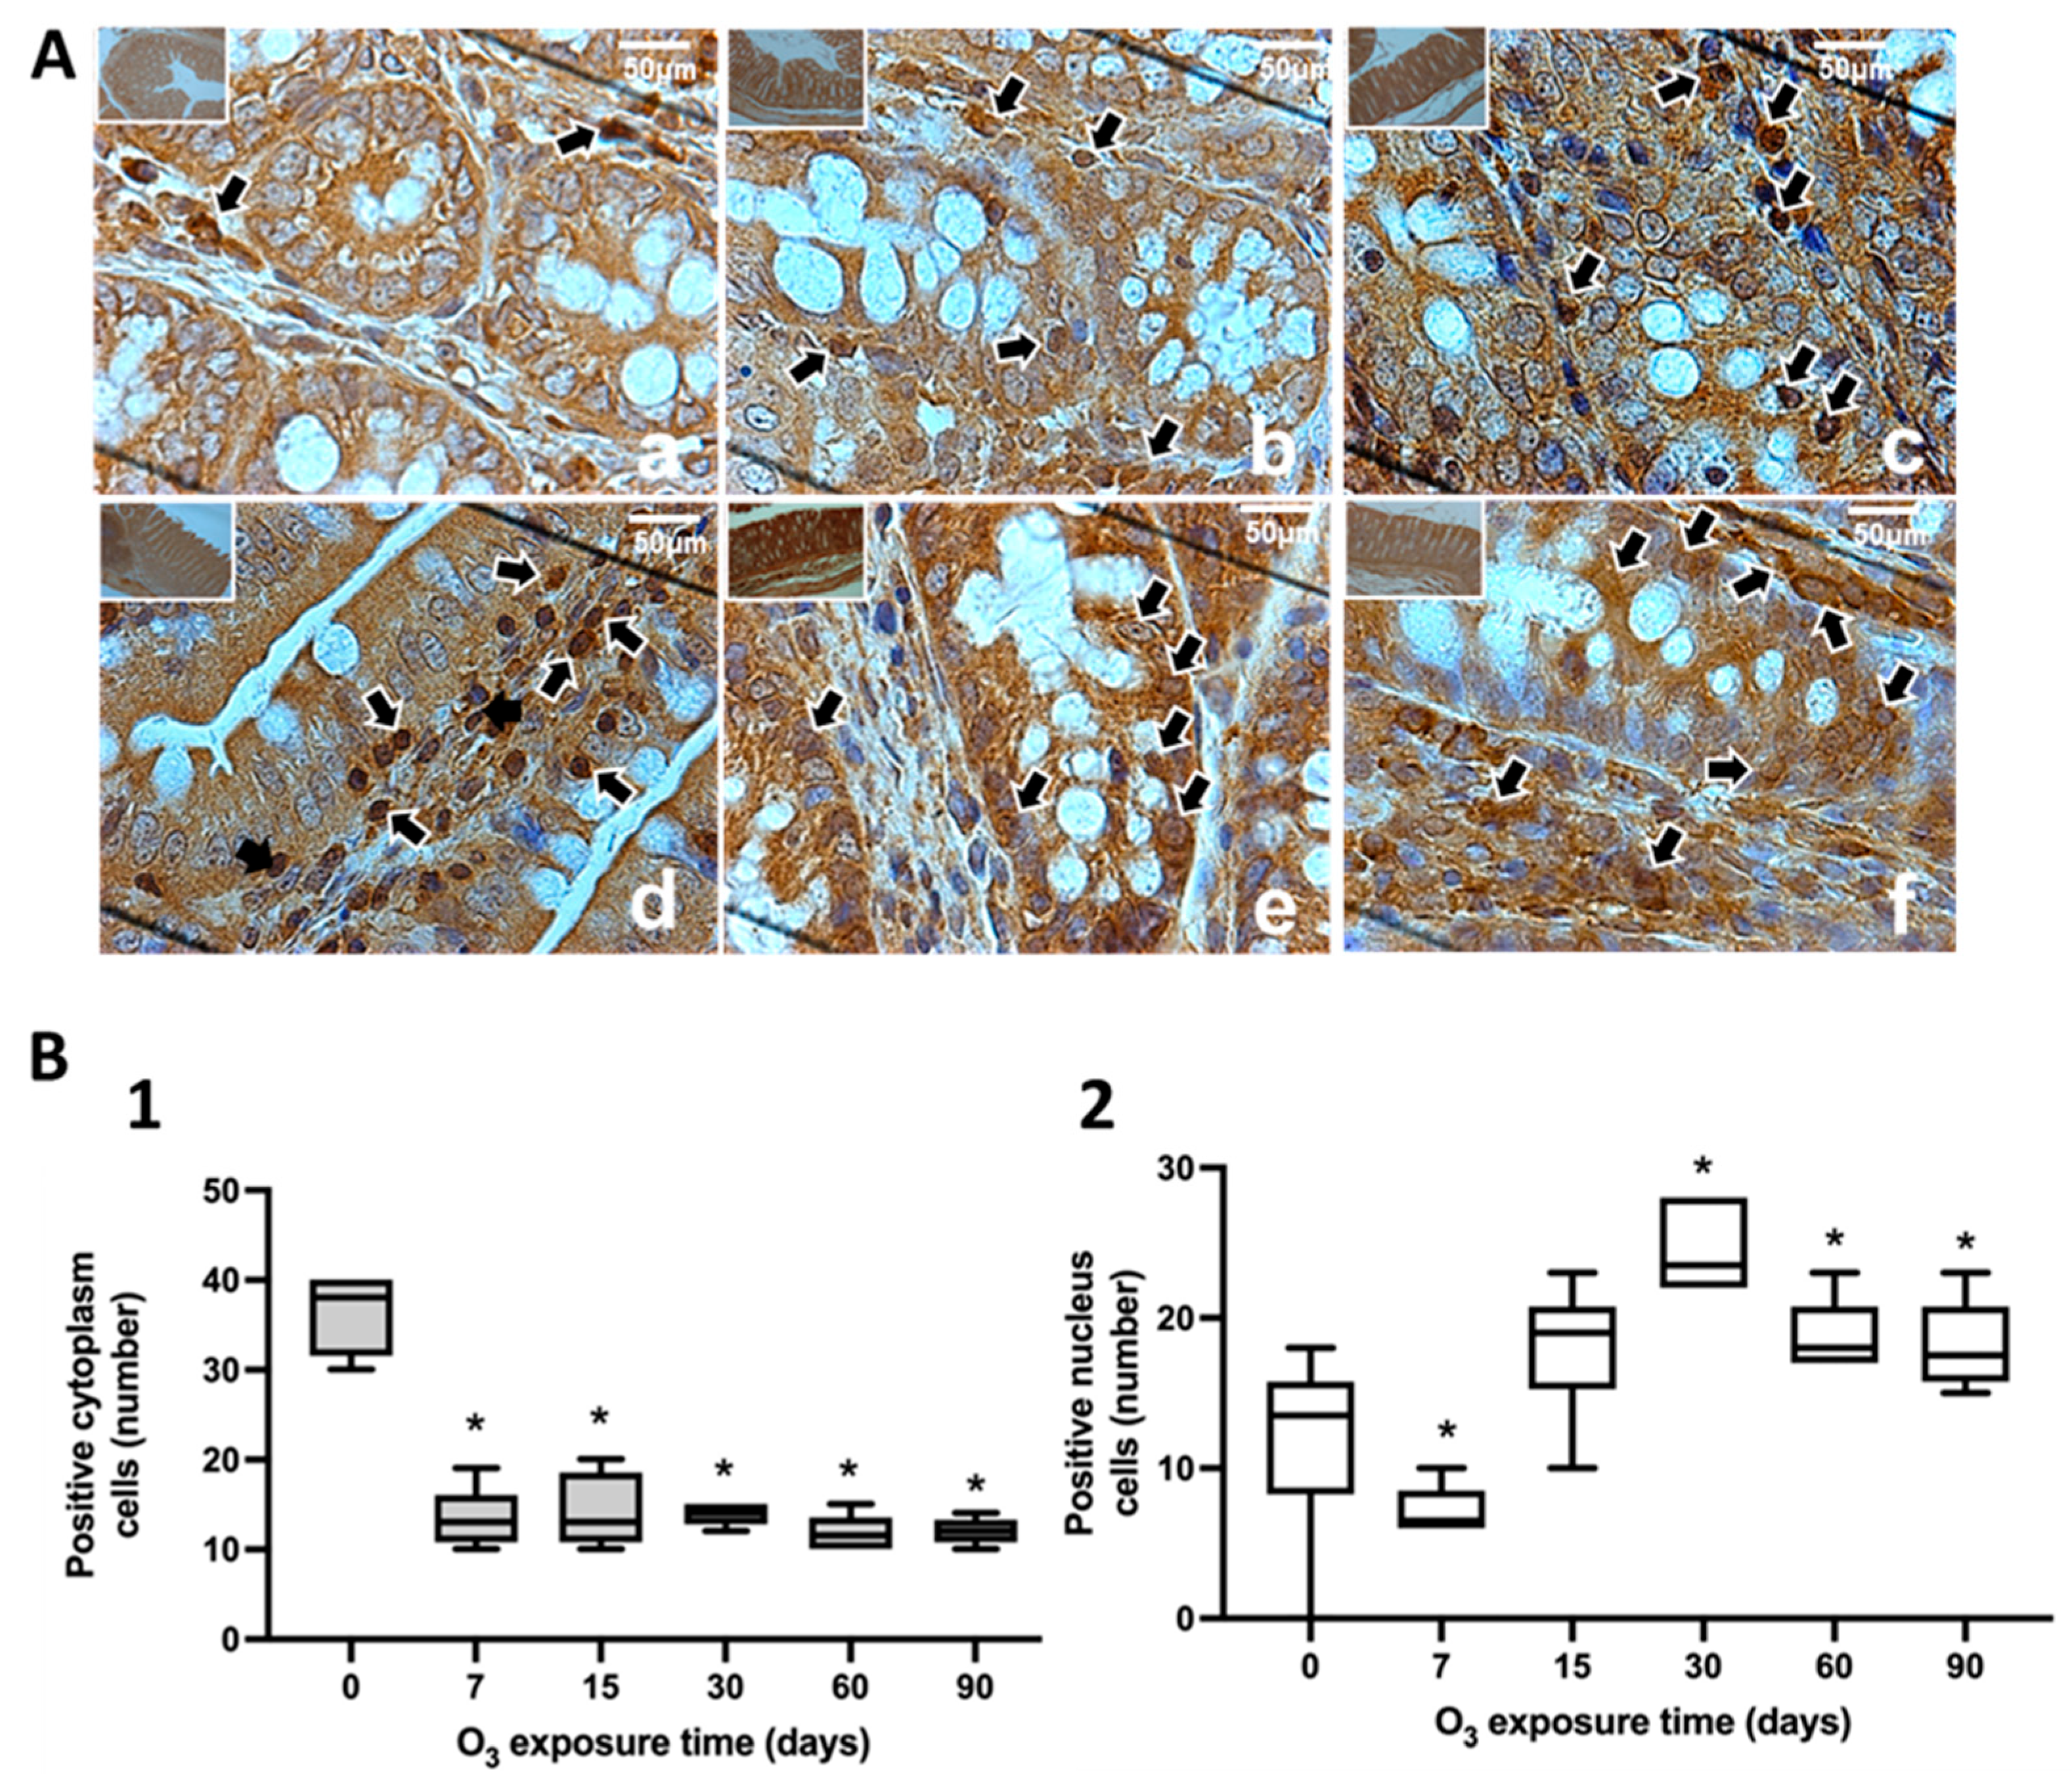
The study of the intracellular localization of NFκB was performed using immunohistochemistry in the substantia nigra (Figure 5), jejunum (Figure 6), and colon (Figure 7). Neurons in the substantia nigra, rat jejunum, and colon enterocytes showed immunoreactivity for NFκB that increased their nuclear localization in the three structures studied from 7 days to 90 days of exposure to O3.
4. Discussion
It has been widely demonstrated that repeated inhalation of low doses of O3 causes a chronic state of oxidative stress due to the inability of antioxidant systems to counteract low and repeated doses of ROS secondary to exposure to this gas[2,10,30]. However, the opposite occurs in the respiratory burst, in which ROS are signaling agents that activate the defense response of the immune system to fight pathogens, and antioxidant systems play a crucial role in restoring the redox balance and contributing to limiting the inflammatory response [32]. The chronic state of oxidative stress and the loss of regulation of the inflammatory response are critical factors in maintaining a progressively degenerative process, as occurs in many chronic diseases [4,11,30]. Our results demonstrate that the loss of regulation of the inflammatory response impacts the oxidative damage found in the intestine and substantia nigra, since they have a close relationship in neurodegenerative diseases such as Parkinson's disease [33]. These results indicate that there is a complex relationship between both regions since the results found in this work together show changes in 4HNE (Figure 1), SOD Cu/Zn proteins (Figure 2), SOD-Mn (Figure 3), SOD activity (Figure 4), and the translocation of NFκB (Figure 5, Figure 6 and Figure 7).
The results of this work show that repeated exposure to low doses of O3 increases the levels of 4HNE in substantia nigra, reaching its maximum at 90 days of exposure to O3 (Figure 1A). Therefore, this indicates a significant increase in peroxidized lipids in this brain structure as the time of exposure to O3 increases. A similar effect is presented in the jejunum and colon. While in the jejunum, there is a significant increase from 15 to 90 days (Figure 1B), in the colon, this increase occurs at 7, 60, and 90 days of exposure (Figure 1C); this suggests that the higher the exposure to O3, the more significant the increase in peroxidation lipids and increased ROS levels. The rise in 4HNE alters its permeability, leading to an increase in the release of proinflammatory cytokines and probable alterations in the microbiota, which is affected as the treatment progresses. In certain models, it was found that the expression of tight junction cellular proteins in the mouse colon is inhibited by 4HNE, which generates the translocation of NFκB to the nucleus through TLR4 receptors for proinflammatory cytokine signaling [34,35]. Our results demonstrate that the loss of regulation of the inflammatory response impacts the oxidative damage found in the intestine and substantia nigra, since they have a close relationship in neurodegenerative diseases such as Parkinson's disease [27,33].
Work carried out in our laboratory using this same model has indicated that an irreversible neurodegenerative process is triggered after 30 days of exposure to O3. One of the endogenous antioxidant systems that play an important role in counteracting ROS is SOD. The results obtained with Cu/Zn-SOD show a significant increase in this enzyme after 30 days of exposure to O3 (Figure 2-A, B, C). However, the results of the total activity of SOD show that its activity significantly decreases compared to controls (Figure 4A–C). Furthermore, when we observe the effect of exposure to O3 on Mn-SOD, this mitochondrial enzyme also shows decreased levels, as shown in Figure 3A–C, which may partly explain the inability of this enzyme to contend with ROS under these conditions. There is a close interrelationship between SOD and NFκB since it regulates the expression of a large number of genes at the genetic level. Among these, there is a close relationship at the transcription level between SOD and NFκB [23,26,36,37]. However, the NFκB transcription factor, when translocated to the cell nucleus, initiates the synthesis of different cytokines and plays a crucial role in the inflammatory response [20,38]. We can also observe that the results of this work show that the effect of exposure to low doses of O3 mediated by chronic oxidative stress, both in substantia nigra and in the jejunum and colon, produces an increase in the translocation of NFκB to the cell nucleus as O3 treatment takes place (Figure 5, Figure 6 and Figure 7), as can be seen in the immunoreactivity to NFκB in substantia nigra shown in Figure 5A, as well as in Figure 5B-1,2. The decrease of NFκB in the cytoplasm, translocation of NFkB to the nucleus is also clearly observed in the jejunum (Figure 6B-1,2) and colon (Figure 7B-1,2). Therefore, we can infer that the increase in the chronic state of oxidative stress induces an increase in cytokines by increasing the translocation of NFκB to the nucleus. Oxidative stress-induced NFκB activation triggers proinflammatory gene expression [39]. Thus, this leads to increased production of inflammatory mediators such as cytokines (e.g., TNF-α, IL-1β), chemokines, and adhesion molecules [40].
Furthermore, oxidative stress can modulate NFκB activity by influencing the cell's redox state. ROS can directly modify cysteine residues within NFκB, affecting its DNA-binding ability and transcriptional activity. Oxidative modifications can also occur in signaling components upstream of the NFκB pathway, leading to altered NFκB activation dynamics and target gene expression [20].
As mentioned above, during redox balance, the formation of ROS, as a product of metabolism and defense reactions of the immune system, is signaling for different cellular functions. However, in the presence of a chronic state of oxidative stress, redox signaling changes due to the increase in reactive species, and this leads to unregulated responses from different systems, especially the loss of control of the immune system, which generates an inflammatory reaction that has lost its regulation [2,6,16].
The results obtained show that exposure to O3 not only causes damage to brain structures such as the substantia nigra, but the jejunum and colon are also sensitive to damage caused by ROS. In addition to everything that has been described about the relationship between the intestine, microbiota, and degenerative diseases, this has implications for the levels of regulation of other signals between the digestive system and food intake, inflammatory bowel diseases, malabsorption syndromes, etc. [15,41,42]. However, in chronic diseases, some questions still need to be resolved, and they are the following: Is O3 pollution capable of causing changes in the intestinal wall due to a chronic process of oxidative stress? The results obtained demonstrate that exposure to O3 causes an inflammatory response in the intestine which also affects the substantia nigra. Is O3 pollution capable of generating simultaneous alterations in the microbiota and the intestinal wall, implicated in degenerative diseases? To resolve this question, we need to perform more experiments using this model to analyze the microbiome. Considering the results of this work, repeated exposure to low doses of O3 could be a critical factor in triggering other pathological conditions such as obesity, diabetes, degenerative diseases, autoimmune diseases, etc., since chronic oxidative stress would be changing pathways.
The relationship between SOD and NFκB seems to be a key player in modulating the inflammatory response to contend with the reactive species secondary to O3 exposure. The activity of antioxidant systems seems dependent on avoiding the loss of the oxidation-reduction balance. During this balance, redox signaling maintains homeostasis and the correct regulation of physiology at the molecular, biochemical, cellular, and organ and system levels. However, small and chronic changes, as occur with environmental contamination by O3, gradually lead the system to an irreversible loss of redox balance and a loss of regulation of the inflammatory response, forming a vicious circle between oxidation and inflammation which accompanies the deterioration of chronic degenerative diseases [6]. O3 pollution causes oxidative stress, which can affect the antioxidant effects of SOD by inhibiting its activity and ultimately reducing its expression, thereby compromising the cell's antioxidant defense system. Furthermore, ozone pollution also can activate NFκB and modulate its translocation to the nucleus, leading to the induction of inflammatory altered responses. Therefore, the inflammatory alterations found in the jejunum, colon, and substantia nigra are a direct result of repeated exposure to low doses of ozone.
5. Conclusions
With the results obtained in this work, we can conclude the following: Oxidative stress caused by low ozone exposure doses in rats generates alterations in both the intestinal wall and the substantia nigra. These effects are characterized by the loss of regulation of the inflammatory response, as shown in the alterations of NFkB, as well as in endogenous antioxidant systems such as SOD, both in the intestine and the substantia nigra. Therefore, the close relationship between the intestine and the brain through the nervous system, mainly through the vagus nerve, hormones, and cytokines, leads to oxidative alterations caused by environmental ozone pollution in both systems, closely related to degenerative processes.
Author Contributions
For research articles with several authors, a short paragraph specifying their individual contributions must be provided. The following statements should be used “Conceptualization, S.R-A; methodology, M. V-F, E. R-M A. M-M E. H-O and C. R-R; validation, M. V-F, E. R-M A. and M-M E.; formal analysis, M. V-F, E. R-M and A. M-M; investigation, M. V-F, E. R-M A. M-M E. H-O and C. R-R.; resources, S. R-A; writing—original draft preparation, S.R-A. M. V-F, E. R-M A. M-M; writing—review and editing, visualization, S.R-A, M.V-F; supervision, S.R-A.; project administration, S.R-A.; funding acquisition, S.R-A. All authors have read and agreed to the published version of the manuscript.
Funding
Project funded by Dirección General de Asuntos del Personal Académico-UNAM (PAPIIT IN221521) to S.R-A.
Institutional Review Board Statement
The animal study protocol was approved by the Ethics Committee of the Facultad de Medicina, UNAM and based on Comité Interno para el Cuidado y Uso de Animales de Laboratorio. División de Investigación. Facultad de Medicina 2018 (CICUAL) Registry 019-2023 [29], the project was approved with registration number FM/DI/063/2023.
Data Availability Statement
The data of this work will be available when required.
Acknowledgments
Alfredo Miranda-Martínez received a CONAHCyT postdoctoral fellowship, CVU 385286. The authors thank Susan Drier-Jonas for help with the edition of the manuscript.
Conflicts of Interest
The authors declares that there is no conflict of interest regarding the publication of this paper.
References
- Manisalidis, I.; Stavropoulou, E.; Stavropoulos, A.; Bezirtzoglou, E. Environmental and Health Impacts of Air Pollution: A Review. Front Public Health. 2020, 8. [Google Scholar] [CrossRef] [PubMed]
- Rivas-Arancibia, S.; Miranda-Martínez, A.; Rodríguez-Martínez, E.; Hernández-Orozco, E.; Valdés-Fuentes, M.; De la Rosa-Sierra, R. Ozone Environmental Pollution: Relationship between the Intestine and Neurodegenerative Diseases. Antioxidants (Basel). 2023, 12. [Google Scholar] [CrossRef] [PubMed]
- Rodríguez-Martínez, E.; Martínez, F.; Espinosa-García, M.T.; Maldonado, P.; Rivas-Arancibia, S. Mitochondrial dysfunction in the hippocampus of rats caused by chronic oxidative stress. Neuroscience. 2013, 252, 384–395. [Google Scholar] [CrossRef] [PubMed]
- Pereyra-Muñoz, N.; Rugerio-Vargas, C.; Angoa-Pérez, M.; Borgonio-Pérez, G.; Rivas-Arancibia, S. Oxidative damage in substantia nigra and striatum of rats chronically exposed to ozone. J Chem Neuroanat. 2006, 31, 114–123. [Google Scholar] [CrossRef] [PubMed]
- Poljsak, B.; Milisav, I. The neglected significance of "antioxidative stress". Oxid Med Cell Longev. 2012, 2012, 480895. [Google Scholar] [CrossRef] [PubMed]
- Solleiro-Villavicencio, H.; Hernández-Orozco, E.; Rivas-Arancibia, S. Effect of exposure to low doses of ozone on interleukin 17A expression during progressive neurodegeneration in the rat hippocampus. Neurologia (Engl Ed). 2021, 36, 673–680. [Google Scholar] [CrossRef]
- Badillo-Ramírez, I.; Saniger, J.M.; Rivas-Arancibia, S. 5-S-cysteinyl-dopamine, a neurotoxic endogenous metabolite of dopamine: Implications for Parkinson's disease. Neurochem Int. 2019, 129, 104514. [Google Scholar] [CrossRef] [PubMed]
- Calderón-Garcidueñas, L.; Reynoso-Robles, R.; Vargas-Martínez, J.; Gómez-Maqueo-Chew, A.; Pérez-Guillé, B.; Mukherjee, P.S.; Torres-Jardón, R.; Perry, G.; Gónzalez-Maciel, A. Prefrontal white matter pathology in air pollution exposed Mexico City young urbanites and their potential impact on neurovascular unit dysfunction and the development of Alzheimer's disease. Environ Res. 2016, 146, 404–417. [Google Scholar] [CrossRef]
- Younan, D.; Petkus, A.J.; Widaman, K.F.; Wang, X.; Casanova, R.; Espeland, M.A.; Gatz, M.; Henderson, V.W.; Manson, J.E.; Rapp, S.R. Particulate matter and episodic memory decline mediated by early neuroanatomic biomarkers of Alzheimer's disease. Brain. 2020, 143, 289–302. [Google Scholar] [CrossRef]
- Santiago-López, D.; Bautista-Martínez, J.A.; Reyes-Hernandez, C.I.; Aguilar-Martínez, M.; Rivas-Arancibia, S. Oxidative stress, progressive damage in the substantia nigra and plasma dopamine oxidation, in rats chronically exposed to ozone. Toxicol Lett. 2010, 197, 193–200. [Google Scholar] [CrossRef]
- Gwak, M.G.; Chang, S.Y. Gut-Brain Connection: Microbiome, Gut Barrier, and Environmental Sensors. Immune Netw. 2021, 21, e20. [Google Scholar] [CrossRef] [PubMed]
- Salvo Romero, E.; Alonso Cotoner, C.; Pardo Camacho, C.; Casado Bedmar, M.; Vicario, M. The intestinal barrier function and its involvement in digestive disease. Rev Esp Enferm Dig. 2015, 107, 686–696. [Google Scholar] [CrossRef] [PubMed]
- Ueno, A.; Jijon, H.; Chan, R.; Ford, K.; Hirota, C.; Kaplan, G.G.; Beck, P.L.; Iacucci, M.; Fort Gasia, M.; Barkema, H.W. Increased prevalence of circulating novel IL-17 secreting Foxp3 expressing CD4+ T cells and defective suppressive function of circulating Foxp3+ regulatory cells support plasticity between Th17 and regulatory T cells in inflammatory bowel disease patients. Inflamm Bowel Dis. 2013, 19, 2522–2534. [Google Scholar] [CrossRef] [PubMed]
- Cho, J.; Kim, S.; Yang, D.H.; Lee, J.; Park, K.W.; Go, J.; Hyun, C.L.; Jee, Y.; Kang, K.S. Mucosal Immunity Related to FOXP3(+) Regulatory T Cells, Th17 Cells and Cytokines in Pediatric Inflammatory Bowel Disease. J Korean Med Sci. 2018, 33, e336. [Google Scholar] [CrossRef] [PubMed]
- Scarpellini, E.; Balsiger, L.M.; Broeders, B.; Houte, K.V.D.; Routhiaux, K.; Raymenants, K.; Carbone, F.; Tack, J. Nutrition and Disorders of Gut-Brain Interaction. Nutrients. 2024, 16. [Google Scholar] [CrossRef] [PubMed]
- Xie, X.; Wang, L.; Dong, S.; Ge, S.; Zhu, T. Immune regulation of the gut-brain axis and lung-brain axis involved in ischemic stroke. Neural Regen Res. 2024, 19, 519–528. [Google Scholar] [CrossRef] [PubMed]
- Lopez-Rodriguez, A.B.; Hennessy, E.; Murray, C.L.; Nazmi, A.; Delaney, H.J.; Healy, D.; Fagan, S.G.; Rooney, M.; Stewart, E.; Lewis, A. Acute systemic inflammation exacerbates neuroinflammation in Alzheimer's disease: IL-1β drives amplified responses in primed astrocytes and neuronal network dysfunction. Alzheimers Dement. 2021, 17, 1735–1755. [Google Scholar] [CrossRef]
- Poma, P. NF-κB and Disease. Int J Mol Sci. 2020, 21. [Google Scholar] [CrossRef]
- Serasanambati, M.; Chilakapati, S.R. Function of nuclear factor kappa B (NF-kB) in human diseases-a review. South Indian Journal of Biological Sciences. 2016, 2, 368–387. [Google Scholar] [CrossRef]
- Kensche, T.; Tokunaga, F.; Ikeda, F.; Goto, E.; Iwai, K.; Dikic, I. Analysis of nuclear factor-κB (NF-κB) essential modulator (NEMO) binding to linear and lysine-linked ubiquitin chains and its role in the activation of NF-κB. J Biol Chem. 2012, 287, 23626–23634. [Google Scholar] [CrossRef]
- Morris, G.; Gevezova, M.; Sarafian, V.; Maes, M. Redox regulation of the immune response. Cell Mol Immunol. 2022, 19, 1079–1101. [Google Scholar] [CrossRef] [PubMed]
- Priya Dharshini, L.C.; Vishnupriya, S.; Sakthivel, K.M.; Rasmi, R.R. Oxidative stress responsive transcription factors in cellular signalling transduction mechanisms. Cell Signal. 2020, 72. [Google Scholar] [CrossRef] [PubMed]
- Miyamoto, S. Nuclear initiated NF-κB signaling: NEMO and ATM take center stage. Cell Res. 2011, 21, 116–130. [Google Scholar] [CrossRef] [PubMed]
- Konturek, S.J.; Konturek, J.W.; Pawlik, T.; Brzozowski, T. Brain-gut axis and its role in the control of food intake. J Physiol Pharmacol. 2004, 55, 137–154. [Google Scholar]
- Socała, K.; Doboszewska, U.; Szopa, A.; Serefko, A.; Włodarczyk, M.; Zielińska, A.; Poleszak, E.; Fichna, J.; Wlaź, P. The role of microbiota-gut-brain axis in neuropsychiatric and neurological disorders. Pharmacol Res. 2021, 172, 105840. [Google Scholar] [CrossRef] [PubMed]
- Liu, T.; Zhang, L.; Joo, D.; Sun, S.C. NF-κB signaling in inflammation. Signal Transduct Target Ther. 2017, 2, 17023. [Google Scholar] [CrossRef]
- Marogianni, C.; Sokratous, M.; Dardiotis, E.; Hadjigeorgiou, G.M.; Bogdanos, D.; Xiromerisiou, G. Neurodegeneration and Inflammation-An Interesting Interplay in Parkinson's Disease. Int J Mol Sci. 2020, 21. [Google Scholar] [CrossRef] [PubMed]
- Albus, U.: Guide for the care and use of laboratory animals (8th edn). In.: SAGE Publications Sage UK: London, England; 2012.
- CICUAL: Comité Interno para el Cuidado y Uso de Animales de Laboratorio. In. México: División de Investigación. Facultad de Medicina 2018.
- Rivas-Arancibia, S.; Guevara-Guzmán, R.; López-Vidal, Y.; Rodríguez-Martínez, E.; Zanardo-Gomes, M.; Angoa-Pérez, M.; Raisman-Vozari, R. Oxidative stress caused by ozone exposure induces loss of brain repair in the hippocampus of adult rats. Toxicol Sci. 2010, 113, 187–197. [Google Scholar] [CrossRef]
- Sun, Y.; Oberley, L.W.; Li, Y. A simple method for clinical assay of superoxide dismutase. Clinical chemistry. 1988, 34, 497–500. [Google Scholar] [CrossRef]
- Sun, L.; Wang, X.; Saredy, J.; Yuan, Z.; Yang, X.; Wang, H. Innate-adaptive immunity interplay and redox regulation in immune response. Redox Biol. 2020, 37, 101759. [Google Scholar] [CrossRef]
- Sampson, T.R.; Debelius, J.W.; Thron, T.; Janssen, S.; Shastri, G.G.; Ilhan, Z.E.; Challis, C.; Schretter, C.E.; Rocha, S.; Gradinaru, V. Gut Microbiota Regulate Motor Deficits and Neuroinflammation in a Model of Parkinson's Disease. Cell. 2016, 167, 1469–1480. [Google Scholar] [CrossRef]
- Wang, Y.; Wang, W.; Yang, H.; Shao, D.; Zhao, X.; Zhang, G. Intraperitoneal injection of 4-hydroxynonenal (4-HNE), a lipid peroxidation product, exacerbates colonic inflammation through activation of Toll-like receptor 4 signaling. Free Radic Biol Med. 2019, 131, 237–242. [Google Scholar] [CrossRef] [PubMed]
- Yang, Y.; Yang, Y.; Xu, Y.; Lick, S.D.; Awasthi, Y.C.; Boor, P.J. Endothelial glutathione-S-transferase A4-4 protects against oxidative stress and modulates iNOS expression through NF-kappaB translocation. Toxicol Appl Pharmacol. 2008, 230, 187–196. [Google Scholar] [CrossRef] [PubMed]
- AlAsmari, A.F.; Alharbi, M.; Alqahtani, F.; Alasmari, F.; AlSwayyed, M.; Alzarea, S.I.; Al-Alallah, I.A.; Alghamdi, A.; Hakami, H.M.; Alyousef, M.K. Diosmin Alleviates Doxorubicin-Induced Liver Injury via Modulation of Oxidative Stress-Mediated Hepatic Inflammation and Apoptosis via NfkB and MAPK Pathway: A Preclinical Study. Antioxidants (Basel). 2021, 10. [Google Scholar] [CrossRef] [PubMed]
- Besong, E.E.; Akhigbe, T.M.; Obimma, J.N.; Obembe, O.O.; Akhigbe, R.E. Acetate Abates Arsenic-Induced Male Reproductive Toxicity by Suppressing HDAC and Uric Acid-Driven Oxido-inflammatory NFkB/iNOS/NO Response in Rats. Biol Trace Elem Res. 2023. [Google Scholar] [CrossRef] [PubMed]
- Jun, J.C.; Kertesy, S.; Jones, M.B.; Marinis, J.M.; Cobb, B.A.; Tigno-Aranjuez, J.T.; Abbott, D.W. Innate immune-directed NF-κB signaling requires site-specific NEMO ubiquitination. Cell Rep. 2013, 4, 352–361. [Google Scholar] [CrossRef] [PubMed]
- Maity, A.; Wollman, R. Information transmission from NFkB signaling dynamics to gene expression. PLoS Comput Biol. 2020, 16, e1008011. [Google Scholar] [CrossRef]
- De Simone, V.; Franzè, E.; Ronchetti, G.; Colantoni, A.; Fantini, M.C.; Di Fusco, D.; Sica, G.S.; Sileri, P.; MacDonald, T.T.; Pallone, F. Th17-type cytokines, IL-6 and TNF-α synergistically activate STAT3 and NF-kB to promote colorectal cancer cell growth. Oncogene. 2015, 34, 3493–3503. [Google Scholar] [CrossRef]
- Bhalla, D.K. Ozone-induced lung inflammation and mucosal barrier disruption: toxicology, mechanisms, and implications. J Toxicol Environ Health B Crit Rev. 1999, 2, 31–86. [Google Scholar] [CrossRef]
- Feng, J.; Cavallero, S.; Hsiai, T.; Li, R. Impact of air pollution on intestinal redox lipidome and microbiome. Free Radic Biol Med. 2020, 151, 99–110. [Google Scholar] [CrossRef]
Figure 1.
Effect of exposure to O3 on lipid oxidation. The abscissa axis shows the treatment, and the ordinate axis shows the relative abundance of 4HNE represented in arbitrary units. *p ≤ 0.05. (A) Substantia nigra. The results show a significant increase in 4HNE at 90 days compared to the control group. (B), Jejunum, the graph shows a significant increase in 4HNE after 30, 60, and 90 days compared to the control group. (C) Colon presented an increase in 4HNE at 60 and 90 days compared to the control group. (D) Representative images for band analysis.
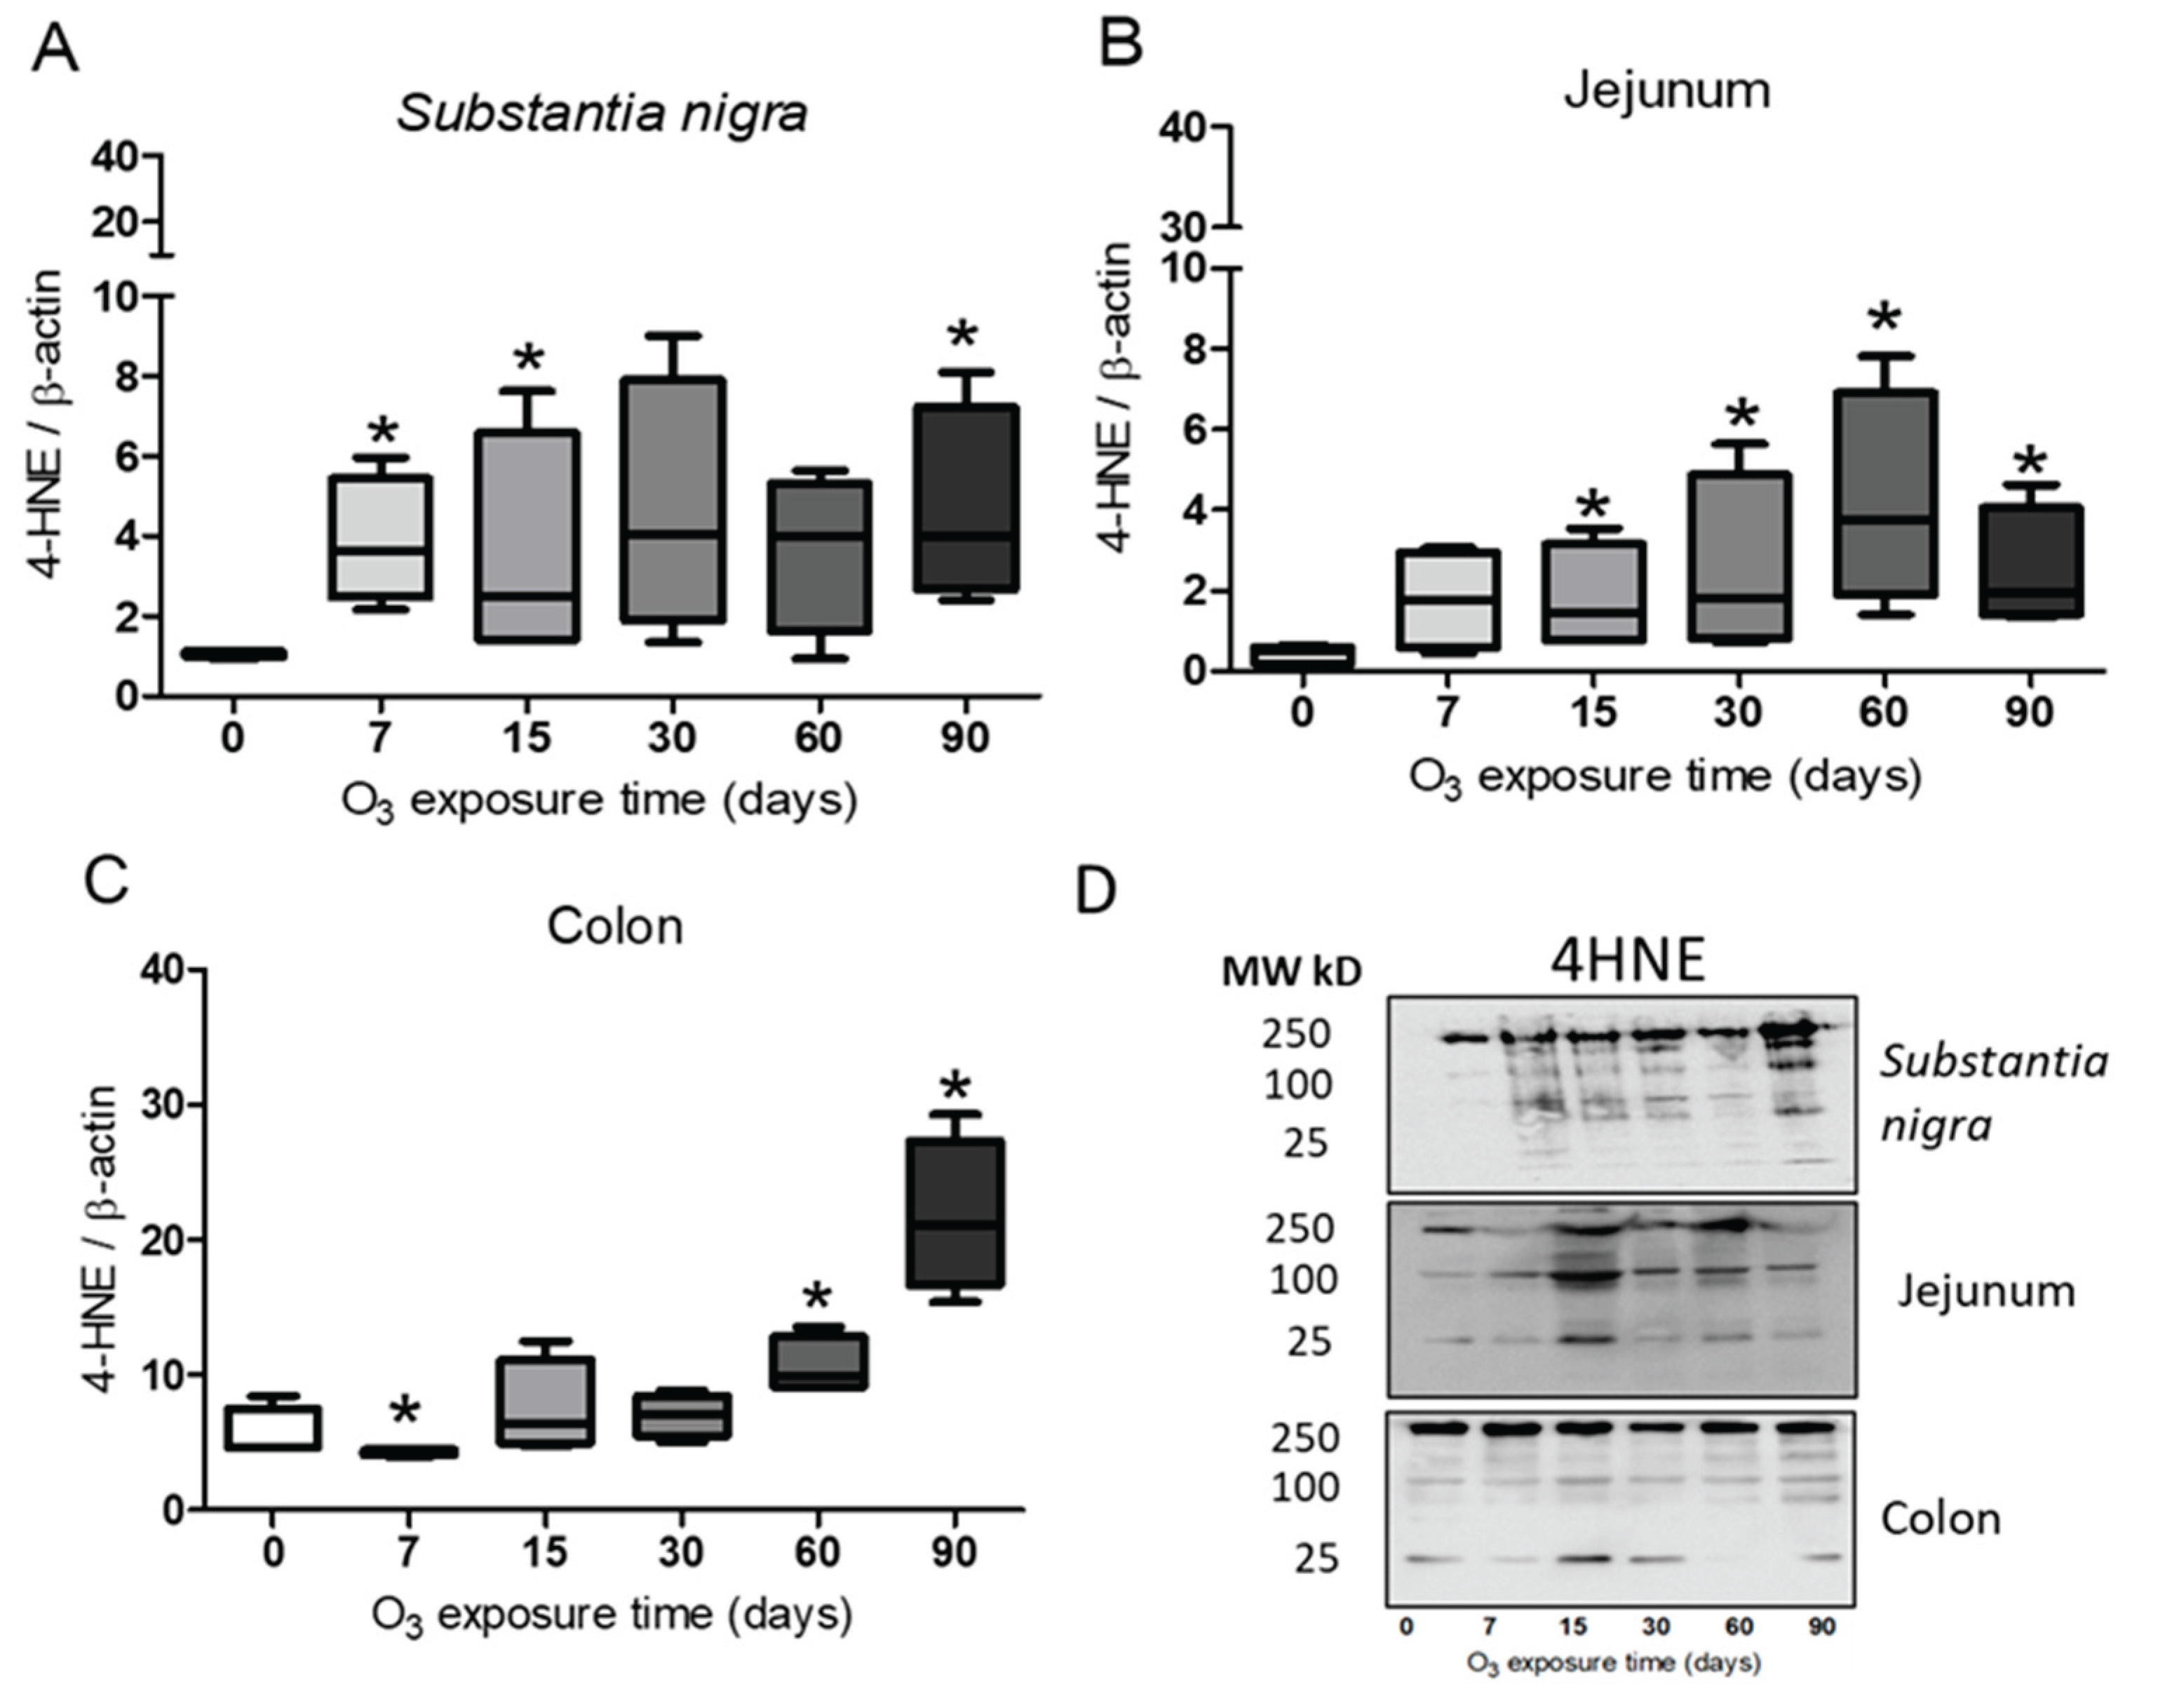
Figure 2.
Effect of exposure to O3 on the relative abundance of Cu/Zn-SOD. The abscissa axis shows the O3 treatments, and the ordinate axis shows the relative abundance of Cu/Zn-SOD represented in arbitrary units. *p ≤ 0.05. (A) Substantia nigra and (B), in the jejunum, a significant increase can be observed at 30, 60, and 90 days of exposure to O3 compared to the control group. (C) while for the colon, an increase is shown at 30 days compared to the control group. (D) Representative WBs for each treatment.
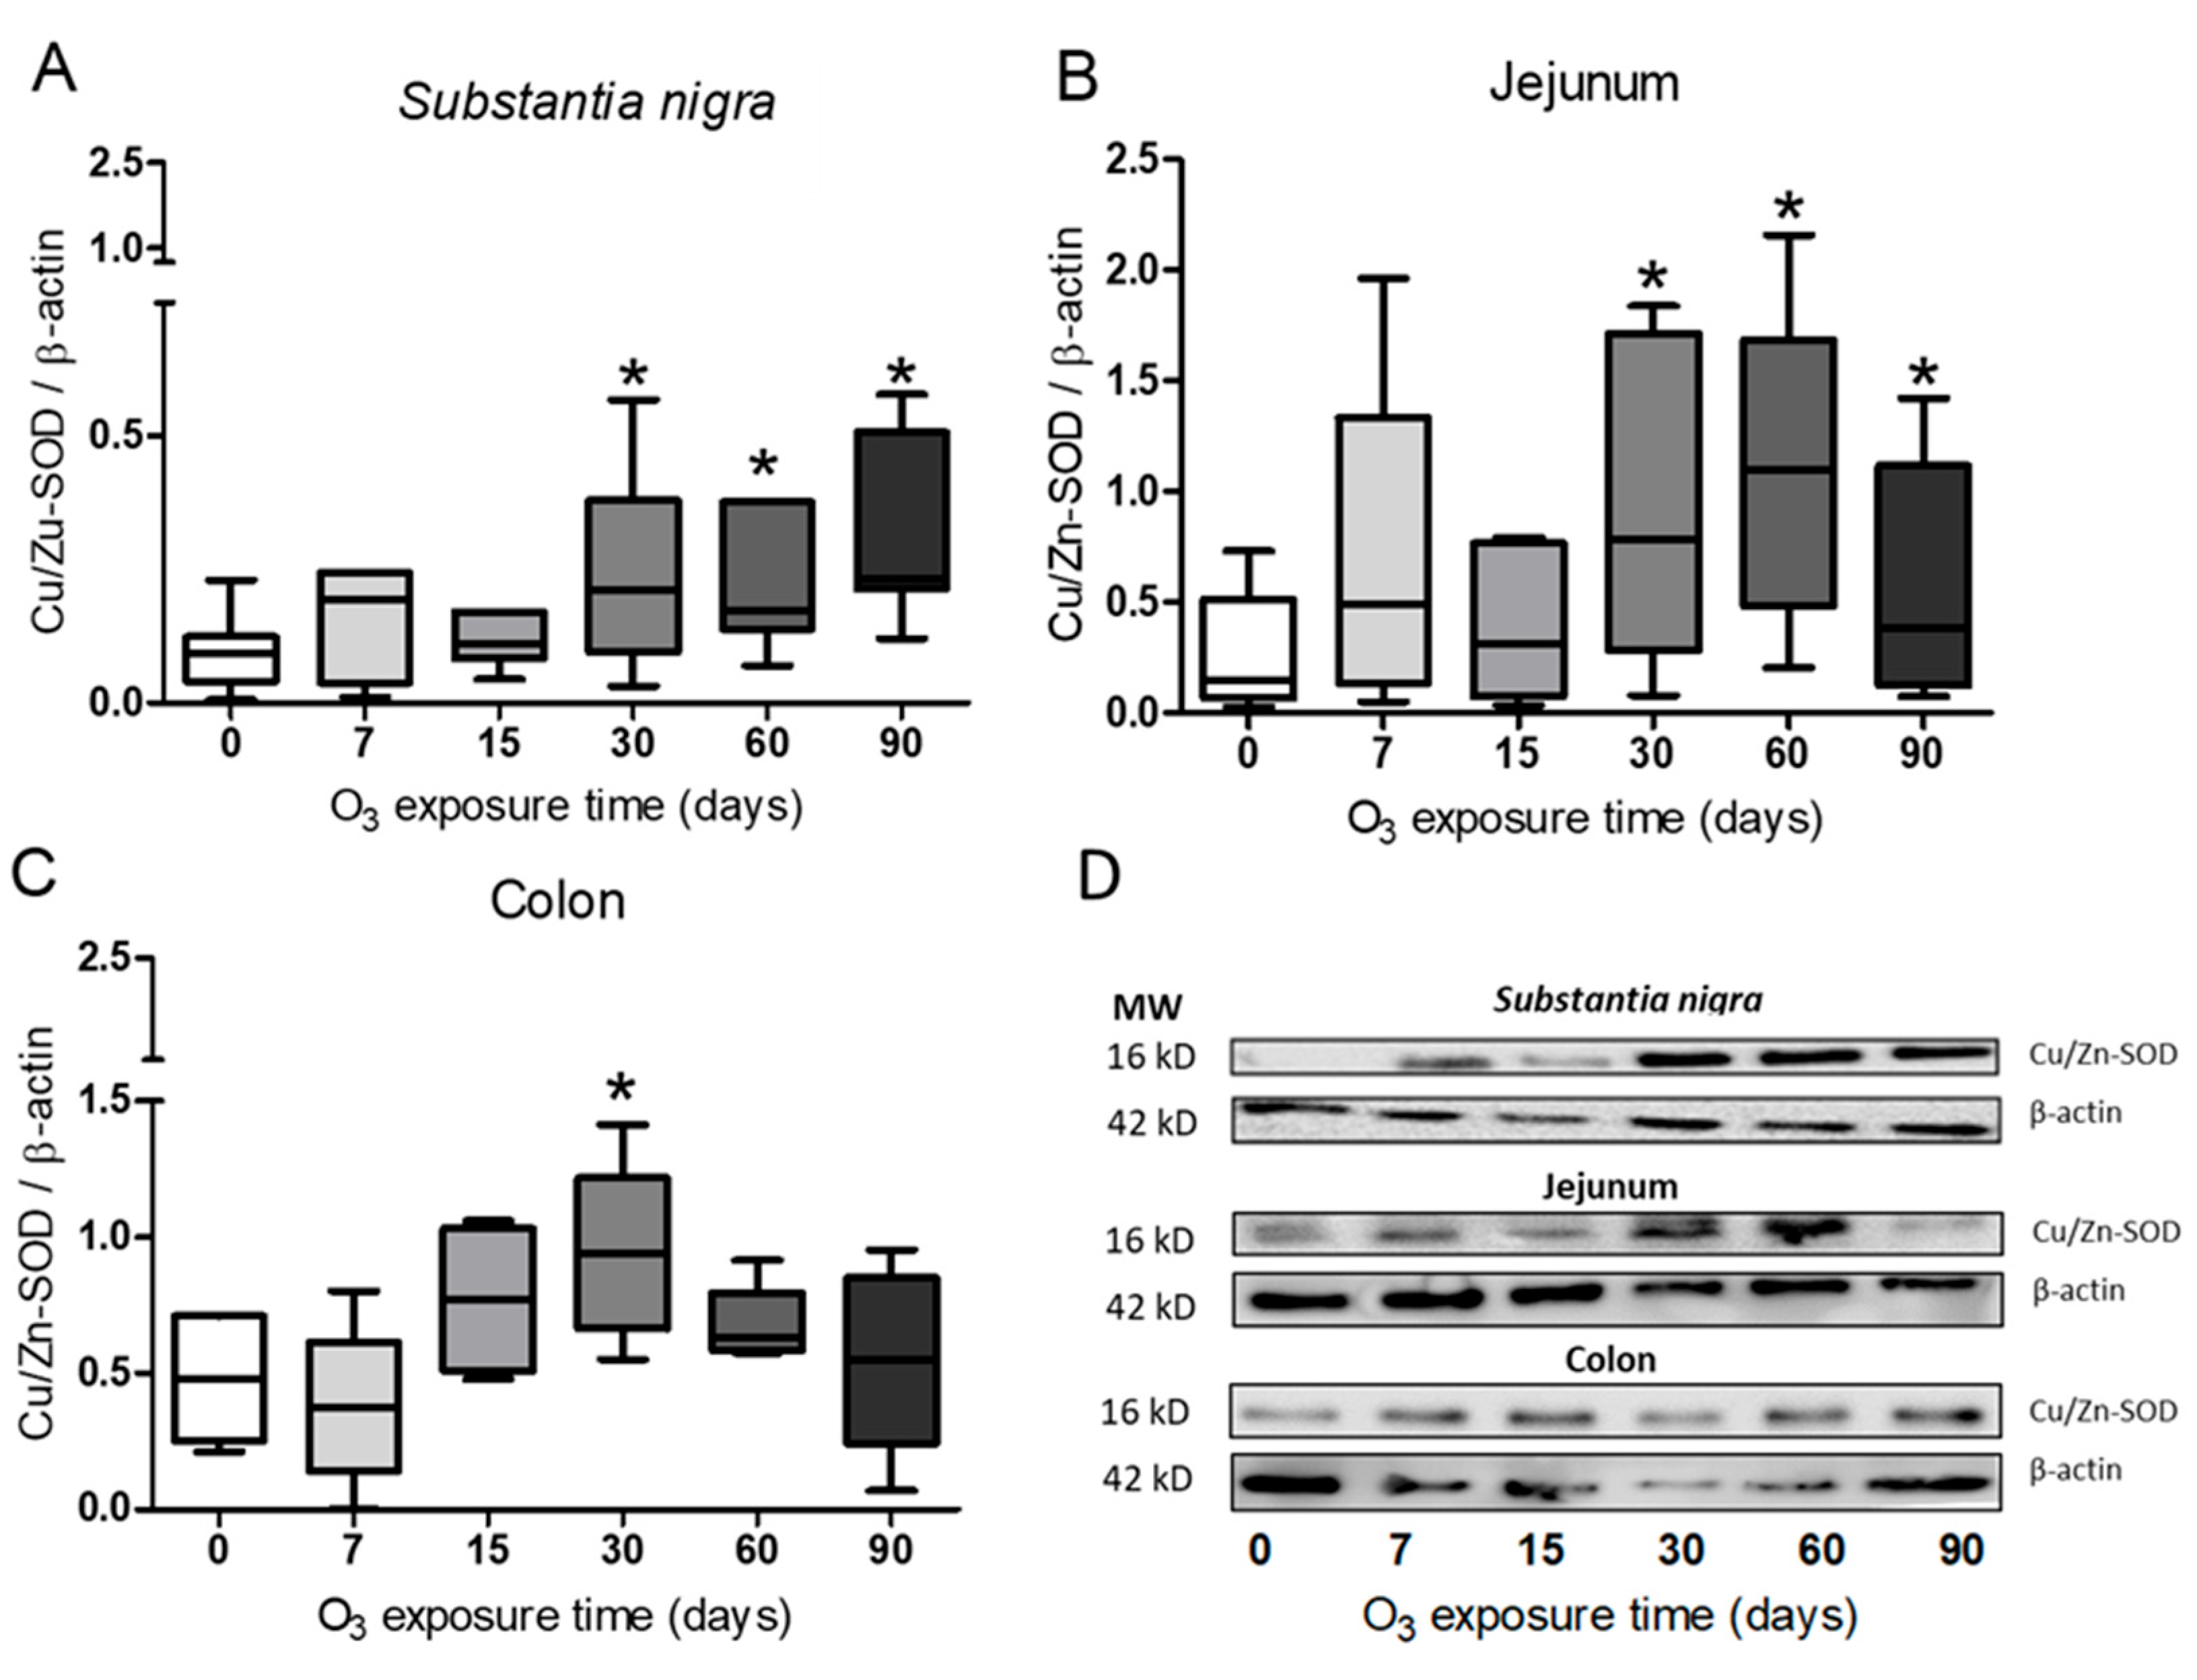
Figure 3.
Effect of exposure to O3 on the relative abundance of Mn-SOD. The abscissa axis shows the O3 treatments, and the ordinate axis shows the relative abundance of Mn-SOD represented in arbitrary units. *p ≤ 0.05. (A) substantia nigra. The Mn-SOD protein decreased at 7 and 60 days and at 90 days in the jejunum and colon (B – C). (D) Representative WB for each condition.
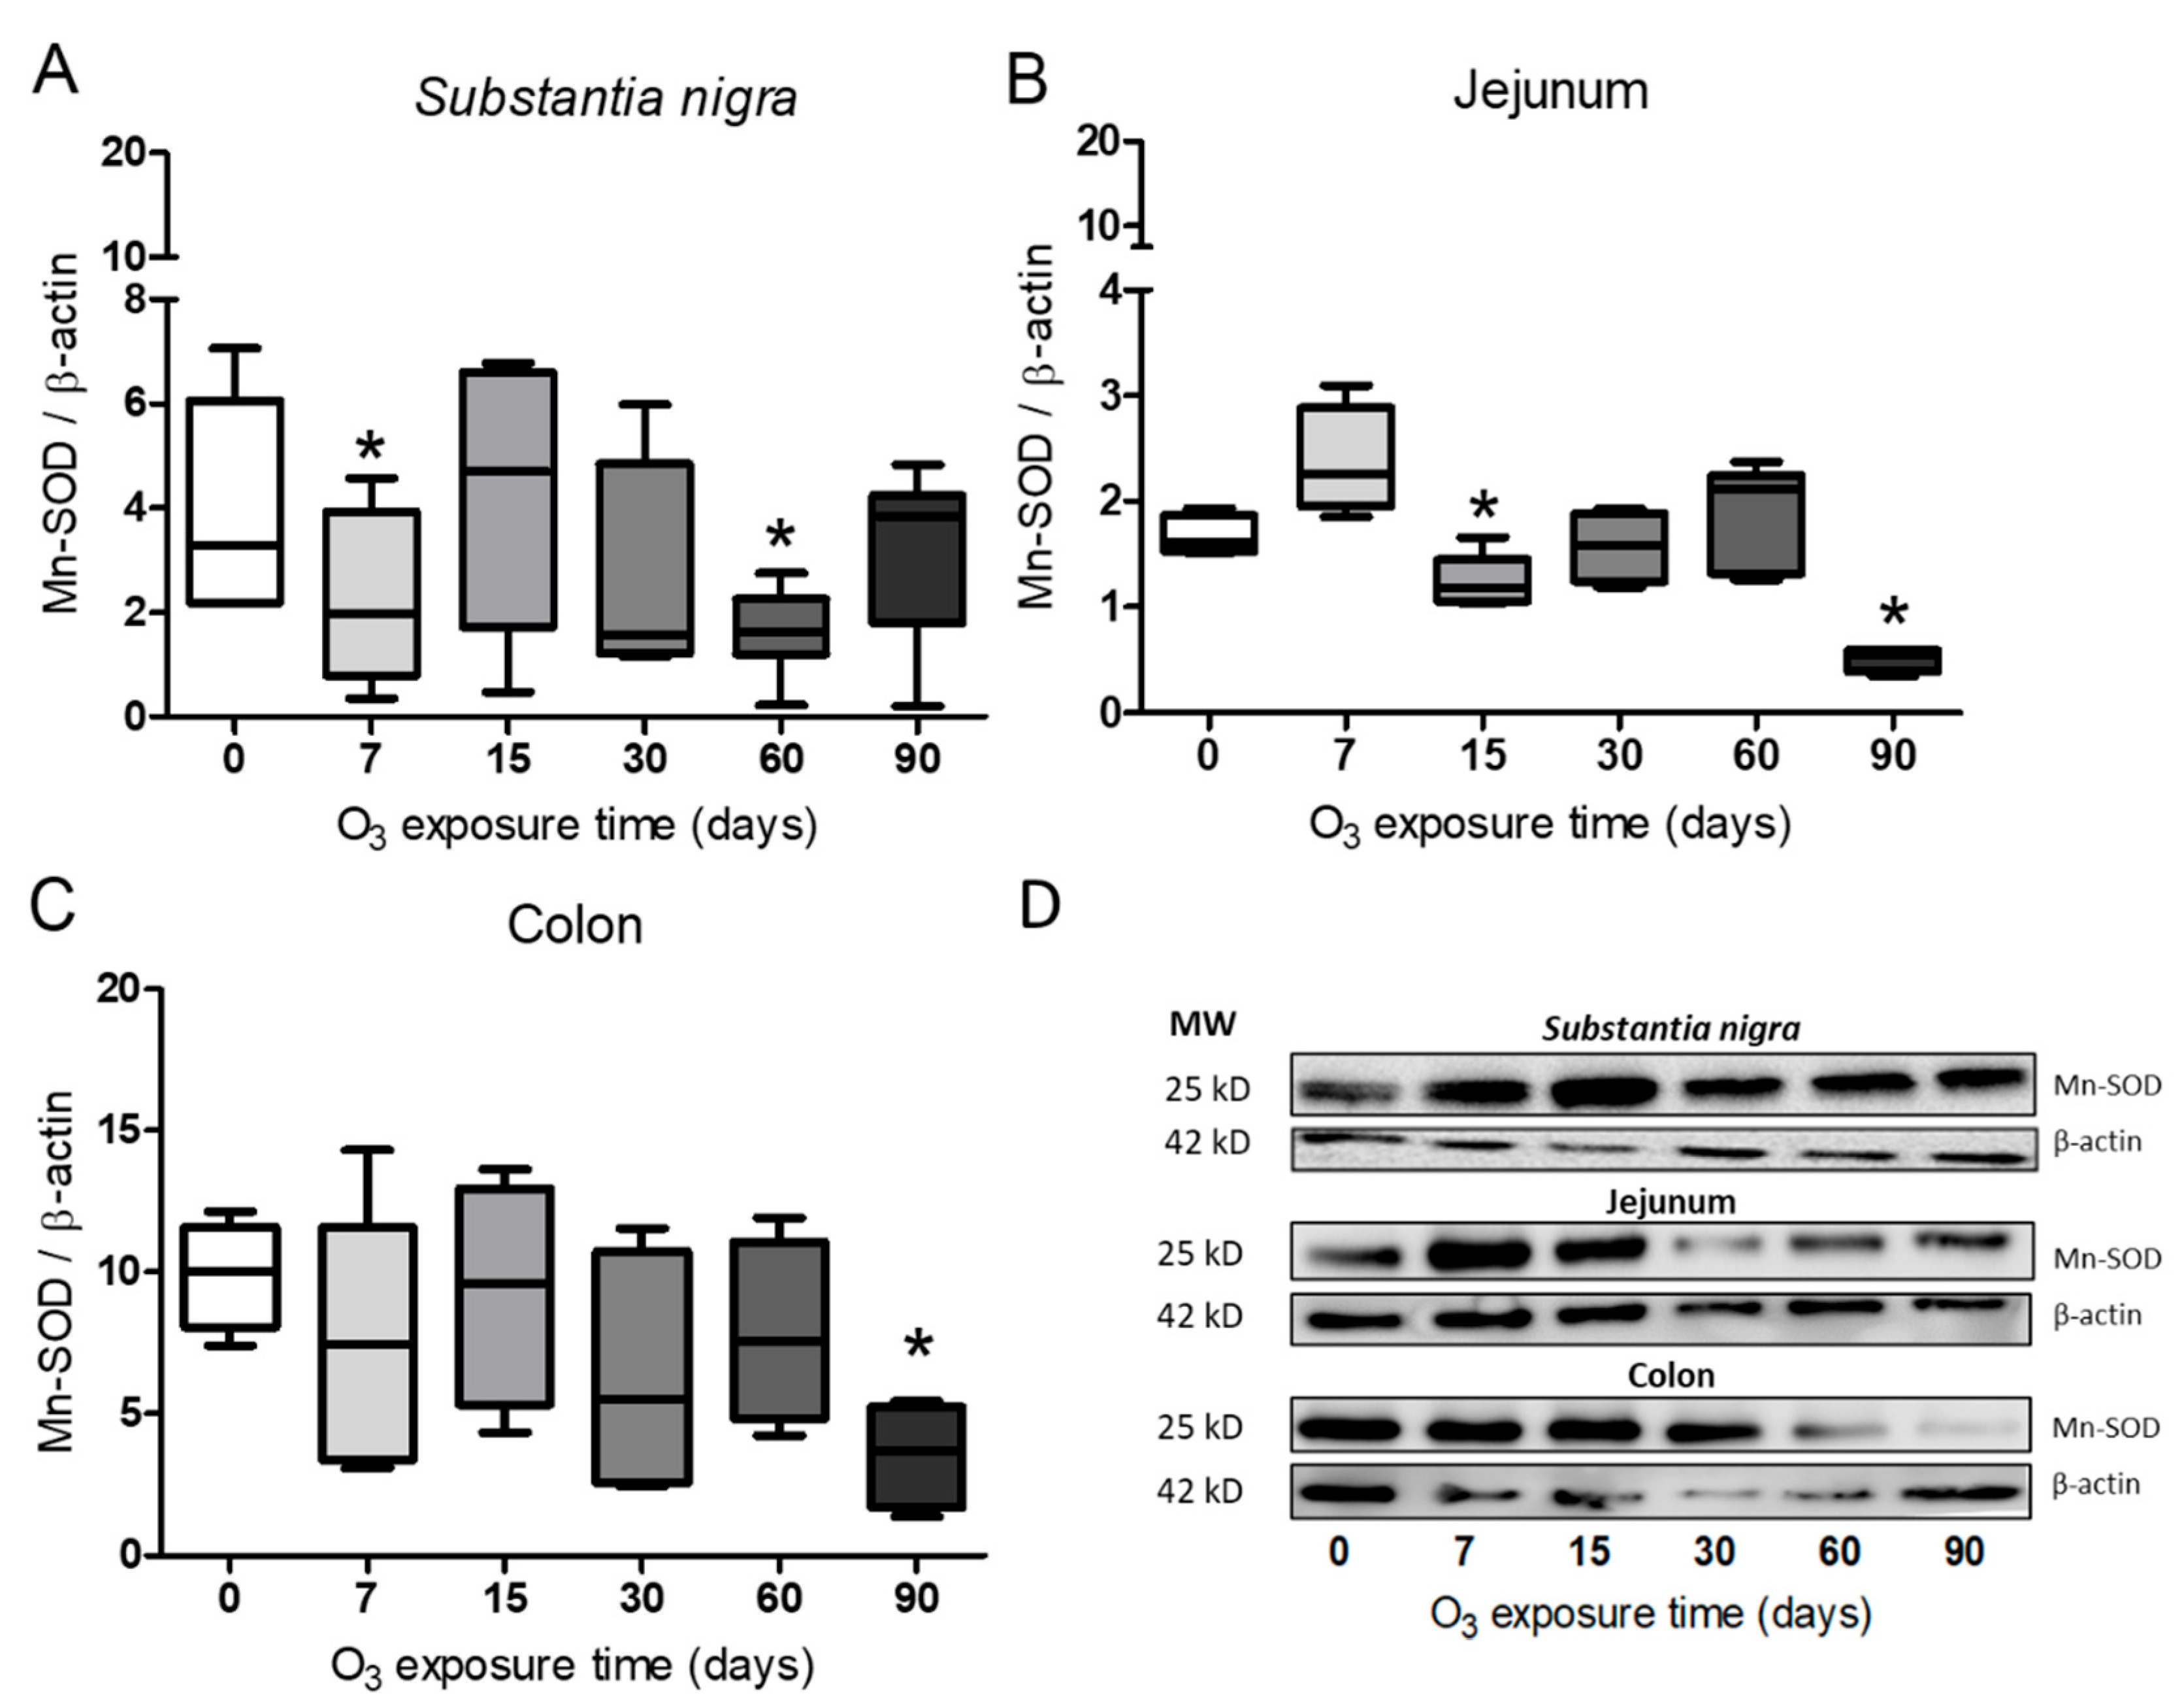
Figure 4.
Effect of exposure to O3 on SOD activity in the substantia nigra, jejunum, and colon of rats. (*p ≤ 0.05) The abscissa axis shows the different O3 exposure treatments of the animals, and the ordinate axis shows the SOD units per microgram of tissue. (A) Total SOD enzyme activity in the substantia nigra shows a significant decrease at 30 days of O3 exposure compared to the control group. (B) SOD activity in the jejunum does not show statistically significant variations. (C) In the rat colon, total SOD activity is significantly decreased at 7, 15, 60, and 90 days of O3 exposure compared to control animals. A Mann-Whitney U test was used to compare the groups against their respective controls.
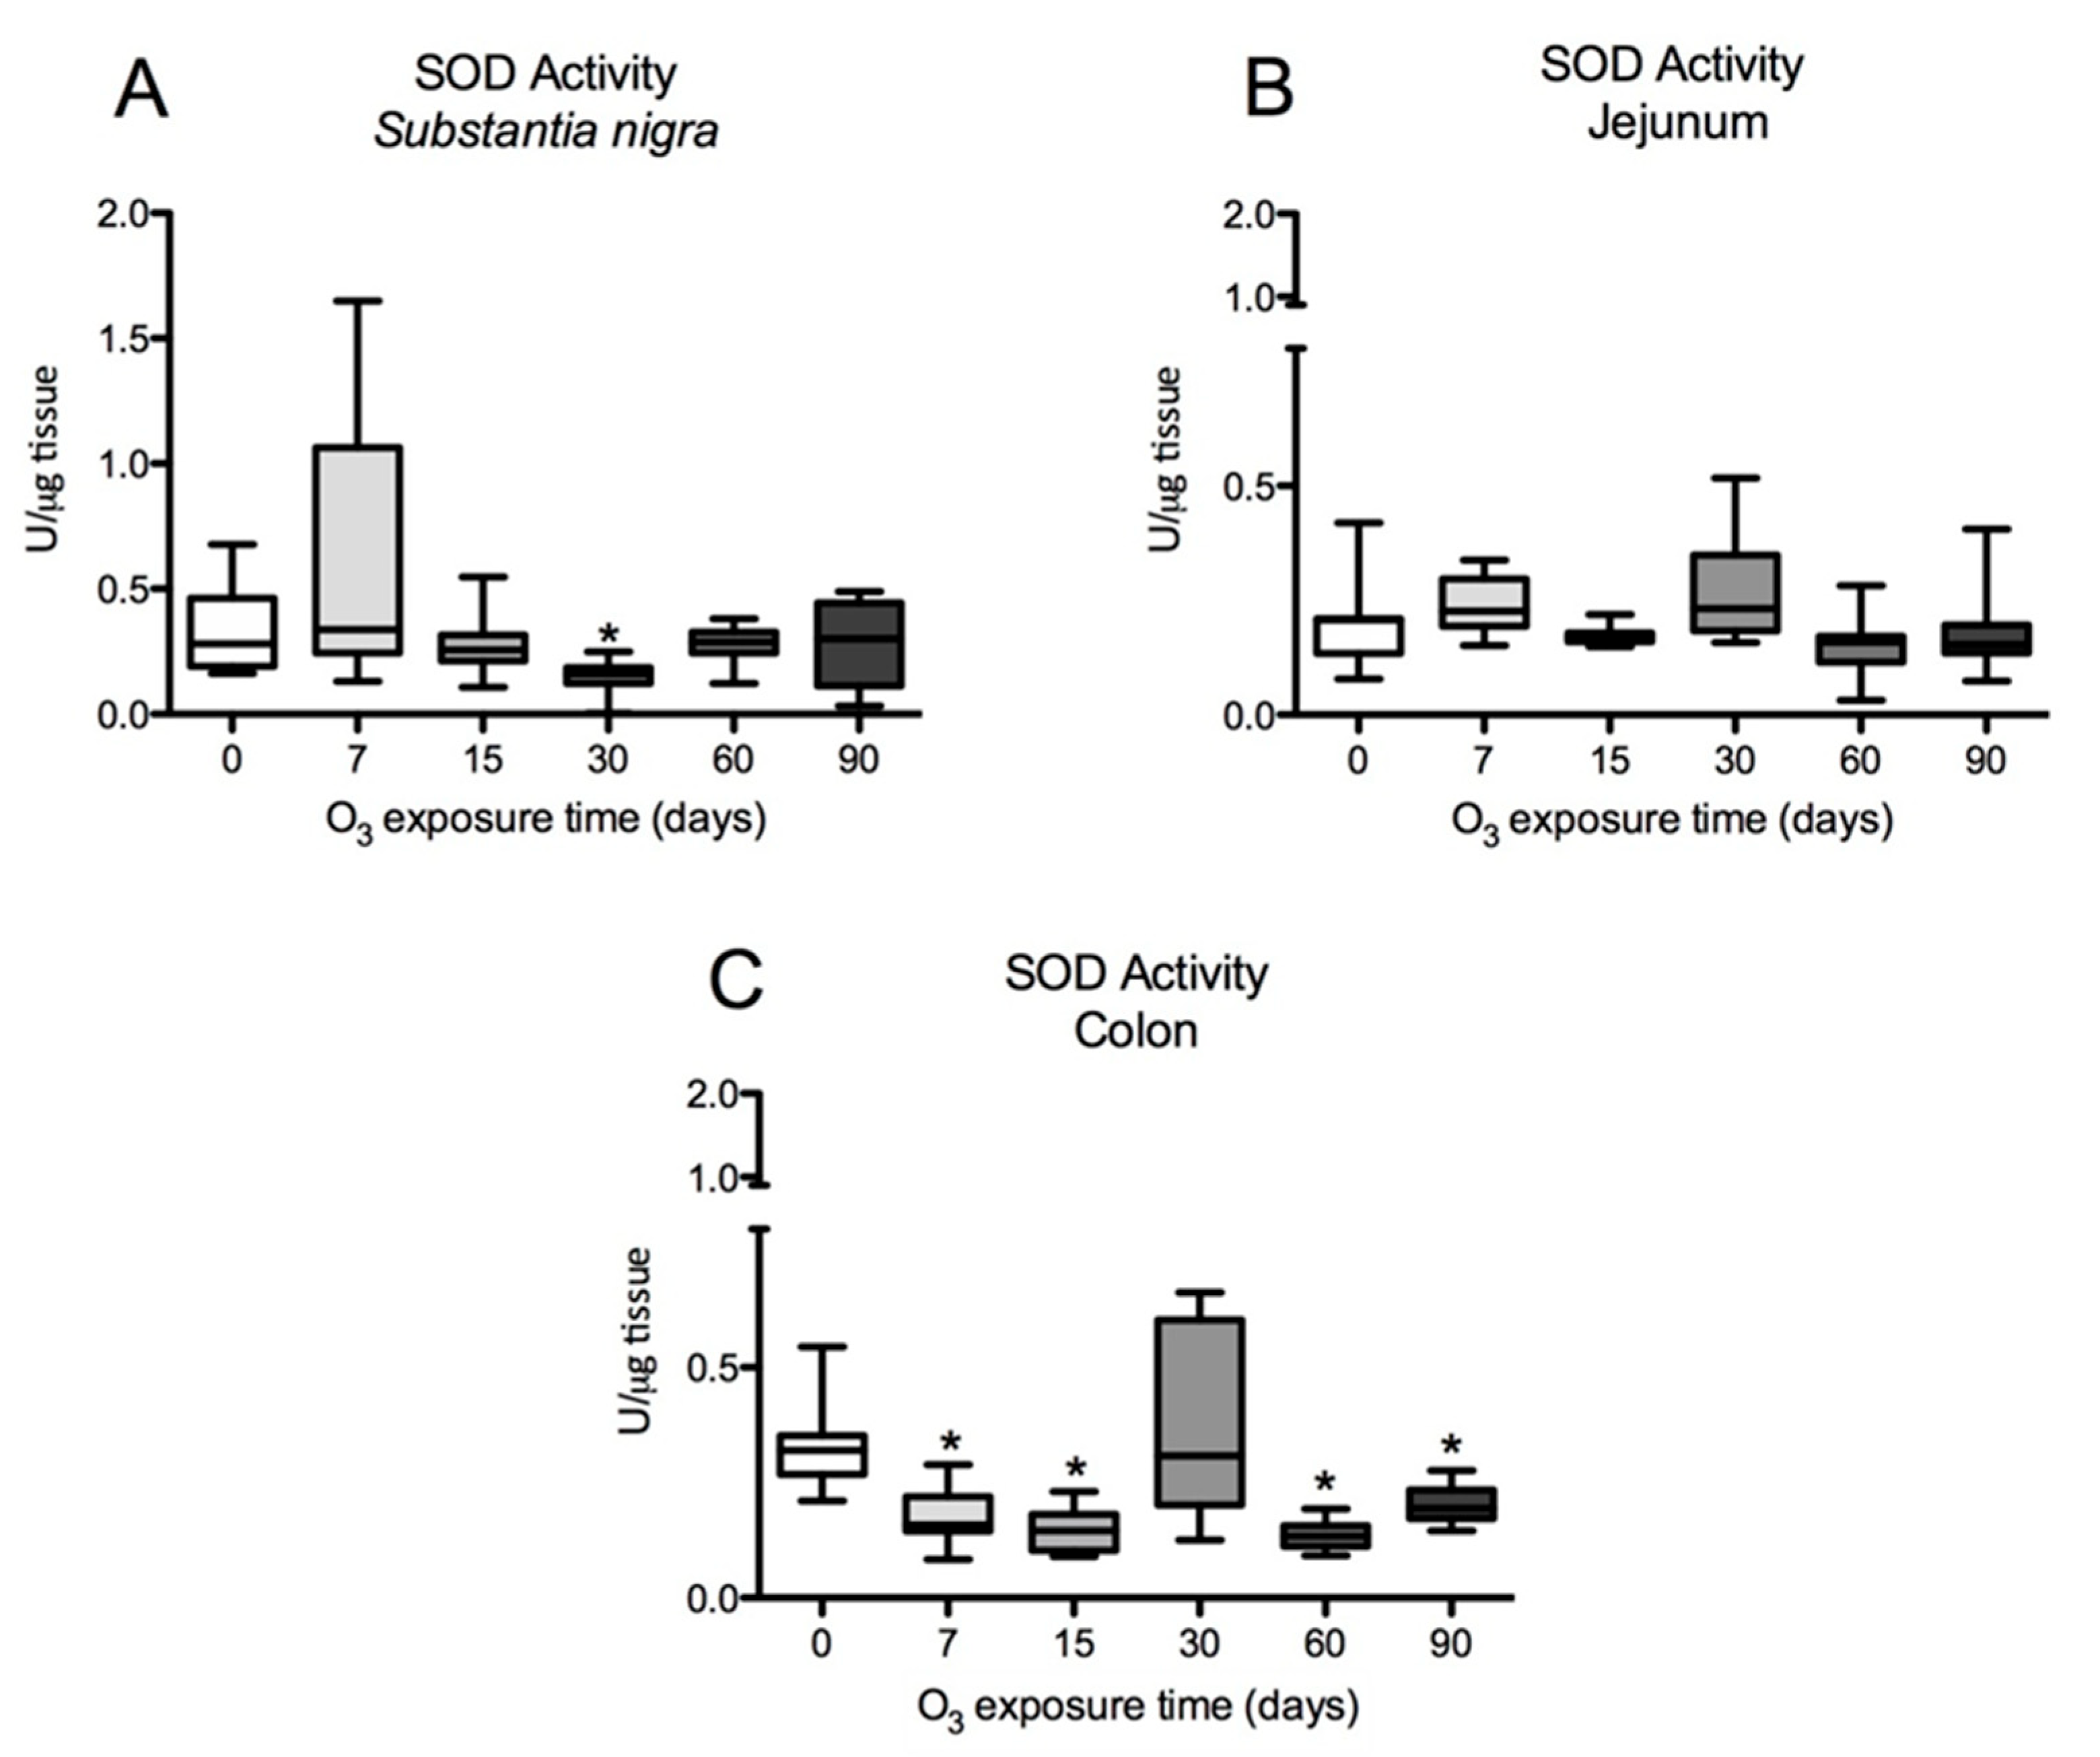
Figure 5.
Effect of chronic exposure to low doses of O3 on rat substantia nigra neurons. (A) shows micrographs of NFκB in substantia nigra of rats exposed to O3: a) Control, b) 7 days of O3 exposure, c) 15 days of O3 exposure, d) 30 days of O3 exposure, e) 60 days of exposure to O3 and f) 90 days of exposure to O3. The micrograph shows an increase in NFκB immunoreactivity in the nucleus at 15, 30, 60, and 90 days of exposure to O3. Arrows indicate the localization of NFκB in the cell nucleus. (Calibration bar = 50µm, 100X photomicrograph). (B). The abscissa axis shows the different O3 exposure treatments of the animals, and the ordinate axis shows the median number of cells reactive to NFκB. *p ≤ 0.05. (B-1) The graph shows the effect of chronic exposure to low doses of O3 on the localization of NFκB in the cell cytoplasm. The results show a cells decrease from 15 to 90 days of exposure. To O3 (p ≤ 0.05). (B-2) The graph shows the effect of chronic exposure to low doses of O3 on the localization of NFκB in the cell nucleus, noting the increase in the nuclear localization of NFκB.
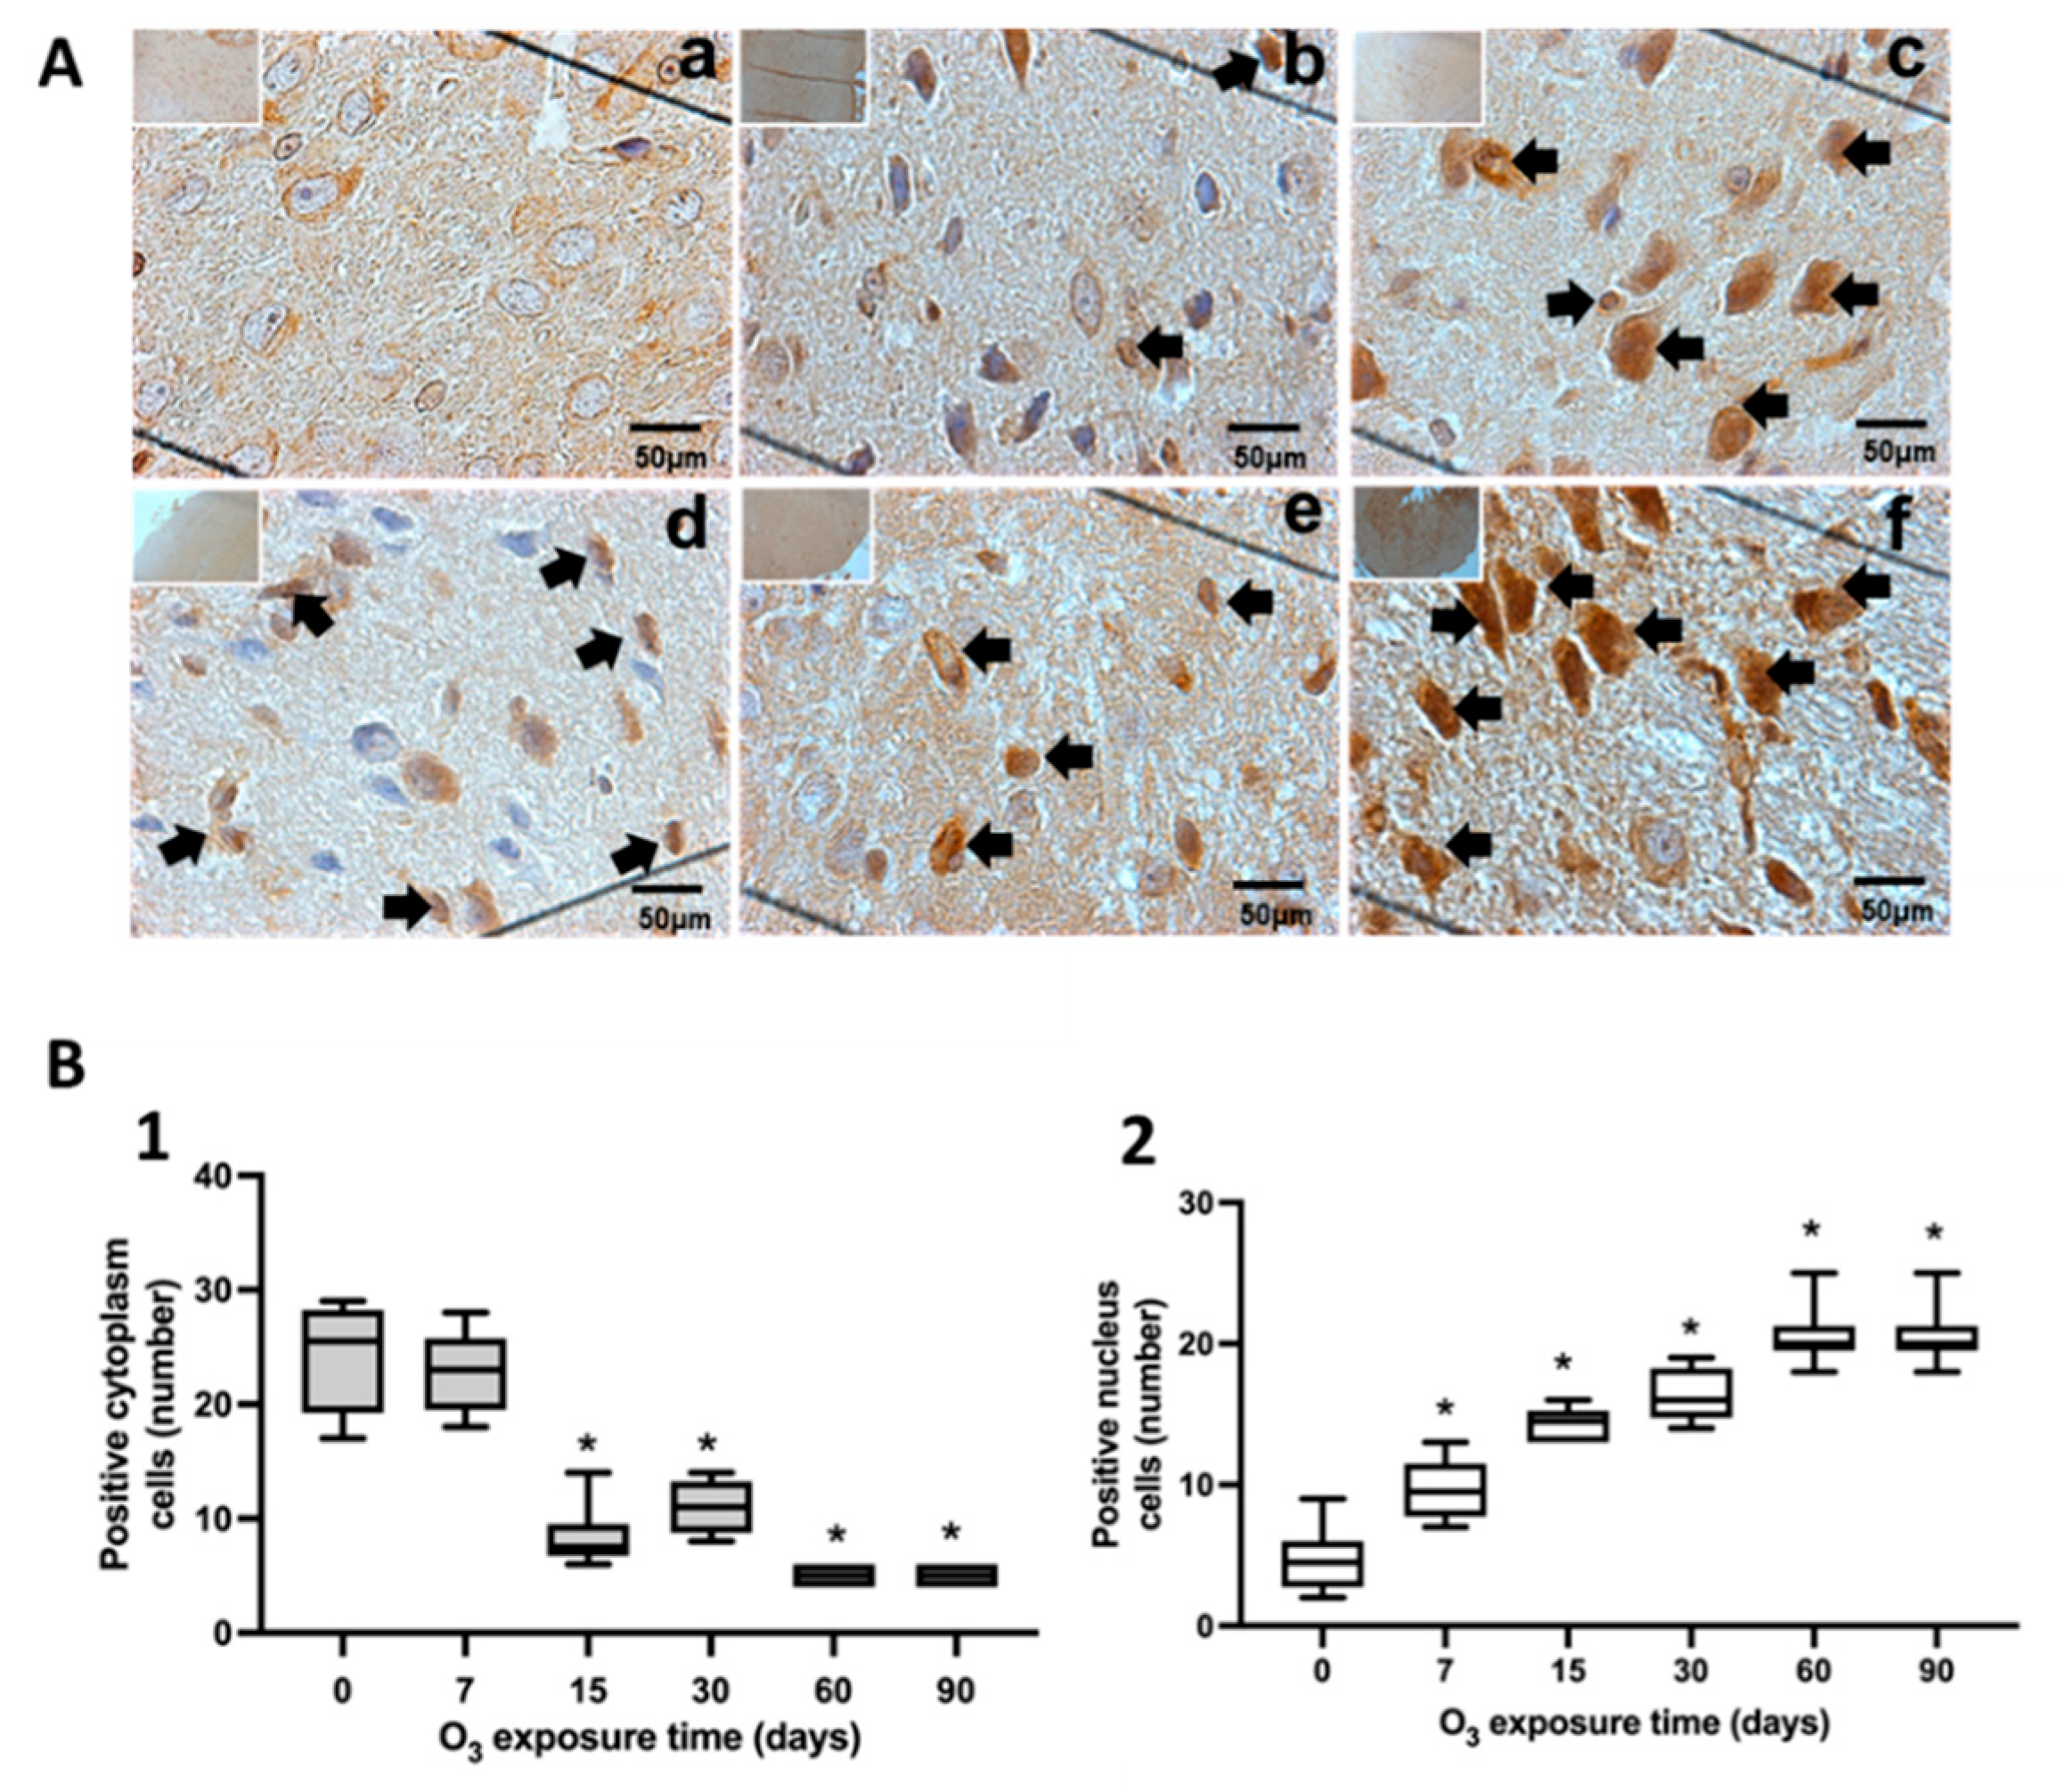
Figure 6.
Effect of chronic exposure to low doses of O3 on enterocytes in the jejunum of rats. (A) shows micrographs of NFκB in the jejunum of rats exposed to O3: a) Control, b) 7 days of O3 exposure, c) 15 days of O3 exposure, d) 30 days of O3 exposure, e) 60 days of exposure to O3 and f) 90 days of exposure to O3. The micrograph shows an increase in NFκB immunoreactivity in the nucleus at 7, 15, 30, 60, and 90 days of exposure to O3. Arrows indicate the localization of NFκB in the cell nucleus. (Calibration bar = 50µm, 100X photomicrograph). (B) The graph shows the different exposure treatments to O3 of the animals on the abscissa axis and the median number of cells reactive to NFκB on the ordinate axis. *p ≤ 0.05. (B-1) The graph shows the effect of chronic exposure to low doses of O3 on the localization of NFκB in the cell cytoplasm; a decrease in the number of cells is observed from 7 to 90 days of exposure to O3 (p ≤ 0.05). (B-2) The graph shows the number of cells with NFκB label in the cell nucleus; the results show an increase in the number of cells from 7 to 90 days of exposure to O3.
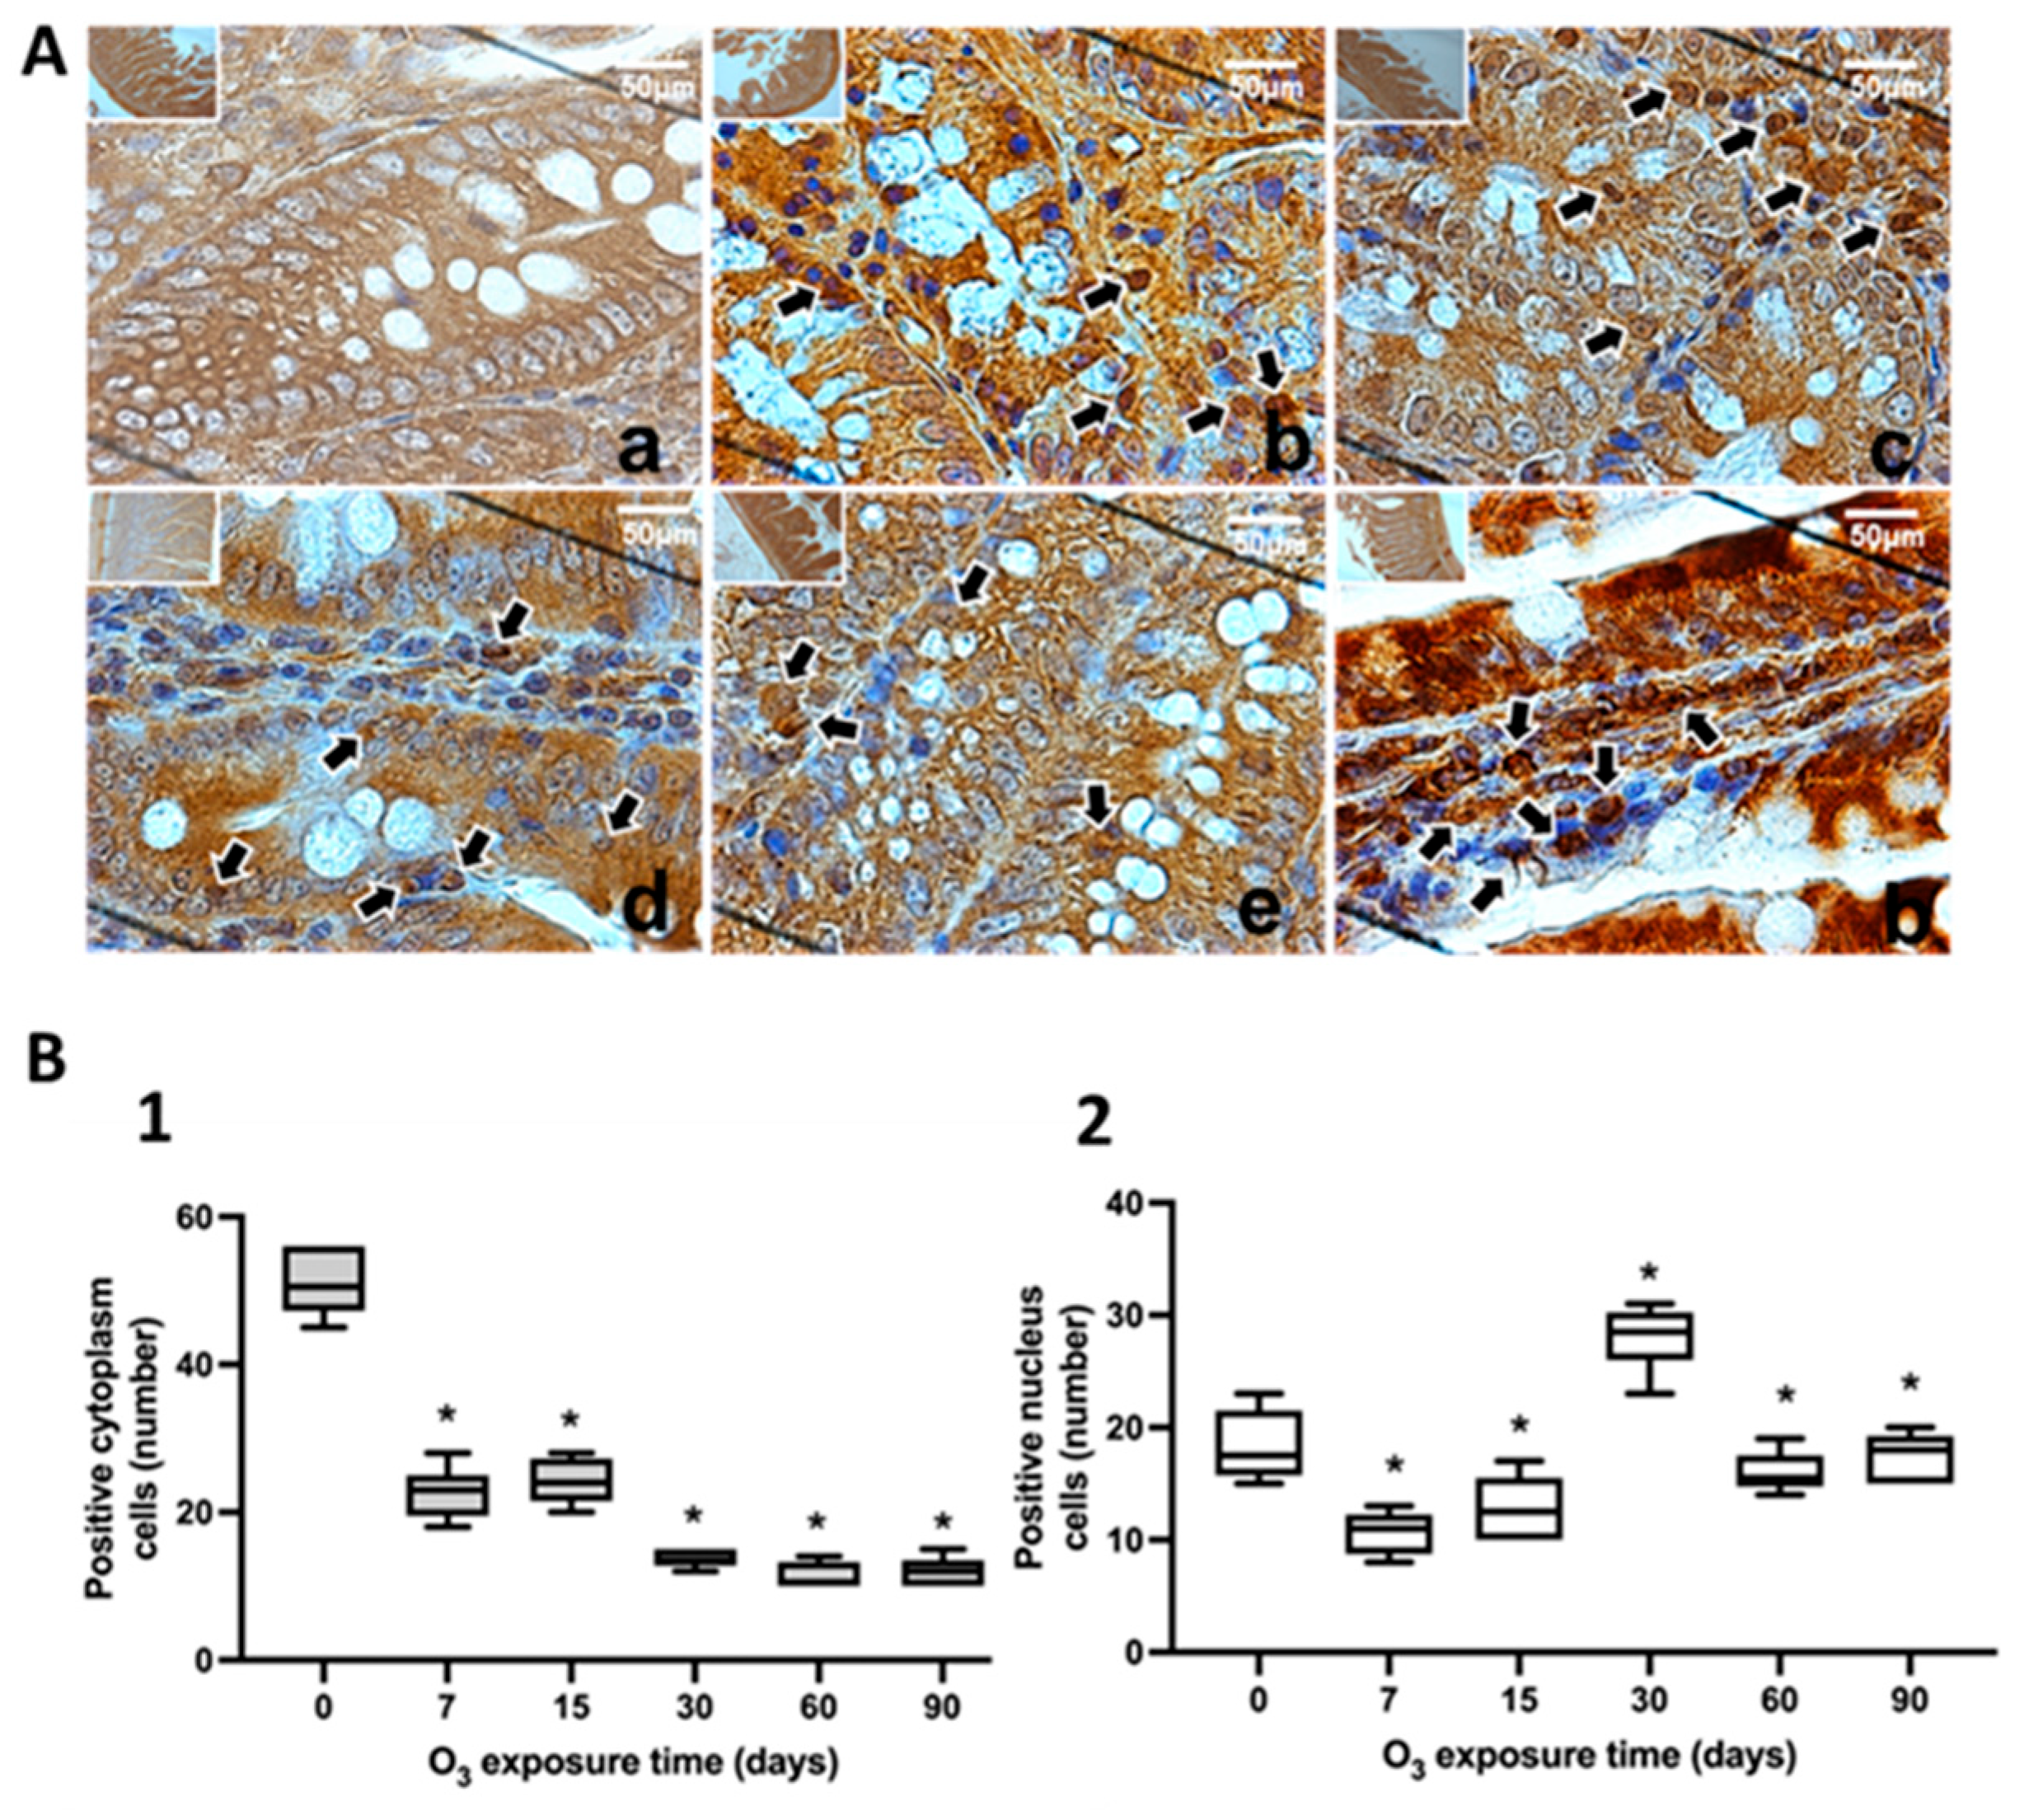
Figure 7.
Effect of chronic exposure to low doses of O3 on enterocytes in the colon of rats. (A) shows micrographs of NFκB in the colon of rats exposed to O3: a) Control, b) 7 days of O3 exposure, c) 15 days of O3 exposure, d) 30 days of O3 exposure, e) 60 days of exposure to O3 and f) 90 days of exposure to O3. The micrograph shows an increase in NFκB immunoreactivity in the nucleus at 15, 30, 60, and 90 days of exposure to O3. Arrows indicate the localization of NFκB in the cell nucleus. (Calibration bar = 50µm, 100X photomicrograph). (B) The graph shows the different animal exposure treatments to O3 on the abscissa axis and the median number of cells reactive to NFκB on the ordinate axis. *p ≤ 0.05. (B-1) The graph shows the effect of chronic exposure to low doses of O3 on the localization of NFκB in the cell cytoplasm; note a decrease in the number of cells from 7 to 90 days of exposure to O3 (p ≤ 0.05). (B-2) The graph shows the effect of chronic exposure to low doses of O3 on nuclear localization; the results show a significant increase in the number of cells from 7 to 90 days of exposure to O3.
Disclaimer/Publisher’s Note: The statements, opinions and data contained in all publications are solely those of the individual author(s) and contributor(s) and not of MDPI and/or the editor(s). MDPI and/or the editor(s) disclaim responsibility for any injury to people or property resulting from any ideas, methods, instructions or products referred to in the content. |
© 2024 by the authors. Licensee MDPI, Basel, Switzerland. This article is an open access article distributed under the terms and conditions of the Creative Commons Attribution (CC BY) license (http://creativecommons.org/licenses/by/4.0/).
Copyright: This open access article is published under a Creative Commons CC BY 4.0 license, which permit the free download, distribution, and reuse, provided that the author and preprint are cited in any reuse.


