Submitted:
20 March 2024
Posted:
20 March 2024
Read the latest preprint version here
Abstract
To make wind power more competitive, it is necessary to reduce turbine downtime and reduce costs associated with wind turbine Operation and Maintenance (O&M). Incorporating machine learning in developing condition-based predictive maintenance methodologies for wind turbines can enhance their efficiency and reliability. This paper presents a monitoring method that utilizes Base Density for the Support Vector Machine (BDSVM) and the evolutionary Fourier spectra of vibrations. This method allows smart monitoring of the function evolution of the turbine. A complex optimal function (FO) for 5-degree order has been developed that will be the boundary function of the BDSVM to timely determine the magnitude, frequency, and place of the failure occurring in wind turbine drive.
Keywords:
wind turbine
; monitoring
; wear trend
; Fourier vibration spectrum
; support vector machine
; base density of the collected data
; machine learning.
1. Introduction
Wind energy has seen remarkable growth over the past decade and continues to be on an upward trend in the power generation industry. In the current context of the reduction and even abandonment of conventional energy sources, wind energy emerges as a primary source, along with nuclear energy and hydropower. In these conditions, the reliability and stability of the wind turbine operations are crucial to maintaining the production capacity for prolonged periods and with optimal predictability [1]. With the rapid development of wind turbine technology and a higher demand for renewable energy, the number of wind turbine (WT) units had a major increase, but under these conditions, the failure rate has also risen [2]. Power transmission is influenced by all the components of the turbine including the kinematic chain, rotor, gearbox, and generator. Drawing from over 20 years of experience in both operational and research contexts, it can be concluded that the component with the highest level of vulnerability is the gearbox, with a very high failure and downtime [1,2,3]. Analyzing the vibration data obtained from the condition monitoring system CMS to understand the dynamic behavior of WT and the timely detection of early failures is a challenge for many researchers [4,5].
Despite wind power being the fastest-growing renewable energy source in the world, the industry still faces premature failures of turbine components [6,7], which lead to increased operation and maintenance (O&M) costs and subsequently increased cost of energy (COE). To make wind power more competitive, it is necessary to reduce turbine downtime and increase reliability [2,3]. Condition monitoring can help reduce the chances of catastrophic failures, enabling cost-effective operation and maintenance practices. It also facilitates the selection of appropriate input parameters to improve turbine performance, thus implementing the most efficient control and design strategy [8,9,10,11,12]. Compared to other applications, the representatives of the wind industry recognized quite late the benefits and importance of monitoring the operating status through the use of artificial intelligence (AI), the base density for the support vector for machine learning (BDSVM), and the evolutionary Fourier spectra of vibrations. Substantial research has been conducted to establish algorithms based on a large volume of data, that train on specific moments of failure, through machine learning to obtain specific failure models [1,2,3,4,5,6]. In situations where such categorized and extensive data is unavailable, it becomes necessary to develop solutions based on limited data. By considering real operating scenarios, optimal prediction models can be generated to address such challenges effectively.
2. Generality of the Wind Turbine Conditions Monitoring
The monitoring of the working condition of a wind turbine (WT), is defined as a complex process of monitoring the parameters of the state of the machine so that a significant change is detected, which indicates a possible developing fault [6,7,8]. This can potentially help in different stages of wear: early detection of emerging failures, minimizing the risk of catastrophic breakdowns; evaluation of proper functions of components, leading to reduced maintenance costs; analysis of root causes of defects, facilitating optimal determination of input parameters for improved turbine operation; establishment of control strategies; and optimization of component design [9,10]. In a broad sense, the CMS of a wind turbine can target almost all of its major subsystems, including blades, nacelle, power transmission, tower, and foundation [15,16,17]. This paper presents a method that focuses on the monitoring of wind turbines and can be applied to the different components of the wind turbine: rotor shaft with main bearings, gearbox, and generator. From a CMS perspective, the main monitored transmission components include the rotor shaft, gearbox, and generator. Among these, the gearbox experiences the longest downtime [10,11]. Other research has also shown that the gearbox is the most expensive subsystem to maintain during the 20-year operating life of a turbine [14,15]. For this reason, the gearbox was chosen as the main subsystem targeted in this study. In detail, this paper will cover the typical practices, challenges, and future research opportunities related to CM wind turbine drivetrains.
3. State of Art in the Monitoring of the Wind Turbine
To understand the dynamic behavior of a WT, especially of a planetary gearbox, a number of techniques have been used in research and the industrial fields. These include vibration analysis, oil condition analysis, thermography, acoustic measurements, ultrasound, boroscopic inspection, electrical parameters effects, self-diagnostic of sensors, etc [17,18,19,20]. To obtain reliable predictive maintenance results, a combination of different techniques is needed. While vibration analysis may hold a predominant role, it is complemented by other specific technologies to perform decision-making accurately.
However, vibration analysis for component fault diagnosis in wind turbines is a hard challenge due to the complex mechanical conditions of the power transmission kinematic chain, the variable operating conditions exhibiting transient phenomena, and the speed differences between different elements of the gearbox [6]. The use of vibration transducers, particularly piezoelectric accelerometers, is the most used method. These sensors have different sensitivities depending on the speed and are rigidly fixed on the structure of the components [4,5,6,7]. The repartition of the sensors in the monitoring process of the wind turbine from the actual stage of the research is shown in Figure 1 and Table 1.
4. Case Study
The experimental protocol is based on the Condition Monitoring System (CMS) used for online monitoring of wind turbines. The data used is part of the online data protocol regarding the wind turbines' state of operation. The recorded data is analyzed using signal evaluation both in the time domain and in the frequency domain. The CMS provides all data sets as originally optimized for all turbines. The data is collected from a wind turbine gearbox. The analysis is centered on the gearbox, examining the vibrations at three specific points of the gearbox: Low-speed Shaft (LSS), Intermediary Shaft (IS), and High-Speed Shaft (HSS). The data acquisition is conducted using vibration sensors fixed on the bearings of the kinematic chain, starting from the input, which is the rotor speed, and extending to the output, which is the generator speed. The data transmission and processing chain is described in Figure 2.
The online acquisition system allows the data to be recorded according to the original settings thus capturing signals as well as speed and power data. In this way, the evolution of vibrations can be determined depending on the parameters of speed and power.
The system allowed the definition of parameters in the frequency domain both in the acquisition and analysis phases. The selected frequency range is according to ISO10816-21 standards, including the rotor, gearbox, generator, and tower/nacelle. Figure 3 shows the data sets according to CMS, for the gearbox in the 3 entry points, LSS, intermediate IS, and HSS.
The paper will consider the data from the input of the gearbox, the acceleration in the frequency domain at LSS, and the data of the gearbox output, in the frequency domain at HSS.
5. Research Method and Some Results Concerning the Evolution in the Monitoring Process by Using the Fourier Spectrum of the Vibrations
Signal analysis is based on numerical processing taking into account the parameters being monitored. Thus, Figure 4 shows the waveforms obtained with the help of the monitoring software both in the time domain and in the frequency domain. The vibration parameters are set according to the ISO10816-21 standard, specifying acceleration in m/s² RMS, vibration velocity in mm/s RMS, and demodulated acceleration in m/s²E. With the bearing frequency data, the characteristic frequency of the bearing defect can be identified. The same approach is applied for gear characterization by using the gear mesh frequency data according to the kinematic chain of the gearbox [12].
The structure of the parameters is complex and based on the vibration defect theory [14,15]. The vibration limits for wind turbines, provided by the ISO standard 10816-21, present an integrated base defining the recommended state of operation. Even in this situation, many specific cases of vibration of the wind turbine components are difficult to classify according to this standard[19,20]. For this purpose, it is proposed to develop a model that can interpret the state of operation in real operating conditions using data provided by CMS.
6. The Base Density Support Vector Machine and Objective Functions
The base density of the support vector for machine learning (BDSVM) is important to establish the basic data for neural network learning. This paper presents a method to find the most important data and establish the objective function (FO) for support vector machine learning (SVM). SVM is the most successful algorithm for classification problems. In any monitoring activity, it is more efficient to train the neural network using BDSVM as it reduces the learning input data (decreasing computational complexity) and determines the resulting weights matrices to swiftly identify a mechanical failure.
The distance between the points representing the input data is calculated by the Mahalanobis method instead of the Euclidean distance (9). The Mahalanobis distance is calculated from the quantity μ which represents the average of the points' distances, to each point. The cov-1 represents the inverse covariance matrix. This distance is [21,22]. The Mahalanobis distance is the smaller unit that takes into account the correlation of the data set and does not depend on the measurement scale [23,24]. The population variance is calculated with a variance-convariance matrix [24]. The Mahalanobis distance from the point to the mean of the distribution μ can be calculated by (9), and the Mahalanobis distance from one point to another can be calculated by (10):
Where the population variance is calculated with [12]:
and population covariance with:
If cov(xi) & cov(yi)>0
both of them increase or decrease;
If cov(xi) & cov(yi)<0
when xi increases yi decreases or vice-versa;
If cov(xi) & cov(yi)=0
not exist any relation between xi & yi;
If var(xi)> var(yi)
xi increase or decrease faster than yi;
End.
The average of d is:
where d is the distance between the points.
If di >d,
the point i is in the outlier group;
Else
the point i will be considered important (meaningful) points in BDSVM;
End.
The optimization function (FO) was proposed as a polynomial function of the fifth order with real coefficients:
where ai will be determined by using the matrix equation:
with the following constraints:
- -
- xi>0;
- -
- xi must be meaningful points, xi group 1;
- -
- xi BDSVM,
where FOi is the amplitude of the vibration evolution in time where the defect will appear and xi is the frequency in time. To define the FO, 5 boundary points (xi, FOi)BDSVM will be used for each moment of time vs. frequency points but under the same conditions of forced vibration and for the same wind turbine. The BDSVM points must strictly adhere to the condition of belonging to BDSVM which is that:
The boundary of FO will be the limit of the optimal functioning of the wind turbine. In this way, the moment of time for intervention on the gearbox will be determined, to eliminate the danger of an imminent defect. To solve the objective function FO, proper LabView virtual instrumentation was used and the block schemas are shown in Figure 5, Figure 6 and Figure 7.
di <average_d.
If the operational limit of the turbine is set at a specific FO, a defect can be easily detected through control at each frequency. This can be done by checking if the working point (frequency, magnitude) is in the normal functioning area or outside of this. In this way, it is possible to determine the maximum permissible magnitude of vibration.
In this case, the equation of the FO will be:
For the predictive maintenance will be applied the following relation:
where xi is the frequency for the imposed five points BDSVM, the points from boundary limits, and fi is the all current frequencies that must be checked. If this condition is false, the respective points could be the potential mechanical wear.
This method was applied to synthesize the data acquisition of the wind turbine in the period between December 2023 to February 2024.
The conditions that were imposed are the following: (i) the data acquisition was for the same, or very similar wind turbines; (ii) the data acquisition that was researched is from the sensors from the gearbox, B3-LSS, and B5-HSS, HSS upwind bearing radial and similarly HSS downwind bearing radial; (iii) the data acquisition was performed in the similar dynamic conditions of wind intensity, speed, and power; (iv) the acquisition data that was synthesized is the data that falls under the condition to be classified as a meaningful point, xi group 1, xi BDSVM, see Figure 8.
To construct the FO for the data acquisition and establish the trend of the maximum values of the vibration magnitude vs. frequency were used four Fourier spectra for the upwind and downwind bearings, see Figure 9. The results of FOi are shown in Figure 10 and Figure 11.
Using the Fourier spectra, the objective functions (FOi) were constructed the objective functions (FOi) for each of these data sets. All these FOs were shown in Figure 11, Figure 12, Figure 13 and Figure 14 ., for up and downwind sensors from the wind turbine gearbox.
Using the data from the column matrices ai, the fifth-order equation for FOi will be determined.
The FOi for the upwind position of the sensor is shown in relation (19) and for the downwind position in relation (20).
All determined FOs represent different stages of the mechanical condition of the turbine gearbox assembly. With the help of these functions, the trend of potential defects in the turbine gearbox area can be assessed. At any given moment, it is possible to check if the function is approaching the period close to the appearance of a defect or not. Throughout this timeframe, it will be possible to examine whether the points (Frequency, Magnitude) fall within the first or last FO or between them, providing information on the proximity of a potential defect, as per relations (19) and (20). The trends of these functions are depicted in Figure 14.
If the first FO objective function is defined after an intervention when the gearbox is working correctly, and the last function is determined close to the appearance of a defect, the position of any point (frequency, amplitude) can be determined between these limits. Intermediate FOs define the intermediate limits. By using this method, it will be possible to implement preventive maintenance and also monitor the normal operation of the gearbox of the wind turbine.
7. Conclusions and Future Work
The power transmission in wind turbines is carried out using planetary gearboxes working in variable conditions, in terms of load, speed, and kinematics. This makes the vibration monitoring and analysis complicated, thus increasing the difficulty of fault diagnosis. The scope of this paper is to propose a mathematical model using AI techniques to evaluate the gearbox condition during the operation.
After analyzing the obtained results, the objective functions, and the trend of the monitoring results, we can make the following remarks: (i) The applied method is general and can be applied to many other dynamic monitoring processes; (ii) The designed LabView instrumentation for the synthetic analysis of the obtained acquisition data opens the way to applying more virtual instrumentation in monitoring the dynamic behavior across various mechanical fields; (iii) Using BDSVM to filter out the meaningful data adds a new front to applying machine learning in monitoring processes; (v) Establishing the trend of the FO for each position of the gearbox sensors ensures the design of an intelligent monitoring system for predictive maintenance; (vi) The trend for the low frequency in the upwind sensor position is a decrease in frequency and an increase in magnitude. Conversely, the trend involves an increase in both frequency and magnitude for the high frequency. In the downwind sensor position, the trend is characterized by an increase in frequency and a decrease in magnitude.
In future work, we propose to generalize this method and leverage neural networks for the rapid establishment of weight matrices, objective functions, and wear trends in wind turbines across all sensors. This will be integrated into a comprehensive matrix comprising objective functions, alongside a monitoring and trend matrix.
In the next stage of this research SVM Regression analysis will be implemented to predict the magnitude or amplitude of vibrations based on various input features (e.g., frequency, time).This information would be crucial to obtaining a quantitative measure of potential issues. Upon further assessment of the FFT spectrum of vibrations leading up to failures or defects, we also aim to study and explore other features (fluctuations in phase, etc.) that could indicate upcoming defects. This condition-based maintenance strategy can also be further enhanced by incorporating supervised classification. We plan to label the datasets indicating different points (labeled points) in time leading up to the developing fault. This would be done through collaboration with the industry specialists. The classification algorithm can be employed to identify the definite states of the system (normal operation, potential fault, critical fault). The combination of regression and classification would allow for a more comprehensive predictive maintenance approach.
The proposed model is intended to be applied in other industrial applications in the case of condition monitoring of machine-tool spindles.
Author Contributions
Conceptualization, B.C. and O.A.; methodology, B.C and O.A.; software, B.C. and O.A; validation, B.C., O.A., O.S. and A.A.; formal analysis O.A., O.S., and A.A.; investigation, B.C., O.A., O.S., A.A., M.N. and U.H.; resources, B.C.; writing—original draft preparation, O.A. and B.C.; writing—review and editing, B.C. and O.A., O.S., A.A. M.N. and U.H.; supervision, O.A.; funding acquisition, B.C. and O.A. All authors have read and agreed to the published version of the manuscript.
Funding
This research received no external funding.
Institutional Review Board Statement
Not applicable.
Informed Consent Statement
Not applicable.
Data Availability Statement
The requested data is currently unavailable as the owner has deemed it confidential for economic reasons.
Acknowledgments
This work was supported by a grant from the National Program for Research of the National Association of Technical Universities - GNAC ARUT 2023.
Conflicts of Interest
The authors declare no conflict of interest.
References
- Nie, Y.; Li, F.; Wang, L.; Li, J.; Sun, M.; Wang, M.; Li, J. A mathematical model of vibration signal for multistage wind turbine gearboxes with transmission path effect analysis. Mechanism and Machine Theory 2022, 167, 104428. [Google Scholar] [CrossRef]
- Spinato, F.; Tavner, P.J.; Bussel, G.J.W.; Koutoulakos, E. Reliability of wind turbine subassemblies. IET Renew. Power Gener. 2009, 3, 387–401. [Google Scholar] [CrossRef]
- Dao, C.; Kazemtabrizi, B.; Crabtree, C. Wind turbine reliability data review and impacts on levelised cost of energy. Wind Energy 2019, 22, 1848–1871. [Google Scholar] [CrossRef]
- Teng, W.; Ding, X.; Zhang, X.; Liu, Y.; Ma, Z. Multi-fault detection and failure analysis of wind turbine gearbox using complex wavelet transform. Renew. Energy 2016, 93, 591–598. [Google Scholar] [CrossRef]
- Vamsi, I.; Sabareesh, G.R.; Penumakala, P.K. Comparison of condition monitoring techniques in assessing fault severity for a wind turbine gearbox under nonstationary loading. Mech. Syst. Signal Process. 2019, 124, 1–20. [Google Scholar] [CrossRef]
- Teng, W.; Ding, X.; Tang, S.; Xu, J.; Shi, B.; Liu, Y. Vibration Analysis for Fault Detection of Wind Turbine Drivetrains—A Comprehensive Investigation. Sensors 2021, 21, 1686. [Google Scholar] [CrossRef] [PubMed]
- Liu, L.; Liang, X.; Zuo, M.J. Vibration signal modeling of a planetary gear set with transmission path effect analysis. Measurement 2016, 85, 20–31. [Google Scholar] [CrossRef]
- Liang, X.; Zuo, M.J.; Liu, L. A windowing and mapping strategy for gear tooth fault detection of a planetary gearbox. Mechanical Systems and Signal Processing 2016, 80, 445–459. [Google Scholar] [CrossRef]
- Feng, Z.; Ma, H.; Zuo, M.J. Vibration signal models for fault diagnosis of planet bearings. Journal of Sound and Vibration 2016, 370, 372–393. [Google Scholar] [CrossRef]
- Wang, T.; Han, Q.; Chu, F.; Feng, Z. Vibration based condition monitoring and fault diagnosis of wind turbine planetary gearbox: A review. Mechanical Systems and Signal Processing 2019, 126, 662–685. [Google Scholar] [CrossRef]
- Salameh, J.P.; Cauet, S.; Etien, E.; Sakout, A.; Rambault, L. Gearbox condition monitoring in wind turbines: A review. Mechanical Systems and Signal Processing 2018, 111, 251–264. [Google Scholar] [CrossRef]
- Zhang, M.; Wang, K.; Wei, D.; Zuo, M.J. Amplitudes of characteristic frequencies for fault diagnosis of planetary gearbox. Journal of Sound and Vibration 2018, 432, 119–132. [Google Scholar] [CrossRef]
- Global Energy Research Council, Global Wind Report, 2009. [Online] http://www.gwec.net/fileadmin/documents/Publications/Global_Wind_2007_report/GWEC_Global_Wind_2009_Report_Lowres_15th.520Apr./pdf.
- Verbruggen, T.W. Condition Monitoring: Theory and Practice. In Proceedings of the Wind Turbine Condition Monitoring Workshop, Broomfield, CO, 8–9 October2009. [Google Scholar]
- Sheng, S.; Veers, P. Wind Turbine Drivetrain Condition Monitoring – An Overview. In Proceedings of the Mechanical Failures Prevention Group: Applied Systems Health Management Conference, Virginia Beach, Virginia, 10–12 May 2011. [Google Scholar]
- Germanischer Lloyd, Guideline for the Certification of Condition Monitoring Systems for Wind Turbines, 2007, Hamburg, Germany.
- Gellermann, T.; Walter, G. Requirements for Condition Monitoring Systems for Wind Turbines, 2003, AZT Report no.03.01.068.
- Wind Stats Newsletter, 2003–2009, vol.16, no.1 to vol.22, no.4, Haymarket Business, Media, London, UK.
- Veers, P. Databases for Use in Wind Plant Reliability Improvement, 2009. In Proceedings of the Wind Turbine Condition Monitoring Workshop, Broomfield, CO, 8–9 October 2009. [Google Scholar]
- T. W. Verbruggen, Wind Turbine Operation and Maintenance Based on Condition Monitoring, 2003, Energy Research Center of the Netherlands, Petten, The Netherlands. [Online] www.ecn.nl/publicaties/PdfFetch.aspx?nr=ECN-C-- 03-047.
- Y.Dodge, The Concise Encyclopedia of Statistics, Springer 2008.
- Z. Nazari, D. Z. Nazari, D. Kang, and H. Endo, Density Based Support Vector Machines, The 29th International Technical Conference on Circuits/Systems, Computers and Communications (ITC-CSCC), pp.1-3, 2014.
- El Moutaouakil, K.; El Ouissari, A.; Olaru, A.; Palade, V.; Ciorei, M. OPT-RNN-DBSVM: OPTimal Recurrent Neural Network and Density-Based Support Vector Machine. Mathematics 2023, 11, 3555. [Google Scholar] [CrossRef]
- Variance-covariance matrix- GeeksforGeeks.html.
Figure 1.
The position of the used sensors for the monitoring process.
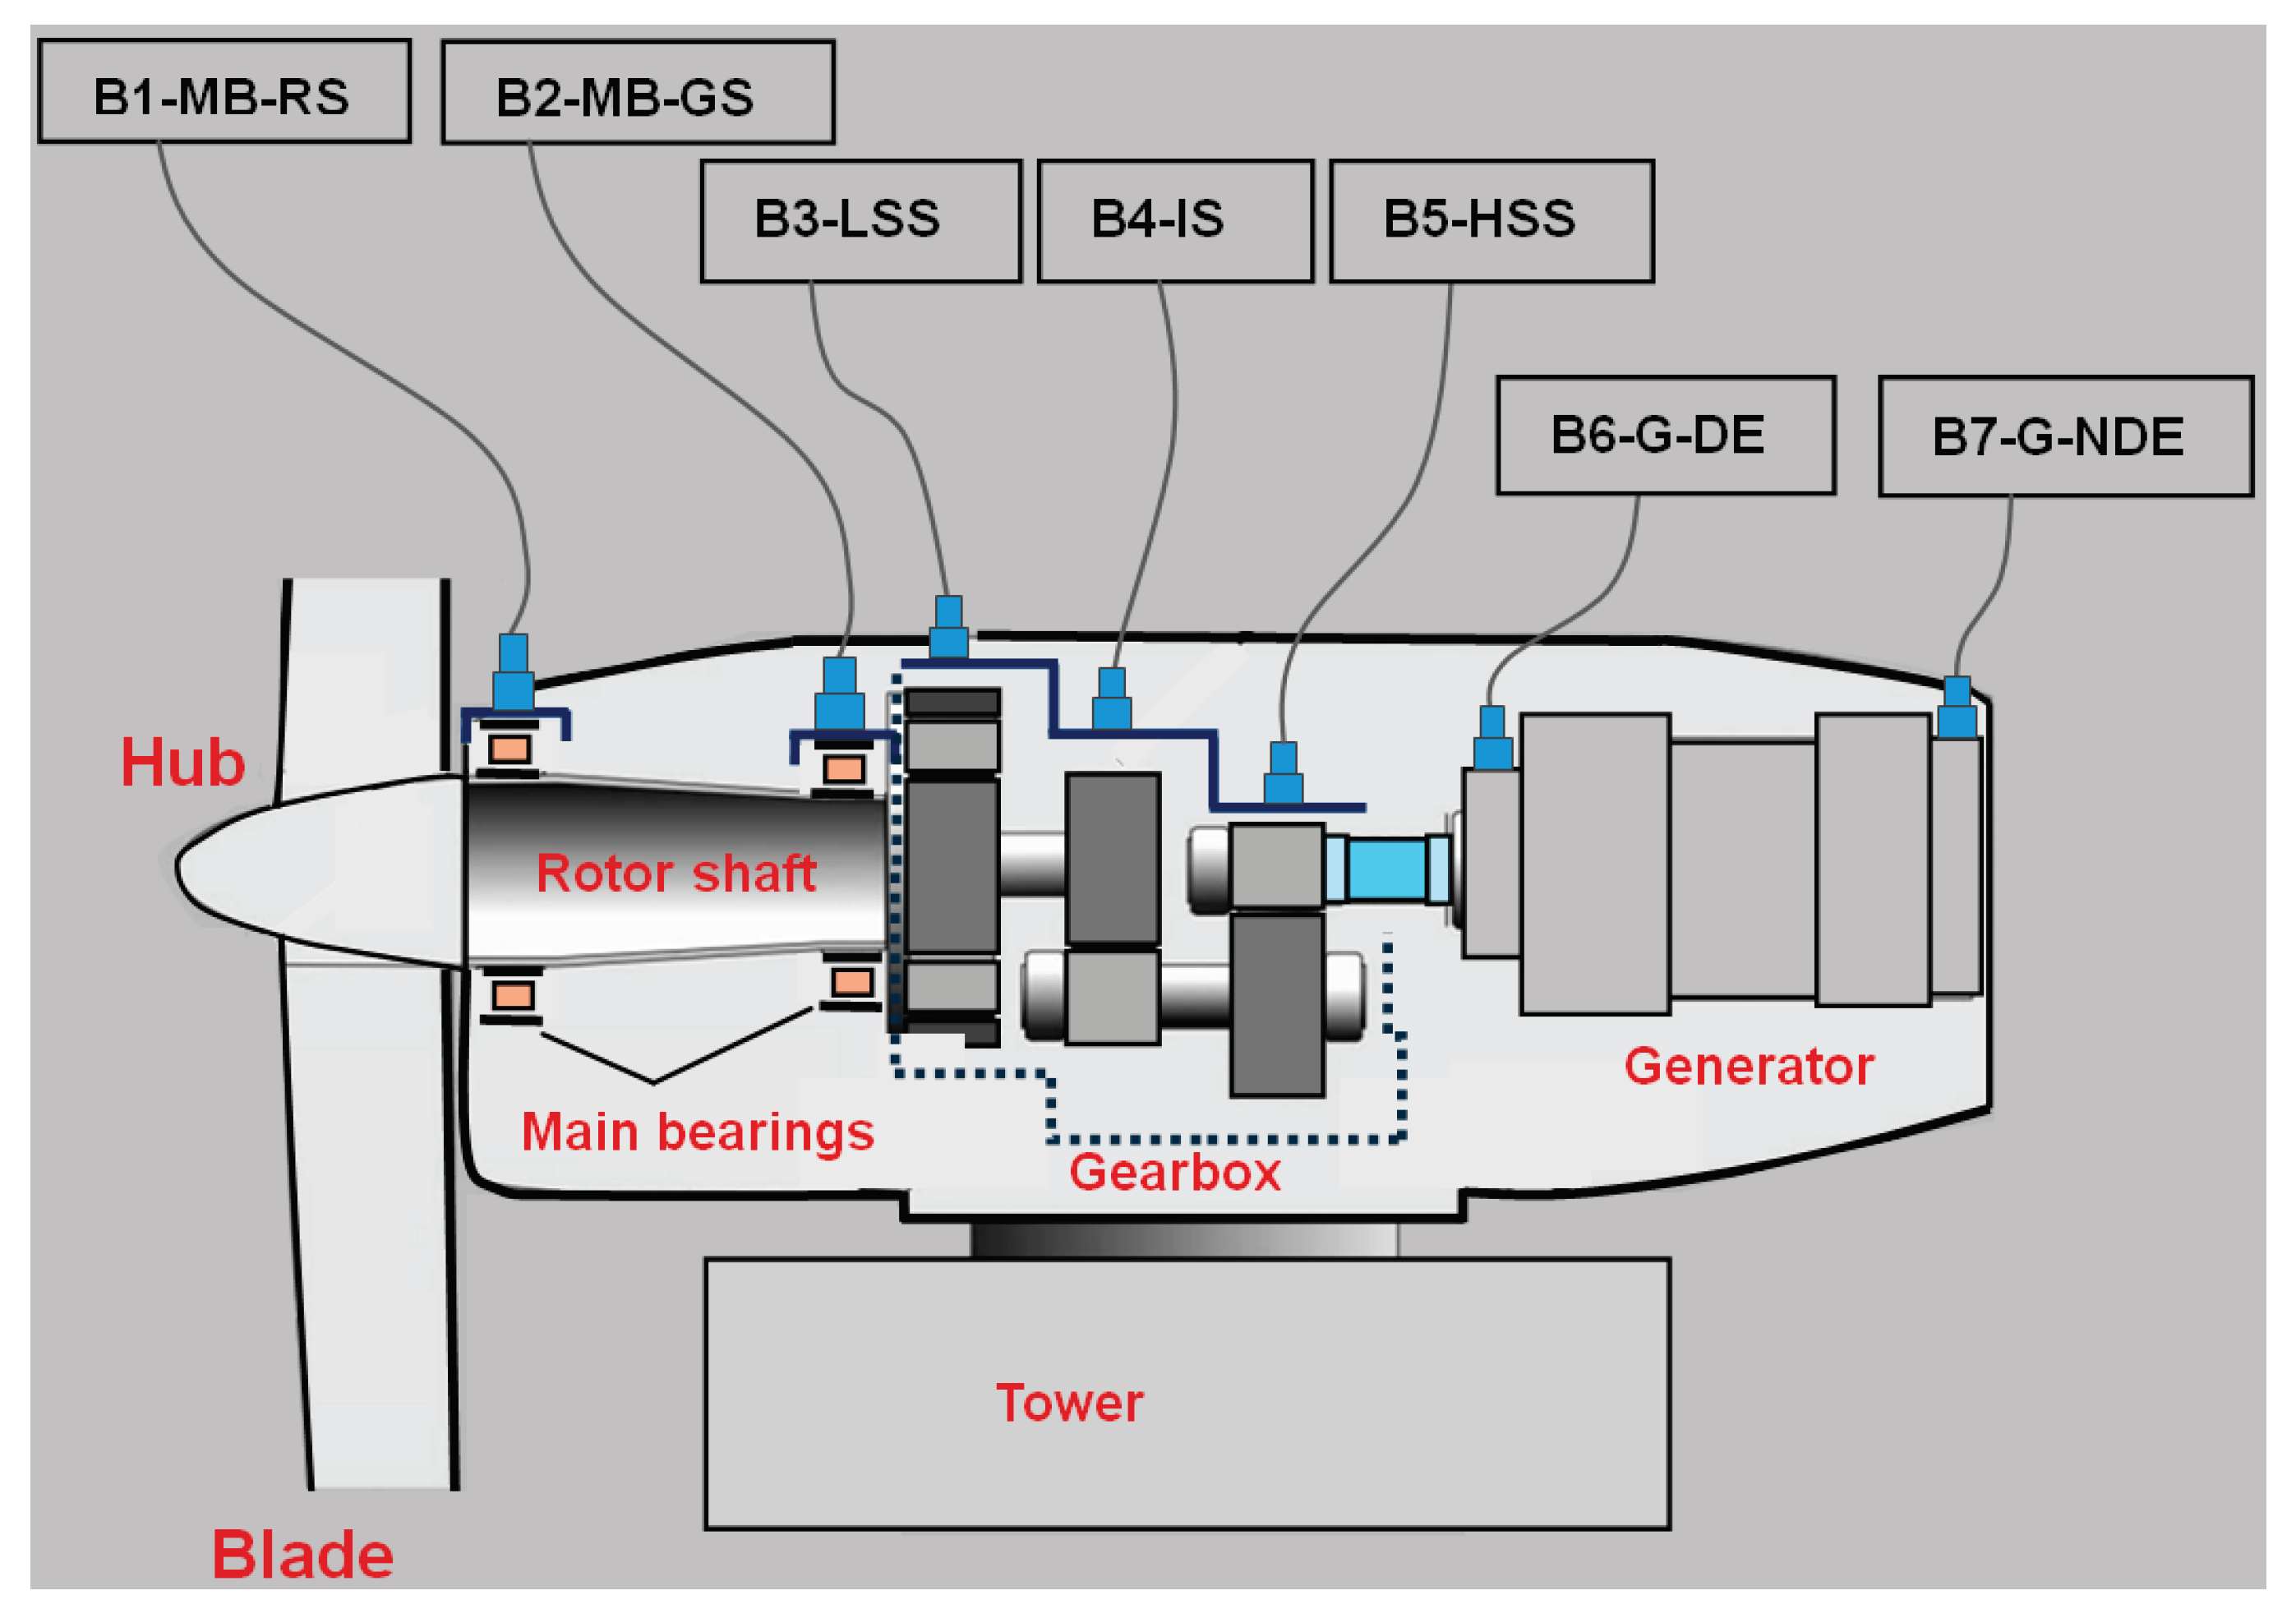
Figure 2.
Synopsis of data acquisition and signal processing.
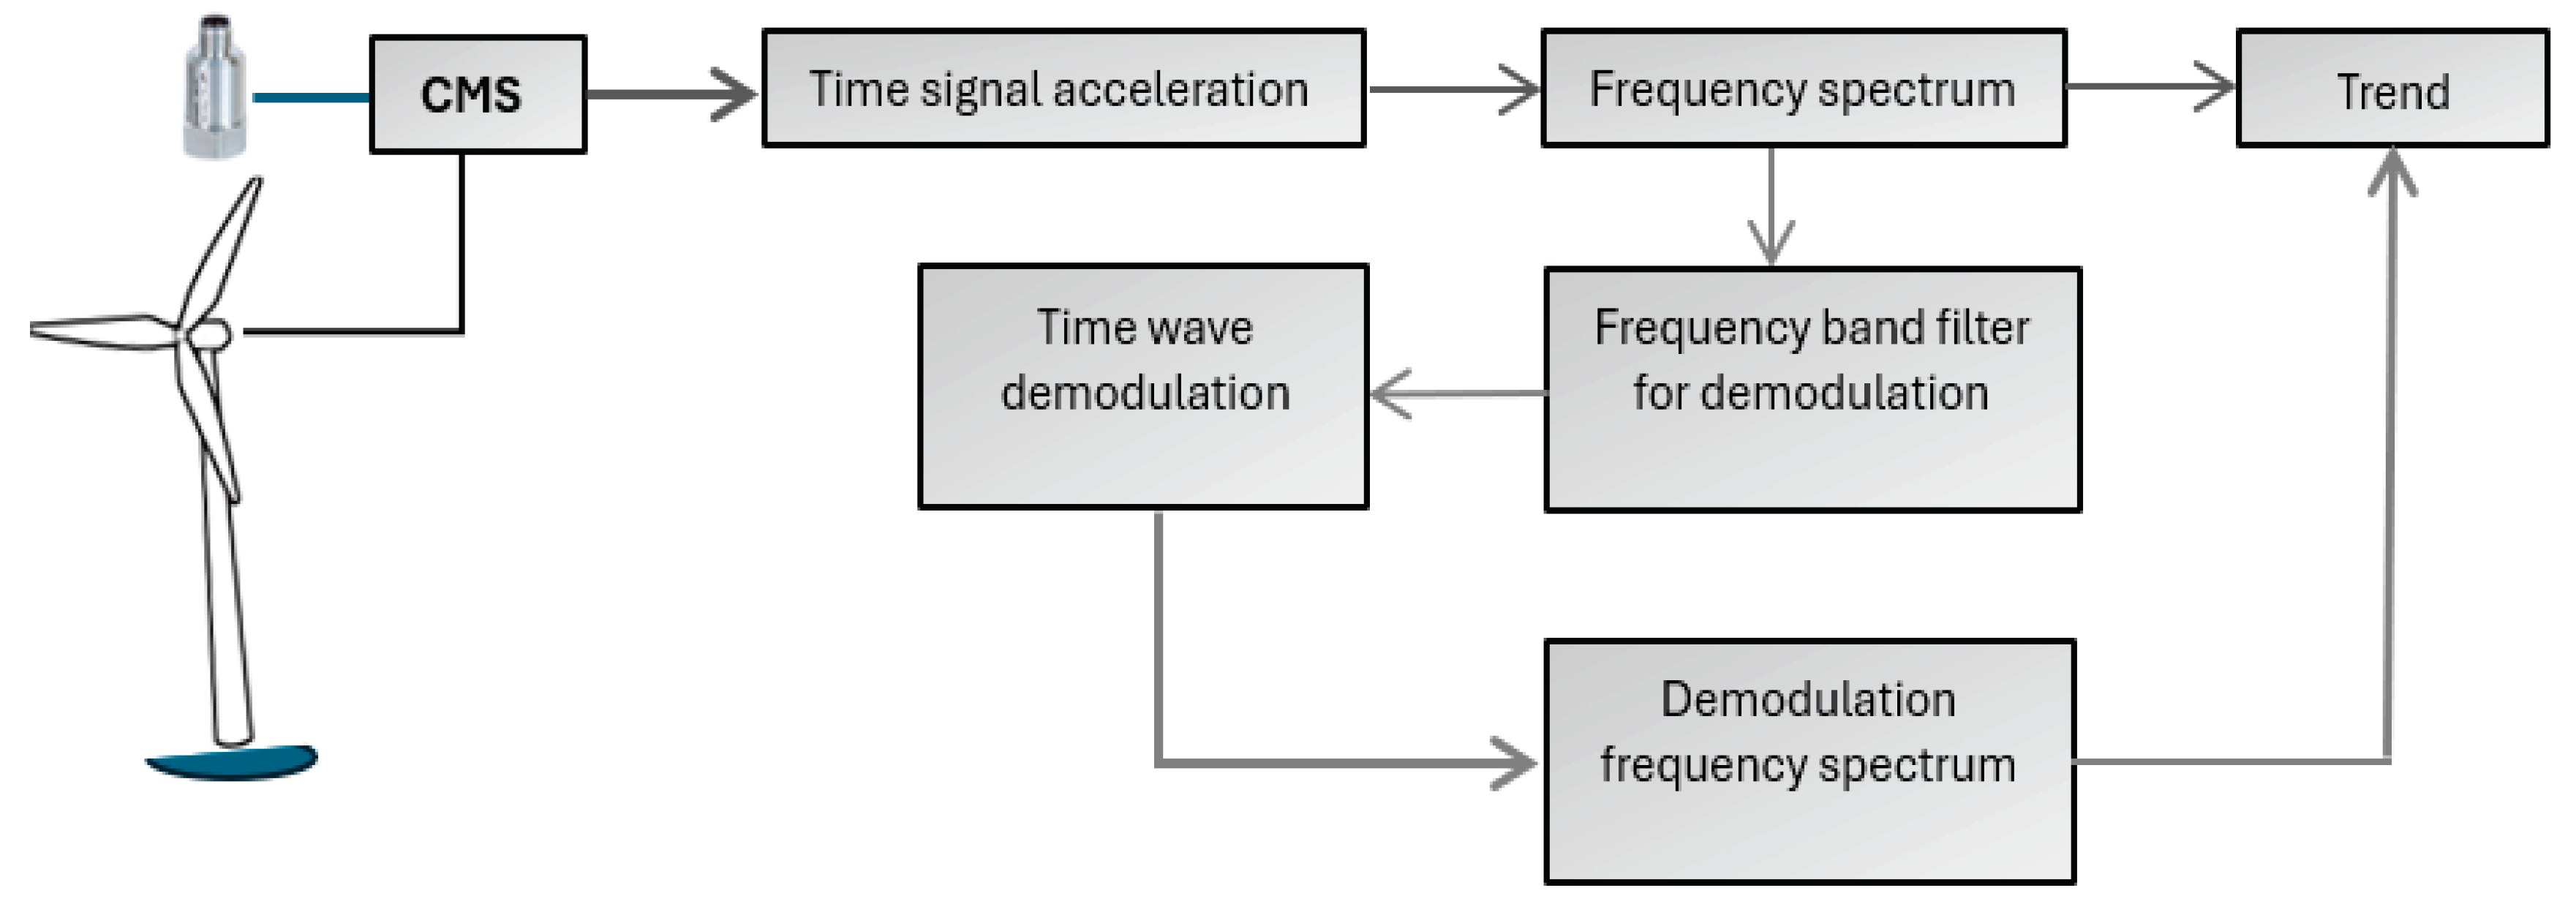
Figure 3.
Example of CMS data presentation.
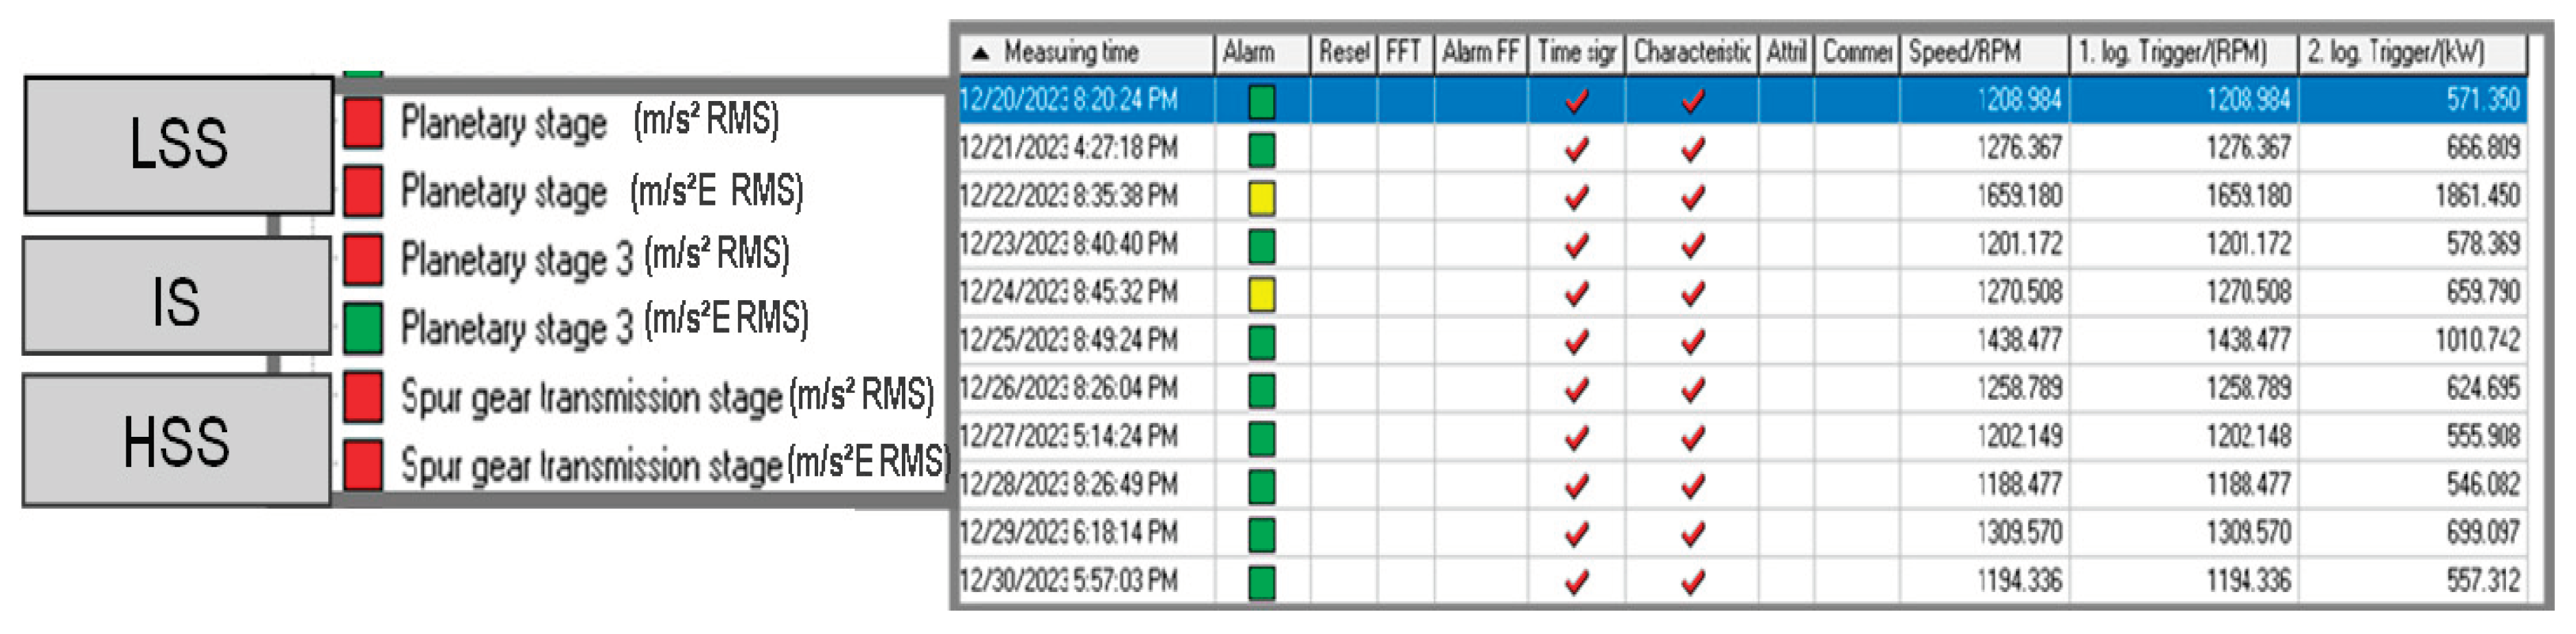
Figure 4.
Signal processing and defect detection from CMS.
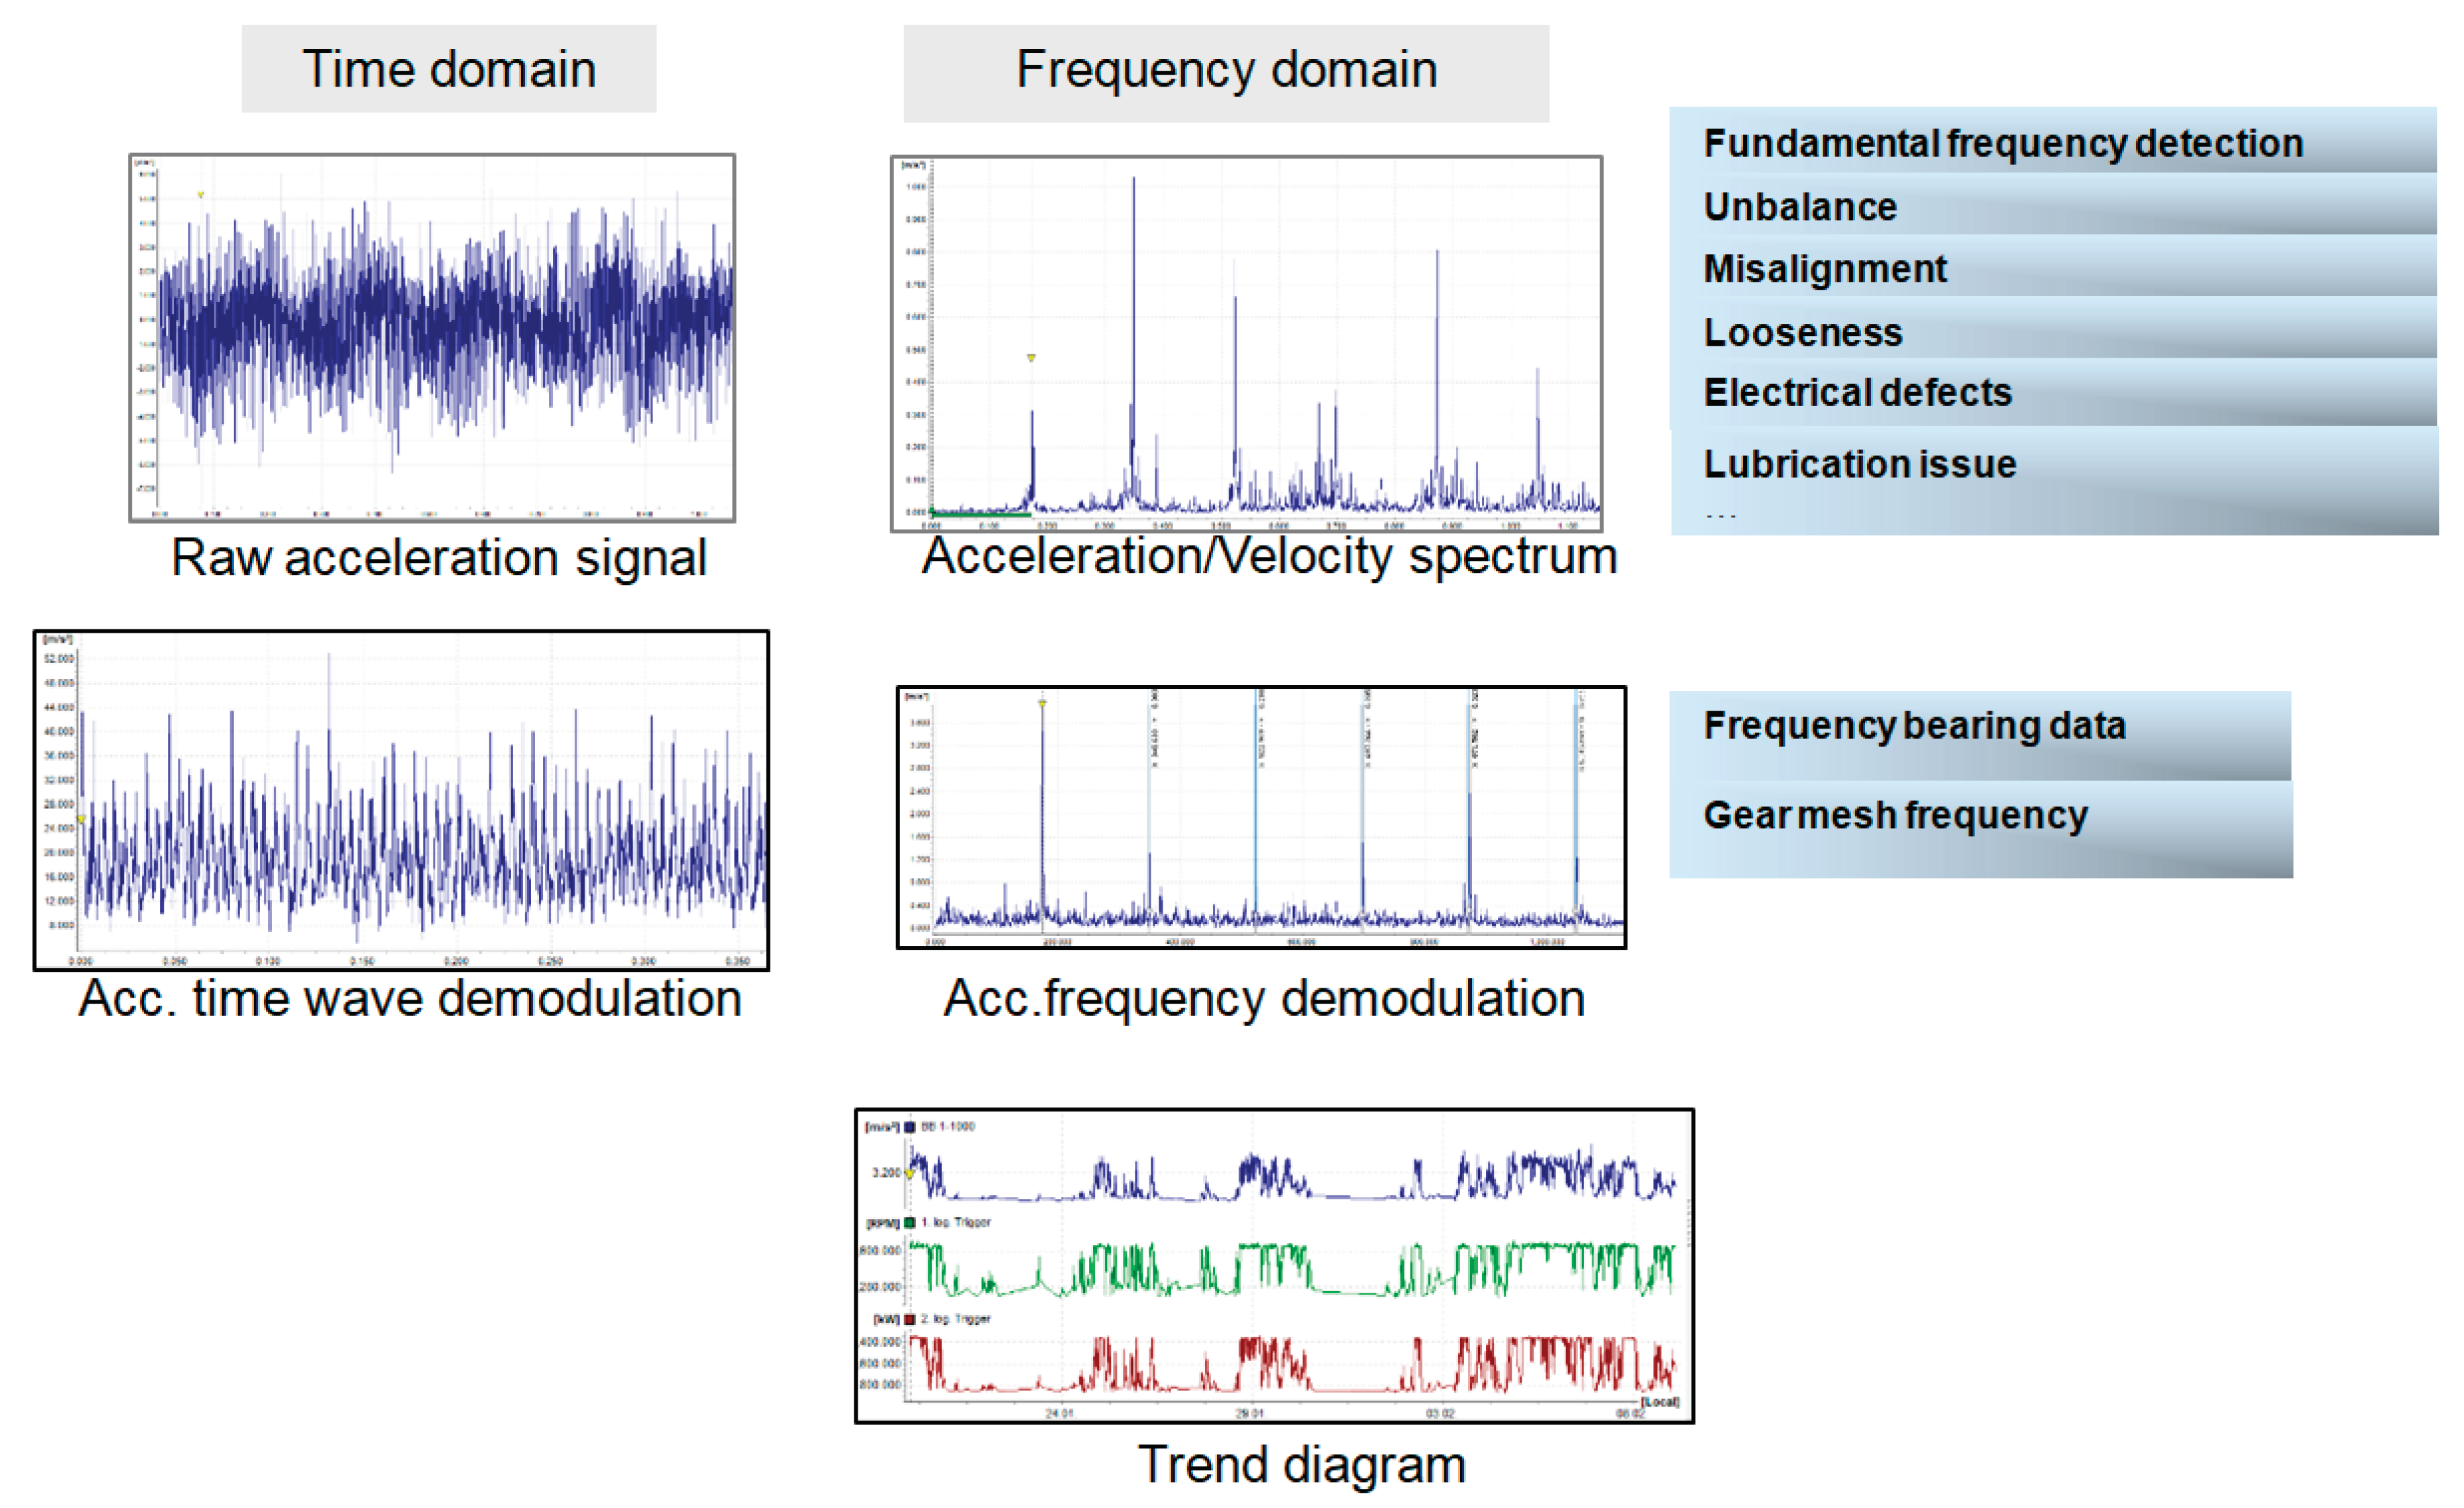
Figure 5.
Part of the block schema of the LabView virtual instrument to determine the FO5 order.
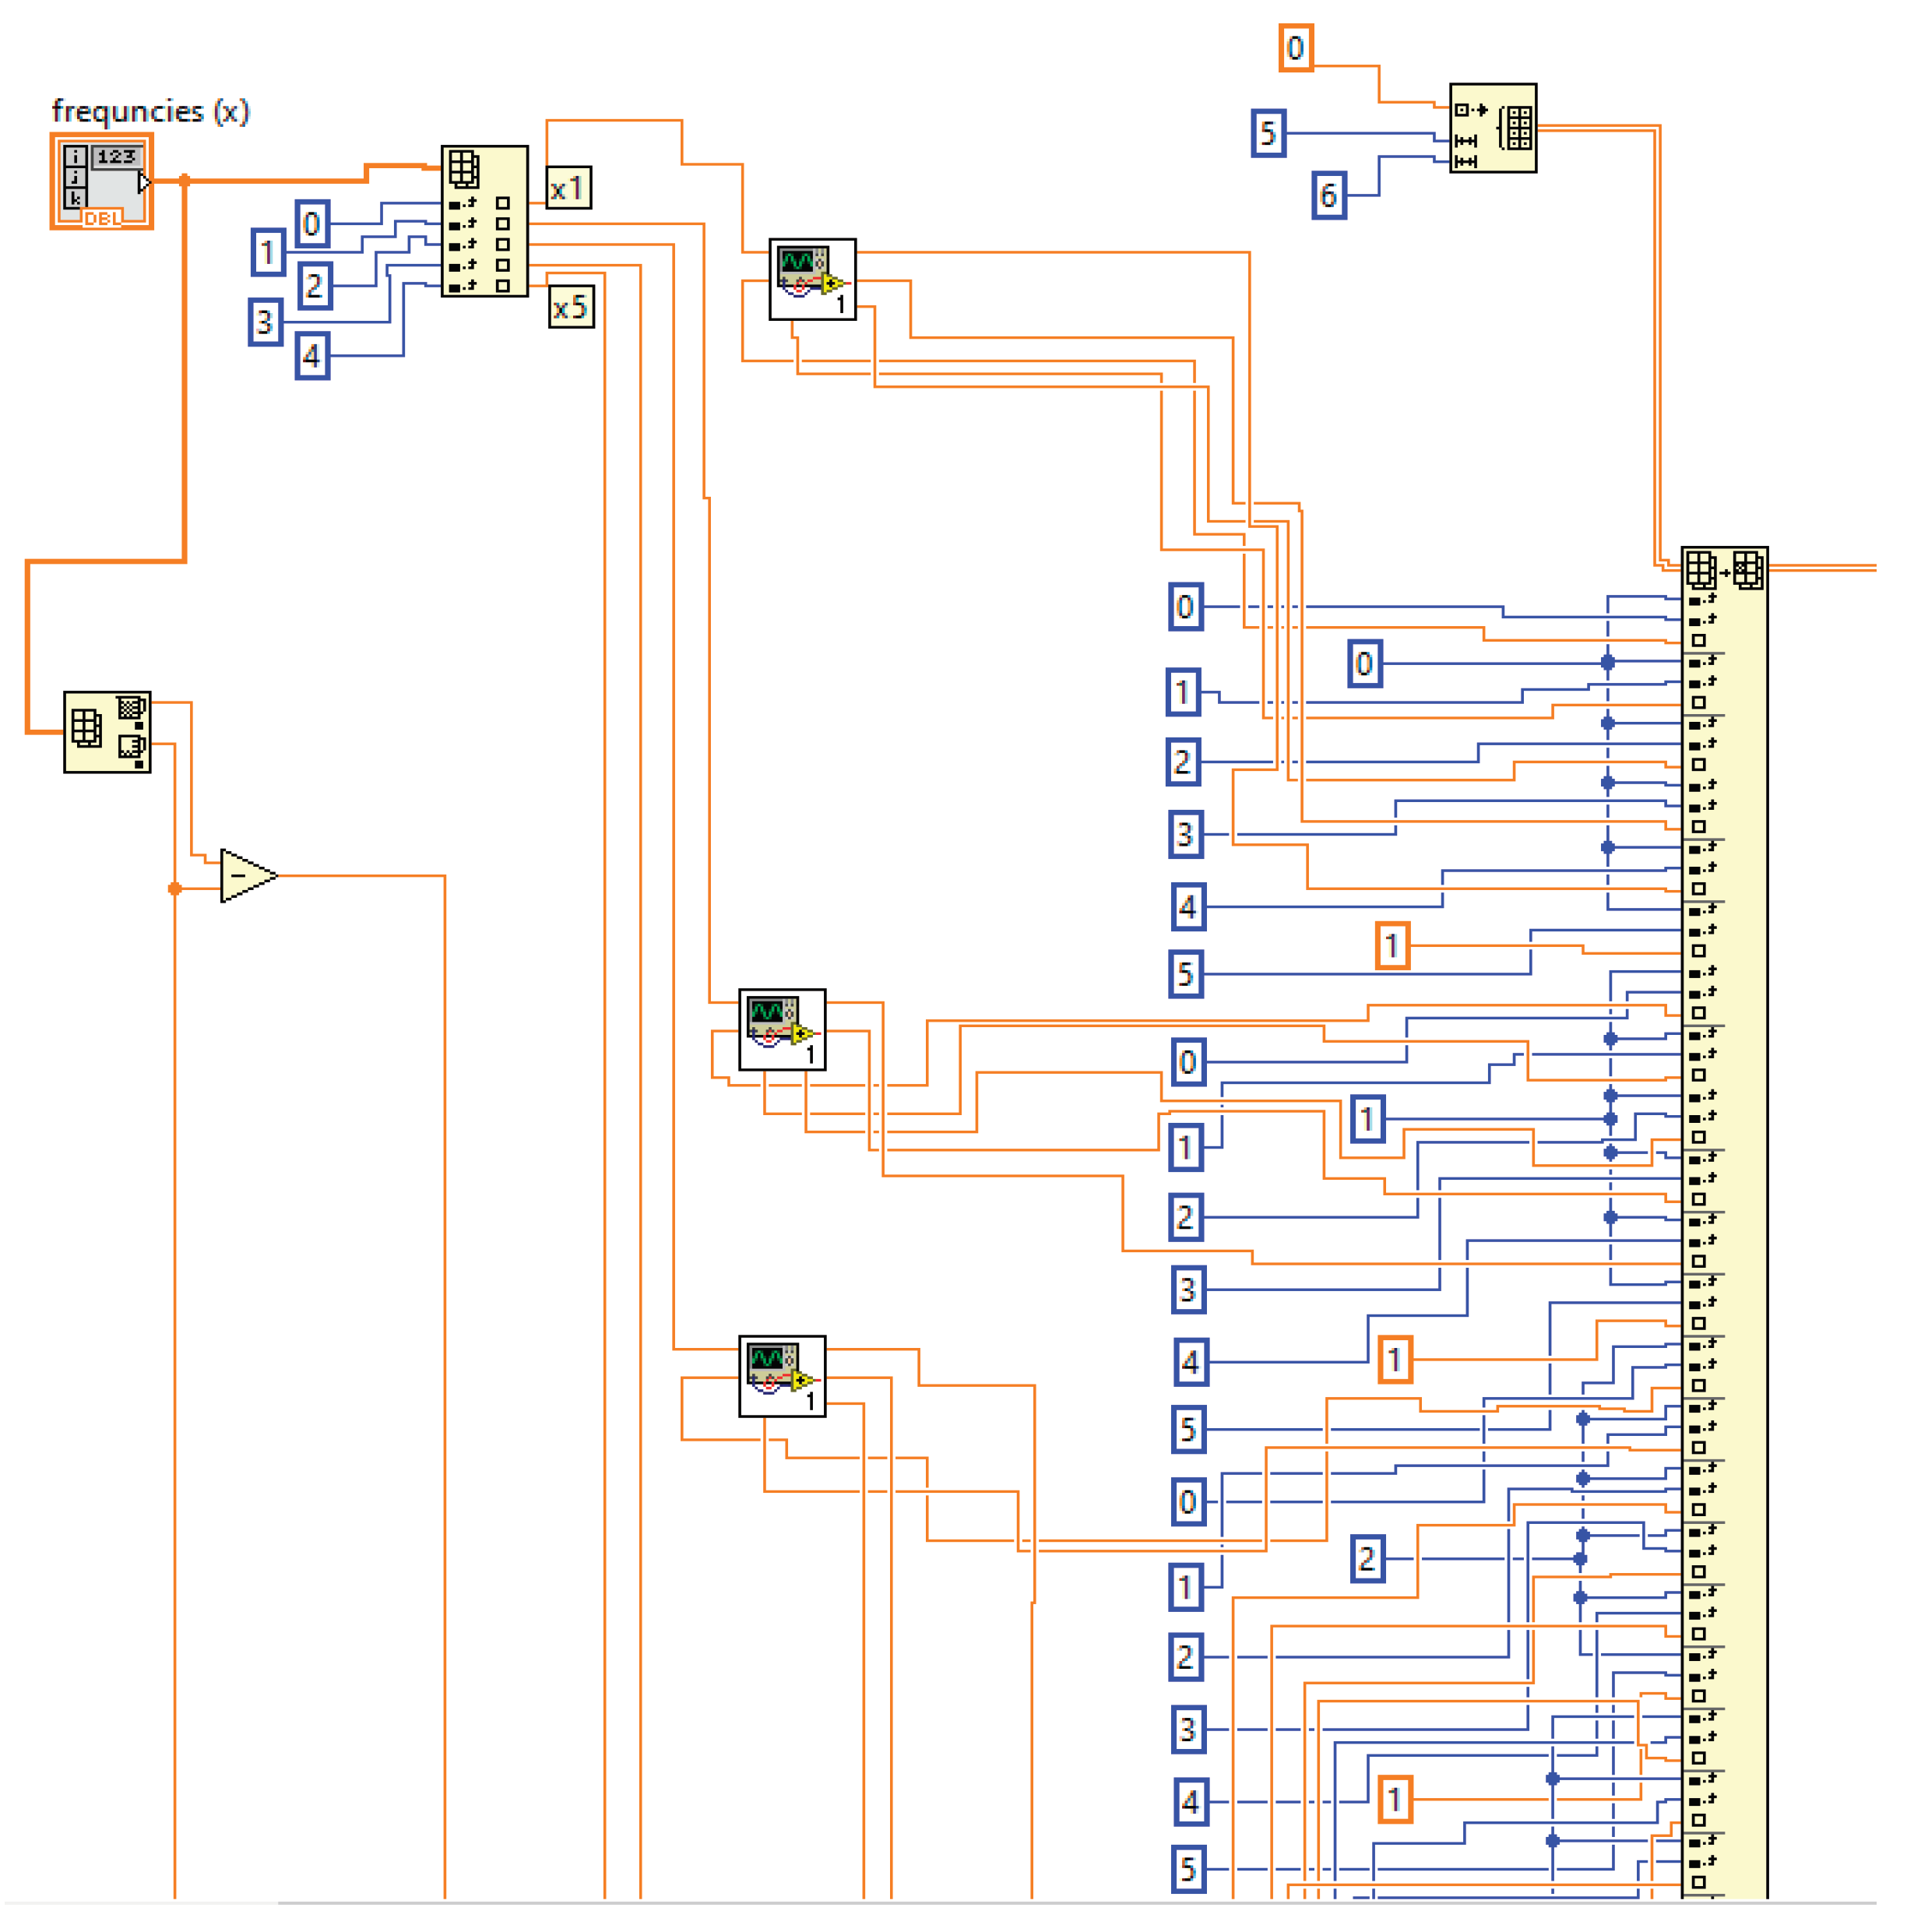
Figure 6.
Part of the block diagram represents the FO (polynomial function of the 5-degree order) characteristic.
Figure 6.
Part of the block diagram represents the FO (polynomial function of the 5-degree order) characteristic.
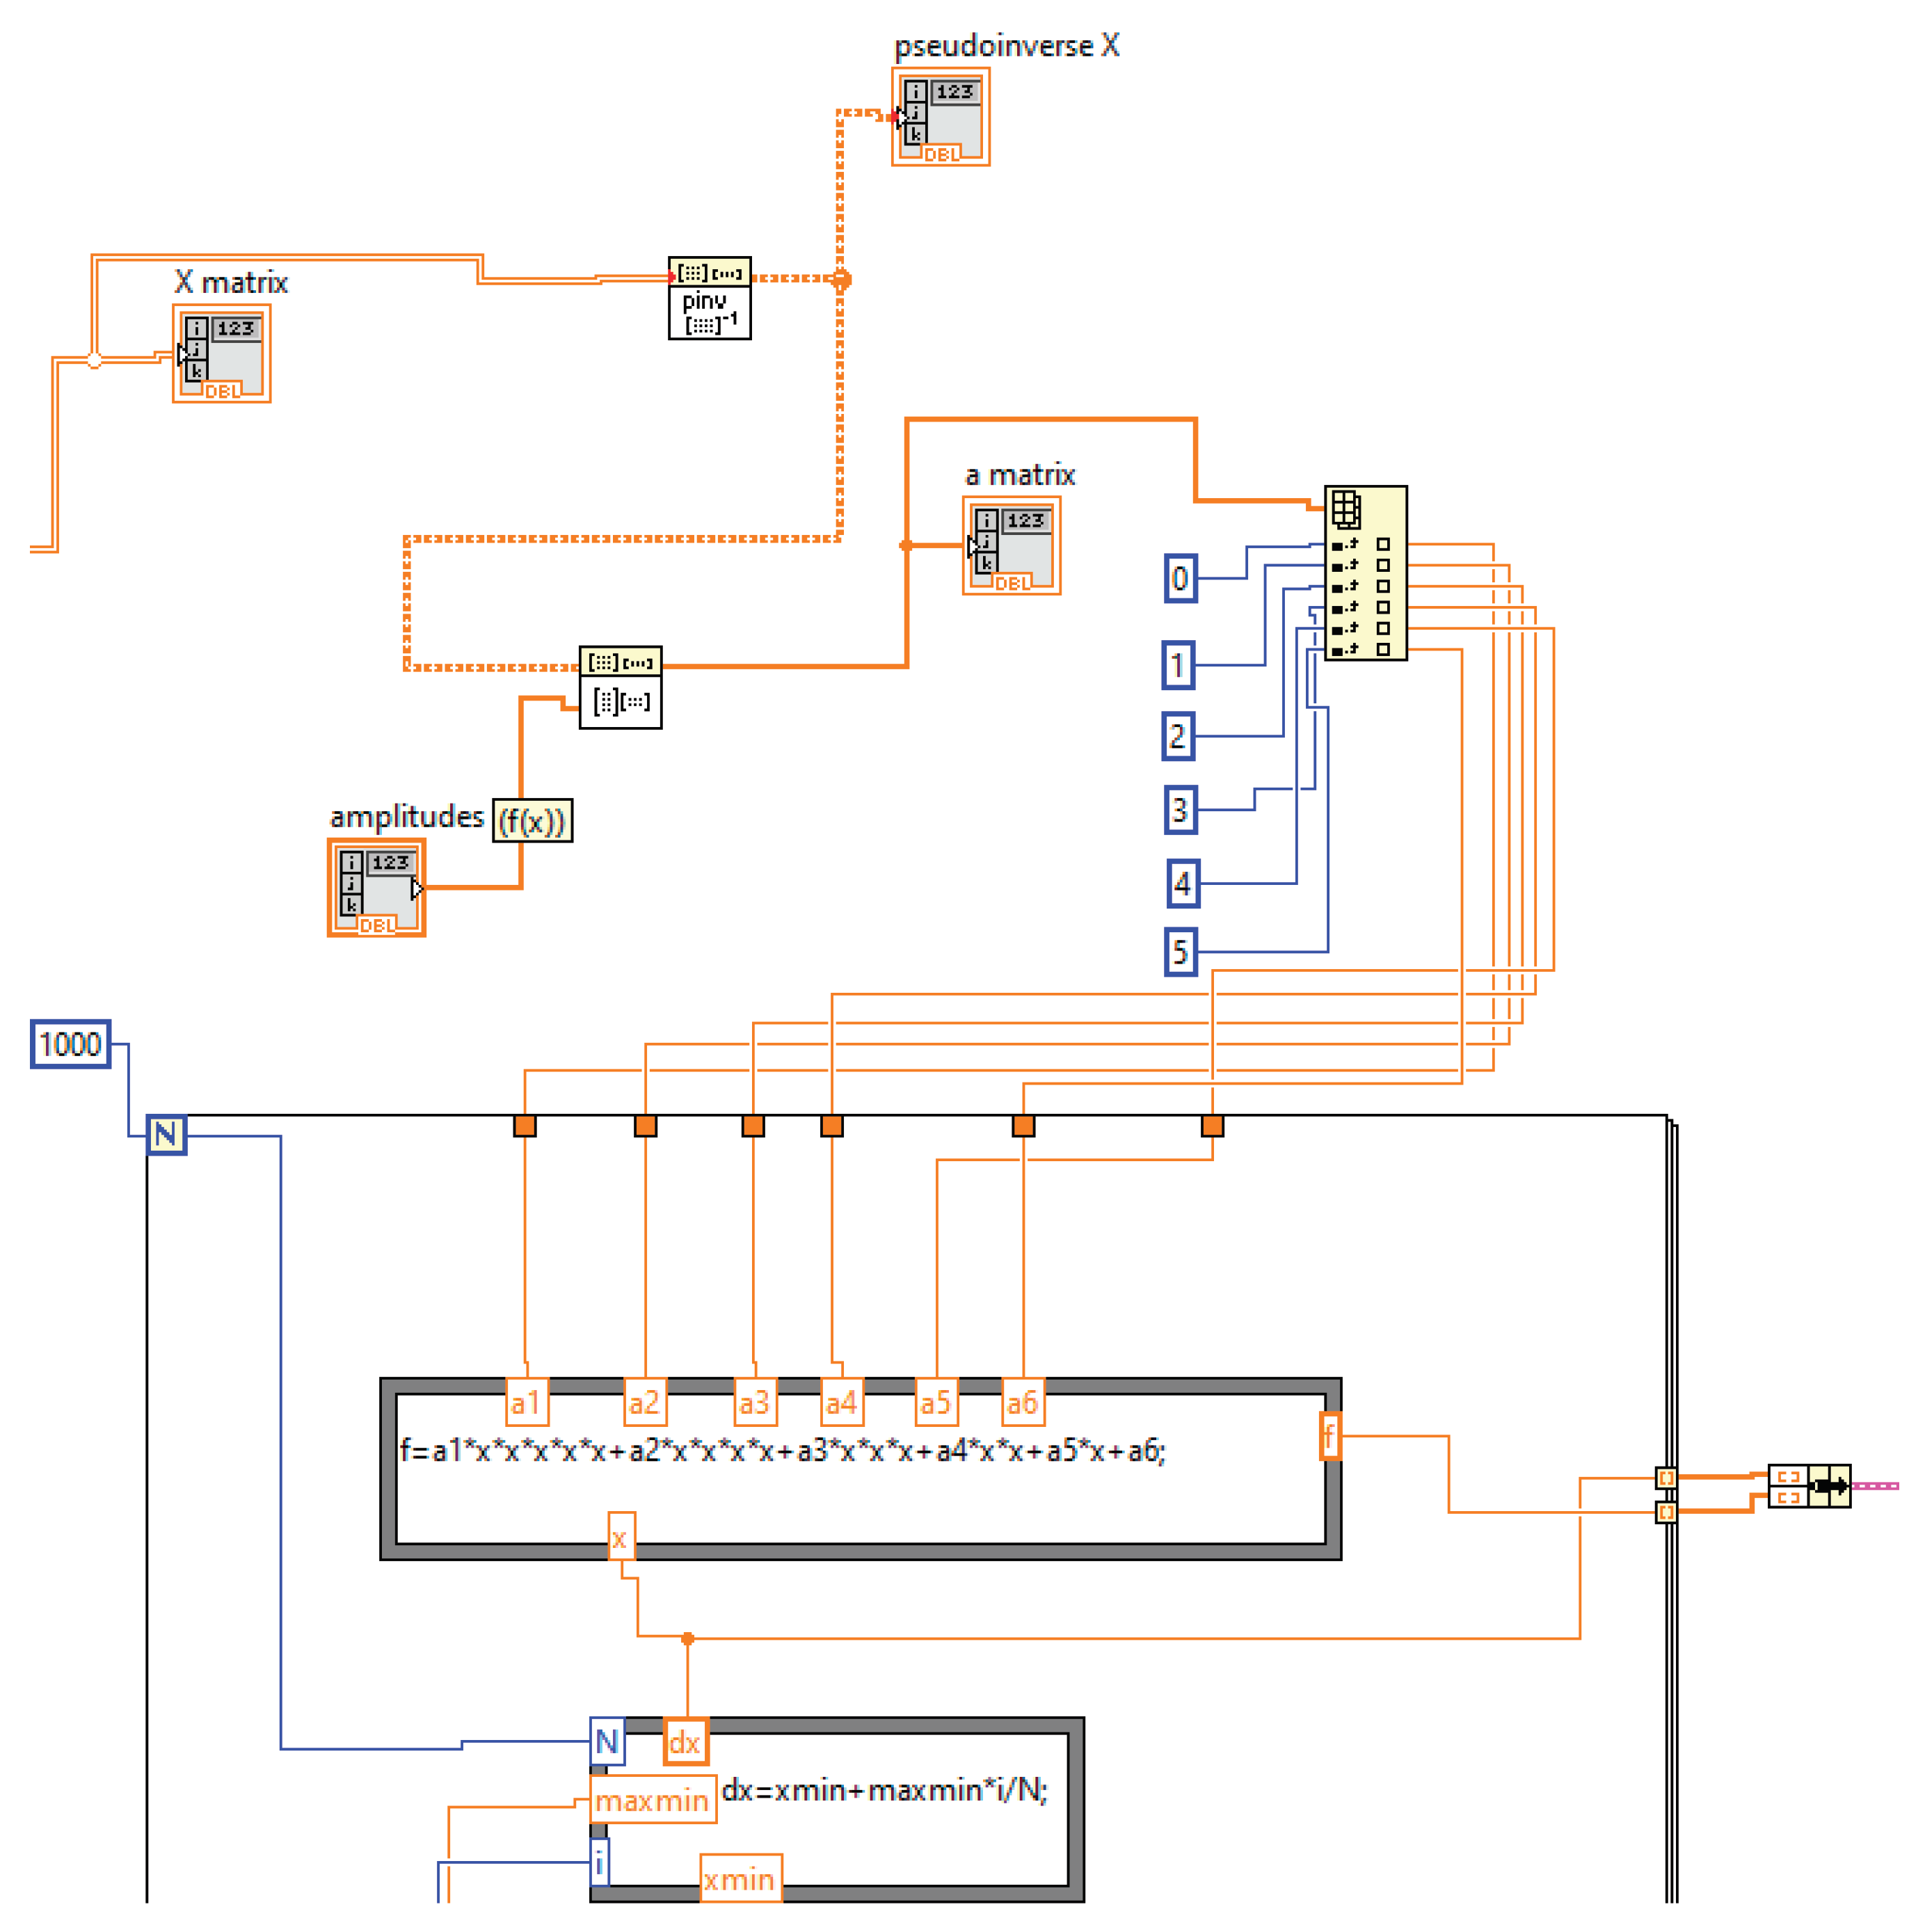
Figure 7.
Front panel with the results of the optimization function FO for known points from the BDSVM.
Figure 7.
Front panel with the results of the optimization function FO for known points from the BDSVM.
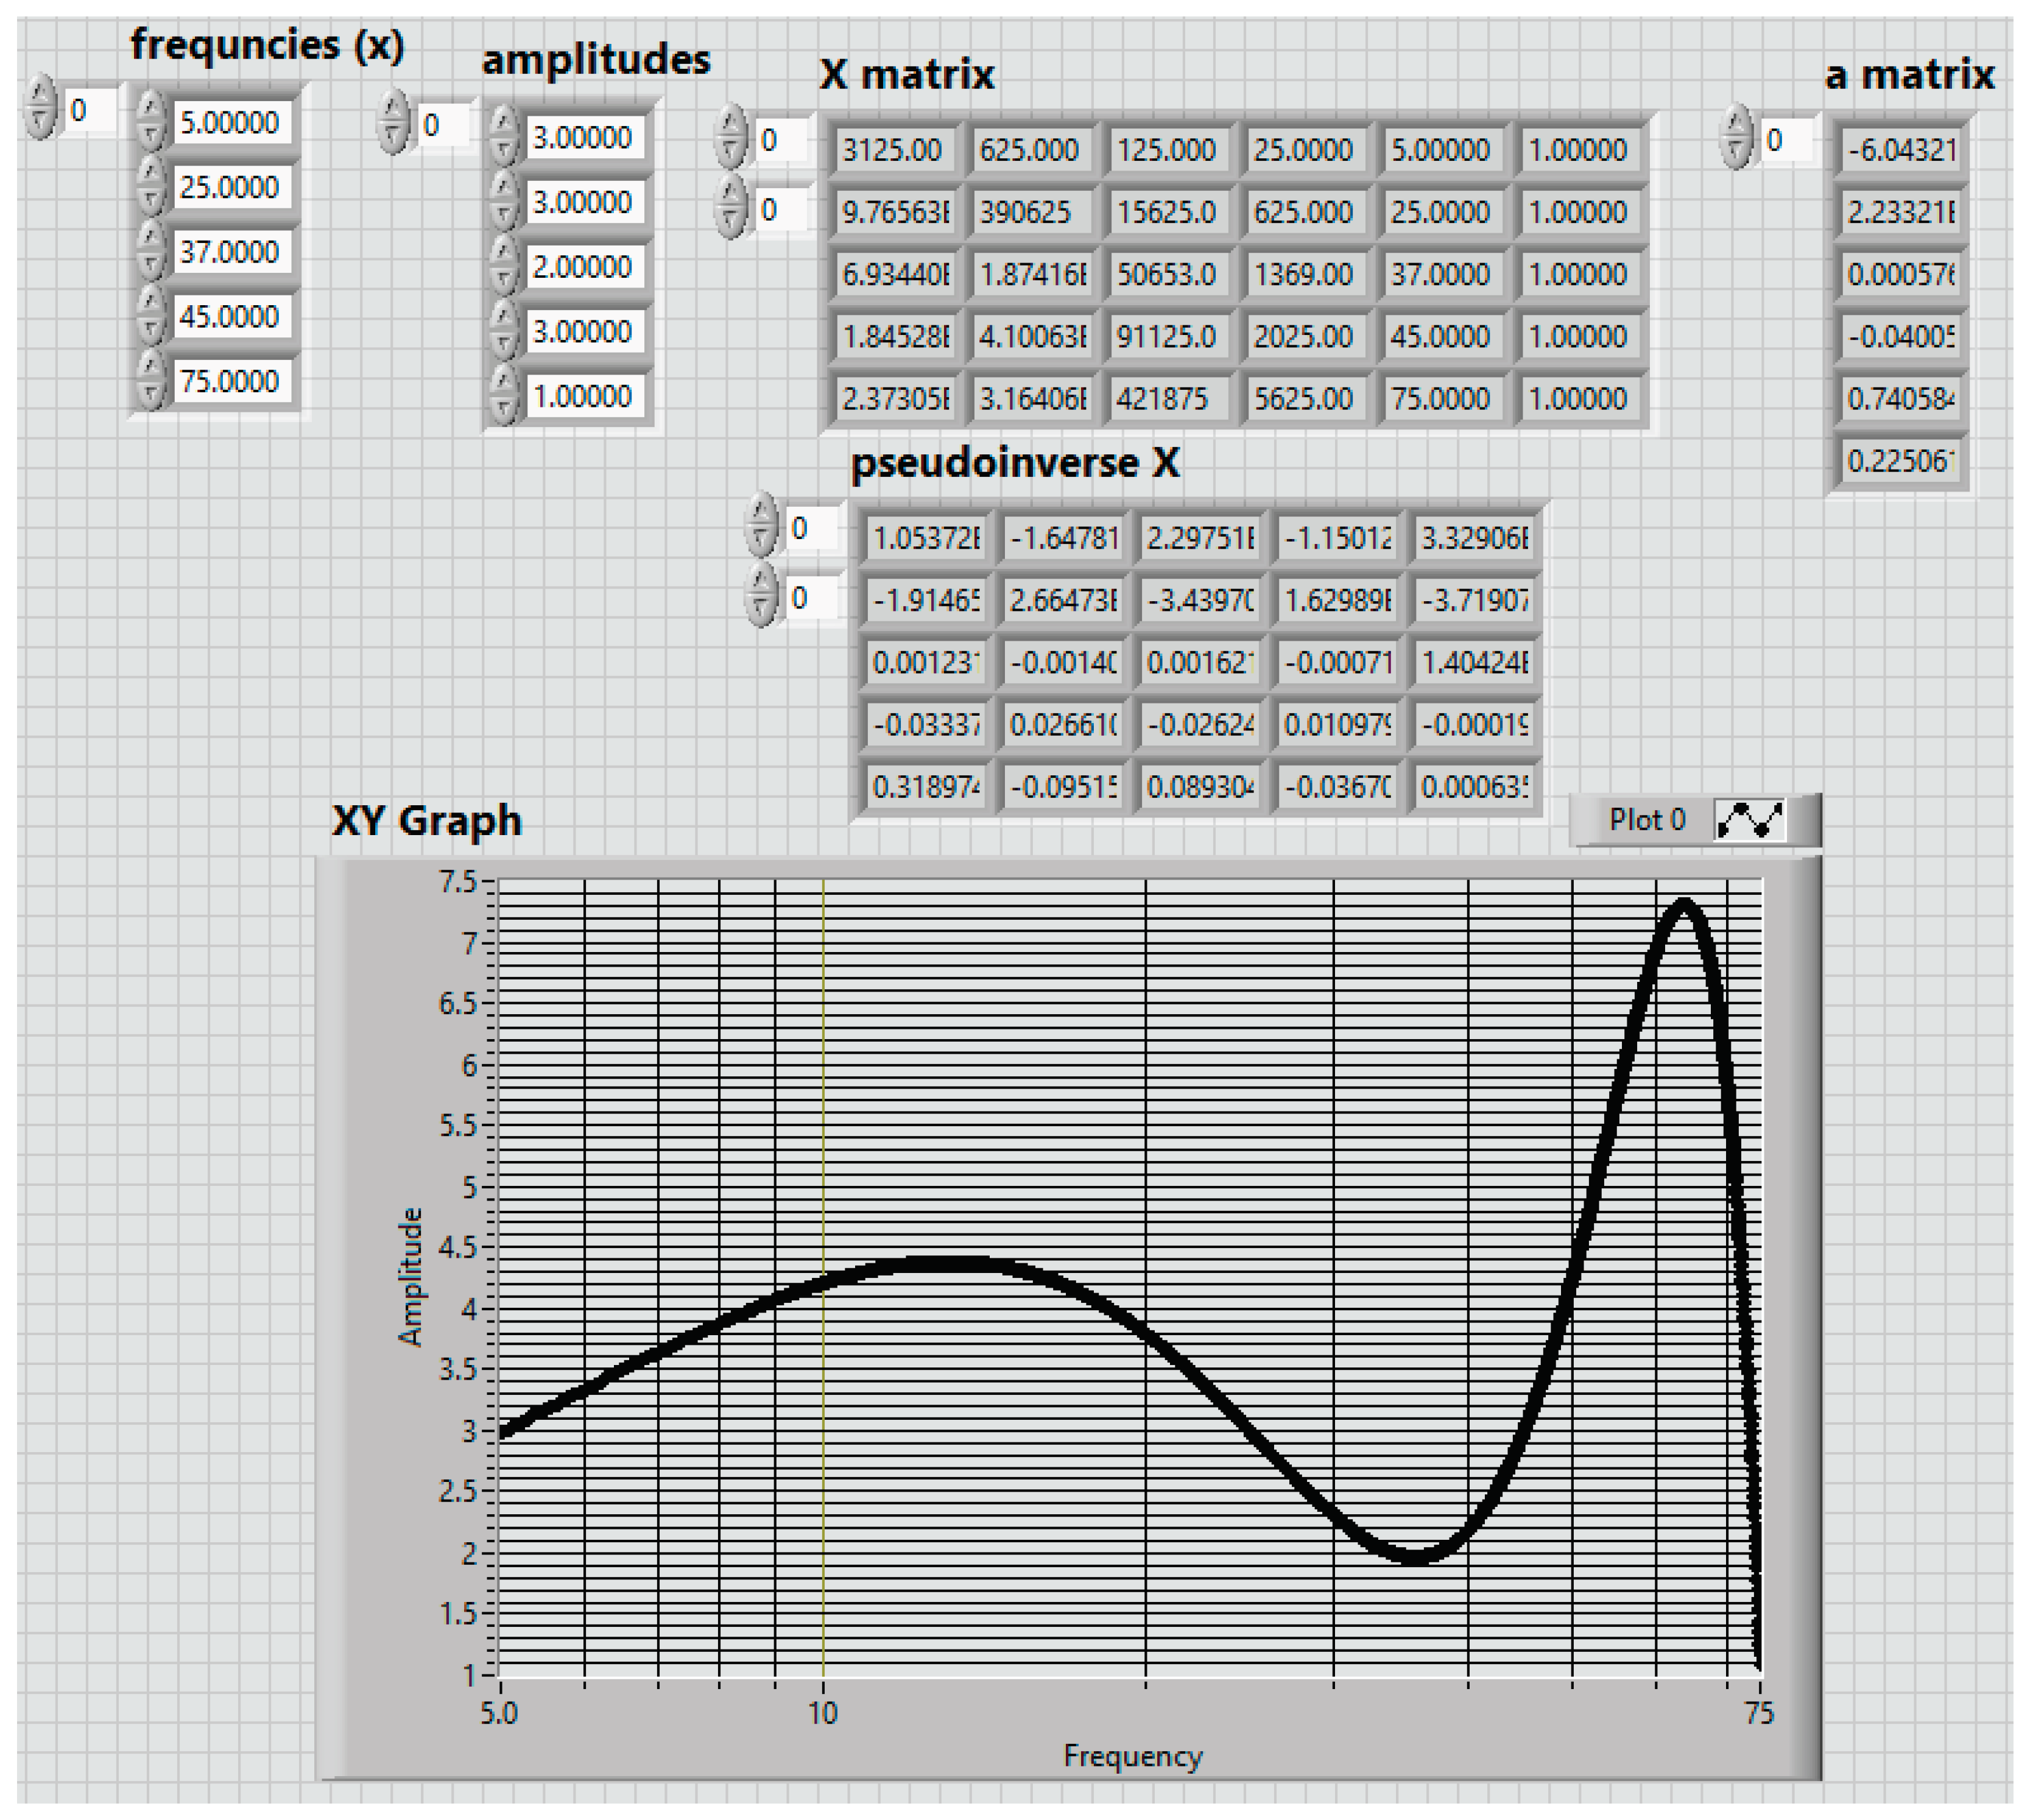
Figure 8.
The repartition of acquisition data and establish the boundary values of group 1, meaningful points of BDSVM, for similar dynamic conditions of speed and power.
Figure 8.
The repartition of acquisition data and establish the boundary values of group 1, meaningful points of BDSVM, for similar dynamic conditions of speed and power.
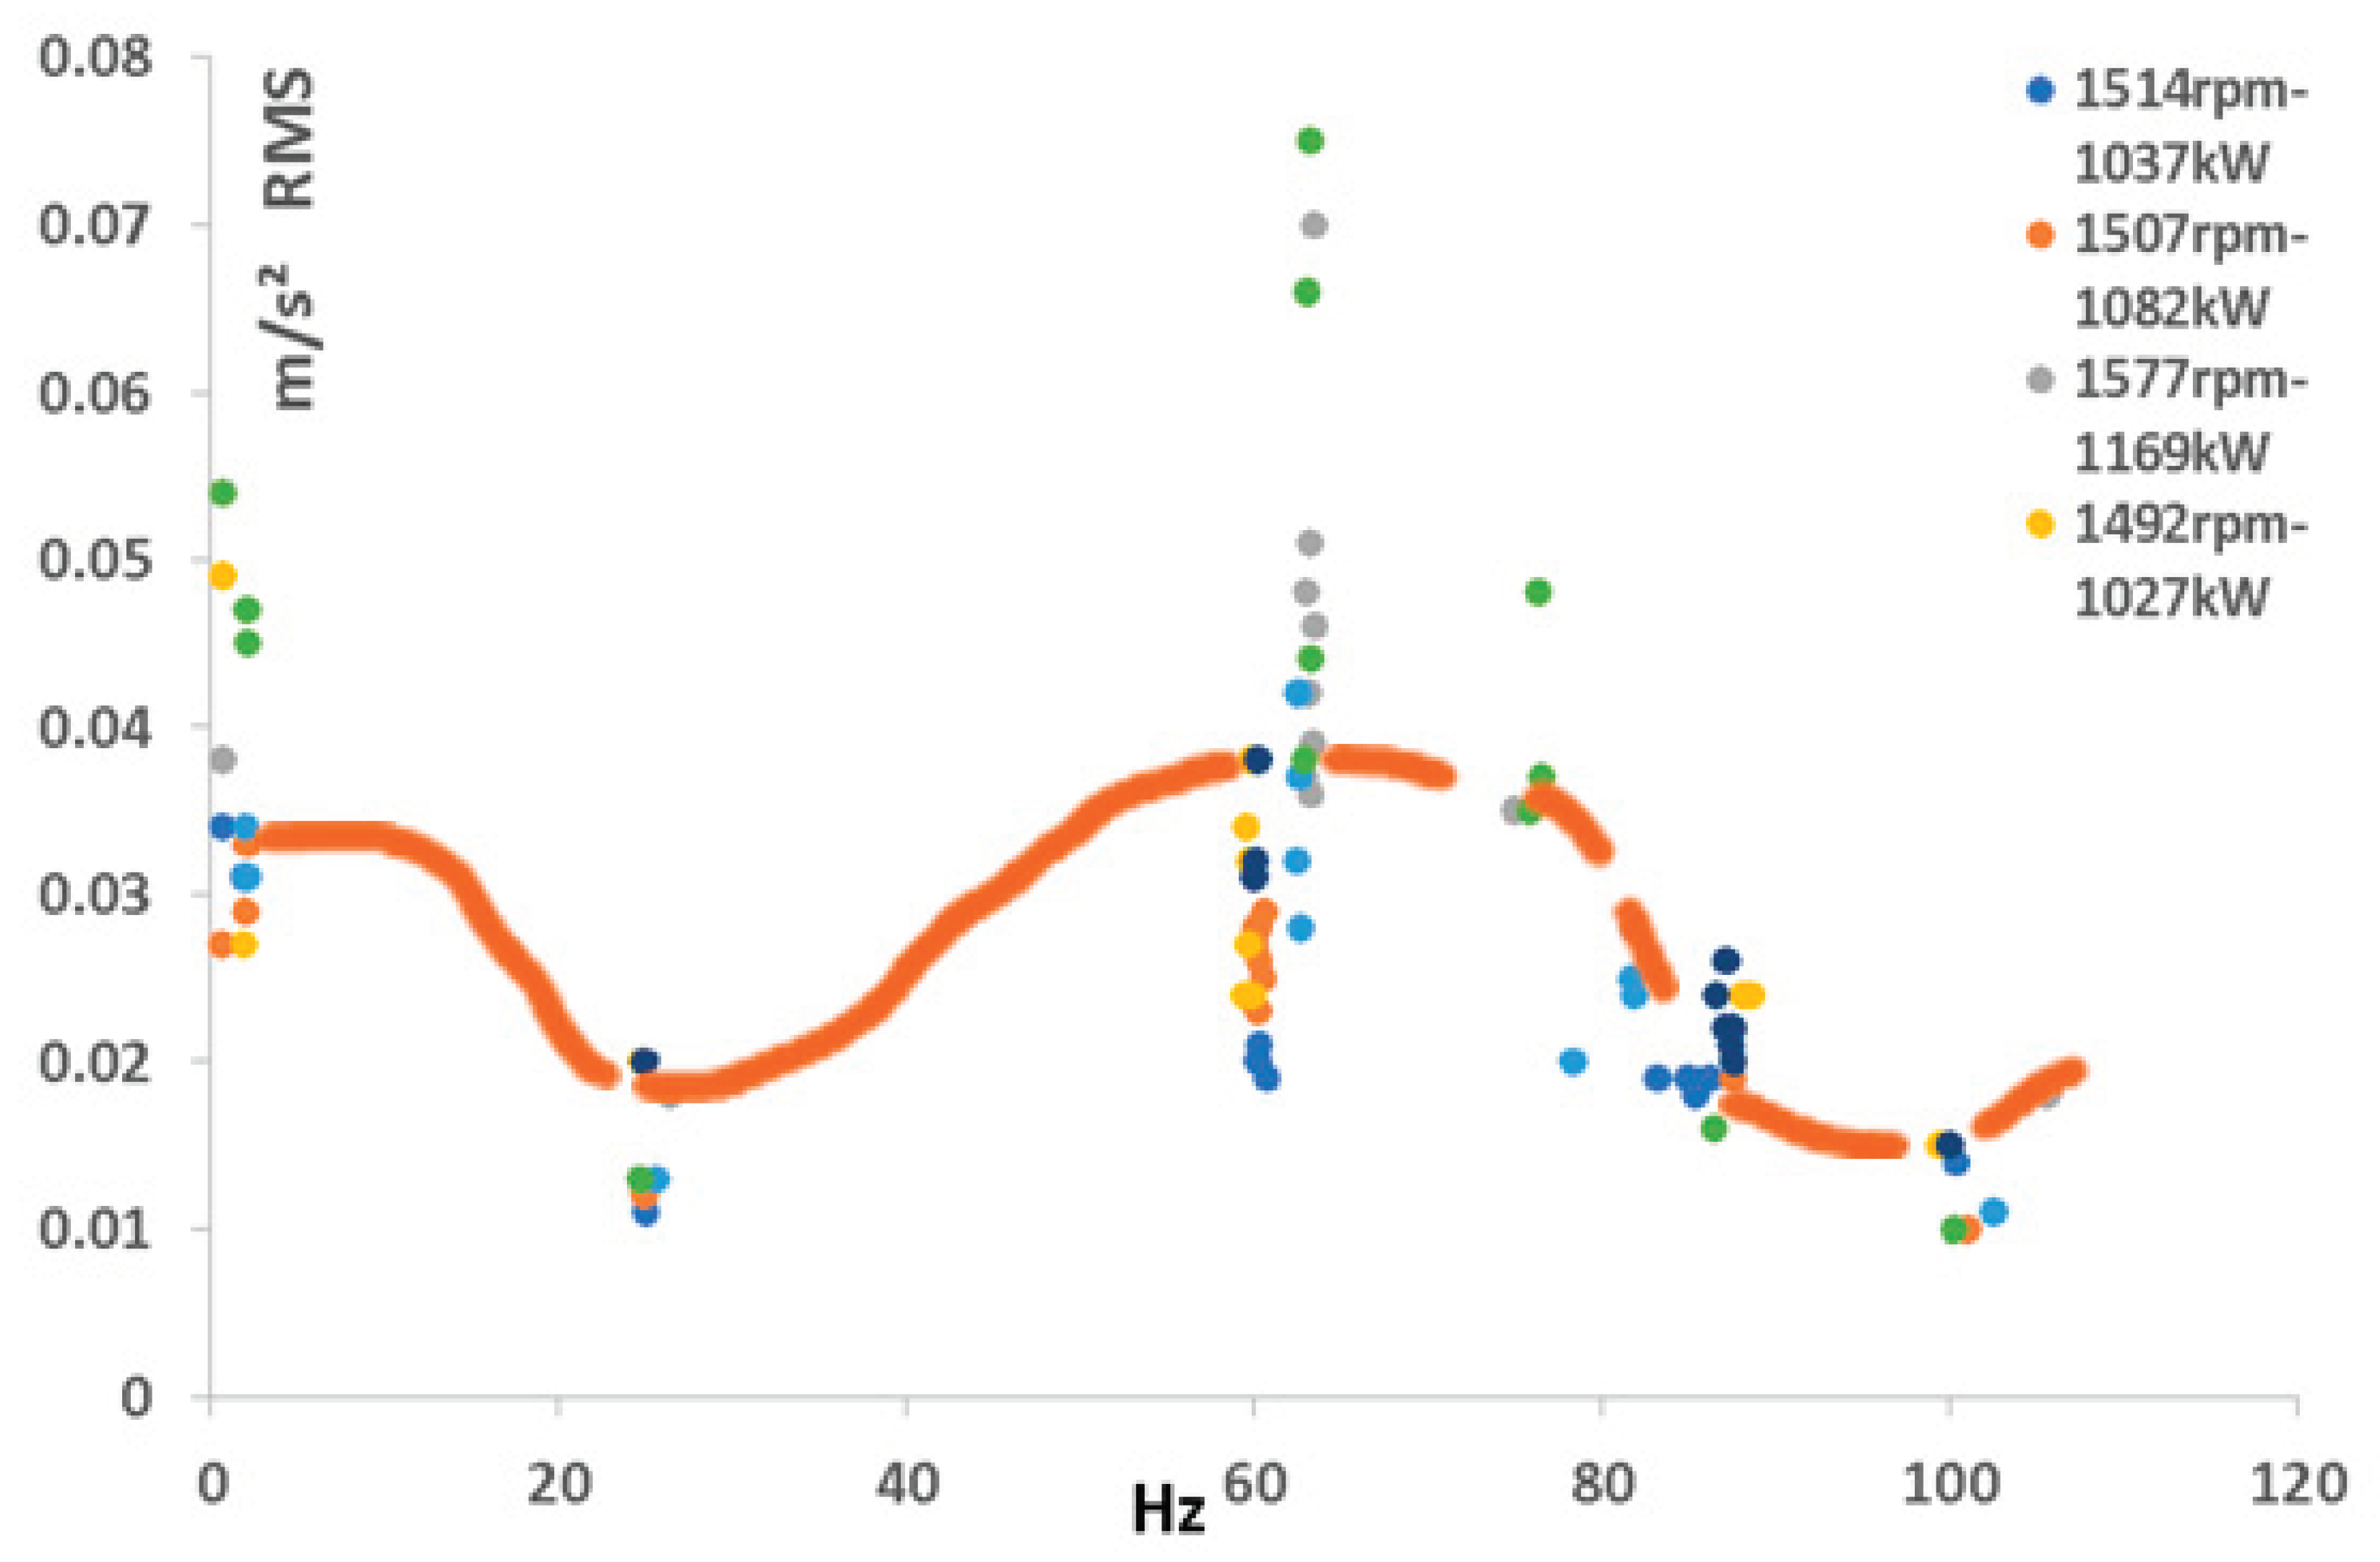
Figure 9.
Fourier spectrum from data acquisition between December 2023 to February 2024, in an up and downwind position.
Figure 9.
Fourier spectrum from data acquisition between December 2023 to February 2024, in an up and downwind position.
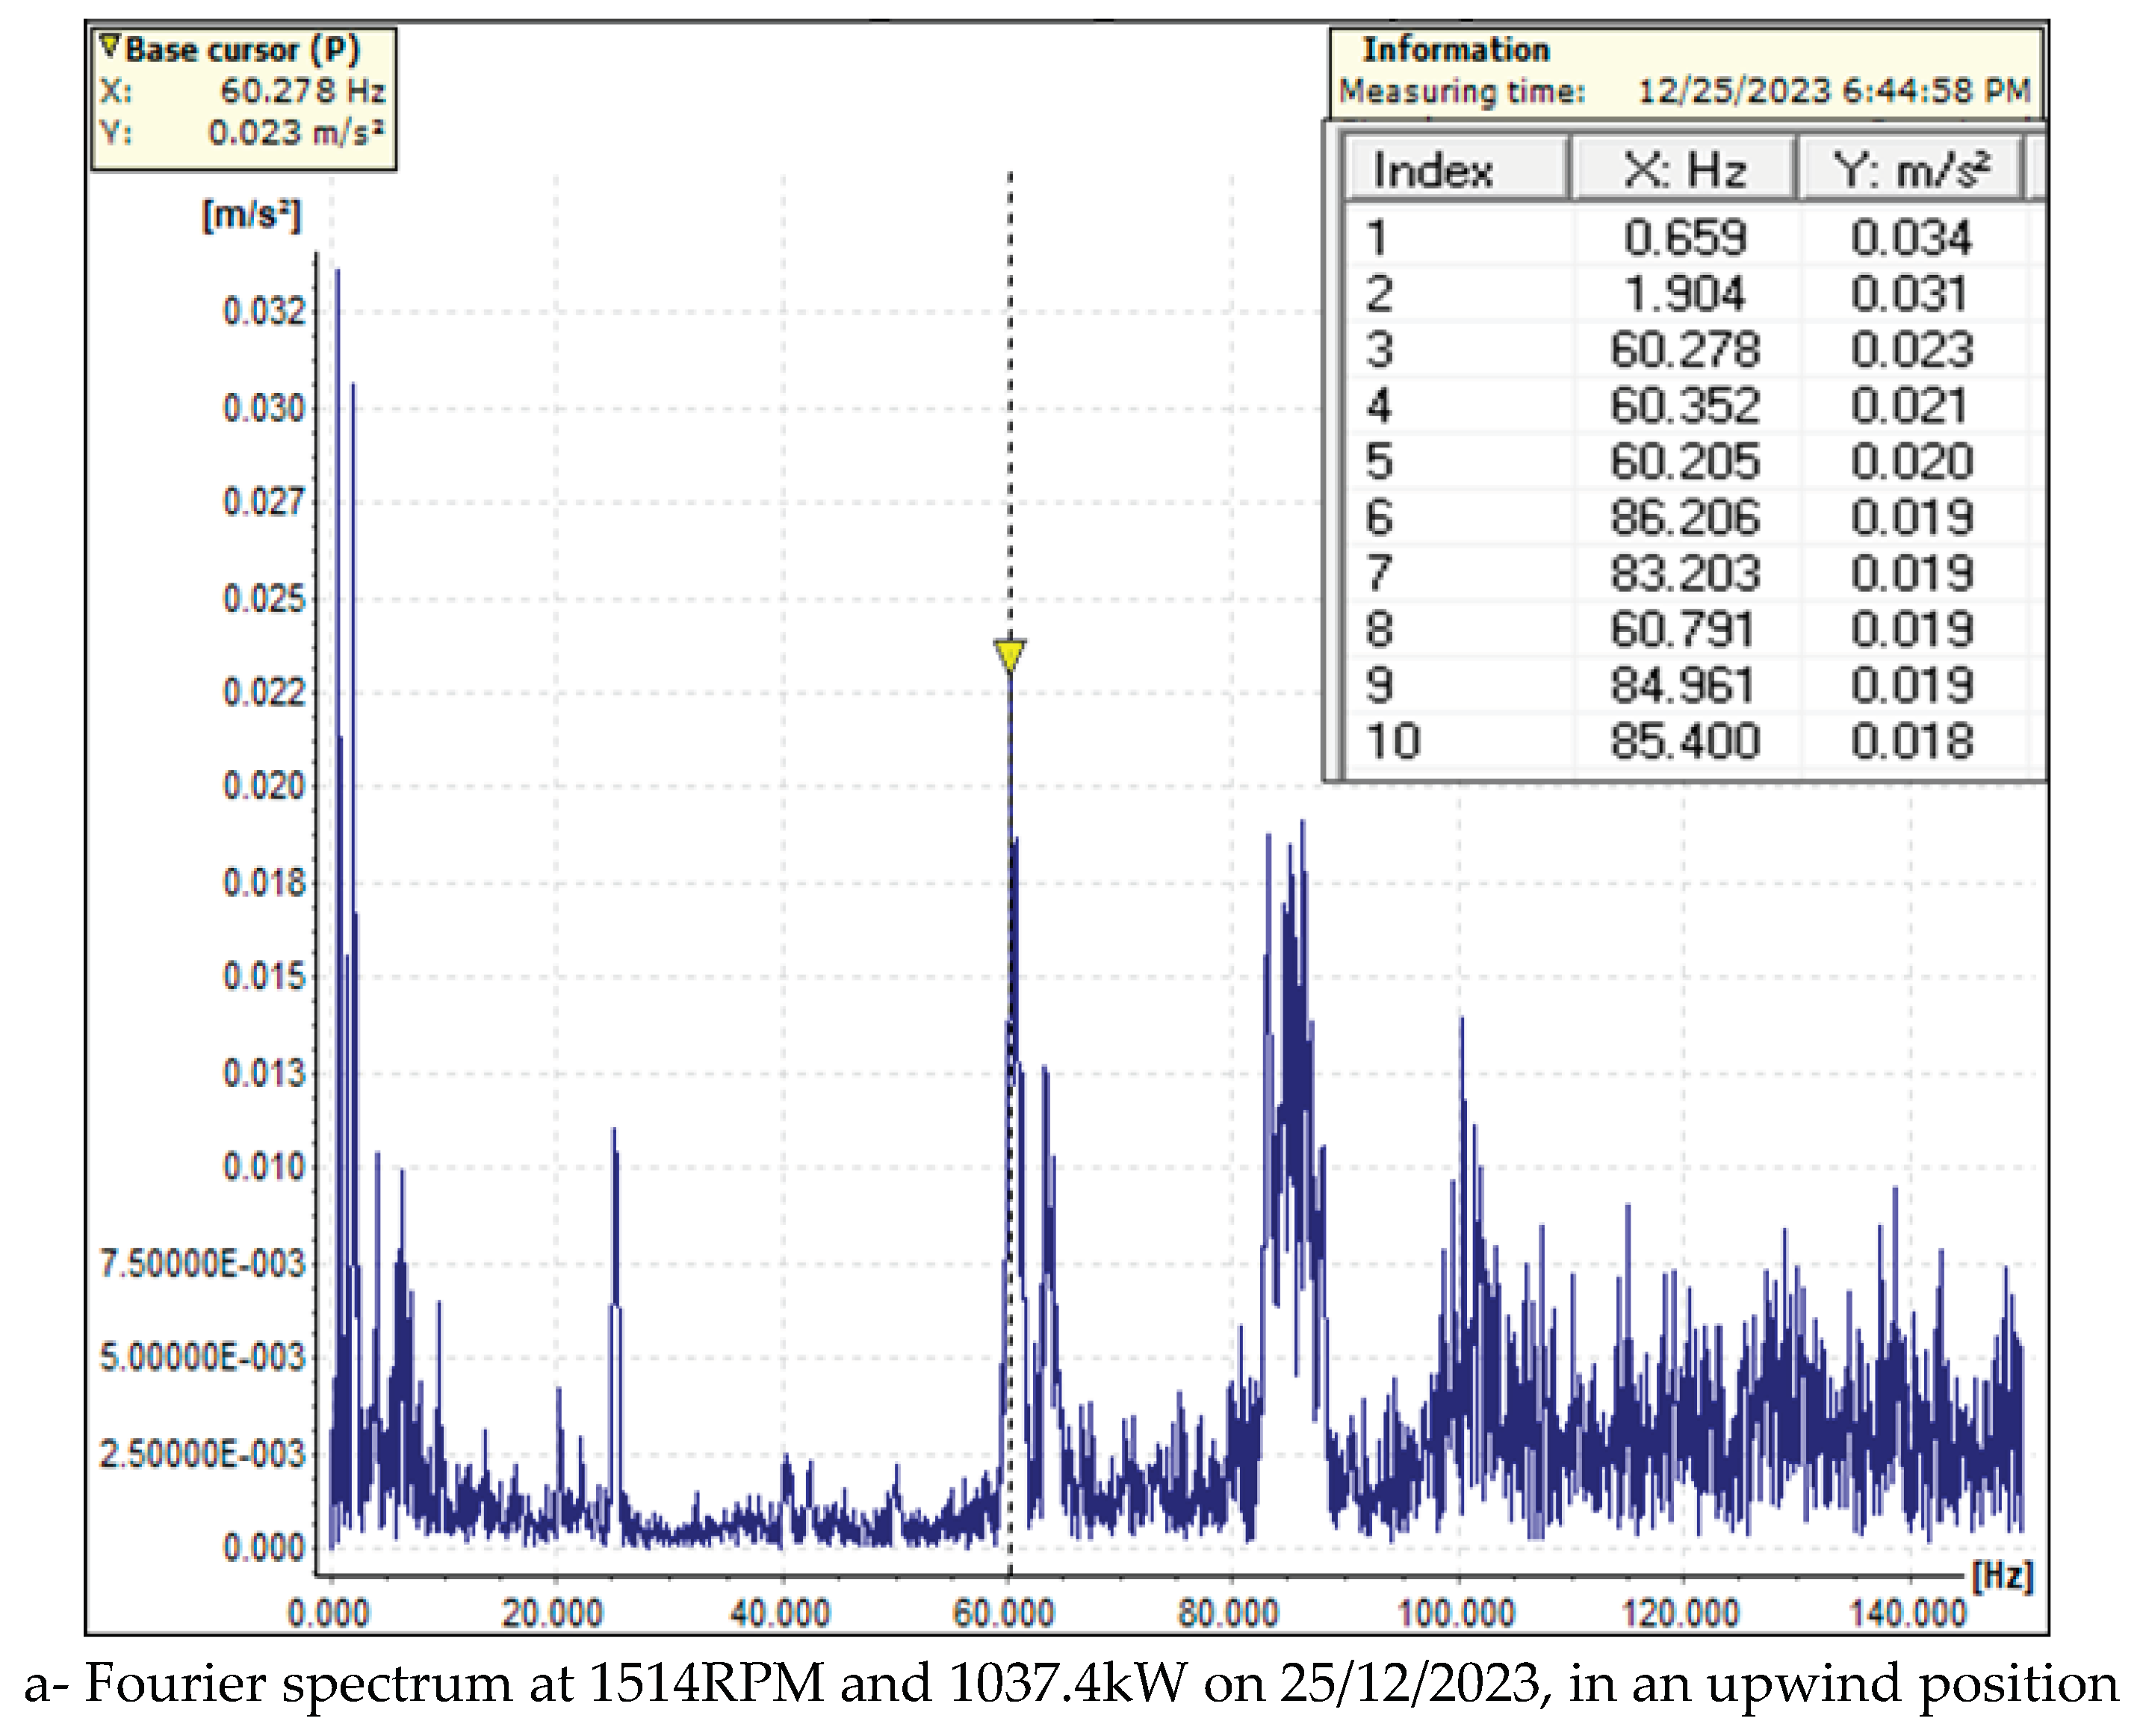
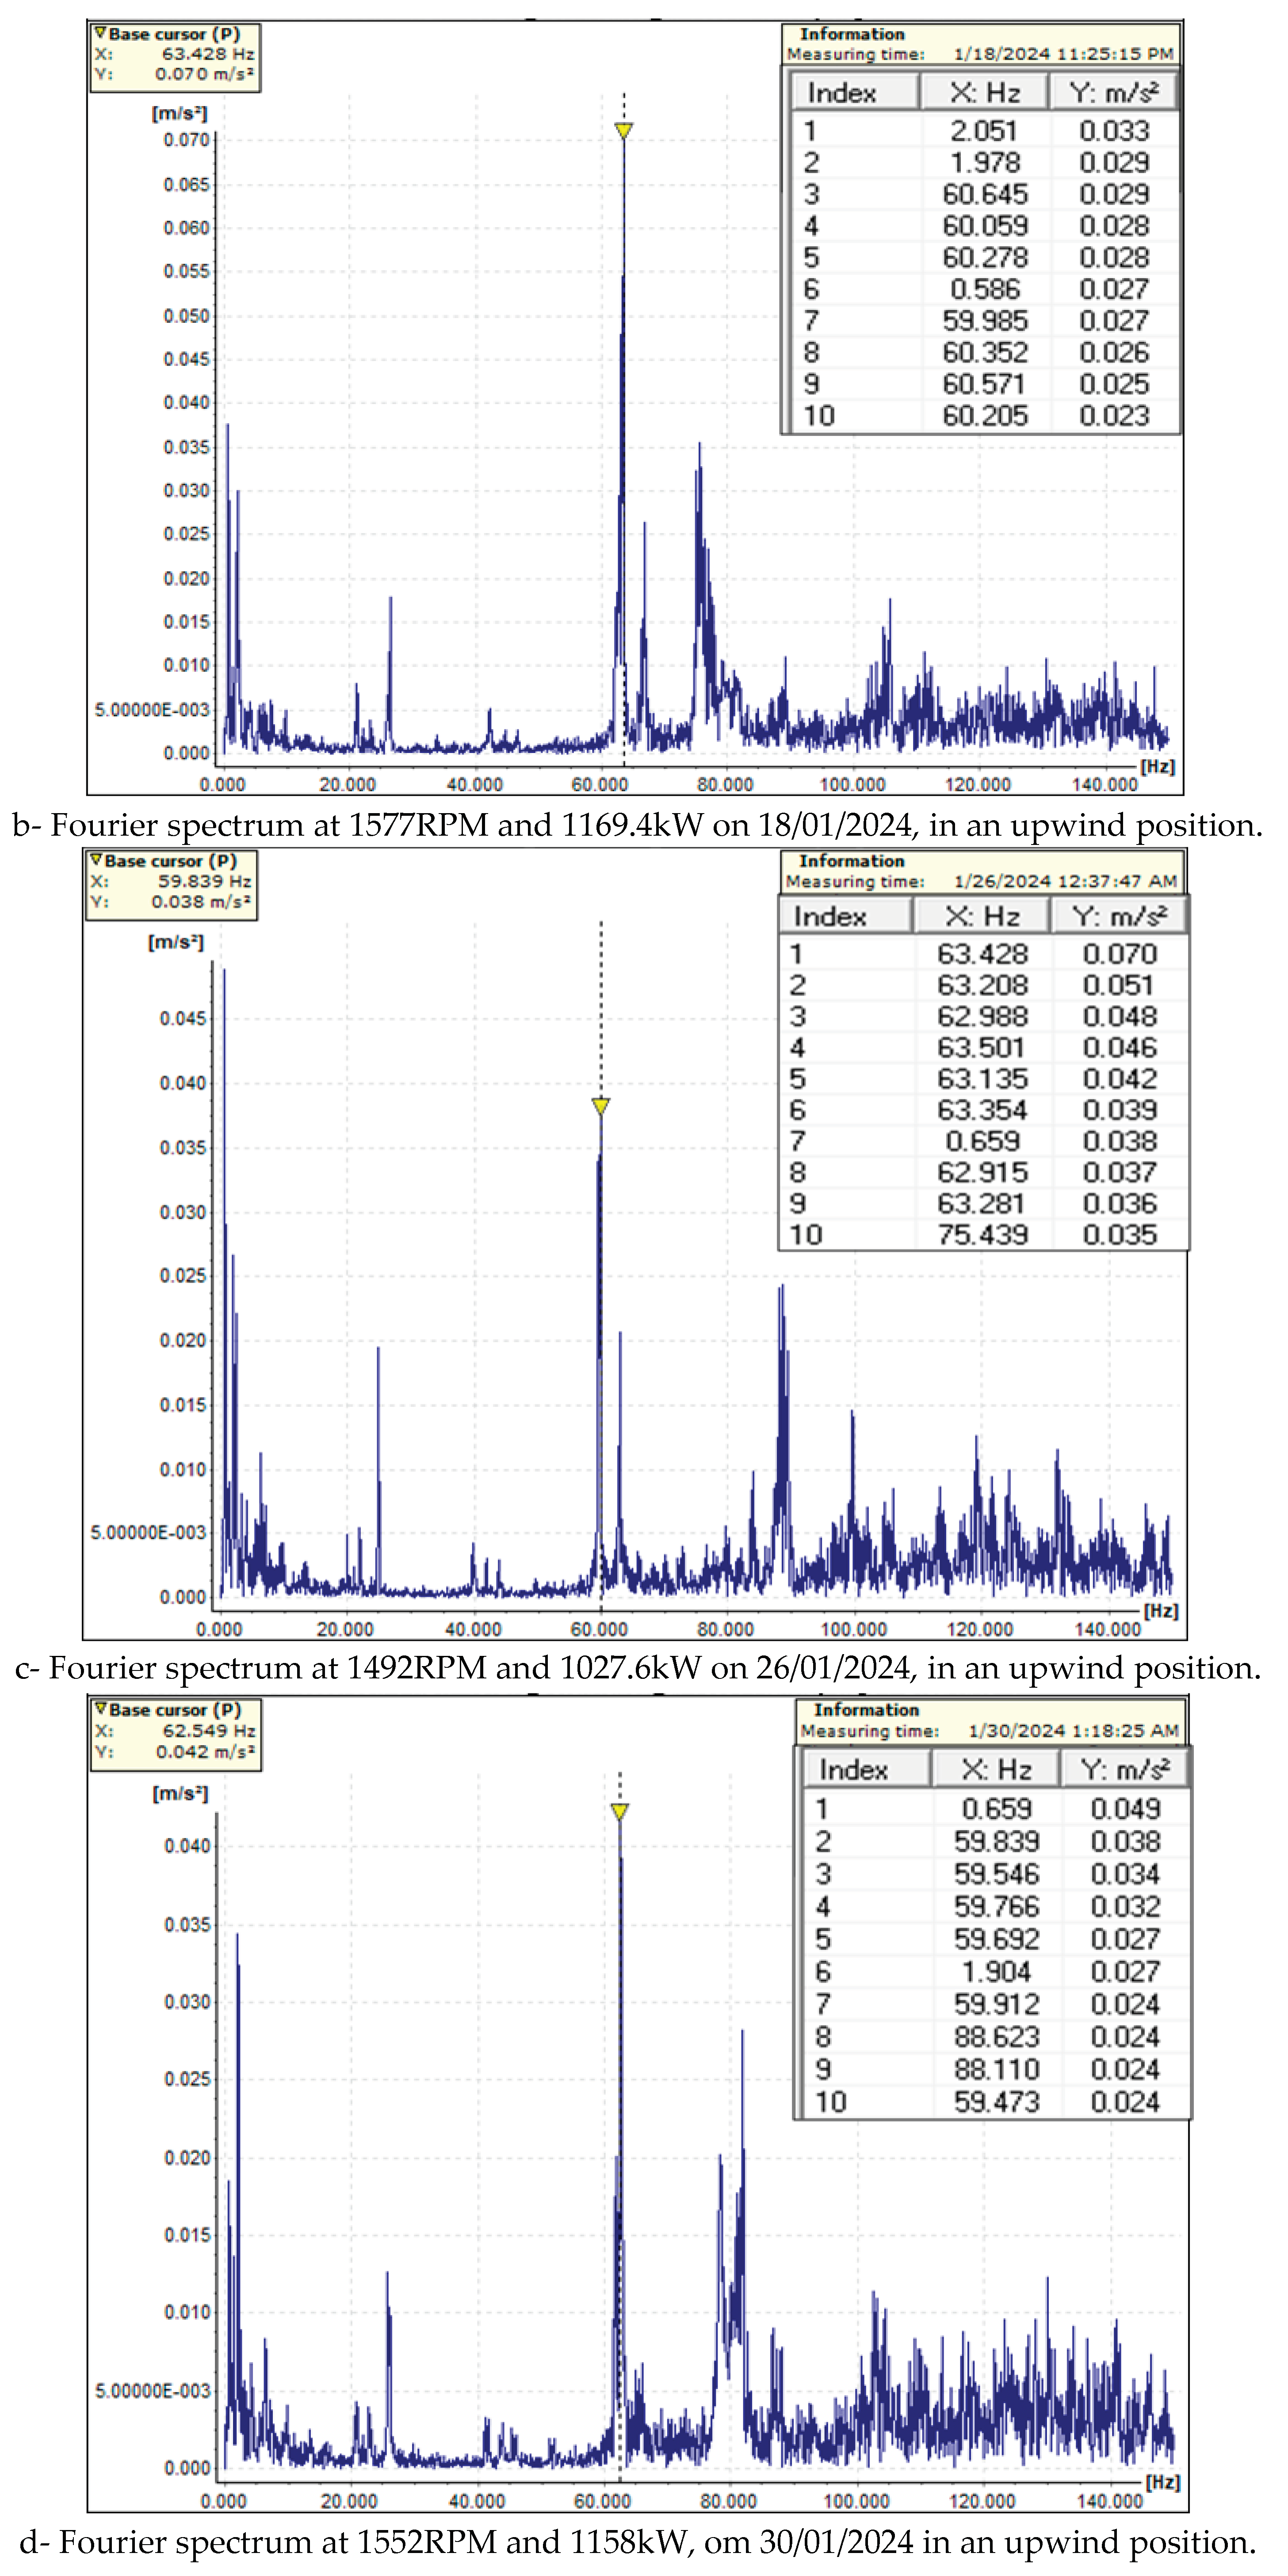
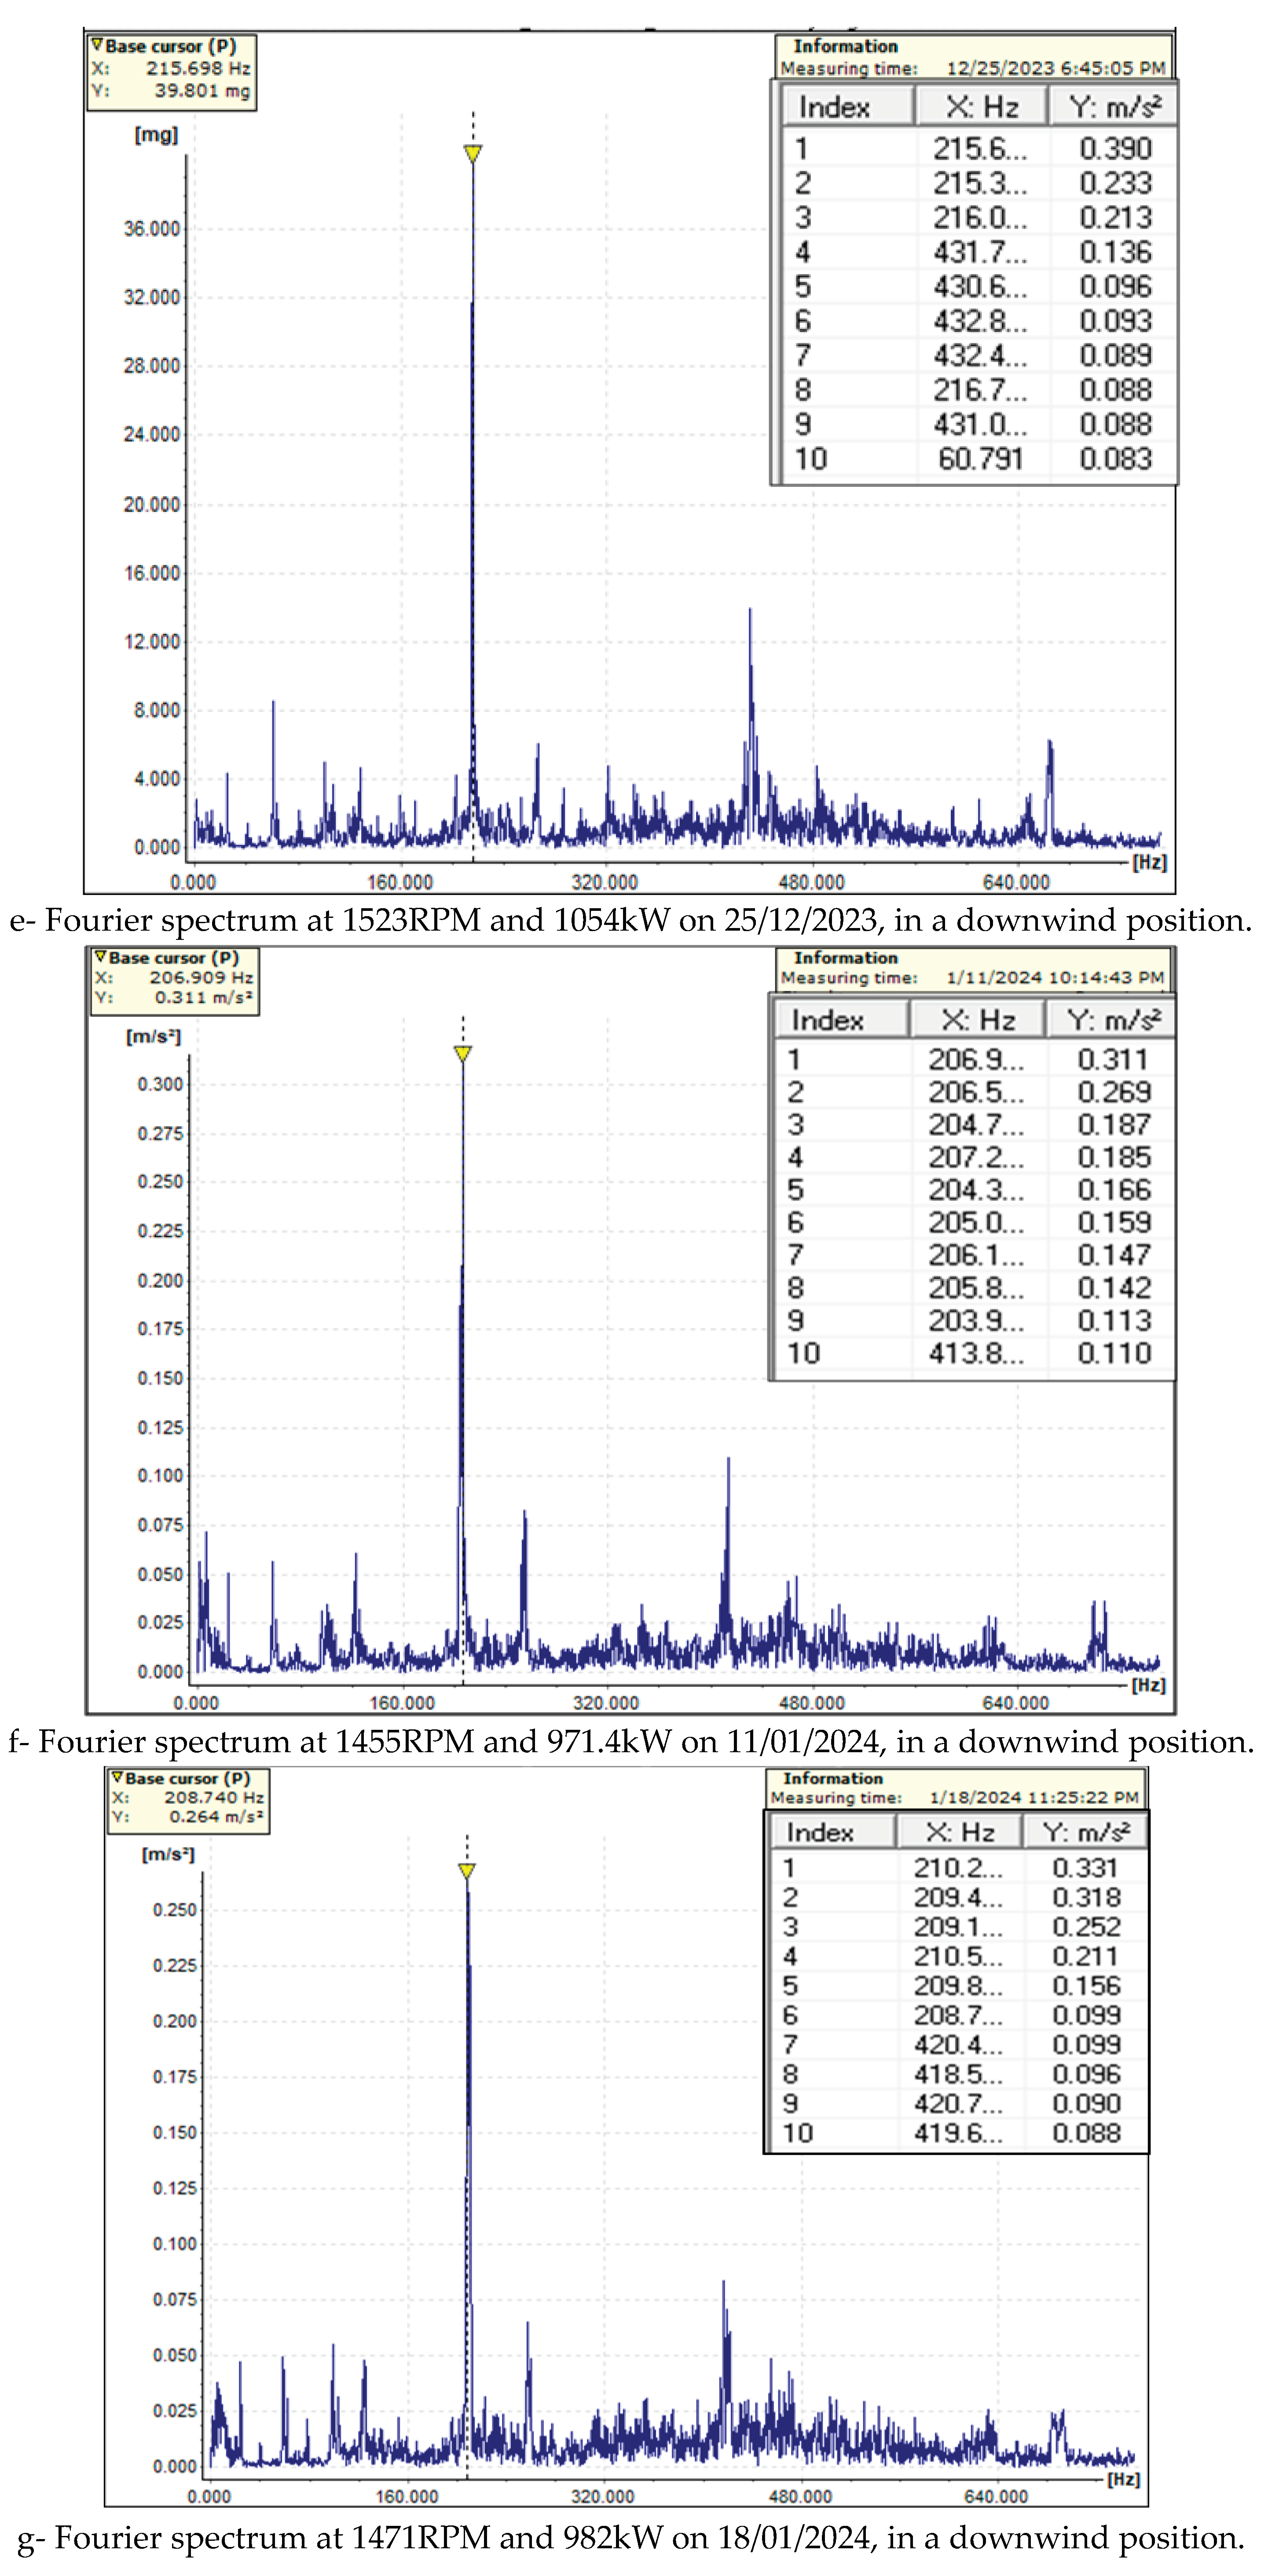
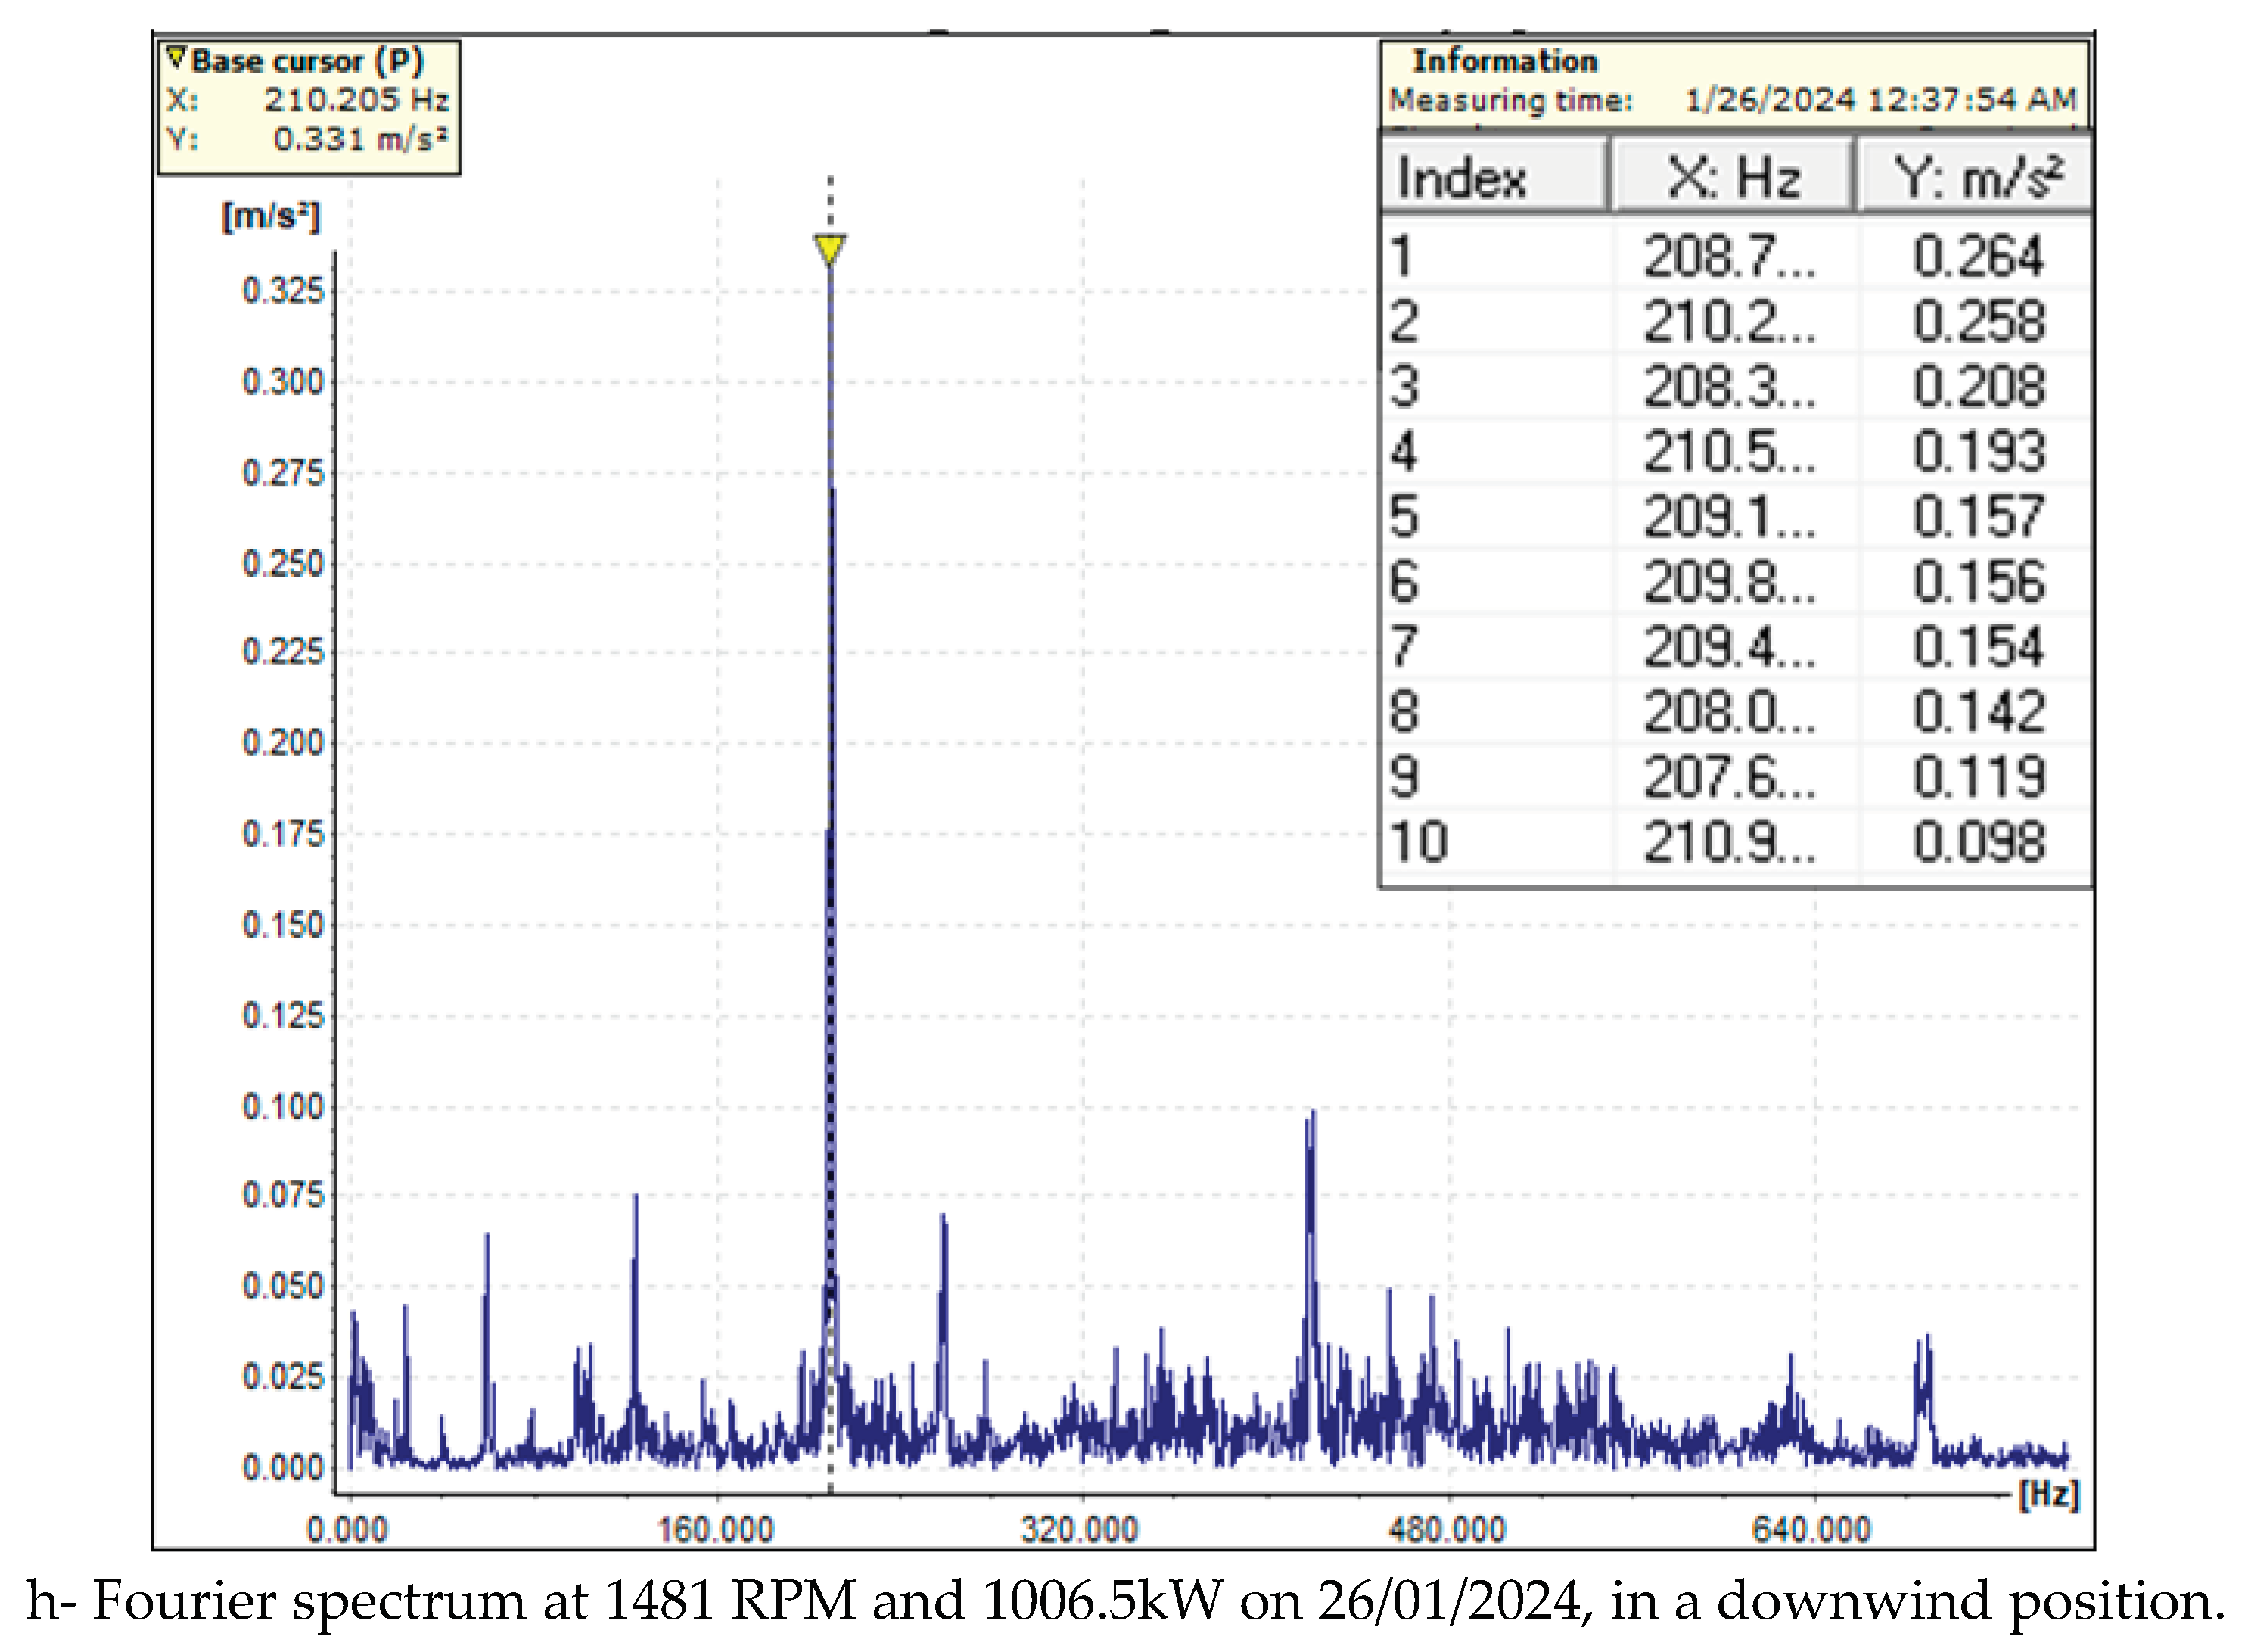
Figure 10.
Objective functions (FOi) for all four selected acquisition data in the upwind sensor position.
Figure 10.
Objective functions (FOi) for all four selected acquisition data in the upwind sensor position.
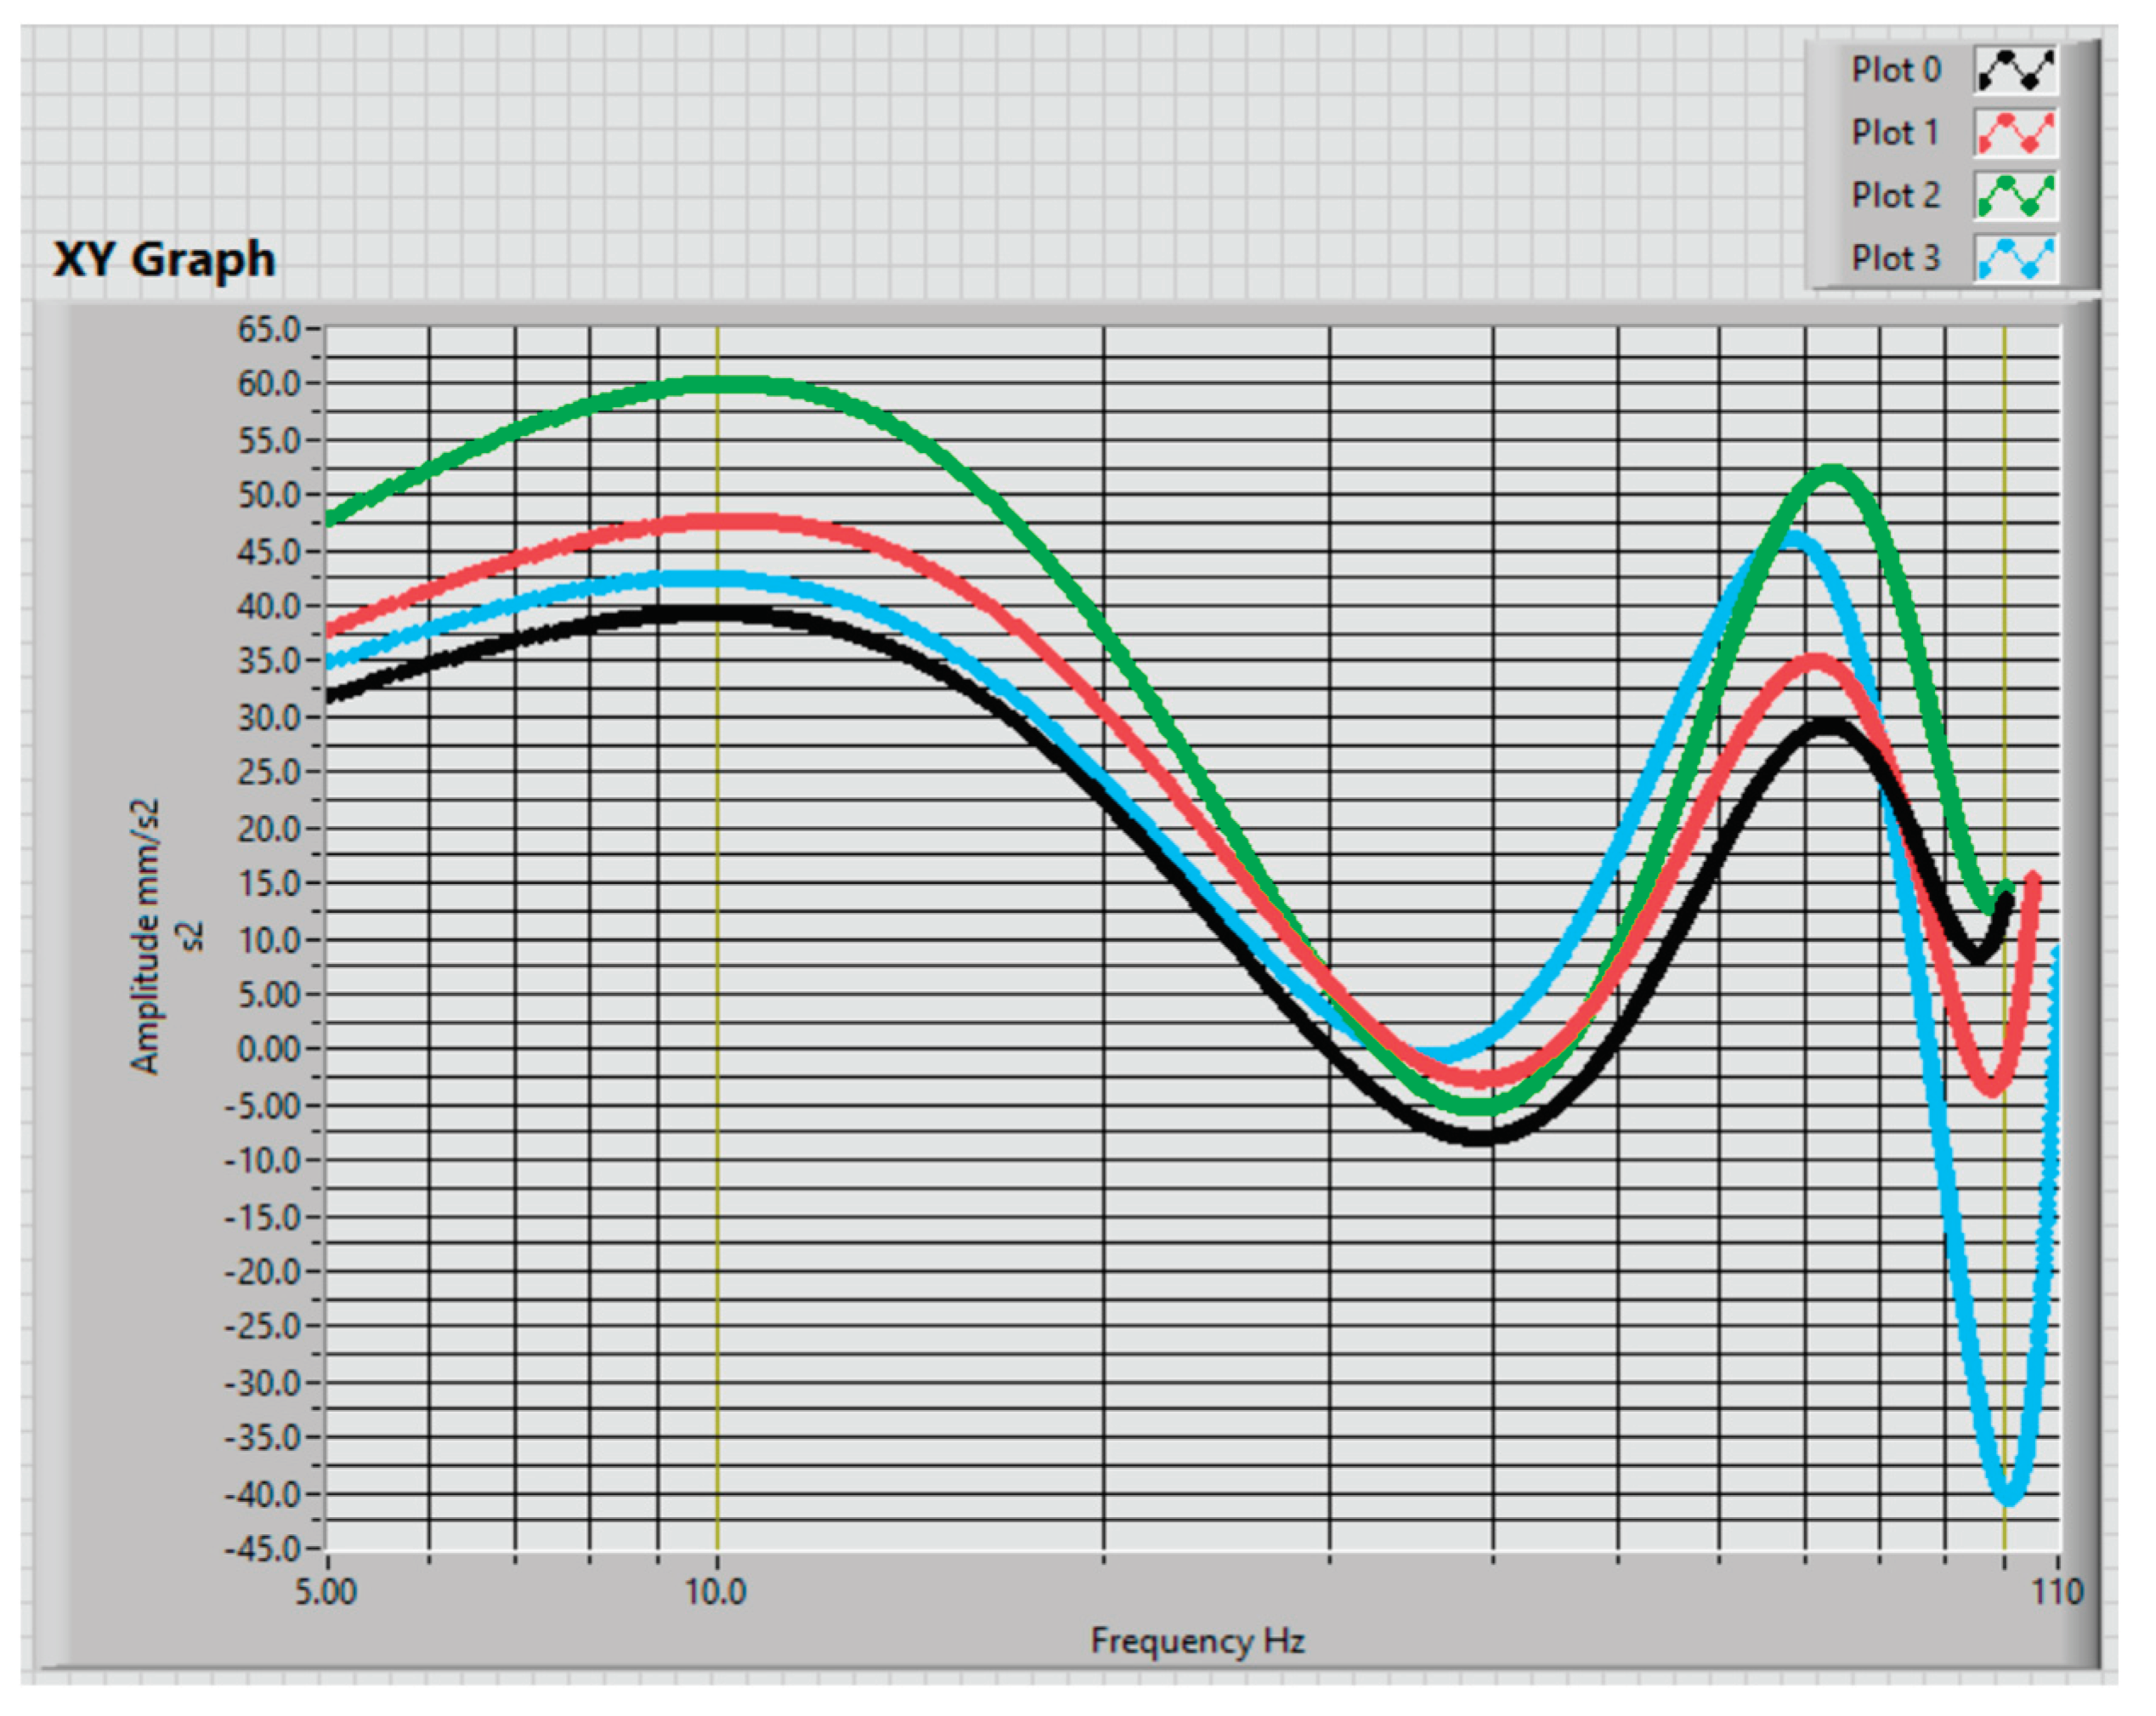
Figure 11.
The front panel of the used LabView VI-s with input and output data for the upwind position sensor.
Figure 11.
The front panel of the used LabView VI-s with input and output data for the upwind position sensor.
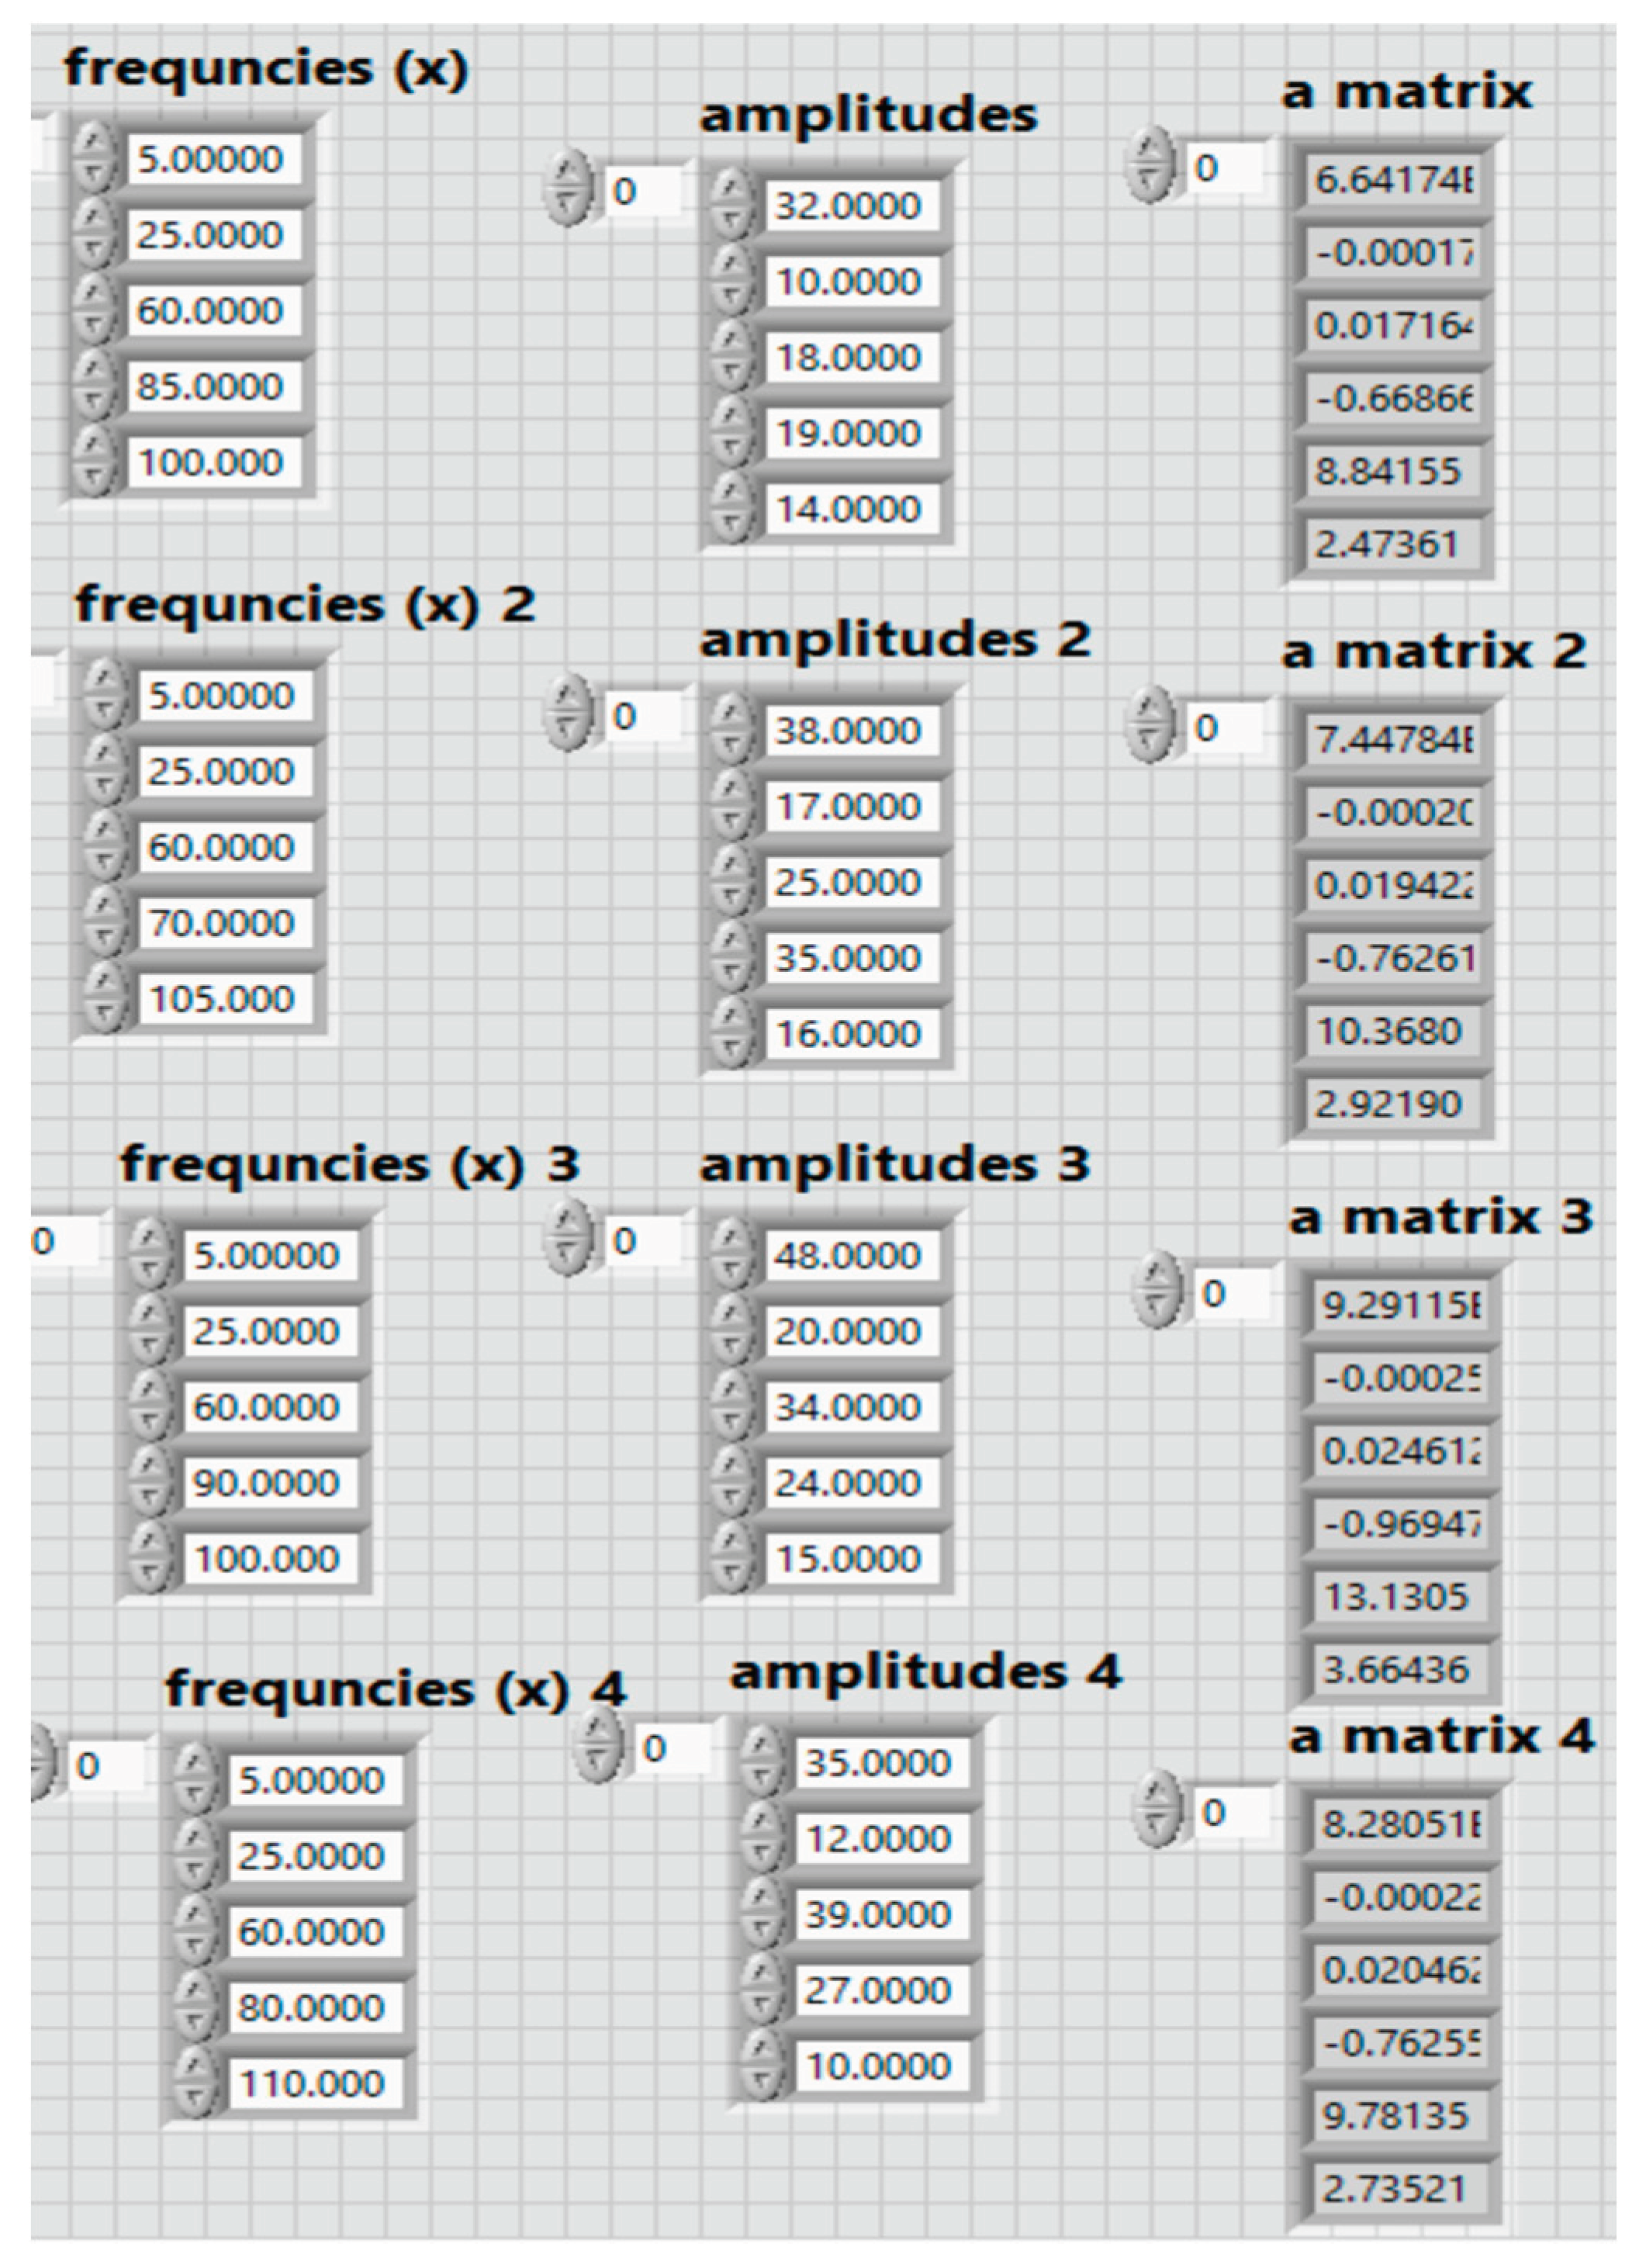
Figure 12.
Objective functions (FOi) for all four selected acquisition data in a downwind sensor position.
Figure 12.
Objective functions (FOi) for all four selected acquisition data in a downwind sensor position.
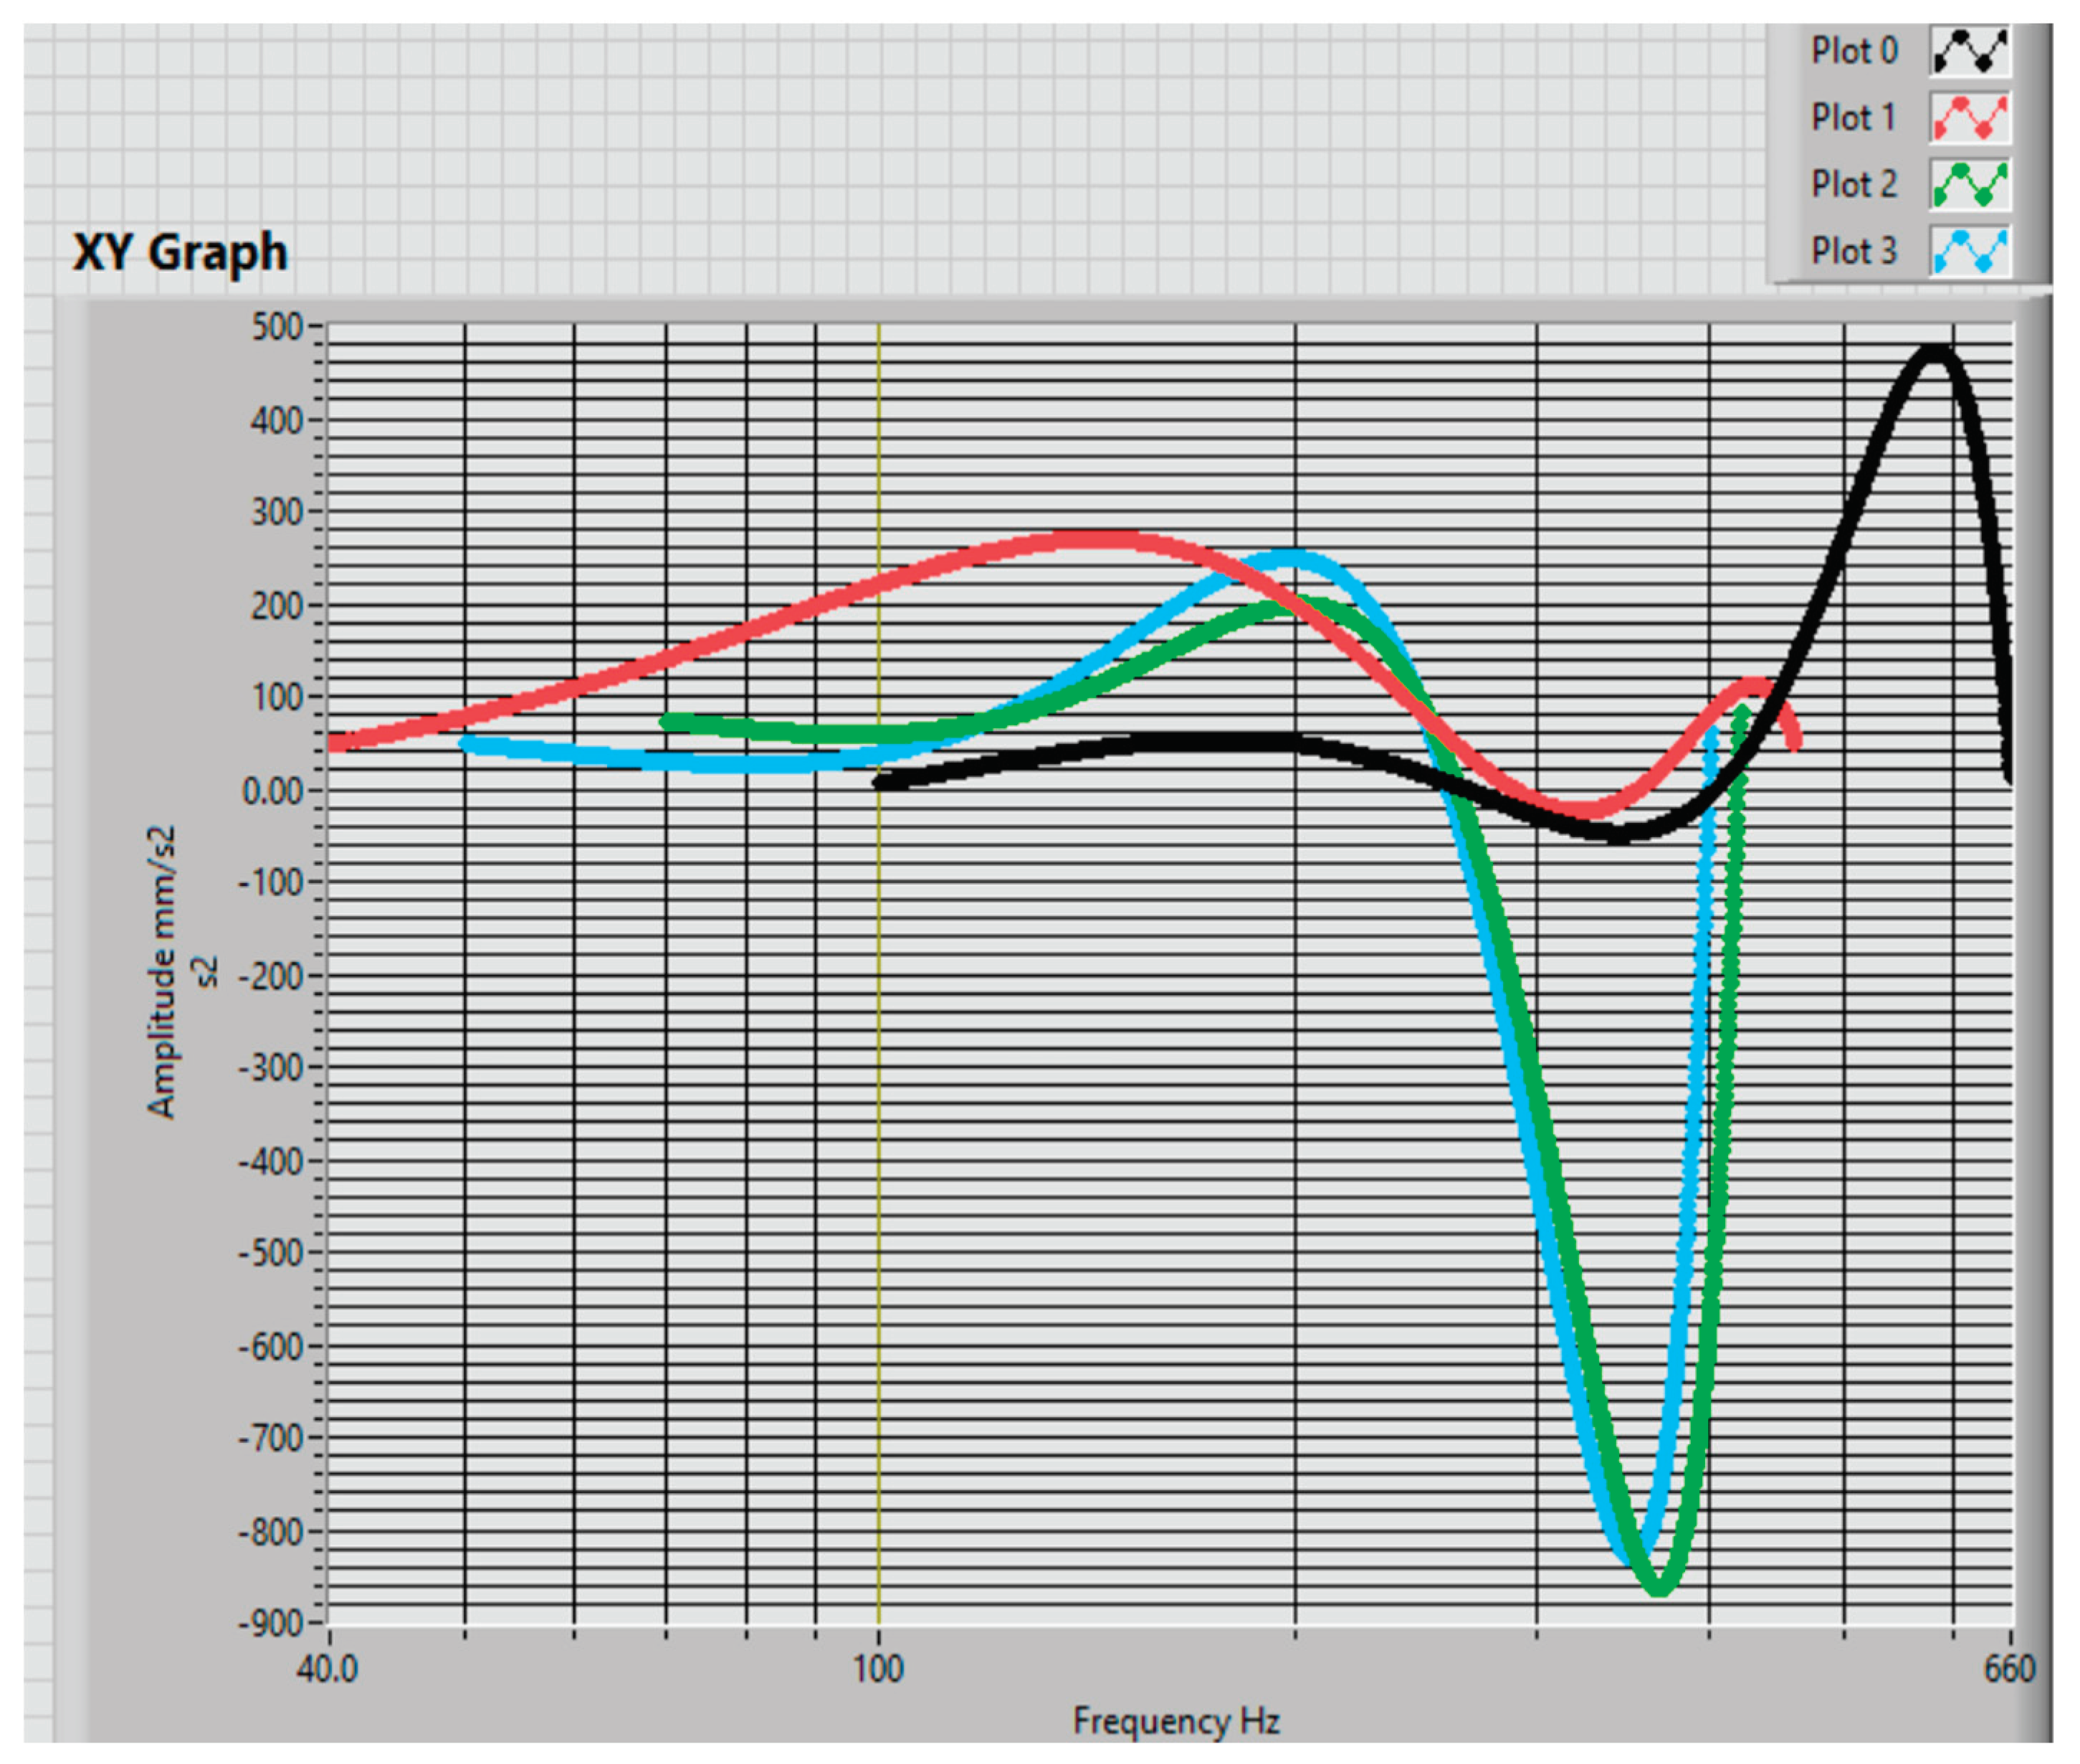
Figure 13.
The front panel of the used LabView VI-s with input and output data for the downwind position sensor.
Figure 13.
The front panel of the used LabView VI-s with input and output data for the downwind position sensor.
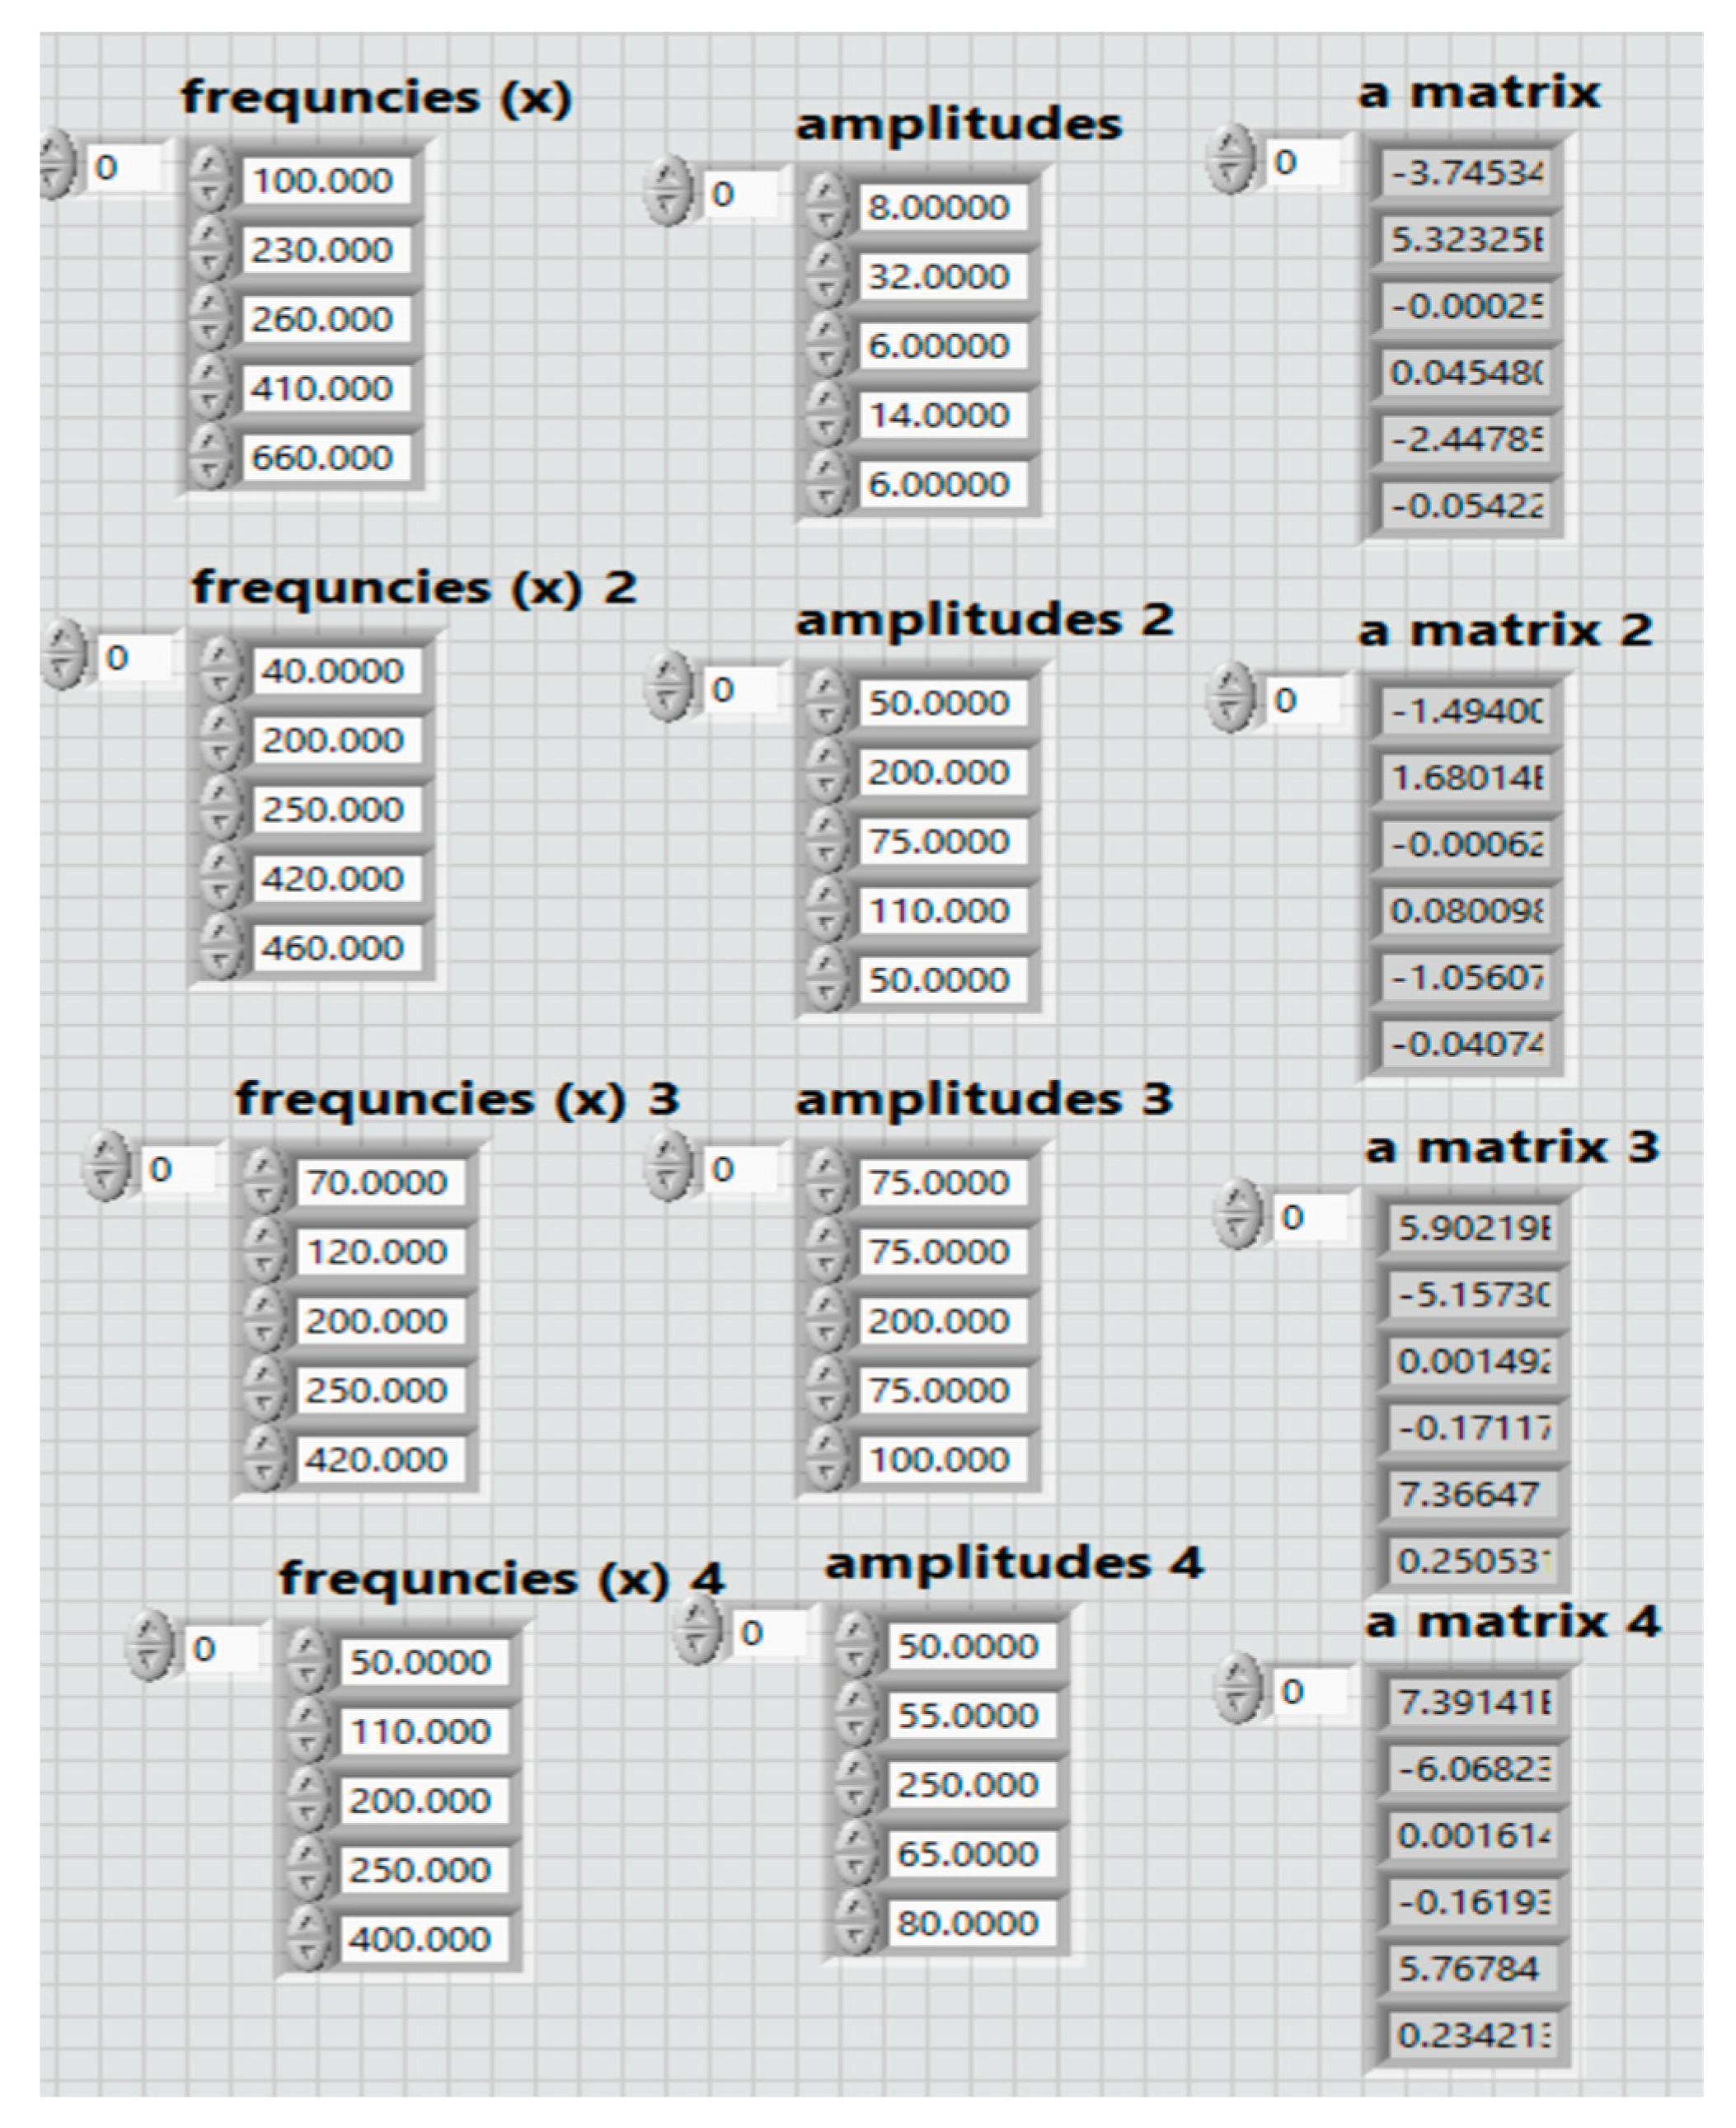
Figure 14.
The trend of the magnitude- -frequency points from the FO.
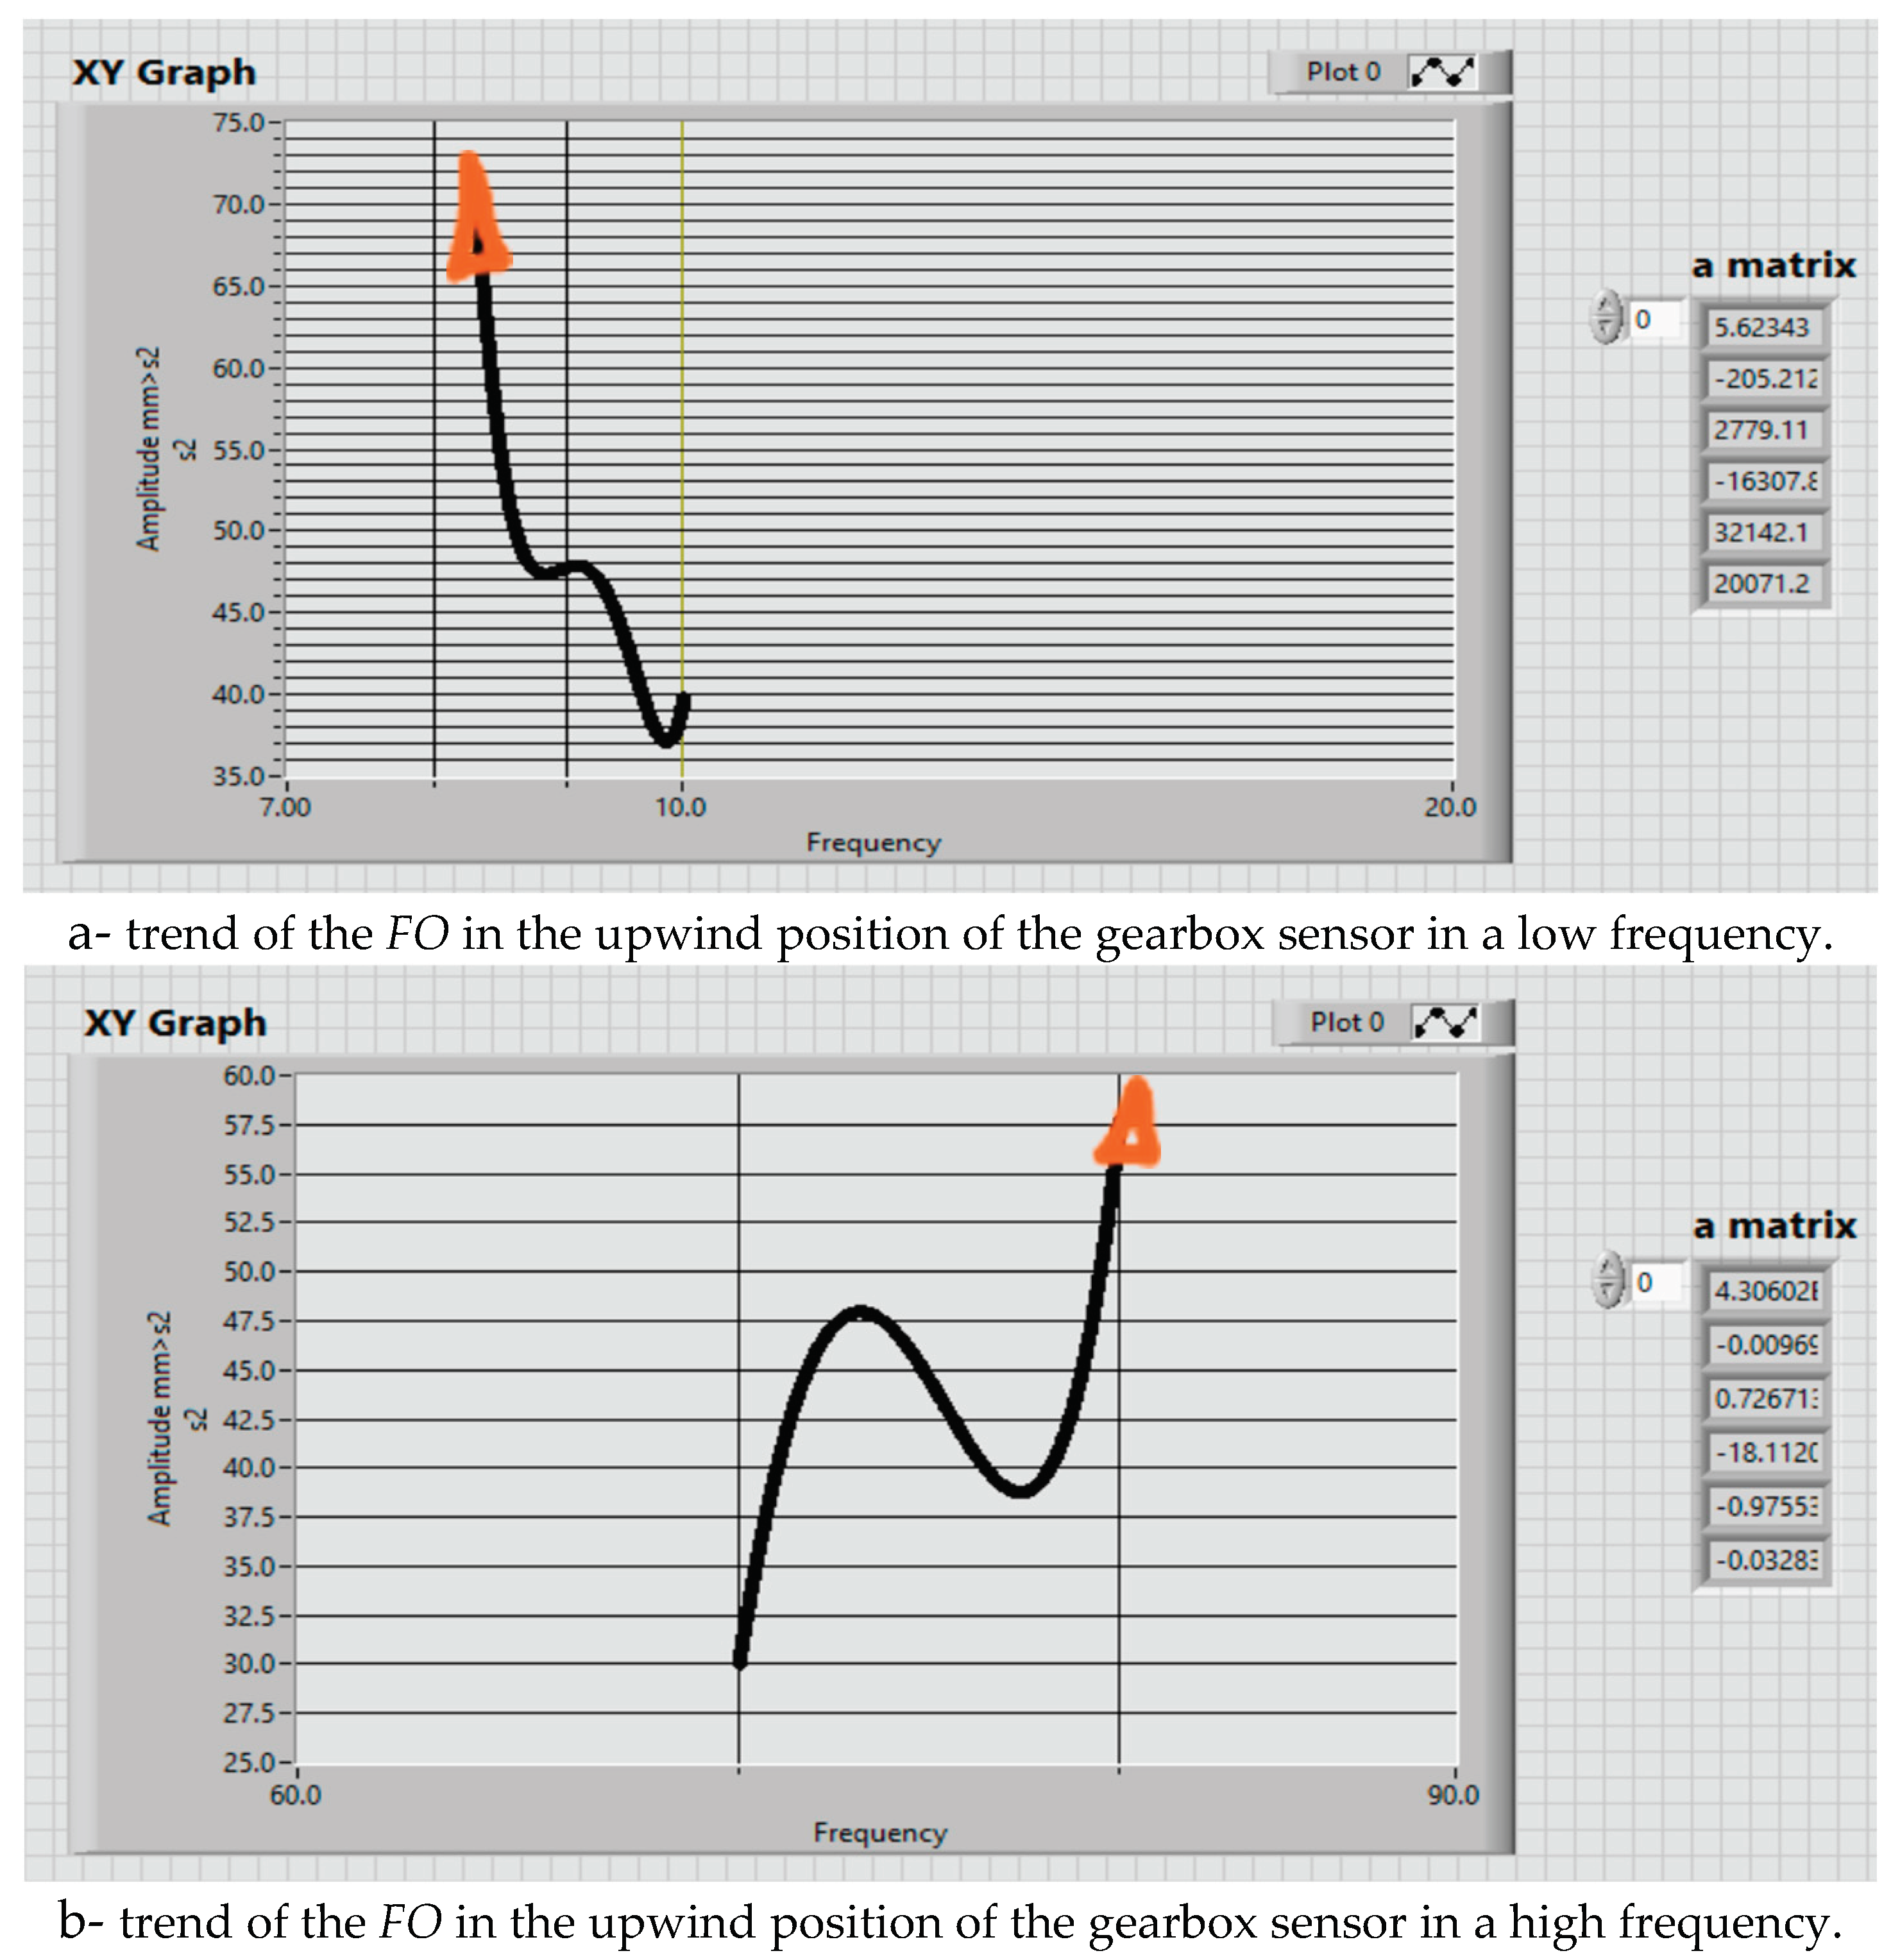
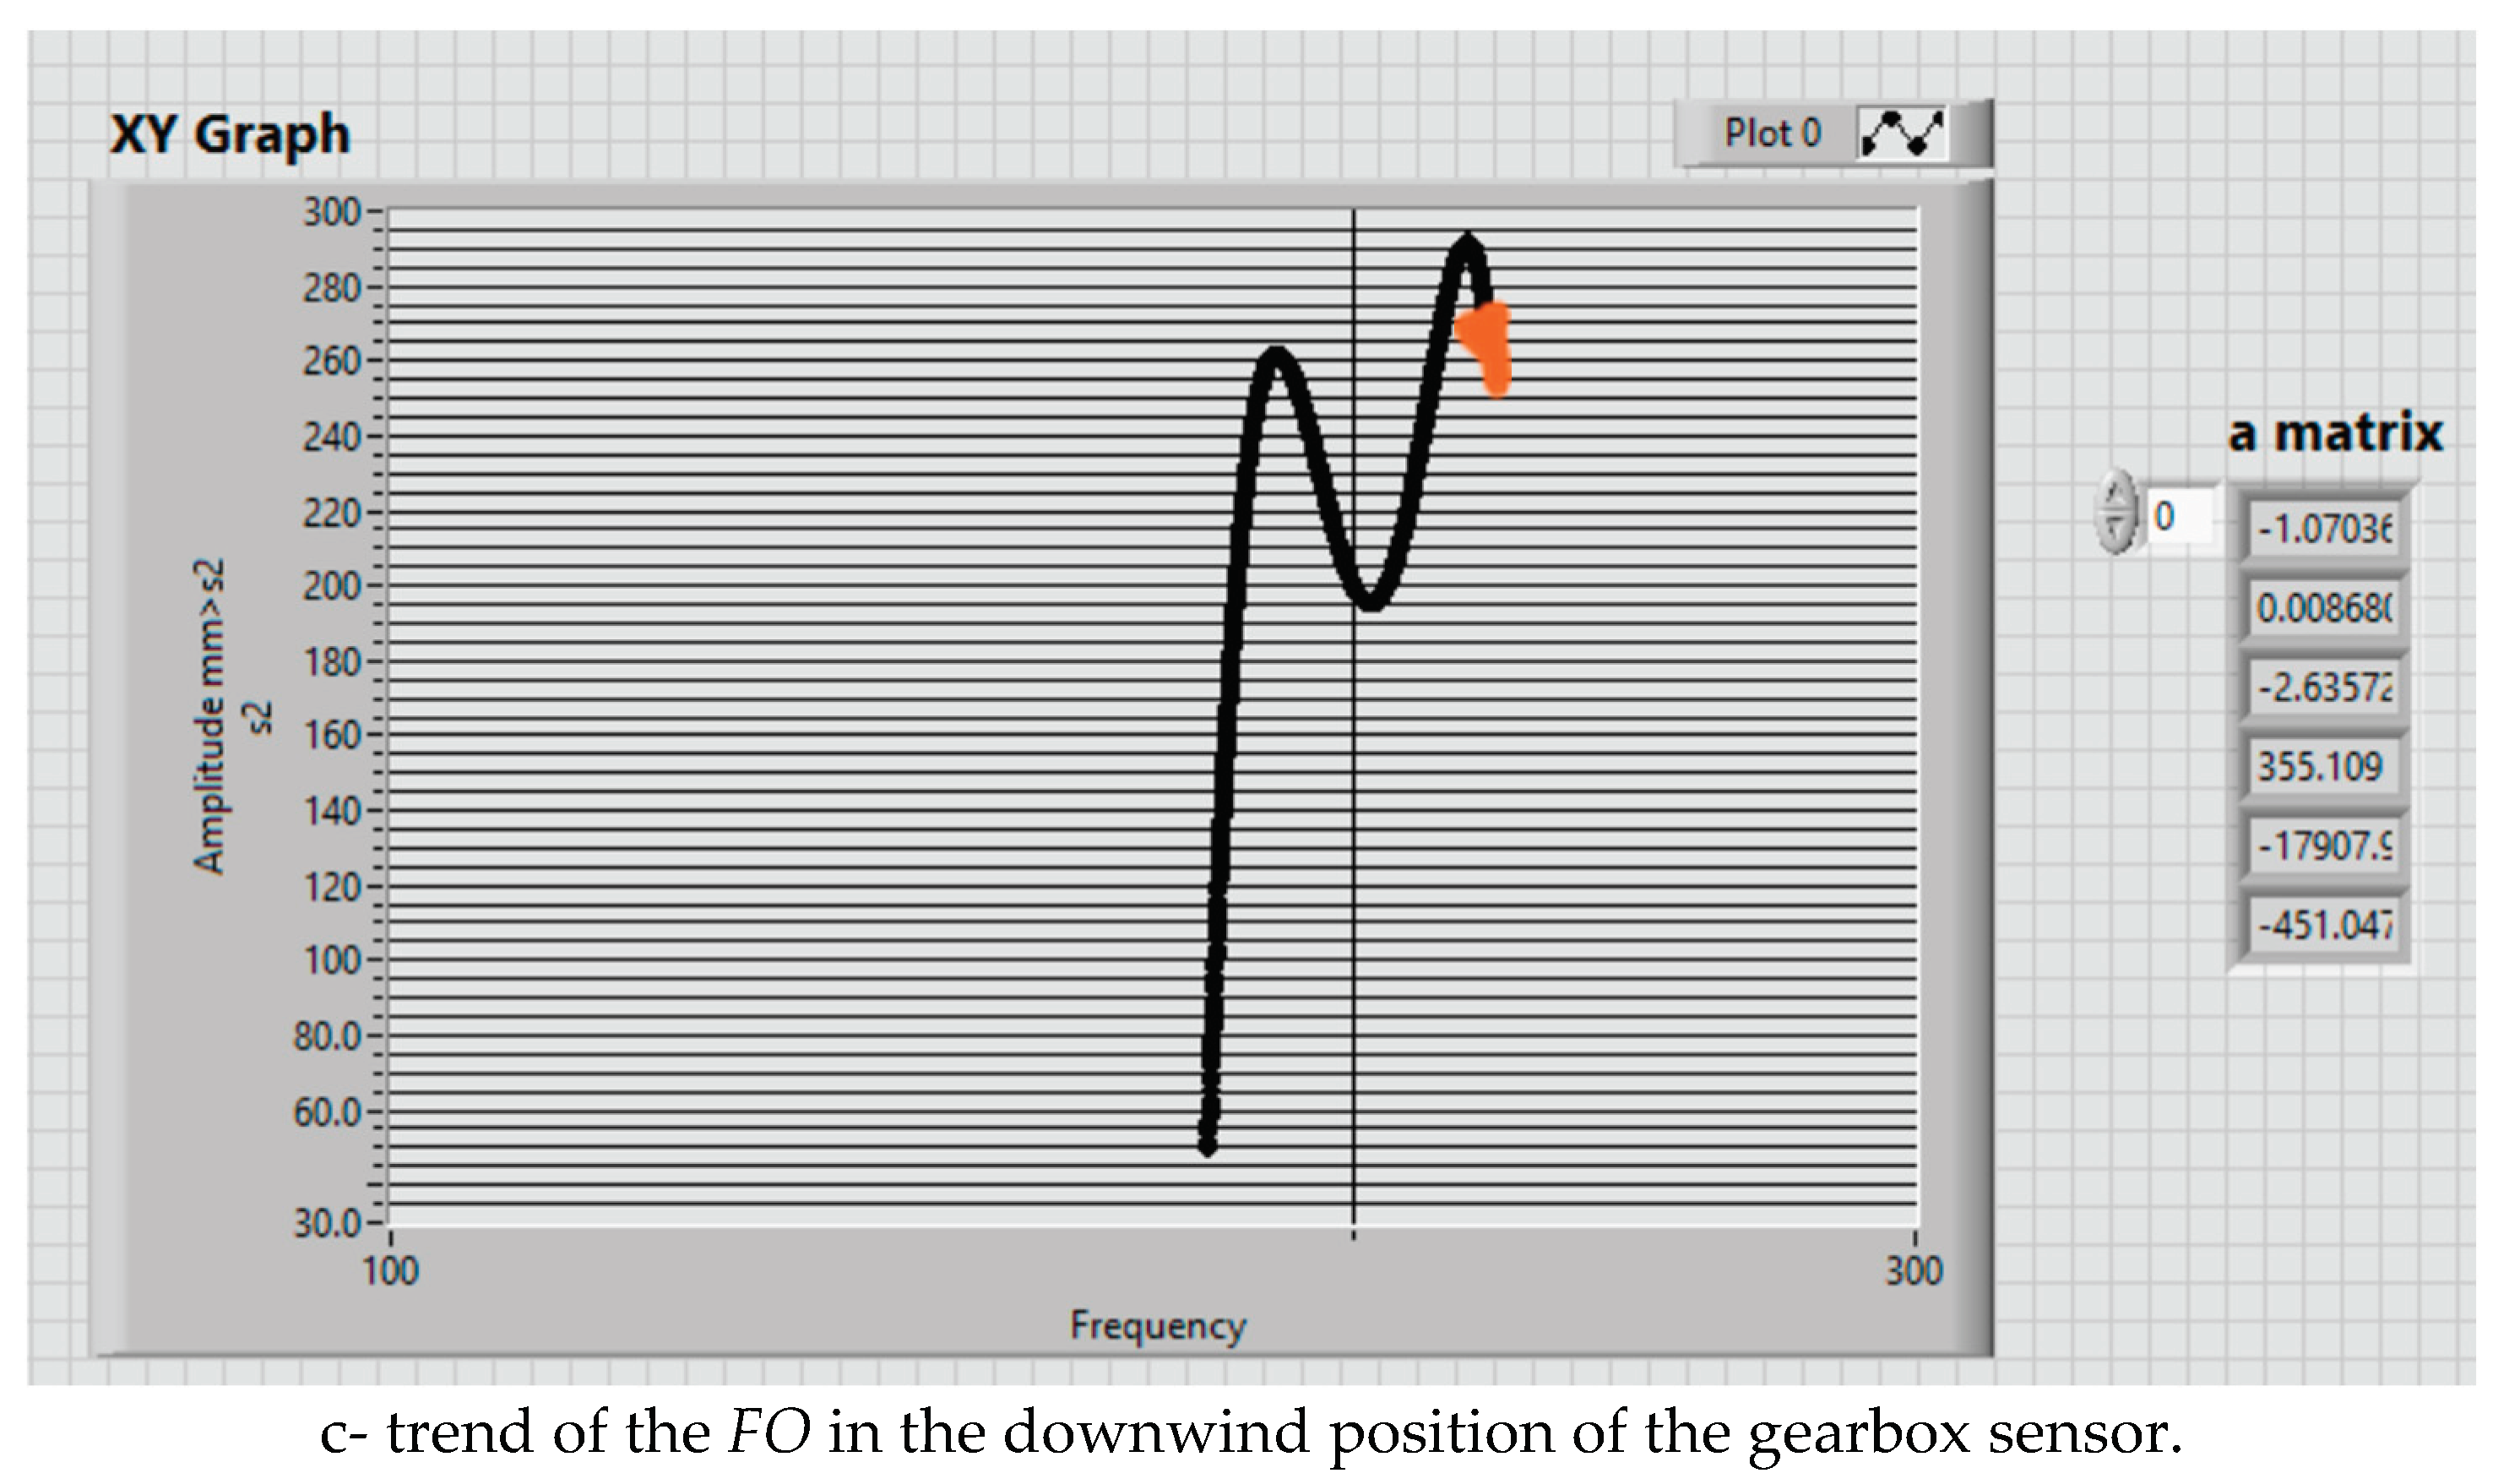

Table 1.
Sensors notation and position on the wind turbine.
| Sensor label | Description |
|---|---|
| B1-MB-RS | Main bearing accelerometer- rotor side |
| B2-MB-GS | Main bearing accelerometer- generator side |
| B3-LSS | Gearbox accelerometer- low-speed shaft |
| B4-IS | Gearbox accelerometer- intermediary shaft |
| B5-HSS | Gearbox accelerometer- high-speed shaft |
| B6-G-DE | Generator accelerometer drive end-side |
| B7-G-NDE | Generator accelerometer non-drive end-side |
Disclaimer/Publisher’s Note: The statements, opinions and data contained in all publications are solely those of the individual author(s) and contributor(s) and not of MDPI and/or the editor(s). MDPI and/or the editor(s) disclaim responsibility for any injury to people or property resulting from any ideas, methods, instructions or products referred to in the content. |
© 2024 by the authors. Licensee MDPI, Basel, Switzerland. This article is an open access article distributed under the terms and conditions of the Creative Commons Attribution (CC BY) license (http://creativecommons.org/licenses/by/4.0/).
Copyright: This open access article is published under a Creative Commons CC BY 4.0 license, which permit the free download, distribution, and reuse, provided that the author and preprint are cited in any reuse.


