Submitted:
19 March 2024
Posted:
19 March 2024
You are already at the latest version
Abstract
The metabolome is the composition of all molecules present in an organism, metabolomics science allows us to qualitatively and quantitatively analyze metabolites and understand the biochemical state in response to genetic and environmental changes. The purpose of the study was to identify the metabolomic profile of biofluids (saliva and urine) of patients living with HIV/AIDS (PLHIV/AIDS), and establish a possible association of metabolites with periodontal disease (PD). It was an analytical and descriptive study composed of 65 patients seen at the Center for Studies and Care for Special Patients (CEAPE-UNIP), who were divided into 4 predetermined groups (G), G1-PLHIV/AIDS and without PD, G2- PLHIV/Aids and with PD, G3-people without HIV/Aids and without PD, G4-people without HIV/Aids and with PD. The results showed that in relation to urine, G2 has the highest mean area of concentration of metabolites. There are statistically significant differences between G1 and G2. The area of G2 is greater than G3, and greater than G4. There are no differences between G3 and G4, neither between G1 and G3, nor between G1 and G4. Regarding saliva, there are no statistically significant differences when comparing the groups for the mean areas of concentration of metabolites. We conclude that it was possible to distinguish the metabolic profile of PLHIV/Aids with periodontal disease and without periodontal disease, some metabolites are over expressed in PLHIV/Aids and with PD. Most of the metabolites of the carbohydrate group are under expressed in PLHIV/AIDS, even in systemic compensation situations these patients presented a different metabolic profile.
Keywords:
Metabolômica
; Biofluidos
; Metabólitos
; Biomarcadores
; HIV.
1. Introduction
Acquired immunodeficiency syndrome (AIDS) was identified in 1981, its publication in the United States occurred between 1982 and 1983, in this period the human immunodeficiency virus (HIV) was identified. In the beginning it was considered fully associated with homosexuality and prostitution, suffering discrimination and prejudice by the society of the time. AIDS has been associated with another pathology called pneumonia by Pneumocystis, it is a defining disease of AIDS in HIV-infected patients, presents itself as the most common lung disease in this population. HIV transmission occurs mainly through sexual intercourse, also by inoculation of contaminated blood, needles and syringes and vertical transmission (from mother to child). As the HIV virus affects the immune system, the first symptoms and signs of the disease appear, in a more advanced stage, it may progress to progressive and severe consumptive syndrome, with possible evolution to death.[1,2,3,4]
In the ranking of non-communicable diseases, those that affect the oral cavity occupy the first place, according to the World Health Organization (WHO), recent research has shown the relationship of periodontitis with other systemic conditions, including coronary disease, rheumatoid arthritis, Alzheimer's, some types of cancer, respiratory ailments, erectile dysfunction, among others. [5]
A detailed history to obtain information about any comorbidity presented by the individual, previous treatments and medications used, is extremely important, in addition, it is essential to know the Dental Surgeon about the disease, its characteristics and consequences, especially in the oral cavity. Several opportunistic diseases are associated with HIV/AIDS, and in relation to oral diseases, there are a number of bacterial, fungal and viral manifestations, in addition to possible malignancies. It is noteworthy that periodontal disease can appear abruptly, depending on the current profile of the individual's immunity. HIV infection predisposes patients to certain oral health problems, HIV can have a direct action on the pathogenicity of periodontal disease, with or without the development of AIDS. [6,7,8,9]
The metabolome is the composition of all molecules present in an organism, the science of metabolomics allows us to qualitatively and quantitatively analyze the possible metabolites present in cells, organs and organisms and to understand the biochemical state of an organism in response to genetic and environmental changes. Given the evolution of techniques and knowledge about the mechanisms of some pathologies, metabolomics has been used as an effective tool in the diagnosis and identification of metabolites secreted by microorganisms present in the oral cavity. This tool has the role of monitoring the amount of metabolites such as amino acids, lipids and sugars with the exception of DNA, RNA and proteins, being possible to understand the dynamics of diseases in the body. The clinical use of the metabolome for the investigation of saliva and urine is related to the low cost, the possibility of processing the samples and the ease of obtaining this material, since it is a less invasive form when compared to the collection of other biological specimens. [8,10,11,12,13] Concerning the relevance of the study, it can be justified by the fact that no research in the field of metabolomics concerning the relationship between PD and HIV was found.
Through the analytical techniques commonly used in metabolomics, which are liquid or gas chromatography associated or not with mass spectrometry and infrared spectroscopy, it is feasible to study the possible associations of periodontal disease with other systemic conditions, therefore, the objective of the present The aim of this study was to identify the metabolomic profile of biofluids (saliva and urine) of patients living with HIV/AIDS, and to verify a possible association with periodontal disease.
2. Methods and Materials
A total of 118 patients were evaluated, 62 with HIV/AIDS treated at CEAPE (Center for the Study and Care of Special Patients) and 56 patients at the Integrated Clinic of the Dentistry Course at the Universidade Paulista de São Paulo (UNIP - SP). included in the research, with 32 patients diagnosed with HIV/AIDS (seropositive) and 33 without a diagnosis of HIV/AIDS (seronegative), both attended at the CEAPE clinics and the Integrated Clinic of the Dentistry course at the Universidade Paulista de São Paulo (FOUNIP – SP).The study was conducted in such a way that patients were clinically allocated to pre-selected groups, randomly distributed within the respective groups, as follows:
Group 1: patients living with HIV/AIDS and without periodontal disease (n=13).
Group 2: patients living with HIV/AIDS and periodontal disease (n=19).
Group 3: individuals without diagnosis for HIV/AIDS seropositivity and without periodontal disease (n=17).
Group 4: individuals without HIV/AIDS seropositivity diagnosis and with periodontal disease (n=16).
Experimental unit: Patients
Sample size: 65 subjects – Allocated into 4 groups (G1, G2, G3, G4).
This study was conducted in accordance with the Declaration of Helsinki, and the protocol was approved by the Ethics Committee in Research with Human Beings of Universidade Paulista – UNIP, with the number of opinion 4.613.288. Patients were informed about the objectives and conditions of the study, and those who agreed to participate signed the Informed Consent Form (ICF).
Data were collected regarding gender, age, skin color, CD4, viral load, habits, comorbidities, oral diseases, use of medications and time of diagnosis of HIV/AIDS pathology (G1 and G2). Periodontal examination was performed by two examiners (VBCS and ESS), after calibration, and the Kappa calibration coefficient inter and intra examiner were calculated, following all biosafety precepts.
Inclusion criteria: patients living with HIV/AIDS confirmed by laboratory tests (G1 without periodontitis and G2 with periodontitis) and patients without confirmed seropositivity for HIV/AIDS (G3 without periodontitis and G4 with periodontitis), with greater than or equal to 3 mm of clinical probing depth (PS), with bleeding and using oral immunosuppressants prescribed by the physician. Comorbidities were not excluded.
Exclusion criteria: periodontal treatment in the last 6 months (G2 and G4), pregnant women, nursing mothers, patients who had cough, edema in the lower limbs, fever, dyspnea, pulse therapy with prednisone (3 to 5 days), systemic arterial hypertension (SAH) uncontrolled and completely edentulous.
Methodology
Clinical Probing Depth (PS)
Performed with relative isolation, using a millimeter probe from 1 to 10 mm and artificial lighting. The probe was introduced into the marginal gum region and inserted into each tooth, and the measurement was noted by sextant in the clinical record (Periogram - UNIP standard record).
A measurement ≥ 3mm was considered in relation to the probing depth, and when there was bleeding it was classified as the presence of periodontal disease. The criteria also followed the new classification of the American Periodontics Association in relation to the Parameter - Clinical Insertion Level (NIC):
NIC 1-2 mm = incipient - Stage l;
IAS 3-4 mm = moderate – Stage ll;
NIC ≥ 5 mm severe or very severe - Stage lll or lV.
Examiner Calibration
The examiners responsible for the measurements were calibrated prior to the initial examination (intra-examiner Kappa = 0.89 and inter-examiner Kappa = 0.85, respectively). Three patients with periodontitis were evaluated in order to collect PS data, with a 24-hour interval between measurements.
Collection and Storage of Biological Specimens (Saliva and Urine)
All patients were instructed on urine and saliva collections and received a sterile bottle for storage at the UNIP clinic premises.
Volumes between 20 and 40 mL of urine were collected, and samples were stored at – 80º C until the time of analysis.[14]
Regarding saliva, patients were instructed not to eat pasty or hardened foods for 1 hour before collection, as well as not to consume alcoholic beverages for at least 12 hours prior to collection. They could only drink water and had to brush their teeth at least 2 hours before collection. Individuals in each group remained sitting upright, in an airy and calm environment, and the collection of unstimulated saliva was performed by sputum in a disposable plastic tube (Falcon®, Rio de Janeiro) according to the modified Navazesh method.[15] Patients were instructed to expectorate 3 mL of saliva in the plastic tubes and then they were hermetically sealed, transported and stored at -80°C until the time of analysis.[16]
Preparation and Metabolomic Analysis of Samples
The samples were prepared and analyzed in the Mass Spectrometry Laboratory of the Chemical Engineering Department of the Polytechnic School of the University of São Paulo - DEMPSTER Mass Lab. After derivatization and extraction they were injected into a gas chromatograph coupled to a mass spectrometer (GC-MS).
The analysis methodology was developed in the laboratory itself by the team of chemists, chemical engineers and dental surgeons involved in a previous study, by BARNES et al.[17]
Urine:
After thawing the samples at room temperature, 1000 µL of urine was transferred to a 1.5 mL plastic tube (Eppendorf, Germany), by means of an automatic micropipette (Biohit, 100 to 1000 µL, Brazil); The samples were dried in Speedvac apparatus (Centrivap concentrator, Labconco, Brazil) for a period of 2h, or until complete drying. After the drying process, the compounds were extracted (Figure 1), in two steps.
In the first step, 1.0 mL of methanol was added to a plastic tube containing the dry sample, for the extraction of polar molecules, agitated in a vortex-type shaker (model AP59, Phoenic Luferco, 3800 rpm, Brazil) for 2 minutes, and centrifuged in a laboratory centrifuge (model 800-1, 13000 rpm, Brazil) for 5 minutes; The supernatant product of this reaction was transferred to a new plastic tube, dried in a Speedvac apparatus and resuspended in 250 µL of methanol; The new supernatant product was transferred to a transparent 2 mL Vial tube (CMS 123TAT, Brazil) with stripe, for subsequent injection of 2 µL of the sample into a gas chromatograph coupled to a mass spectrometer (GC-MS, QP 2010 Plus, Shimadzu do Brasil), DB-1 column, 50 m long, internal diameter of 0.32 mm and film thickness of 1.20 µm (Figure 2).
The second stage consisted of a new extraction followed by derivatization with hexane to extract the nonpolar molecules present in the urine. 1 mL of hexane was added to the sample in the plastic tube and stirred on a vortex shaker for 2 seconds. 200 µL of 2 N methanolic sodium hydroxide solution was added and a new stirring was made. The tube was placed for 20 seconds in a bath at 50°C and stirred manually for one minute. 200 µL of methanolic hydrochloric acid (2N) solution was added and a new stirring in a vortex agitator was performed for 2 seconds, followed by centrifugation. There was the formation of two phases, the upper phase being the organic layer that contained esterified lipids solubilized in hexane. The supernatant product of this reaction was transferred to a new eppendorf, dried in Speedvac apparatus and resuspended in 250 µL of hexane. The new supernatant product was transferred to a Vial tube, via an electronic micropipette for further GC-MS analysis, under the same previous conditions (Figure 3).
Spittle
First, 300 µL of saliva samples were dried in a vacuum centrifuge (Labconco Centrivap Concentrator, Kansas City, MI, USA). The metabolites were extracted by adding 300 µL of methanol containing methionine sulfonate as an internal standard and shaken (LCG Vortex Mixer, Taiwan, China) for 2 min, and the supernatant was dried in a vacuum centrifuge. After extraction, derivatization was performed by adding 100 µL of a solution with proportions (1:1) of N-methyl-N-(trimethylsilyl)trifluoroacetamide and a solvent solution: acetonitrile/dichloromethane/cyclohexane (5:4:1) and 5% trimethylamine. The samples were stirred for 30 s and then kept in a thermal bath (Nova Instruments NI 1225, Piracicaba, Brazil) at 60º C for 1 h. Then, the samples were centrifuged (Eppendorf Mini Spin, Hamburg, Germany) at 12,044 × g for 2 min. The supernatant was analyzed via GC-MS. The obtained data were processed using the GC MS solution and the metabolites identified using the smart metabolite database version 4.2 (Figure 4).
GC-MS Analysis Conditions:
• Samples were analyzed under the following conditions:
Injector temperature: 280°C
Initial column temperature: 50°C
Heating rate: 5°C per min up to 300°C, remaining at this temperature for 10 min.
Total running time: 60 min
Ionization source temperature: 300°C
Solvent cut: 5 min
Interface temperature: 290°C
We obtained a total ion chromatogram (TIC) with mass range of 40 to 600 Da.
Results
Sociodemographic Aspects and Clinical Parameters
Regarding the sociodemographic aspects, the patients in groups G1 and G2 totaled 32, being 90.5% male and 9.5% female. With regard to race, 62.5% were leukoderms and 37.5% were melanoderms. The age range of these groups ranged from 20 to 68 years (mean age 48 years). Regarding habits, 25% were ethyl, 6% were smokers and 13% were smokers/ethyl. Regarding comorbidities, it was found that 3.12% had Herpes Zoster, 3.12% Syphilis, 3.12% Hepatitis B and 3.12% Hepatitis C (Table 1).
In group G1 the probing depth ranged between 1mm (smallest pouch) and 3mm (largest pouch), without bleeding, and in group G2 the probing depth ranged between 4mm (smallest pouch) and 9mm (largest pouch), with bleeding (Table 1).
In groups G3 and G4, the total number of patients was 33, 48% male and 52% female. Of these patients, 79% were leukoderms and 21% were melanoderms. The age group of these groups ranged from 22 to 74 years (mean age 47 years); 12% reported being smokers and 18% reported having hypertension (Table 1).
In group G3 the probing depth ranged between 1mm (smallest pouch) and 3mm (largest pouch), without bleeding, and in group G4 the probing depth ranged between 3mm (smallest pouch) and 8mm (largest pouch), with bleeding (Table 1).
Metabolomic Analysis
Origin Pro and Statistica 12 software were used to generate the graphs and statistical analyses. We used the Anova techniques with Fisher's LSD test a posteriori, to compare the areas between the groups, variable that is directly proportional to the concentrations of each metabolite.
We built the Venn Diagram to identify the metabolites trivial to the groups and the unique metabolites. The chi-square test was also performed to compare single metabolites between groups at different time points.
Urine
The values in parentheses at the top of the graph are the degrees of freedom of the analysis and F is the F statistic.

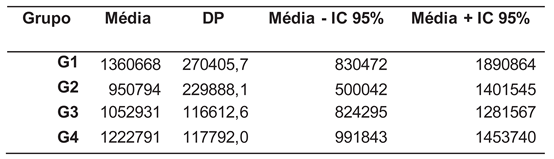
Table 2.
Means, standard deviation (SD), the lower and upper limits of the 95% confidence interval around the mean for metabolites present in urine.
Table 2.
Means, standard deviation (SD), the lower and upper limits of the 95% confidence interval around the mean for metabolites present in urine.
| Group | Grade | DP | Average - IC 95% | Average + IC 95% |
|---|---|---|---|---|
| G1 | 839049 | 163116.3 | 519268 | 1158831 |
| G2 | 1584567 | 126826.4 | 1335930 | 1833204 |
| G3 | 1040023 | 139487.8 | 766539 | 1313507 |
| G4 | 1191700 | 141962.7 | 913364 | 1470037 |
In the urine analysis (Figure 5), we can observe that group 2 has the largest area. It is evident from the statistical analyses that there are significant differences between G1 and G2 (p =0.0003), with G2 being greater than G1. The area of G2 is greater than G3 (p =0.003) and greater than G4 (p =0.034). There are no significant differences between the areas of G3 and G4 (p =0.427), nor between G1 and G3 (p =0.341) and G1 and G4 (p =0.09). Evaluating the graph, the greater the degree of freedom (value above the graph), the greater the differences between the means, and the p value indicates that there is at least one difference between the means. The other p values are found with the a posteriori test, as it will indicate which means differ from each other, and it is only performed if the first p value is significant. For the case of urine, we found a value of p = 0.001 (p <0.05 considered the reference value for statistical significance), thus confirming the differences between groups.
The 25 most representative metabolites were listed in terms of area in each group, and compared via a venn diagram (Figure 6). This analysis allowed identifying which metabolites were present in each group, and how many and which metabolites the groups shared with each other.
Table 3.
Frequencies in the Venn diagram.
| Group | Number of metabolites | Number of unique metabolites |
|---|---|---|
| G1 | 878 | 123 |
| G2 | 1453 | 196 |
| G3 | 1300 | 346 |
| G4 | 1256 | 274 |
| Number of unique metabolites | 486 | |
Spittle
The values in parentheses at the top of the graph are the degrees of freedom of the analysis and F is the F statistic.
Table 4.
Means, standard deviation (SD), the lower and upper limits of the 95% confidence interval around the mean for metabolites present in urine.
Table 4.
Means, standard deviation (SD), the lower and upper limits of the 95% confidence interval around the mean for metabolites present in urine.
 |
Regarding saliva analysis (Figure 7) we can observe that group 1 has the largest area, however, from the statistical calculations there were no statistically significant differences between the areas of the groups (p =0.376). To test whether the differences in the tables in Appendix A were statistically significant, we used the Chi-square test and found that there are statistically significant differences between the number of unique metabolites in each group (X2 =71.84, GL=3, p <0.00001).
The 25 most representative metabolites were listed in terms of area in each group, and compared via a venn diagram (Figure 8). This analysis allowed identifying which metabolites were present in each group, and how many and which metabolites the groups shared with each other.
Table 5.
Frequencies in the Venn diagram.
| Group | Number of metabolites | Number of unique metabolites |
|---|---|---|
| G1 | 1092 | 468 |
| G2 | 2244 | 469 |
| G3 | 1300 | 346 |
| G4 | 1254 | 273 |
| Number of unique metabolites | 941 | |
In urine, 4 metabolites are repeated in the 4 groups, identified in Table 6.
In saliva, 31 metabolites are repeated, but the metabolites that appear in groups with HIV (G1 and G2) do not appear in groups without HIV (G3 and G4), where G3 is the control group, therefore, 17 metabolites are repeated in groups G1 and G2 and 14 metabolites are repeated in groups G3 and G4. Identified in Table 7.
Discussion
Metabolomic analysis was applied in the present study to determine metabolites that corroborate possible associations between HIV/AIDS and periodontal disease (PD). of the diseases studied in the research and the opportunity to analyze the causal relationships between these metabolites and the evolution of both diseases, substantiating the bidirectional relationship between them, through the recognition of these metabolites, it was possible to estimate the variation in their concentrations, and through from systems biology analysis, to verify how these metabolic pathways were altered by both diseases.[8,18,19,20]
We analyzed biological samples (saliva and urine), which showed great variability, either due to changes in the metabolic processes of patients systemically compromised or even due to the use of medication, which favored the emergence of some atypical results observed in the analyses.
Barnes et al.[17] demonstrated that estimates of biofluid metabolites are important to draw a phenotypic profile of certain individuals in relation to the predisposition to manifest or not certain pathologies. Saude, Sykes [21], corroborate with the validation of studies the use of saliva and urine samples, due to the ease of collection and their nature rich in metabolites, which are constantly used as biofluids for research in humans and animals.
Studies such as that of Ryder et al. [22], show us the relevance of HIV/AIDS infection in relation to the increased risk of opportunistic infections, especially those associated with oral and periodontal disorders, with oral manifestations being the first clinical presentations and periodontal disease one of the main most prevalent oral disorders in patients infected with HIV/AIDS.
Patients who are on ART/HAART, due to the presence of antigens and activation of the immune system, are in a systemic inflammatory state, predisposing them to periodontal disease (PD). Microbiota-derived metabolites influence molecular and cellular processes and modulate immune system maturation at the tissue level. Inflammatory and immunological reactions correspond to most of the tissue lesions observed in PD.[23,24,25] The results observed (Figure 5 and Figure 7), corroborate these statements, as they demonstrate that groups 1 and 2 have larger areas of metabolites in relation to their concentrations, and most are fatty acids, which are precursors of arachidonic acid, an important anti-inflammatory agent. In salivary analysis, among the 25 most significant metabolites, palmitic acid was found to be present, which shows that perhaps, patients living with HIV/AIDS (PVHIV/AIDS) because they are under art/HAART, may have a higher expression of this metabolite in the inflammatory pathways of the body, it was observed in higher concentration in PVHIV/AIDS and with PD, (G2).
Corroborating the studies of Çiçek et al.[26], our results showed that the concentration of poly and monounsaturated carboxylic acids presents as altered in inflamed gingival tissues (G1 and G2).
Another metabolite in high concentration was proline, which is associated with collagen degradation and is shown to inhibit metalloproteinases. Some microorganisms present in periodontal lesions are more proteolytic than others and can produce these amino acids. According to Barnes et al.[17] and Luchian et al.[27], is the imbalance between the active form of matrix metalloproteins and their endogenous inhibitors that promote pathological collapse of the extracellular matrix. In addition, the fact that some patients presented comorbities and are immunocompromised shows that some metabolites found, such as proline, may also be related to the systemic diseases and not only to periodontal disease [13]. Some individuals were smokers, ethyl/smokers and presented high blood pressure, and the effect of this occurrence is much more related to the presence of oral lesions rather than the type and amount of metabolites found.
One fact that was quite highlighted in groups 3 and 4, is that all 25 of the most significant metabolites present in saliva were also present in urine. From this data it can be inferred that because they are groups of patients not diagnosed with HIV/AIDS, no metabolic process suppresses or enhances the formation of more metabolites. However, as for the quantification of each of them, it is possible to verify differences in their concentrations.
Finally, some groups did not show results with large statistical differences, given that the sample number was small with a calculation of sample power of 68%, this was due to the fact that all collections were carried out during the COVID 19 pandemic period, and because we have a sample classified as a risk population, also the number of metabolites found was large spectrum and we only selected the 25 with the highest concentration for each group. It is suggested, therefore, that the continuity of this study happens, thus increasing the number of participants in each group, also the possibilities of new discoveries.
Conclusions
We concluded that from the metabolomic analysis it was possible to distinguish the biomarkers of patients living with HIV/AIDS with periodontal disease and without periodontal disease;
Some metabolites such as amino acids, carboxylic acids and fatty acids were over expressed in patients living with HIV/AIDS and periodontal disease;
Most metabolites in the carbohydrate group were under expressed in patients living with HIV/AIDS, showing that even in systemic compensation situations these patients have a different metabolic profile.
Funding
This study was financed in part by the Coordenação de Aperfeiçoamento de Pessoal de Nível Superior - Brasil (CAPES) - Finance Code 001".
Conflicts of Interest
Authors declare no conflict of interest.
Appendix A - Urine
25 most representative metabolites in terms of area in each urine group
GROUP G1
Table A1.
The 25 metabolites with the largest area in the G1 group, p<0.0001 (i.e., there are
statistically significant differences).
Table A1.
The 25 metabolites with the largest area in the G1 group, p<0.0001 (i.e., there are
statistically significant differences).
| Metabólito | Média | DP | ||
|---|---|---|---|---|
| 1,3,5-Triazine, 2,4,6-tris[(trimethylsilyl)oxy]- | 8865952 | 710467 | ||
| Propanoic acid, 2-[(trimethylsilyl)oxy]-, trimethylsilyl ester | 6207136 | 653534 | ||
| N-Ethyl-5-propyl-5-nonanamine | 5473310 | 1666193 | ||
| Hexadecanoic acid, 2,3-bis[(trimethylsilyl)oxy]propyl ester | 4234076 | 745144 | ||
| Glycine, N-(trimethylsilyl)-, trimethylsilyl ester | 4222151 | 710467 | ||
| Ethanimidic acid, N-(trimethylsilyl)-, trimethylsilyl ester | 3913242 | 1360441 | ||
| Bis(trimethylsilyl)monostearin | 3646899 | 745144 | ||
| L-Proline, 1-(trimethylsilyl)-, trimethylsilyl ester | 3594686 | 745144 | ||
| 2,4,6-Tri-t-butylbenzenethiol | 2639443 | 1666193 | ||
| Benzonitrile, 4-(2-methyl-1,3-dioxolan-2-yl)- | 2623687 | 462119 | ||
| D-Glucose, 4-O-[2,3,4,6-tetrakis-O-(trimethylsilyl)-.beta.-D-galactopyranosyl]-2,3,5,6-tetrakis-O-(trimethylsilyl)- | 2623670 | 1666193 | ||
| Urea, N,N'-bis(trimethylsilyl)- | 2614503 | 453480 | ||
| l-Alanine, N-(trimethylsilyl)-, trimethylsilyl ester | 2521168 | 785451 | ||
| Octadecanoic acid, trimethylsilyl ester | 2429429 | 745144 | ||
| Glucose, pentakis-O-trimethylsilyl- | 2187543 | 1666193 | ||
| Pentanoic acid, 5-[bis(trimethylsilyl)amino]-, trimethylsilyl ester | 1907578 | 785451 | ||
| 1-(3-Methylbutyl)-2,3,4,6-tetramethylbenzene | 1468944 | 1053793 | ||
| 3-(3,5-di-tert-butyl-4-hydroxyphenyl)propionic acid | 1407772 | 1053793 | ||
| .alpha.-D-Glucopyranoside, 1,3,4,6-tetrakis-O-(trimethylsilyl)-.beta.-D-fructofuranosyl 2,3,4,6-tetrakis-O-(trimethylsilyl)- | 1350668 | 555398 | ||
| L-Valine, N-(trimethylsilyl)-, trimethylsilyl ester | 1059684 | 833096 | ||
| 3-Diazo-1-methyl-1,3-dihydro-indol-2-one | 978722 | 2356352 | ||
| .beta.-L-Mannopyranose, 6-deoxy-1,2,3,4-tetrakis-O-(trimethylsilyl)- | 792553 | 480988 | ||
| Glucopyranose pentaTMS | 791134 | 1666193 | ||
| Hexadecanoic acid, trimethylsilyl ester | 790838 | 745144 | ||
| Benzene, 1-(1,3-dimethyl-3-butenyl)-4-fluoro- | 744349 | 1053793 | ||
GROUP 2
Table A2.
The 25 metabolites with the largest area in the G2 group, p<0.0001.
| Metabólito | Média | DP | ||
|---|---|---|---|---|
| D-Glucopyranose, 4-O-[2,3,4,6-tetrakis-O-(trimethylsilyl)-.beta.-D-galactopyranosyl]-1,2,3,6-tetrakis-O-(trimethylsilyl)- | 54130868 | 3646427 | ||
| Talose, 2,3,4,5,6-pentakis-O-(trimethylsilyl)- | 43096150 | 3646427 | ||
| D-Fructose, 1,3,4,5,6-pentakis-O-(trimethylsilyl)- | 32580927 | 2578413 | ||
| .beta.-D-Galactofuranose, 1,2,3,5,6-pentakis-O-(trimethylsilyl)- | 27413320 | 3646427 | ||
| .beta.-D-Glucopyranose, 1,2,3,4,6-pentakis-O-(trimethylsilyl)- | 26772088 | 2578413 | ||
| D-Mannopyranose, 1,2,3,4,6-pentakis-O-(trimethylsilyl)- | 21864900 | 3646427 | ||
| Arabinofuranose, 1,2,3,5-tetrakis-O-(trimethylsilyl)- | 20942458 | 3646427 | ||
| D-Glucose, 4-O-[2,3,4,6-tetrakis-O-(trimethylsilyl)-.beta.-D-galactopyranosyl]-2,3,5,6-tetrakis-O-(trimethylsilyl)- | 15713470 | 2105265 | ||
| Propanoic acid, 2-[(trimethylsilyl)oxy]-, trimethylsilyl ester | 14436441 | 1153101 | ||
| Maltose, octakis(trimethylsilyl)- | 12848208 | 3646427 | ||
| D-Fructose, 6-O-[2,3,4,6-tetrakis-O-(trimethylsilyl)-.alpha.-D-glucopyranosyl]-1,3,4,5-tetrakis-O-(trimethylsilyl)- | 11735572 | 3646427 | ||
| D-Galactose, 2,3,4,5,6-pentakis-O-(trimethylsilyl)- | 10441678 | 1718942 | ||
| D-Glucose, 4-O-[2,3,4,6-tetrakis-O-(trimethylsilyl)-.beta.-D-glucopyranosyl]-2,3,5,6-tetrakis-O-(trimethylsilyl)- | 9125283 | 3646427 | ||
| 1,3,5-Triazine, 2,4,6-tris[(trimethylsilyl)oxy]- | 8417359 | 1183057 | ||
| Acrylic acid, 2,3-bis[(trimethylsilyl)oxy]-, trimethylsilyl ester | 5871478 | 3646427 | ||
| Hexadecanoic acid, 2,3-bis[(trimethylsilyl)oxy]propyl ester | 4725717 | 1250714 | ||
| Bis(trimethylsilyl)monostearin | 4703488 | 1331487 | ||
| Benzonitrile, 4-(2-methyl-1,3-dioxolan-2-yl)- | 4516857 | 897688 | ||
| Ethanimidic acid, N-(trimethylsilyl)-, trimethylsilyl ester | 4203803 | 3646427 | ||
| .alpha.-D-Glucopyranoside, 1,3,4,6-tetrakis-O-(trimethylsilyl)-.beta.-D-fructofuranosyl 2,3,4,6-tetrakis-O-(trimethylsilyl)- | 3834960 | 795716 | ||
| D-Turanose, heptakis(trimethylsilyl)- | 3732689 | 1250714 | ||
| Urea, N,N'-bis(trimethylsilyl)- | 2828885 | 701755 | ||
| Octadecanoic acid, trimethylsilyl ester | 2211092 | 1183057 | ||
| Glucose, pentakis-O-trimethylsilyl- | 2187543 | 2578413 | ||
| Glycine, N-(trimethylsilyl)-, trimethylsilyl ester | 2140387 | 1488647 | ||
GROUP 3
Table A3.
The 25 metabolites with the largest area in the G3 group, p<0.0001.
| Metabólito | Média | DP |
|---|---|---|
| .beta.-D-Galactofuranose, 1,2,3,5,6-pentakis-O-(trimethylsilyl)- | 64909445 | 3638542 |
| D-Fructose, 1,3,4,5,6-pentakis-O-(trimethylsilyl)- | 50559713 | 2572838 |
| Talose, 2,3,4,5,6-pentakis-O-(trimethylsilyl)- | 45271460 | 3638542 |
| .beta.-D-Glucopyranose, 1,2,3,4,6-pentakis-O-(trimethylsilyl)- | 43726768 | 2100713 |
| D-Glucose, 4-O-[2,3,4,6-tetrakis-O-(trimethylsilyl)-.beta.-D-glucopyranosyl]-2,3,5,6-tetrakis-O-(trimethylsilyl)- | 38610758 | 2572838 |
| Hexopyranose, 1,2,3,4,6-pentakis-O-(trimethylsilyl)- | 24080346 | 3638542 |
| D-Glucopyranose, 4-O-[2,3,4,6-tetrakis-O-(trimethylsilyl)-.beta.-D-galactopyranosyl]-1,2,3,6-tetrakis-O-(trimethylsilyl)- | 15958348 | 2100713 |
| Inosose-2, 1,3,4,5,6-pentakis-O-(trimethylsilyl)-, myo- | 15513174 | 3638542 |
| D-Ribofuranose, 1,2,3,5-tetrakis-O-(trimethylsilyl)- | 13662867 | 3638542 |
| Maltose, octakis(trimethylsilyl)- | 13546098 | 2572838 |
| Propanoic acid, 2-[(trimethylsilyl)oxy]-, trimethylsilyl ester | 10854091 | 1097062 |
| Dihydroxyacetone dimer, tetra(trimethylsilyl)- | 7785312 | 3638542 |
| D-Xylopyranose, 1,2,3,4-tetrakis-O-(trimethylsilyl)- | 7544071 | 3638542 |
| (.+/-.)-2,3-Butanediol diTMS | 6635889 | 3638542 |
| Benzonitrile, 4-(2-methyl-1,3-dioxolan-2-yl)- | 6302249 | 758688 |
| .alpha.-L-Galactofuranose, 6-deoxy-1,2,3,5-tetrakis-O-(trimethylsilyl)- | 5392053 | 3638542 |
| D-Turanose, heptakis(trimethylsilyl)- | 5341013 | 1009150 |
| Phenol, 2,4-bis(1,1-dimethylethyl)- | 4607213 | 2572838 |
| Glucofuranoside, methyl 2,3,5,6-tetrakis-O-(trimethylsilyl)-, .alpha.-D- | 4213623 | 2572838 |
| .alpha.-D-Glucopyranoside, 1,3,4,6-tetrakis-O-(trimethylsilyl)-.beta.-D-fructofuranosyl 2,3,4,6-tetrakis-O-(trimethylsilyl)- | 4080467 | 813603 |
| 2,4,6-Tri-t-butylbenzenethiol | 2836874 | 1375240 |
| Ethanimidic acid, N-(trimethylsilyl)-, trimethylsilyl ester | 2836511 | 1819271 |
| Ethylbis(trimethylsilyl)amine | 2601776 | 3638542 |
| L-Proline, 1-(trimethylsilyl)-, trimethylsilyl ester | 2498879 | 1819271 |
| 2,6-Octadiene, 3,7-dimethyl-1-(hydroxydimethylsilyl)-1-(trimethylsilyl)- | 2206954 | 3638542 |
GROUP 4
Table A4.
The 25 metabolites with the largest area in the G4 group, p<0.0001.
| Metabólito | Média | DP |
|---|---|---|
| D-Glucopyranose, 4-O-[2,3,4,6-tetrakis-O-(trimethylsilyl)-.beta.-D-galactopyranosyl]-1,2,3,6-tetrakis-O-(trimethylsilyl)- | 54130868 | 4002282 |
| Talose, 2,3,4,5,6-pentakis-O-(trimethylsilyl)- | 43096150 | 4002282 |
| D-Glucose, 4-O-[2,3,4,6-tetrakis-O-(trimethylsilyl)-.beta.-D-galactopyranosyl]-2,3,5,6-tetrakis-O-(trimethylsilyl)- | 41893070 | 4002282 |
| D-Fructose, 1,3,4,5,6-pentakis-O-(trimethylsilyl)- | 32580927 | 2830041 |
| .beta.-D-Galactofuranose, 1,2,3,5,6-pentakis-O-(trimethylsilyl)- | 27413320 | 4002282 |
| .beta.-D-Glucopyranose, 1,2,3,4,6-pentakis-O-(trimethylsilyl)- | 26772088 | 2830041 |
| D-Mannopyranose, 1,2,3,4,6-pentakis-O-(trimethylsilyl)- | 21864900 | 4002282 |
| Arabinofuranose, 1,2,3,5-tetrakis-O-(trimethylsilyl)- | 20942458 | 4002282 |
| Maltose, octakis(trimethylsilyl)- | 12848208 | 4002282 |
| D-Fructose, 6-O-[2,3,4,6-tetrakis-O-(trimethylsilyl)-.alpha.-D-glucopyranosyl]-1,3,4,5-tetrakis-O-(trimethylsilyl)- | 11735572 | 4002282 |
| D-Galactose, 2,3,4,5,6-pentakis-O-(trimethylsilyl)- | 9490839 | 1789875 |
| Propanoic acid, 2-[(trimethylsilyl)oxy]-, trimethylsilyl ester | 9218777 | 1069655 |
| D-Glucose, 4-O-[2,3,4,6-tetrakis-O-(trimethylsilyl)-.beta.-D-glucopyranosyl]-2,3,5,6-tetrakis-O-(trimethylsilyl)- | 9125283 | 4002282 |
| 1,3,5-Triazine, 2,4,6-tris[(trimethylsilyl)oxy]- | 8596650 | 1033385 |
| D-Turanose, heptakis(trimethylsilyl)- | 7561628 | 2001141 |
| .alpha.-D-Glucopyranoside, 1,3,4,6-tetrakis-O-(trimethylsilyl)-.beta.-D-fructofuranosyl 2,3,4,6-tetrakis-O-(trimethylsilyl)- | 6501577 | 1155359 |
| Acrylic acid, 2,3-bis[(trimethylsilyl)oxy]-, trimethylsilyl ester | 5871478 | 4002282 |
| Hexadecanoic acid, 2,3-bis[(trimethylsilyl)oxy]propyl ester | 5513926 | 1033385 |
| Benzonitrile, 4-(2-methyl-1,3-dioxolan-2-yl)- | 4065195 | 743205 |
| Bis(trimethylsilyl)monostearin | 3612728 | 1069655 |
| 2,4,6-Tri-t-butylbenzenethiol | 3550449 | 2310719 |
| Glucose, pentakis-O-trimethylsilyl- | 2902541 | 4002282 |
| Ethanimidic acid, N-(trimethylsilyl)-, trimethylsilyl ester | 2629166 | 2830041 |
| 1H-Indole-3-methanamine, N,N-dimethyl- | 2593132 | 4002282 |
| L-Proline, 1-(trimethylsilyl)-, trimethylsilyl ester | 2582950 | 1415021 |
Appendix B - Spittle
25 most representative metabolites in terms of area in each saliva group
GROUP 1
Table A5.
The 25 metabolites with the largest area in the G1 group, p=0.993 (i.e., there are no statistically significant differences).
Table A5.
The 25 metabolites with the largest area in the G1 group, p=0.993 (i.e., there are no statistically significant differences).
| Metabólito | Média | DP | ||
|---|---|---|---|---|
| Galactose-meto-5TMS(2) | 28932614 | 4670991 | ||
| Glucose-meto-5TMS(2) | 28614032 | 4670991 | ||
| Isomaltose-meto-8TMS(2) | 17457895 | 4670991 | ||
| 1,6-Anhydroglucose-3TMS | 15798295 | 4670991 | ||
| Glycine-3TMS | 13662378 | 4670991 | ||
| Mannitol-6TMS | 13361370 | 4670991 | ||
| Citric acid-4TMS | 11716427 | 4670991 | ||
| Serine-3TMS | 11041226 | 3813848 | ||
| Isocitric acid-4TMS | 10433067 | 6605779 | ||
| Isoleucine-2TMS | 9334604 | 4670991 | ||
| Arabitol-5TMS | 7824703 | 4670991 | ||
| Vanilmandelic acid-3TMS | 5070400 | 6605779 | ||
| Threonic acid-4TMS | 5030182 | 4670991 | ||
| Glycine-2TMS | 4960489 | 3813848 | ||
| 2-Aminoethanol-3TMS | 4061667 | 3813848 | ||
| Cysteine-3TMS | 3912423 | 4670991 | ||
| Sucrose-8TMS | 3640156 | 4670991 | ||
| Palmitic acid-TMS | 3057804 | 4670991 | ||
| 4-Hydroxyphenyllactic acid-3TMS | 3035529 | 6605779 | ||
| Threitol-4TMS | 2941068 | 4670991 | ||
| 2-Deoxy-glucose-4TMS(1) | 2783354 | 4670991 | ||
| Ribonic acid-5TMS | 2650150 | 6605779 | ||
| Alanine-2TMS | 2616988 | 6605779 | ||
| Glucuronic acid-meto-5TMS(2) | 2598801 | 6605779 | ||
| 2-Hydroxyglutaric acid-3TMS | 2564823 | 4670991 | ||
GROUP 2
Table A6.
The 25 metabolites with the largest area in the G2 group, p=0.999, there are no statistically significant differences.
Table A6.
The 25 metabolites with the largest area in the G2 group, p=0.999, there are no statistically significant differences.
| Metabólito | Média | DP | ||
|---|---|---|---|---|
| Proline-2TMS | 28353197 | 5674798 | ||
| Mannitol-6TMS | 16556688 | 2537847 | ||
| 1,6-Anhydroglucose-3TMS | 13358231 | 2537847 | ||
| Glucose-meto-5TMS(2) | 13022293 | 2837399 | ||
| Palmitic acid-TMS | 8594207 | 3276346 | ||
| Citric acid-4TMS | 6910706 | 2837399 | ||
| Leucine-2TMS | 6263040 | 3276346 | ||
| Cadaverine-3TMS | 5831356 | 2837399 | ||
| Isocitric acid-4TMS | 5369195 | 4012688 | ||
| Vanilmandelic acid-3TMS | 5084182 | 5674798 | ||
| 2-Hydroxyglutaric acid-3TMS | 3877160 | 5674798 | ||
| Serine-3TMS | 3833007 | 3276346 | ||
| Indol-3-acetic acid-2TMS | 3719565 | 5674798 | ||
| Threonic acid-4TMS | 3291717 | 3276346 | ||
| Aconitic acid-3TMS | 3193806 | 5674798 | ||
| meso-Erythritol-4TMS | 2222647 | 3276346 | ||
| Arabitol-5TMS | 2075037 | 2537847 | ||
| Sucrose-8TMS | 2074208 | 2837399 | ||
| Isoleucine-2TMS | 2014361 | 3276346 | ||
| Cysteine-3TMS | 1973099 | 2837399 | ||
| Threitol-4TMS | 1911564 | 3276346 | ||
| Threonine-3TMS | 1525751 | 4012688 | ||
| 4-Hydroxyphenylacetic acid-2TMS | 1353572 | 5674798 | ||
| Glucuronic acid-meto-5TMS(2) | 1297058 | 4012688 | ||
| Ribonic acid-5TMS | 1296552 | 4012688 | ||
GROUP 3
Table A7.
The 25 metabolites with the largest area in the G3 group, p<0.0001.
| Metabólito | Média | DP |
|---|---|---|
| .beta.-D-Galactofuranose, 1,2,3,5,6-pentakis-O-(trimethylsilyl)- | 64909445 | 3638542 |
| D-Fructose, 1,3,4,5,6-pentakis-O-(trimethylsilyl)- | 50559713 | 2572838 |
| Talose, 2,3,4,5,6-pentakis-O-(trimethylsilyl)- | 45271460 | 3638542 |
| .beta.-D-Glucopyranose, 1,2,3,4,6-pentakis-O-(trimethylsilyl)- | 43726768 | 2100713 |
| D-Glucose, 4-O-[2,3,4,6-tetrakis-O-(trimethylsilyl)-.beta.-D-glucopyranosyl]-2,3,5,6-tetrakis-O-(trimethylsilyl)- | 38610758 | 2572838 |
| Hexopyranose, 1,2,3,4,6-pentakis-O-(trimethylsilyl)- | 24080346 | 3638542 |
| D-Glucopyranose, 4-O-[2,3,4,6-tetrakis-O-(trimethylsilyl)-.beta.-D-galactopyranosyl]-1,2,3,6-tetrakis-O-(trimethylsilyl)- | 15958348 | 2100713 |
| Inosose-2, 1,3,4,5,6-pentakis-O-(trimethylsilyl)-, myo- | 15513174 | 3638542 |
| D-Ribofuranose, 1,2,3,5-tetrakis-O-(trimethylsilyl)- | 13662867 | 3638542 |
| Maltose, octakis(trimethylsilyl)- | 13546098 | 2572838 |
| Propanoic acid, 2-[(trimethylsilyl)oxy]-, trimethylsilyl ester | 10854091 | 1097062 |
| Dihydroxyacetone dimer, tetra(trimethylsilyl)- | 7785312 | 3638542 |
| D-Xylopyranose, 1,2,3,4-tetrakis-O-(trimethylsilyl)- | 7544071 | 3638542 |
| (.+/-.)-2,3-Butanediol diTMS | 6635889 | 3638542 |
| Benzonitrile, 4-(2-methyl-1,3-dioxolan-2-yl)- | 6302249 | 758688 |
| .alpha.-L-Galactofuranose, 6-deoxy-1,2,3,5-tetrakis-O-(trimethylsilyl)- | 5392053 | 3638542 |
| D-Turanose, heptakis(trimethylsilyl)- | 5341013 | 1009150 |
| Phenol, 2,4-bis(1,1-dimethylethyl)- | 4607213 | 2572838 |
| Glucofuranoside, methyl 2,3,5,6-tetrakis-O-(trimethylsilyl)-, .alpha.-D- | 4213623 | 2572838 |
| .alpha.-D-Glucopyranoside, 1,3,4,6-tetrakis-O-(trimethylsilyl)-.beta.-D-fructofuranosyl 2,3,4,6-tetrakis-O-(trimethylsilyl)- | 4080467 | 813603 |
| 2,4,6-Tri-t-butylbenzenethiol | 2836874 | 1375240 |
| Ethanimidic acid, N-(trimethylsilyl)-, trimethylsilyl ester | 2836511 | 1819271 |
| Ethylbis(trimethylsilyl)amine | 2601776 | 3638542 |
| L-Proline, 1-(trimethylsilyl)-, trimethylsilyl ester | 2498879 | 1819271 |
| 2,6-Octadiene, 3,7-dimethyl-1-(hydroxydimethylsilyl)-1-(trimethylsilyl)- | 2206954 | 3638542 |
GROUP 4
Table A8.
The 25 metabolites with the largest area in the G4 group, p<0.0001.
| Metabólito | Média | DP |
|---|---|---|
| D-Glucopyranose, 4-O-[2,3,4,6-tetrakis-O-(trimethylsilyl)-.beta.-D-galactopyranosyl]-1,2,3,6-tetrakis-O-(trimethylsilyl)- | 54130868 | 4002282 |
| Talose, 2,3,4,5,6-pentakis-O-(trimethylsilyl)- | 43096150 | 4002282 |
| D-Glucose, 4-O-[2,3,4,6-tetrakis-O-(trimethylsilyl)-.beta.-D-galactopyranosyl]-2,3,5,6-tetrakis-O-(trimethylsilyl)- | 41893070 | 4002282 |
| D-Fructose, 1,3,4,5,6-pentakis-O-(trimethylsilyl)- | 32580927 | 2830041 |
| .beta.-D-Galactofuranose, 1,2,3,5,6-pentakis-O-(trimethylsilyl)- | 27413320 | 4002282 |
| .beta.-D-Glucopyranose, 1,2,3,4,6-pentakis-O-(trimethylsilyl)- | 26772088 | 2830041 |
| D-Mannopyranose, 1,2,3,4,6-pentakis-O-(trimethylsilyl)- | 21864900 | 4002282 |
| Arabinofuranose, 1,2,3,5-tetrakis-O-(trimethylsilyl)- | 20942458 | 4002282 |
| Maltose, octakis(trimethylsilyl)- | 12848208 | 4002282 |
| D-Fructose, 6-O-[2,3,4,6-tetrakis-O-(trimethylsilyl)-.alpha.-D-glucopyranosyl]-1,3,4,5-tetrakis-O-(trimethylsilyl)- | 11735572 | 4002282 |
| D-Galactose, 2,3,4,5,6-pentakis-O-(trimethylsilyl)- | 9490839 | 1789875 |
| Propanoic acid, 2-[(trimethylsilyl)oxy]-, trimethylsilyl ester | 9218777 | 1069655 |
| D-Glucose, 4-O-[2,3,4,6-tetrakis-O-(trimethylsilyl)-.beta.-D-glucopyranosyl]-2,3,5,6-tetrakis-O-(trimethylsilyl)- | 9125283 | 4002282 |
| 1,3,5-Triazine, 2,4,6-tris[(trimethylsilyl)oxy]- | 8596650 | 1033385 |
| D-Turanose, heptakis(trimethylsilyl)- | 7561628 | 2001141 |
| .alpha.-D-Glucopyranoside, 1,3,4,6-tetrakis-O-(trimethylsilyl)-.beta.-D-fructofuranosyl 2,3,4,6-tetrakis-O-(trimethylsilyl)- | 6501577 | 1155359 |
| Acrylic acid, 2,3-bis[(trimethylsilyl)oxy]-, trimethylsilyl ester | 5871478 | 4002282 |
| Hexadecanoic acid, 2,3-bis[(trimethylsilyl)oxy]propyl ester | 5513926 | 1033385 |
| Benzonitrile, 4-(2-methyl-1,3-dioxolan-2-yl)- | 4065195 | 743205 |
| Bis(trimethylsilyl)monostearin | 3612728 | 1069655 |
| 2,4,6-Tri-t-butylbenzenethiol | 3550449 | 2310719 |
| Glucose, pentakis-O-trimethylsilyl- | 2902541 | 4002282 |
| Ethanimidic acid, N-(trimethylsilyl)-, trimethylsilyl ester | 2629166 | 2830041 |
| 1H-Indole-3-methanamine, N,N-dimethyl- | 2593132 | 4002282 |
| L-Proline, 1-(trimethylsilyl)-, trimethylsilyl ester | 2582950 | 1415021 |
References
- Brasil MS. Secretaria de Vigilância em Saúde. Departamento de Doenças de Condições Crônicas e Infecções Sexualmente Transmissíveis –DCCI. Boletim Epidemiológico de HIV e Aids, 2019; especial: 01-72. doi: https://www.gov.br › ... › 2019 › HIV/Aids.
- ADA. American Dental Association. Human Immunodeficiency Virus (HIV) [homepage]; 2019 [cited 2021 nov21] https://www.ada.org/resources/research/science-and-research-institute/oral-health-topics/hiv.
- Waymack JR, Sundareshan V. Acquired Immune Deficiency Syndrome. 2022 Oct 30. In: StatPearls [Internet]. Treasure Island (FL): StatPearls Publishing; 2022 Jan–. PMID: 30725978.
- Teixeira LG, Chagas BLF, Alves FS, Padron GMS, Ribeiro J da C, Do Amaral RC, et al. The epidemiological profile of AIDS in Brazil. Brazilian Journal of Health Review. 2022 Jan 31;5(1):1980–92. [CrossRef]
- Bhuyan R, Bhuyan SK, Mohanty JN, Das S, Juliana N, Juliana IF. Periodontitis and Its Inflammatory Changes Linked to Various Systemic Diseases: A Review of Its Underlying Mechanisms. Biomedicines. 2022;10(10):2659. Published 2022 Oct 21. [CrossRef]
- Weitzmann MN, Vikulina T, Roser-Page S, Yamaguchi M, Ofotokun I. Homeostatic Expansion of CD4+ T Cells Promotes Cortical and Trabecular Bone Loss, Whereas CD8+ T Cells Induce Trabecular Bone Loss Only. J Infect Dis. 2017;216(9):1070-1079. [CrossRef]
- Borges SAL, Real LHG, Schreiner RB. Sarcoma de Kaposi em pacientes HIV: novamente uma realidade. REAS [Internet]. 3fev.2019 [cited 20jan.2023];11(6):e352. Available from: https://acervomais.com.br/index.php/saude/article/view/352.
- Gawron K, Wojtowicz W, Łazarz-Bartyzel K, et al. Metabolomic Status of The Oral Cavity in Chronic Periodontitis. In Vivo. 2019;33(4):1165-1174. [CrossRef]
- Little RF, Uldrick TS. Are There Clues to Oral Kaposi Sarcoma-Associated Herpesvirus Shedding and Kaposi Sarcoma Oncogenesis in the Oral Microbiome? J Infect Dis. 2020;221(8):1226-1228. [CrossRef]
- Bujak R, Struck-Lewicka W, Markuszewski MJ, Kaliszan R. Metabolomics for laboratory diagnostics. J Pharm Biomed Anal. 2015;113:108-120. [CrossRef]
- Chauhan P, Saha B. Metabolic regulation of infection and inflammation. Cytokine. 2018;112:1-11. [CrossRef]
- Chauhan P, Sarkar A, Saha B. Interplay Between Metabolic Sensors and Immune Cell Signaling. Exp Suppl. 2018;109:115-196. [CrossRef]
- de Sá Alves M, de Sá Rodrigues N, Bandeira CM, et al. Identification of Possible Salivary Metabolic Biomarkers and Altered Metabolic Pathways in South American Patients Diagnosed with Oral Squamous Cell Carcinoma. Metabolites. 2021;11(10):650. Published 2021 Sep 23. [CrossRef]
- European Confederation of Laboratory Medicine. European urinalysis guidelines. Scand J Clin Lab Invest Suppl. 2000;231:1-86.
- Navazesh M, Kumar SK; University of Southern California School of Dentistry. Measuring salivary flow: challenges and opportunities. J Am Dent Assoc. 2008;139 Suppl:35S-40S. [CrossRef]
- Alves LAC. Estudo do metaboloma de biofluidos em pacientes pediátricos nefropatas e sua associação com a doença periodontal [Internet]. 2016 ;[cited 2023jan.20] Available from: http://www.teses.usp.br/teses/disponiveis/23/23132/tde-04112016-104007/.
- Barnes VM, Teles R, Trivedi HM, et al. Acceleration of purine degradation by periodontal diseases. J Dent Res. 2009; 88(9):851-855. [CrossRef]
- Corrêa RO, Vieira A, Sernaglia EM, et al. Bacterial short-chain fatty acid metabolites modulate the inflammatory response against infectious bacteria. Cell Microbiol. 2017;19(7):10.1111/cmi.12720. [CrossRef]
- Canuto, G. A., Costa, J. L. D., da Cruz, P. L., Souza, A. R. L. D., Faccio, A. T., Klassen, A., ... & Tavares, M. F. (2018). Metabolômica: definições, estado-da-arte e aplicações representativas. New Chemistry, 41, 75-91.
- Schulte F, King OD, Paster BJ, et al. Salivary metabolite levels in perinatally HIV-infected youth with periodontal disease. Metabolomics. 2020;16(9):98. Published 2020 Sep 11. [CrossRef]
- Saude, E.J., Sykes, B.D. Urine stability for metabolomic studies: effects of preparation and storage. Metabolomics 3, 19–27 (2007). [CrossRef]
- Ryder MI, Nittayananta W, Coogan M, Greenspan D, Greenspan JS. Periodontal disease in HIV/AIDS. Periodontol 2000. 2012;60(1):78-97. [CrossRef]
- Neville, Brad. Patologia oral e maxilofacial. Elsevier Brasil, 2011.
- Michel, M., Soledade, K. R., & Eduardo Azoubel, M. C. F. A. (2012). Necrotizing periodontal diseases and use of antimicrobials as adjunct therapy-review of the literature.
- Newman, M. G., Takei, H., Klokkevold, P. R., & Carranza, F. A. (2016). Carranza clinical periodontics. Elsevier Brasil.
- Ciçek Y, Ozmen I, Canakçi V, Dilsiz A, Sahin F. Content and composition of fatty acids in normal and inflamed gingival tissues. Prostaglandins Leukot Essent Fatty Acids. 2005;72(3):147-151. [CrossRef]
- Luchian I, Goriuc A, Sandu D, Covasa M. The Role of Matrix Metalloproteinases (MMP-8, MMP-9, MMP-13) in Periodontal and Peri-Implant Pathological Processes. Int J Mol Sci. 2022;23(3):1806. Published 2022 Feb 4. [CrossRef]
Figure 1.
Collection, storage and drying of urine samples. Source: Alves, 2016.
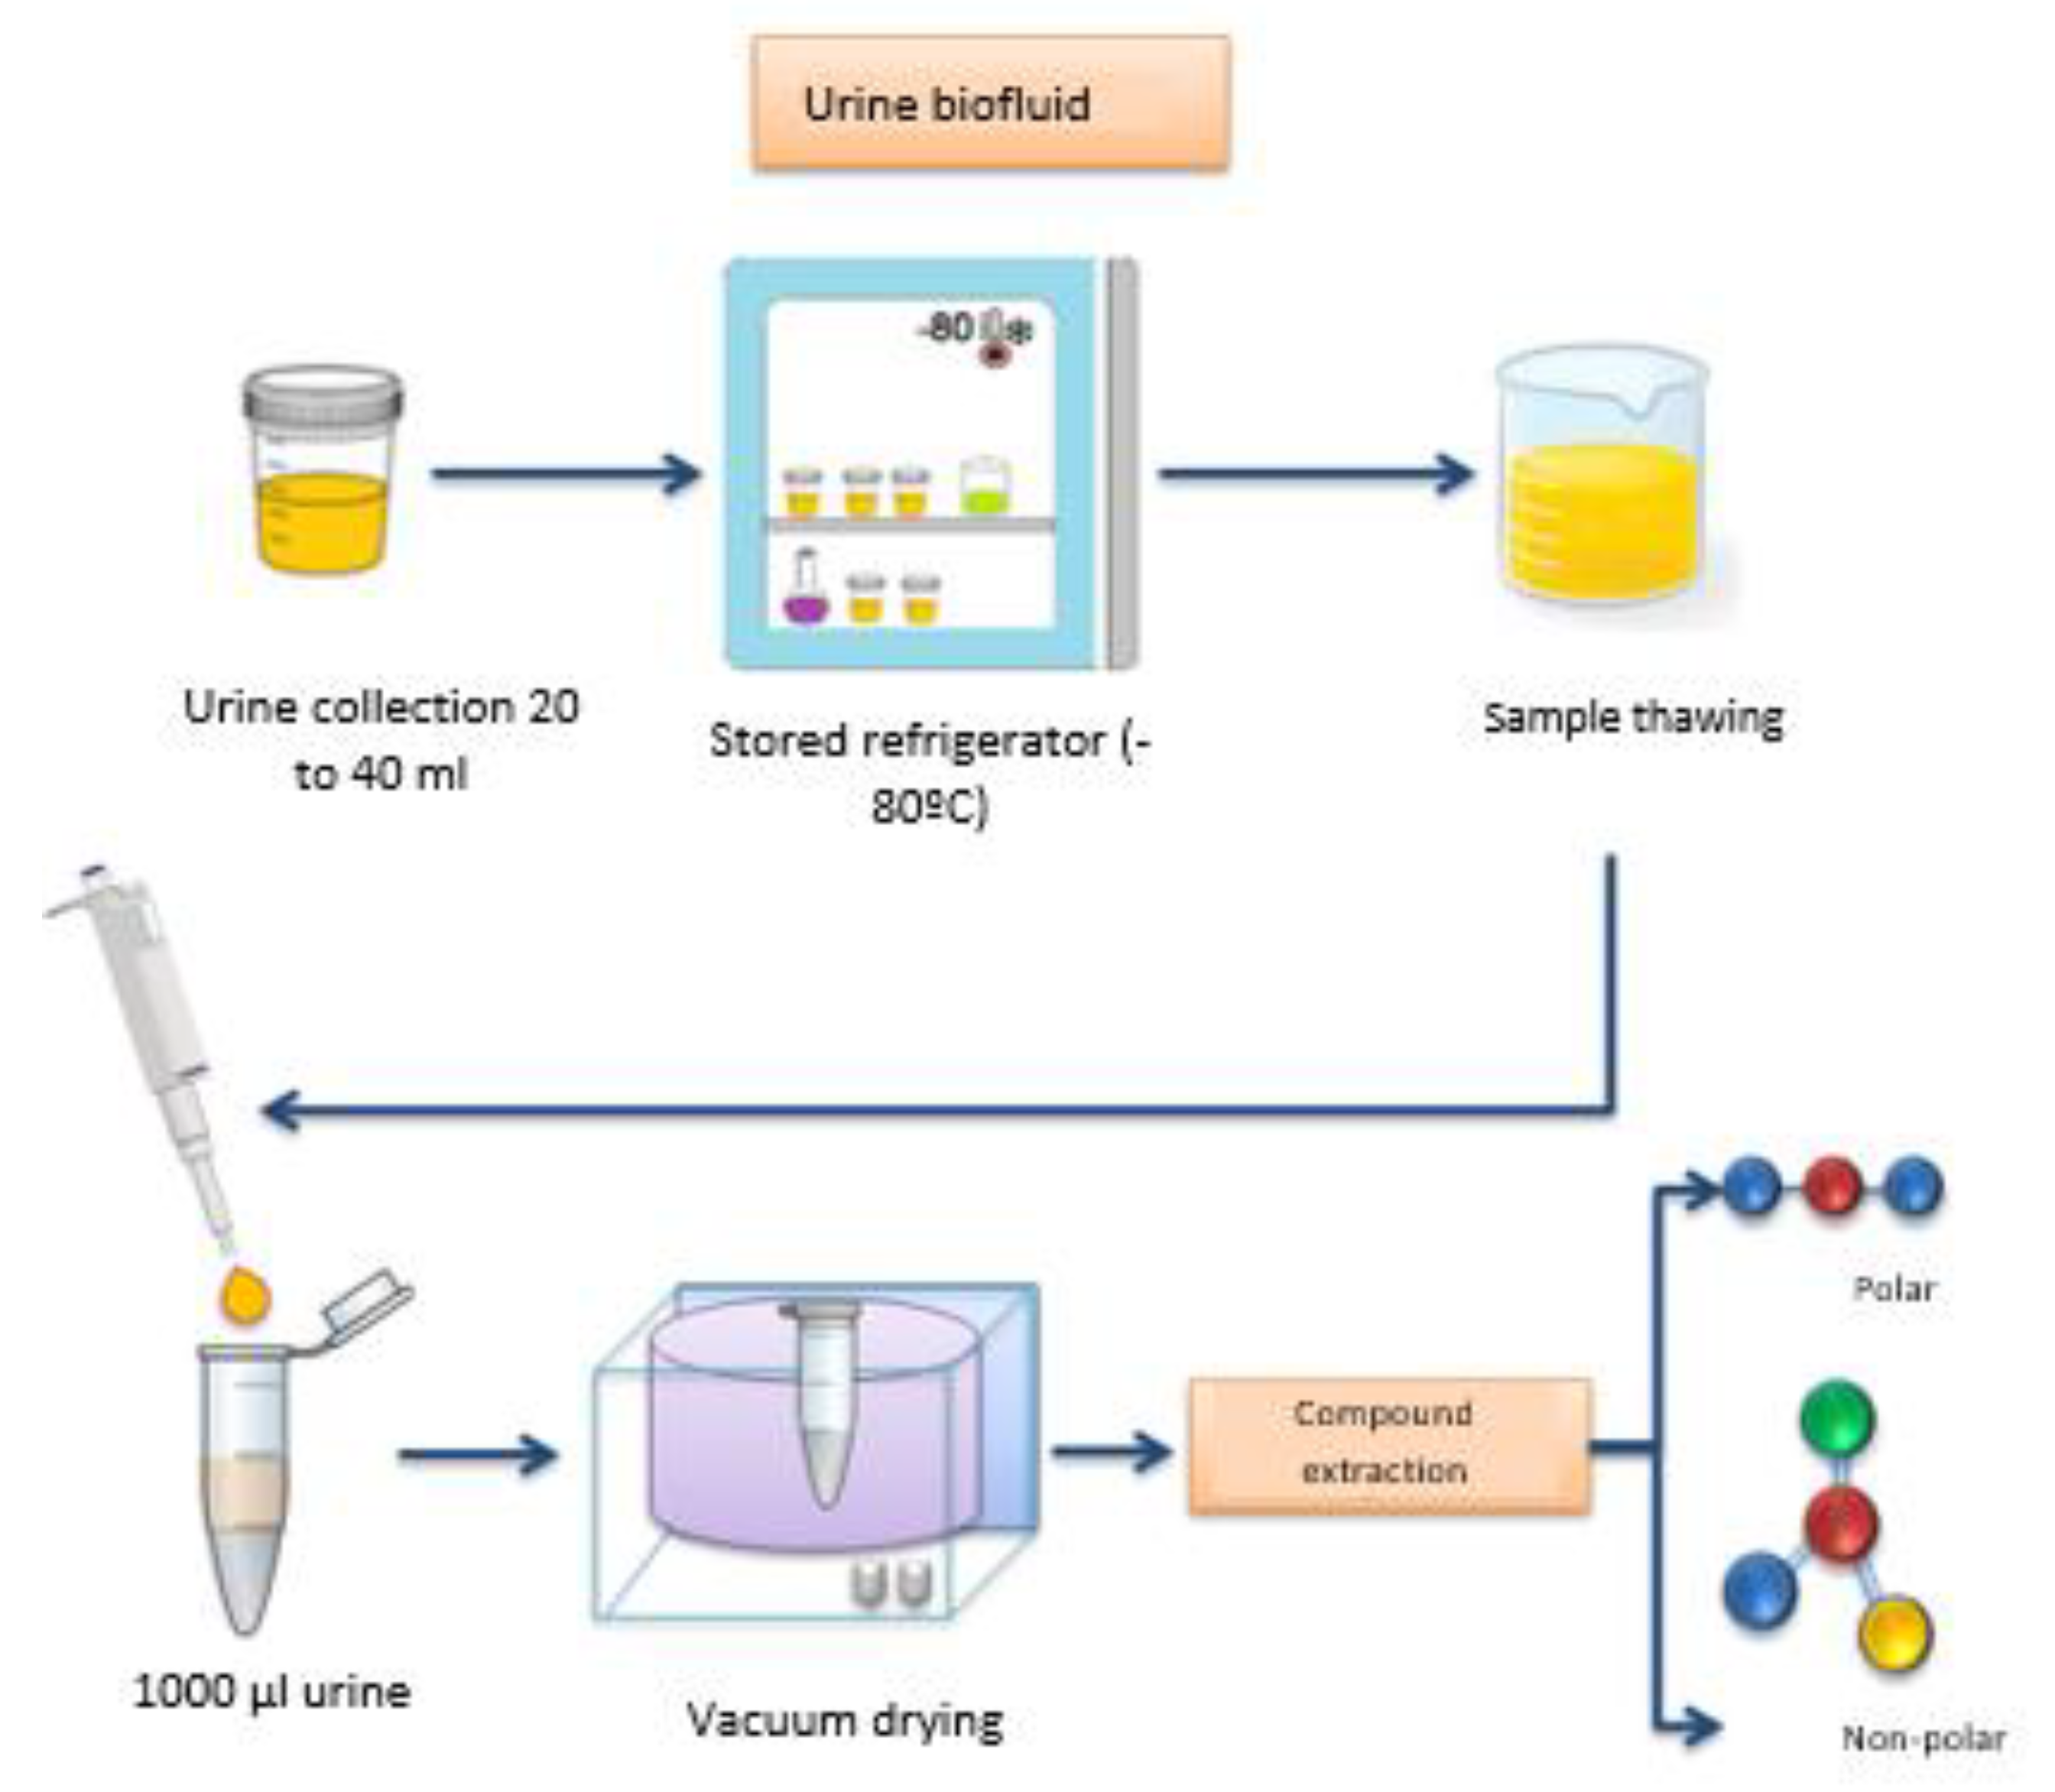
Figure 2.
Process of extraction of metabolites from urine. Source: Alves, 2016.
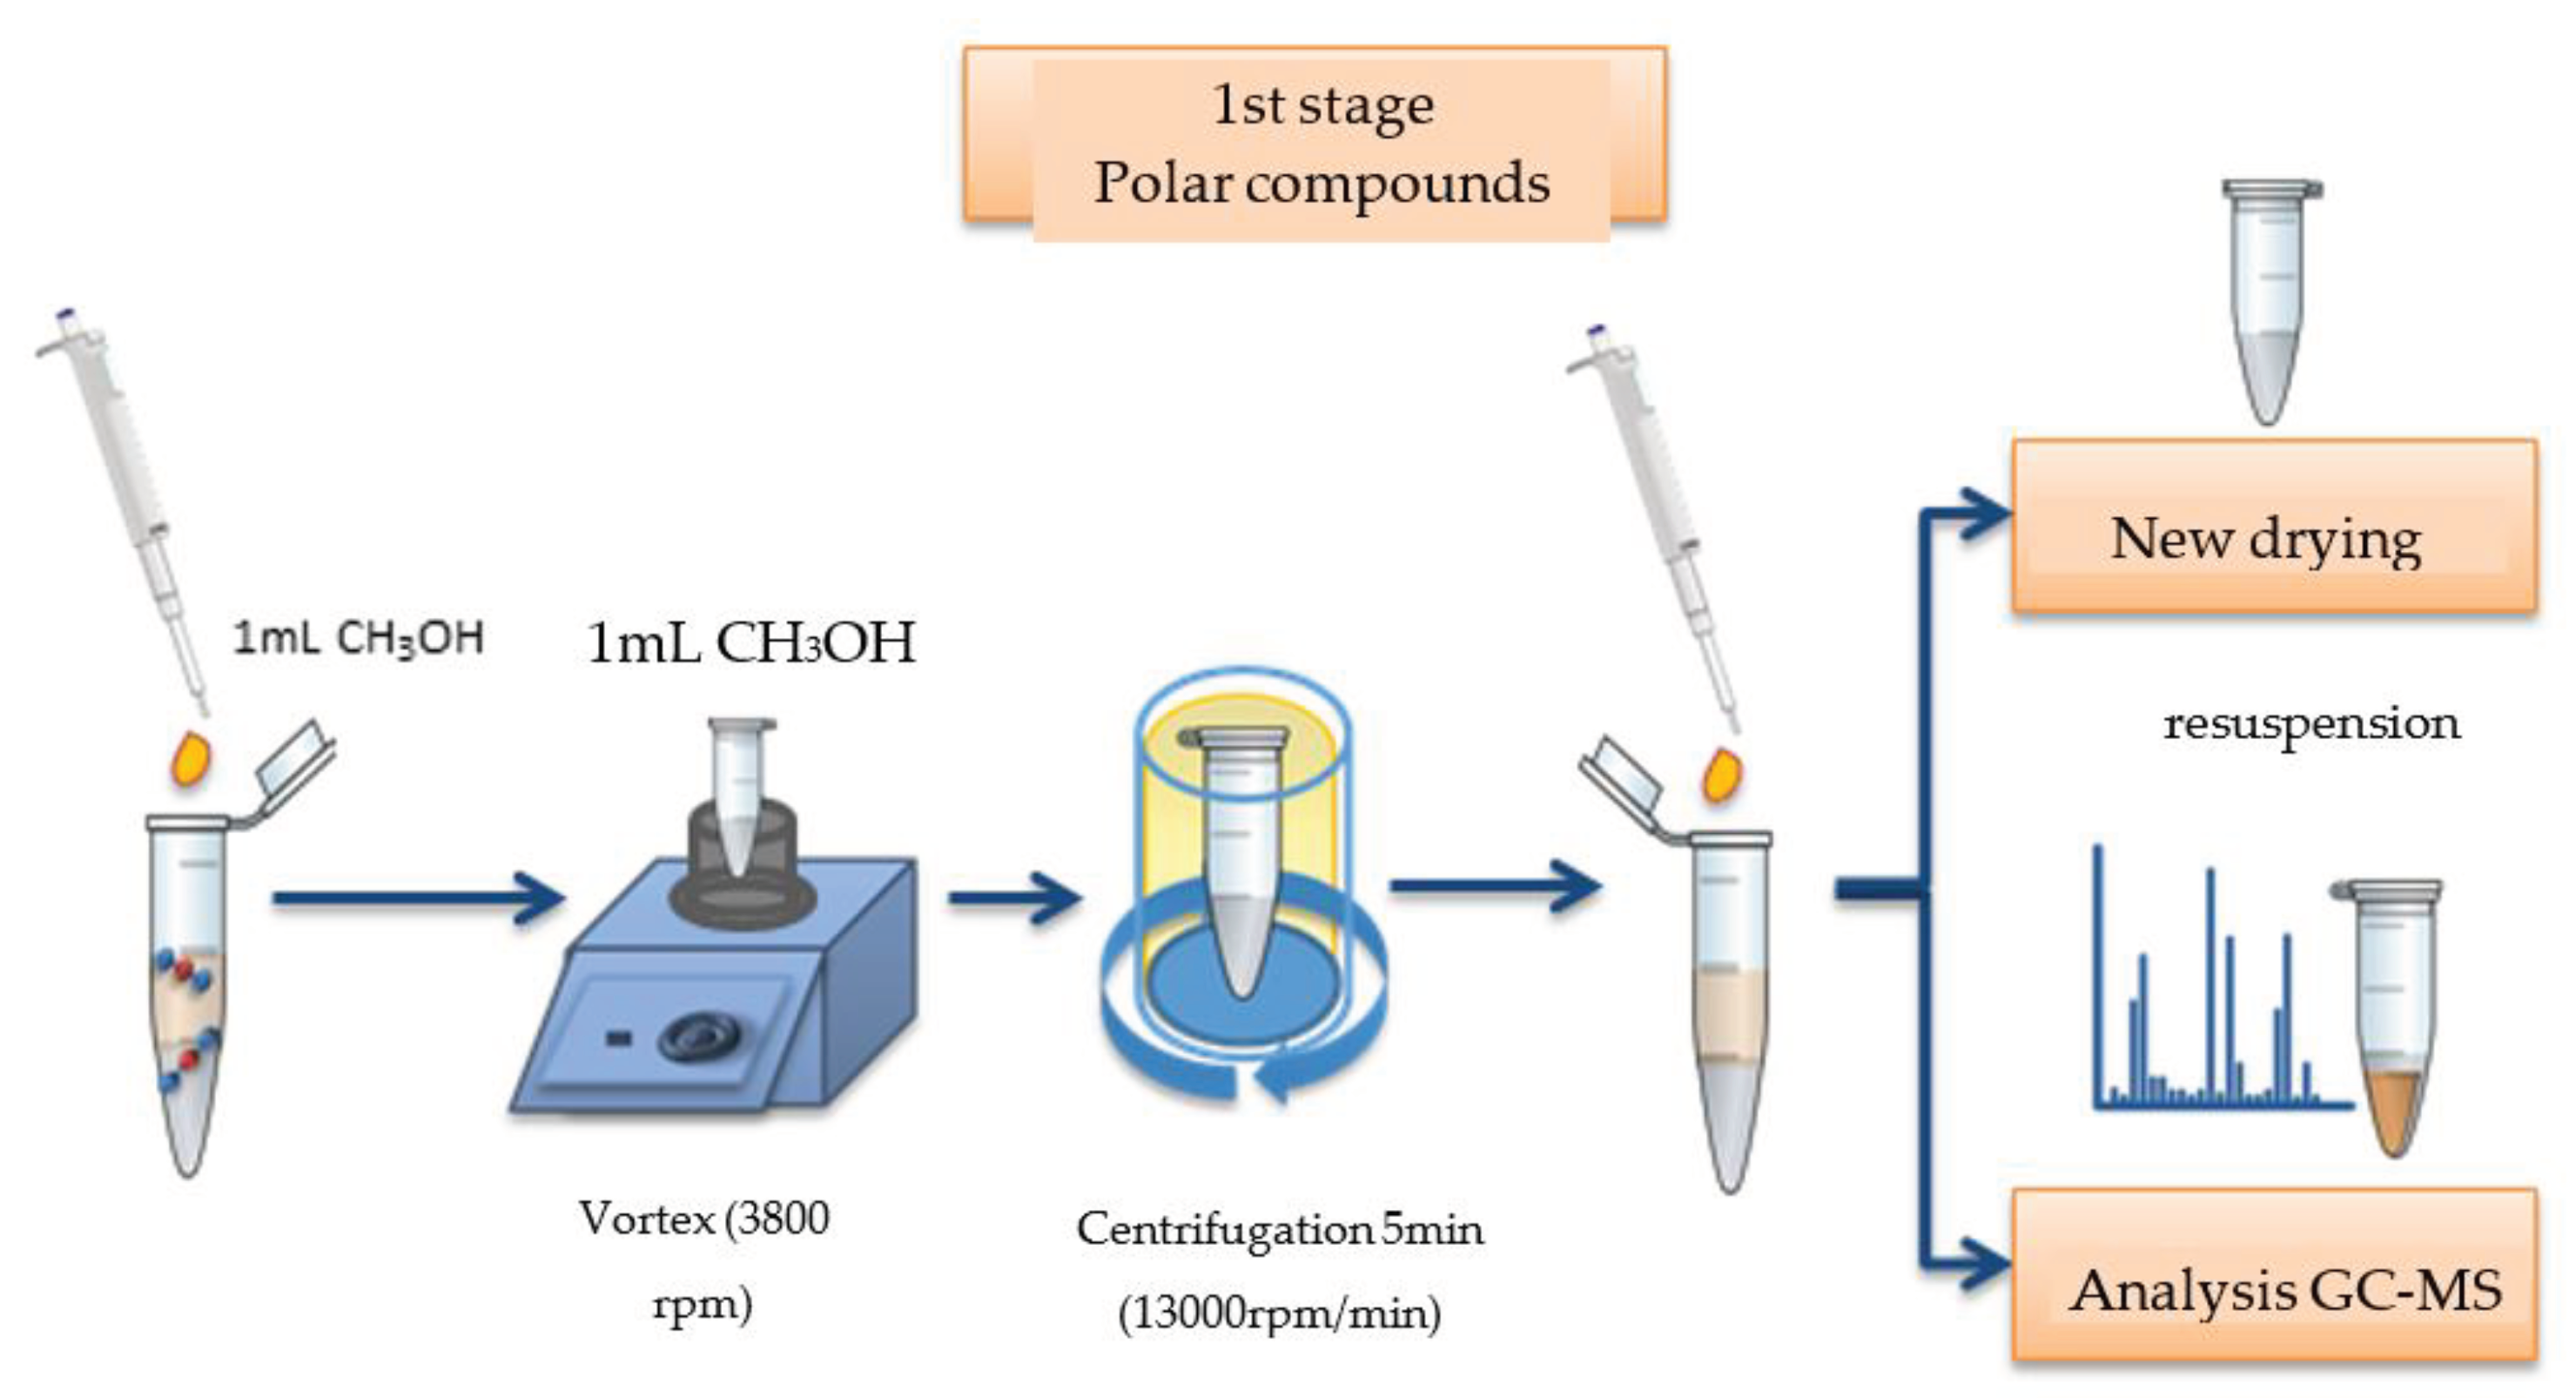
Figure 3.
Derivatization process of urine metabolites. Source: Alves, 2016.
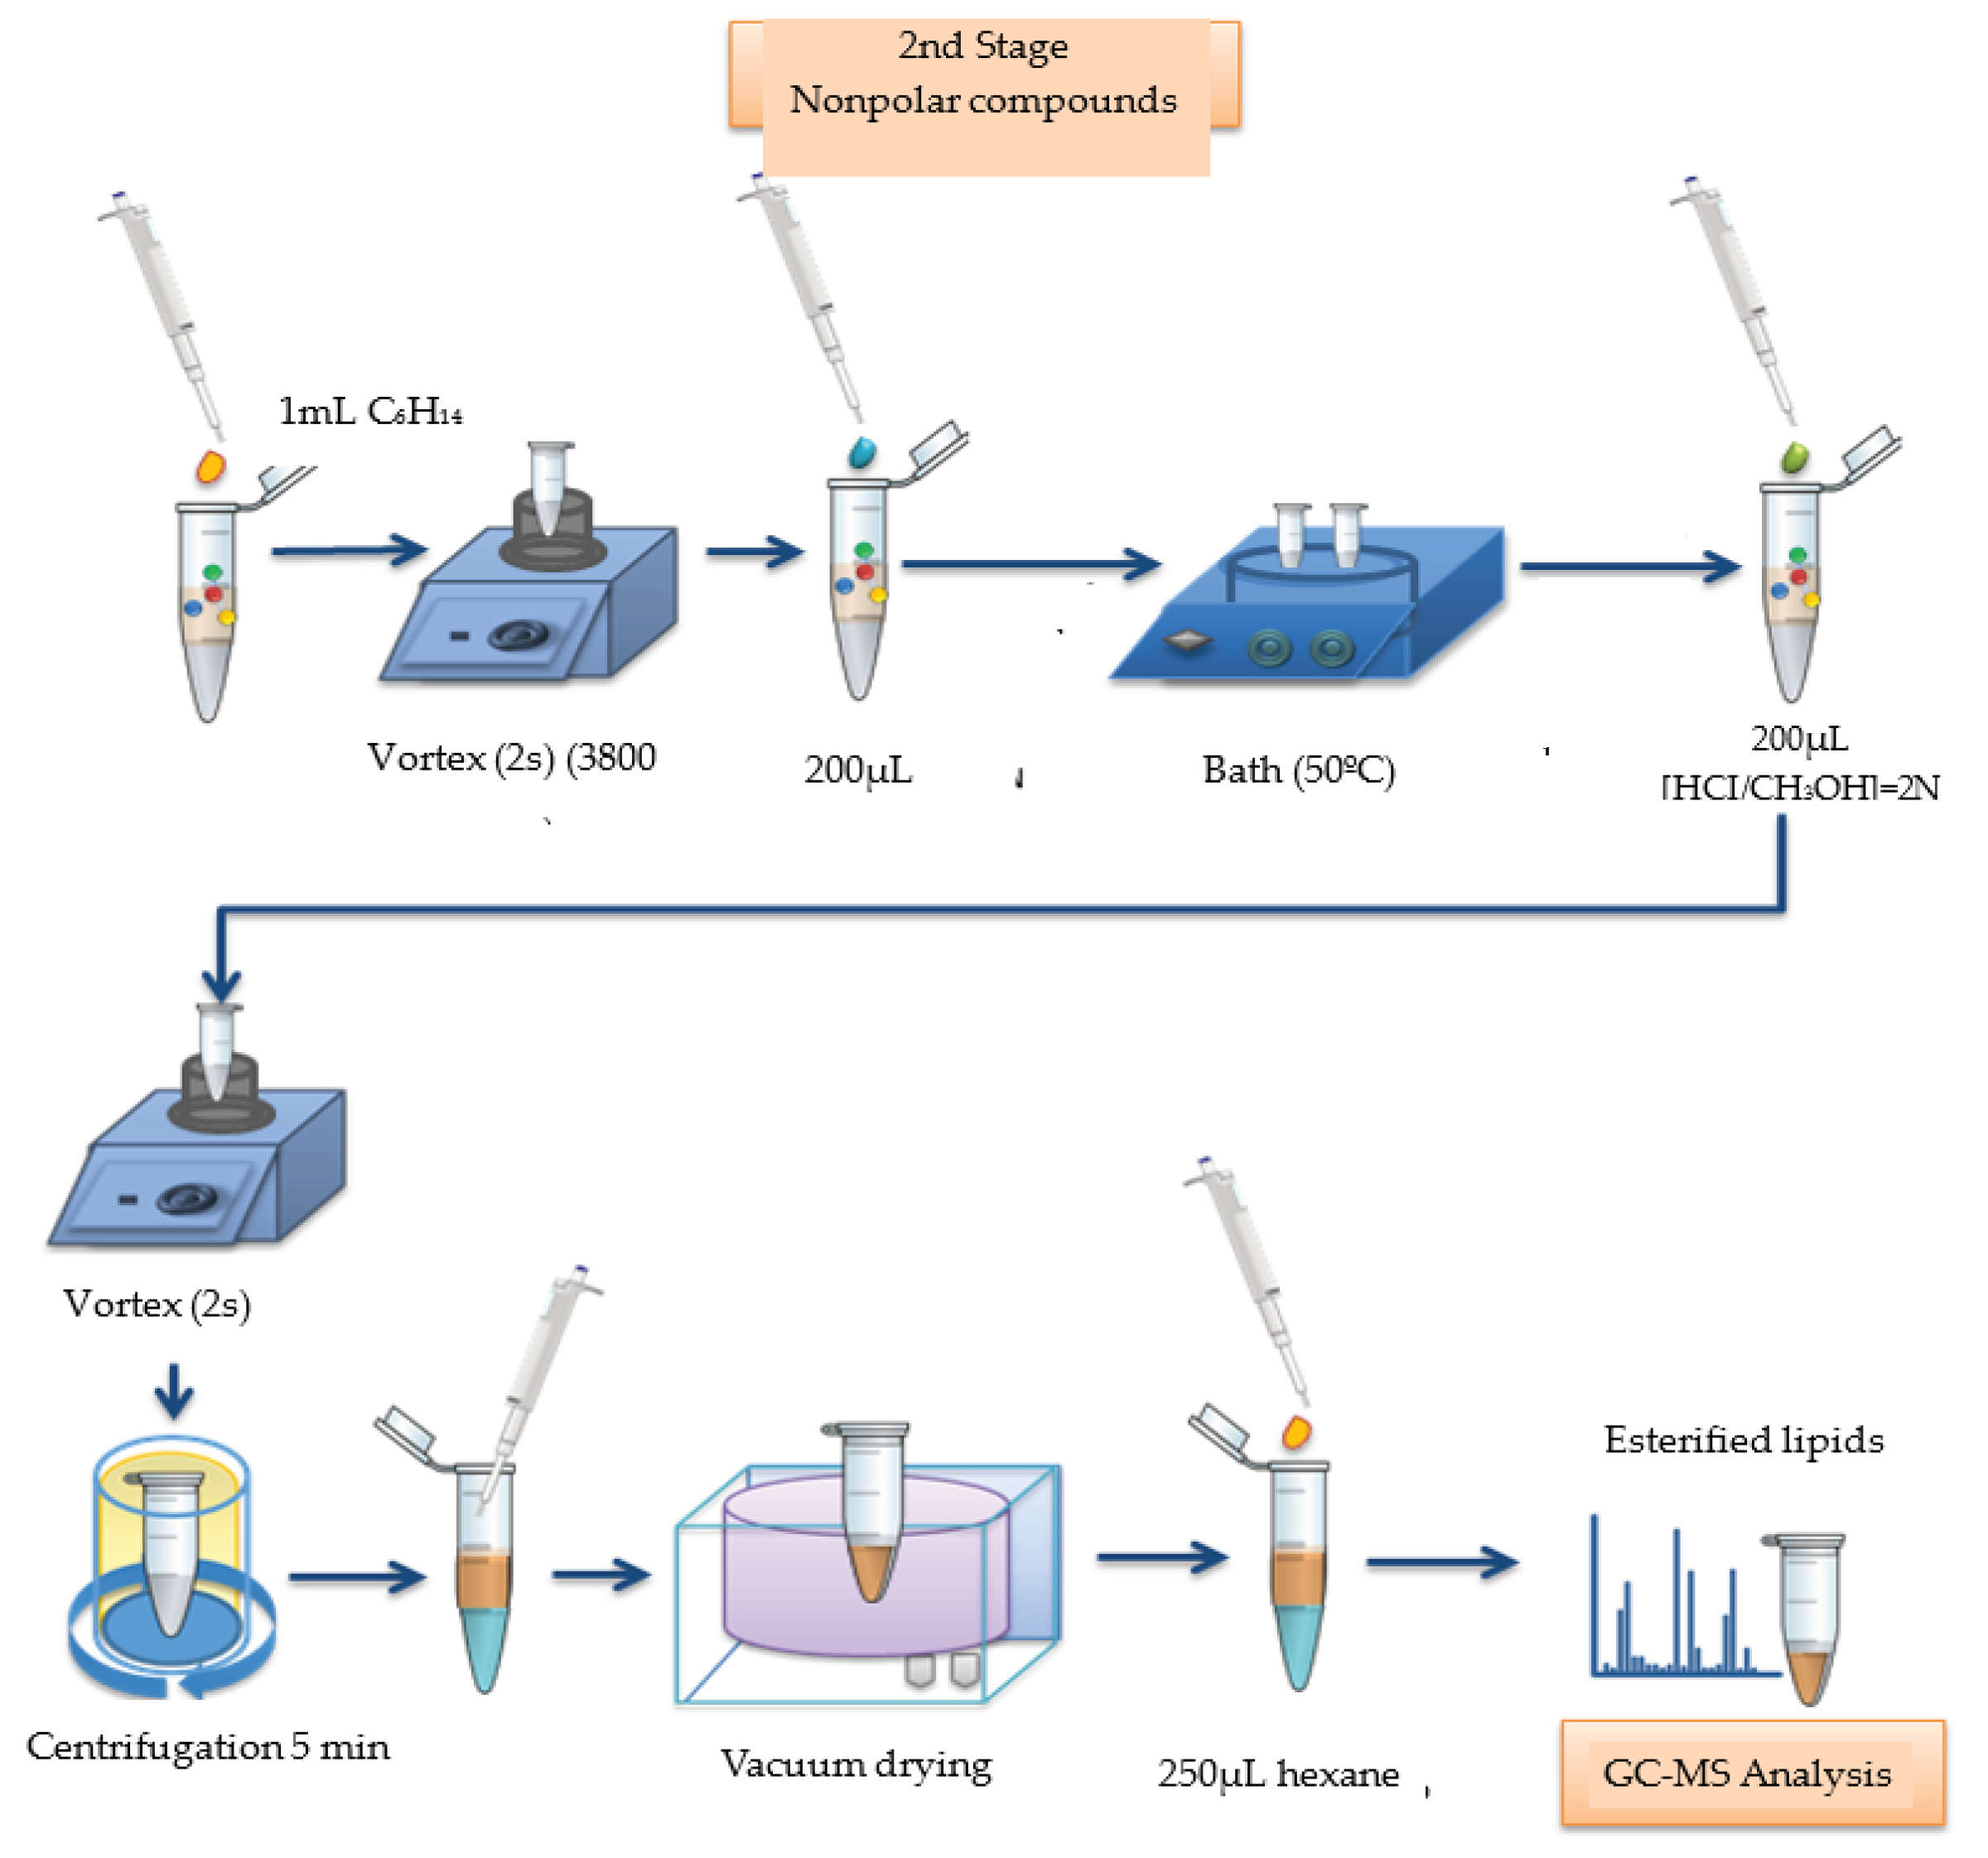
Figure 4.
Process of extraction and derivatization of salivary metabolites. Source: Alves, 2016.
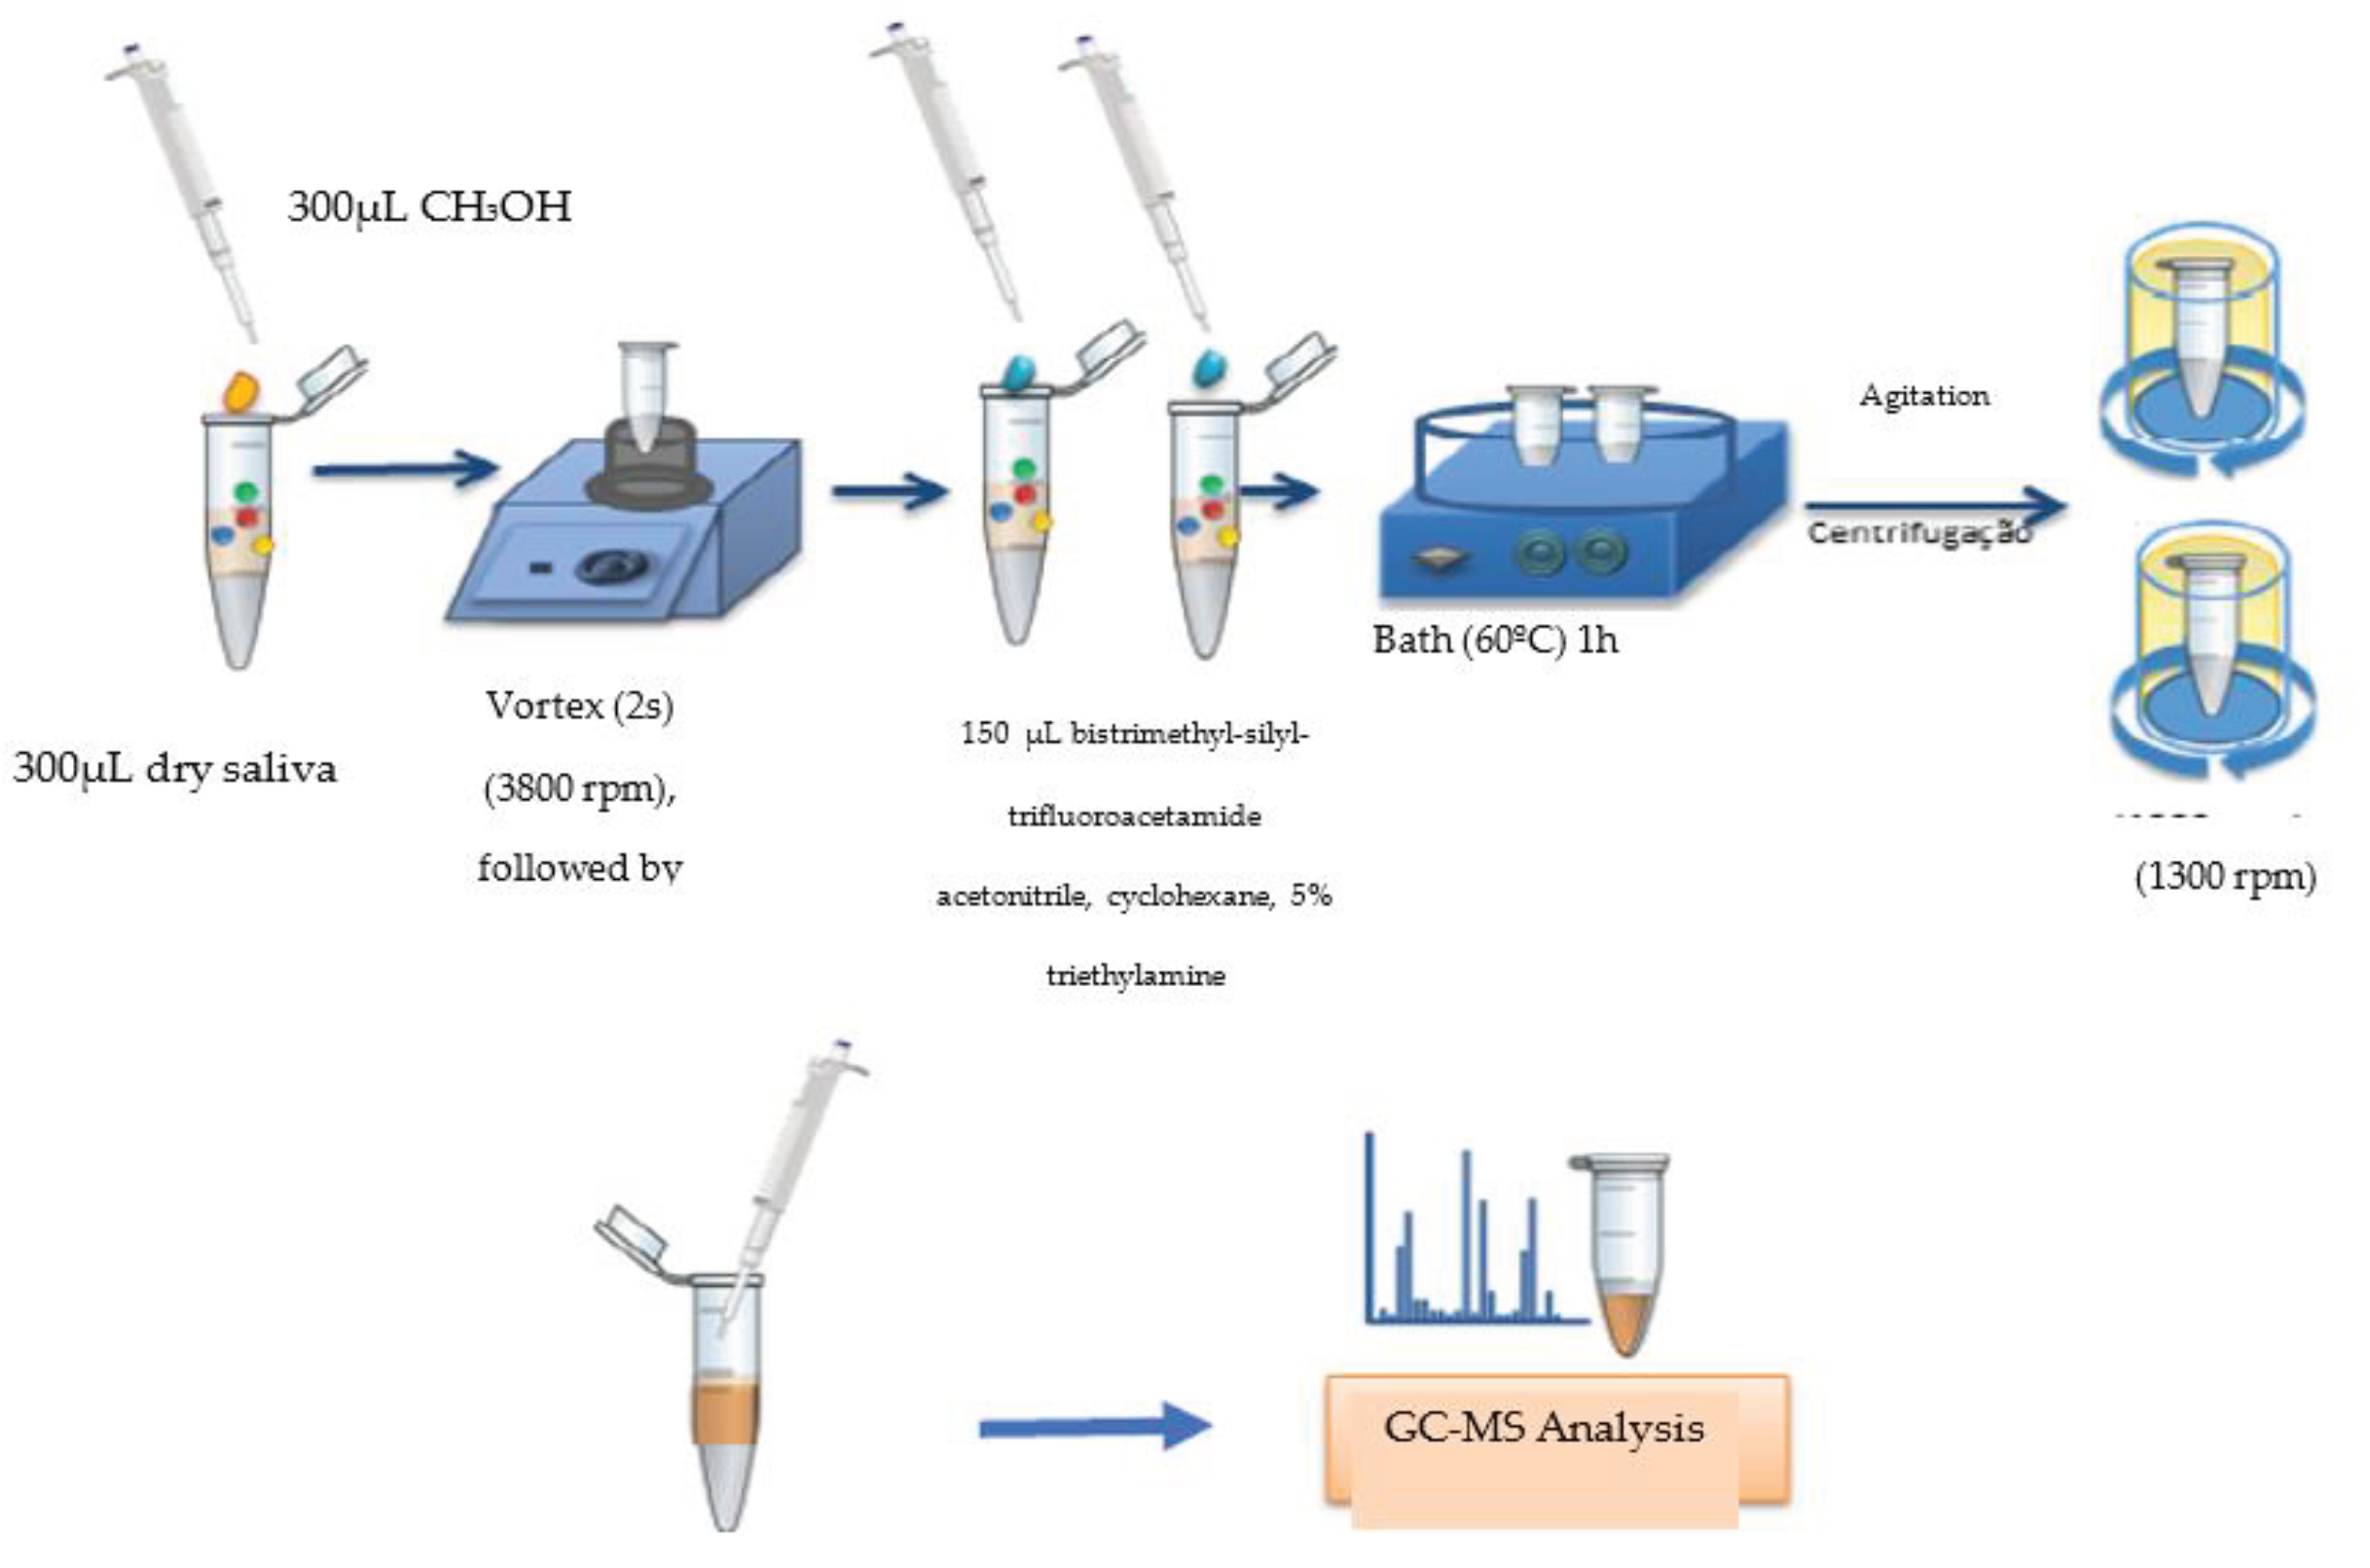
Figure 5.
Anova comparing area averages of urine metabolites for the 4 groups. The bars denote a 95% confidence interval around the mean.
Figure 5.
Anova comparing area averages of urine metabolites for the 4 groups. The bars denote a 95% confidence interval around the mean.
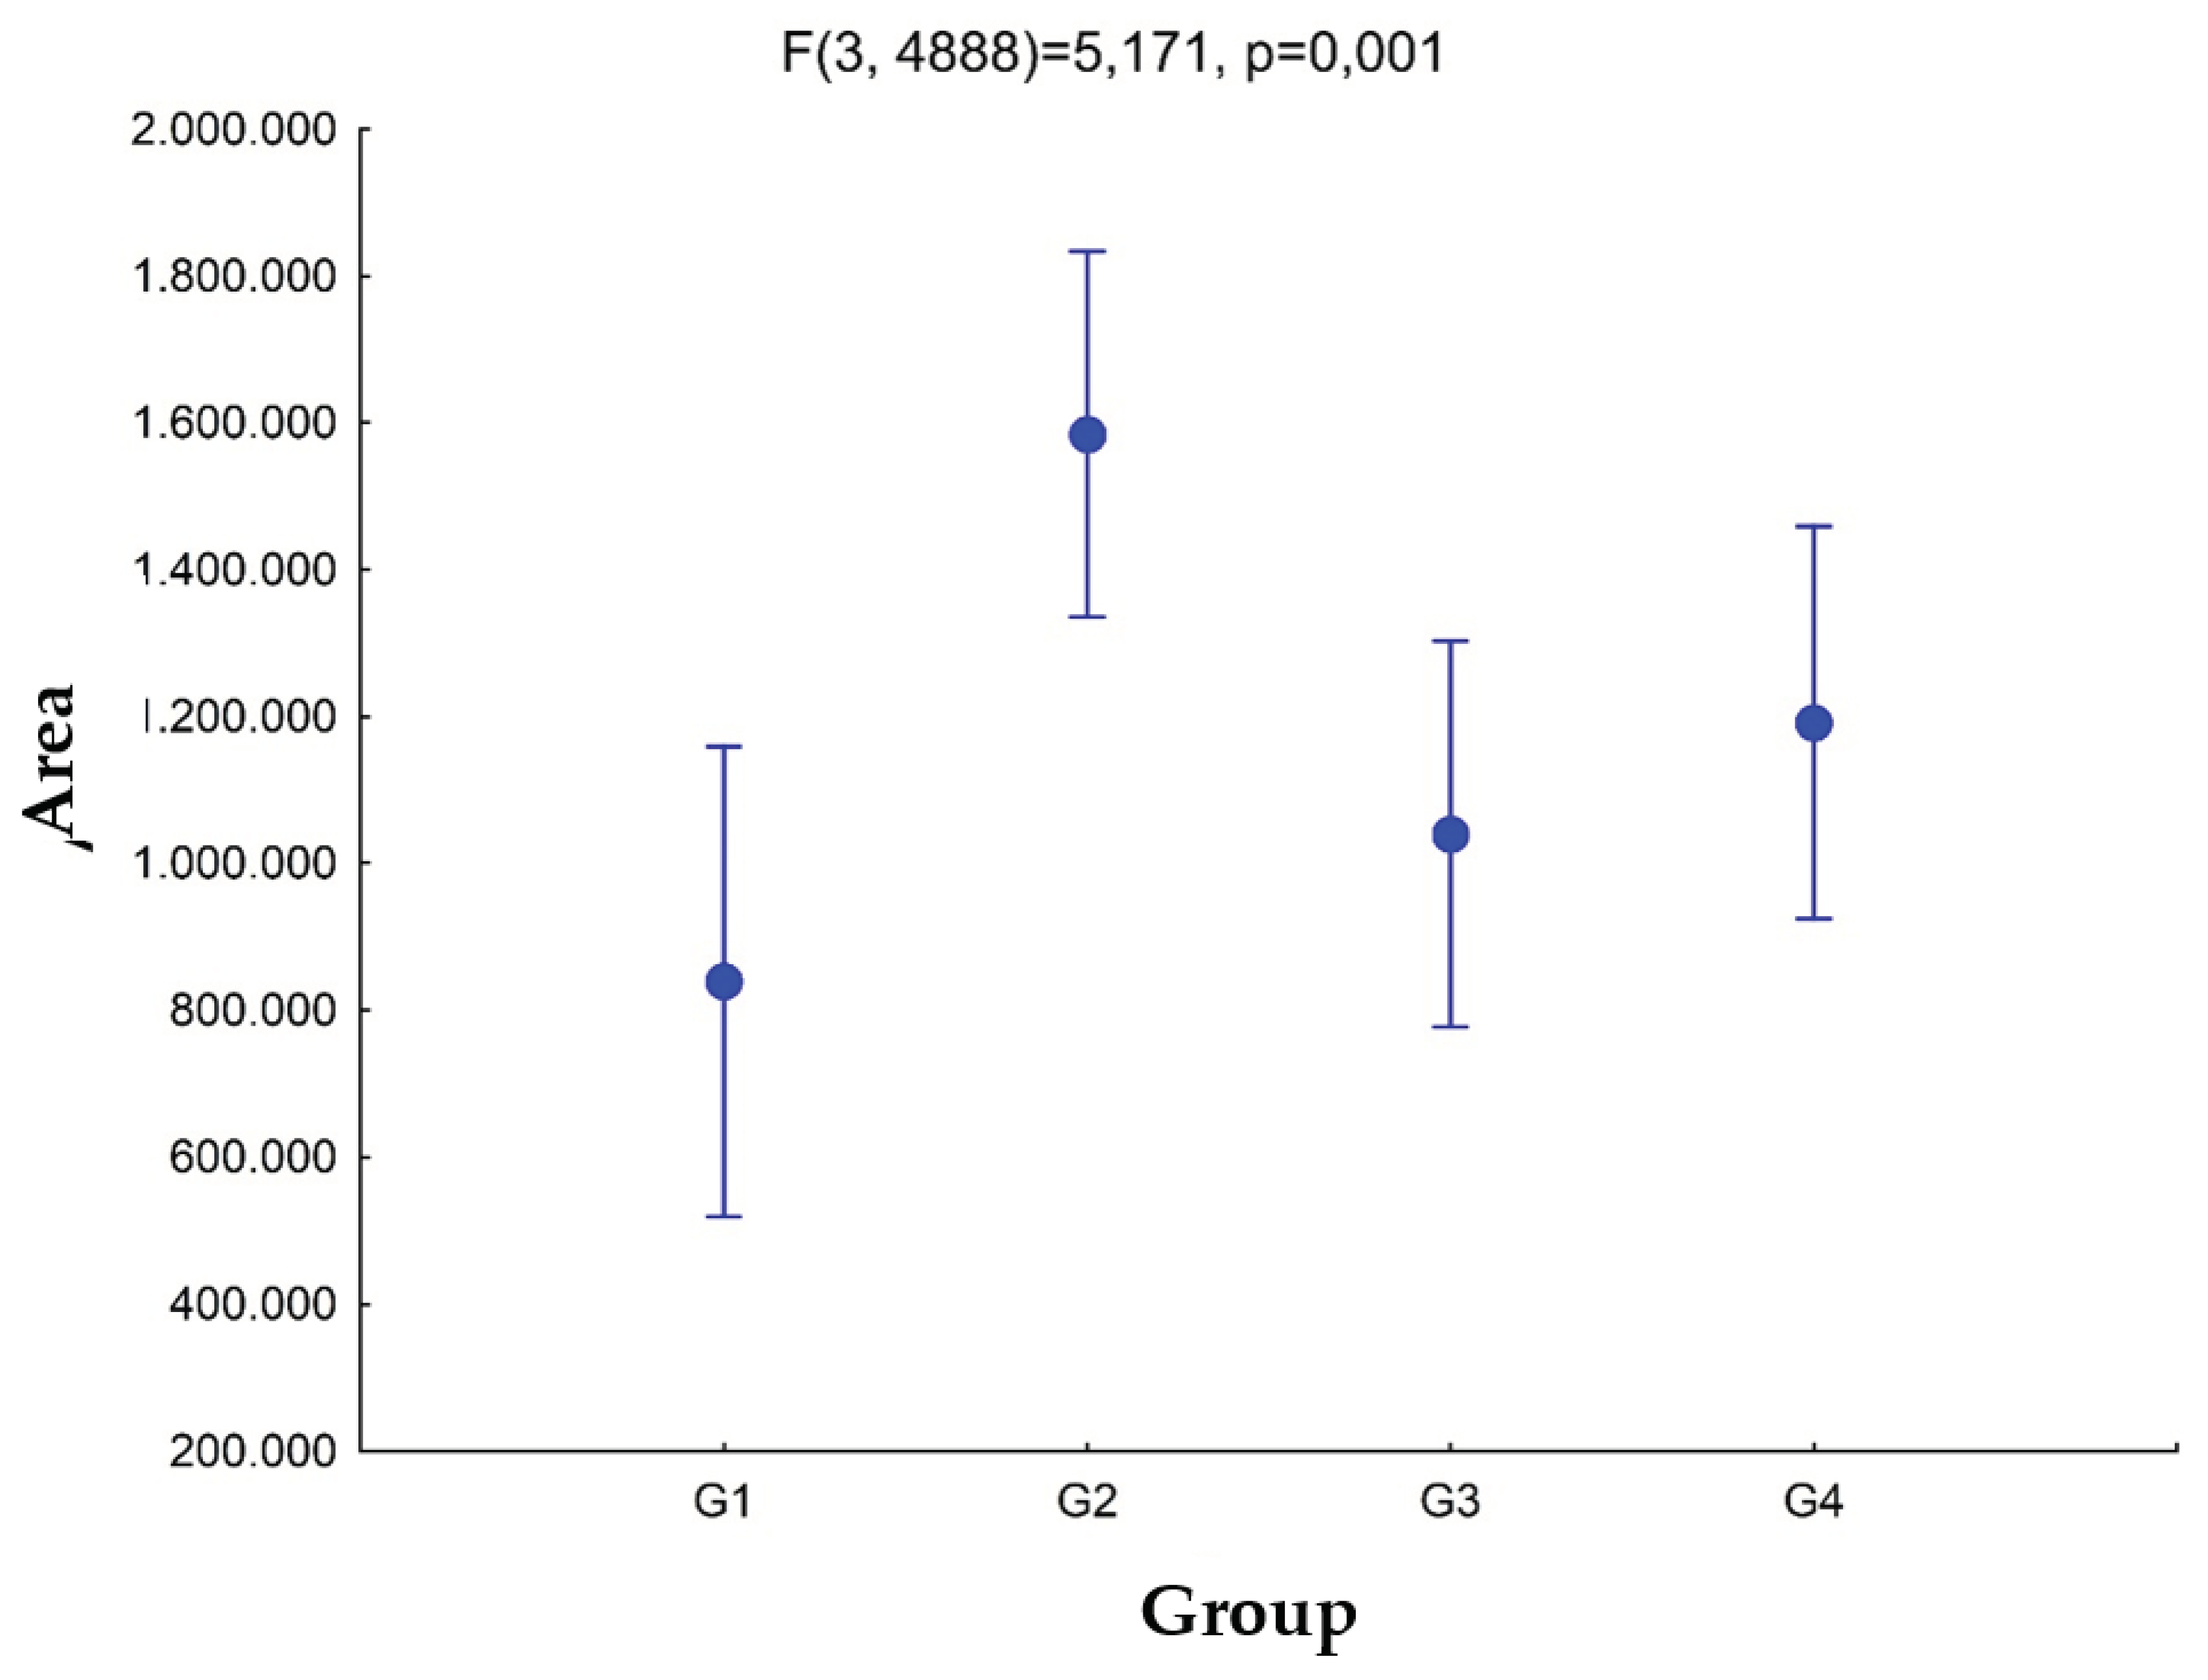
Figure 6.
Venn diagram between groups for metabolites present in urine.
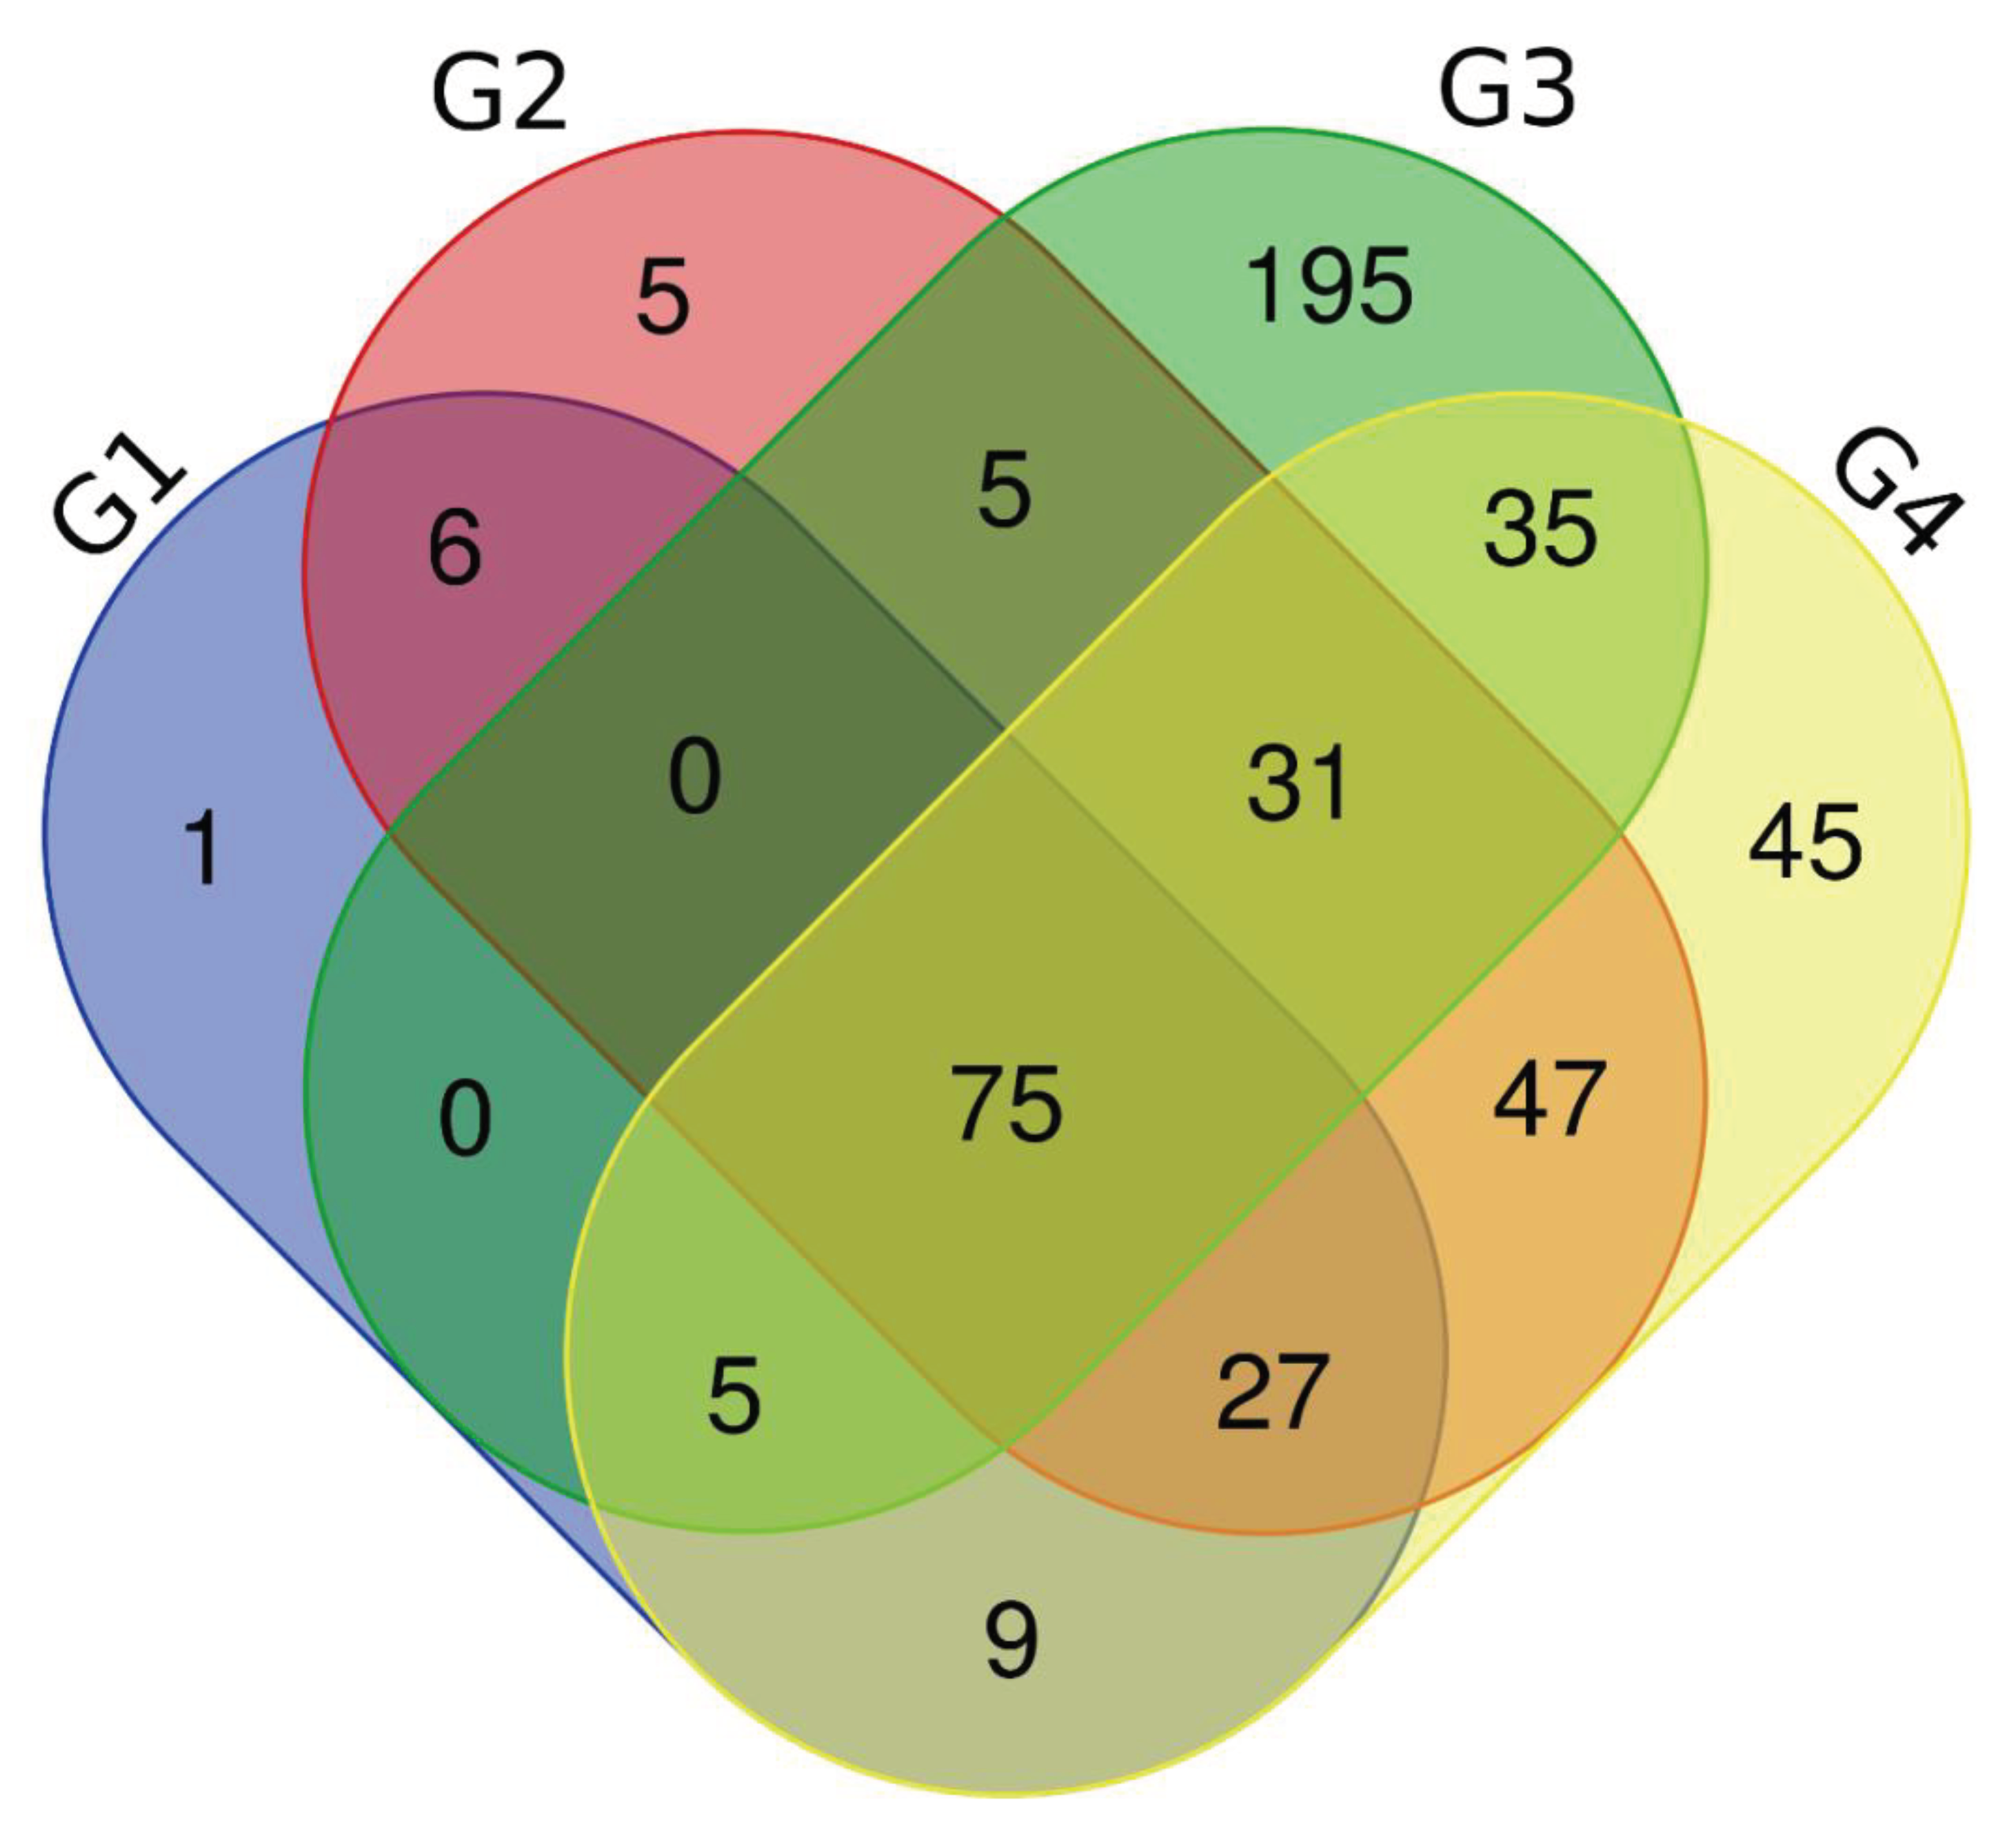
Figure 7.
Anova comparing area averages of urine metabolites for the 4 groups. The bars denote a 95% confidence interval around the mean.
Figure 7.
Anova comparing area averages of urine metabolites for the 4 groups. The bars denote a 95% confidence interval around the mean.
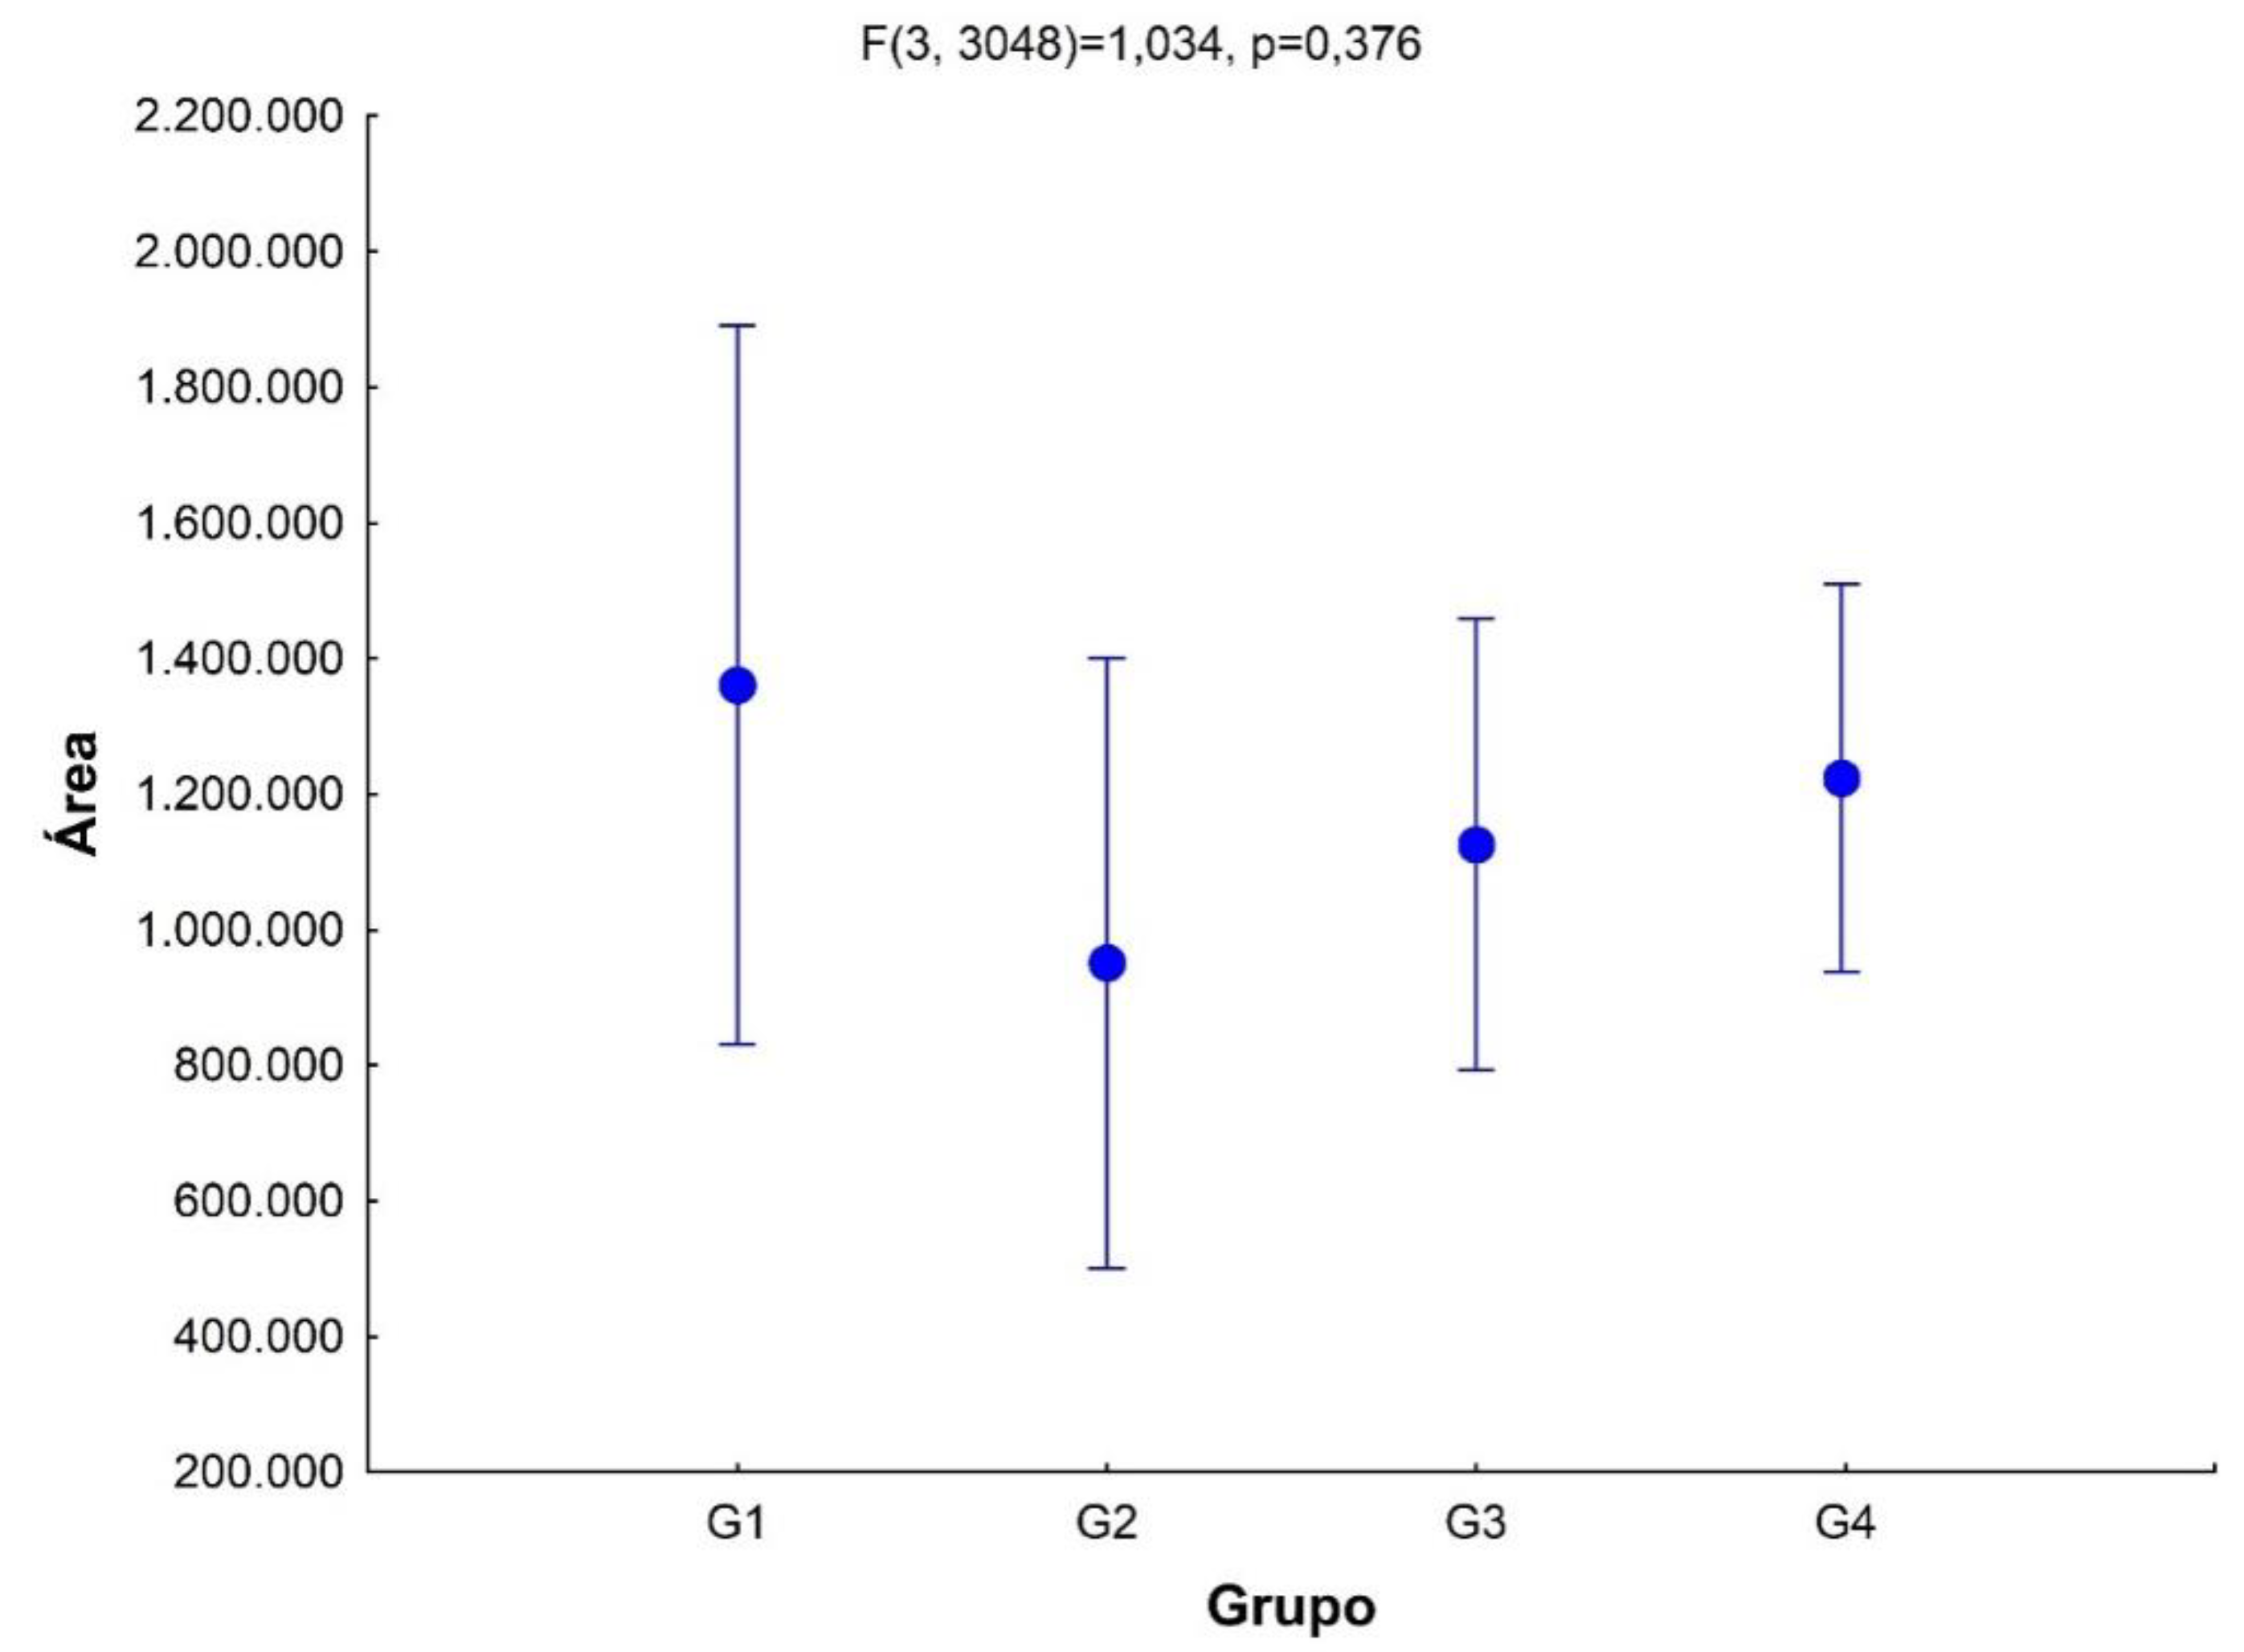
Figure 8.
Venn diagram between groups for metabolites present in urine.
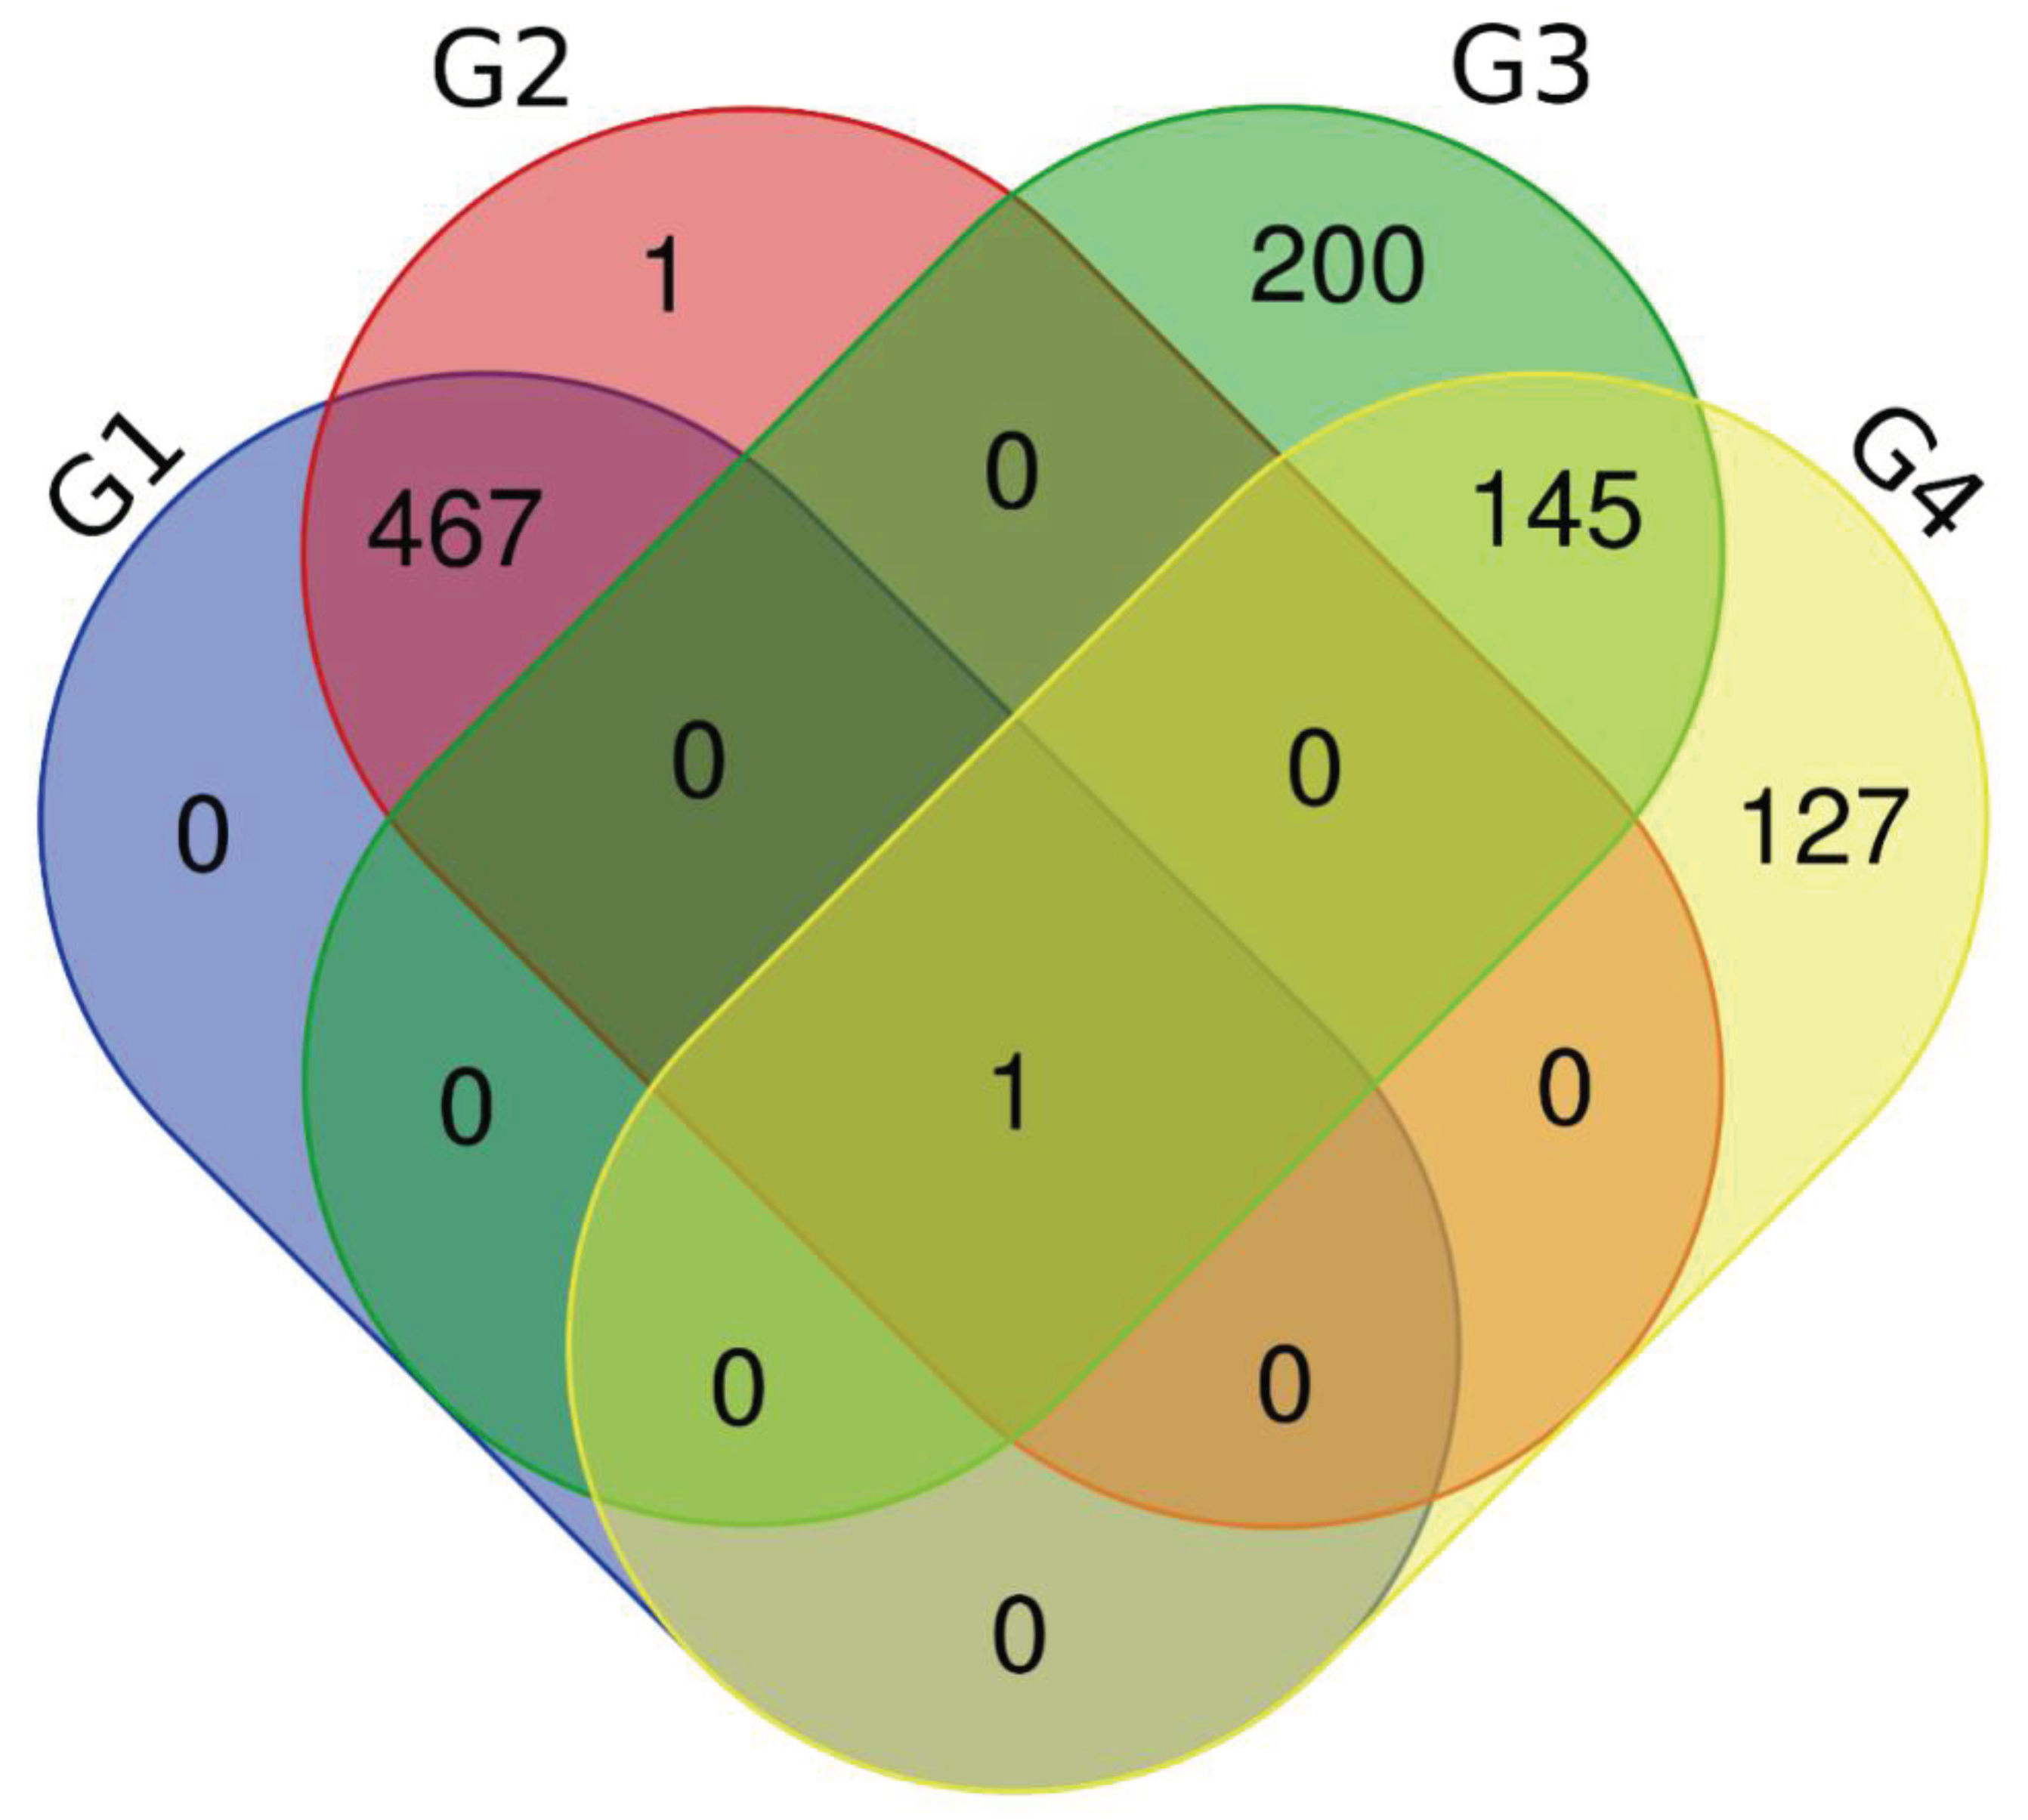
Table 1.
Distribution and frequency of clinical variables in the study.
| Variable | Absence of PD (N = 30) | Presence of PD (N = 35) |
|---|---|---|
| Age (Mean ± SD (N)) | 44.27 ± 14.02 (N = 30) | 50.23 ±9.83 (N = 35) |
| Sex | ||
| Female | 11 (36.67%) | 9(25.71%) |
| Male | 19 (63.33%) | 26 (74.29%) |
| Race | ||
| Leukoderma | 25 (83.33%) | 21 (60%) |
| Melanoderma | 5(16.67%) | 14 (40%) |
| Habits | ||
| Ethyl | 5(16.67%) | 3 (8.57%) |
| Smoker | 1 (3.33%) | 5(14.29%) |
| Ethyl/Smoker | 1 (3.33%) | 3 (8.57%) |
| None | 23 (76.67%) | 24 (68.57%) |
| Diseases | ||
| HerpesZoster | 1 (3.33%) | 0 (0%) |
| Syphilis | 1 (3.33%) | 0 (0%) |
| Hepatitis B | 0 (0%) | 1 (2.86%) |
| Hepatitis C | 0 (0%) | 1 (2.86%) |
| Hypertension | 1 (3.33%) | 5(14.29%) |
| None | 27 (90%) | 28 (80%) |
| Sounding depth | ||
| < 3mm | 27 (90%) | 0 (0%) |
| 3 to 4 mm | 3 (10%) | 8(22.86%) |
| > 4mm | 0 (0%) | 27 (77.14%) |
| Key: SD = Periodontal disease | ||
Table 6.
Urine metabolites that are repeated in all groups of urine G1, G2, G3, G4.
| URINA | |
|---|---|
| Metabólito | Grupos |
| Propanoic acid, 2-[(trimethylsilyl)oxy]-, trimethylsilyl ester | G1,G2,G3,G4 |
| Ethanimidic acid, N-(trimethylsilyl)-, trimethylsilyl ester | G1,G2,G3,G4 |
| Benzonitrile, 4-(2-methyl-1,3-dioxolan-2-yl)- | G1,G2,G3,G4 |
| .alpha.-D-Glucopyranoside, 1,3,4,6-tetrakis-O-(trimethylsilyl)-.beta.-D-fructofuranosyl 2,3,4,6-tetrakis-O-(trimethylsilyl)- | G1,G2,G3,G4 |
Table 7.
Salivary metabolites from groups G1 and G2 that are repeated among themselves, and from groups G3 and G4 that are repeated among themselves.
Table 7.
Salivary metabolites from groups G1 and G2 that are repeated among themselves, and from groups G3 and G4 that are repeated among themselves.
| SALIVA | |
|---|---|
| Metabólito | Grupos |
| Glucose-meto-5TMS(2) | G1,G2 |
| 1,6-Anhydroglucose-3TMS | G1,G2 |
| Mannitol-6TMS | G1,G2 |
| Citric acid-4TMS | G1,G2 |
| Serine-3TMS | G1,G2 |
| Isocitric acid-4TMS | G1,G2 |
| Isoleucine-2TMS | G1,G2 |
| Arabitol-5TMS | G1,G2 |
| Vanilmandelic acid-3TMS | G1,G2 |
| Threonic acid-4TMS | G1,G2 |
| Cysteine-3TMS | G1,G2 |
| Sucrose-8TMS | G1,G2 |
| Palmitic acid-TMS | G1,G2 |
| Threitol-4TMS | G1,G2 |
| Ribonic acid-5TMS | G1,G2 |
| Glucuronic acid-meto-5TMS(2) | G1,G2 |
| 2-Hydroxyglutaric acid-3TMS | G1,G2 |
| .beta.-D-Galactofuranose, 1,2,3,5,6-pentakis-O-(trimethylsilyl)- | G3,G4 |
| D-Fructose, 1,3,4,5,6-pentakis-O-(trimethylsilyl)- | G3,G4 |
| Talose, 2,3,4,5,6-pentakis-O-(trimethylsilyl)- | G3,G4 |
| .beta.-D-Glucopyranose, 1,2,3,4,6-pentakis-O-(trimethylsilyl)- | G3,G4 |
| D-Glucose, 4-O-[2,3,4,6-tetrakis-O-(trimethylsilyl)-.beta.-D-glucopyranosyl]-2,3,5,6-tetrakis-O-(trimethylsilyl)- | G3,G4 |
| D-Glucopyranose, 4-O-[2,3,4,6-tetrakis-O-(trimethylsilyl)-.beta.-D-galactopyranosyl]-1,2,3,6-tetrakis-O-(trimethylsilyl)- | G3,G4 |
| Maltose, octakis(trimethylsilyl)- | G3,G4 |
| Propanoic acid, 2-[(trimethylsilyl)oxy]-, trimethylsilyl ester | G3,G4 |
| Benzonitrile, 4-(2-methyl-1,3-dioxolan-2-yl)- | G3,G4 |
| D-Turanose, heptakis(trimethylsilyl)- | G3,G4 |
| .alpha.-D-Glucopyranoside, 1,3,4,6-tetrakis-O-(trimethylsilyl)-.beta.-D-fructofuranosyl 2,3,4,6-tetrakis-O-(trimethylsilyl)- | G3,G4 |
| 2,4,6-Tri-t-butylbenzenethiol | G3,G4 |
| Ethanimidic acid, N-(trimethylsilyl)-, trimethylsilyl ester | G3,G4 |
| L-Proline, 1-(trimethylsilyl)-, trimethylsilyl ester | G3,G4 |
Disclaimer/Publisher’s Note: The statements, opinions and data contained in all publications are solely those of the individual author(s) and contributor(s) and not of MDPI and/or the editor(s). MDPI and/or the editor(s) disclaim responsibility for any injury to people or property resulting from any ideas, methods, instructions or products referred to in the content. |
© 2024 by the authors. Licensee MDPI, Basel, Switzerland. This article is an open access article distributed under the terms and conditions of the Creative Commons Attribution (CC BY) license (http://creativecommons.org/licenses/by/4.0/).
Copyright: This open access article is published under a Creative Commons CC BY 4.0 license, which permit the free download, distribution, and reuse, provided that the author and preprint are cited in any reuse.


