Submitted:
15 March 2024
Posted:
18 March 2024
Read the latest preprint version here
Abstract
Mango (Mangifera indica L.) is an allotetraploid (2n = 4X= 40) drupe fruit and has high nutritional value belongs to genus Mangifera and family Anacardiaceae. Mango cultivars are used with worldwide acceptance to pharmacological, ethnomedical, and phytochemical industries. Assessment of the genetic distinctiveness of a cultivar through morphological descriptors is an important tool for both the registration and the protection. New mango genotypes have been improved using valuable diverse germplasm resources to ensure food security. DNA fingerprinting based simple sequence repeats (SSR)-markers have been the most broadly used, effective and accurate in evaluation of genetic characterization of a cultivar. Molecular breeding is an effective source of genetic gain after improvement of fruit trees using marker assisted genomic selection. Total genomic DNA (gDNA) was generated using CTAB method from each cultivar. The most effective 50 hyper-variable SSR markers were selected. Highly specific DNA fingerprints were identified in the candidate line ‘Azeem Chaunsa’ compared with three standard cultivars using SSR-PCR. An agglomerative hierarchical clustering method was used to construct dendrogram based on the UPGMA clustering method. Cultivar identification diagram (CID) was constructed to evaluate association among standard cultivars and Azeem Chaunsa. Our results showed that SSR markers could efficiently assess genetic diversity in mango. The genetic similarity coefficients were recorded between the cultivars of mango ranged from 0.49 to 0.67. CID results concluded that cultivar ‘Azeem Chaunsa’ varied significantly from the check cultivar, Sindhri (46.2%), S.B Chaunsa (45%) and Sufaid Chaunsa (46.7%). The results obtained in this study will orient cultivar identification strategies for a successful future.
Keywords:
Mango tree
; SSR markers
; mango varieties
; genetic diversity
; cultivar identification diagram
; loci
; polymorphism
; genetic resources in Pakistan
; breeding
; cultivar development
1. Introduction
The mango (Mangifera indica L.) is the most popular cultivated commercial fruit with great economic value and important long-lived evergreen tree [1]. Mango has been ranked third in production and second major fruit in Pakistan, participating to food and nutritional security to rural economy. Mango is known as “king of fruits” originated from subcontinent belonging to an earliest cultivated fruits. Mango production is concentrated in Pakistan in Sindh province as tropical climate while in Punjab have the subtropical climate [2]. Pakistan has commercial exportable mango cultivars as Sindhri (Early), SB Chaunsa (Mid) and Sufaid Chaunsa (Late) fruit availability and have approximately 3.5 months window for export of mangoes to other countries [3]. Mango fruit trees have been widely grown in tropical and subtropical areas. China and Pakistan are among the top mango producer countries. Mangoes are one of the major horticultural fruit crops in Punjab with 76% and Sindh provinces 24% share in mango production in Pakistan. In China, tropical provinces such as Hainan, Guangxi, Guangdong, Yunnan, Fujian, and Sichuan are major mango producers. Selection among chance seedling with superior traits of fruit quality as well as planned breeding with marker assisted selection considered a quick and precise technique for the development of mango varieties. Mango is often cross-pollinated [4], an allotetraploid (2n = 4X= 40) [5], highly heterozygous tree fruit, mono- and polyembryonic seed and having small imputed genome size of approximately 440-480 MB[6,7]. The genes controlling the traits can be mapped using high-throughput sequencing [8,9]. New mango varieties are generated by hybridization, introduction, selection and breeding of novel transgenes or genotypes [10,11].
Commercial mango varieties have largely been grown under varying planting geometries and were maintained by using clonal propagation by grafting of a specific variety or mutated branches [12]. Mango trees are heteroecious and cross-breeding has become dominant with high world popularity. Simple sequence repeats (SSR) or microsatellites are categorized as genetic loci and are tandem repeats, highly abundant and broadly distributed across both the prokaryotic and eukaryotic genomes. Compared with RFLP and RAPD, the advantages of SSR molecular markers include multi-allelic, clear loci, highly polymorphic, good repeatability, high resolution, codominate, reliable detection, high abundance, simple experimental design, easy operation and high distribution in plant genomes. The SSR DNA markers are widely used for genotype DNA identification, variety or hybrid certification, parent detection, diversity analysis in diverse forest fruit species including mango [13,14,15]. More than 1000 named mango commercial cultivars have been reported to exist around the worldwide. More than 100 SSR markers have been used to identify, characterize and evaluate various mango germplasm [16,17,18]. Germplasm evaluation and genetic diversity in mango using SSR markers gain significant advancement for evaluation of hybrids or cultivars, determination of genetic variations and conservation of germplasm [7]. SSR markers have widely used for identification of the domestication and movement of germplasm [19]. Genetic diversity evaluation in candidate cultivar using SSR molecular technology is based on SSR-PCR amplifications. The polyacrylamide gel electrophoresis and silver staining procedures were used to visualize and analyze the amplified segments as DNA fingerprints [20,21].
In Pakistan, mango is an exportable fresh fruit commodity. Several breeding lines are created to develop competitive cultivars with excellent production [22]. In mango, variety evaluation is important for utilization of the valuable genetic resource. The present study was performed to estimate the genetic variability created in mango cultivar ‘Azeem Chaunsa’ recommended for cultivation in Punjab using SSR markers. The genetic diversity of Azeem Chaunsa’ cultivar was also compared with other improved standard mango cultivars cultivated in Punjab. Mango reciprocal cross breeding method is frequently used for breeding new mango cultivars in hybridization program [23]. The progeny have the probability of both superior and inferior traits, tested after passing long juvenility. It is difficult to differentiate the authenticity of the offspring of hybrid. To evaluate cultivar identification and diversity of Pakistani mango genetic resources, 50 standard polymorphic SSR markers were selected for rapid genetic purity assessment in mango. Several commercially grown mango cultivars or hybrids were assessed accurate parentages. The present study was performed to determine genetic diversity among candidate mango cultivar and standard mango cultivars using hyper-variable polymorphic SSR markers. In the current study, unique and rare alleles were also identified and reconfirmed that would be useful for determination of genetic purity of cultivars in mango.
2. Materials and Methods
2.1. Experimental Material
The mango cultivars classified according to fruit availability such as Sindhri (Early season), Samar Bahisht (S.B) Chaunsa (Mid-season) and Sufaid Chaunsa (Late season), and the candidate cultivars ‘Azeem Chaunsa’ were grown in separate block and follow the planting geometry of 27 feet distance in between the rows and 22 feet distance in plants which accommodated 72 plants per acre in Mango Research Station, Shujabad, Multan. Freshly emerged tender leaves were collected for extraction of DNA samples. A set of perfect mango polymorphic SSR markers was selected for testing based on high polymorphism, stable amplification and clear banding patterns. The SSR primers were obtained from different genomic databases based on wide genome coverage. The fully grown mature and uniform mango trees having uniform age and size in the experimental orchard of “Mango Research Station” Shujabad, Punjab (Pakistan), located at latitude 29.8717° N and 71.3231° E, belonging to the Sub-Tropical Arid Climate. The standard cultivars are commercially grown in all the provinces of Pakistan and differ in geographical region. The standard cultivars such as Sindhri, Samar Bahisht (S.B) Chaunsa and Sufaid Chaunsa, have been approved by Punjab Seed Council, Lahore, Punjab, Pakistan. Experimental materials were collected in compliance with the institutional, national, and international guidelines and legislation.
2.2. Genomic DNA (gDNA) Extraction and Analysis
Total genomic DNA (gDNA) was generated from 4-5 young fully expanding leaves of each cultivar. The gDNA extraction was performed using the dried ground leaves of seedlings using the cetyltrimethylammonium bromide (CTAB) protocol with minor modification. The quality of gDNA was evaluated by loading 15 ng DNA of each genotype on 0.8% agarose gel prepared in IX TBE buffer and stained with ethidium bromide (10 ng/100 ml). Samples showing intact bands were selected to use for further study. The DNA concentration and purity of each cultivar was determined using a Nano Drop® ND-1000 spectrophotometer by estimating absorbance (OD260/280). Intact gDNA bands were marked for further SSR-PCR. The gDNA was stored at − 20 °C.
2.3. Search for Mango Simple Sequence Repeat Markers and Choice of PCR Primers
SSR markers were selected from the reference databases [18,24,25,26]. A total of 50 pairs of highly polymorphic SSR primers with different amplification bands among ‘Sufaid Chaunsa’, ‘Sindhri’, and S.B. Chaunsa ’and‘ Azeem Chaunsa′ were selected for cultivar identification (Table 1). The amplification efficiency of the selected SSR markers was evaluated using SSR-PCR.
2.4. PCR Amplification and SSR Fragment Analysis
PCR was completed with all 50 SSR primers pairs and 200 samples of variety used in this study. PCR was performed 25μL reaction volumes containing 12μL of 2x Green PCR master mix, 0.6 uM forward and reverse primers (approximately 25 ng of gDNA), and 50ng of gDNA as a template. Amplification was performed in a Thermal cycler (eppendorf Mastercycler gradient). The Mastercycler was programmed to pre-denaturation step of 94°C for 5 min followed by 35 cycles of denaturation 94°C for 30 sec, approximately annealing 55-60°C for 1 min (varied with Tm of different primers) and 72°C for 1 min followed by a final synthesis at 72 °C for 5 min. The reactions were then held at 4 °C. Amplifications were performed for twice and only reproducible products were considered for further data analysis.
2.5. Denaturing Polyacrylamide Gel Electrophoresis (PAGE)
In order to explore genetic polymorphism, 3μL of denatured SSR-PCR mixture was resolved on 6% Polyacrylamide (19:1 acrylamide: bis-acrylamide) Gel Electrophoreses (PAGE) (for high resolution). The 50bp DNA ladder (Fermentas, USA) was used as a molecular size marker. The amplified bands were visualized by silver nitrate staining in an ethidium bromide solution as described [21]. The gel profile was photographed under UV light as digital images using a gel documentation and analysis system.
2.6. Band Recording DATA Analysis for DNA Fingerprinting
The binary data matrices obtained from SSR markers were processed at DN fingerprinting level. The presence of band will be scored as 1, whereas the absence will be scored as 0. The binary data matrix will be used for dendrogram construction. Cluster analysis was performed on the similarity coefficient matrix. The Jaccard similarity matrix was used for cluster analysis using Unweighted Pair Group Method of Arithmetic average (UPGMA)[27] into Numerical Taxonomy System of Multivariate Programs (NTSyspc) (version 2.10e) software package [28]. Exact size of DNA fragment was recorded for each variety and primer. The distinct bands are identified and labeled as DNA fingerprints.
2.7. Staistical Analysis
The amplified SSR bands resulting from the SSR-PCR were summarized as graphical representations using R-language (version 3.1.1, software version 3.5.1) [29].
3. Results
3.1. Genetic Amplification of Mango Cultivars using SSR Markers
A total of 50 pairs of polymorphic SSR markers were selected to process two hundred leaf samples of DNA from each standard cultivar and candidate mango line ‘Azeem Chaunsa’ as templates (Table 1). The polymorphic SSR marker primers were selected to amplify and distinguish bands for screening. Out of 50 polymorphic SSR primers, 47 primers pairs amplified 82 SSR fragments from the candidate Azeem Chaunsa. Similarly 49 primers set amplified a total of 105 SSR fragments in Sufaid Chaunsa genome. The 41 primers amplified 62 polymorphic bands in Sindhri, and each primer pair amplified an average of 1.5 polymorphic fragments. The 41 primers amplified 70 polymorphic bands in S.B Chaunsa, and each primer pair amplified an average of 1.7 polymorphic fragments. A total of 319 DNA fragments were obtained across all genotypes using the 50 SSR primers. A set of 34 SSR primers showed amplification in all cultivars. Similarly, 40 common fragments were amplified in all cultivars (Figure 1 and Figure 2 and Table 2)
Out of fifty primers of polymorphic SSR markers, only 47 primers showed amplification in Azeem Chaunsa, 41 primers showed amplification in Sindhri and SB Chaunsa. The highest efficiency of primers observed in Sufaid Chaunsa (Figure 1).
Seven SSR marker showed highest amplification of fragments in all cultivars; MiSHRS-48, MGDSSR11, MGDSSR34, MillHR21, mMiCIR016, mMiCIR030, and MIAC251-1. Some SSR marker primers showed very low amplification of fragments: MillHR20a and AJ635178 (Table 2).
3.2. Distribution of Unique SSRs with Polymorphism
The 50 SSR primer pairs generated a total of 154 alleles with an average of 3.08 alleles per primer pair in all cultivars of Mango. Out of 154 alleles, 130 were found polymorphic alleles. The highest allele size range was observed in following SSR markers: mMiCIRO18, MGDSSR11, MillHR21, MITGg62, MICA231-1, MICA235, MIGA2O3, MIAC251-1, and AJ635164. The highest number of alleles was generated by SSR markers in mango cultivars: mMiCIRO18, MiSHRS-48, MGDSSR5, MGDSSR34, mMiCIR030, and MICA231-1. The highest number of polymorphic alleles was mMiCIRO18, MiSHRS-48, MGDSSR5, mMiCIR030, and MICA231-1 (Table 3). The highest rate of polymorphism generated by following SSR markers: mMiCIRO18, MGDSSR5, mMiCIR030, and MICA231-1 (Table 3).
3.3. SSR Fingerprinting/ Allelic Diversity
Four mango cultivars were DNA fingerprinted. The SSR profiling of highly diverse candidate line Azeem Chaunsa cultivar exhibited polymorphism using 50 SSR markers. Out of 50 SSR, 47 SSR primer pairs yielded strong amplification in candidate cultivar. The allele size varied from 90 bp in MIAC-4 to 700 bp in MIAC251-1 in Azeem Chaunsa cultivar. The number of alleles per marker varied from 1 (LMMA1F) to 4 (MGDSSR34, MillHR21).
In total, 82 SSR alleles were amplified in the candidate line Azeem Chaunsa using 50 SSR markers. Out of 82 SSR alleles, 60 SSR alleles were detected as polymorphic. The SSR alleles of 160 bp, 200 bp (marker name mMiCIRO14), 280 bp (mMiCIRO18), 210 bp (MiSHRS-1), 280 bp (MiSHRS-48), 100 bp (MIAC-4), 390 bp (MIAC-6), 100 bp, 175 bp, 180 bp (MGDSSR34), 230 bp (mMiCIR005), 100 bp (MITGI75), 170 bp of (MITGg62), 320 bp (MICA231-1), 380 bp (MIGA2O3), 190 bp (MillHR20a) were amplified only in Azeem Chaunsa genome. The analysis revealed a total of 60 polymorphic alleles ranging from 1 to 3 per locus, with an average of 1.2 alleles per locus in candidate line (Table 4). However, there are four SSRs i.e. mMiCIRO14, MGDSSR34, MillHR21 and MITGg62 which yielded 3 alleles per locus.
3.5. DNA Fingerprinting Analysis
The genetic relation at DNA fingerprint level among the standard cultivars and candidate line was evaluated using cluster analysis. The cultivar identification diagram (CID) was constructed using UPGMA algorithm for the evaluation of genetic diversity and relatedness among the mango cultivars. CID presenting association among standard cultivars (Sufaid Chaunsa, Sindhri and S.B Chaunsa) based on the phylogenetic relationship using coefficients by NTSYS cluster analysis (Figure 3). Dice similarity coefficients were calculated for the 50 SSR markers, and a UPGMA tree was generated (Figure 3). Cluster I consists of Azeem Chaunsa and further divided into two cultivars, S.B Chaunsa and Sindhri. Cluster II consists of Sufaid Chaunsa. Cluster III consisted of Chenab-Gold. X-axis represents similarity coefficient between genotypes with ranged from 0.49-0.67. CID results concluded that candidate cultivar ‘Azeem Chaunsa’ varied significantly from the standard cultivar Sufaid Chaunsa (46.7% dissimilarity), Sindhri (46.2% dissimilarity) and SB Chaunsa (45% dissimilarity).
4. Discussion
The standard cultivars included in the present study probably represent a major component of the mango gene pool in Pakistan. Further, SSR markers have been broadly used in mango genetic research to differentiate cultivars, hybrids and to evaluate new varieties [13,14]. The improvement in genetic and agronomic traits for high yield potential in fruit plants is highly based on the proper assessment of diversity analysis. Systematic mango breeding is laborious, time-consuming and is a long-term endeavor (up to 25 years) due to a highly heterozygous genome as well as long juvenility. Promising selection, introduction, evaluation of cross-breeding progenies and mutational breeding has been widely used to develop mango cultivars, varieties and hybrids [23,30,31]. In current study, a mango candidate line was developed and further molecular diversity was analyzed with three standard cultivars using SSR markers. Highly unique, diverase cultivars of mango have been grown in Punjab and Sindh provinces of Pakistan as they have a long history of breeding. In mango, variety identification has been greatly challenging. The SSR markers are very sensitive to evaluate hybrid mango lines to identify genetic contamination. Several microsatellite as molecular markers such as SSR have been developed for the Mango [18,24,26]. These markers have shown to be reliable, consistent and reasonably discriminative for use by several laboratories as a mango genotyping tool. In this study, 50 pairs of SSR primers were used for PCR amplifications of different bands in all four mango cultivars (Table 1 and Table 2). Among these primers, 45 pair of primers showed amplification in the candidate line ‘Azeem Chaunsa’ as shown (Figure 1 and Table 2). The highest polymorphic ratio of the SSR primers are associated with the hyper variable nature of the SSR markers. The maximum number of polymorphic bands was obtained by the mMiCIRO18, MiSHRS-48, MGDSSR5, mMiCIR030, mMiCIR030, and MICA231-1 SSR primers (Table 3). MillHR21 and mMiCIR030 primers recorded the highest (twelve) amplified bands. While the lowest (one) numbers of amplified bands was recorded in MillHR20a and AJ635178 (Table 2). The results are in agreement with previous reports based on SSR markers developed for Mangifera indica to evaluate mango varieties in India [18,32,33], China [14,34], Indonesia [35], Pakistan [3,36], Maxico [37] and Japan [13].
The polymorphism ratio of amplified alleles was observed very high, and several unique alleles were identified in the candidate line which provides important basis for subsequent use these primers. The 45 primer pairs generated clear single-locus polymorphic bands and 5 primers pairs yielded monomorphic bands in the candidate line. The 50 SSR primer pairs generated a total of 319 fragments in 4 mango cultivars with an average of 6.38 fragments per primer. Notably, primers MGDSSR1, mMiCIR013, MillHR07a, MillHR20a, AY942826, AJ635178 and AB190349 did not present any polymorphic bands (Table 2 and Table 3). These results are in agreement with previous studies on mango [13,14].
Generally for UPGMA based cultivar identification and the construction of dendrogram, more than 10 markers were used [38]. Therefore, these highly polymorphic SSR primer pairs can be applied as core primer pairs for variety identification. In this study, DNA fingerprints of the 4 mango cultivars were constructed according to the original data matrix of amplification results (Figure 3). The number of bands produced across 4 mango varieties by different SSR primers is consistent with published reports on microsatellite frequency in the mango genome [13,14].
Author Contributions
Conceptualization, J.I., M.A.A., and B.A.P.; methodology, J.I., M.K., M.A.A.; software, M.A.A and B.A.P., validation, J.I., M.A.A., and M.K; formal analysis, J.I.; investigation, M.K., J.I., and M.A.A.; resources, B.A.P., and J.I., data curation, J.I., and M.A.A.,: writing—original draft preparation, M.A.A., and J.I.; writing—review and editing, B.A.P., M.A.A., and J.I.; visualization, J.I., and M.K.; supervision, J.I., B.A.P, and M.A.A.; project administration, J.I., and M.K; funding acquisition, J.I., and B.A.P. All authors have read and agreed to the published version of the manuscript.
Funding
This research was supported by researchers supporting project number (RSP2023R144), King Saud University, Riyadh, Saudi Arabia.
Data Availability Statement
Not applicable.
Acknowledgments
The authors would like to extend their sincere appreciation to the researchers supporting project number (RSP2023R144), King Saud University, Riyadh, Saudi Arabia.
Conflicts of Interest
The authors declare that they no competing interest.
References
- Litz, R.E. The mango: botany, production and uses; Cabi, 2009. [Google Scholar]
- Khanum, Z.; Tiznado-Hernández, M.E.; Ali, A.; Musharraf, S.G.; Shakeel, M.; Khan, I.A. Adaptation mechanism of mango fruit (Mangifera indica L. cv. Chaunsa White) to heat suggest modulation in several metabolic pathways. RSC advances 2020, 10, 35531–35544. [Google Scholar] [CrossRef] [PubMed]
- Zahid, G.; Aka Kaçar, Y.; Shimira, F.; Iftikhar, S.; Nadeem, M.A. Recent progress in omics and biotechnological approaches for improved mango cultivars in Pakistan. Genetic Resources and Crop Evolution 2022, 69, 2047–2065. [Google Scholar] [CrossRef]
- Ramírez, F.; Davenport, T.L. Mango (Mangifera indica L.) pollination: a review. Scientia Horticulturae 2016, 203, 158–168. [Google Scholar] [CrossRef]
- Mukherjee, S.K. Mango: its allopolyploid nature. Nature 1950, 166, 196–197. [Google Scholar] [CrossRef] [PubMed]
- Wang, P.; Luo, Y.; Huang, J.; Gao, S.; Zhu, G.; Dang, Z.; Gai, J.; Yang, M.; Zhu, M.; Zhang, H. The genome evolution and domestication of tropical fruit mango. Genome biology 2020, 21, 1–17. [Google Scholar] [CrossRef] [PubMed]
- Sherman, A.; Rubinstein, M.; Eshed, R.; Benita, M.; Ish-Shalom, M.; Sharabi-Schwager, M.; Rozen, A.; Saada, D.; Cohen, Y.; Ophir, R. Mango (Mangifera indica L.) germplasm diversity based on single nucleotide polymorphisms derived from the transcriptome. BMC Plant Biology 2015, 15, 1–11. [Google Scholar] [CrossRef] [PubMed]
- Mahato, A.K.; Sharma, N.; Singh, A.; Srivastav, M.; Jaiprakash; Singh, S.K.; Singh, A.K.; Sharma, T.R.; Singh, N.K. Leaf transcriptome sequencing for identifying genic-SSR markers and SNP heterozygosity in crossbred mango variety ‘Amrapali’(Mangifera indica L.). PloS one 2016, 11, e0164325. [Google Scholar] [CrossRef] [PubMed]
- Song, M.; Wang, H.; Fan, Z.; Huang, H.; Ma, H. Advances in sequencing and key character analysis of mango (Mangifera indica L.). Horticulture Research 2023, 10, uhac259. [Google Scholar] [CrossRef] [PubMed]
- Carella, A.; Gianguzzi, G.; Scalisi, A.; Farina, V.; Inglese, P.; Bianco, R.L. Fruit growth stage transitions in two mango cultivars grown in a Mediterranean environment. Plants 2021, 10, 1332. [Google Scholar] [CrossRef] [PubMed]
- Samal, K.; Jena, R.; Swain, S.; Das, B.; Chand, P. Evaluation of genetic diversity among commercial cultivars, hybrids and local mango (Mangifera indica L.) genotypes of India using cumulative RAPD and ISSR markers. Euphytica 2012, 185, 195–213. [Google Scholar] [CrossRef]
- Iqbal, J.; Kiran, S.; Hussain, S.; Iqbal, R.K.; Ghafoor, U.; Younis, U.; Zarei, T.; Naz, M.; Germi, S.G.; Danish, S. Acidified biochar confers improvement in quality and yield attributes of sufaid chaunsa mango in saline soil. Horticulturae 2021, 7, 418. [Google Scholar] [CrossRef]
- Yamanaka, S.; Hosaka, F.; Matsumura, M.; Onoue-Makishi, Y.; Nashima, K.; Urasaki, N.; Ogata, T.; Shoda, M.; Yamamoto, T. Genetic diversity and relatedness of mango cultivars assessed by SSR markers. Breeding science 2019, 69, 332–344. [Google Scholar] [CrossRef] [PubMed]
- Li, X.; Zheng, B.; Xu, W.; Ma, X.; Wang, S.; Qian, M.; Wu, H. Identification of F1 hybrid progenies in mango based on Fluorescent SSR markers. Horticulturae 2022, 8, 1122. [Google Scholar] [CrossRef]
- Hussein, M.A.; Eid, M.; Rahimi, M.; Filimban, F.Z.; Abd El-Moneim, D. Comparative Assessment of SSR and RAPD markers for genetic diversity in some Mango cultivars. PeerJ 2023, 11, e15722. [Google Scholar] [CrossRef] [PubMed]
- Chiang, Y.C.; Tsai, C.M.; Chen, Y.K.H.; Lee, S.R.; Chen, C.H.; Lin, Y.S.; Tsai, C.C. Development and characterization of 20 new polymorphic microsatellite markers from Mangifera indica (Anacardiaceae). American journal of botany 2012, 99, e117–e119. [Google Scholar] [CrossRef] [PubMed]
- Dillon, N.L.; Innes, D.J.; Bally, I.S.; Wright, C.L.; Devitt, L.C.; Dietzgen, R.G. Expressed sequence tag-simple sequence repeat (EST-SSR) marker resources for diversity analysis of mango (Mangifera indica L.). Diversity 2014, 6, 72–87. [Google Scholar] [CrossRef]
- Ravishankar, K.V.; Mani, B.H.R.; Anand, L.; Dinesh, M.R. Development of new microsatellite markers from Mango (Mangifera indica) and cross-species amplification. American Journal of Botany 2011, 98, e96–e99. [Google Scholar] [CrossRef] [PubMed]
- Venison, E.P.; Litthauer, S.; Laws, P.; Denancé, C.; Fernández-Fernández, F.; Durel, C.-E.; Ordidge, M. Microsatellite markers as a tool for active germplasm management and bridging the gap between national and local collections of apple. Genetic Resources and Crop Evolution 2022, 69, 1817–1832. [Google Scholar] [CrossRef]
- Ji, Y.T.; Qu, C.Q.; Cao, B.Y. An optimal method of DNA silver staining in polyacrylamide gels. Electrophoresis 2007, 28, 1173–1175. [Google Scholar] [CrossRef]
- Huang, L.; Deng, X.; Li, R.; Xia, Y.; Bai, G.; Siddique, K.H.; Guo, P. A fast silver staining protocol enabling simple and efficient detection of SSR markers using a non-denaturing polyacrylamide gel. JoVE (Journal of Visualized Experiments) 2018, e57192. [Google Scholar]
- Azmat, M.A.; Khan, A.A.; Khan, I.A.; Rajwana, I.A.; Cheema, H.M.N.; Khan, A.S. Morphological characterization and SSR based DNA fingerprinting of elite commercial mango cultivars. Pakistan Journal of Agricultural Sciences 2016, 53. [Google Scholar] [CrossRef]
- Bally, I.S.; Dillon, N.L. Mango (Mangifera indica L.) breeding. Advances in Plant Breeding Strategies: Fruits: Volume 3 2018, 811–896. [Google Scholar]
- Duval, M.-F.; Bunel, J.; Sitbon, C.; Risterucci, A.-M. Development of microsatellite markers for mango (Mangifera indica L.). Molecular Ecology Notes 2005, 5, 824–826. [Google Scholar] [CrossRef]
- Schnell, R.; Olano, C.; Quintanilla, W.; Meerow, A. Isolation and characterization of 15 microsatellite loci from mango (Mangifera indica L.) and cross-species amplification in closely related taxa. Molecular Ecology Notes 2005, 5, 625–627. [Google Scholar] [CrossRef]
- Ravishankar, K.V.; Dinesh, M.; Nischita, P.; Sandya, B. Development and characterization of microsatellite markers in mango (Mangifera indica) using next-generation sequencing technology and their transferability across species. Molecular Breeding 2015, 35, 1–13. [Google Scholar] [CrossRef]
- Jaccard, P. Nouvelles recherches sur la distribution florale. Bull. Soc. Vaud. Sci. Nat. 1908, 44, 223–270. [Google Scholar]
- FJ, R. NTSYS-pc: numerical taxonomy and multivariate analysis system, version 2.1; Exeter Software: New York, 2000. [Google Scholar]
- Gandrud, C. Reproducible research with R and RStudio; Chapman and Hall/CRC: 2018.
- Campbell, R.; Zill, G. Mango selection and breeding for alternative markets and uses. In Proceedings of the VIII International Mango Symposium 820; 2006; pp. 189–196. [Google Scholar]
- Michael, V.N.; Crane, J.; Freeman, B.; Kuhn, D.; Chambers, A.H. Mango seedling genotyping reveals potential self-incompatibility and pollinator behavior. Scientia Horticulturae 2023, 308, 111599. [Google Scholar] [CrossRef]
- Ravishankar, K.V.; Bommisetty, P.; Bajpai, A.; Srivastava, N.; Mani, B.H.; Vasugi, C.; Rajan, S.; Dinesh, M.R. Genetic diversity and population structure analysis of mango (Mangifera indica) cultivars assessed by microsatellite markers. Trees 2015, 29, 775–783. [Google Scholar] [CrossRef]
- Surapaneni, M.; Vemireddy, L.R.; Begum, H.; Purushotham Reddy, B.; Neetasri, C.; Nagaraju, J.; Anwar, S.; Siddiq, E. Population structure and genetic analysis of different utility types of mango (Mangifera indica L.) germplasm of Andhra Pradesh state of India using microsatellite markers. Plant Systematics and Evolution 2013, 299, 1215–1229. [Google Scholar] [CrossRef]
- Wang, M.; Ying, D.; Wang, Q.; Li, L.; Zhang, R. Genetic Diversity Analysis and Fingerprint Construction of Major Mango Cultivars in China. Agricultural Science & Technology 2016, 17, 1289. [Google Scholar]
- Razak, S.A.; Azman, N.H.E.N.; Ismail, S.N.; Yusof, M.F.M.; Ariffin, M.A.T.; Sabdin, Z.H.M.; Hassan, M.H.M.; Nasir, K.H.; Sani, M.A.; Abdullah, N. Assessment of diversity and population structure of mango ('Mangifera indica'L.) germplasm based on microsatellite (SSR) markers. Australian Journal of Crop Science 2019, 13, 315–320. [Google Scholar] [CrossRef]
- Khan, A.S.; Ali, S.; Khan, I.A. Morphological and molecular characterization and evaluation of mango germplasm: An overview. Scientia Horticulturae 2015, 194, 353–366. [Google Scholar] [CrossRef]
- Gálvez-López, D.; Hernández-Delgado, S.; González-Paz, M.; Becerra-Leor, E.N.; Salvador-Figueroa, M.; Mayek-Pérez, N. Genetic analysis of mango landraces from Mexico based on molecular markers. Plant Genetic Resources 2009, 7, 244–251. [Google Scholar] [CrossRef]
- Segura-Alabart, N.; Serratosa, F.; Gómez, S.; Fernández, A. Nonunique UPGMA clusterings of microsatellite markers. Briefings in Bioinformatics 2022, 23, bbac312. [Google Scholar] [CrossRef] [PubMed]
Figure 1.
Venn Diagram of SSR marker primer pairs showing amplifiction in mango cultivars. SSR primers amplified different fragments in four cultivars: Sufaid Chunsa, Sindhri, S.B Chunsa and Azeem Chunsa. The degree of ovelap between mango cultivars was obserevd at primer level. The intersetcion of four cultivars showed 34 common SSR primers pairs.
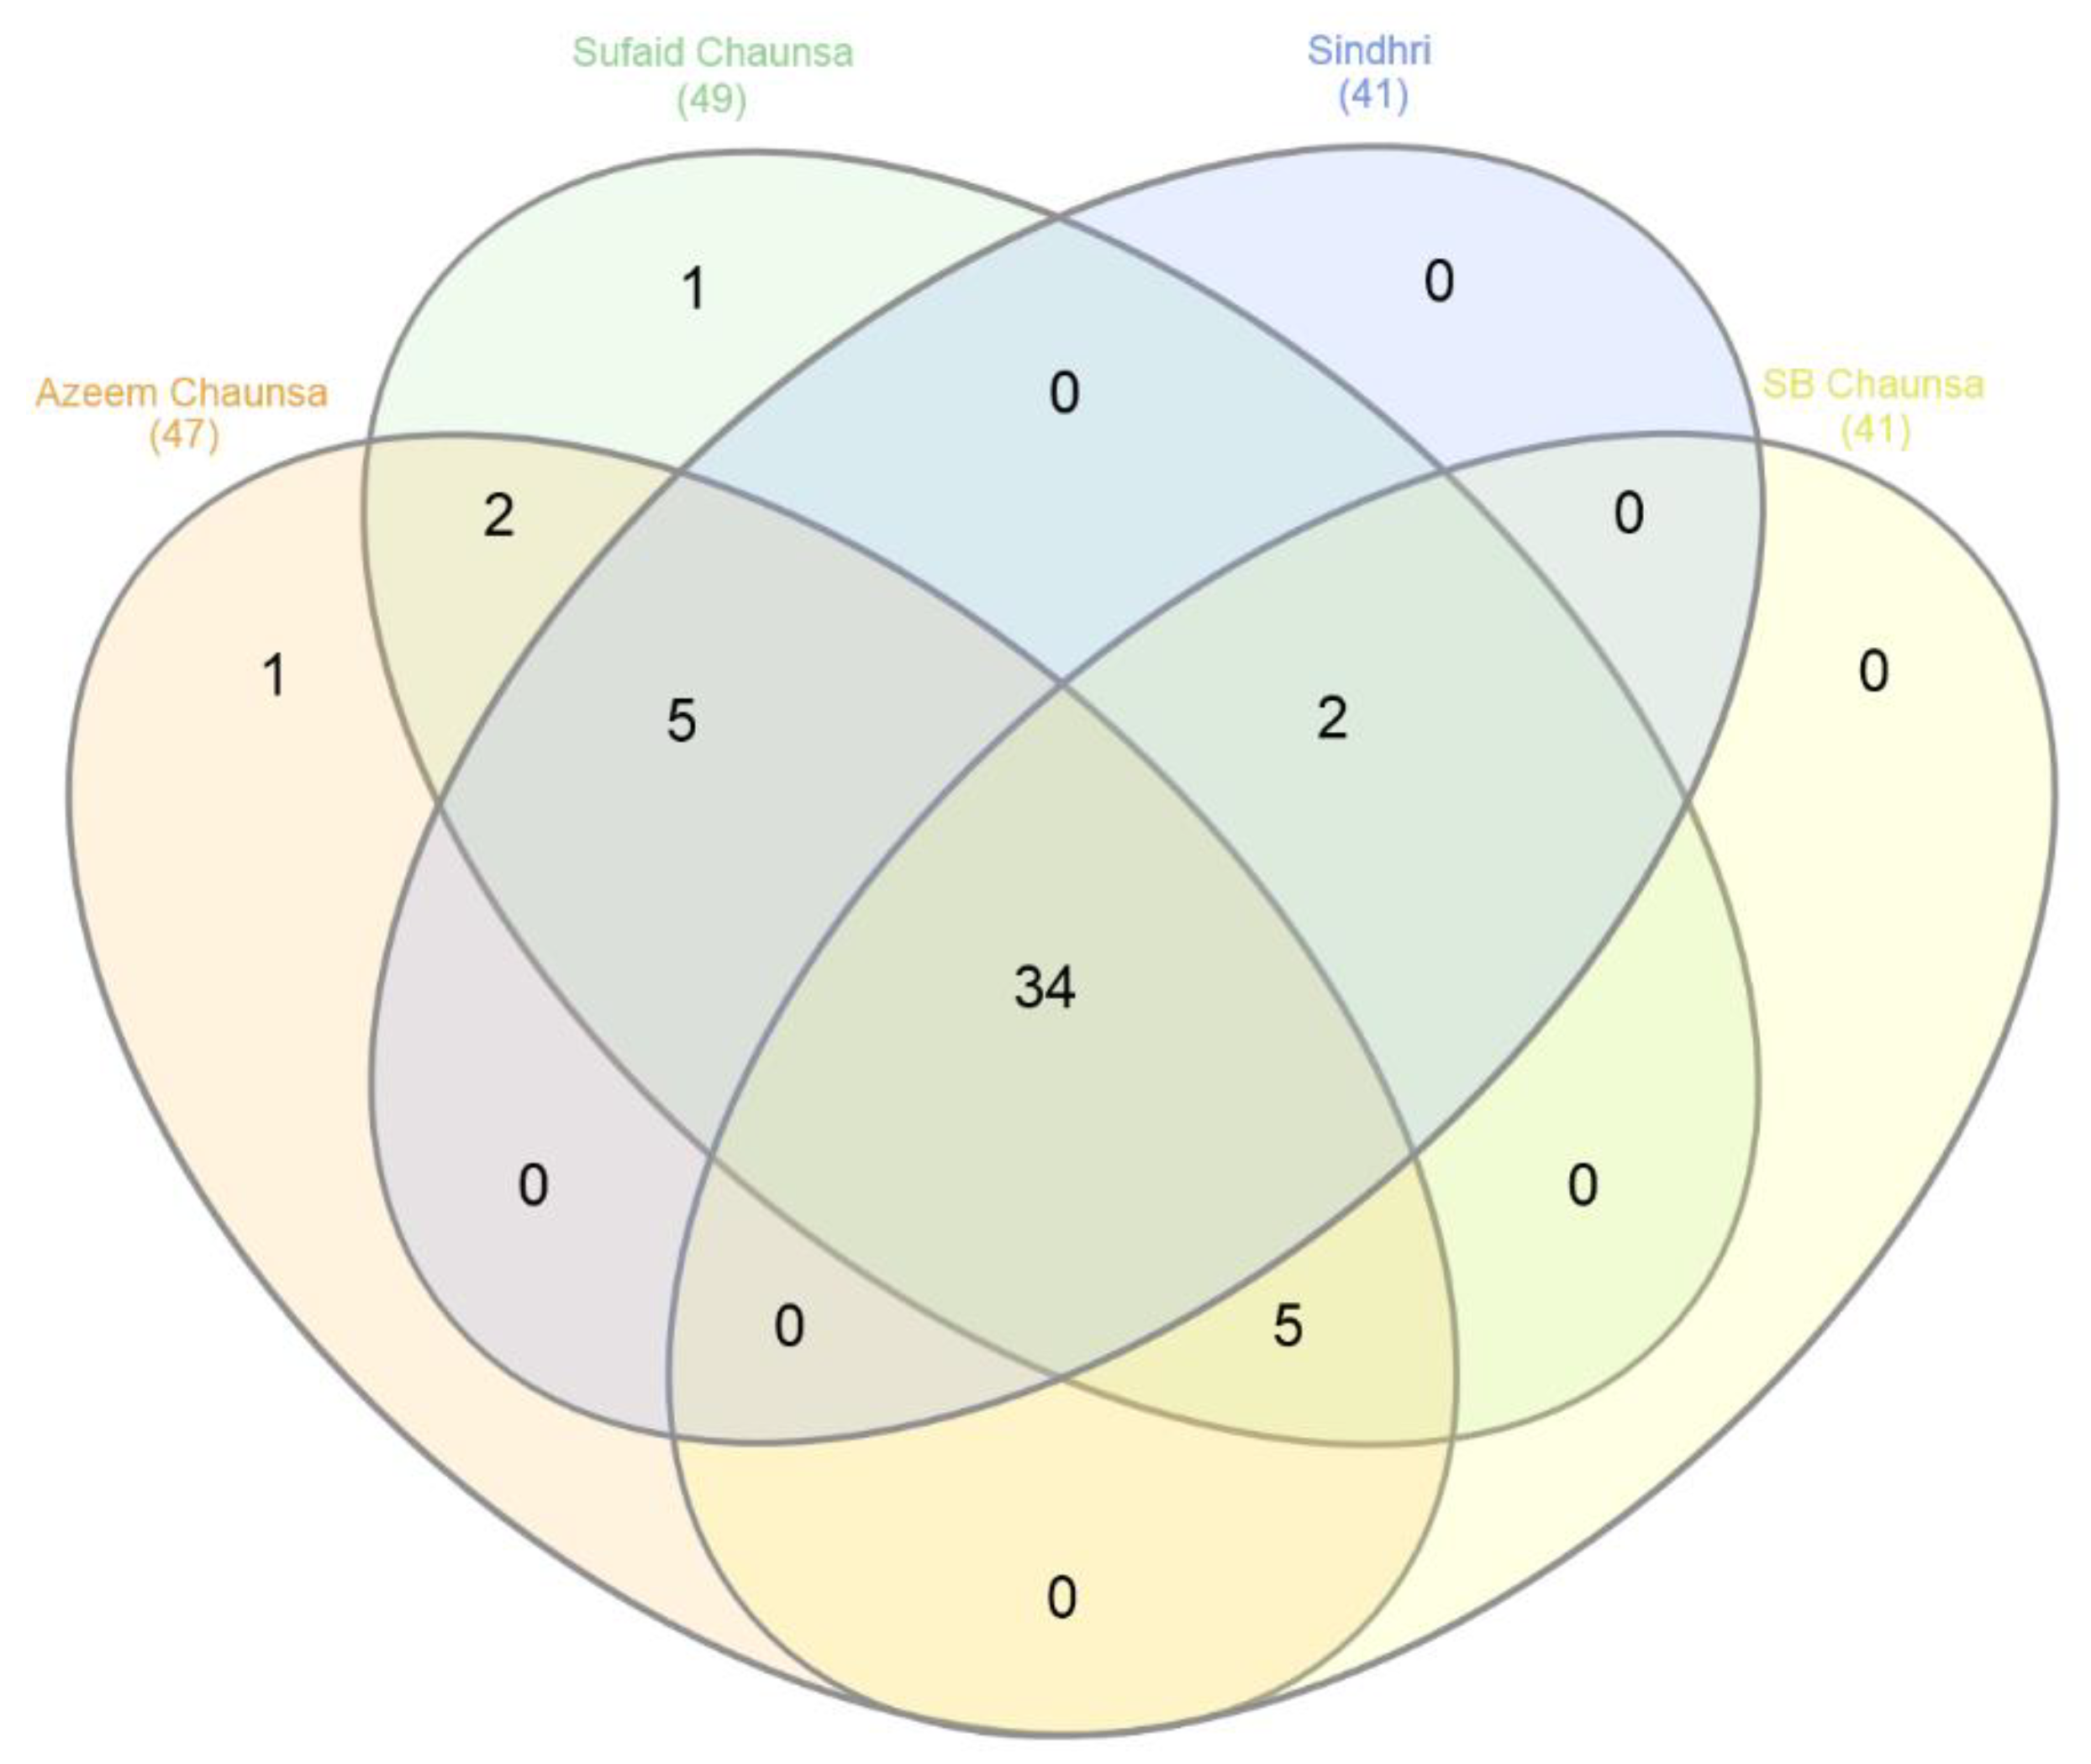
Figure 2.
Venn Diagram showing common and exclusive fragments obtained from mango cultivars genomes. SSR primers amplified different fragments in four cultivars: Sufaid Chunsa, Sindhri, S.B Chunsa and Azeem Chunsa. The degree ovelap between mango cultivars was obserevd at fragment level. The intersetcion of four cultivars showed 40 common fragments amplified by SSR primer pairs.
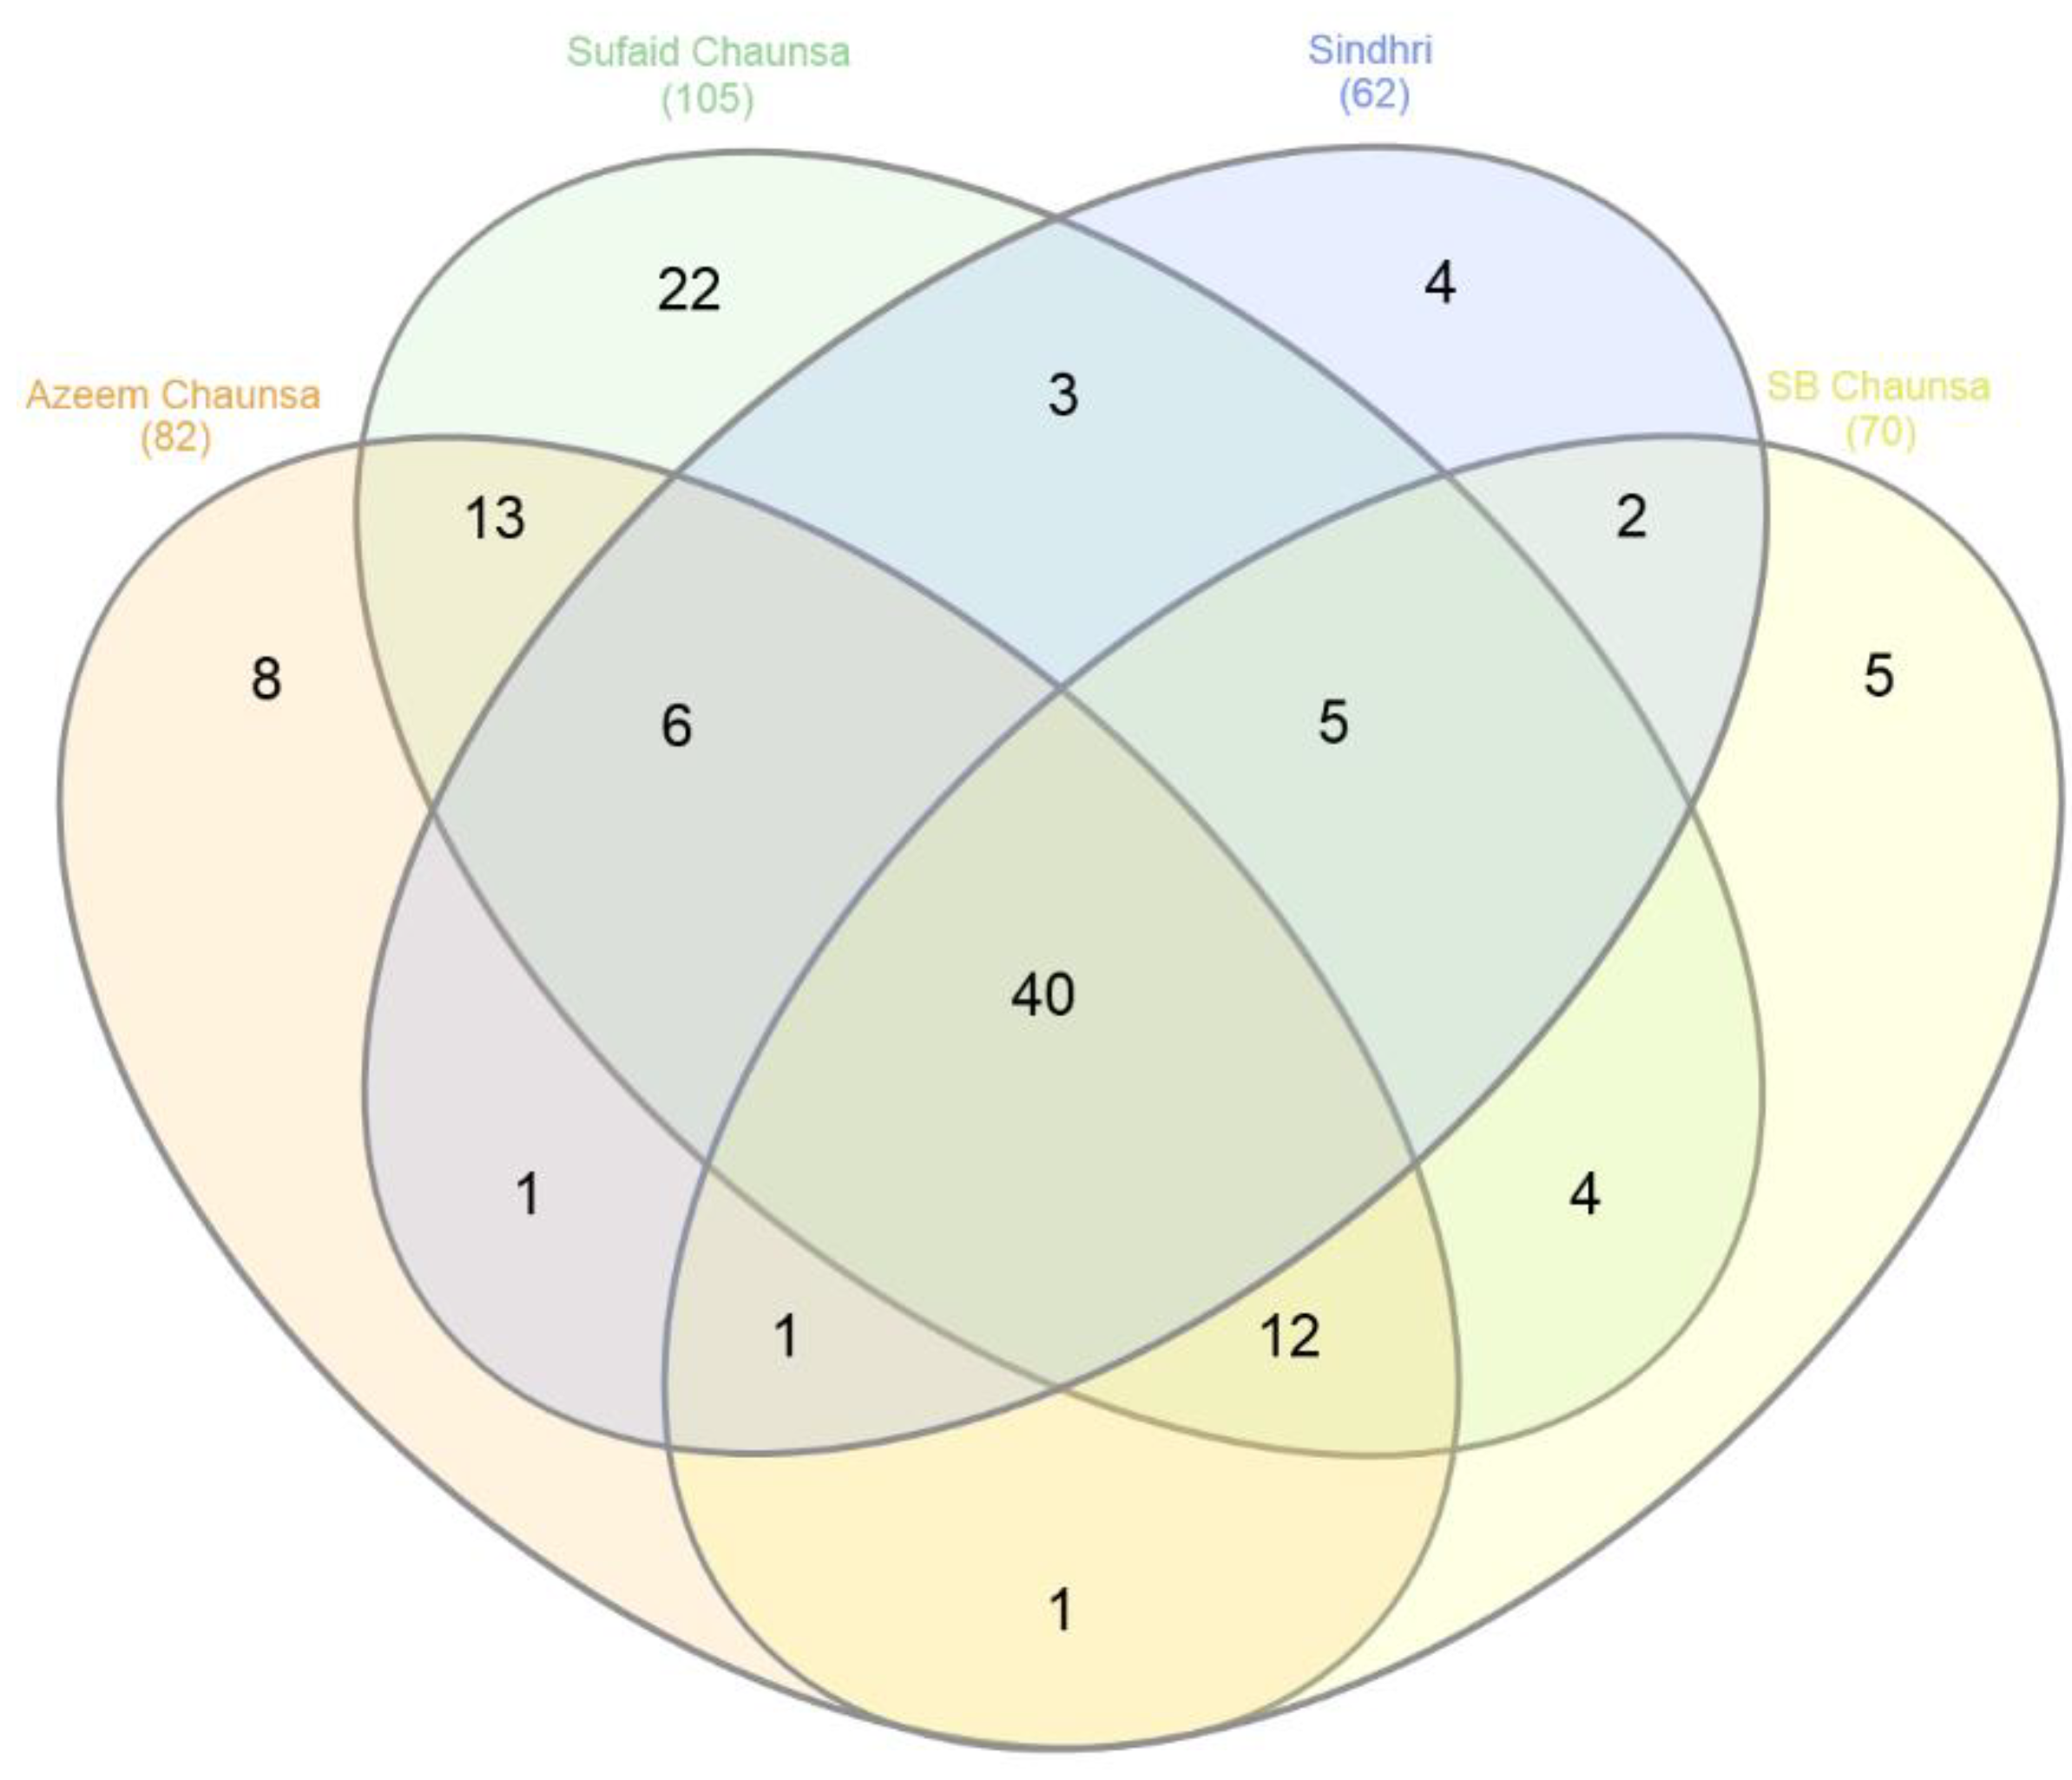
Figure 3.
Cultivar identification diagram (CID) based on hierarchical NTSYS cluster estimating Jaccard's similarity coefficient. The UPGMA based CID shows the clustering and association of mango cultivars based on SSR marker data.
Figure 3.
Cultivar identification diagram (CID) based on hierarchical NTSYS cluster estimating Jaccard's similarity coefficient. The UPGMA based CID shows the clustering and association of mango cultivars based on SSR marker data.
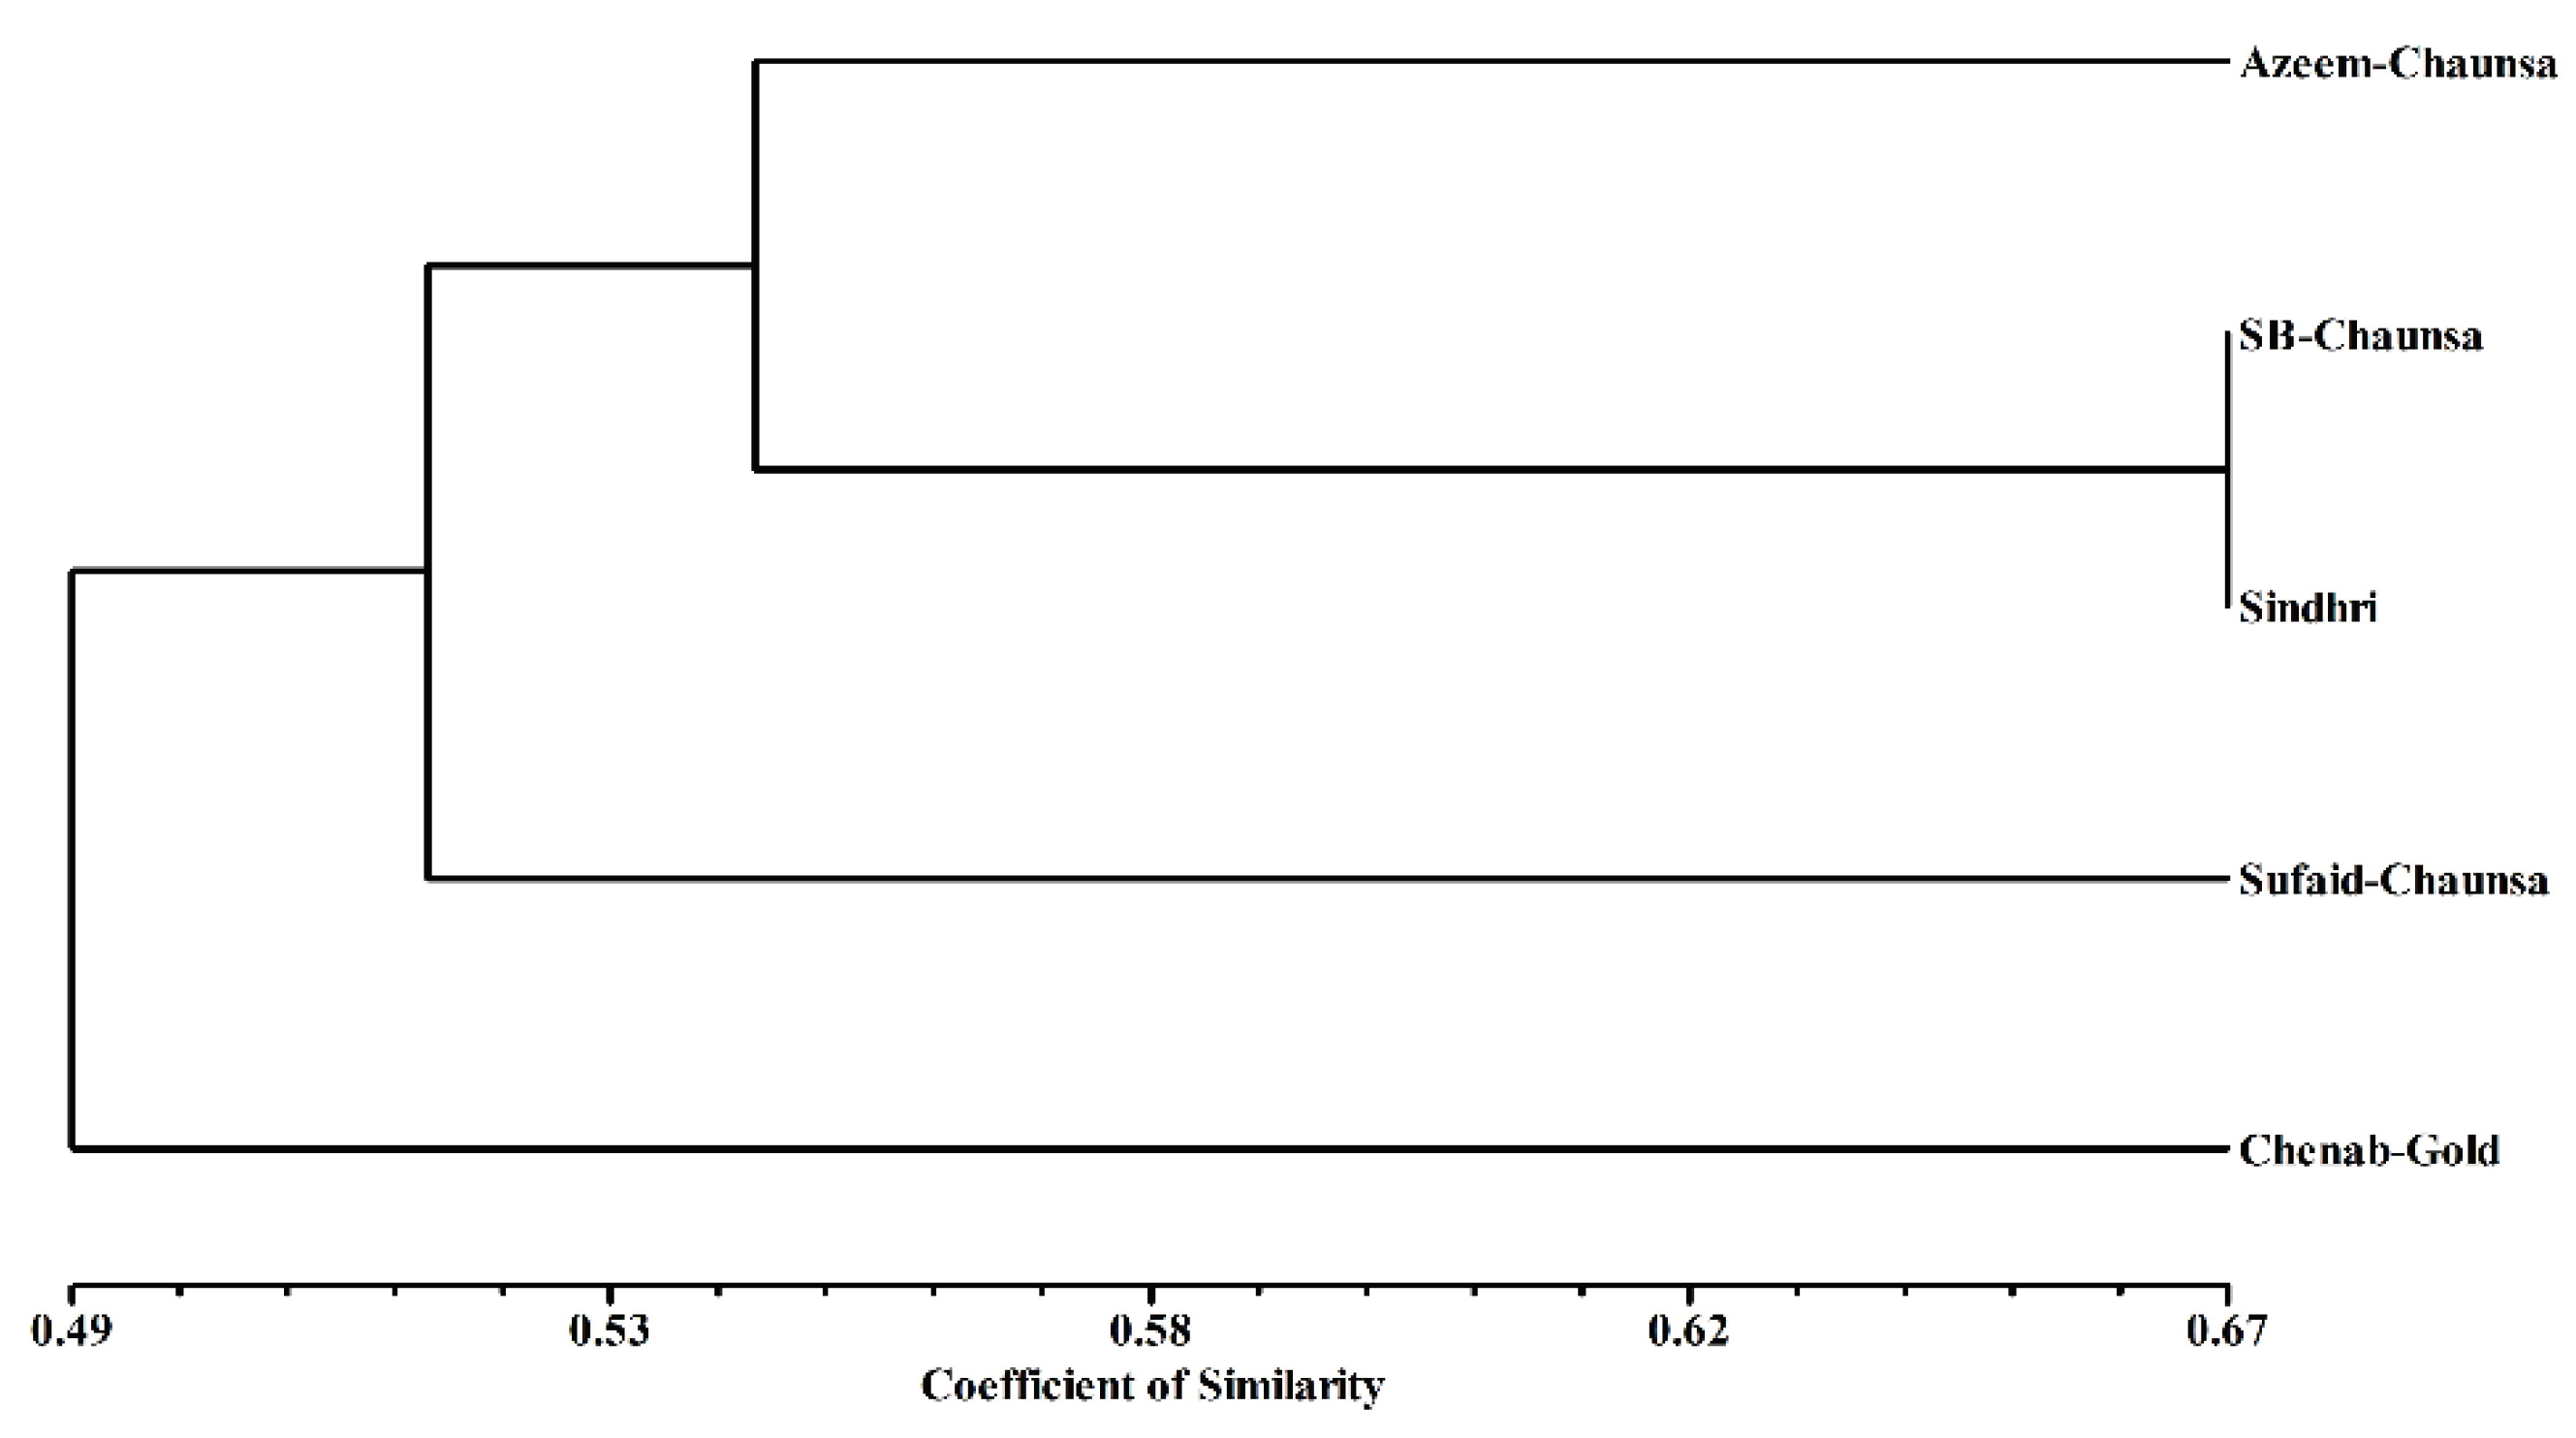

Table 1.
List of microsatellite markers used in mango DNA fingerprinting study.
| SSR Primer Pair ID | Forward Primer | Reverse Primer |
|---|---|---|
| LMMA1F | ATGGAGACTAGAATGTACAGAG | ATTAAATCTCGTCCACAAGT |
| LMMA7F | ATTTAACTCTTCAACTTTCAAC | AGATTTAGTTTTGATTATGGAG |
| LMMA9F | TTGCAACTGATAACAAATATAG | TTCACATGACAGATATACACTT |
| mMiCIRO14 | GAGGA CATAAAGATGGTG | GACAAGATAAACAAC TGGAA |
| mMiCIRO18 | CCTCAATCTCACTCAACA | ACCCCACAATCAAACTAC |
| mMiCIRO32 | TCATTGCTGTCCCTTTTC | ATCGCTCAAACAATCC |
| MiSHRS-1 | TAACAGCTTTGCTTGCCTCC | TCCGCCGATAAACATCAGACA |
| MiSHRS-48 | TTTACCAAGCTAGGGTCA | CACTCTTAAACTATTCAACCA |
| MIAC-4 | CGTCATCCTTTACAGCGAACT | CATCTTTGATCATCCGAAAC |
| MIAC-6 | CGCTCTGTGAGAATCAAATGGT | GGACTCTTATTAGCCAATGGGAG |
| MGDSSR1 | CGAAATGAGACACCTGCAAA | TTTCCTCCATTGCTTTTTCG |
| MGDSSR2 | GGGAATGGTAGAGACGGACA | ATCCAAGCAGTCACCATCAA |
| MGDSSR5 | CGATAGTGCCAATCTGGTGA | TCATCTCACACACTCTCTCTCTCTC |
| MGDSSR11 | GGGAATGGTAGAGACGGACA | TTCATCATAGGTCCCACACG |
| MGDSSR14 | AATGCTGAGCCTGGTAAGGA | CAACATCCTCTTTCTTCCCTGT |
| MGDSSR34 | GAAAGTGAGACCTTCGGTTCC | AAGGCCCCTTCTTCACATTT |
| MillHR21 | TTTGGCTGGGTGATTTTAGC | TTAATTGCAGGACTGGAGCA |
| mMiCIR005 | GCCCTTGCATAAGTTG | TAAGTGATGCTGCTGGT |
| mMiCIR009 | AAAGATAAGATTGGGAAGAG | CGTAAGAAGAGCAAAGGT |
| mMiCIR013 | GCGTAAAGCTGTTGACTA | TCATCTCCCTCAGAACA |
| mMiCIR016 | TAGCTGTTTTGGCCTT | ATGTGGTTTGTTGCTTC |
| mMiCIR030 | GCTCTTTCCTTGACCTT | TCAAAATCGTGTCATTTC |
| MiSHRS-37 | CTCGCATTTCTCGCAGTC | TCCCTCCATTTAACCCTCC |
| MIAC-11 | GTGCGAGGAGATATCTGT | CTGGTTCTTCATTGTTGAGATG |
| MITGI75 | TGCGTCTTGTGTGTGTGTGT | GGAATGCTGTGTGTGTGTG |
| MITGg62 | TGTTCGATTTGCAAACTTTTT | GGCCTAATGTGTGTGTGTG |
| MICA231-1 | TGGAAGGACCATGCTTGAAT | GGTCACACACACACACACA |
| MICA235 | TGTCACACACACACACACA | AATGGAAGGACCATGCTTGA |
| MIGA2O3 | TGAAGGATAGGTGTGGTG | CATGAGAGAGAGAGAGAGA |
| MIGA224 | CACGAGAGAGAGAGAGAGA | GGGTCTCAGAGGGAGGATTT |
| MIAC251-1 | CCTTGGGTTCATTCGCTAAA | GGACGCCACACACACACAC |
| MIAC251-2 | TGGCGCTACACACACACAC | CACACACACACACACACACG |
| LMMA8 | CATGGAGTTGTGATACCTAC | CAGAGTTAGCCATATAGAGTG |
| MillHR04c | CGTTTTTGACCCTCTTGAGC | CCGCATACTTCCCTTCACAT |
| MillHR06 | CGCCGAGCCTATAACCTCTA | ATCATGCCCTAAACGACGAC |
| MillHR07a | GCCACTCAGCTAAATAGCCTCT | TGCAGTCGGTAAAGTGATGG |
| MillHR11a | CAGTGAAACCACCAGGTCAA | TGGCCAGCTGATACCTTCTT |
| MillHR20a | CCTAACGCGCAAGAAACATA | ACCCACCTTCCCAATCTTTT |
| AJ635164 | AAACAAAGAATGGAGCA | TGGACTGAATGTGGATAG |
| AY942826 | TGTGAAATGGAAGGTTGAG | ACAGCAATCGTTGCATTC |
| AJ635178 | GTATAAATCGCGTGCAT | AGTTTCCCTCCTTGTATCT |
| AJ635187 | ATCCCCAGTAGCTTTGT | TGAGAGTTGGCAGTGTT |
| AY942817 | TAACAGCTTTGCTTGCCTCC | TCCGCCGATAAACATCAGAC |
| AY942825 | CGAGGAAGAGGAAGATTATGAC | CGAATACCATCCAGCAAAATAC |
| AJ635166 | CTTGAAAGAGATTGAGATTG | AGAAGGCAGAAGGTTTAG |
| AJ635184 | TGTCTACCATCAAGTTCG | GCTGTTGTTGCTTTACTG |
| AY942820 | AGGTCTTTTATCTTCGGCCC | AAACGAAAAAGCAGCCCA |
| AB190349 | AATTATCCTATCCCTCGTATC | AGAAACATGATGTGAACC |
| AY942828 | CTCGCATTTCTCGCAGTC | TCCCTCCATTTAACCCTCC |
| AJ635189 | ACGGTTTGAAGGTTTTAC | ATCCAAGTTTCCTACTCCT |
Table 2.
SSR-PCR amplification profile of 50 SSR mango markers on gDNA of four mango cultivars resulted different fragments obtained in this study. SSR loci that distinguish Azeem Chaunsa and standard mango cultivars.
Table 2.
SSR-PCR amplification profile of 50 SSR mango markers on gDNA of four mango cultivars resulted different fragments obtained in this study. SSR loci that distinguish Azeem Chaunsa and standard mango cultivars.
| SSR Marker ID | Sufaid Chaunsa | Sindhri | SB Chaunsa | Azeem Chaunsa |
|---|---|---|---|---|
| LMMA1F | 290, 295 | 310 | 290, 295, 310 | 295 |
| LMMA7F | 260 | 205, 220, 260, 340 | 220, 340 | 220, 340 |
| LMMA9F | 205 | 0 | 200, 205 | 200 |
| mMiCIRO14 | 210 | 205 | 0 | 160, 200, 210 |
| mMiCIRO18 | 195, 240, 250, 350 | 380 | 250 | 250, 280 |
| mMiCIRO32 | 190, 200 | 200 | 190, 200 | 190, 200 |
| MiSHRS-1 | 180 | 175, 180 | 175, 240 | 210 |
| MiSHRS-48 | 180, 190, 200 | 180 | 180, 210, 220 | 180, 200, 280 |
| MIAC-4 | 90, 125 | 90, 125 | 90 | 90, 100, 125 |
| MIAC-6 | 250 | 0 | 250 | 390 |
| MGDSSR1 | 205 | 205 | 205 | 205 |
| MGDSSR2 | 260, 270 | 260 | 150, 260 | 0 |
| MGDSSR5 | 155, 295 | 155, 190, 300 | 160, 300 | 300 |
| MGDSSR11 | 190, 240, 390 | 190, 240, 390 | 200, 240 | 190, 240 |
| MGDSSR14 | 150, 200, 225, 250 | 150 | 150, 225 | 200 |
| MGDSSR34 | 150, 190 | 150, 190 | 150, 190 | 100, 150, 175, 180 |
| MillHR21 | 140, 310, 400, 425 | 400 | 140, 400, 425 | 140, 310, 400, 425 |
| mMiCIR005 | 210, 240, 250 | 210, 240 | 250 | 230 |
| mMiCIR009 | 175, 240 | 175, 220, 240 | 220 | 220 |
| mMiCIR013 | 160, 220 | 160, 220 | 160, 220 | 160, 220 |
| mMiCIR016 | 250, 260, 280, 360 | 260 | 250, 260, 280 | 250 |
| mMiCIR030 | 230, 245, 250 | 245, 250, 295 | 180, 245, 290, 295 | 180, 290 |
| MiSHRS-37 | 200, 220 | 200 | 140, 245 | 140, 200 |
| MIAC-11 | 145, 150 | 145, 150 | 145, 150 | 145 |
| MITGI75 | 110, 150, 175 | 175 | 0 | 100, 110 |
| MITGg62 | 450 | 175, 200 | 200 | 170, 200, 450 |
| MICA231-1 | 300 | 600 | 195, 300, 620 | 320, 600 |
| MICA235 | 120, 200, 400 | 0 | 400 | 200 |
| MIGA2O3 | 155, 275 | 155 | 155 | 155, 275, 380 |
| MIGA224 | 250, 300 | 250 | 300 | 250, 300 |
| MIAC251-1 | 350, 600, 700 | 350, 600 | 350, 600 | 350, 600, 700 |
| MIAC251-2 | 200 | 175, 200 | 175, 200 | 200 |
| LMMA8 | 480 | 430 | 0 | 430 |
| MillHR04c | 160, 250 | 160 | 0 | 160 |
| MillHR06 | 105 | 0 | 120 | 105 |
| MillHR07a | 160 | 0 | 160 | 160 |
| MillHR11a | 190, 220, 290 | 220 | 220 | 190, 220 |
| MillHR20a | 0 | 0 | 0 | 190 |
| AJ635164 | 240, 380 | 240 | 240 | 240, 380 |
| AY942826 | 225 | 0 | 0 | 225 |
| AJ635178 | 240 | 0 | 0 | 0 |
| AJ635187 | 240, 250 | 290 | 290 | 240 |
| AY942817 | 200, 210, 250 | 200 | 190, 200 | 210, 250 |
| AY942825 | 230, 260, 280 | 260 | 0 | 260 |
| AJ635166 | 225, 250, 290 | 225 | 225 | 225, 290 |
| AJ635184 | 160, 165, 190 | 175 | 165 | 165, 175 |
| AY942820 | 200, 205, 250 | 205, 250 | 200, 250 | 205, 250 |
| AB190349 | 130 | 130 | 130 | 0 |
| AY942828 | 130, 135, 160 | 0 | 0 | 135 |
| AJ635189 | 145, 155 | 145 | 145 | 145, 155 |
Table 3.
Allele distribution, polymorphism and diversity in four mango cultivars.
| SSR Primer Pair ID | Tm °C | Allele Size (bp) | No. of Loci | No. of Polymorphic loci | Polymorphic loci % |
|---|---|---|---|---|---|
| LMMA1F | 59 | 290-310 | 3 | 3 | 100 |
| LMMA7F | 55 | 205-340 | 4 | 4 | 100 |
| LMMA9F | 56 | 200-205 | 2 | 2 | 100 |
| mMiCIRO14 | 57 | 160-210 | 4 | 4 | 100 |
| mMiCIRO18 | 59 | 195-380 | 6 | 6 | 100 |
| mMiCIRO32 | 57 | 190-200 | 2 | 1 | 50 |
| MiSHRS-1 | 65 | 175-240 | 4 | 4 | 100 |
| MiSHRS-48 | 57 | 180-280 | 6 | 5 | 83.33 |
| MIAC-4 | 59 | 90-125 | 3 | 2 | 66.66 |
| MIAC-6 | 65 | 250-390 | 2 | 2 | 100 |
| MGDSSR1 | 62 | 205 | 1 | 0 | - |
| MGDSSR2 | 65 | 150-270 | 3 | 3 | 100 |
| MGDSSR5 | 65 | 155-300 | 5 | 5 | 100 |
| MGDSSR11 | 65 | 190-390 | 4 | 3 | 75 |
| MGDSSR14 | 65 | 150-250 | 4 | 4 | 100 |
| MGDSSR34 | 65 | 100-190 | 5 | 4 | 80 |
| MillHR21 | 64 | 140-425 | 4 | 4 | 100 |
| mMiCIR005 | 58 | 210-250 | 4 | 4 | 100 |
| mMiCIR009 | 57 | 175-240 | 3 | 3 | 100 |
| mMiCIR013 | 60 | 160-220 | 2 | 0 | - |
| mMiCIR016 | 58 | 250-360 | 4 | 4 | 100 |
| mMiCIR030 | 55 | 180-295 | 6 | 6 | 100 |
| MiSHRS-37 | 65 | 140-245 | 4 | 4 | 100 |
| MIAC-11 | 61 | 145-150 | 2 | 1 | 50 |
| MITGI75 | 65 | 100-175 | 4 | 4 | 100 |
| MITGg62 | 59 | 170-450 | 4 | 4 | 100 |
| MICA231-1 | 65 | 195-600 | 5 | 5 | 100 |
| MICA235 | 65 | 120-400 | 3 | 3 | 100 |
| MIGA2O3 | 60 | 155-380 | 3 | 2 | 66.66 |
| MIGA224 | 63 | 250-300 | 2 | 2 | 100 |
| MIAC251-1 | 64 | 350-700 | 3 | 1 | 33.33 |
| MIAC251-2 | 65 | 175-200 | 2 | 1 | 50 |
| LMMA8 | 60 | 430-480 | 2 | 2 | 100 |
| MillHR04c | 65 | 160-250 | 2 | 2 | 100 |
| MillHR06 | 65 | 105-120 | 2 | 2 | 100 |
| MillHR07a | 65 | 160 | 1 | 0 | 0 |
| MillHR11a | 65 | 190-290 | 3 | 2 | 66.66 |
| MillHR20a | 64 | 190 | 1 | 0 | 0 |
| AJ635164 | 56 | 240-380 | 2 | 1 | 50 |
| AY942826 | 60 | 225 | 1 | 0 | 0 |
| AJ635178 | 57 | 240 | 1 | 0 | 0 |
| AJ635187 | 61 | 240-290 | 3 | 3 | 100 |
| AY942817 | 65 | 190-250 | 4 | 4 | 100 |
| AY942825 | 62 | 230-280 | 3 | 2 | 66.66 |
| AJ635166 | 56 | 225-290 | 3 | 2 | 66.66 |
| AJ635184 | 59 | 160-190 | 4 | 4 | 100 |
| AY942820 | 64 | 200-250 | 3 | 2 | 66.66 |
| AB190349 | 57 | 130 | 1 | 0 | 0 |
| AY942828 | 65 | 130-160 | 3 | 3 | 100 |
| AJ635189 | 58 | 145-155 | 2 | 1 | 50 |
Table 4.
Allele distribution and polymorphism was estimated in Azeem Chaunsa cultivar.
| SSR Loci ID | Nature | Polymorphic type | Polymorphic alleles (N.) | Allele size (bp) |
|---|---|---|---|---|
| LMMA1F | polymorphic | co-dominate | 1 | 295 |
| LMMA7F | polymorphic | co-dominate | 2 | 220, 340 |
| LMMA9F | polymorphic | co-dominate | 1 | 200 |
| mMiCIRO14 | polymorphic | co-dominate | 3 | 160, 200, 210 |
| mMiCIRO18 | polymorphic | co-dominate | 2 | 250, 280 |
| mMiCIRO32 | polymorphic | co-dominate | 1 | 190, 200 |
| MiSHRS-1 | polymorphic | co-dominate | 1 | 210 |
| MiSHRS-48 | polymorphic | co-dominate | 2 | 180, 200, 280 |
| MIAC-4 | polymorphic | co-dominate | 2 | 90, 100, 125 |
| MIAC-6 | polymorphic | co-dominate | 1 | 390 |
| MGDSSR1 | monomorphic | dominant | 0 | 205 |
| MGDSSR2 | polymorphic | co-dominate | 0 | 0 |
| MGDSSR5 | polymorphic | co-dominate | 1 | 300 |
| MGDSSR11 | polymorphic | co-dominate | 1 | 190, 240 |
| MGDSSR14 | polymorphic | co-dominate | 1 | 200 |
| MGDSSR34 | polymorphic | co-dominate | 3 | 100, 150, 175, 180 |
| MillHR21 | polymorphic | co-dominate | 3 | 140, 310, 400, 425 |
| mMiCIR005 | polymorphic | co-dominate | 1 | 230 |
| mMiCIR009 | polymorphic | co-dominate | 1 | 220 |
| mMiCIR013 | polymorphic | co-dominate | 0 | 160, 220 |
| mMiCIR016 | polymorphic | co-dominate | 1 | 250 |
| mMiCIR030 | polymorphic | co-dominate | 2 | 180, 290 |
| MiSHRS-37 | polymorphic | co-dominate | 2 | 140, 200 |
| MIAC-11 | polymorphic | co-dominate | 0 | 145 |
| MITGI75 | polymorphic | co-dominate | 2 | 100, 110 |
| MITGg62 | polymorphic | co-dominate | 3 | 170, 200, 450 |
| MICA231-1 | polymorphic | co-dominate | 2 | 320, 600 |
| MICA235 | polymorphic | co-dominate | 1 | 200 |
| MIGA2O3 | polymorphic | co-dominate | 2 | 155, 275, 380 |
| MIGA224 | polymorphic | co-dominate | 2 | 250, 300 |
| MIAC251-1 | polymorphic | co-dominate | 1 | 350, 600, 700 |
| MIAC251-2 | polymorphic | co-dominate | 0 | 200 |
| LMMA8 | polymorphic | co-dominate | 1 | 430 |
| MillHR04c | polymorphic | co-dominate | 1 | 160 |
| MillHR06 | polymorphic | co-dominate | 1 | 105 |
| MillHR07a | monomorphic | dominant | 0 | 160 |
| MillHR11a | polymorphic | co-dominate | 1 | 190, 220 |
| MillHR20a | monomorphic | dominant | 0 | 190 |
| AJ635164 | polymorphic | co-dominate | 1 | 240, 380 |
| AY942826 | monomorphic | dominant | 0 | 225 |
| AJ635178 | monomorphic | dominant | 0 | 0 |
| AJ635187 | polymorphic | co-dominate | 1 | 240 |
| AY942817 | polymorphic | co-dominate | 2 | 210, 250 |
| AY942825 | polymorphic | co-dominate | 1 | 260 |
| AJ635166 | polymorphic | co-dominate | 1 | 225, 290 |
| AJ635184 | polymorphic | co-dominate | 2 | 165, 175 |
| AY942820 | polymorphic | co-dominate | 1 | 205, 250 |
| AB190349 | monomorphic | dominant | 0 | - |
| AY942828 | polymorphic | co-dominate | 1 | 135 |
| AJ635189 | polymorphic | co-dominate | 1 | 145, 155 |
Disclaimer/Publisher’s Note: The statements, opinions and data contained in all publications are solely those of the individual author(s) and contributor(s) and not of MDPI and/or the editor(s). MDPI and/or the editor(s) disclaim responsibility for any injury to people or property resulting from any ideas, methods, instructions or products referred to in the content. |
© 2024 by the authors. Licensee MDPI, Basel, Switzerland. This article is an open access article distributed under the terms and conditions of the Creative Commons Attribution (CC BY) license (http://creativecommons.org/licenses/by/4.0/).
Copyright: This open access article is published under a Creative Commons CC BY 4.0 license, which permit the free download, distribution, and reuse, provided that the author and preprint are cited in any reuse.


