
Submitted:
14 March 2024
Posted:
15 March 2024
You are already at the latest version
Abstract
The intestinal microbial community of aquatic animals is closely related to the environment and thus affects the health of aquatic animals. Here we investigated annual variation of intestinal bacteria community structures of Ruditapes philippinarum cultured using two different methods, bottom sown and raft hanging. Bacterial diversity of seawater and sediment in different seasons was examined as well. Correlation between R. philippinarum intestinal bacteria community structures and environmental factors was analyzed. The results showed that in the two aquculture areas where R. philippinarum was differentially cultured, bacteria community structure of seawater and sediment both altered with seasons. However, neither seasonal changes nor difference in culture methods could significantly affect the intestinal bacteria community structures of R. philippinarum. Additionally, in terms of the alpha diversity of intestinal bacteria communities, there was no significant difference in R. philippinarum cultured using the two methods. For benthic cultured clams, alpha diversity of the intestinal bacterial communities was often higher than that of the environmental bacterial communities. For raft hanging cultured calms, Alpha diversity of the intestinal bacterial communities was normally comparable with that of the environmental counterparts. Beta diversity analysis showed that the intestinal bacterial community structure of R. philippinarum was mainly determined by both deterministic and stochastic processes. Correlation analysis showed that the intestinal bacterial community structures of R. philippinarum were determined by a variety of environmental factors. For clams collected from the benthic culture area, the intestinal bacterial structure was more correlated with the physicochemical properties of sediment in comparing with those of seawater. For clams collected from the raft-culture area, the intestinal bacterial structure was mainly determined by the phsicochemical characteristics of seawater. This study helps us to better understand the bacterial community structure in complex aquaculture ecosystems, providing a reference for healthy shellfish aquaculture and ecosystem protection in aquaculture area.
Keywords:
Ruditapes philippinarum
; environmental factors
; diversity analysis;microbial community structure analysis;redundancy analysis
1. Introduction
Seawater and sediment are important components of aquaculture ecosystems and important exchange sites for nutrients [1,2,3]. The structure of microbial communities changes dynamically in response to environmental factors (e.g., temperature, salinity, pH, chemical oxygen demand (COD), total nitrogen (TN), total phosphorus (TP), total carbon (TC), and inorganic nitrogen (IN)), but the core microbial communities remain unchanged [4,5], and they play an important role in ecosystem stability in complex and dynamic communities [6].
Unlike terrestrial animals, aquatic animals have a complex relationship with their external environment and are more sensitive to environmental changes [7,8,9]. Shellfish are mostly filter feeders, and food enters the shellfish with the culture water or sediment, changes in the culture environment will cause changes in the species, number, ecological niche, and proportion of the bacteria in the shellfish intestinal, which will lead to dysbiosis of the shellfish intestinal flora, affecting the growth and development of the shellfish or causing diseases [10,11]. Therefore, in recent years, the study of shellfish aquaculture environment and shellfish intestinal microbiome has received more and more attention [12]. It is important to understand the diversity and composition of bacterial communities in aquaculture systems and their relationship with the surrounding environment to control the occurrence of aquaculture diseases [13].
The marine environment consists of diverse and complex microbial communities. Marine microorganisms help to maintain carbon dynamics, thereby maintaining the ecological and biogeochemical balance of marine ecosystems [14]. Microbial communities are characterized by strong temporal variation and seasonal aggregation [15] .Powell et al. [16] studied the composition of the microbiota in the water of the Crassostrea gigasnursery pond, and the results showed that the water microbiota of the Crassostrea gigasnursery pond was very rich, and the community varied greatly on the daily, weekly and seasonal scales.
Aquaculture can have an impact on bacterial and plankton populations in the water column, which may lead to disease transmission between wild and farmed organisms. In addition, there are effects on water quality that can lead to changes in population density and diversity [17]. The composition, function, and diversity of bacterial communities in seawater, sediment, and intestinal are also different according to different ecological patterns of aquaculture, which have a significant impact on the structure, composition, and function of intestinal microbial communities. Bacterial communities in seawater and sediment were more similar and were the main source of intestinal microorganisms, but bacterial communities in the intestinal were different from environmental samples. Each environment has unique dominant microbial taxa [5,13,18,19], however, the composition of the bacterial community in each culture system remains relatively stable [20], and the "native" bacteria remain unaffected by environmental microbes [21]. Similar environments exhibit similar microbial community structures. Environmental parameters such as bacterial community and environmental factors (pH, total carbon, total oxygen carbon (TOC), total nitrogen, total phosphorus, salinity, nitrite, and nitrate) in seawater and sediment have a moderating effect on the composition of microbial community structure [22]. Li et al. [23] studied the bacterial communities in the sediment of scallops, mussels, and oysters in the coastal intestinal zone of northeastern China, and showed that salinity, phosphate, ammonium salt, and chlorophyll-a content were the main factors affecting the distribution of bacterial composition.
The intestinal microorganisms of aquatic animals are mainly composed of Proteobacteria, Actinomycetes, Bacteroidetes and Firmicutes [24], but the relative abundance of bacterial communities varies [25]. Huang et al. [26]comprehensively compared the water, sediment, and intestinal flora of marine culture ponds of Penaeus vannamei during the middle and late stages of culture, the bacterial community structures in the water, sediment, and intestinal were significantly different; and the relative abundance of the dominant intestinal taxa changed significantly at different rearing stages. Shrimp physiological parameters were closely related to bacterial changes in the intestinal and/or environment. In terms of nutrition and immunity, bacterial balance in the intestinal is critical for animal health. Composition and bacterial ecology can be altered depending on environmental factors and host physiology [27].
A large number of studies have shown a close correlation between bacterial community structure and environmental factors in culture areas. However, the effects of different seasons and farming methods on the culture environment and the characterization of intestinal microbial community structure are still unclear. In this study, we analyzed the physicochemical parameters of seawater and sediment as well as the microbial community structure of R. philippinarum in different seasons and culturing methods using high-throughput sequencing, including (1) environmental factors in cultured seaward areas; (2) seasonal succession of bacterial community structure in cultured areas; (3) the effects of different culturing methods (bottom-seeding and hanging) on the intestinal bacterial community structure of R. philippinarum; (4) key environmental factors affecting the intestinal bacterial community structure of clams. The correlation between environmental factors and microbial community structure characteristics was explored, which provides an important reference for the study of the association between aquatic animal culture environment and intestinal bacterial community structure.
2. Materials and Methods
2.1. Sample Collection
Seawater, sediment, and R. philippinarum samples were collected in the second half of each month in January (winter), June (spring), August (summer), and November (autumn) of 2019, with sampling stations as shown in Figure 1. The benthic-culture area (DB: 123°21.089’-123°21.555’E, 39°34.542’-39°34.833’N) and the raft-culture area (DY: 123°05.143’E-123°05.189’E, 39°30.220’-35°30.241’N) of the shellfish culture area were used as the collection targets.
Seawater samples were collected from the surface layer, 3 station points were selected for each target object, 2 parallel samples were taken from each station, 5 L of seawater was taken for each sample, and a total of 12 water samples were collected. The collected water samples were immediately placed in an ice box for preservation and transported back to the laboratory within 24 h for water quality analysis and microbial filtration collection. The filter membranes collected by filtration were stored in the refrigerator at -80°C for 16S rRNA high-throughput sequencing.
The sediment was sampled at each sample point using the five-point method, taking 0-5 cm of surface sediment and mixing it evenly. Two parallel samples were taken from each station in the benthic-culture area (there was no in sediment in the raft-culture area), and 1 kg of sediment was taken from each sample, totaling six mud samples. One part of the subsoil samples were packed in a self-sealing bag and put into a 4°C insulated box to be brought back to the laboratory and stored in a -80°C refrigerator for 16S rRNA high-throughput sequencing, and the other part of the subsoil samples were dried, ground and sieved for determining the soil physicochemical properties.
Nine healthy clams were taken from each of the bottom-seeding and raft-culture areas, and a total of 68 clams were collected for 16S rRNA high-throughput sequencing(Due to adverse weather conditions during sample collection,Only 5 healthy clams were collected in the summer benthic-culture area).
2.2. Determination of Physicochemical Parameters of Seawater
Seawater nitrite (), nitrate (), ammonium ( ) and phosphate (), COD concentration determination follow the "Marine Monitoring Specification of China Part 4: Seawater Analysis" (GB17378.4-2007), IN concentration for nitrite , nitrate and ammonium.
2.3. Determination of Physical and Chemical Parameters of the Sediment
sediment pH was determined by pH meter, water content (W) was determined by drying method, and the concentration of TP was determined by the Specification for Marine Monitoring of China Part 5: sediment Analysis (GB17378.5-2007).
2.4. Intestinal Treatment of R. philippinarum
Before dissection, clams were wiped with 75% alcohol, the closed-shell muscle was opened using a sterilized scalpel, rinsed three times with sterile seawater, and the intestinal was removed and the contents were extruded and preserved in anhydrous ethanol.
2.5. DNA Extraction and High-Throughput Sequencing
After the samples were transported back to the laboratory, 1 L of seawater was taken from each sample to collect microbial samples from the water onto a 0.22 m polycarbonate membrane (47 mm in diameter) using negative pressure filtration; the filter membrane samples were cut up and DNA extraction was performed according to the step-by-step instructions in the Water DNA Isolation Kit (absin, China). The sediment was subjected to DNA extraction according to the step-by-step instructions of the TIANamp Soil DNA Kit (TIANGEN, China). Clam intestinal were subjected to DNA extraction according to the step-by-step instructions of the TIANamp Marine Animals DNA Kit.
PCR amplification of the V3-V4 region of the 16S rRNA gene was performed using extracted DNA as a template and 338F and 806R as primers. The forward primer was 338F (5′-ACTCCTACGGGGAGGCAGCAG-3′), the reverse primer was 806R (5′-GGACTACHVGGGT WTCTAAT-3′), and the amplicon length was about 460 bp. The PCR reaction system was 30 L: 2×Taq PCR MasterMix (Takara, China) 15 L, DNA template 2 L, 10 mol/L forward and reverse primers 2 L each, ddH2O supplement. Reaction conditions: pre-denaturation at 95°C for 2 min; denaturation at 95°C for 30 s, denaturation at 55°C for 30 s, 72°C, extension for 90 s, repeat 35 cycles, extension at 72°C for 7 min, and storage at 20°C. The PCR products obtained by amplification were detected by 1% agarose gel electrophoresis and then entrusted to Biomarker Technologies Co., Ltd (Beijing, China).
2.6. Data Analysis and Processing
Based on the Illumina NovaSeq sequencing platform, small fragment libraries were constructed for sequencing using the Paired-End sequencing method. The raw data obtained from high-throughput sequencing were de-noised, de-chimerized, spliced, and quality-controlled to obtain high-quality valid sequences.
Using Usearch [28]software to cluster and obtain Operational Taxonomic Units (OTUs) classification for Tags at a 97% similarity level. The microbial diversity analysis platform in BMK Cloud (www.biocloud.net) was used to further analyze the Shannon index, Simpson index, Chao 1 and Abundance-based Coverage Estimator (ACE) for Alpha Diversity, and the species community structure for Beta Diversity.
R language (3.6.2) was used to perform redundancy analysis (RDA) on the relative abundance and environmental parameters of dominant taxa. In this paper, the average value of physical and chemical parameters measured by water and mud samples at each sampling station and its microbial community structure describe the environmental characteristics of the region and the differences and parallelism between the sampling stations.
The test of significance was performed using the software SPSS (27.0).
3. Results
3.1. Physicochemical Properties of Seawater in R. philippinarum Culture Areas
As shown in Table 1, the IN content of seawater in the benthic-culture area ranged from 0.046-0.232 mg/L; the content of seawater ranged from 0.002-0.223 mg/L; and the COD content of seawater ranged from 0.859-3.433 mg/L. The IN content of seawater in the raft-culture area ranged from 0.049-0.359 mg/L; the content of seawater ranged from 0.001-0.026 mg/L; and the COD content of seawater ranged from 0.511-2.461 mg/L. There were no significant differences (P>0.05) between the benthic-culture area and the raft-culture area in terms of and COD content among the four seasons. IN content was significantly lower (P<0.05) in the benthic-culture area than in the suspended area in the autumn, and there was no significant effect (P>0.05) in the other three seasons.
3.2. Physicochemical Properties of Sediment in R. philippinarum Culture Areas
As shown in Table 2, the pH of the substrate in the benthic-culture area was in the range of 6.480-7.817, the TP content of the substrate was in the range of 0.008-0.095 mg/L, and the water content of the substrate was in the range of 28.095%-32.131%.
3.3. Seasonal Variation in Seawater Bacterial Diversity
Seasonal variations in the proportional contributions of dominant phyla in seawater are depicted in Figure 2. Dominant phyla occurring throughout the year include Proteobacteria, Bacteroidetes, Actinobacteria, Cyanobacteria, and Verrucomicrobia. Numbers of phyla and genera identified each season were 28 and 466 (spring), 23 and 308 (summer), 27 and 510 (autumn), and 29 and 609 (winter). Dominant bacteria in seawater above benthic-culture area in spring included Proteobacteria (66.42%), Bacteroidetes (17.28%), Cyanobacteria (8.48%), Actinobacteria (2.77%), and Firmicutes(1.71%). In seawater in clam raft-culture habitat these were Proteobacteria (56.57%), Bacteroidetes (25.47%), Cyanobacteria (12.52%), Actinobacteria (2.88%), and Firmicutes (1.27%). Dominant phyla were the same in spring in benthic- and raft-culture areas, and decreased in descending percentage in the order Proteobacteria, Bacteroidetes, Cyanobacteria, Actinobacteria and Firmicutes.
Dominant bacteria in seawater above benthic-culture area in summer included Proteobacteria (49.51%), Bacteroidetes (31.76%), Actinobacteria (8.01%), Verrucomicrobia (5.61%), and Cyanobacteria (4.14%). In seawater in clam-raft-culture habitat these were Proteobacteria (53.91%), Bacteroidetes (19.72%), Cyanobacteria (8.34%), Verrucomicrobia (7.99%), and Actinobacteria (7.29%). Dominant bacteria in summer benthic- and raft-culture areas were the same, but differed slightly in their proportional contributions to the total bacterial assemblage.
Dominant bacteria in seawater above benthic-culture area in autumn were Proteobacteria (71.82%), Cyanobacteria (13.82%), Actinobacteria (4.81%), Bacteroidetes (4.36%), and Firmicutes (2.58%). In seawater in clam-raft-culture habitat these were Proteobacteria (59.97%), Cyanobacteria (12.19%), Bacteroidetes (10.05%), Actinobacteria (8.29%), and Firmicutes (5.23%). Dominant bacteria in the autumn benthic-and raft-culture areas were the same, but differed slightly in their proportional contributions to the total bacterial assemblage.
Dominant bacteria in seawater above benthic-culture area in winter were Proteobacteria (51.31%), Cyanobacteria (20.74%), Firmicutes (17.11%), Bacteroidetes (12.21%), and Verrucomicrobia (5.19%). In seawater in raft-culture habitat these were Proteobacteria (38.97%), Cyanobacteria (18.70%), Bacteroidetes (14.94%), Verrucomicrobia (4.68%), and Firmicutes (4.01%). Dominant flora in the autumn benthic culturedand raft-culture areas were the same, but differed slightly in proportional contributions to the total bacterial assemblage.
3.4. Seasonal Variation in Sediment Bacterial
Seasonal variations in the proportional contributions of dominant phyla in sediment are shown in Figure 3. Numbers of phyla and genera identified each season were 27 and 340 (spring), 38 and 402 (summer), 21 and 400 (autumn), and 22 and 397 (winter), respectively. Dominant sediment-dwelling bacterial phyla in spring in benthic-culture areas were Proteobacteria (62.72%), Bacteroidetes (8.23%), Acidobacteriota (8.18%), Chloroflexi (6.76%), and Actinobacteria (5.59%); in summer these were Proteobacteria (38.82%), Chloroflexi (13.15%), Firmicutes (12.04%), Bacteroidetes (11.50%), and Acidobacteriota (6.24%); in autumn these were Proteobacteria (85.5%), Bacteroidetes (5.16%), Firmicutes (4.39%), Actinobacteria (2.51%), and Cyanobacteria (0.85%); and in winter, Proteobacteria (64.88%), Bacteroidetes (8.28%), Acidobacteriota (6.45%), Chloroflexi (6.23%), and Actinobacteria (4.77%).
3.5. Seasonal Variation of Intestinal Bacteria Diversity in R. philippinarum
Five phyla dominate clam intestinal each season: Proteobacteria, Bacteroidetes, Firmicutes, Actinobacteria, and Cyanobacteria Figure 4. Numbers of phyla and genera identified each season were 29 and 475 (spring), 26 and 565 (summer), 23 and 490 (autumn), and 28 and 692 (winter), respectively. Dominant bacterial phyla during spring in benthic-clam-culture habitat were Proteobacteria (46.92%), Bacteroidetes (37.62%), Cyanobacteria (5.05%), Actinobacteria (3.06%), and Fusobacteria (1.75%). Those in areas where clams were cultured on rafts were Proteobacteria (50.43%), Bacteroidetes (15.54%), Cyanobacteria (9.21%), Actinobacteria (8.19%), and Firmicutes (4.83%). The four most-dominant phyla during spring in benthic- and raft-culture habitat were Proteobacteria, Bacteroidetes, Cyanobacteria, and Actinobacteria.
Dominant bacterial phyla in clam intestinal during summer in benthic-culture areas were Proteobacteria (40.28%), Firmicutes (20.07%), Bacteroidetes (13.65%), Actinobacteria (10.26%), and Cyanobacteria (4.88%). Dominant bacterial phyla in clam intestinal in raft-culture habitat were Proteobacteria (38.35%), Firmicutes (18.87%), Bacteroidetes (16.62%), Actinobacteria (6.91%), and Spirochaetes (4.17%). The four-most dominant phyla during summer in both the benthic- and raft-culture areas were Proteobacteria, Firmicutes, Bacteroidetes, and Actinobacteria.
Dominant phyla in autumn in clam intestinal in the benthic-culture area were Firmicutes (39.55%), Cyanobacteria (24.12%), Proteobacteria (20.75%), Bacteroidetes (6.79%), and Actinobacteria (4.62%). Dominant phyla in clam intestinal in the raft-culture area were Firmicutes (53.19%), Proteobacteria (20.07%), Cyanobacteria (24.12%), Bacteroidetes (10.58%), and Actinobacteria (3.38%). Dominant bacterial phyla in clam intestinal were the same in the benthic- and raft-culture areas in autumn, but differed slightly in their proportional contributions to the total bacterial assemblage. Dominant bacteria in clam intestinal in both benthic- and raft-culture areas were Firmicutes, and the least-dominant was Actinobacteria.
Dominant intestinal-dwelling bacterial phyla during winter in the benthic-culture area were Cyanobacteria (46.50%), Proteobacteria (20.98%), Verrucomicrobia (10.08%), Bacteroidetes (9.96%), and Firmicutes (6.79%). Dominant intestinal bacteria in the raft-culture area were Cyanobacteria (48.36%), Proteobacteria (24.92%), Firmicutes (9.94%), Bacteroidetes (7.52%), and Actinobacteria (4.62%). During winter, four dominant phyla in clam intestinal s from both benthic-and raft-culture areas were Cyanobacteria (most dominant), Proteobacteria, Bacteroidetes, and Firmicutes.
3.6. Alpha Diversity of the Intestinal Bacteria in R. philippinarum
The Alpha diversity indices of the bacterial communities in the intestinal tract of clams in different seasons are shown in Table 3 and Table 4, respectively. The sequencing coverage was above 99%, indicating that the sequencing results could reflect the real microbial community structure composition and diversity in the samples.
Species diversity indices, including Simpson’s index and Shannon’s index, were listed in Table 3, with intervals of 0.02-0.30 and 2.92-5.03 for the benthic-culture area, and 0.02-0.29 and 2.92-5.48 for the raft-culture area, respectively. The Simpson’s index of the benthic-culture area was significantly lower than that of the raft-culture area in winter. Simpson’s index was significantly lower (P< 0.05) in the winter benthic-culture area than in the raft-culture area, indicating that the diversity of communities in the winter benthic-culture area was higher than that in the raft-culture area. Simpson’s index and Shannon’s index were not significant (P> 0.05) in other seasons in the bottom-seeded and raft-culture areas.
The richness indices, including ACE and Chao 1 indices, are presented in Table 4, with intervals ranging from 373.69-1203.33 and 403.74-1053.61 in the benthic-culture area and 280.59-1153.18 and 293.09-1051.23 in the raft-culture area, respectively. The peaks of the number of species in ACE indices for the benthic-culture area and the raft-culture area were observed in the summer months, and the lows were observed in the spring months. occurred in spring. The peaks of Chao 1 index species counts in both benthic- and raft-culture areas occurred in summer, and the low peaks of species counts occurred in spring. The above results indicated that the spring culture area was the least species-rich and the summer culture area was the most species-rich. There was no significant effect (P> 0.05) of the ACE index and Chao 1 in both benthic- and raft-culture areas with the same season.
As can be illustrated, the Simpson index was analyzed for the diversity of clam intestinal samples in different seasons based on phylum classification level to compare the diversity of OTUs within each bacterial community. The box plot represents the Alpha diversity, reflecting the species diversity between the intestinal of clams, seawater, and sediment under different seasons and culture methods [29]. As shown in Figure 5, the Simpson index in spring and summer in the benthic-culture area showed that the contents of OTU in the intestinal of clams were more than those of marine bacteria (P<0.05), and there was no significant difference in the Alpha diversity of intestinal and sediment (P>0.05). In autumn, the intestinal of clams had more OTUs content than that of seawater and sediment, and there was a significant difference (P<0.05). There was no significant difference in the Alpha diversity between the intestinal of clams, seawater, and sediment in winter.
The spring Simpson index of the raft-culture area shows that showed that the intestinal tract of clams was more than that of marine bacteria, and there was a significant difference (P<0.05), but there was no significant difference in the Alpha diversity of clam intestinal and seawater in summer, autumn, and winter (P>0.05).
3.7. Beta Diversity of the Intestinal Bacteria in R. philippinarum
It can be seen from Figure 6 that the distribution of -NTI values in the intestinal tract of clams in the benthic-culture area and the raft-culture area in different seasons. The -NTI values of clam intestinal samples in the spring bottom-sowing area were mainly distributed in the range of -2-4. The -NTI value of the intestinal samples of clams in the raft-culture area was concentrated in the range of -2-5. Most of the -NTI values were distributed in the range of -2-2, indicating that the community changes in the spring bottom-sowing area and the raft-culture area were affected by both random and deterministic factors. The -NTI values of clam intestinal samples in the summer bottom-sowing area were concentrated in the range of -1-4. The -NTI values of clam intestinal samples in the raft-culture area were concentrated in the range of -1-5. Most of the -NTI values were distributed between -2-2, indicating that the community changes in the summer benthic-culture area and raft-culture area were affected by both random and deterministic factors. The -NTI values of clam intestinal samples in the autumn bottom-sowing area were concentrated in the range of -1-4. The -NTI values of clam intestinal samples in the raft-culture area were concentrated in the range of -1-2. Most of the -NTI values were distributed in the range of -2-2, indicating that the community changes in the autumn bottom-sowing area and the raft-culture area were affected by both random and deterministic factors. The -NTI values of clam intestinal samples in the winter bottom-sowing area were concentrated in the range of -2.5-6, and most of the -NTI values were distributed in the range of -2-2, indicating that the community change in the winter bottom-sowing area was affected by both random and deterministic factors. The -NTI values of the intestinal samples of clams in the raft-culture area were mainly distributed in the range of -2.5-7.5, and most of the -NTI values were > 2 or <-2, indicating that the community change in the winter raft-culture area was affected by deterministic factors [30].
3.8. Correlation Analysis of the R. philippinarum Intestinal Bacterial Communities and Environmental variables
3.8.1. Correlation Analysis of the R. philippinarum Intestinal Bacterial Community and Environmental Factors
As known from Figure 7 seawater was not significant (P>0.05), seawater IN (=0.505, P<0.01), substrate TP (=0.700, P<0.01), substrate pH (=0.283, P<0.01) were highly significantly correlated with the structure of the clam enterobacterial community in the bottomed area, and substrate water content (= 0.187, P<0.05) was significantly correlated with clam intestinal bacterial community structure in the bottom-seeded area.
The first two RDA axes explained 71.63% of variation in bacterial composition in benthic-culture areas. The correlations between clam-intestinal bacteria and environmental variables in the benthic-culture area were, in descending order: sediment TP > seawater IN > sediment pH > seawater COD > sediment water content. Seawater IN and sediment TP greatly influenced clam-intestinal bacteria in the benthic-culture area. August and November G-DB samples were mainly affected by sediment pH, moisture content, and seawater COD, and were concentrated in the negative semi-axis of the first axis. April and January G-DB samples were mainly affected by seawater IN and sediment TP, and were concentrated in the positive half axis of the first axis.
In the benthic-culture area during spring, seawater pH and sediment TP were highly, significantly correlated with clam intestinal bacteria; they were also highly, significantly negatively correlated with sediment water content, and negatively correlated with seawater IN. In summer, seawater COD and sediment pH mainly affected clam intestinal bacterial communities, with the correlation with seawater COD being positive, and that with pH highly significantly correlated; intestinal bacteria correlated negatively with sediment water content, and highly significantly negatively correlated with total phosphorus and seawater IN. During autumn, seawater COD, IN, and sediment water content main affected clam intestinal bacteria, and were highly significantly correlated with seawater IN; these communities were positively correlated with seawater COD and sediment water content, and negatively correlated with total phosphorus and sediment pH. During winter, sediment pH and TP principally, significantly affected intestinal bacteria, with negative (sediment water content, seawater COD) and significantly negative (seawater IN) correlations.
As known from Figure 8 seawater IN (=0.624, P<0.01), (=0.506, P<0.01), and COD (=0.409, P<0.01) were highly significantly correlated with the structure of the intestinal bacterial community of clams in the hanging culture area.
Axes 1 and 2 explain 87.11% of variation in clam-intestinal bacterial communities. Correlations between clam-intestinal bacterial communities and environmental variables are ordered seawater IN > seawater > seawater COD. April, November and January G-DY samples were mainly influenced by seawater IN and and were concentrated on the positive half axis of the first axis. During spring, seawater and IN were significantly correlated and mainly affected clam-intestinal bacterial abundance; they were also significantly, negatively correlated with seawater COD. During summer, seawater COD mainly affected intestinal bacterial abundance, and was significantly negatively correlated with seawater and IN. During autumn, seawater COD and IN were significantly correlated, and mainly affected intestinal bacterial abundance, and highly, significantly, negatively correlated with seawater . During winter, seawater IN and mainly affected intestinal bacterial abundance, which was significantly and negatively correlated with seawater COD.
3.8.2. Correlation Analysis of the Seawater Bacteria Community Strucutre and Environmental Factors
As known from Figure 9 seawater , COD, and bottom mud water content (P>0.05) were not significant. Seawater IN (=0.494, P<0.01), substrate TP (=0.727, P<0.01), and substrate pH (=0.454, P<0.01) were highly significantly correlated with the structure of seawater bacterial community in the benthic zone.
Axes 1 and 2 explain 77.42% of variation in communities. Correlations between seawater bacterial communities and environmental variables in descending order were seawater IN > sediment TP > sediment pH. August, April and January W-DB were mainly affected by sediment pH and TP, and were concentrated in the negative half axis of the first axis. November W-DB samples were mainly affected by seawater IN and are concentrated on the positive semi-axis of the first axis. During spring, correlations between seawater IN and sediment TP and seawater bacterial communities were highly significant, and that with sediment pH was highly, negatively significant. During summer, sediment pH mainly affected seawater bacterial communities, and there was a highly significant negative correlation with seawater IN and sediment TP. During autumn, seawater IN mainly affected seawater bacterial communities, and a highly significant correlation with seawater IN existed; there was a highly significant negative correlation with sediment TP and pH. During winter, sediment pH mainly affected seawater bacterial communities, with a highly significant correlation; a highly significant negative correlation also existed between seawater IN and sediment TP.
As known from Figure 10 seawater (P>0.05) was not significant. The correlation between seawater IN (=0.445, P<0.01) and COD (=0.626, P<0.01) and the structure of seawater bacterial community in the hanging area was highly significant. The correlation between seawater bacterial community structure and environmental factors in the hanging area was seawater COD>seawater IN in descending order.
The correlation between seawater bacterial community structure and environmental factors in the hanging area was seawater COD>seawater IN in descending order. The first two axes of the RDA plot explained 90.41% of variation in bacterial communities. January, August and April W-DY samples clustered in the negative half of the first axis, whereas November W-DY samples were mainly influenced by seawater IN and COD and cluster in the positive half of the first axis. During spring, seawater IN mainly, and highly significantly affected seawater bacterial communities; the correlation with seawater COD was highly significant and negative. During summer, seawater COD mainly affected seawater bacterial communities, with a highly significant correlation; the correlation with seawater IN was also highly significant but negative. During both autumn and winter, there were no significant correlations between environmental variables and seawater bacterial communities.
3.8.3. Correlation Analysis of the Sediment Bacteria Community Structure and Environmental Factors
According to Figure 11, the pH and moisture content of seawater , sediment pH and moisture content (P>0.05) were not significant, and seawater IN (=0.415, P<0.01), COD (=0.442, P<0.01), and sediment TP (=0.767, P<0.01) were significantly correlated with the sediment in the benthic culturedarea.
In descending order, correlations were seawater IN > sediment TP > seawater COD. The first two axes explained 76.94% of variation in sediment-dwelling bacterial communities. January, November and April S-DB samples clustered in the negative half of the first axis and were mainly influenced by seawater IN and sediment TP; August S-DB samples were mainly influenced by seawater COD and clustered in the positive half of the first axis. During spring, seawater IN and sediment TP mainly affected sediment-dwelling bacterial communities, with highly significant correlations; correlations with seawater COD were highly significantly negative. During summer, seawater COD mainly affected bacterial communities in sediment, and the correlation was significant; correlations with seawater IN and sediment TP were significantly negative. During autumn, seawater IN and sediment TP mainly affected sediment-dwelling bacterial communities; the correlation with seawater COD was highly significant and negative.During winter, sediment TP and seawater IN mainly affected sediment-dwelling bacterial communities, with highly significant correlations; the correlation with seawater COD was negative.
4. Discussion
The lack of correlation analysis of environmental factors and fungal community structure in the samples is the shortcoming of this study. In this context, the seawater, sediment, and clam intestinal of the R. philippinarum culture area with different culture methods were monitored for one year, their microbial diversity was studied, and the relationship between environmental factors and bacterial community structure and diversity was analyzed.
4.1. Effects of Environmental Factors on Bacterial Community Structure in Seawater and Sediment
The results showed that the bacterial community structure of seawater and sediment in the aquaculture area was significantly affected by the season, but the influence of different aquaculture methods was not obvious (Figure 2 and Figure 3). The season was the same, and the dominant bacteria in the seawater and sediment in the benthic-culture area and the raft-culture area were similar, but the relative abundance was slightly different. The culture methods were the same, but the distribution of dominant bacteria in seawater and sediment in the four seasons was different and there were differences [31]. The abundance of dominant phyla in water, and sediment changed, which was consistent with previous studies [32,33,34]. The analysis results at the phylum level showed that the dominant bacteria in seawater mainly included Proteobacteria, Bacteroidetes, and Cyanobacteria. The main bacterial communities in the sediment were Proteobacteria, Bacteroidetes, and Firmicutes [23,35]. Pseudomonas, Actinomycetes, and Bacteroidetes are the most abundant phyla in the aquatic environment [36,37,38].
Sun et al. [39]The most common and dominant bacterial phyla studied in the intestinal and surrounding environment of crabs in both feeding regimes were Bacteroidetes and Proteobacteria. These abundant phyla have also been reported as dominant phyla in shrimp or other aquatic animals [40,41,42,43,44]. Proteobacteria have emerged as a potential bacterial signature of bacterial community dysbiosis that can reflect fish health through fluctuations in their relative abundance [45,46].
Many environmental factors in water and sediment have been characterized in fish [47], shrimp [22]and crabs [48]The results of RDA showed that environmental factors showed different correlations on the composition of seawater and substrate bacterial community structure as affected by seasons and culture methods (Figures 12–14).IN was the most important environmental factor affecting the bacterial community structure of seawater in the benthic-culture area, and COD was the most important environmental factor affecting the bacterial community structure of seawater in the raft-culture area. IN was the most important environmental factor affecting the bacterial community structure of seawater in the benthic-culture area. IN was the most important environmental factor affecting the structure of the bacterial community in the benthic-culture area. Some environmental factors are limiting factors in a certain period of time, but their limitations also change with seasons and times [49]. H. Zhang et al. [50]-N and TN were found to be the main factors forming water microbial communities in shrimp aquaculture ecosystems. Zhang et al. [48]showed that TN was the main environmental factor influencing the differentiation of water microbial communities.
4.2. Effects of Environmental Factors on the Intestinal Bacteria Community Structure of Clams Collected from Benthic-Culture Area and Raft-Culture Area
Environmental microbiota can influence and significantly differ in the microbial composition of aquatic animals due to continuous contact with water or sediment [26,51]. The bivalve microbiota is highly diverse and susceptible to environmental factors [52,53,54]. Environmental factors were found to show different correlations in the composition of the intestinal bacterial community structure of clams as affected by season and by culture method (Figure 10 and Figure 11).TP was the most important environmental factor affecting the intestinal bacterial community structure of clams in the benthic-culture area, and IN was the most important environmental factor affecting the intestinal bacterial community structure of clams in the raft-culture area. In summary, clams in the benthic-culture area lived in the substrate, and the structure of the intestinal bacterial community of clams was most significantly affected by environmental factors of the substrate, while clams in the raft-culture area lived in seawater, and the structure of the intestinal bacterial community of clams was most significantly affected by environmental factors of seawater. The high spatial and temporal similarity of oyster microbiomes, with some seasonal variation, and the results of the current study are also consistent with characterization studies of other bivalve species [55].
Host-associated microbiota may be limited by many biological factors, such as the host immune system [56], and abiotic factors such as nutrition and salinity [5] (Sun et al., 2019). Previous studies have reported that the shrimp intestinal microbiota exhibits a closer relationship with the sediment microbiota [26]. Fish intestinal microbiota has a direct relationship with fish health and aquaculture efficiency. Feed composition, environmental conditions, and culture methods affect the structure of fish intestinal microbial communities. Establishing and maintaining a "healthy" fish microbial community requires a basic understanding of the diversity and spatial and temporal dynamics of fish-associated microbial communities and their impact on host growth and health [57].Aquatic organisms all have habitats in the water column or sediment, and while intestinal microbes vary widely among organisms, the structural characteristics of their mucosal microbial communities can be significantly influenced by habitat conditions [37,51]. Nikapitiya [58]In his study, the relationship between microorganisms in the intestinal environment of clams was investigated to find the differences in the structure of seawater, substrate, and intestinal community of clams, and correlation analysis was performed. The results showed that the environmental factors affecting the distribution of the bacterial community structure of seawater and substrate clams in the aquaculture area were different and varied significantly. Comparative analyses of water, sediment, and intestinal microbial communities revealed the differences and effects of host species, body parts, and habitats on microbial communities [37].
4.3. Comparison of Alpha Diversity of Environmental Bacteria and Intestinal Bacteria of Benthic Cultured Clams and Raft Cultured Clams
Environmental microbial communities have high bacterial diversity, which may favor the colonization and expansion of aquatic organism-associated microbial communities [51,59,60].
The results showed that the bacterial diversity of clams in spring and summer was significantly greater than that in seawater in the benthic-culture area (Figure 6, Figure 7), significantly greater than that in autumn and in sediment, and there was no significant difference in winter. There is little seasonal variation in the diversity of bacterial communities in aggregates [61], a finding similar to the results of the current study. Compared with the external environment, the species abundance of bacterial species in the intestinal tract of clams in the benthic-culture area was more abundant, and there was no significant difference in the intestinal bacterial community of clams in the raft-culture area compared with the external environment, and the species diversity of the internal and external environments was the same. Highly diverse populations can improve the stability of aquatic ecosystems [62], and the more complete the structure and function of the intestinal environment of clams in the bottom-sowing area, the better the adaptability to changing environmental conditions, but once the ecological environment is damaged, the ecosystem is difficult to recover.
4.4. Comparison of Intestinal Bacterial Community Structure between Benthic Cultured Clams and Raft Cultured Clams
The clams’ intestinal tract was not significantly affected by season and culture mode in the culture area (Figure 4). The structural composition of the bacterial community in the intestinal tract of clams under different culture modes was similar, with slight differences in distribution, and the dominant phyla were mainly Proteobacteria, Bacteroidetes, Firmicutes and Actinomycetes [63].The bacterial composition found in the digestive glands and stomachs of mussels consisted mainly of Proteobacteria, Firmicutes, and Bacteroidetes, which is in agreement with the results of a previous microbiota study conducted on this species [64,65,66]. Cultivation practices were the same, and the structural composition of the clam intestinal bacterial community was similar between seasons, with slight differences in distribution, and the dominant phyla were mainly Proteobacteria and Bacteroidetes. These two phyla were also the dominant phyla for the presence of seawater, sediment and clam intestinal bacterial communities in each sampling season.
There was a clear association between the microbiota in the intestinal of clams and the microbiota in the cultured seawater and sediment (Figure 3 and Figure 4), and the coexistence of intestinal microbes in the culture environment [67], indicating that the microbiota in the intestinal of clams was affected by the culture environment and that the microbiota in the host may be different from the microbiota in the environment [68,69]. The complexity of the intestinal microbiome brings several benefits to its host [70]. The interaction of the intestinal microbiome is dynamic rather than static in nature [71]. Depending on how long the bacteria stay in the intestinal, they are referred to as transient or permanent microbiota [72,73].
In the present study, two-by-two comparisons of -NTI values of intestinal bacterial communities of clams were made under different farming practices (Figure 9). These results showed that the relative influence of stochastic and deterministic processes did not shift much with season and farming methods. Deterministic and stochastic processes are the 2 main ecological processes of microbial community construction. However, the relative impacts on microbial communities may vary with geographic scale, habitat, and species type [74,75,76]. As succession progresses, the relative impact of randomness in the winter suspension zone decreases, and the relative impact of homogeneous selection increases [77]. The reason for this may be analyzed as the clam intestinal bacterial community in the winter hangar area is only affected by seawater and not by the substrate, and the clam intestinal and seawater bacterial communities are structurally similar. In these cases, the stronger the effect of bacterial taxa by the homogeneous selection, the weaker their stochastic process and the stronger the homogeneous selection [78].
5. Conclusions
This is the first comprehensive investigation on seasonal variations of the environmental physicochemical properties, environmental bacteria community structure and intestinal bacteria community structure of R. philippinarum from the benthic culture area as well as the raft culture area. Composition of the intestinal bacteria from benthic cultured clams was significantly affected by inorganic nitrogen content of seawater, total phosphorus content of sediment and pH of sediment. Composition of the intestinal bacteria from raft cultured area was significantly affected by COD of seawater and inorganic nitrogen content of seawater. As compared with raft cultured clams, benthic cultured clams were more susceptible to environmental disturbance, which might contribute to its relatively lower survival rate.
Author Contributions
Conceptualization, L.F.; methodology and formal analysis, X.Z.and Y.C.; software J.L.; investigation, S.L. and C.Z.; resources, L.F.and Z.H.; validation,data curation and writing—original draft preparation, C.Z.; writing—review and editing, C.Z. and L.F.; supervision, L.F.and Z.H.; project administration and funding acquisition, Z.H. and L.F. All authors have read and agreed to the published version of the manuscript.
Funding
The study was financially supported by the China National Key R&D Program"Blue Granary Science and Technology Innovation Project"(No. 2019YFD0900704) and The Applied Basic Research Program of Liaoning(No. 2022JH2/101300141).
Data Availability Statement
Data are contained within the article.
Conflicts of Interest
The authors declare no conflicts of interest.
References
- Amalfitano, S.; Coci, M.; Corno, G.; Luna, G.M. A microbial perspective on biological invasions in aquatic ecosystems. Hydrobiologia 2015, 746, 13–22. [Google Scholar] [CrossRef]
- Nealson, K.H. Sediment bacteria: who’s there, what are they doing, and what’s new? Annual review of earth and planetary sciences 1997, 25, 403–34. [Google Scholar] [CrossRef]
- Lin, G.; Lin, X. Bait input altered microbial community structure and increased greenhouse gases production in coastal wetland sediment. Water Research 2022, 218, 118520. [Google Scholar] [CrossRef] [PubMed]
- Sehnal, L.; Brammer-Robbins, E.; Wormington, A.M.; Blaha, L.; Bisesi, J.; Larkin, I.; Martyniuk, C.J.; Simonin, M.; Adamovsky, O. Microbiome composition and function in aquatic vertebrates: small organisms making big impacts on aquatic animal health. Frontiers in Microbiology 2021, 12, 567408. [Google Scholar] [CrossRef] [PubMed]
- Sun, F.; Wang, Y.; Wang, C.; Zhang, L.; Tu, K.; Zheng, Z. Insights into the intestinal microbiota of several aquatic organisms and association with the surrounding environment. Aquaculture 2019, 507, 196–202. [Google Scholar] [CrossRef]
- Amalfitano, S.; Coci, M.; Corno, G.; Luna, G.M. A microbial perspective on biological invasions in aquatic ecosystems. Hydrobiologia 2015, 746, 13–22. [Google Scholar] [CrossRef]
- Tan, C.K.; Natrah, I.; Suyub, I.B.; Edward, M.J.; Kaman, N.; Samsudin, A.A. Comparative study of gut microbiota in wild and captive Malaysian Mahseer (Tor tambroides). Microbiologyopen 2019, 8, e00734. [Google Scholar] [CrossRef] [PubMed]
- Ringø, E.; Zhou, Z.; Vecino, J.G.; Wadsworth, S.; Romero, J.; Krogdahl, Å.; Olsen, R.E.; Dimitroglou, A.; Foey, A.; Davies, S.; others. Effect of dietary components on the gut microbiota of aquatic animals. A never-ending story? Aquaculture nutrition 2016, 22, 219–282. [Google Scholar] [CrossRef]
- Ruiz-González, C.; Niño-Garcia, J.; Berggren, M.; Del Giorgio, P. Contrasting dynamics and environmental controls of dispersed bacteria along a hydrologic gradient. Adv Oceanogr Limnol 2017, 8, 222–234. [Google Scholar] [CrossRef]
- Diwan, A.D.; Harke, S.N.; Gopalkrishna. ; Panche, A.N. Aquaculture industry prospective from gut microbiome of fish and shellfish: An overview. Journal of Animal Physiology and Animal Nutrition 2022, 106, 441–469. [Google Scholar] [CrossRef]
- Li, Y.F.; Yang, N.; Liang, X.; Yoshida, A.; Osatomi, K.; Power, D.; Batista, F.M.; Yang, J.L. Elevated seawater temperatures decrease microbial diversity in the gut of Mytilus coruscus. Frontiers in Physiology 2018, 9, 839. [Google Scholar] [CrossRef]
- Chen, C.Z.; Li, P.; Liu, L.; Li, Z.H. Exploring the interactions between the gut microbiome and the shifting surrounding aquatic environment in fisheries and aquaculture: A review. Environmental Research 2022, 214, 114202. [Google Scholar] [CrossRef]
- Wei, D.; Xing, C.; Hou, D.; Zeng, S.; Zhou, R.; Yu, L.; Wang, H.; Deng, Z.; Weng, S.; He, J.; others. Distinct bacterial communities in the environmental water, sediment and intestine between two crayfish-plant coculture ecosystems. Applied Microbiology and Biotechnology 2021, 105, 5087–5101. [Google Scholar] [CrossRef]
- Chakraborty, J.; Palit, K.; Das, S. Metagenomic approaches to study the culture-independent bacterial diversity of a polluted environment—a case study on north-eastern coast of Bay of Bengal, India. In Microbial Biodegradation and Bioremediation; Elsevier, 2022; pp. 81–107.
- Qin, Y.; Hou, J.; Deng, M.; Liu, Q.; Wu, C.; Ji, Y.; He, X. Bacterial abundance and diversity in pond water supplied with different feeds. Scientific reports 2016, 6, 35232. [Google Scholar] [CrossRef]
- Powell, S.M.; Chapman, C.; Bermudes, M.; Tamplin, M. Dynamics of seawater bacterial communities in a shellfish hatchery. Microbial ecology 2013, 66, 245–256. [Google Scholar] [CrossRef]
- Iwama, G.K. Interactions between aquaculture and the environment. Critical Reviews in Environmental Science and Technology 1991, 21, 177–216. [Google Scholar] [CrossRef]
- de Bruijn, I.; Liu, Y.; Wiegertjes, G.F.; Raaijmakers, J.M. Exploring fish microbial communities to mitigate emerging diseases in aquaculture. FEMS Microbiology Ecology 2018, 94, fix161. [Google Scholar] [CrossRef]
- Maji, U.J.; Mohanty, S.; Mahapatra, A.S.; Mondal, H.K.; Samanta, M.; Maiti, N.K. Exploring the gut microbiota composition of Indian major carp, rohu (Labeo rohita), under diverse culture conditions. Genomics 2022, 114, 110354. [Google Scholar] [CrossRef]
- Sandaa, R.A.; Magnesen, T.; Torkildsen, L.; Bergh, Ø. Characterisation of the bacterial community associated with early stages of great scallop (Pecten maximus), using denaturing gradient gel electrophoresis (DGGE). Systematic and Applied Microbiology 2003, 26, 302–311. [Google Scholar] [CrossRef] [PubMed]
- Wang, C.; Zhou, Y.; Lv, D.; Ge, Y.; Li, H.; You, Y. Change in the intestinal bacterial community structure associated with environmental microorganisms during the growth of Eriocheir sinensis. MicrobiologyOpen 2019, 8, e00727. [Google Scholar] [CrossRef]
- Hou, D.; Huang, Z.; Zeng, S.; Liu, J.; Weng, S.; He, J. Comparative analysis of the bacterial community compositions of the shrimp intestine, surrounding water and sediment. Journal of applied microbiology 2018, 125, 792–799. [Google Scholar] [CrossRef] [PubMed]
- Li, J.; Li, F.; Yu, S.; Qin, S.; Wang, G. Impacts of mariculture on the diversity of bacterial communities within intertidal sediments in the Northeast of China. Microbial ecology 2013, 66, 861–870. [Google Scholar] [CrossRef] [PubMed]
- Butt, R.L.; Volkoff, H. Gut microbiota and energy homeostasis in fish. Frontiers in endocrinology 2019, 10, 9. [Google Scholar] [CrossRef] [PubMed]
- Fan, L.; Wang, Z.; Chen, M.; Qu, Y.; Li, J.; Zhou, A.; Xie, S.; Zeng, F.; Zou, J. Microbiota comparison of Pacific white shrimp intestine and sediment at freshwater and marine cultured environment. Science of the Total Environment 2019, 657, 1194–1204. [Google Scholar] [CrossRef]
- Huang, F.; Pan, L.; Song, M.; Tian, C.; Gao, S. Microbiota assemblages of water, sediment, and intestine and their associations with environmental factors and shrimp physiological health. Applied microbiology and biotechnology 2018, 102, 8585–8598. [Google Scholar] [CrossRef] [PubMed]
- Banerjee, G.; Ray, A.K. Bacterial symbiosis in the fish gut and its role in health and metabolism. Symbiosis 2017, 72, 1–11. [Google Scholar] [CrossRef]
- Edgar, R.C. UPARSE: highly accurate OTU sequences from microbial amplicon reads. Nature methods 2013, 10, 996–998. [Google Scholar] [CrossRef]
- Che, L.; Hu, Q.; Wang, R.; Zhang, D.; Liu, C.; Zhang, Y.; Xin, G.; Fang, Z.; Lin, Y.; Xu, S.; others. Inter-correlated gut microbiota and SCFAs changes upon antibiotics exposure links with rapid body-mass gain in weaned piglet model. The Journal of nutritional biochemistry 2019, 74, 108246. [Google Scholar] [CrossRef]
- Fan, K.; Weisenhorn, P.; Gilbert, J.A.; Shi, Y.; Bai, Y.; Chu, H. Soil pH correlates with the co-occurrence and assemblage process of diazotrophic communities in rhizosphere and bulk soils of wheat fields. Soil Biology and Biochemistry 2018, 121, 185–192. [Google Scholar] [CrossRef]
- Feng, J.; Zhou, L.; Zhao, X.; Chen, J.; Li, Z.; Liu, Y.; Ou, L.; Xie, Z.; Wang, M.; Yin, X.; others. Evaluation of environmental factors and microbial community structure in an important drinking-water reservoir across seasons. Frontiers in Microbiology 2023, 14, 1091818. [Google Scholar] [CrossRef]
- Huang, Z.; Li, X.; Wang, L.; Shao, Z. Changes in the intestinal bacterial community during the growth of white shrimp, L itopenaeus vannamei. Aquaculture Research 2016, 47, 1737–1746. [Google Scholar] [CrossRef]
- Rungrassamee, W.; Klanchui, A.; Chaiyapechara, S.; Maibunkaew, S.; Tangphatsornruang, S.; Jiravanichpaisal, P.; Karoonuthaisiri, N. Bacterial population in intestines of the black tiger shrimp (Penaeus monodon) under different growth stages. PloS one 2013, 8, e60802. [Google Scholar] [CrossRef]
- Zhang, H.; Sun, Z.; Liu, B.; Xuan, Y.; Jiang, M.; Pan, Y.; Zhang, Y.; Gong, Y.; Lu, X.; Yu, D.; others. Dynamic changes of microbial communities in Litopenaeus vannamei cultures and the effects of environmental factors. Aquaculture 2016, 455, 97–108. [Google Scholar] [CrossRef]
- Schulze, A.D.; Alabi, A.O.; Tattersall-Sheldrake, A.R.; Miller, K.M. Bacterial diversity in a marine hatchery: balance between pathogenic and potentially probiotic bacterial strains. Aquaculture 2006, 256, 50–73. [Google Scholar] [CrossRef]
- Ferreira, A.C.; Nobre, M.F.; Rainey, F.A.; Silva, M.T.; Wait, R.; Burghardt, J.; Chung, A.P.; Da Costa, M.S. Deinococcus geothermalis sp. nov. and Deinococcus murrayi sp. nov., two extremely radiation-resistant and slightly thermophilic species from hot springs. International Journal of Systematic and Evolutionary Microbiology 1997, 47, 939–947. [Google Scholar] [CrossRef]
- Kuang, T.; He, A.; Lin, Y.; Huang, X.; Liu, L.; Zhou, L. Comparative analysis of microbial communities associated with the gill, gut, and habitat of two filter-feeding fish. Aquaculture Reports 2020, 18, 100501. [Google Scholar] [CrossRef]
- Sylvain, F.É.; Holland, A.; Bouslama, S.; Audet-Gilbert, É.; Lavoie, C.; Val, A.L.; Derome, N. Fish skin and gut microbiomes show contrasting signatures of host species and habitat. Applied and environmental microbiology 2020, 86, e00789–20. [Google Scholar] [CrossRef] [PubMed]
- Sun, Y.; Han, W.; Liu, J.; Huang, X.; Zhou, W.; Zhang, J.; Cheng, Y. Bacterial community compositions of crab intestine, surrounding water, and sediment in two different feeding modes of Eriocheir sinensis. Aquaculture Reports 2020, 16, 100236. [Google Scholar] [CrossRef]
- Duan, Y.; Liu, Q.; Wang, Y.; Zhang, J.; Xiong, D. Impairment of the intestine barrier function in Litopenaeus vannamei exposed to ammonia and nitrite stress. Fish & shellfish immunology 2018, 78, 279–288. [Google Scholar]
- Gao, S.; Pan, L.; Huang, F.; Song, M.; Tian, C.; Zhang, M. Metagenomic insights into the structure and function of intestinal microbiota of the farmed Pacific white shrimp (Litopenaeus vannamei). Aquaculture 2019, 499, 109–118. [Google Scholar] [CrossRef]
- Liu, H.; Guo, X.; Gooneratne, R.; Lai, R.; Zeng, C.; Zhan, F.; Wang, W. The gut microbiome and degradation enzyme activity of wild freshwater fishes influenced by their trophic levels. Scientific reports 2016, 6, 24340. [Google Scholar] [CrossRef]
- Wu, S.; Wang, G.; Angert, E.R.; Wang, W.; Li, W.; Zou, H. Composition, diversity, and origin of the bacterial community in grass carp intestine. PloS one 2012, 7, e30440. [Google Scholar] [CrossRef]
- Zhang, Z.; Xing, R.; Lv, Z.; Shao, Y.; Zhang, W.; Zhao, X.; Li, C. Analysis of gut microbiota revealed Lactococcus garviaeae could be an indicative of skin ulceration syndrome in farmed sea cucumber Apostichopus japonicus. Fish & shellfish immunology 2018, 80, 148–154. [Google Scholar]
- Shapleigh, J.P. Oxygen control of nitrogen oxide respiration, focusing on α-proteobacteria. Biochemical Society Transactions 2011, 39, 179–183. [Google Scholar] [CrossRef] [PubMed]
- Shin, N.R.; Whon, T.W.; Bae, J.W. Proteobacteria: microbial signature of dysbiosis in gut microbiota. Trends in biotechnology 2015, 33, 496–503. [Google Scholar] [CrossRef]
- Dai, L.; Liu, C.; Yu, L.; Song, C.; Peng, L.; Li, X.; Tao, L.; Li, G. Organic matter regulates ammonia-oxidizing bacterial and archaeal communities in the surface sediments of Ctenopharyngodon idellus aquaculture ponds. Frontiers in Microbiology 2018, 9, 2290. [Google Scholar] [CrossRef]
- Zhang, Z.; Deng, Q.; Cao, X.; Zhou, Y.; Song, C. Patterns of sediment fungal community dependent on farming practices in aquaculture ponds. Frontiers in Microbiology 2021, 12, 542064. [Google Scholar] [CrossRef]
- Zhao, K.; Yang, J.; Lv, J.; Liu, Q.; Liu, X.; Xie, S.; Feng, J. Structural Characteristics of Periphytic Algal Community and Its Relationship with Environmental Factors in the Taiyuan Region of the Fenhe River. Water 2022, 14, 2151. [Google Scholar] [CrossRef]
- Zhang, H.; Sun, Z.; Liu, B.; Xuan, Y.; Jiang, M.; Pan, Y.; Zhang, Y.; Gong, Y.; Lu, X.; Yu, D.; others. Dynamic changes of microbial communities in Litopenaeus vannamei cultures and the effects of environmental factors. Aquaculture 2016, 455, 97–108. [Google Scholar] [CrossRef]
- Del’Duca, A.; Cesar, D.E.; Abreu, P.C. Bacterial community of pond’s water, sediment and in the guts of tilapia (O reochromis niloticus) juveniles characterized by fluorescent in situ hybridization technique. Aquaculture Research 2015, 46, 707–715. [Google Scholar] [CrossRef]
- Green, T.; Barnes, A. Bacterial diversity of the digestive gland of Sydney rock oysters, Saccostrea glomerata infected with the paramyxean parasite, Marteilia sydneyi. Journal of Applied Microbiology 2010, 109, 613–622. [Google Scholar] [CrossRef]
- Lokmer, A.; Wegner, K.M. Hemolymph microbiome of Pacific oysters in response to temperature, temperature stress and infection. The ISME journal 2015, 9, 670–682. [Google Scholar] [CrossRef] [PubMed]
- Milan, M.; Carraro, L.; Fariselli, P.; Martino, M.; Cavalieri, D.; Vitali, F.; Boffo, L.; Patarnello, T.; Bargelloni, L.; Cardazzo, B. Microbiota and environmental stress: how pollution affects microbial communities in Manila clams. Aquatic Toxicology 2018, 194, 195–207. [Google Scholar] [CrossRef]
- Pierce, M.L.; Ward, J.E. Microbial ecology of the Bivalvia, with an emphasis on the family Ostreidae. Journal of Shellfish Research 2018, 37, 793–806. [Google Scholar] [CrossRef]
- Brown, R.M.; Wiens, G.D.; Salinas, I. Analysis of the gut and gill microbiome of resistant and susceptible lines of rainbow trout (Oncorhynchus mykiss). Fish & shellfish immunology 2019, 86, 497–506. [Google Scholar]
- Egerton, S.; Culloty, S.; Whooley, J.; Stanton, C.; Ross, R.P. The gut microbiota of marine fish. Frontiers in microbiology 2018, 9, 873. [Google Scholar] [CrossRef] [PubMed]
- Nikapitiya, C. Marine bacteria as probiotics and their applications in aquaculture. Marine Microbiology 2013, pp. 97–126.
- Al-Harbi, A.H.; Uddin, N. Bacterial diversity of tilapia (Oreochromis niloticus) cultured in brackish water in Saudi Arabia. Aquaculture 2005, 250, 566–572. [Google Scholar] [CrossRef]
- Dabadé, D.S.; Wolkers-Rooijackers, J.C.; Azokpota, P.; Hounhouigan, D.J.; Zwietering, M.H.; Nout, M.R.; den Besten, H.M. Bacterial concentration and diversity in fresh tropical shrimps (Penaeus notialis) and the surrounding brackish waters and sediment. International journal of food microbiology 2016, 218, 96–104. [Google Scholar] [CrossRef]
- Vojvoda, J.; Lamy, D.; Sintes, E.; Garcia, J.A.; Turk, V.; Herndl, G.J. Seasonal variation in marine-snow-associated and ambient-water prokaryotic communities in the northern Adriatic Sea. Aquatic Microbial Ecology 2014, 73, 211–224. [Google Scholar] [CrossRef]
- Li, X.; Wang, T.; Fu, B.; Mu, X. Improvement of aquaculture water quality by mixed Bacillus and its effects on microbial community structure. Environmental Science and Pollution Research 2022, 29, 69731–69742. [Google Scholar] [CrossRef]
- Grice, E.A.; Kong, H.H.; Conlan, S.; Deming, C.B.; Davis, J.; Young, A.C.; Program, N.C.S.; Bouffard, G.G.; Blakesley, R.W.; Murray, P.R.; others. Topographical and temporal diversity of the human skin microbiome. science 2009, 324, 1190–1192. [Google Scholar] [CrossRef]
- Santisi, S.; Genovese, M.; Bonsignore, M.; Fiumara, E.; Maricchiolo, G.; Mancuso, M.; Genovese, L.; Giuliano, L.; Cappello, S. Study of bacterial communities in mussel Mytilus galloprovincialis by a combination of 16S crDNA and 16S rDNA sequencing. Int. J. Microbiol. Appl 2015, 2, 18–24. [Google Scholar]
- Li, Y.F.; Xu, J.K.; Chen, Y.W.; Ding, W.Y.; Shao, A.Q.; Liang, X.; Zhu, Y.T.; Yang, J.L. Characterization of gut microbiome in the mussel Mytilus galloprovincialis in response to thermal stress. Frontiers in Physiology 2019, 10, 1086. [Google Scholar] [CrossRef] [PubMed]
- Musella, M.; Wathsala, R.; Tavella, T.; Rampelli, S.; Barone, M.; Palladino, G.; Biagi, E.; Brigidi, P.; Turroni, S.; Franzellitti, S.; others. Tissue-scale microbiota of the Mediterranean mussel (Mytilus galloprovincialis) and its relationship with the environment. Science of the Total Environment 2020, 717, 137209. [Google Scholar] [CrossRef] [PubMed]
- Xiong, J.; Zhu, J.; Dai, W.; Dong, C.; Qiu, Q.; Li, C. Integrating gut microbiota immaturity and disease-discriminatory taxa to diagnose the initiation and severity of shrimp disease. Environmental microbiology 2017, 19, 1490–1501. [Google Scholar] [CrossRef] [PubMed]
- Zhang, C.; Zheng, X.; Ren, X.; Li, Y.; Wang, Y. Bacterial diversity in gut of large yellow croaker Larimichthys crocea and black sea bream Sparus macrocephalus reared in an inshore net pen. Fisheries science 2019, 85, 1027–1036. [Google Scholar] [CrossRef]
- Wei, N.; Wang, C.; Xiao, S.; Huang, W.; Lin, M.; Yan, Q.; Ma, Y. Intestinal microbiota in large yellow croaker, Larimichthys crocea, at different ages. Journal of the World Aquaculture Society 2018, 49, 256–267. [Google Scholar] [CrossRef]
- Flint, H.J.; Bayer, E.A.; Rincon, M.T.; Lamed, R.; White, B.A. Polysaccharide utilization by gut bacteria: potential for new insights from genomic analysis. Nature Reviews Microbiology 2008, 6, 121–131. [Google Scholar] [CrossRef]
- Yukgehnaish, K.; Kumar, P.; Sivachandran, P.; Marimuthu, K.; Arshad, A.; Paray, B.A.; Arockiaraj, J. Gut microbiota metagenomics in aquaculture: factors influencing gut microbiome and its physiological role in fish. Reviews in Aquaculture 2020, 12, 1903–1927. [Google Scholar] [CrossRef]
- Bhatt, P.; Kumaresan, V.; Palanisamy, R.; Ravichandran, G.; Mala, K.; Amin, S.N.; Arshad, A.; Yusoff, F.M.; Arockiaraj, J. A mini review on immune role of chemokines and its receptors in snakehead murrel Channa striatus. Fish & shellfish immunology 2018, 72, 670–678. [Google Scholar]
- Shade, A.; Handelsman, J. Beyond the Venn diagram: the hunt for a core microbiome. Environmental microbiology 2012, 14, 4–12. [Google Scholar] [CrossRef]
- Xiong, J.; Liu, Y.; Lin, X.; Zhang, H.; Zeng, J.; Hou, J.; Yang, Y.; Yao, T.; Knight, R.; Chu, H. Geographic distance and pH drive bacterial distribution in alkaline lake sediments across Tibetan Plateau. Environmental microbiology 2012, 14, 2457–2466. [Google Scholar] [CrossRef]
- Bardgett, R.D.; Van Der Putten, W.H. Belowground biodiversity and ecosystem functioning. Nature 2014, 515, 505–511. [Google Scholar] [CrossRef] [PubMed]
- Wang, J.T.; Zheng, Y.M.; Hu, H.W.; Li, J.; Zhang, L.M.; Chen, B.D.; Chen, W.P.; He, J.Z. Coupling of soil prokaryotic diversity and plant diversity across latitudinal forest ecosystems. Scientific Reports 2016, 6, 19561. [Google Scholar] [CrossRef] [PubMed]
- Dini-Andreote, F.; Stegen, J.C.; Van Elsas, J.D.; Salles, J.F. Disentangling mechanisms that mediate the balance between stochastic and deterministic processes in microbial succession. Proceedings of the National Academy of Sciences 2015, 112, E1326–E1332. [Google Scholar] [CrossRef] [PubMed]
- Jiao, S.; Chu, H.; Zhang, B.; Wei, X.; Chen, W.; Wei, G. Linking soil fungi to bacterial community assembly in arid ecosystems. IMeta 2022, 1, e2. [Google Scholar] [CrossRef]
Figure 1.
Locations and sampling stations in the benthic- and raft-culture area of shellfish culture area
Figure 1.
Locations and sampling stations in the benthic- and raft-culture area of shellfish culture area
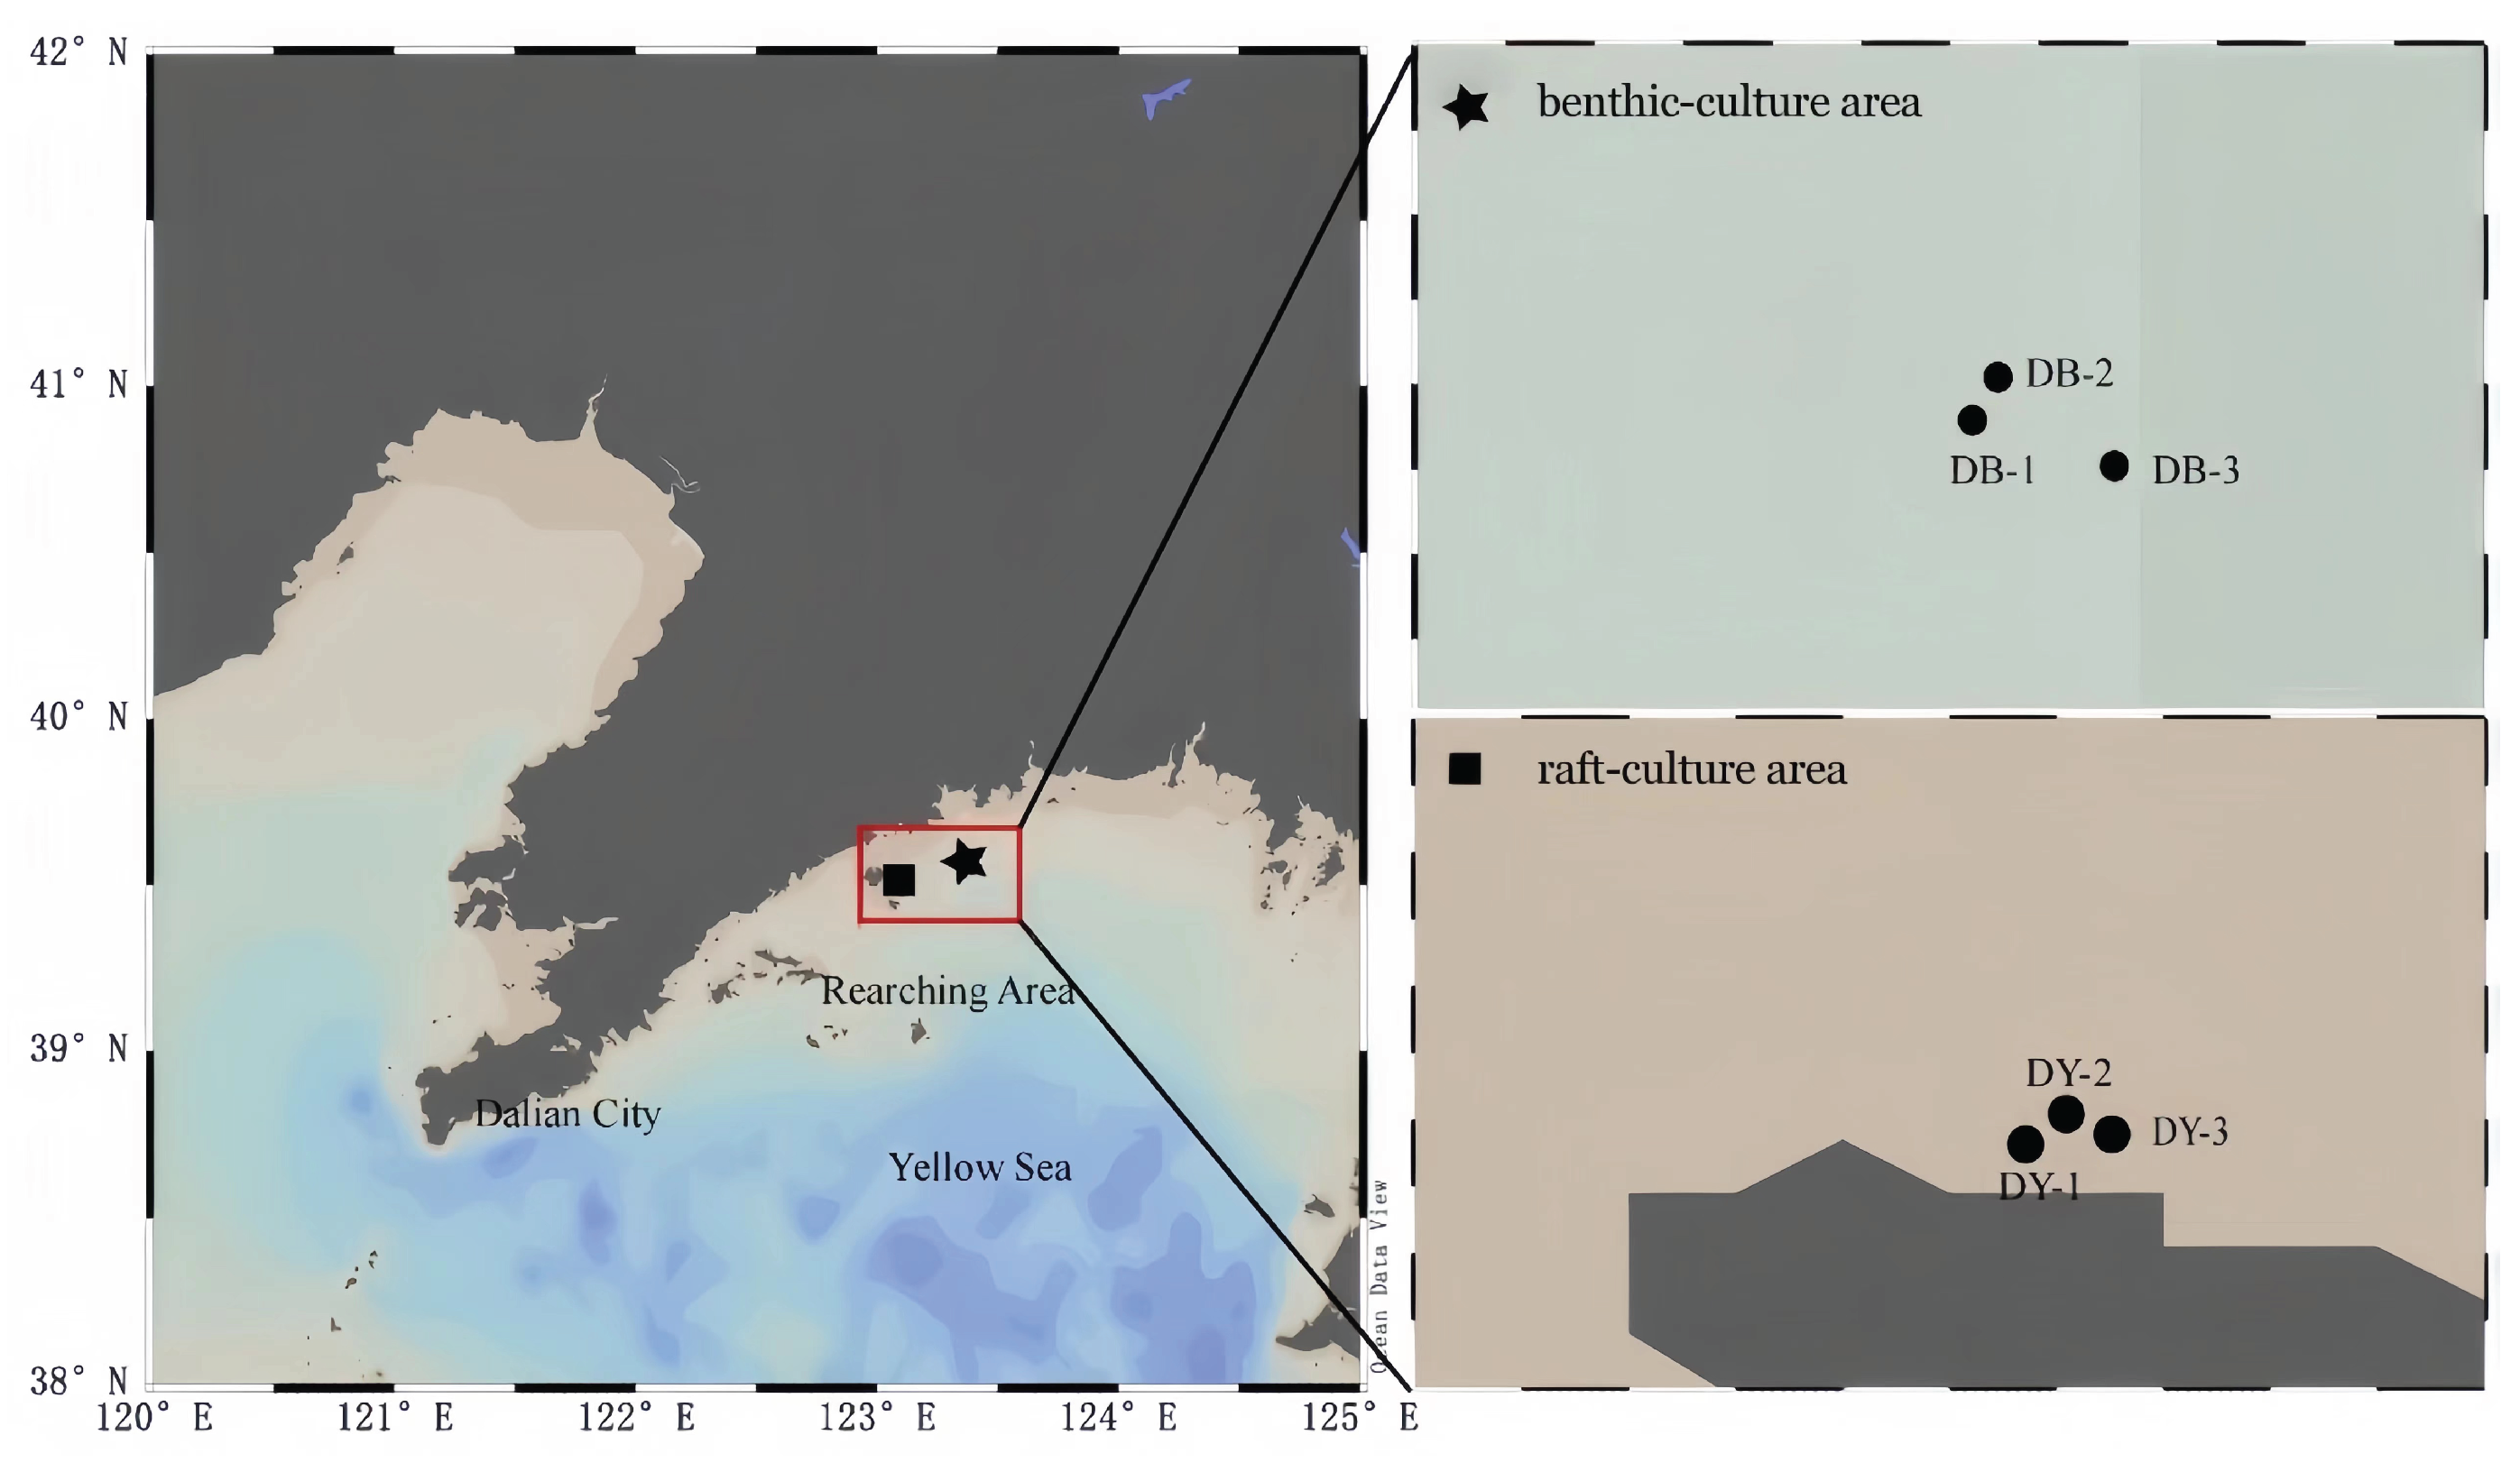
Figure 2.
Proportional contributions of dominant bacterial phyla to assemblages in seawater: (a) spring; (b) summer; (c) autumn; (d) winter. Non-dominant species = ‘Others.’ ‘Unassigned’ = species without taxonomic annotation.
Figure 2.
Proportional contributions of dominant bacterial phyla to assemblages in seawater: (a) spring; (b) summer; (c) autumn; (d) winter. Non-dominant species = ‘Others.’ ‘Unassigned’ = species without taxonomic annotation.
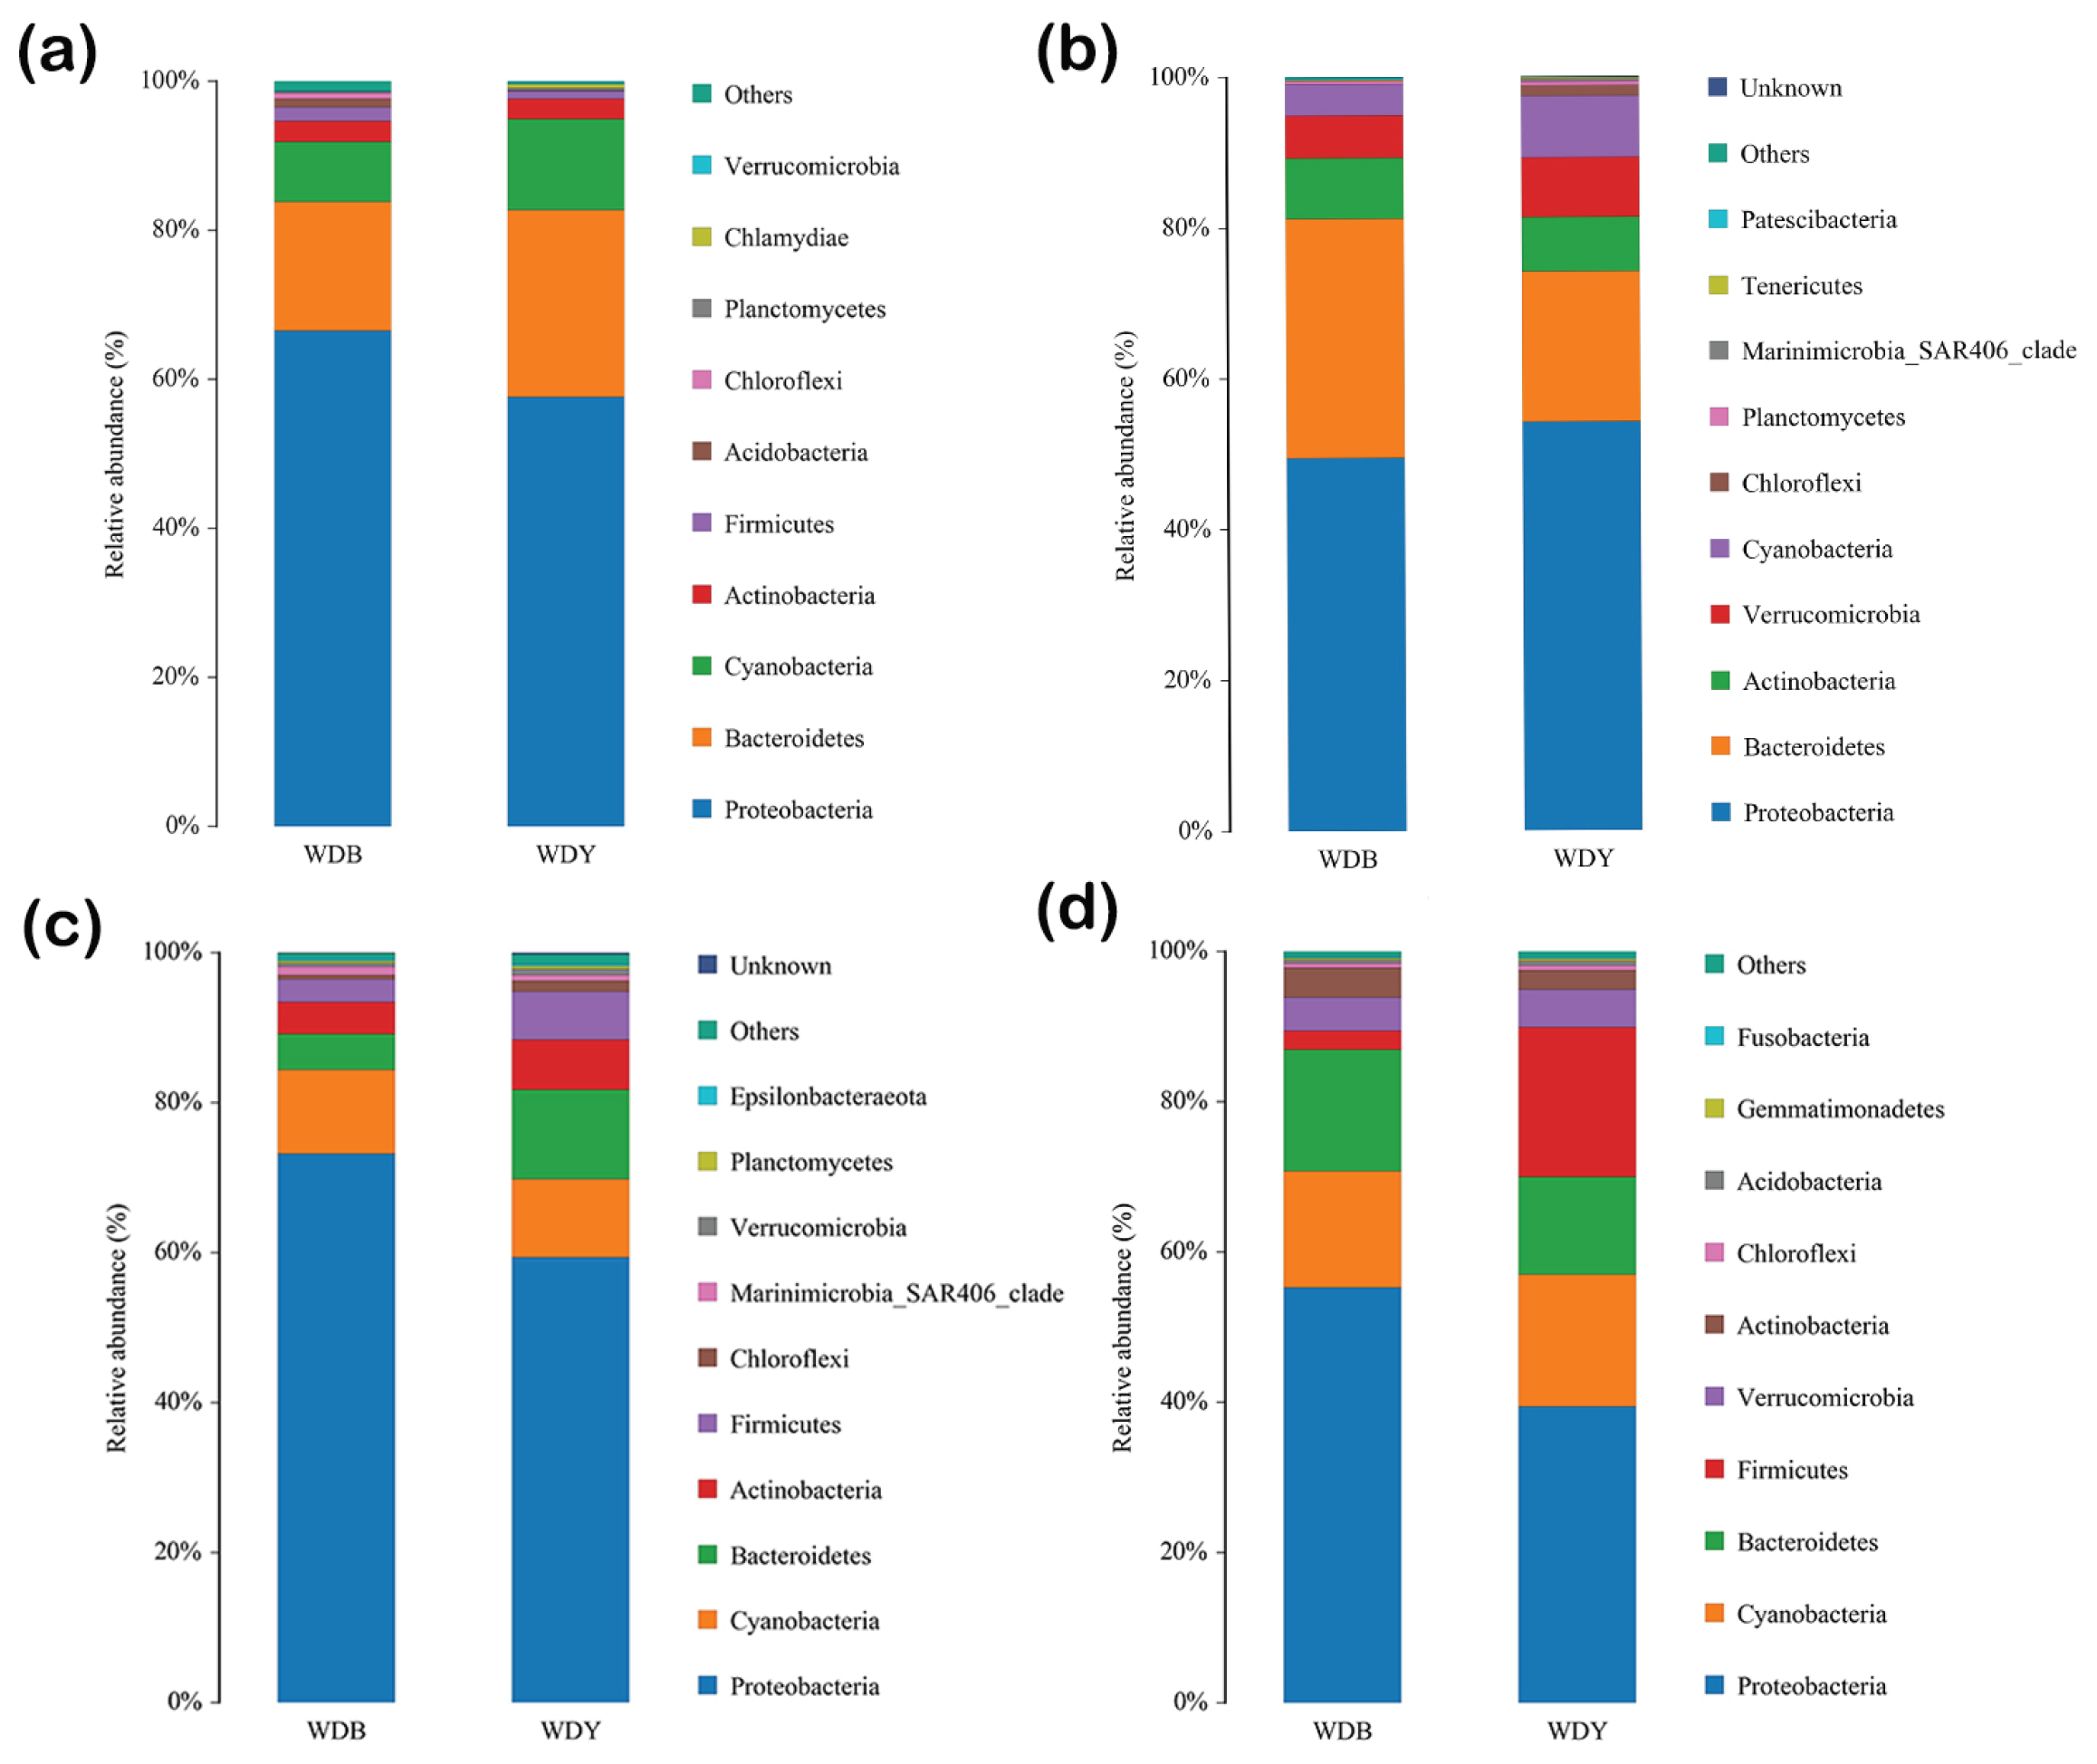
Figure 3.
Proportional contributions of dominant bacterial phyla to assemblages in sediment: (a) spring; (b) summer; (c) autumn; (d) winter. Non-dominant species = ‘Others.’ ‘Unassigned’ = species without taxonomic annotation.
Figure 3.
Proportional contributions of dominant bacterial phyla to assemblages in sediment: (a) spring; (b) summer; (c) autumn; (d) winter. Non-dominant species = ‘Others.’ ‘Unassigned’ = species without taxonomic annotation.

Figure 4.
Proportional contributions of dominant bacterial phyla to assemblages in clam intestinal s: (a) spring; (b) summer; (c) autumn; (d) winter. Non-dominant species = ‘Others.’ ‘Unassigned’ = species without taxonomic annotation.
Figure 4.
Proportional contributions of dominant bacterial phyla to assemblages in clam intestinal s: (a) spring; (b) summer; (c) autumn; (d) winter. Non-dominant species = ‘Others.’ ‘Unassigned’ = species without taxonomic annotation.
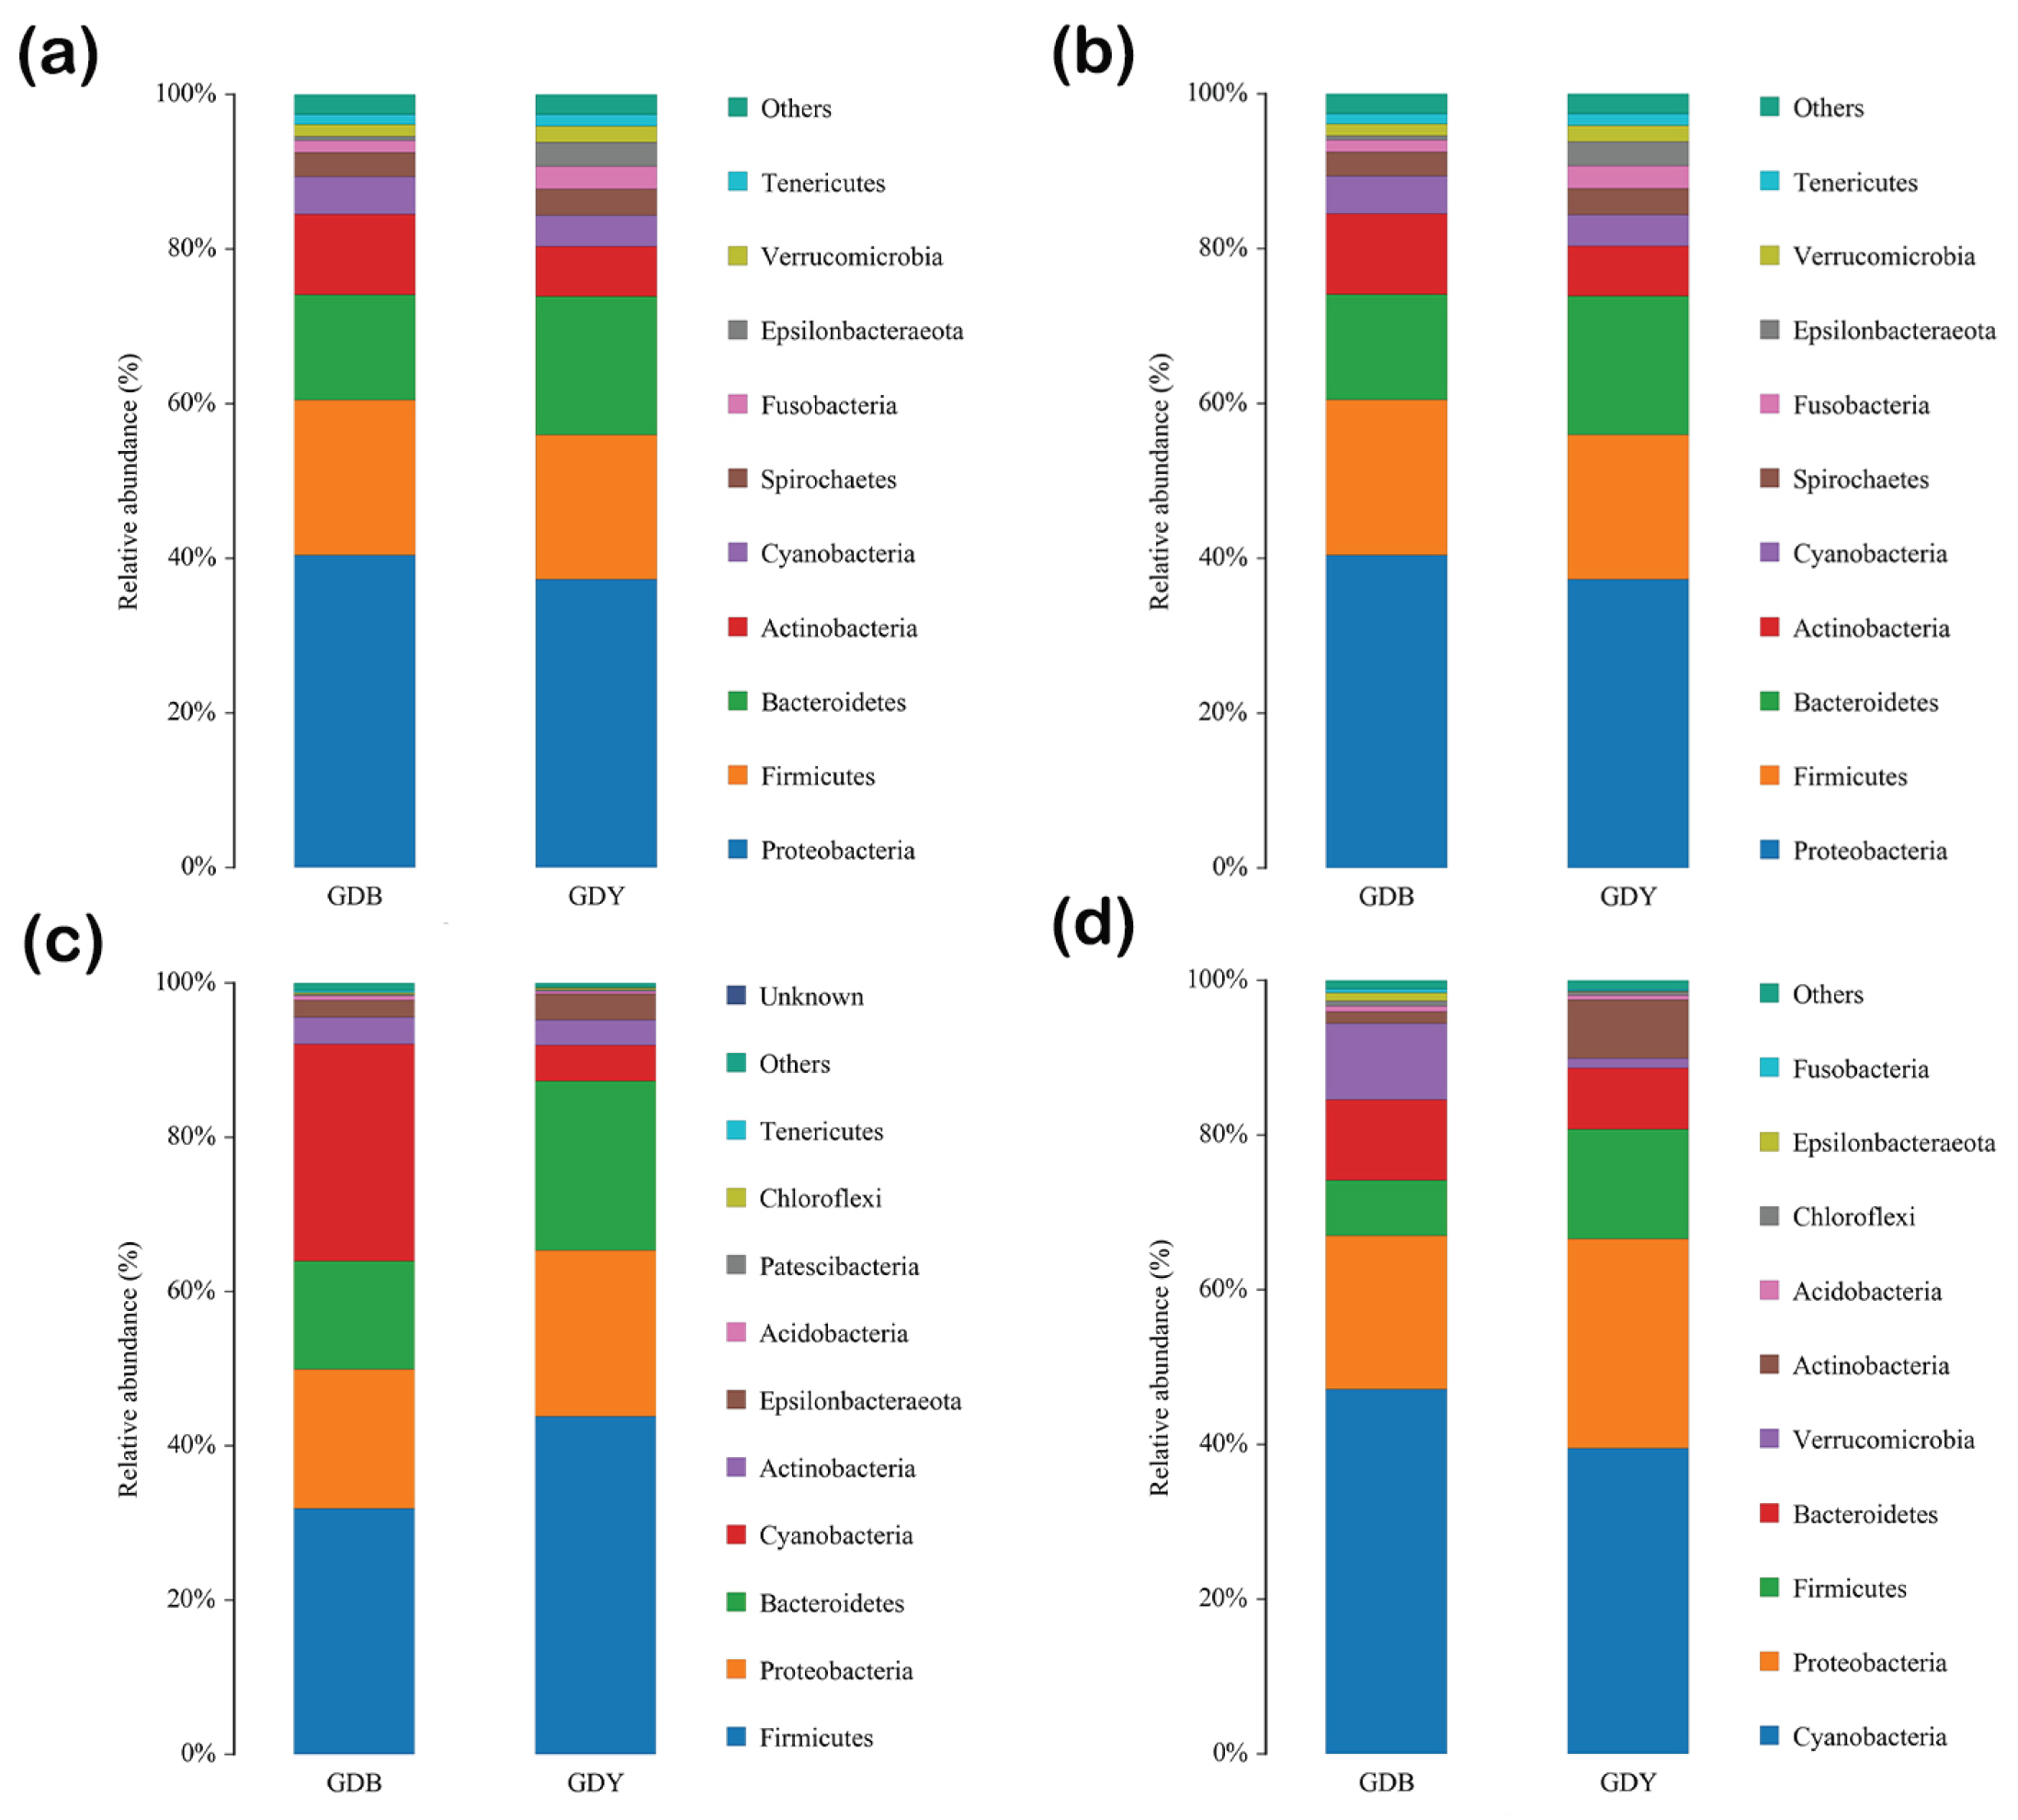
Figure 5.
Alpha diversity index of the gut, seawater, and sediment of clam larvae in the raft-culture area: DB, benthic-culture area; DY, raft-culture area;(a) spring; (b) summer; (c) autumn; (d) winter.
Figure 5.
Alpha diversity index of the gut, seawater, and sediment of clam larvae in the raft-culture area: DB, benthic-culture area; DY, raft-culture area;(a) spring; (b) summer; (c) autumn; (d) winter.
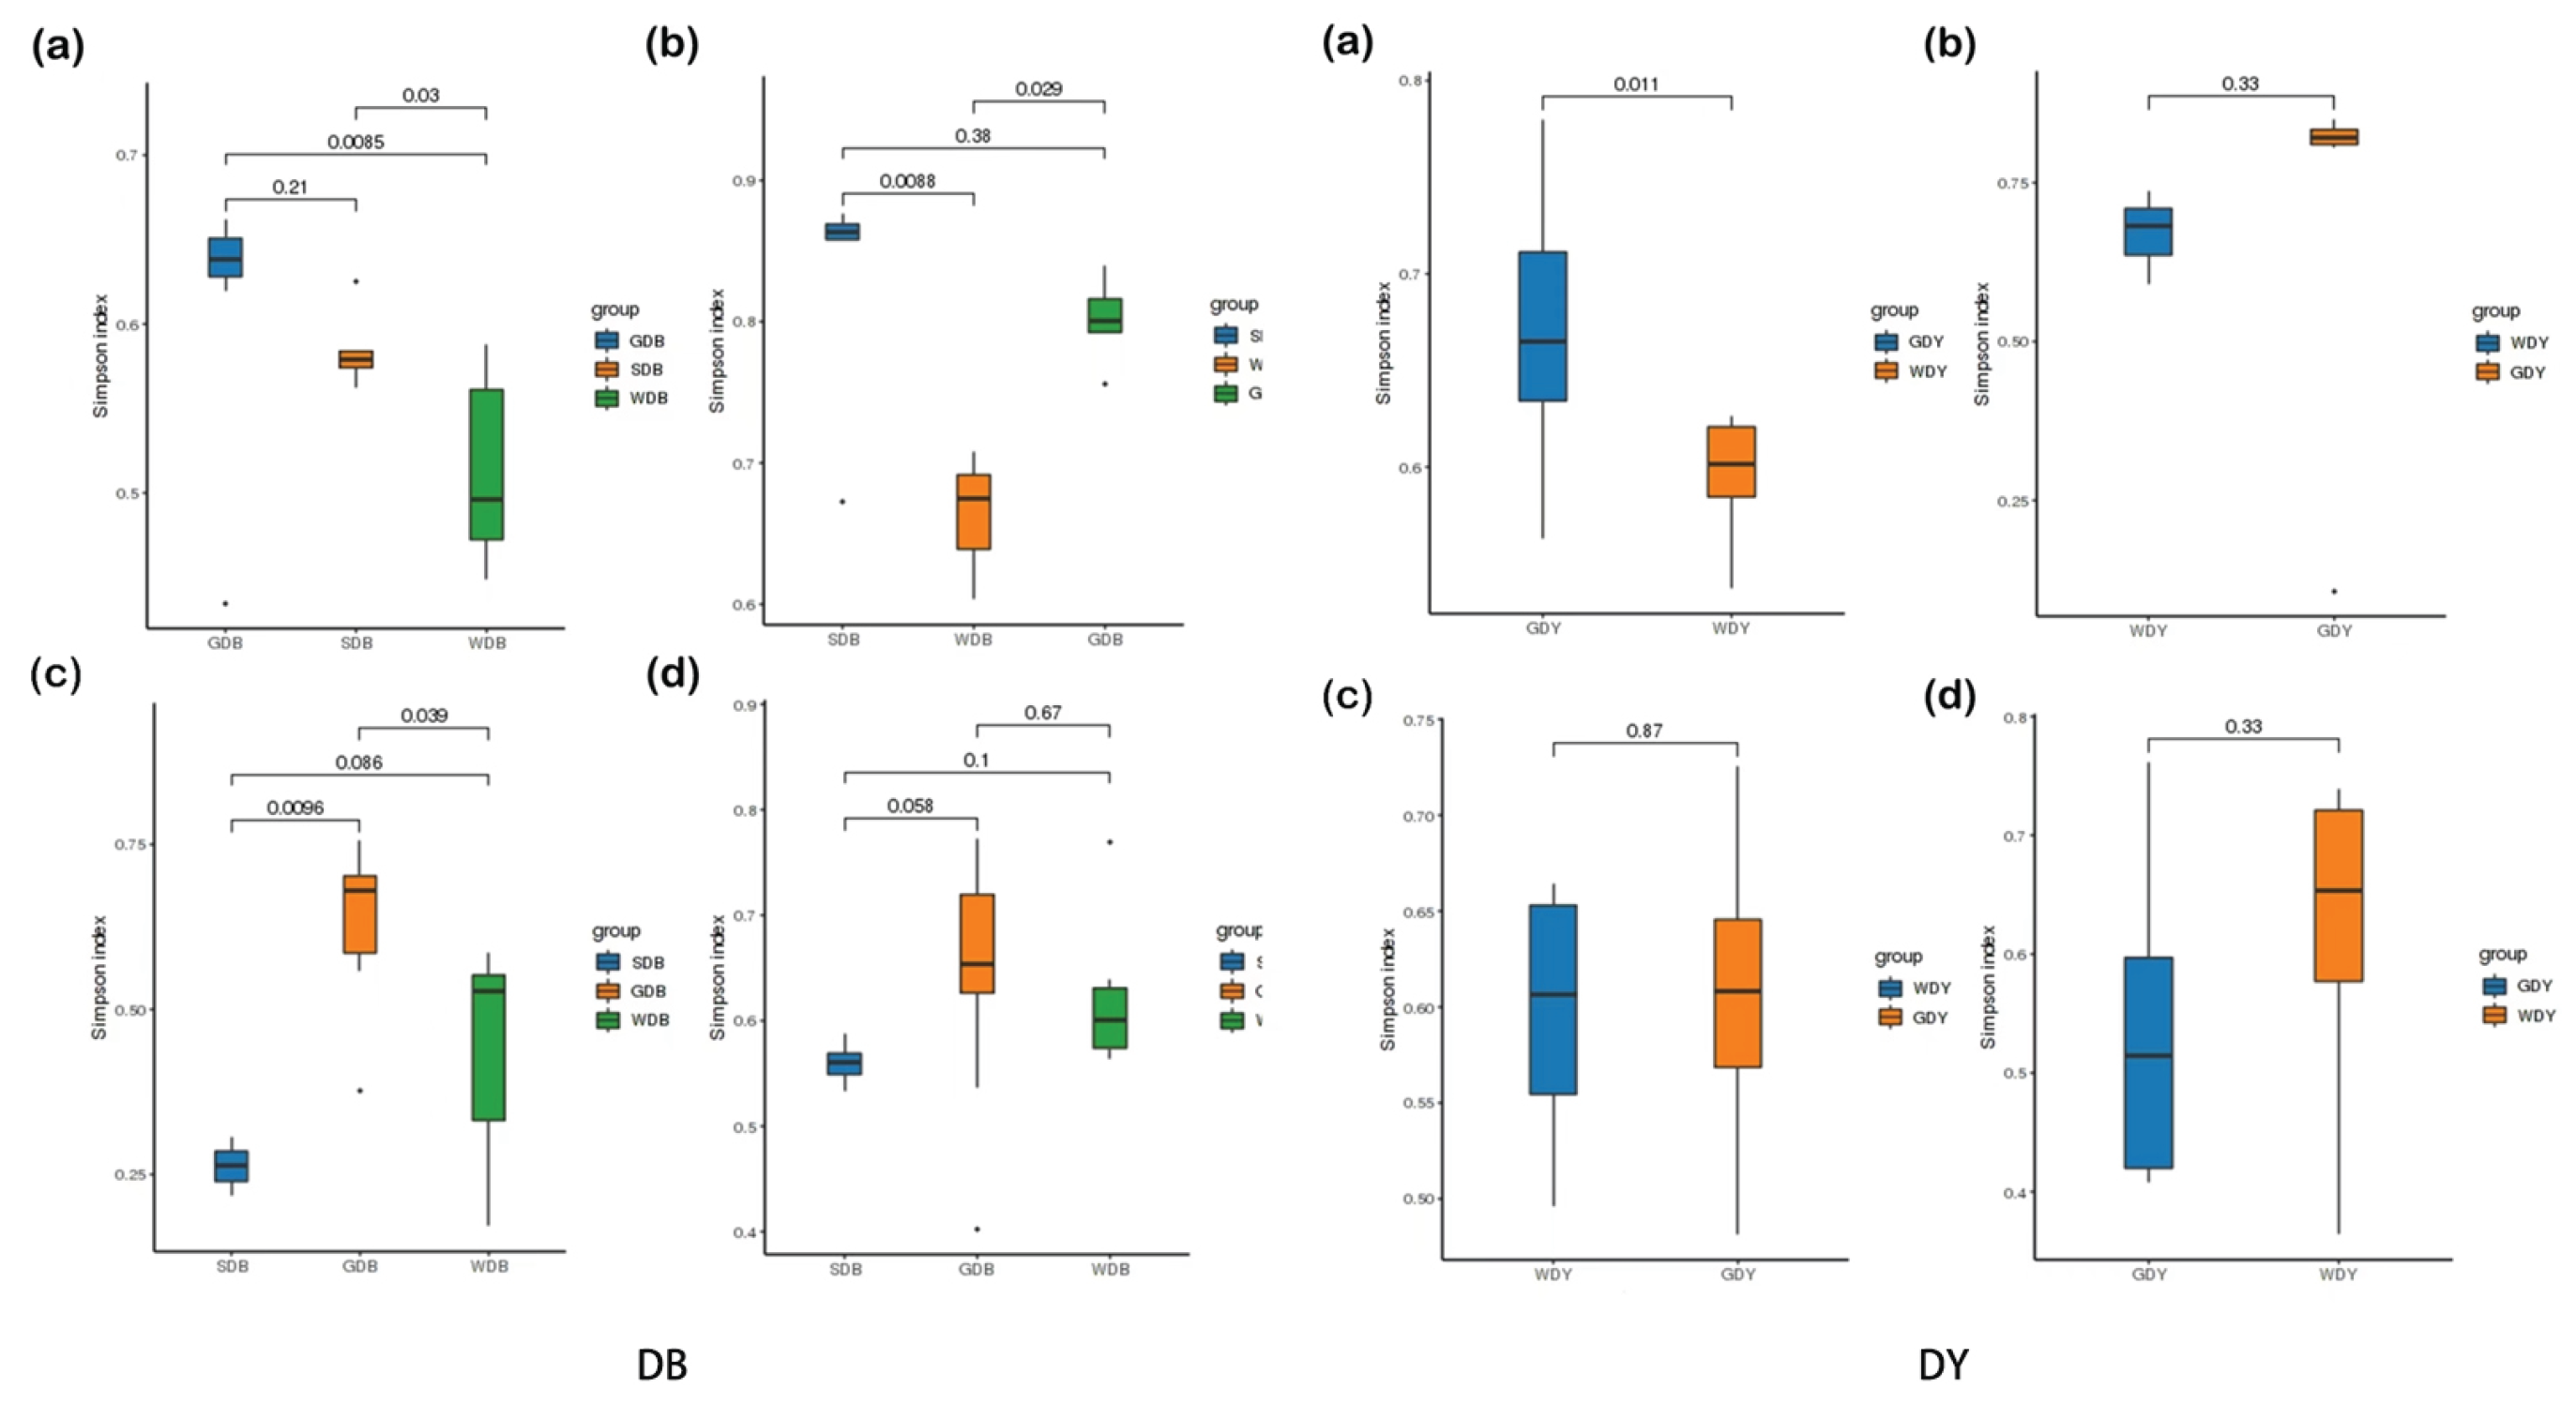
Figure 6.
Analysis of gut community structure of clams: (a) spring; (b) summer; (c) autumn; (d) winter.
Figure 6.
Analysis of gut community structure of clams: (a) spring; (b) summer; (c) autumn; (d) winter.
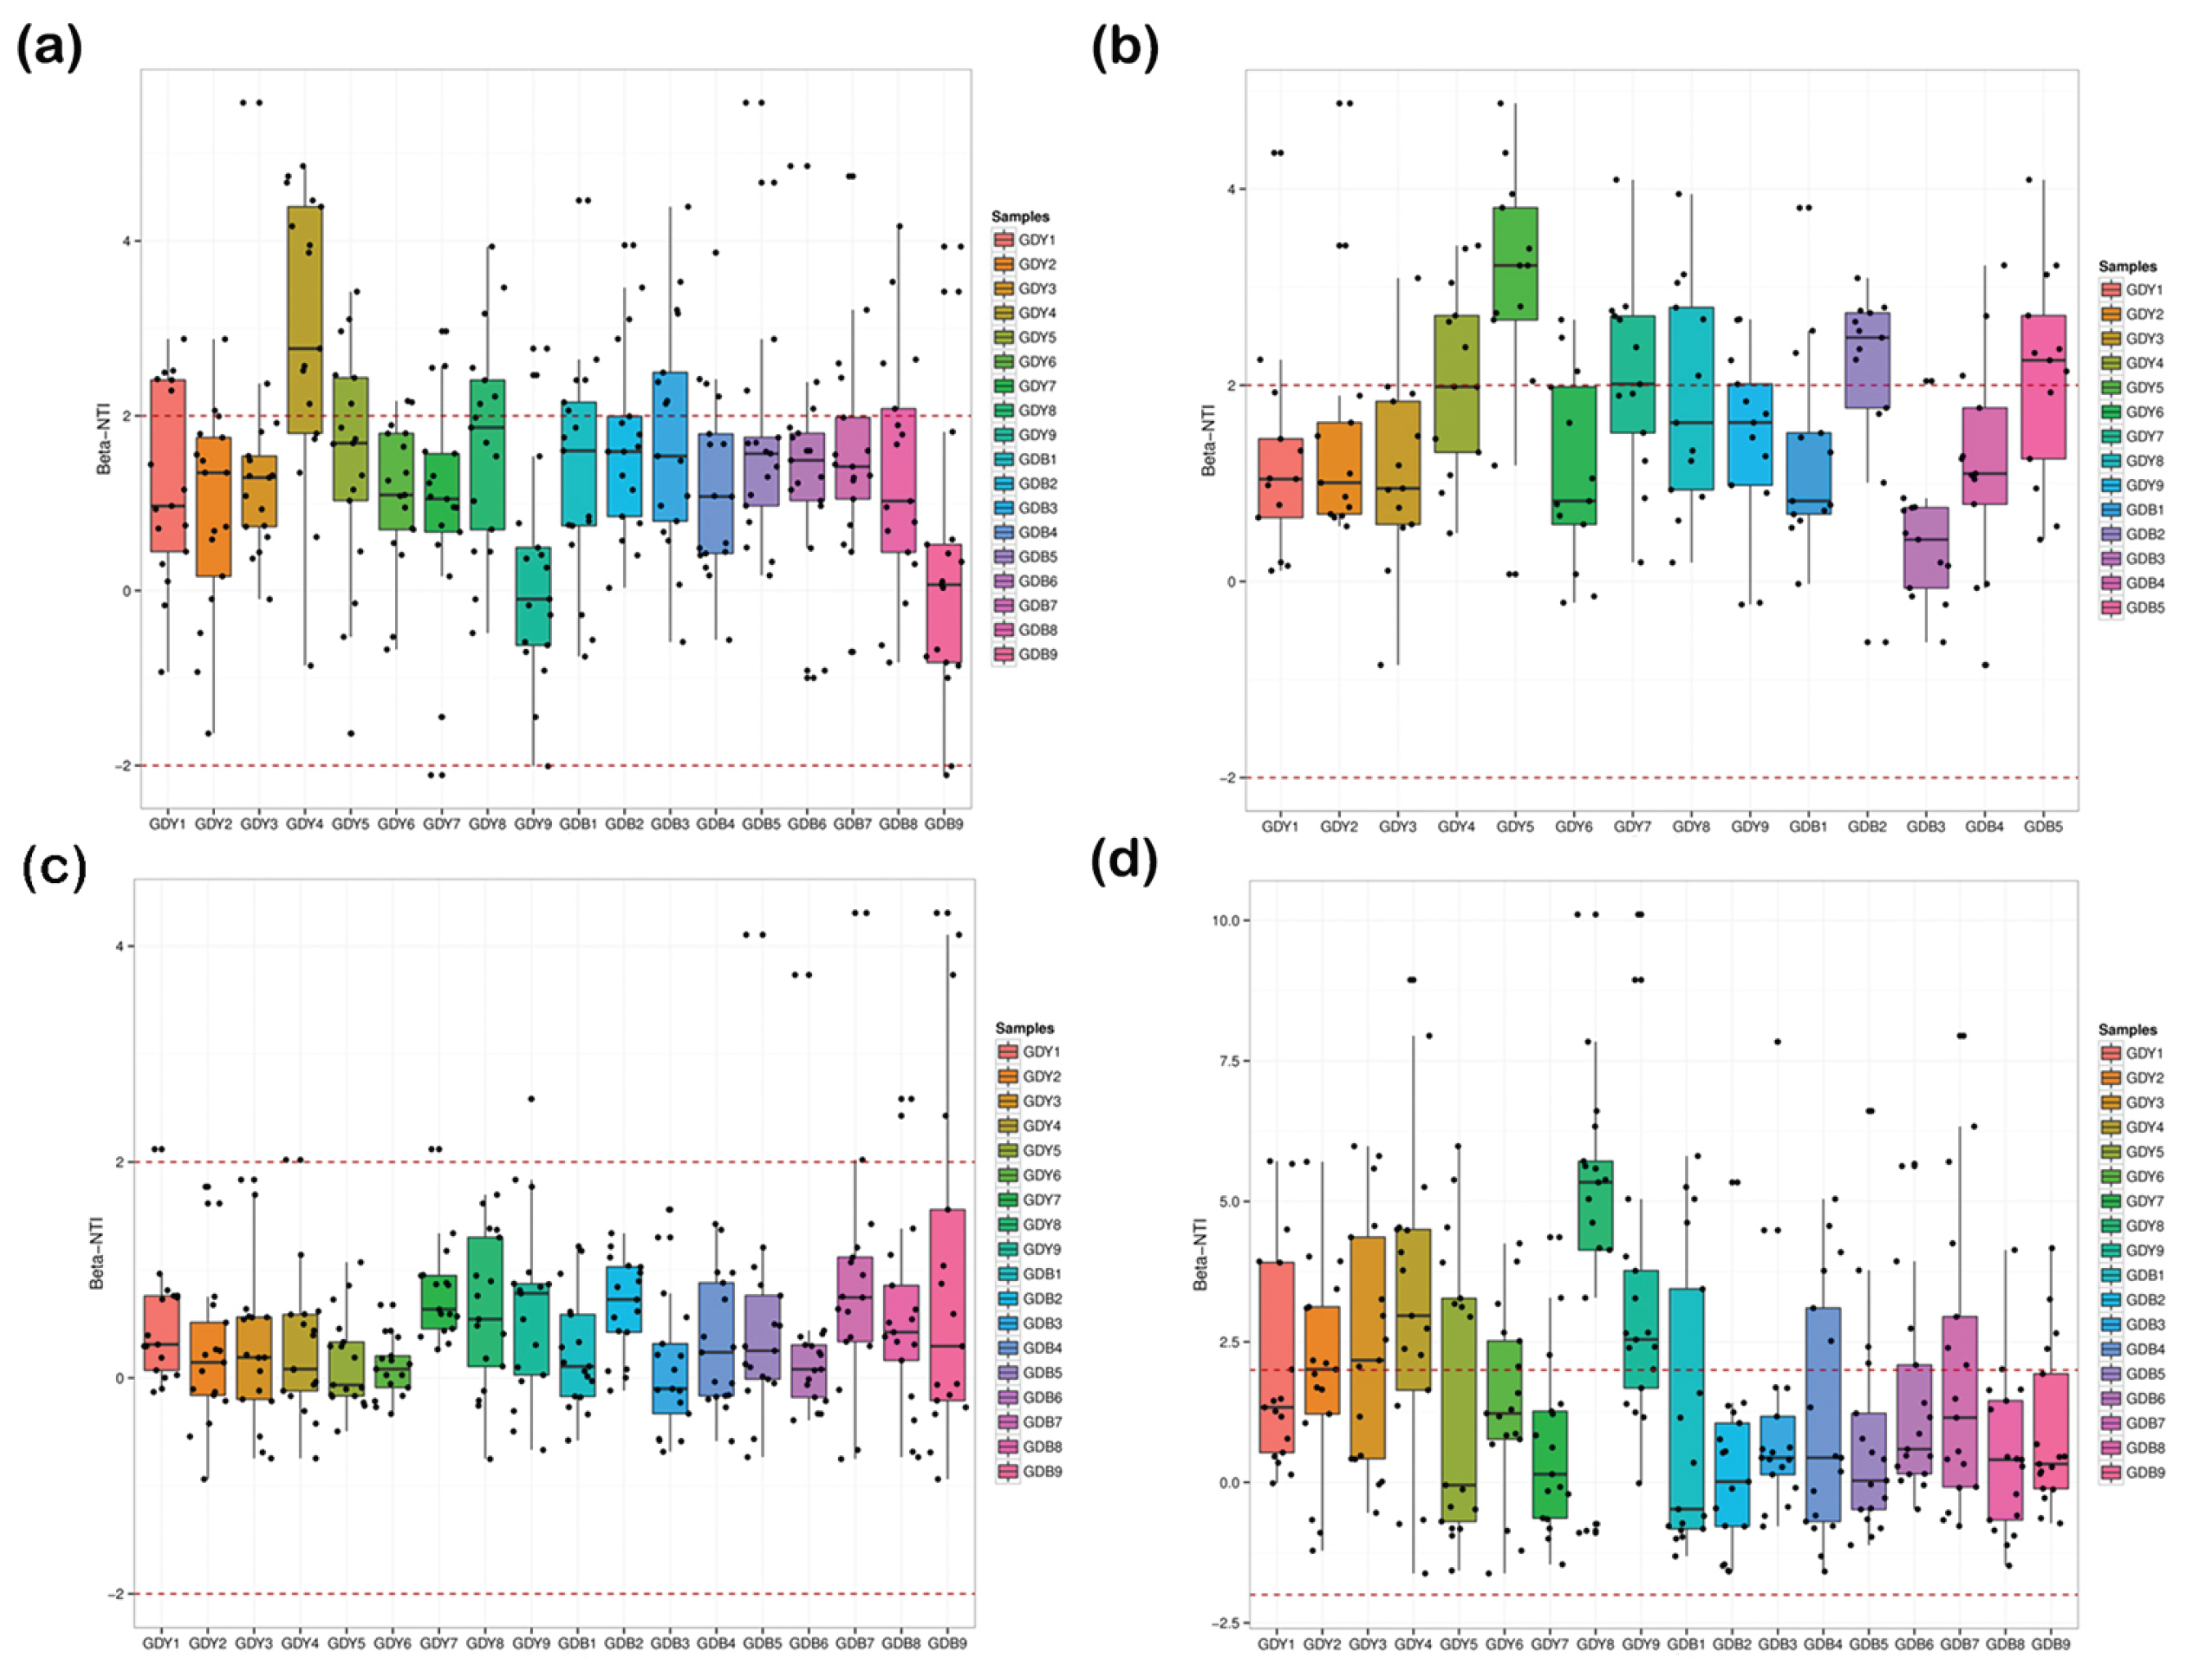
Figure 7.
Redundancy analysis plot of clam intestine bacterial phyla and environmental variables in the benthic-culture area. Sea-IN seawater inorganic nitrogen; Sed-TP, total phosphorus in sediment; Sed-pH, sediment pH; Sea-, seawater phosphate; Sea-COD, seawater COD; Sed-W, sediment water content.
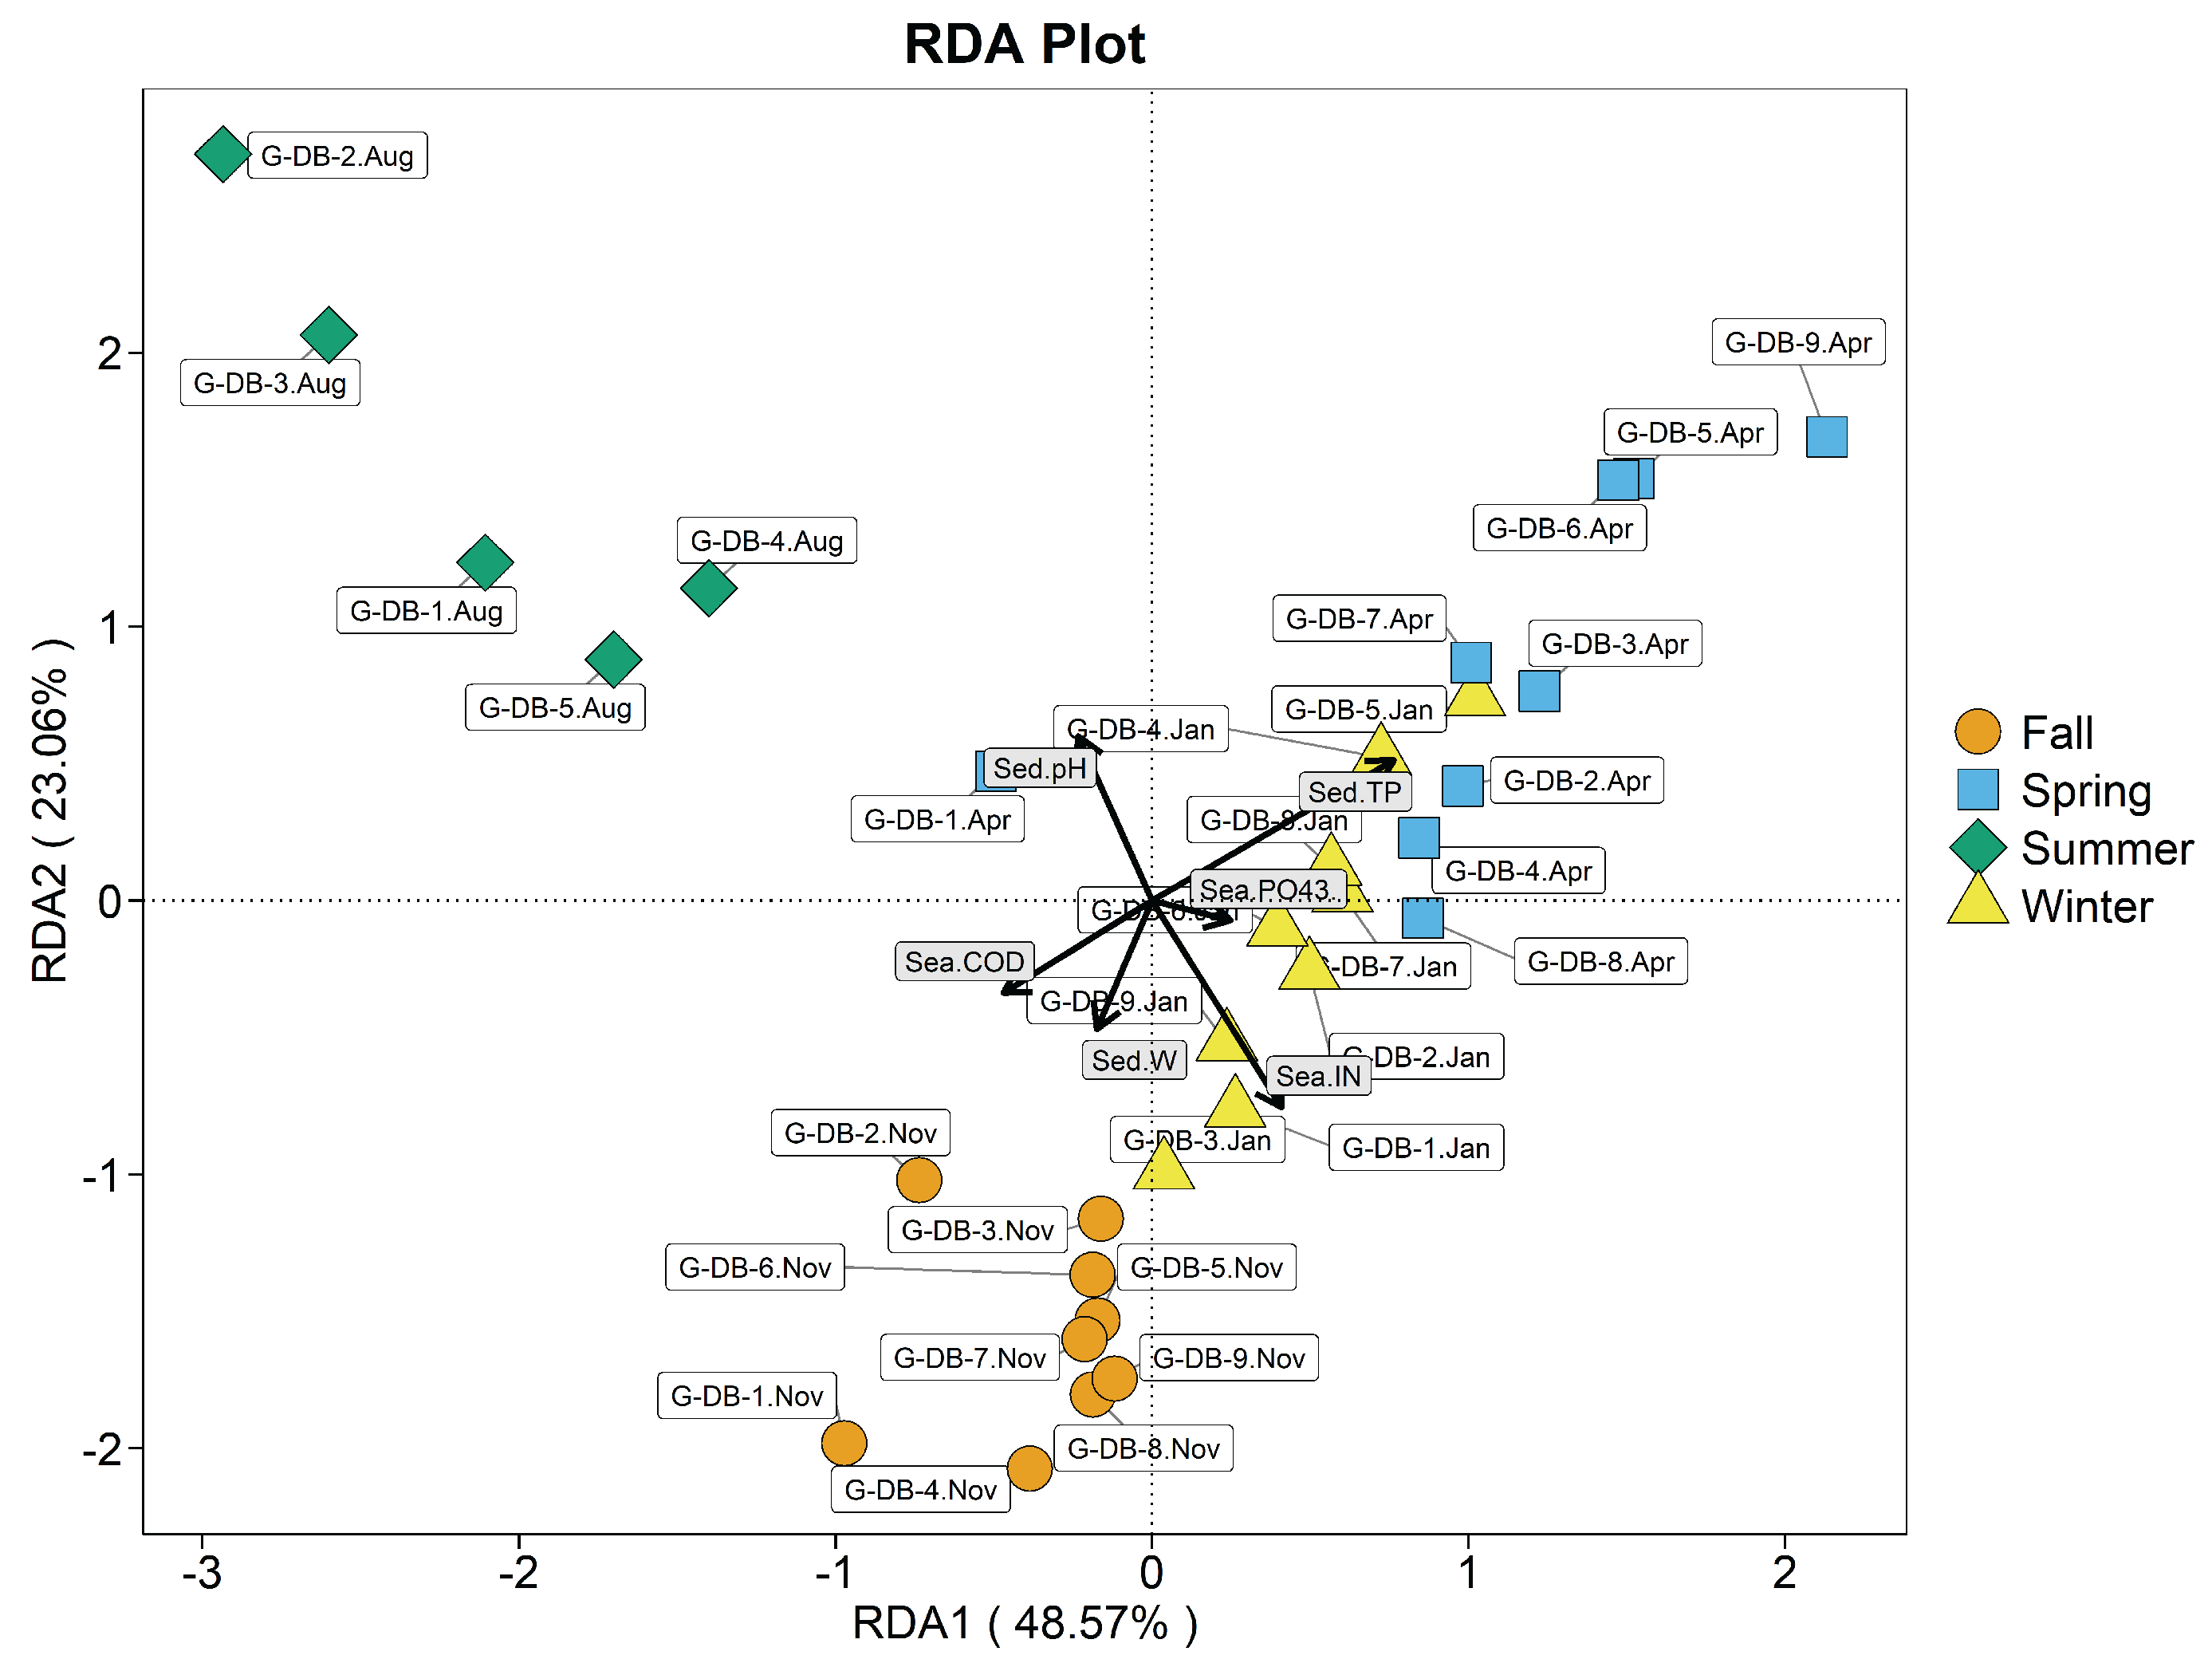
Figure 8.
Redundancy analysis plot of clam intestine bacterial phyla and environmental variables in raft-culture area. Sea-IN, seawater inorganic nitrogen; Sea-, seawater phosphate; Sea-COD, seawater COD.
Figure 8.
Redundancy analysis plot of clam intestine bacterial phyla and environmental variables in raft-culture area. Sea-IN, seawater inorganic nitrogen; Sea-, seawater phosphate; Sea-COD, seawater COD.
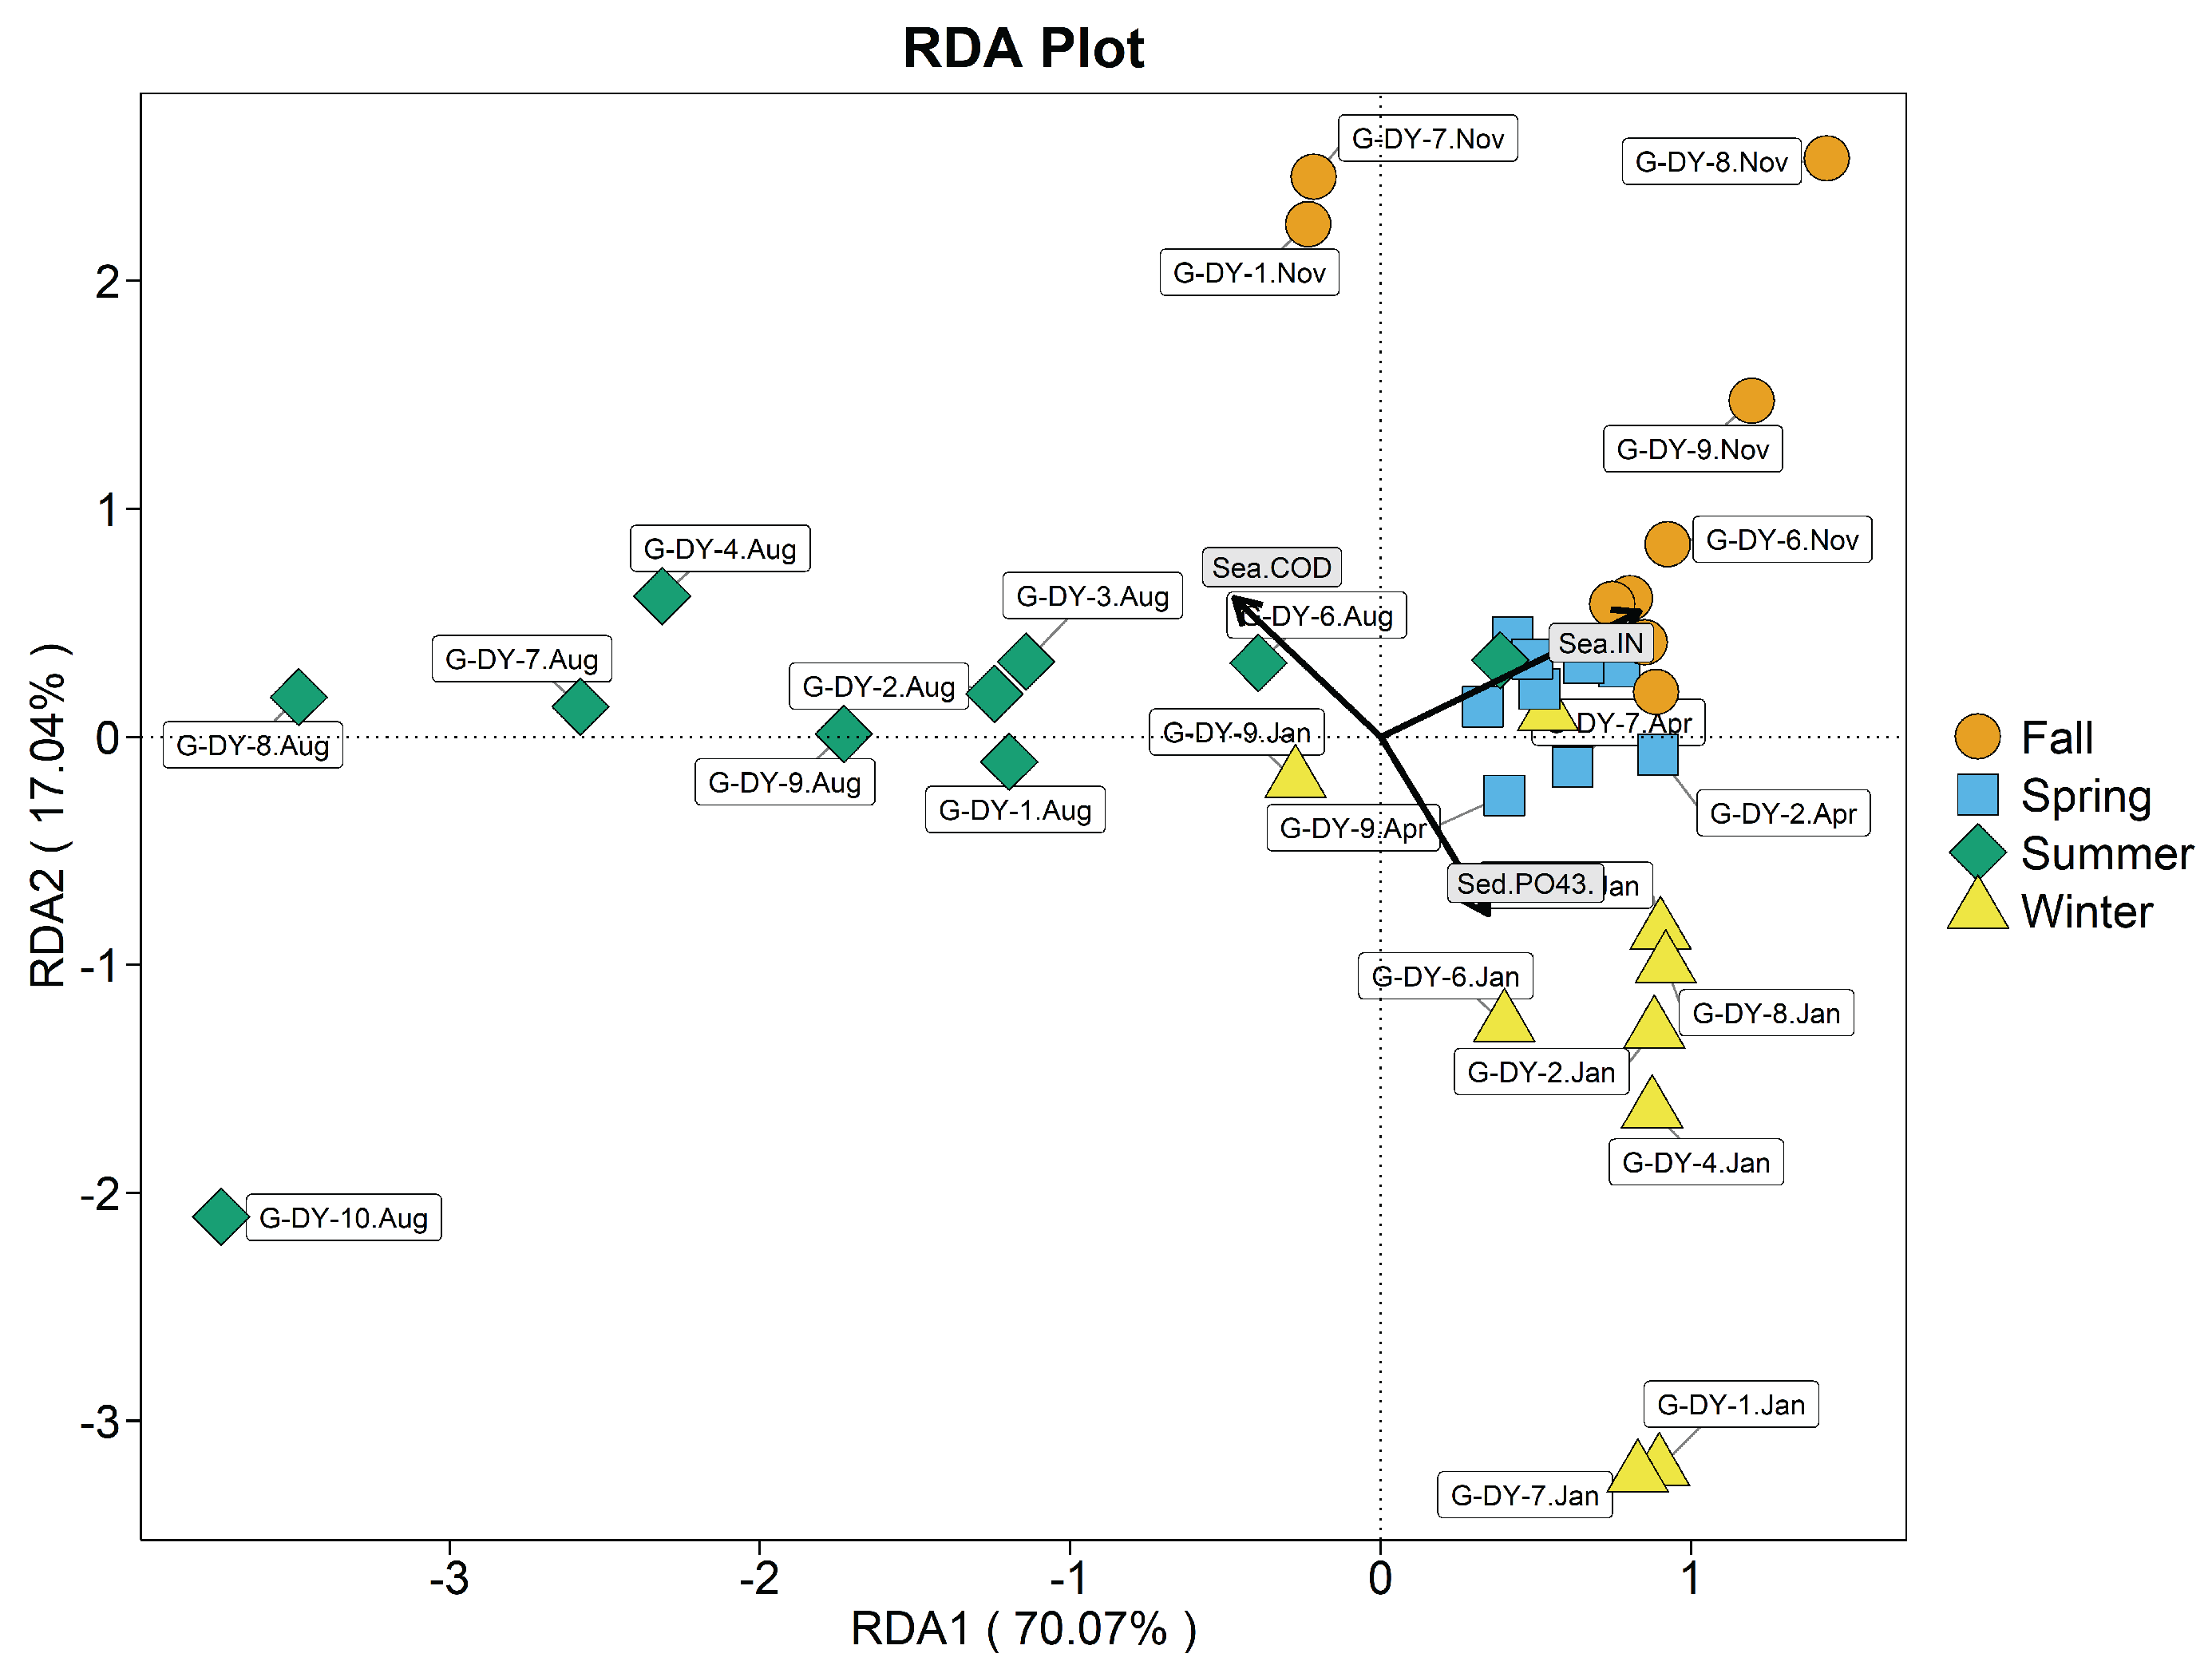
Figure 9.
Redundancy analysis plot of clam gut bacterial phyla and environmental variables in the benthic-culture area. Sea-IN seawater inorganic nitrogen; Sea-, seawater phosphate; Sea-COD seawater COD; Sed TP, total phosphorus in sediment; Sed pH, sediment pH.
Figure 9.
Redundancy analysis plot of clam gut bacterial phyla and environmental variables in the benthic-culture area. Sea-IN seawater inorganic nitrogen; Sea-, seawater phosphate; Sea-COD seawater COD; Sed TP, total phosphorus in sediment; Sed pH, sediment pH.
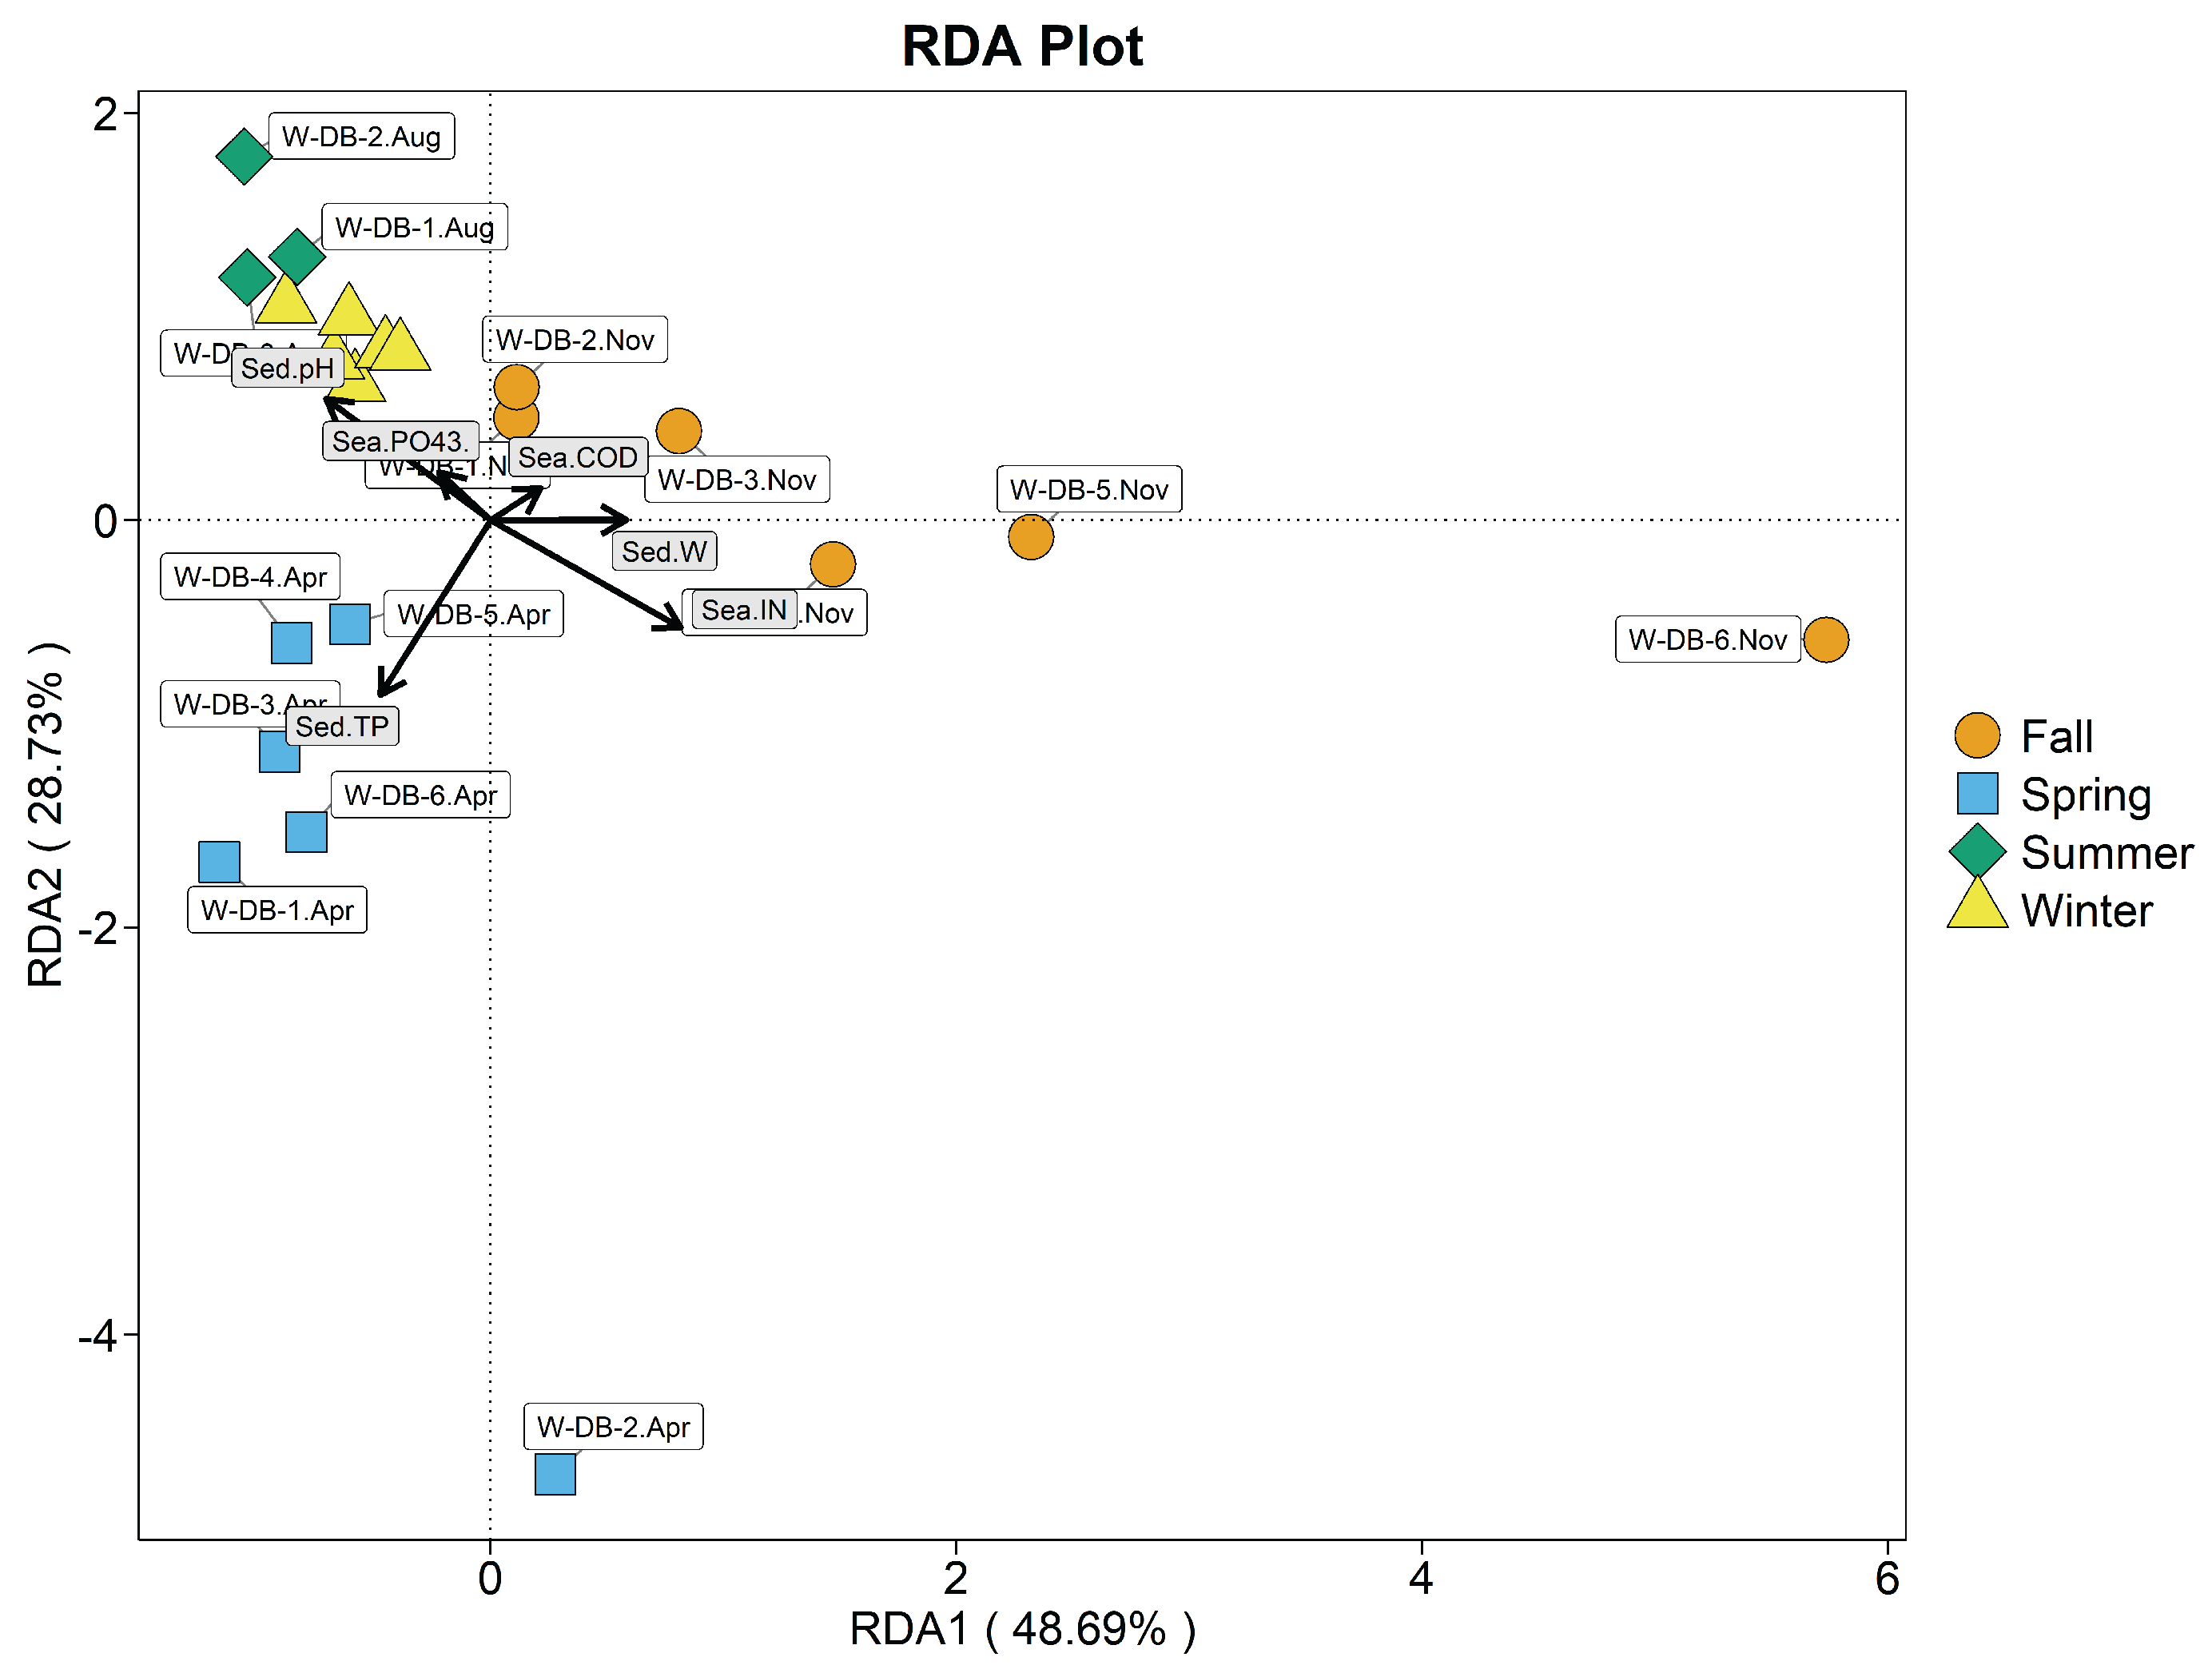
Figure 10.
Redundancy analysis plot of seawater bacterial phyla and environmental variables in the raft-culture area. Sea-IN, seawater inorganic nitrogen; Sea-, seawater phosphate; Sea-COD, seawater COD.
Figure 10.
Redundancy analysis plot of seawater bacterial phyla and environmental variables in the raft-culture area. Sea-IN, seawater inorganic nitrogen; Sea-, seawater phosphate; Sea-COD, seawater COD.
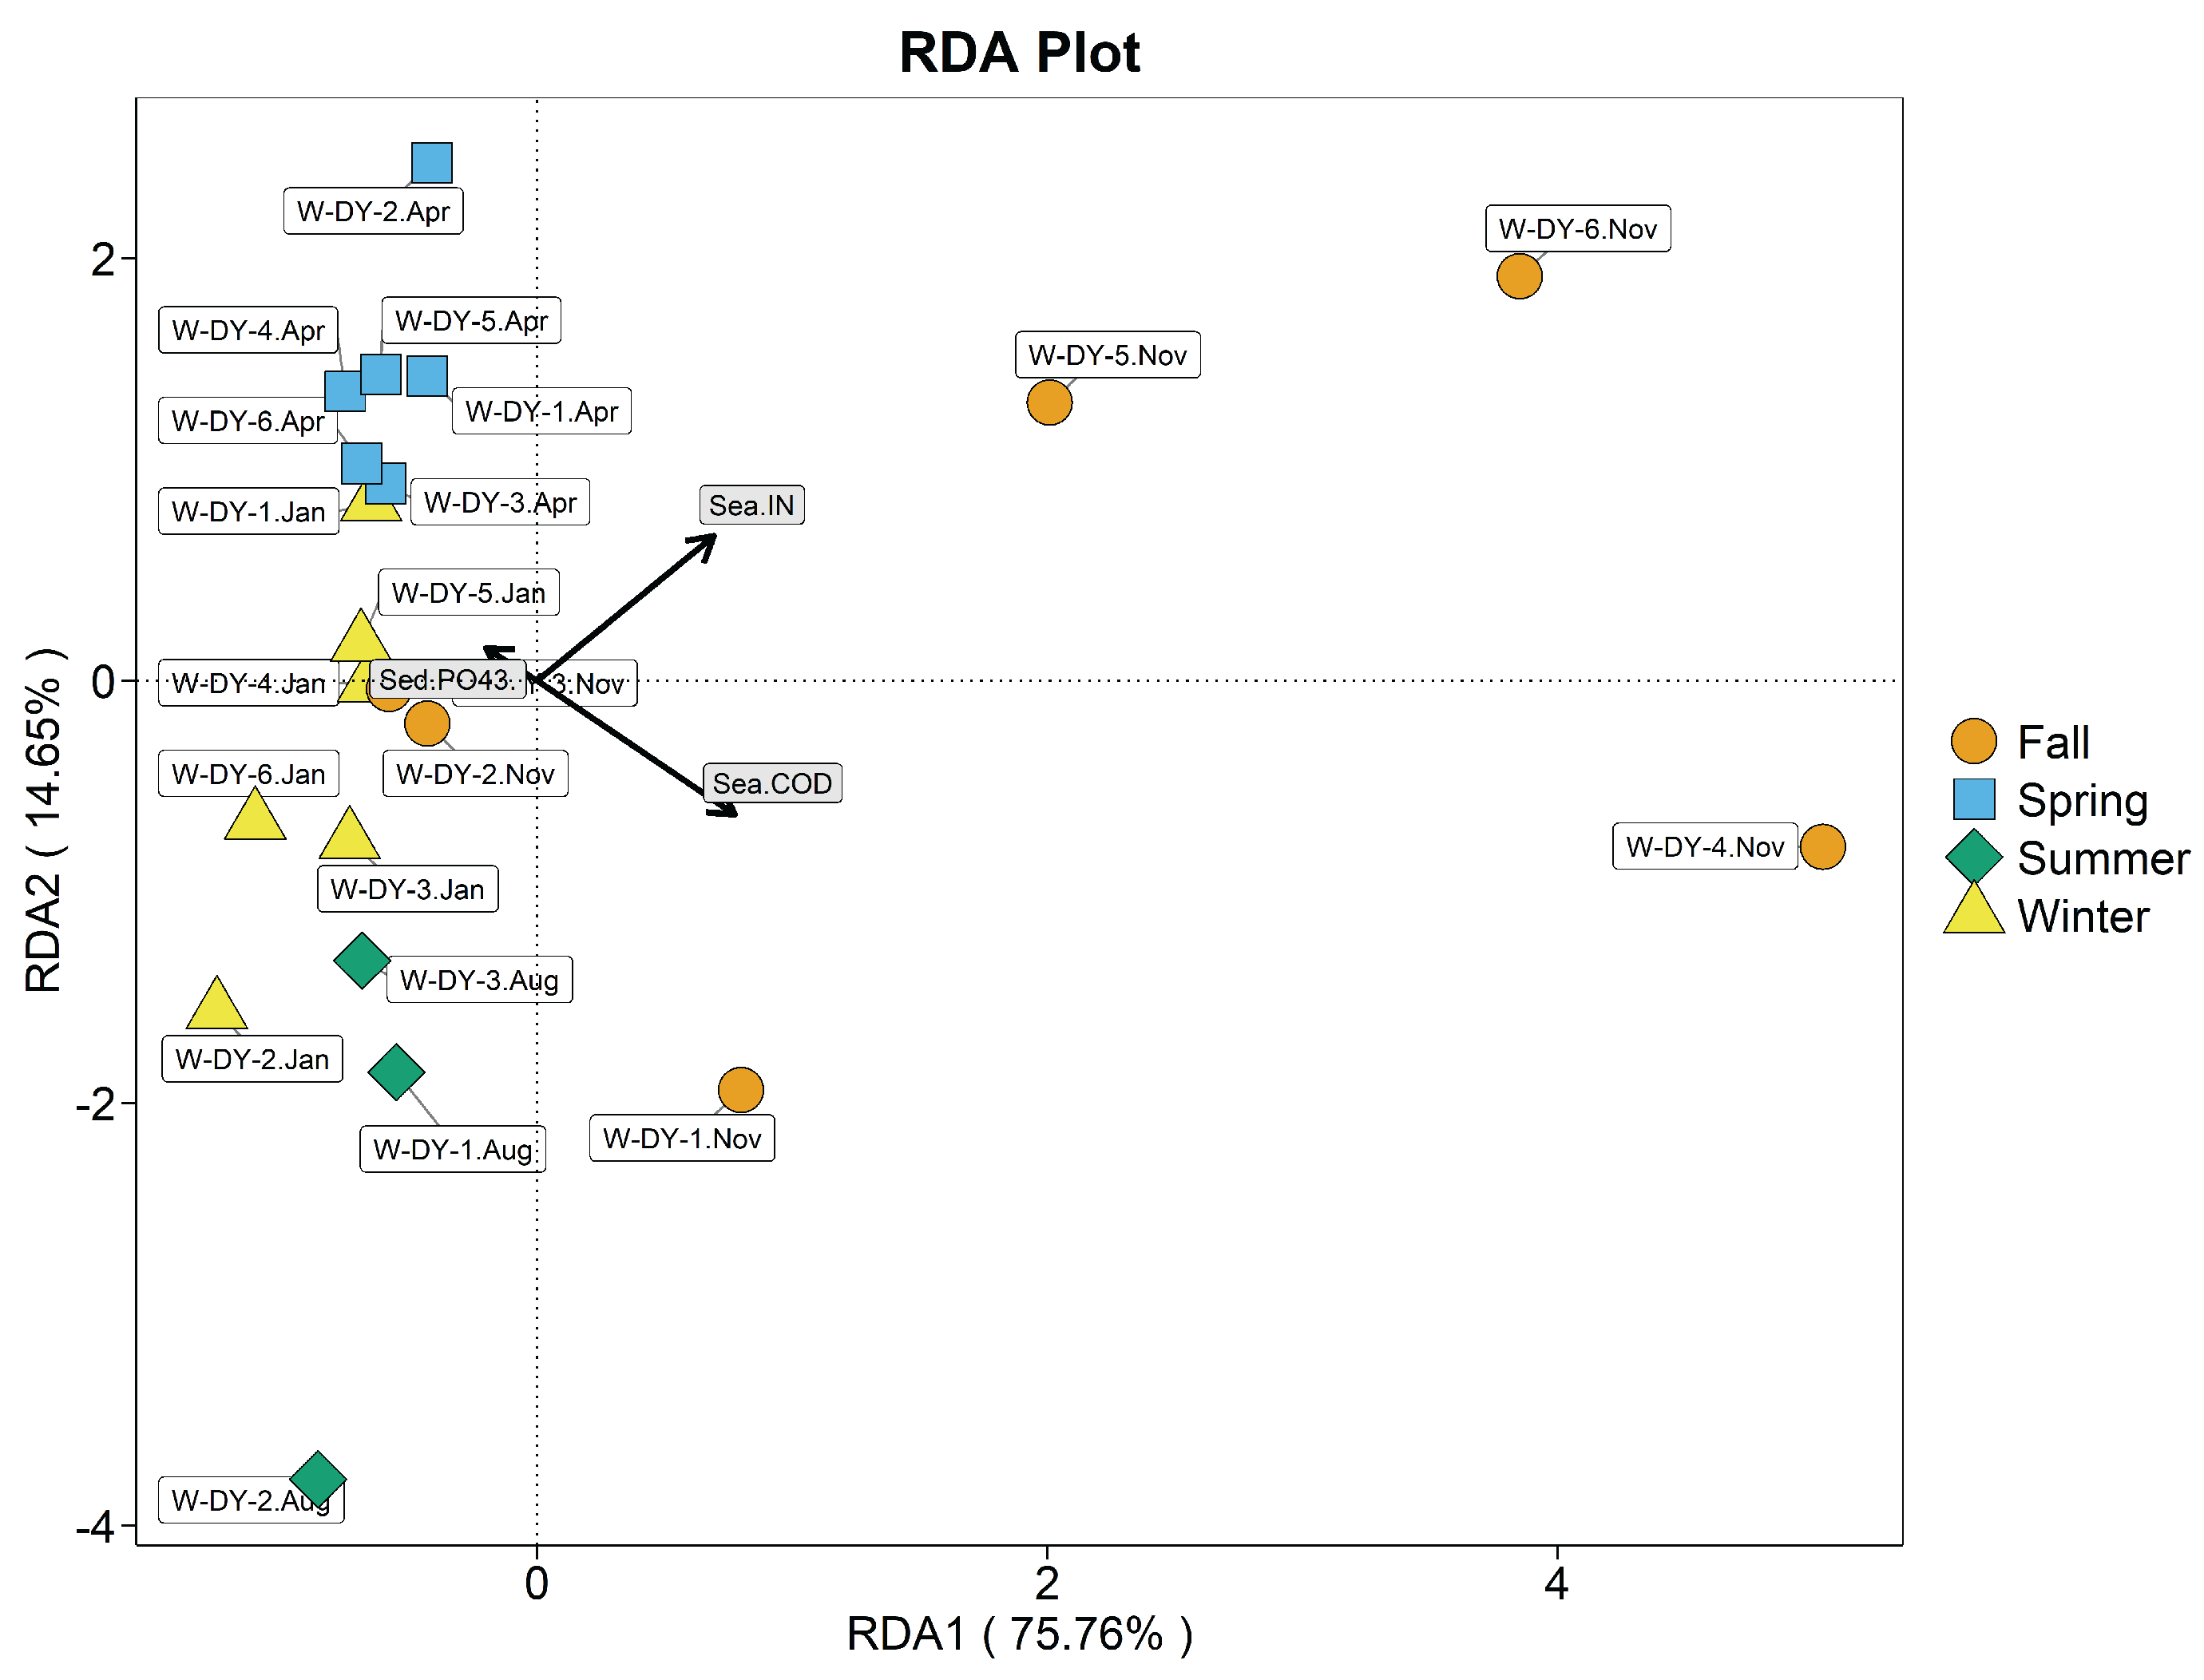
Figure 11.
Redundancy analysis plot of sediment-dwelling bacterial phyla and environmental variables in the benthic -culture area. Sea-IN, seawater inorganic nitrogen; Sed-TP, total phosphorus in sediment; Sed-pH, sediment pH; Sea-, seawater phosphate; Sea-COD, seawater COD; Sed-W, sediment water content.
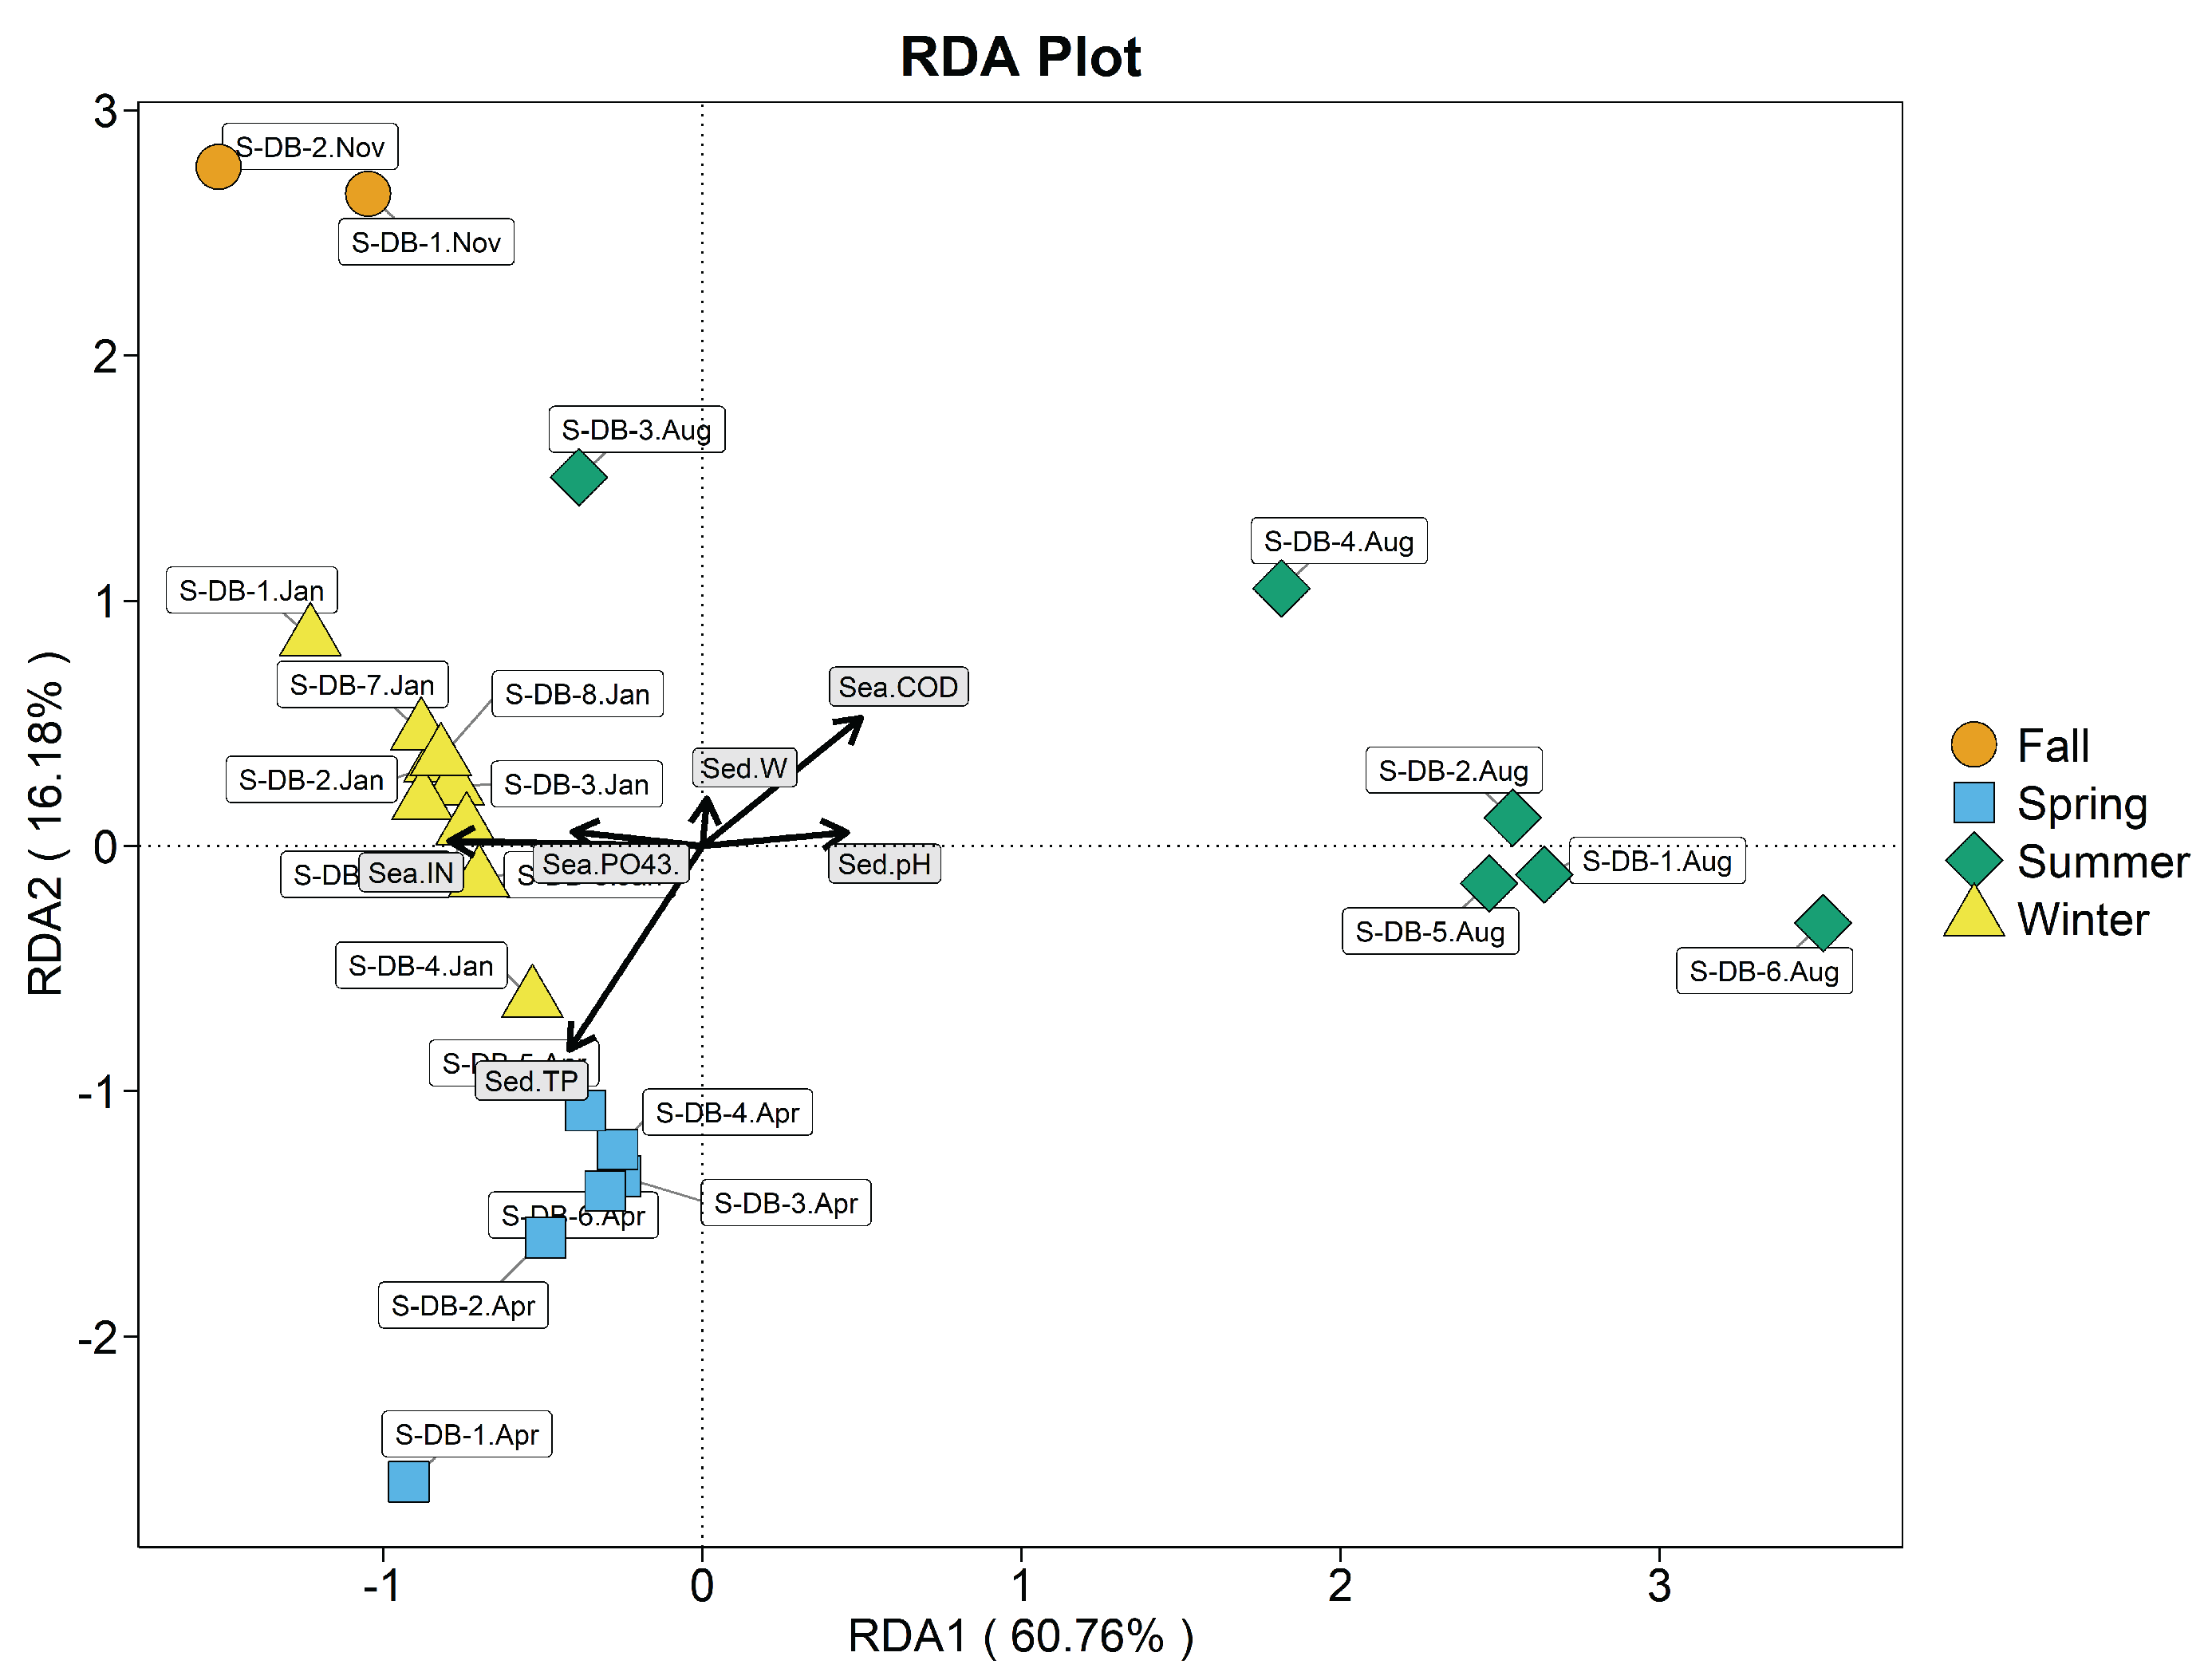

Table 1.
Characteristics of physical and chemical factors of seawater in the breeding area.
| Stations | Index (mg/L) | Spring | Summer | Autumn | Winter |
| IN | 0.159±0.021a | 0.050±0.004a | 0.217±0.025a | 0.102±0.008a | |
| DB | 0.025±0.009a | 0.005±0.003a | 0.217±0.006a | 0.126±0.128a | |
| COD IN |
1.182±0.284a 1.129±0.013a |
2.036±0.091a 0.052±0.003a |
2.214±1.219a 0.318±0.041b |
1.047±0.188a 0.104±0.013a |
|
| DY | 0.023±0.003a | 0.002±0.001a | 0.015±0.005a | 0.012±0.006a | |
| COD | 0.853±0.342a | 1.607±0.351a | 2.209±0.252a | 1.286±0.255a |
1Different lowercase letters in the same industry indicate significant differences in P<0.05 levels between different samples.
Table 2.
Characteristics of physical and chemical factors of sediment in the breeding area.
| Index | Spring | Summer | Autumn | Winter |
|---|---|---|---|---|
| pH | 7.303±0.102 | 7.693±0.124 | 7.120±0.640 | 7.690±0.115 |
| TP (mg/L) | 0.089±0.006 | 0.011±0.003 | 0.012±0.0007 | 0.030±0.0009 |
| W(%) | 30.237±0.949 | 30.241±1.890 | 32.305±1.390 | 30.027±1.932 |
Table 3.
Simpson and Shannon indices of intestinal bacterial communities in clams culture area.
| Stations | Spring | Summer | Autumn | Winter | ||||||||
|---|---|---|---|---|---|---|---|---|---|---|---|---|
| Simpson | Shannon | Coverage | Simpson | Shannon | Coverage | Simpson | Shannon | Coverage | Simpson | Shannon | Coverage | |
| DB | 0.04±0.01a | 4.55±0.36a | 0.99 | 0.03±0.01a | 5.00±0.03a | 0.99 | 0.17±0.13a | 3.66±0.74a | 0.99 | 0.13±0.03a | 3.64±0.29a | 0.99 |
| DY | 0.06±0.02a | 4.02±0.23a | 0.99 | 0.02±0.00a | 4.78±0.70a | 0.99 | 0.11±0.03a | 3.80±0.33a | 0.99 | 0.27±0.02b | 3.08±0.16a | 0.99 |
1Different lowercase letters in the same industry indicate significant differences in P<0.05 levels between different samples.
Table 4.
Simpson and Shannon indices of intestinal bacterial communities in clams culture area.
| Stations | Spring | Summer | Autumn | Winter | ||||
|---|---|---|---|---|---|---|---|---|
| ACE | Chao 1 | ACE | Chao 1 | ACE | Chao 1 | ACE | Chao 1 | |
| DB | 496.70±123.01a | 523.19±119.35a | 1159.52±43.81a | 1042.6±11.01a | 641.90±25.3a | 660.78±14.57a | 686.14±19.63a | 700.22±21.61a |
| DY | 292.83±12.24a | 303.86±10.77a | 1097.87±55.31a | 1035.44±15.79a | 648.12±81.60a | 676.58±70.12a | 683.77±18.33a | 689.32±20.92a |
1Different lowercase letters in the same industry indicate significant differences in P<0.05 levels between different samples.
Disclaimer/Publisher’s Note: The statements, opinions and data contained in all publications are solely those of the individual author(s) and contributor(s) and not of MDPI and/or the editor(s). MDPI and/or the editor(s) disclaim responsibility for any injury to people or property resulting from any ideas, methods, instructions or products referred to in the content. |
© 2024 by the authors. Licensee MDPI, Basel, Switzerland. This article is an open access article distributed under the terms and conditions of the Creative Commons Attribution (CC BY) license (http://creativecommons.org/licenses/by/4.0/).
Copyright: This open access article is published under a Creative Commons CC BY 4.0 license, which permit the free download, distribution, and reuse, provided that the author and preprint are cited in any reuse.


