Submitted:
02 May 2024
Posted:
02 May 2024
You are already at the latest version
Abstract
Marine industries are dependent on the ocean and often have a direct impact on the marine environment. Although previous studies have talked about pollution from marine industries, it is not known to what extent and to what extent these behaviors affect the ocean. Therefore, this study examines the impacts of major marine industries on the marine environment, using China as an example. The Ministry of Ecology and Environment of the People's Republic of China categorizes the quality of seawater into Class I, Class II, Class III, Class IV, and Inferior Class IV in descending order according to the quality from good to poor. In this study, water quality of Class I and Class II are defined as good quality seawater, Class III as average quality, Class IV and Class IV as poor quality, and the proportion of the area of seawater with different water quality to the total area of the sea area symbolizes the overall quality of the marine environment. We use panel data from 11 provinces and cities along the coast of mainland China from 2006 to 2020, estimated by the full feasible generalized least squares (FGLS) method, to study the impacts of the development of coastal tourism, marine transportation, marine shipbuilding, marine salt, mariculture, and marine fishing on the marine environment. The empirical results show that, in descending order of the degree of influence, the marine industries that cause a decrease in the area of good quality seawater are coastal tourism, mariculture and shipbuilding, and the marine industries that cause an increase in the area of poor quality seawater are marine transportation and shipbuilding, while the marine salt industry has no obvious influence on the marine environment, and the development of the marine fishing industry indirectly contributes to the improvement of the marine environment.
Keywords:
marine industry
; marine environment
; human activities
; pollution
; China
1. Introduction
The oceans are a great treasure trove that not only provides us humans with ecological, economic and social values (Costanza, 1999) It provides habitat for many other species, and it can be said that all life on earth depends directly or indirectly on the oceans. With population growth and social development, resources are becoming increasingly scarce and our dependence on the oceans is growing (Costello et al., 20). (Costello et al., 2020; Jouffray, Blasiak, Norstrom, Osterblom, & Nystrom, 2020; Spillias et al., 2023). . However, while humans have exploited marine resources, they have also caused a series of negative impacts on the marine environment (O'Hara & Halpern, 2022) Among these problems, the marine environment has been recognized as a major source of pollution. Among these marine environmental problems, marine pollution is the most talked about issue (Riechers et al., 2022). (Riechers et al., 2021). Marine pollution is defined as the direct or indirect impact of human activities on the marine environment. Marine pollution is the direct or indirect introduction of substances or energy into the marine environment, including estuaries, by humans, which causes or may cause harmful effects such as damage to living resources and marine life, hazards to human health, impediments to marine activities including fishing and other lawful uses of the sea, impaired quality of seawater use, and reduction of facilities (Shi, 2016) . Marine pollution not only affects the normal growth of numerous marine organisms (Duarte et al., 2020). (Brown et al., 2018) , it also erodes human health (Landrigan et al., 2020) and impedes economic and social development (Ofiara & Seneca, 2006) .
There are three main pathways for pollutants to enter the oceans (categorized according to the pathways by which pollutants enter the oceans), the first is the input of pollutants from land-based sources (Sarikaya, Sevimli, & Citil, 1999). The first is the input of pollutants from land-based sources (Sarikaya, Sevimli, & Citil, 1999), which mainly includes carry-over of pollutants from rivers to the sea, outfalls that discharge sewage directly into the sea (Zhou et al. (Zhou et al., 2021) and dumping into dumping areas (Yi et al., 2023). (Yi et al., 2023). This pathway is the main source of marine pollutants (Chitrakar, Baawain, Sana, & Al-Mamun, 2019) . Secondly, there are some human activities at sea as well as along the coast, mainly including marine industries such as marine fisheries, marine transportation and coastal tourism (Morales-Caselles et al., 2021) The third is the deposition of atmospheric pollutants. The third is the deposition of atmospheric pollutants, i.e., airborne pollutants either dissolve directly into seawater or follow precipitation into the ocean (von Glasow et al., 2021). (von Glasow et al., 2013). The Previous studies, while describing what marine pollutants are are found in the ocean (Clunie & Hendricks, 1995) (Auta, Emenike, & Fauziah, 2017) (Le Moal et al., 2019) , also indicates which human activities have contributed to the pollution of the oceans (Chitrakar et al., 2019; Wang et al., 2017) However, the exact scope and form of impacts of these human activities are unknown. This is not conducive for the government to formulate practical policies. Both land-based pollutant inputs and atmospheric pollutant deposition mix pollutants from multiple sources, which are difficult to trace back, and the key to pollution management of these two pathways lies on land rather than in the ocean. Most of the production activities of marine industries are located in the sea or near the shore, and all of them directly or indirectly utilize marine resources and often directly affect the marine environment, so this study aims to find out the impacts of major marine industries on marine pollution.
Marine Industry1 Driving the Economic Development of Coastal Areas (Liu & Cao, 2018; Wang & Wang, 2019) It also provides numerous employment opportunities for coastal residents, and has an extremely important role in the development of the national economy, however, the impact of the marine industry on the marine environment cannot be ignored. Therefore, this study takes China as an example to investigate the impacts of major marine industries on the marine environment, and provides some practical policy recommendations, as well as a reference for researchers and policy makers in other regions of the world.
2. China's Marine Environment and Marine Industry
2.1. China's Marine Environment
China's jurisdictional ocean covers an area of about 4.727 million square kilometers, divided into four zones: the Bohai Sea, the Yellow Sea, the East China Sea, and the South China Sea, with a total of 14 coastal provinces, municipalities, and special administrative regions fronting on the sea.2 . Each area of China's oceans faces different levels of pollution, with the main pollutants being nutrient salts (Wang, Xin, Wei, & Xie, 2018) , heavy metals (Liu et al., 2020) (Liu et al., 2020), microplastics (Zhang et al., 2019) and petroleum-based (Li & Duan, 2015) etc. The Water Quality Standard for Seawater (GB 3097-1997 ) issued by the Ministry of Ecology and Environment of the People's Republic of China categorizes seawater quality from good to poor according to the amount of pollutants in seawater, such as total nitrogen, total phosphorus, heavy metals, PH value, and marine debris, into Class I seawater, Class II seawater, Class III seawater, Class IV seawater, and Inferior Class IV seawater3 . In this study, Class I and Class II seawater are defined as good quality seawater, Class III seawater is defined as general quality seawater, and Class IV and Poor IV seawater are defined as poor quality seawater. The ratio of the area of seawater of different qualities to the total area of the sea area symbolizes the quality of the marine environment, and the higher the ratio of the area of good-quality seawater to the area of poor-quality seawater, the smaller the ratio of the area of poor-quality seawater to the area of poor-quality seawater, the better the quality of the overall marine environment. As shown in Figure 1(The values in the legend refer to the area of excellent quality seawater as a percentage of the total area of the sea.), the quality of seawater in different sea areas of China varies greatly, so figuring out the specific causes of marine pollution will help us to effectively manage the marine environment.
2.2. China's Marine Industry
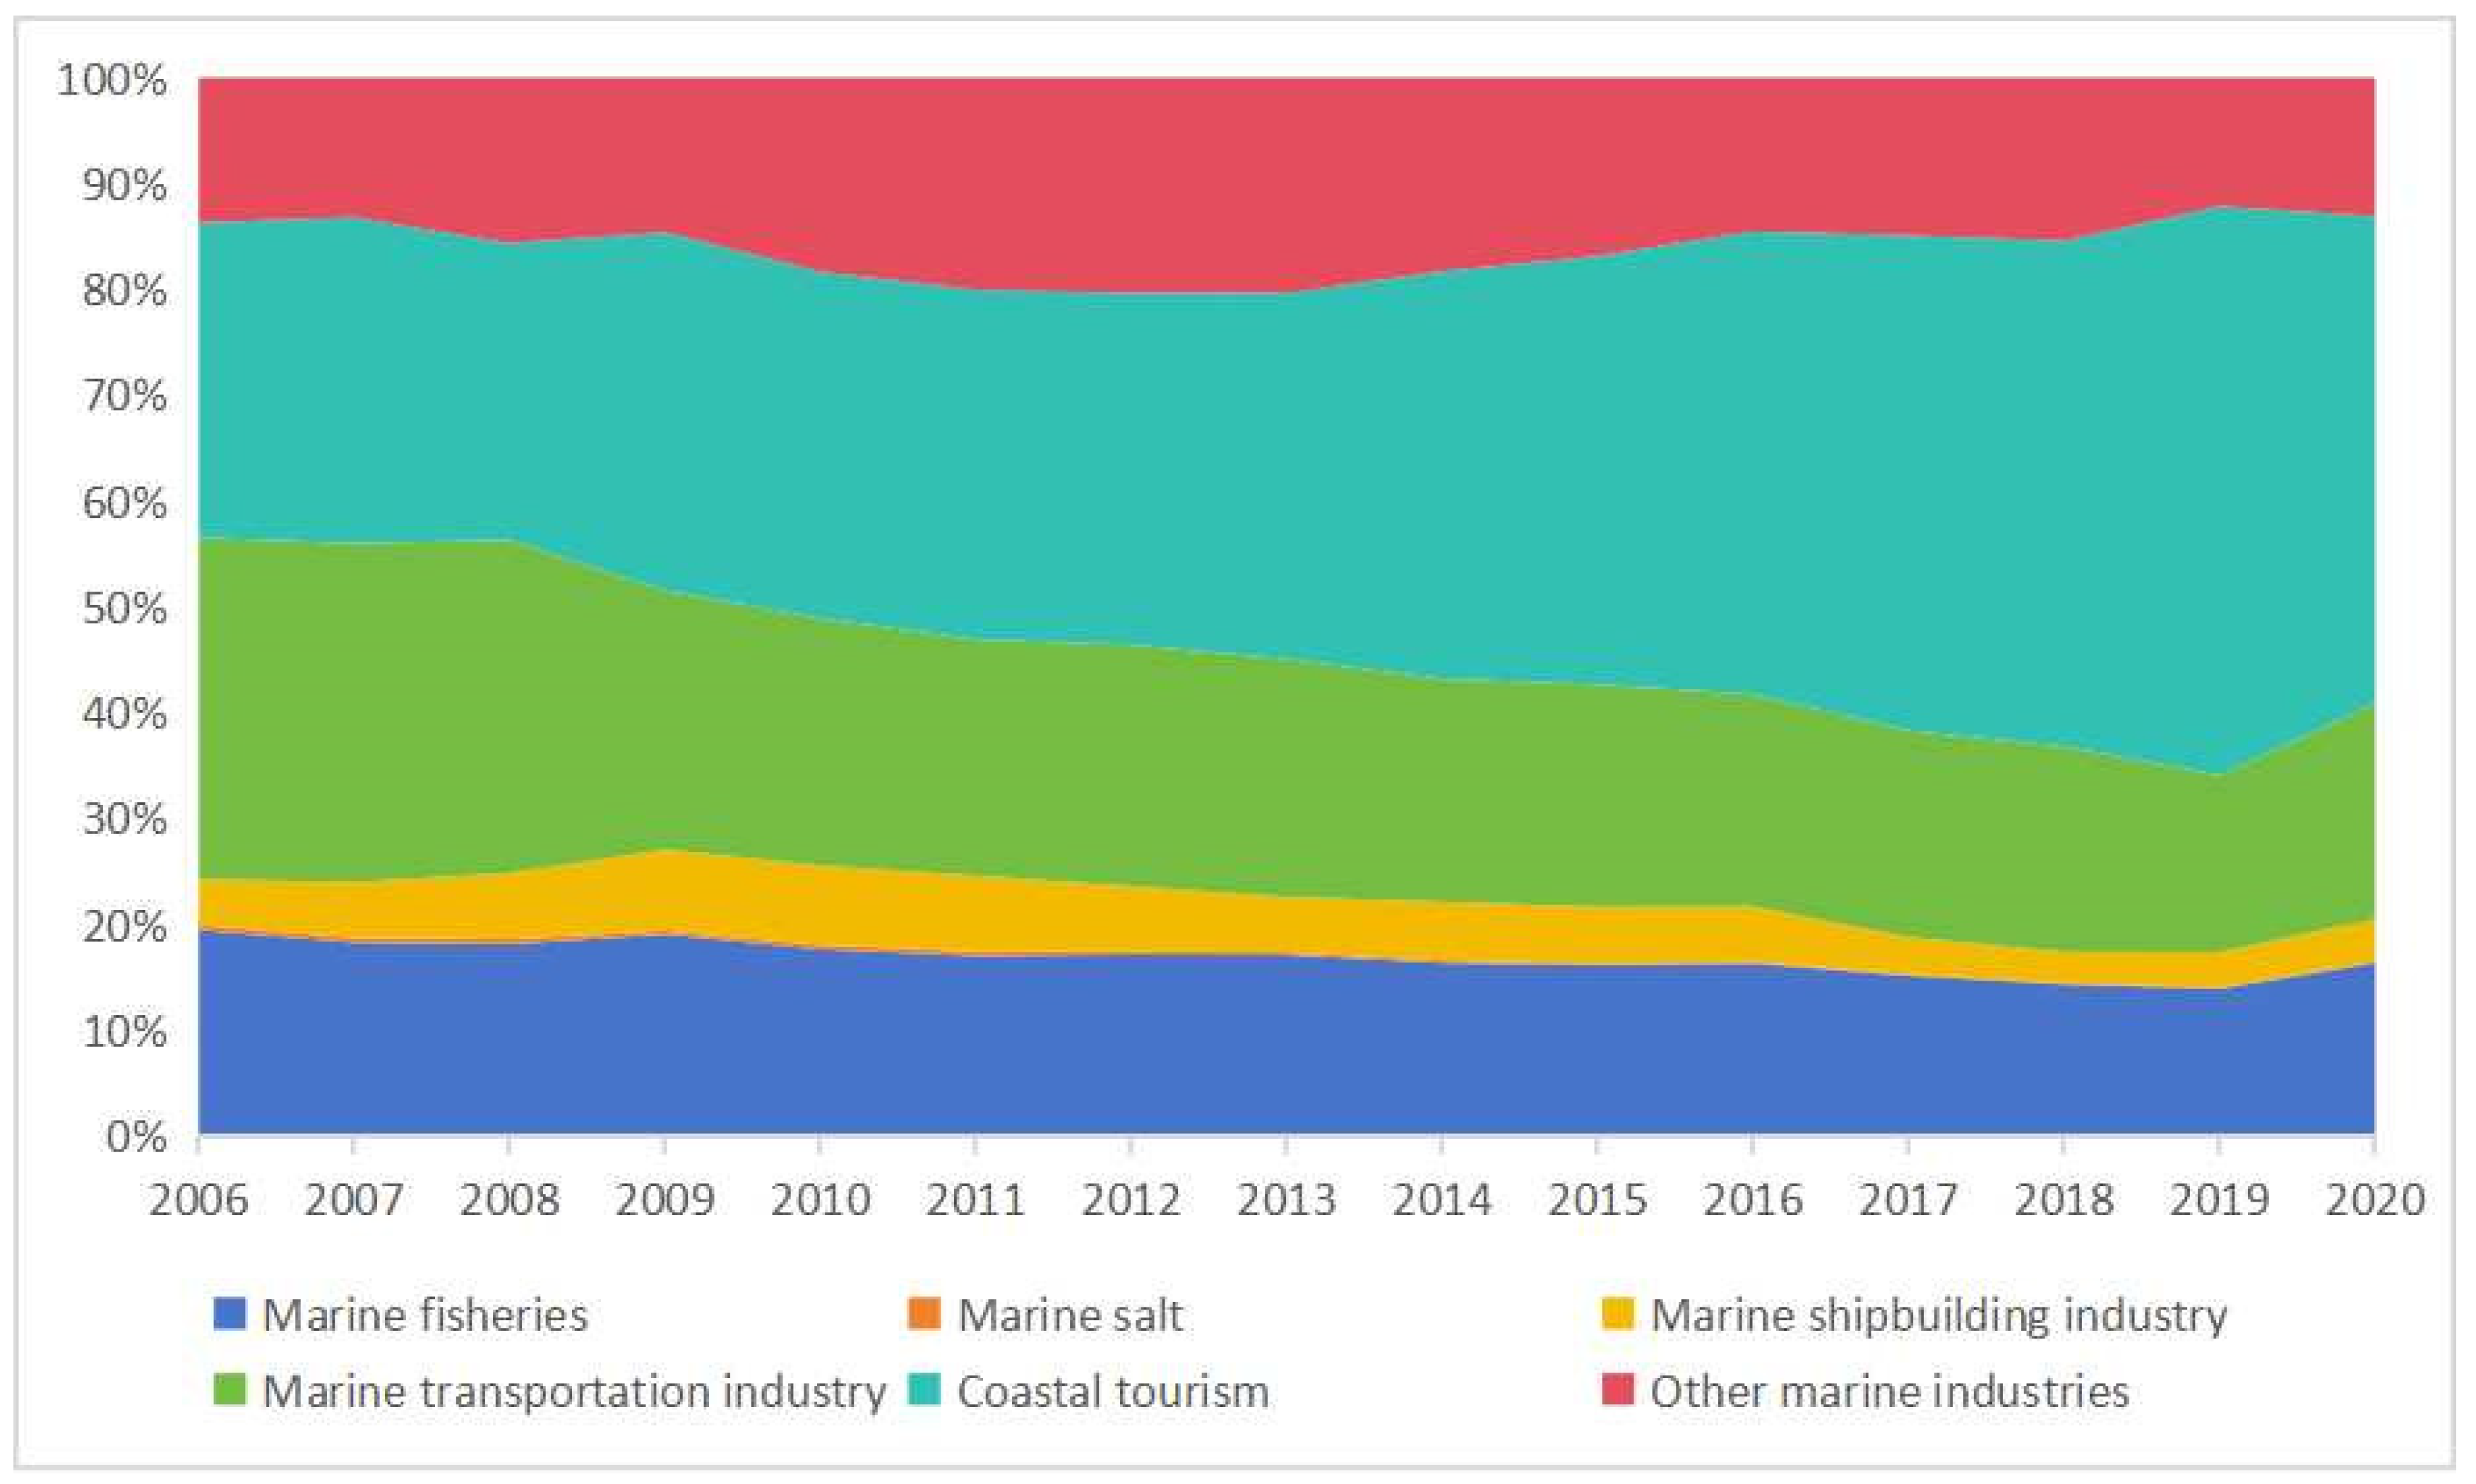
The Classification of Marine and Related Industries (GB/T 20794-2006) of the People's Republic of China defines the marine industry as the production and service activities for the development, utilization and protection of the ocean, including marine fishery, coastal mudflat plantation, marine aquatic products processing industry, marine oil and gas industry, marine mining, marine salt industry, marine shipbuilding, marine engineering equipment manufacturing, marine chemical industry, marine drugs and biological products industry, marine engineering construction industry, marine power industry, seawater desalination and comprehensive utilization industry, marine transportation industry, marine tourism, which are the 15 major categories. manufacturing, marine chemical industry, marine drugs and biological products, marine engineering and construction, marine power industry, seawater desalination and comprehensive utilization, marine transportation and marine tourism. There are many marine industries in China, but some of them, although utilizing marine resources, do not directly affect the marine environment, such as marine aquatic products processing industry, marine chemical industry, and marine drugs and biological products industry, etc.; there is also a part of the marine industry that lacks serious data or whose activities are difficult to be quantified, such as coastal mudflat planting industry, marine engineering equipment manufacturing industry, and marine engineering construction industry, etc.; and there is also a part of the marine industry that impacts on the marine environment, such as marine power industry, seawater desalination and comprehensive utilization industry, marine transportation industry, and marine tourism industry. Some marine industries have a small impact on the marine environment, and their inclusion would make our study redundant and not conducive to streamlined and clear results, such as the marine power industry and the desalination and comprehensive utilization of seawater industry. Therefore, in the end, we selected seven major marine industries, namely marine fisheries4 , marine oil and gas industry, marine mining industry, marine salt industry, marine ship industry, marine transportation industry and marine tourism , to be the objects of our study. The value-added of these industries accounted for a relatively high proportion of the total value-added of China's marine industries in the past years, with the highest year reaching 88% and the lowest year accounting for 80%, so they are well represented.
Figure 2.
Value added of selected marine industries as a percentage of total value added of marine industries.
Figure 2.
Value added of selected marine industries as a percentage of total value added of marine industries.
3. Materials and Methods
3.1. Data Sources and Sample Selection
The data are mainly obtained from China Marine Ecological and Environmental Situation Bulletin, China Marine Economy Statistical Yearbook, China Fishery Statistical Yearbook, China Shipbuilding Industry Statistical Yearbook and other yearbooks, as well as websites of China Statistics Bureau, China Government Website, Ministry of Agriculture and Rural Development of the People's Republic of China, Ministry of Ecology and Environment of the People's Republic of China, and China Marine Information Network, etc. Some of the missing or abnormal data are supplemented or replaced by the Statistical Yearbook of each province and city. Statistical Yearbook of each province and city to make up or replace the missing or abnormal data.5
For reasons such as ensuring the completeness of the data, we chose to study 11 coastal provinces and municipalities in mainland China, spanning the period from 2006 to 2020, and China in this study refers to mainland China (i.e., excluding Hong Kong, the Macao Special Administrative Region, and Taiwan Province).
3.2. Variable Selection and Description
Due to the large number of variables selected for this study and the complexity of the situation, the variables are described in detail in this section.
3.2.1. Explained Variables
The explanatory variables in this study are seawater quality, we firstly selected the ratio of the area of good quality seawater to the total area of near-shore sea area as an indicator of seawater quality, the decrease of this indicator means that good quality seawater may be transformed into general water quality or bad quality seawater, we can not know which water quality seawater it has changed into, but this indicator reflects the change of the area of good water quality seawater. In addition, we also selected the proportion of the area of non-poor water quality seawater in the total area of the sea as an indicator of seawater quality, which shows the change of the area of poor water quality seawater.
Larger values of these two indicators mean better quality of the marine environment, and in the next study, we will use these two indicators to perform regression analysis separately.
3.2.2. Explanatory Variables
As detailed in the previous section, we have selected seven major marine industries, namely, marine fisheries, marine oil and gas, marine mining, marine salt, marine shipbuilding industry, marine transportation and marine tourism, and we use the intensity of industrial activity as an indicator for each marine industry. The data of marine oil and gas industry and marine mining industry are seriously missing, so we use dummy variables to represent these two industries and use them as control variables. In addition, we also selected rivers entering the sea, direct sea pollution sources, air pollutant deposition and pollution control efforts as control variables, and the details of all variables are shown in Table 1.
We can assume that when all other conditions are equal, the larger the size of an industry, the greater its impact on the environment. Therefore, we have selected production capacity, labor force quantity or productivity as indicators of industry scale according to the characteristics of different industries and the availability of data. For direct sea pollution sources and atmospheric pollutant deposition, we selected the corresponding pollutant emissions as the indicators, and for rivers entering the sea, we selected the water quality condition as the indicator6 , and we selected the ratio of the completed investment in industrial pollution control to the industrial output value of the year as the indicator of industrial pollution control. The details of all variables are shown in Table 1.
Therefore, we did not use the economic data commonly used in previous studies as indicators, but used capacity data, which not only circumvents the vertical bias in the time dimension caused by inflation and other factors, but also avoids the horizontal bias in the spatial dimension caused by the differences in the level of economic development of different regions. We refer to the study of () and choose mariculture, marine fishing, marine salt industry, coastal tourism, marine ship industry and marine transportation industry as explanatory variables. Details of all variables are shown in Table 1.

Table 1.
List of variable definitions.
| variable symbol | Variable Meaning | Variable indicators | unit (of measure) | |
| explanatory variable | Y1 | Sea water quality | Proportion of good seawater area to total sea area | % |
| Y2 | Sea water quality | Proportion of sea area with good and fair water quality to total sea area | % | |
| explanatory variable | tra | Marine transportation | Volume of marine cargo transportation | tons |
| shi | Marine Shipbuilding Industry | Shipbuilding completions | dead weight ton | |
| tou | Coastal tourism | Number of Chinese traveling | man | |
| cul | aquaculture industry | Number of specialized workforce in mariculture | man | |
| fis | marine capture fisheries | Total power of motorized marine fishing vessels at the end of the previous year7 | kilowatt (unit of electric power) | |
| sal | Marine salt | Sea salt production | ton (loanword) | |
| control variable | oil | offshore oil and gas industry | Dummy variable, 1 if there is production, 0 otherwise | not have |
| min | Marine Mining | Dummy variable, 1 if there is production, 0 otherwise | not have | |
| riv | Water quality of rivers entering the sea | Ratio of the number of water-quality sections in categories IV, V and II to the total number of sections tested | % | |
| sew | direct oceanic waste water discharge | Volume of wastewater discharged directly to the sea | tons | |
| atm | atmospheric deposition | Nitrogen oxide emissions | ton (loanword) | |
| gov | pollution control | Ratio of completed investment in industrial pollution control to industrial output value | % |
4. Empirical Methodology and Results
4.1. Research Methodology
Multiple linear regression is a common method used to analyze causality, and we developed the following econometric model based on the previous description:
Y1it =α+ β 1trait +β2shiit +β3touit +β4culit +β5fis +it β6 salit +contralit +id+t+εit
In model (1), Y1 represents the water quality condition of seawater, i in the subscript it represents different regions, and t represents different years. tra, shi, tou, cul, fis, and sal represent the industry scale of marine transportation, marine shipbuilding, marine tourism, mariculture, marine fishing, and marine salt, respectively. β1-β6 are the coefficients to be estimated, and are the main references for comparing the relative impacts of each marine industry on the marine environment. contral represents the ensemble of control variables, including marine oil and gas, marine mining, direct wastewater discharge from inlet rivers, and atmospheric pollutant deposition. compare the relative influence of each marine industry on the marine environment. contralit represents the ensemble of control variables, including marine oil and gas industry, marine mining industry, direct discharge of wastewater from rivers into the sea, deposition of air pollutants, and pollution control efforts; id represents the individual fixed effect of each region, which indicates the characteristics specific to the different study areas but unobservable to us, such as the self-purification ability of the sea area itself; t is the time trend; and t is the time trend of the marine transportation industry, marine tourism, mariculture, marine fishing, and marine salt industry. self-cleaning ability; t is the time trend term, which represents the trend of each sea area itself over time, and εit is the perturbation term, which includes all the other factors that can affect the quality of the marine environment but are not reflected in the equation.
Meanwhile, we established model (2) by replacing the explanatory variable with Y2 to study the factors that increase the area of poor water quality seawater, and all other variables are the same as in model 1
Y2it =α+β1trait +β2shiit +β3touit +β4culit +β5fisit +β6salit +contralit +id+t+εit
4.1. Descriptive Statistics
Table 2 shows the descriptive statistics of each variable, according to the table we can know that the quality of seawater varies greatly from year to year in different regions (there are 0 and 1 in the ratio of the area of good quality seawater and poor quality seawater in the total area of the sea); the industries that operate in all regions in all years are marine transportation, marine tourism and marine fishing (the minimum of these three industries is not 0); the standard deviation of each marine industries has a large standard deviation (the minimum is 19512.72, not counting the marine oil and gas industry and the marine mining industry), indicating that the scale and structure of the marine industry varies greatly from year to year in different regions. In order to avoid the size of the unit of the variables affecting the accuracy of the regression results, we take the logarithmic value of the natural logarithm as the base of the actual regression, except for the variables with the unit of % and without unit.
4.3. Benchmark Regression Results
In order to avoid the problems of heteroskedasticity, intra-group autocorrelation and inter-group contemporaneous correlation, we use the full feasible least generalized squares (FGLS) method to estimate each model, and the regression results are shown in Table 3. Among them, column (1) is the regression result with the ratio of excellent water quality seawater area in the total sea area as the explanatory variable, and the negative regression coefficient represents that, the expansion of the scale of the industry caused the reduction of the excellent seawater area. Column (2) is the regression result with the proportion of non-excellent seawater area in the total sea area as the explanatory variable, and the negative regression coefficient represents that the expansion of the scale of the industry caused the increase of the area of poor water quality seawater.
The results showed that the development of marine tourism, marine transportation, marine shipbuilding and mariculture all had a significant negative impact on the marine environment (regression coefficient negative and p<0.1), while the marine salt industry had no significant impact on the marine environment (p>0.1), and the development of the marine fishing industry had a significant positive impact on the marine environment (regression coefficient positive and p<0.05). 0.05). According to the concept of ecological elasticity, the specific impact of the development of each industry on the marine environment is as follows, when all other conditions remain unchanged, the scale of a particular marine industry is expanded by 1%, then:
Coastal tourism would reduce the area of good quality seawater by 0.03%; marine transportation would increase the area of poor quality seawater by 0.072%; marine shipbuilding would reduce the area of good quality seawater by 0.004%, while increasing the area of poor quality seawater by 0.003%; mariculture would reduce the area of good quality seawater by 0.018%; and marine fishing would Marine aquaculture reduces the area of good quality water by 0.018% and marine fishing reduces the area of bad quality water by 0.009%.
4.4. Robustness Tests
Here, we will choose the method of replacing explanatory variables to test model (1) and model (2) for robustness. Some studies have shown that algae can absorb nutrient salts in the water body, so algal culture has a purifying effect on the water body (Xiao et al., 2017) . Therefore, we divided the seawater aquaculture industry into two parts of seaweed aquaculture and other types of aquaculture to conduct multiple linear regression again, because the China Fisheries Statistical Yearbook does not specify is the professional labor force of seawater aquaculture is carried out which kind of seafood farming, so we use the aquaculture production of seaweed and the aquaculture production of other seafood other than algae to represent the scale of the industry of seaweed farming as well as the aquaculture of other seafood products, respectively. As a result, model (3) and model (4) were established, and model (1) and model (2) were tested for robustness, respectively:
Y1it =α+β1trait +β2shiit +β3touit +β4culit +β5alg+β6fisit +β7salit +contralit +id+t+εit
Y2it =α+β1trait +β2shiit +β3touit +β4culit +β5alg+β6fisit +β7salit +contralit +id+t+εit
The cul in model (3) and model (4) represents the scale of the seafood farming industry other than algae, which is expressed in terms of the production of seafood farming other than algae; and alg represents the scale of the algae farming industry, which is expressed in terms of the production of seaweed farming. The meanings of all other variables are consistent with model (1) and model (2).
The regression results are shown in Table 5, although the size of the regression coefficients of each marine industry has some slight changes, the sign and the size of the first pair are consistent with the regression results of model 1, which indicates that the model setting of this study is more reasonable. The coefficient of algal culture is only 1/3 of the coefficient of seafood culture other than algae, and when expanding the same industrial scale, the negative impact caused by algal culture is only 1/3 of that caused by other varieties of seawater culture, although algal culture does not improve the effect of seawater quality, its impact on the marine environment is far less than that of the culture of other seafood products.
Table 4.
Robustness test regression results.
| (1) | (2) | |
| Area of good water quality | Area of non-poor water quality | |
| tra | 0.017 | -0.074*** |
| (-0.014) | (-0.015) | |
| shi | -0.004** | -0.003* |
| (-0.002) | (-0.002) | |
| tou | -0.043*** | -0.000150 |
| (-0.016) | (-0.018) | |
| cul | -0.018*** | -0.011 |
| (-0.004) | (-0.007) | |
| alg | -0.006* | -0.003 |
| (-0.004) | (-0.004) | |
| fis | -0.004 | 0.009** |
| (-0.004) | (-0.004) | |
| sal | 0.002 | 0.003 |
| (-0.003) | (-0.002) | |
| oil | -0.126** | 0.114 |
| (-0.055) | (-0.075) | |
| min | 0.021 | -0.014 |
| (-0.021) | (-0.021) | |
| riv | 0.027 | 0.191*** |
| (-0.041) | (-0.033) | |
| sew | -0.005 | 0.016 |
| (-0.012) | (-0.014) | |
| atm | 0.027 | -0.089*** |
| (-0.017) | (-0.025) | |
| gov | -0.013 | 0.008 |
| (-0.014) | (-0.015) | |
| t | 0.011*** | 0.004 |
| (-0.003) | (-0.003) | |
| _cons | 1.545*** | 2.406*** |
| (-0.309) | (-0.385) | |
| N | 165 | 165 |
| Standard errors in parentheses | ||
| * p<0.1, ** p<0.05, *** p<0.01 | ||
4.5. Analysis of Regression Results
From the regression results, among the six major marine industries we selected, except for the marine salt industry, several other industries have either a significant impact on the marine environment or a significant impact on the marine environment. Next, we will briefly analyze these five several industries that have significant impacts on the marine environment.
The marine transportation industry is the main cause of the increase in the area of seawater with poor water quality in Chinese waters, and the pollution generated by marine navigation, in addition to conventional wastewater discharges (Shu et al., 2022) In addition to conventional wastewater discharges (Shu et al., 2022), pollution from marine transportation is also caused by accidental spills of pollutants (Wan et al., 2022). Pollution from ship navigation is a major problem in all parts of the world (Patruno, 2008). (Patruno, 2008). Pollution from shipping is a major problem worldwide (Patruno, 2008). However, China's marine transportation has not reduced the area of good quality seawater, indicating that China's control of sea routes is relatively strict, and therefore the area of good quality seawater has not been significantly affected by the marine transportation industry.
Coastal tourism is the main factor that causes the reduction of the area of good quality seawater. Most of the activity sites of coastal tourism are in the sea with good quality seawater, so it will affect the seawater with good quality seawater. Tourism activities generally do not produce some serious pollutants, so its impact is only manifested in the reduction of the area of good quality seawater, but did not cause an increase in the area of bad seawater.
The marine shipbuilding industry is the only one of the major marine industries that has caused both a decrease in the area of good-quality seawater and an increase in the area of poor-quality seawater, suggesting that some of China's shipyards are located in areas with better water quality.
Bait fed during mariculture and feces from aquatic animals can lead to eutrophication of water bodies (Gephart et al., 2021). Seaweed is also a major contributor to the decrease in the area of good quality seawater, although mariculture has not resulted in an increase in the area of poor quality seawater. Although several studies have shown that seaweeds can absorb pollutants from seawater (Duarte, Bruhn, & Krause-Jensen, 2022), our results show that seaweeds are able to absorb pollutants from seawater. , however, our results show that seaweed farming also has a negative impact on the marine environment. However, it did not have the envisioned positive effect, and we believe that some other physiological effects of seaweed growth were overlooked, or possibly offset by some other production activities during seaweed aquaculture, such as some apoplastic contamination during production or harvesting (Luo, Xie, & Yang, 2022). .
Marine capture fisheries, on the other hand, have been shown to reduce the area of poor water quality, but we do not believe that marine capture activities have directly improved the marine environment. The indicator we chose to represent the intensity of marine fishing activities was the total power of marine fishing vessels owned by each region at the end of the previous year, so we believe that when more marine fishing equipment is used in a region, the local government and fishermen have a higher incentive to improve and protect the marine environment. Previous studies have also shown that laborers who demand higher environmental quality have greater incentives to protect the environment (Hukom, Nielsen, Asmild, & Nielsen, 2020; Nations, 2023) .
5. Conclusion and Discussion
We used 15 years of panel data from 11 coastal provinces and cities in mainland China to study the impact of six major marine industries, namely coastal tourism, marine transportation, marine shipbuilding, marine salt, mariculture and marine fishing, on marine pollution. The results of the study show that when all other conditions are certain, each marine industry expands the same scale respectively, and in order of the degree of influence from the largest to the smallest, the marine industries that cause a reduction in the area of seawater with good water quality are, in order, the coastal tourism industry (-0.03, p<0.05), the marine shipbuilding industry (-0.004, p<0.05), and the sea water aquaculture industry (-0.018, p< 0.01); the marine industries that caused an increase in the area of seawater with poor water quality were marine transportation (-0.072, p<0.01) and marine shipbuilding (-0.003, p<0.1), the marine salt industry (0.003, p>0.1) had no significant effect on the marine environment, and marine fishing (0.009, p<0.05) had a slight positive effect on the marine environment instead had a slight positive effect.
From the foregoing, we know that different marine industries have different requirements for the marine environment, and their impacts on the marine environment also vary greatly. The government should strictly delimit the development area of each marine industry to prevent highly polluting industries from affecting the sea area with better water quality. Local governments should formulate policies suitable for the development of their regions in accordance with their own development needs.
References
- Auta, H. S., Emenike, C. U., & Fauziah, S. H. 2017. Distribution and importance of microplastics in the marine environment: a review of the sources, fate, effects, and potential solutions. fate, effects, and potential solutions. Environment International, 102: 165-176. [CrossRef] [PubMed]
- Brown, E. J., Vasconcelos, R. P., Wennhage, H., Bergstrom, U., Stottrup, J. G., van de Wolfshaar, K., Millisenda, G., Colloca, F., & Le Pape, O. 2018. Conflicts in the coastal zone: human impacts on commercially important fish species utilizing coastal habitat. ices Journal of Marine Science, 75(4). 1203-1213. [CrossRef]
- Chitrakar, P., Baawain, M. S., Sana, A., & Al-Mamun, A. 2019. Current Status of Marine Pollution and Mitigation Strategies in the Arid Region: a Detailed Review. Ocean Science Journal, 54(3): 317-348. [CrossRef]
- Clunie, W. F., & Hendricks, D. W. 1995. Refuse pollution of seas and oceans. Water Science and Technology, 32(7): 13-23. [CrossRef]
- Costanza, R. 1999. The ecological, economic, and social importance of the oceans. Ecological Economics, 31(2): 199-213. [CrossRef]
- Costello, C., Cao, L., Gelcich, S., Cisneros-Mata, M. A., Free, C. M., Froehlich, H. E., Golden, C. D., Ishimura, G., Maier, J., Macadam-Somer, I., Mangin , T., Melnychuk, M. C., Miyahara, M., de Moor, C. L., Naylor, R., Nostbakken, L., Ojea, E., O'Reilly, E., Parma, A. M., Plantinga, A. J., Thilsted, S. H., & amp; Lubchenco, J. 2020. the future of food from the sea. nature, 588(7836): 95-+. [CrossRef] [PubMed]
- Duarte, C. M., Agusti, S., Barbier, E., Britten, G. L., Castilla, J. C., Gattuso, J. P., Fulweiler, R. W., Hughes, T. P., Knowlton, N., Lovelock, C. E., Lotze, H. K., Predragovic, M., Poloczanska, E., Roberts, C., & Worm, B. 2020. Lotze, H. K., Predragovic, M., Poloczanska, E., Roberts, C., & Worm, B. 2020. rebuilding marine life. nature, 580(7801): 39-51. [CrossRef] [PubMed]
- Duarte, C. M., Bruhn, A., & Krause-Jensen, D. 2022. a seaweed aquaculture imperative to meet global sustainability targets. nature sustainability Nature Sustainability , 5(3): 185-193. [CrossRef]
- Gephart, J. A., Henriksson, P. J. G., Parker, R. W. R., Shepon, A., Gorospe, K. D., Bergman, K., Eshel, G., Golden, C. D., Halpern, B. S., Hornborg, S.. Jonell, M., Metian, M., Mifflin, K., Newton, R., Tyedmers, P., Zhang, W. B., Ziegler, F., & Troell, M. 2021. environmental performance of blue foods. Nature, 597(7876): 360-+. [CrossRef] [PubMed]
- Hukom, V., Nielsen, R., Asmild, M., & Nielsen, M. 2020. do Aquaculture Farmers Have an Incentive to Maintain Good Water Quality? The Case of Small- Scale Shrimp Farming in Indonesia. Ecological Economics, 176. [CrossRef]
- Jouffray, J. B., Blasiak, R., Norstrom, A. V., Osterblom, H., & Nystrom, M. 2020. The Blue Acceleration: The Trajectory of Human Expansion into the Ocean. One Earth, 2(1): 43-54. [CrossRef]
- Landrigan, P. J., Stegeman, J. J., Fleming, L. E., Allemand, D., Anderson, D. M., Backer, L. C., Brucker-Davis, F., Chevalier, N., Corra, L., Czerucka, D. , Bottein, M. Y. D., Demeneix, B., Depledge, M., Deheyn, D. D., Dorman, C. J., Fenichel, P., Fisher, S., Gaill, F., Galgani, F., Gaze, W. H., Giuliano, L.. Grandjean, P., Hahn, M. E., Hamdoun, A., Hess, P., Judson, B., Laborde, A., McGlade, J., Mu, J., Mustapha, A., Neira, M., Noble, R. T., Pedrotti, M. L.. Reddy, C., Rocklov, J., Scharler, U. M., Shanmugam, H., Taghian, G., van de Water, J., Vezzulli, L., Weihe, P., Zeka, A., Raps, H., & Rampal, P. 2020. Human Health and Ocean Pollution. Annals of Global Health, 86(1). [CrossRef] [PubMed]
- Le Moal, M., Gascuel-Odoux, C., Menesguen, A., Souchon, Y., Etrillard, C., Levain, A., Moatar, F., Pannard, A., Souchu, P., Lefebvre, A., & Pinay, G. 2019. Eutrophication: a new wine in an old bottle? Science of the Total Environment, 651: 1-11. [CrossRef]
- Li, Y., & Duan, X. 2015. Polycyclic aromatic hydrocarbons in sediments of the China Sea. Environmental Science and Pollution Research, 22(20): 15432- 15442. [CrossRef] [PubMed]
- Liu, P., Hu, W. Y., Tian, K., Huang, B., Zhao, Y. C., Wang, X. K., Zhou, Y. Q., Shi, B., Kwon, B. O., Choi, K., Ryu, J., Chen, Y., Wang, T., & Khim, J. S. 2020. Accumulation and ecological risk of heavy metals in soils along the coastal areas of the Bohai Sea and the Yellow Sea: A comparative study of China and South Korea. Environment International, 137. [CrossRef] [PubMed]
- Liu, W. B., & Cao, Z. F. 2018. Positive Role of Marine Tourism on Economic Stimulus in Coastal Area. journal of Coastal Research: 217-220. [CrossRef]
- Luo, H. T., Xie, S. G., & Yang, Y. F. 2022. Potential removal capacity and secondary pollution risk evaluation of heavy metals in Gracilaria lemaneiformis from a typical seaweed farming base. Algal Research-Biomass Biofuels and Bioproducts, 65. [CrossRef]
- Ma, R. F., Hou, B., & Zhang, W. Z. 2019. Could Marine Industry Promote the Coordinated Development of Coastal Provinces in China? Sustainability, 11( 4). [CrossRef]
- Morales-Caselles, C., Viejo, J., Marti, E., Gonzalez-Fernandez, D., Pragnell-Raasch, H., Gonzalez-Gordillo, J. I., Montero, E., Arroyo, G. M., Hanke , G., Salvo, V. S., Basurko, O. C., Mallos, N., Lebreton, L., Echevarria, F., van Emmerik, T., Duarte, C. M., Galvez, J. A., van Sebille, E., Galgani, F., Garcia, C. M., Ross, P. S., Bartual, A., Ioakeimidis, C., Markalain, G., Isobe, A., & Cozar, A. 2021. An inshore-offshore sorting system revealed from global classification of ocean litter. Nature Sustainability, 4(6): 484-493. [CrossRef]
- Solomon Islands Prime Minister Sogavare: Japan must immediately stop discharging nuclear waste water, Vol. 2023: United Nations.
- O'Hara, C. C., & Halpern, B. S. 2022. Anticipating the Future of the World's Ocean. Annual Review of Environment and Resources, 47: 291-315. [CrossRef]
- Ofiara, D. D., & Seneca, J. J. 2006. Biological effects and subsequent economic effects and losses from marine pollution and degradations in marine environments: Implications from the literature. Marine Pollution Bulletin, 52(8): 844-864. [CrossRef] [PubMed]
- Patruno, R. 2008. PREVENTION OF MARINE POLLUTION FROM SHIPS IN THE MEDITERRANEAN REGION: ECONOMIC, LEGAL AND TECHNICAL ASPECTS. Geografia Fisica E Dinamica Quaternaria, 31(2): 211-214.
- Riechers, M., Brunner, B. P., Dajka, J. C., Duse, I. A., Lubker, H. M., Manlosa, A. O., Sala, J. E., Schaal, T., & Weidlich, S. 2021. Leverage points for addressing marine and coastal pollution: A review. Marine Pollution Bulletin, 167. [CrossRef] [PubMed]
- Sarikaya, H. Z., Sevimli, M. F., & Citil, E. 1999. Region-wide assessment of the land-based sources of pollution of the Black Sea. Water Science and Technology, 39(8): 193-200. Technology, 39(8): 193-200. [CrossRef]
- Shi, Y. B. 2016. Are greenhouse gas emissions from international shipping a type of marine pollution? Marine Pollution Bulletin, 113(1-2): 187-192. [CrossRef]
- Shu, Y. Q., Wang, X. Y., Huang, Z. Q., Song, L., Fei, Z. Q., Gan, L. X., Xu, Y. M., & Yin, J. C. 2022. Estimating spatiotemporal distribution of wastewater generated by ships in coastal areas. generated by ships in coastal areas. Ocean & Coastal Management, 222. [CrossRef]
- Spillias, S., Valin, H., Batka, M., Sperling, F., Havlik, P., Leclere, D., Cottrell, R. S., O'Brien, K. R., & McDonald-Madden, E. 2023. Reducing global land-use pressures with seaweed farming. nature Sustainability. [CrossRef]
- von Glasow, R., Jickells, T. D., Baklanov, A., Carmichael, G. R., Church, T. M., Gallardo, L., Hughes, C., Kanakidou, M., Liss, P. S., Mee, L., Raine, R., Ramachandran, P., Ramesh, R., Sundseth, K., Tsunogai, U., Uematsu, M., & Zhu, T. 2013. Megacities and Large Urban Agglomerations in the Coastal Zone : Interactions Between Atmosphere, Land, and Marine Ecosystems. Ambio, 42(1): 13-28. [CrossRef]
- Wan, S. Y., Yang, X. H., Chen, X. Y., Qu, Z. N., An, C. J., Zhang, B. Y., Lee, K., & Bi, H. F. 2022. Emerging marine pollution from container ship accidents. Risk characteristics, response strategies, and regulatory advancements. Journal of Cleaner Production, 376. [CrossRef]
- Wang, B. D., Xin, M., Wei, Q. S., & Xie, L. P. 2018. A historical overview of coastal eutrophication in the China Seas. Marine Pollution Bulletin, 136. 394-400. [CrossRef] [PubMed]
- Wang, S. P., Li, K. Q., Liang, S. K., Zhang, P., Lin, G. H., & Wang, X. L. 2017. An integrated method for the control factor identification of resources and environmental carrying capacity in coastal zones: a case study in Qingdao, China. Ocean & Coastal Management, 142: 90-97. [CrossRef]
- Wang, Y. X., & Wang, N. 2019. The role of the marine industry in China's national economy: an input-output analysis. Marine Policy, 99: 42-49. [CrossRef]
- Xiao, X., Agusti, S., Lin, F., Li, K., Pan, Y. R., Yu, Y., Zheng, Y. H., Wu, J. P., & Duarte, C. M. 2017. Nutrient removal from Chinese coastal waters by large-scale seaweed aquaculture. scientific Reports, 7. [CrossRef]
- Yi, Y. Y., Kong, L. N., Wang, X. M., Li, Y. X., Cheng, J. Y., Han, J. B., Chen, H., & Zhang, N. D. 2023. Distribution and characteristics of microplastics in sediment at representative dredged material ocean dumping sites, China. in sediment at representative dredged material ocean dumping sites, China. Marine Pollution Bulletin, 193. [CrossRef]
- Zhang, C. F., Zhou, H. H., Cui, Y. Z., Wang, C. S., Li, Y. H., & Zhang, D. D. 2019. Microplastics in offshore sediment in the Yellow Sea and East China Sea, China. China. Environmental Pollution, 244: 827-833. [CrossRef]
- Zhou, D., Yu, M., Yu, J. B., Li, Y. Z., Guan, B., Wang, X. H., Wang, Z. K., Lv, Z. B., Qu, F. Z., & Yang, J. S. 2021. Impacts of inland pollution input on Impacts of inland pollution inputs on coastal water quality of the Bohai Sea.
Figure 1.
Water quality status of near-shore marine waters in coastal areas of mainland China in 2006 and 2020.
Figure 1.
Water quality status of near-shore marine waters in coastal areas of mainland China in 2006 and 2020.
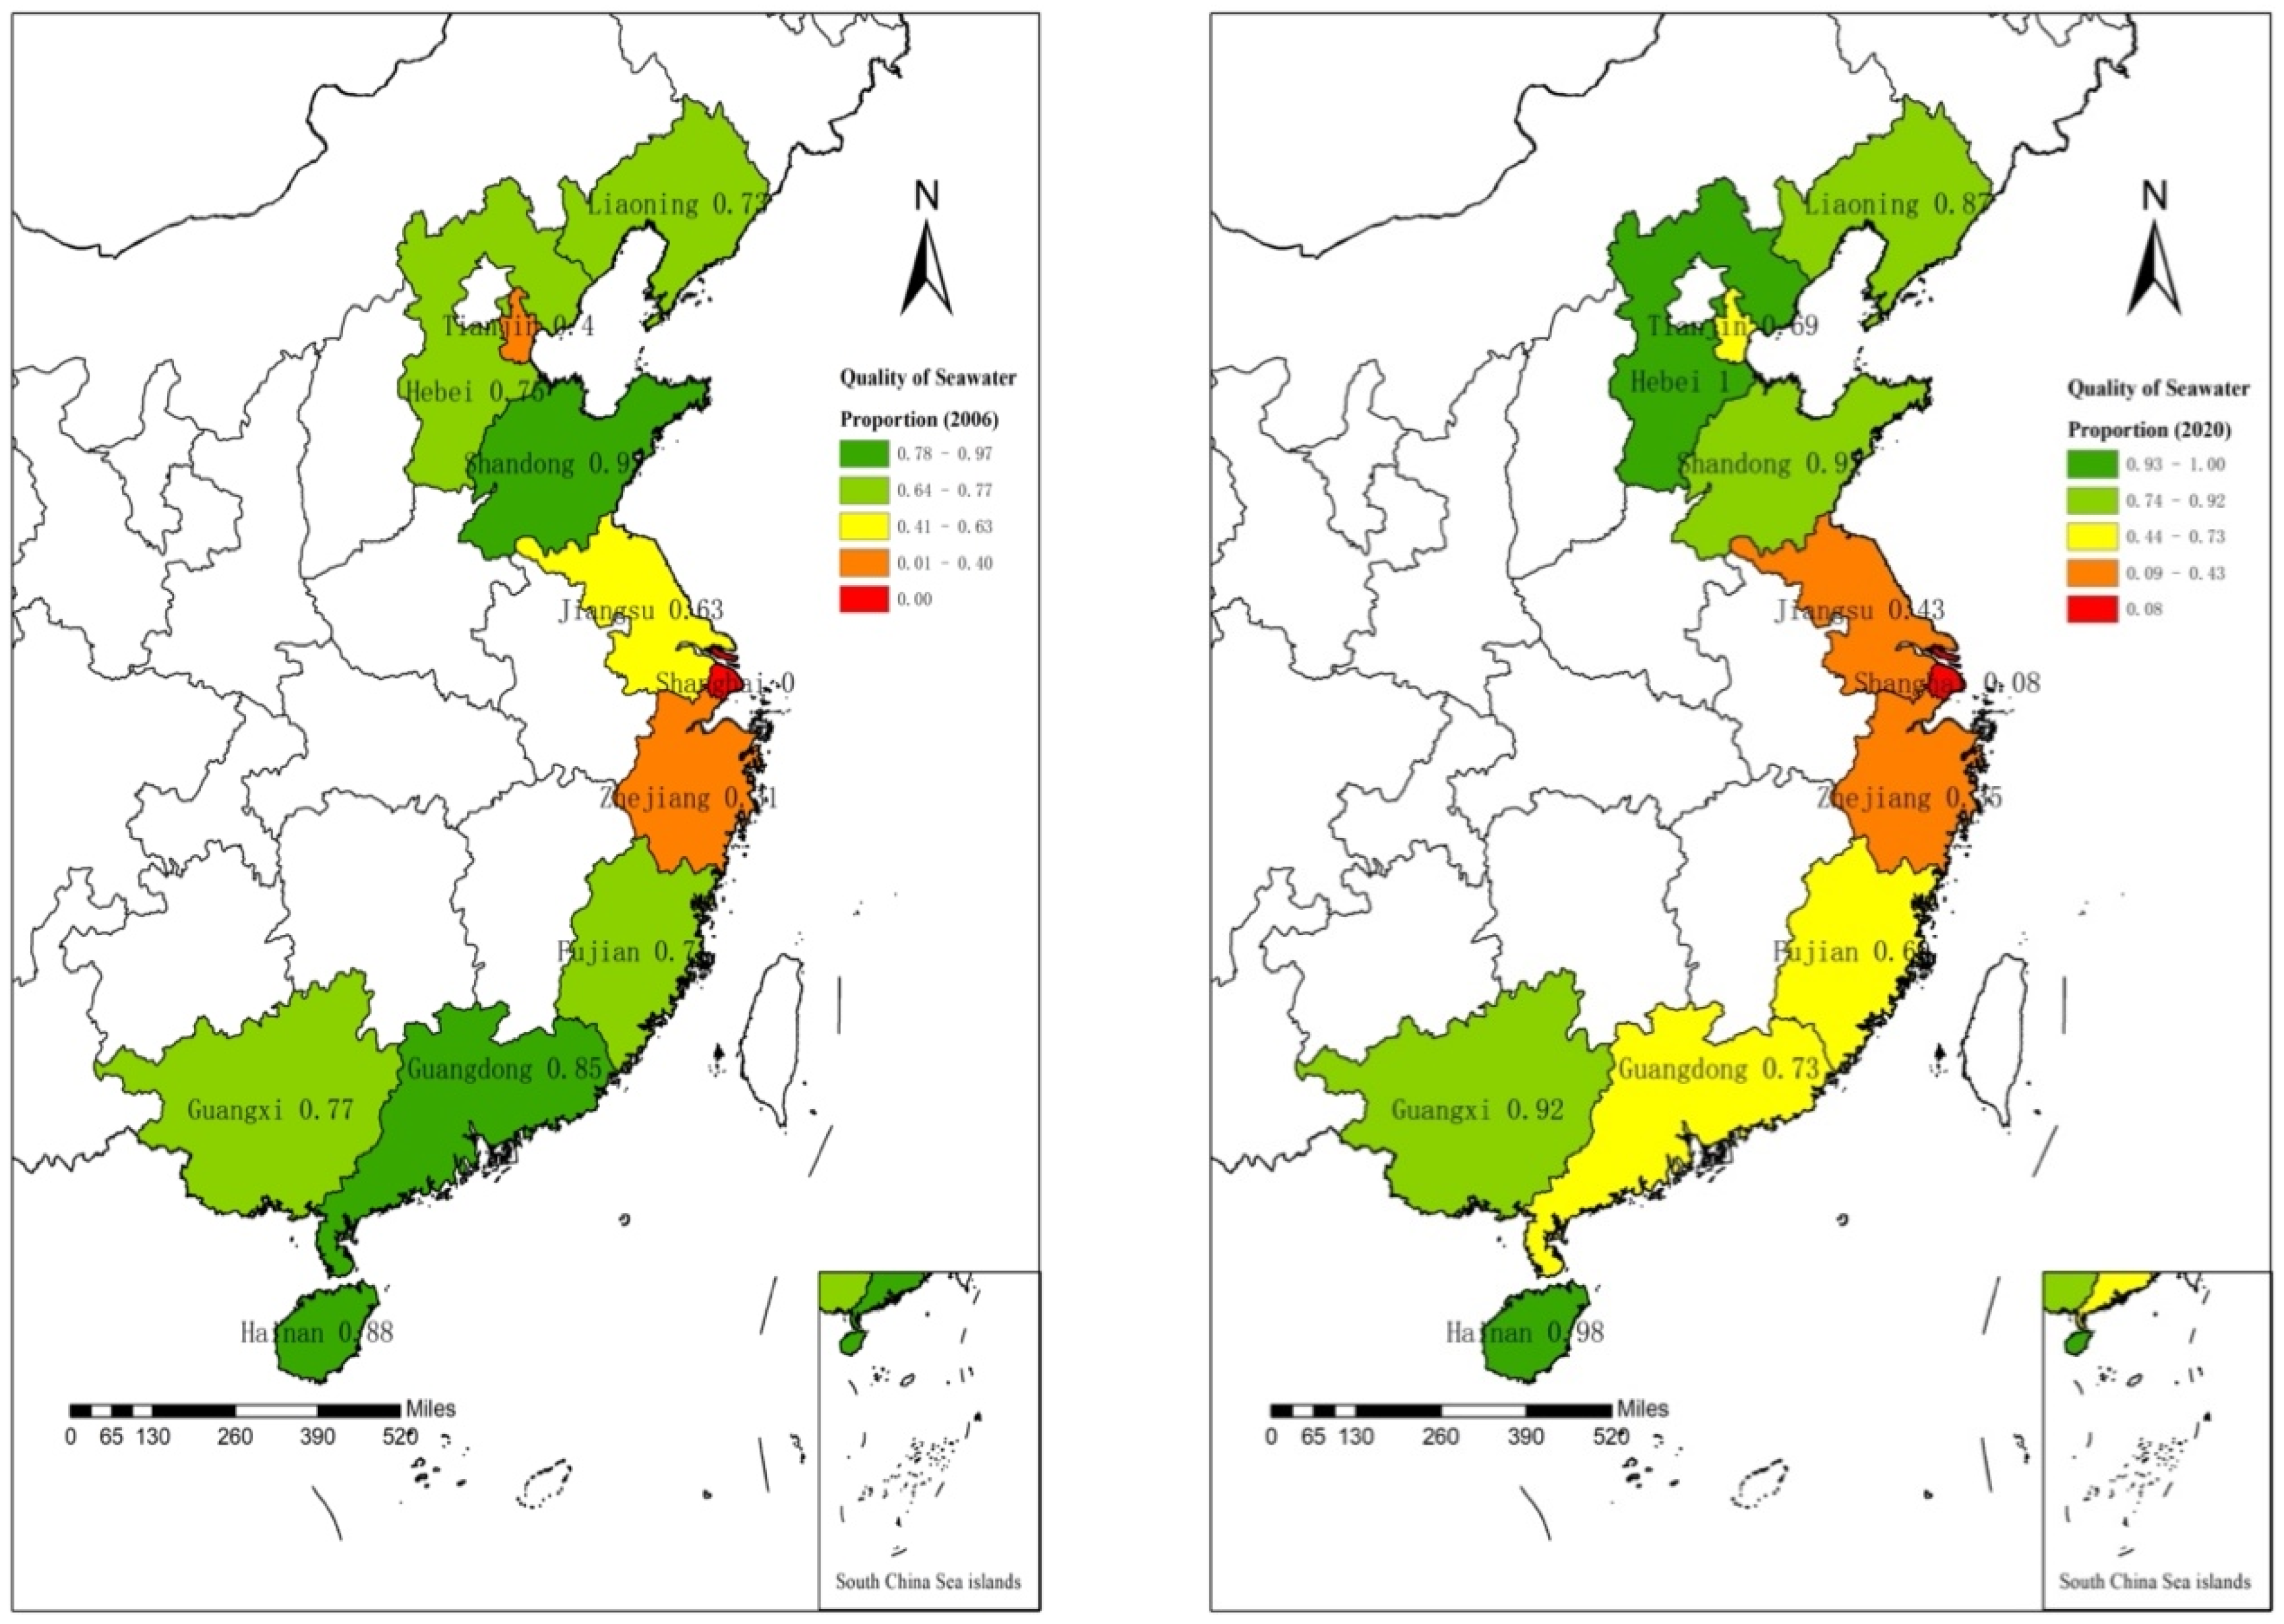
Table 2.
Table of descriptive statistics.
| Variable | Obs | Mean | Std. dev. | Min | Max. |
| Percentage of seawater area with good water quality | 165 | 0.647685 | 0.304762 | 0 | 1 |
| Percentage of area of marine water that is not of poor quality | 165 | 0.752879 | 0.277626 | 0 | 1 |
| Marine transportation | 165 | 20446.52 | 19151.72 | 581 | 88127 |
| Marine shipbuilding industry | 165 | 3617172 | 5008762 | 0 | 28100000 |
| Marine tourism | 165 | 16357.1 | 15795.63 | 373 | 91942 |
| aquaculture industry | 165 | 79154.76 | 67673.26 | 0 | 225139 |
| marine capture fisheries | 165 | 1119891 | 1006070 | 5585 | 3683444 |
| Marine salt | 165 | 2623078 | 5753518 | 0 | 24200000 |
| offshore oil and gas industry | 165 | 0.545454 | 0.499445 | 0 | 1 |
| Marine Mining | 165 | 0.436363 | 0.497443 | 0 | 1 |
| direct oceanic waste water discharge | 165 | 53438.44 | 60170.2 | 1188 | 325424 |
| river draining into the sea | 165 | 0.570222 | 0.235098 | 0 | 1 |
| atmospheric deposition | 165 | 802176.9 | 548922.2 | 40669 | 1990551 |
| Pollution control efforts | 165 | 0.323998 | 0.24381 | 0.008539 | 1.457163 |
Table 3.
Regression results.
| explanatory variable | (1) | (2) |
| tra | 0.023 | -0.072*** |
| (-0.014) | (-0.014) | |
| shi | -0.004** | -0.003* |
| (-0.002) | (-0.002) | |
| tou | -0.030** | 0.008 |
| (-0.015) | (-0.016) | |
| cul | -0.018*** | -0.017 |
| (-0.005) | (-0.011) | |
| fis | -0.001 | 0.009** |
| (-0.004) | (-0.004) | |
| sal | 0.002 | 0.003 |
| (-0.003) | (-0.002) | |
| oil | -0.124** | 0.124 |
| (-0.053) | (-0.076) | |
| min | 0.03 | -0.012 |
| (-0.02) | (-0.021) | |
| riv | 0.048 | 0.190*** |
| (-0.039) | (-0.032) | |
| sew | -0.021** | 0.016 |
| (-0.01) | (-0.012) | |
| atm | 0.002 | -0.105*** |
| (-0.014) | (-0.023) | |
| gov | -0.007 | 0.004 |
| (-0.014) | (-0.014) | |
| t | 0.008*** | 0.001 |
| (-0.002) | (-0.003) | |
| _cons | 1.556*** | 2.464*** |
| (-0.304) | (-0.388) | |
| N | 165 | 165 |
| Standard errors in parentheses | ||
| * p<0.1, ** p<0.05, *** p<0.01 | ||
| 1 | The marine industry is discussed in more detail below and can be found at https://openstd.samr.gov.cn/bzgk/gb/newGbInfo?hcno=CD643A1B2C7D9F56285AE6A526D8BBB3
|
| 2 | For more information, see National Marine Functional Zoning (2011~2020), People's Republic of China, http://f.mnr.gov.cn/201806/t20180621_1830454.html
|
| 3 | For more information, please see the People's Republic of China, "Seawater Quality Standards (GB 3097-1997 )," https://www.mee.gov.cn/ywgz/fgbz/bz/bzwb/shjbh/shjzlbz/199807/W020061027511546974673.pdf
|
| 4 | Marine fisheries, which in turn include mariculture and marine capture fisheries, will be analyzed separately in this study. |
| 5 | Please see the Annex for detailed processing of the data, which will not be described here due to space constraints. |
| 6 | The People's Republic of China "Environmental Quality Standards for Surface Water (GB 3838-2002)" divides the water quality of rivers into six categories from good to bad: Category 1, Category 2, Category 3, Category 4, Category 5, and worse than Category 5, and the status of the water quality of the river is judged by the tested sections, and in this study, the ratio of the number of monitoring sections for water quality of Category 4, Category 5, and worse than Category 5 to the total number of sections is taken as an indicator of the water quality of the river. In this study, the ratio of the number of monitoring sections with water quality of category 4, 5 and worse than 5 to the total number of monitoring sections is used as an indicator of river water quality, and the larger the value is, the worse the river water quality is symbolized. https://www.mee.gov.cn/ywgz/fgbz/bz/bzwb/shjbh/shjzlbz/200206/W020061027509896672057.pdf
|
| 7 | Because the monitoring of seawater quality is concentrated from May to October each year, and the total power of fishing vessels is generally counted in December each year, the total power of fishing vessels counted at the end of the year is in fact available for the productivity of the following year, so we use the total power of fishing vessels at the end of the previous year to represent the intensity of marine fishing in that year. |
Disclaimer/Publisher’s Note: The statements, opinions and data contained in all publications are solely those of the individual author(s) and contributor(s) and not of MDPI and/or the editor(s). MDPI and/or the editor(s) disclaim responsibility for any injury to people or property resulting from any ideas, methods, instructions or products referred to in the content. |
© 2024 by the authors. Licensee MDPI, Basel, Switzerland. This article is an open access article distributed under the terms and conditions of the Creative Commons Attribution (CC BY) license (http://creativecommons.org/licenses/by/4.0/).
Copyright: This open access article is published under a Creative Commons CC BY 4.0 license, which permit the free download, distribution, and reuse, provided that the author and preprint are cited in any reuse.


