

Submitted:
08 March 2024
Posted:
11 March 2024
You are already at the latest version
Abstract
The analysis of the key factors which prevent or contribute to the promotion and development of the Power Purchase Agreements (PPAs) in order to meet the sustainability goals represents an important issue which worth being investigated, especially in the situation in which entering in bilateral relations inside this contract has a powerful meaning in achieving new climate targets, developing and improving the use of green energy, and promoting a sustainable green economy. The main goal of this research is to identify and analyze the main factors which help or pre-vent the promotion and development of a PPA, in order to meet the sustainability goals by promoting a green economy. For this research survey based on comparative analysis, questionnaires and interviews with energy experts, Spearman’s correlation matrix and IBM SPSS Statistics for Window are also used.
The results suggest that although there are positive interest and an open attitude towards the PPA from both sides (sellers and buyers), but there is still place for improvement, the lack of knowledge or the insufficient measures taken so far being two of the reasons way until now in Romania we do not have a developed PPA market and the level of knowledge regarding this type of mechanism is quite low.
Keywords:
Power Purchase Agreement (PPA)
; Key Factors
; Sustainability Goals
; Renewable Energy
; Green Energy
; Zero Carbon Economy
; Climate Neutrality
; Romania
1. Introduction
The problem of global warming turned the attention to renewable energy (Tie and Tan, 2013). So, climate change and its implications are some of the most important issues the humanity is facing (International Energy Outlook, 2011) and from what the researchers say the main cause is the burning of fossil fuels, which releases greenhouse gases (GHG). Here are to be mentioned that five industries (cement and concrete, iron and steel, oil and gas, chemicals, and coal mining) together are responsible for 80% of industrial emissions (Iancu, 2023). At the same time, taking into consideration the Paris agreement more world countries, including European Union want to become carbon neutral by 2050 (Hale et al., 2022; Council of European Union, 2020) as to limit the global warming below 1.5 C (IPCC et al., 2018, 2012). Considering that between 2002 and 2030 the global energy demand will increase by approximately 60%, with an average increase of 1.7 % annually means the increase of greenhouse gas emissions (Schmidt, 2008). It is thought that oil reserves could be exhausted by 2040, natural gas by 2060, while coal by 2300 (Chau and Chan, 2007). In this sense, a safe and efficient way to be able to stop and defeat global pollution is to use as many renewable energy sources as possible (Petersen, 2011), which is a sustainable and clean energy that comes from nature (Parsons et. al., 2015). According to the International Energy Agency’s Experts it is a beneficial period for development and use of renewable energy sources (RES). It is expected that in the next 5 years as many renewable energy resources will be used as were used in the last 20 years, this is also due to the countries that are becoming leaders in this field (David, 2023). In recent years, power purchase agreement (PPA) has developed better and better, receiving more and more importance, thus at the end of 2014, the total number of farms that signed PPA reached 363 and the total capacity 32,641MW (Lei and Sandborn, 2018). In addition to being an efficient way for energy producers from renewable energy sources to attract financing for the development of green energy infrastructure, PPAs are also a suitable way of encouraging the reallocation of resources, as well as a good instrument in achieving the sustainability goals by promoting a green economy. Thus, PPAs represent an innovative and sustainable mechanism, which plays an important role in environmental protection, by encouraging an ecologically friendly responsibility and ending with the achievement of climate sustainability by having an appropriate financial aid. The analysis starts with a first PPA definition. A power purchase agreement (PPA) is a performance-based contract for the purchase and sale of energy between an energy buyer and an energy provider, through which the energy buyer establishes the total amount of energy he wants and for which he will pay the agreed price in the contract. (Bruck et al., 2018; Lei & Sandborn, 2018). According to Vimpari, 2022, in 2019 already 20 GW from renewable energy sources investments were developed based on PPAs signed between private companies. The purpose of this article is to identify and analyse the main factors which help or prevent in a way or another the promotion and development of a PPA by promoting a green economy and to find appropriate measures that can be applied or improved. This article has the following structure. The introduction presents Power Purchase Agreement Concept. In Section 2, PPA and its associated risks are defined with an analysis of the main scientific sources. Within Section 3, the research methodology is presented, which consists in a comparative analysis and a questionnaire. Section 4 presents the main research results and last, but not least the final section shows the main conclusion. Bibliographical references complete this article.
2. Power Purchase Agreement in the Scientific Literature
The desire of European leaders is to develop the renewable energy sources in order to create a greener planet and a sustainable green economy. According to Wang et. All., 2022, investing in renewable energy sources will reduce their carbon footprint and avoid big climate problems. At the same time, due to Ben Belgacem et. all., 2023, opinion, there is the need for more regulations in renewable energy field, because there are many financial constraints for developing countries. In this regard, the encouragement of using renewable energy falls on governments, who are best placed to ensure that there are regulations aimed at ensuring that the transition to green energy is done in a responsible and sustainable way.
Many companies willing to achieve climate neutrality are implementing green financial methods, designed to use much more green energy and reduce carbon emissions. These financial and green purposes could be easily achieved through power purchase agreements (PPAs), which are contracts that ensure the supply of electricity for distribution companies from a generation capacity. In order to be concluded, these contracts require the establishment of a fixed rate for a certain amount of energy to be purchased by a buyer.
In addition to the above-mentioned aspects, it must be added that according to Liobikien˙e and Miceikien˙e, 2023, The European Commission, through Green Deal focused on carbon-neutral or clima-neutral EU economy by 20250, which means environmental policies such as climate change as well as circular economy, among them also counting PPAs.
The main characteristic of a Renewable PPA is that a certain amount of energy can be sold from a renewable project, which means that signing a long term PPA is very important for any renewable project, because it secures a long-term stream through the sale of energy at a sure price (RCREEE, 2012), having the benefits of using green or renewable energy, which means a step forward to the transition to green energy, by reducing CO2 emmissions and achievening, at the same time, climate neutrality.
In Europe, PPAs have been signed more in Scandinavia, Great Britain, Spain and the Netherlands, and recently in Italy. The most used renewable energy resource is wind energy, with the exception of Spain, where the energy used is from solar sources. (Huneke and Claußner, 2019).
Although there are many studies made for the assessment of climate policy and emission reductions, regarding to Kumar et al., 2022 these studies are not available for this type of contracts, the payment arrangements in PPA having to establish the costs of power transmission as clear as possible. According to Tranberg et. al., 2019 there is a negative dependence between wind power production and electricity spot price, this being a relevant factor which can be taken into consideration when we talk about risk management of long-term PPAs. In their article, Taghizadeh-Hesary et al, 2021 affirmed that PPAs are the most appropriate way for attracting green investment and they draw attention upon the private system that should be more involved in taking part in reducing the pollution. In this situation, PPAs are considered the most effective tools that can help develop green energy and the most efficient mechanism that can improve the relation between a clean energy buyer and a clean energy supplier. At the same time according to Xiang et. al., 2017 under the effects of the PPA, energy producers are much more motivated to take effective measures in developing the amount of energy produced.
The mechanism of PPA means, first of all, for the buyers that there is no need to build and maintain the energy producing equipment, being more convenient to buy this energy directly from the sellers through PPA.
Secondly, the PPA brings benefits also for producers (Qiu et. al., 2018), in the sense that they will have a constant flow of energy that will be paid according to a price mutually agreed upon with the buyer. It should be mentioned that the minimum and maximum of the delivered energy are set by the buyer and once the maximum amount is reached, he can choose if he wants to buy the additional amount of energy at a lower price. Otherwise, when the established amount of energy is not reached, the producer will have to buy the remaining quantity from the market and sell it to the buyer.
At the same time, PPAs bring another advantage for renewable energy producers due to their price security for a forthcoming unsecure energy amount, while the buyers sign PPAs due to the durability they offer. Anyway, for buyers the insecurity of energy quantity produced by renewable energy producers can bring both economic and technological difficulty (PWC, 2016; Yashar, 2021). Another benefits worth to be mentioned are that of reducing the maintenance costs, improving delivery power, but also offering long-term price security, offering opportunities to finance investments in power generation capacities and last but not least reducing the risks associated with electricity sales and purchases. When a specific physical supply of electricity with certain regional characteristic and guarantees of origin occur, this is an opportunity that can make their brand more sustainable and greener (Taghizadeh - Hesary et al., 2021). Another important advantage is the price, that could be fixed, established under the form of contracts for differences or even variable.
Important to be remembered is the fact that PPAs have the possibility to reduce the risks which may occur during the project for both parties (the offtaker and the producer) and to increase the growth of renewables (Mendicino et. al., 2019). As it is mentioned in IRENA’s 2018 Report, PPAs are also very important in regulating the most considerable aspect from the contract this meaning the prices, the responsabilities between the parties and the associated risks, this idea being retained also by Farhad et all who established that in this contract all the before mentioned aspects are an integrated part of the contract.
Furthermore, this contract is an instrument that fights against the electricity market price volatility in developing economies, because different aspects are taken into consideration during the negotiations. Here we can remember the budget of the offtaker, the capacity of green energy that can be produced, the type of renewable resources that can be used, government legal measures, the requested technlogies to generate power. (Taghizadeh-Hesary et. al., 2021). These are one of the advantages and benefits why a development of green policies can be seen (RCREEE, 2012) and why the interest in signing such a contracts is growing bigger. It happens also that purchased energy limit is obtained, the offtaker has the possibility not to pay anymore the required contractual price, the excess of energy could be bought at a reduced price or not at all. This is the moment when the seller has the posibility (according to some PPAs ) to sell the energy that is in excess into the spot market, where he ca obtain lower or higher prices (Bruck and Sandborn, 2021). According to Gabrielli et. al., 2022 most participants in the market, such as energy utilities, traders and electricity market operators prefer the contractual forms that offer the possibility of several income flows, but also offer control over the generation and storage of technologies. On the other side the corporate buyers prefer PPAs due to their possibility to avoid market volatility, to reduce energy costs and pollution and to gain sustainability. For them simple contract structures are favourable, namely the ones where they do not have the full control of generation or storage asset, such as:
- Tolling agreement - This structure offers the buyer the possibility to control the storages and to function on multiple markets, for example ancillary services, intraday arbitrage and day-ahead market arbitrage. At the same time, the producer gets the energy price in order to pay for the operational costs and capacity payments to cover fixed costs (Sinaiko, 2018). In Germany, this structure is more used for energy traders and utilities, which have more expertise in energy markets.
- Energy contracts - Regarding to Sinaiko, 2018, through this structure the buyer pays a fixed price for the energy produced by a RE plant coupled with an energy storage technology. Through this type of contract, the buyer benefits from the day ahead markets revenues while the producer takes advantage from offering ancillary services and playing intraday arbitrage.
- RE-store contracts - This type of contract is based on the difference between the highest and lowest price hours of the day ahead auction (Level ten energy, 2020). For the corporate buyers this contract is appropriate due to the independency of the cash flows from the operation of the storage asset and established on the day-ahead market prices. This type of contract notes the revenues of grid-charged storage, but if it is desired to retain in the contract the various round-trip efficiencies of the storage technology or if it is desired to note the revenues from wind or solar storage, this is not possible, this contract cannot be adapted for these purposes.
As it results from the analysis of the information contained on the website of the Wind industry company, with regard to the ownership of the environmental attributes or the renewable energy credits (REC), there are provisions established in the PPAs by which this ownership is assigned to the buyer who wishes to respects the conditions applicable to green energy. Despite the fact that there is no state tracking and trading system applicable to a specific wind project, there are provisions that assign ownership of such credits if a system is developed. Normally, the sellers, as long as they are compensated for the sale of credits and attributes, have no problem in this regard, but the tax benefits remain at their expense.
3. Research Methodology
The main objective of this research is to find out the key factors which contribute or prevent the promotion and development of PPAs on the road to climate neutrality and meeting the related sustainability goals. The research methodology used in this paper consists in a comparative analysis, a workshop with a panel of experts, a survey based on questionnaire, Spearman’s correlation matrix, IBM SPSS Statistics for Windows and simple linear regression. This work has the main purpose of analysing and better understanding the main factors which help or prevent the promotion and development of PPAs on the road to climate neutrality and meeting the related sustainability goals.
Figure 1.
The steps of the methodology.
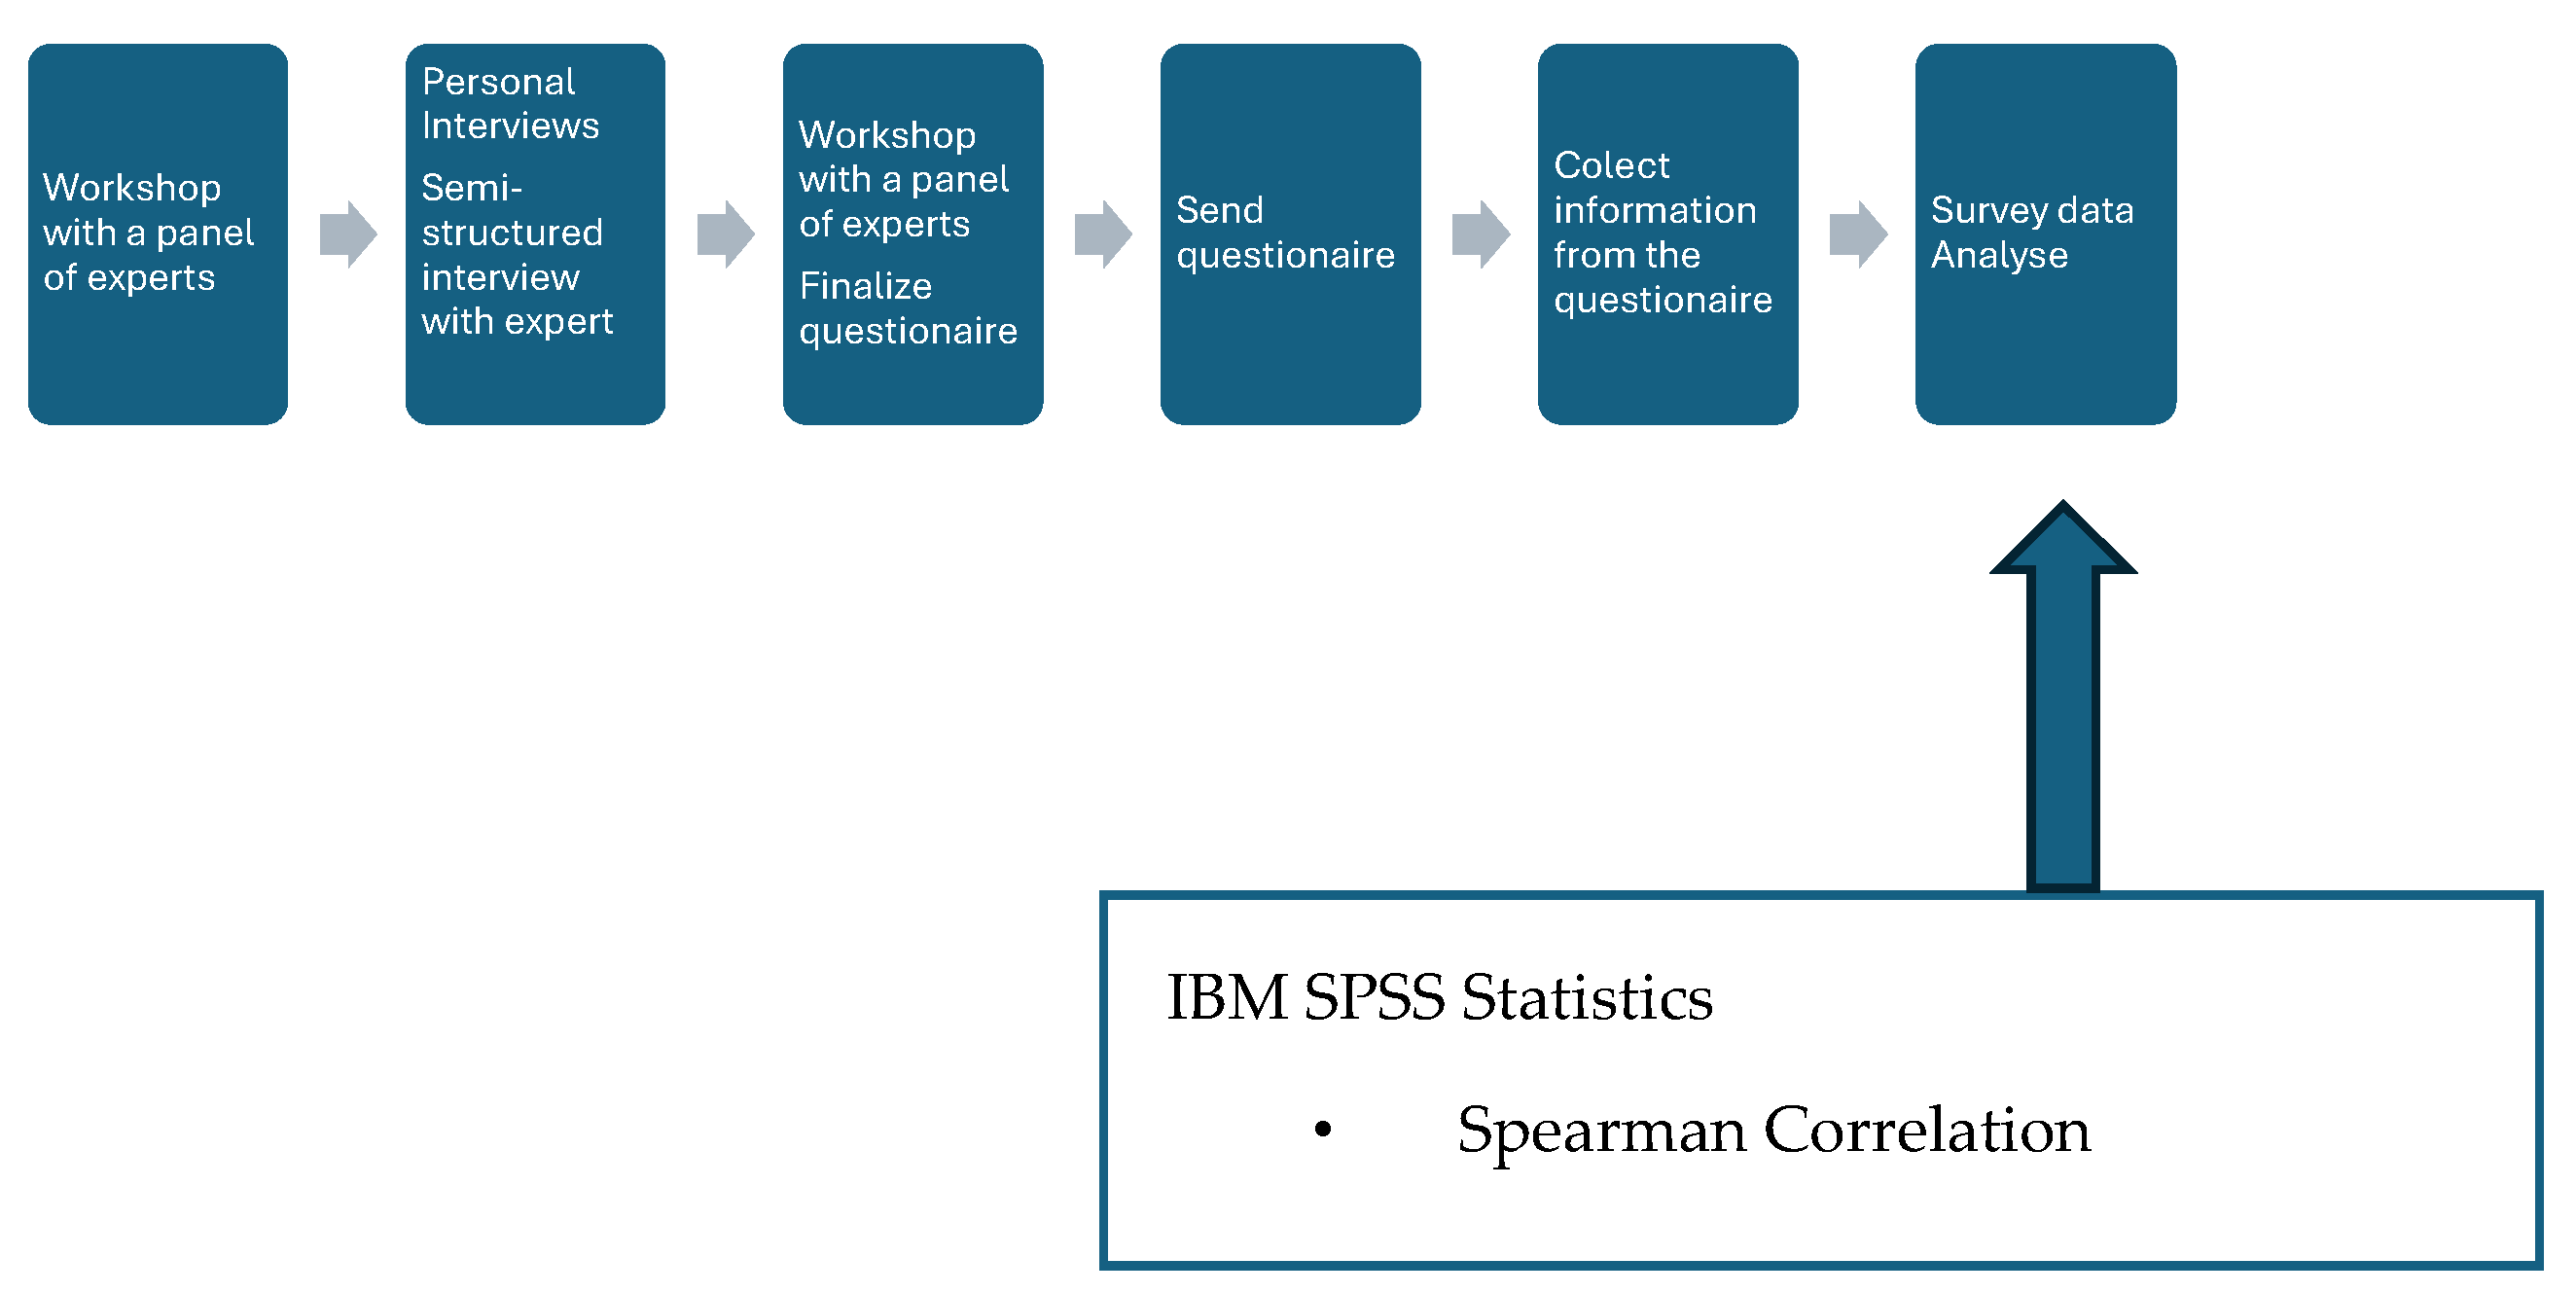
A research method is that of comparative analysis with the objective as we said before to determine the key factors that help or prevent the development of PPAs and the relationship between them. A second method of research is the organisation of a workshop made up of several energy experts which had the purpose to formulate the first hypothesis regarding the key factors that have an influence upon the development or not of PPAs as they appear to be from the questionnaire.
The participants were: energy trader, responsible for purchasing for a portfolio of top 10 universal customer suppliers in Romania, developer of renewable projects, renewable electricity producer, average industrial consumer (category C3). These experts were randomly selected from the list of respondents from the questionnaire, without knowing their answers, their role being to expose their opinion on PPAs’ key factors based on the questionnaire results.
Hypothesis 1:
Experience is directly correlated with the level of knowledge (considered independent variables) and influences the attitude towards the implementation of PPAs.
Hypothesis 2:
The development of PPA is dependent on level of how much the state is involved.
Hypothesis 3:
The experience is independent on the party (seller/buyer). There are companies, mostly multinational, with a large experience from the buyer’s point of view, which share with the Romanian branch the contracts that are already implemented in other countries.
Hypothesis 4:
There is a direct correlation between the monthly energy consume and the benefits of signing PPA. Therefore, signing a PPA is dependent on monthly consume so the attitude towards PPA is dependent on Monthly consume
All these Hypothesis will be analysed from 2 points of view:from the seller’s and buyer’s pers-pective.
The formulation of questionnaires had the main purpose to find out the elements that may affect the PPAs in the transition to a zero-carbon economy, while their results are processed with IBM SPSS Statistics for Window. The data obtained through the formulation of the questionnaire revealed that the main factors which influence or prevent the development of PPAs are the following (Figure 2):
It has to be mentioned that the survey involved 232 respondents and it had the idea to determine the factors which contribute or not to the development of PPAs on the road to climate neutrality and meeting the related sustainability goals. Regarding the respondents we emphasize that they fall into different categories representing different fields of activity, such as economic operators and industrial and small consumers. The confidentiality of the respondents is respected throughout the study. Personal data were not the subject of this study and the questions provided are not subjective in nature. Furthermore, aspects such as attitude, state’s implication, level of knowledge, the level of PPA market, if the respondents have ever signed a PPA, the field of the company and monthly consume were taken into account when analysing the results.
The profile of the consumers who answered the questionnaires is presented in Table 2.
In order to obtain the research results, the data were processed with IBM SPSS Statistics for Windows. The statistical analysis performed as a result of the processing of the questionnaire was based on the following stages: collection, processing, analysis and interpretation of the survey results. Regarding the horizontal analysis, we show that the answers to each question have different units of measure (ordinal, nominal, scale), so that a horizontal analysis is not eloquent. The vertical analysis is aimed at statistical correlations in order to explore their presence and intensity between the variables included in the model. We wanted to find out the correlations between different factors which influence the risks and whether these factors were strongly correlated to other factors.
Spearman’s rank correlation was used. The main variables used for the correlation analysis are the following: attitude, level of knowledge, experience, state’s implication, the level of PPA market, if the respondents have ever signed a PPA, the field of the company, the monthly energy consumption.
4. Results and Discussions
As we mentioned in the previous chapter, the analysis was carried out based on the questionnaire answered by 232 respondents, their profile being described according to the table below:

Table 1.
Respondent profile.
| Frequency | Percent | ||
| Parties | Buyer | 167 | 72.0 |
| Seller | 60 | 25.9 | |
| Other | 5 | 2.2 | |
| Level of knowledge | Very low | 75 | 32.3 |
| Low | 59 | 25.4 | |
| Medium | 74 | 31.9 | |
| High | 19 | 8.2 | |
| Very high | 5 | 2.2 | |
| Signing before PPA | Yes | 55 | 23.7 |
| No | 177 | 76.3 | |
| Monthly energy consumption | 0-50 MWh | 98 | 42.2 |
| 50-100 MWh | 59 | 25.4 | |
| 100-500 MWh | 64 | 27.6 | |
| >500 MWh | 11 | 4.7 |
Source: authors’ elaboration on sample data.
From the analysis of the Table 2, it can be seen that most of the respondents have the quality of buyer within the PPA with a percentage of 72%, while only 60 respondents have the quality of seller, with a total percentage of 25.9%. In terms of level of knowledge, it can be seen that the majority of respondents are people who have very low (32,3%), low (25,4%), medium (31,9%) level of knowledge, while the difference up to 100% is divided as follows: high level of knowledge, 8,2 % and very high only 2.2%. Regarding the aspects related to the situation of signing before PPAs, it can be observed that 55 (23,7%) respondents have signed before PPAs, while the rest of 177 (76,3%) haven’t entered by now in such contractual relations. Correlating the aspects indicated in points 2 and 3 in the table presented above, we can see that even if 10.5% of the respondents have so far signed a PPA, it can still be observed that almost half of the respondents (42,3%) have an average, high or very high level of knowledge, which shows a fear of entering into a PPA, on the one hand, but also an urgency on the part of the state to take the necessary measures to encourage the entry into such commercial relationships. Last but not least, the analysis of the respondents' profile must also be correlated with the monthly energy consumption, where it can be seen that compared to the companies represented by the respondents, it appears that they are small and medium industrial consumers, having a monthly consumption of less than 500 MWh and adding up a total percentage of 95.3%.
The rank and effect ratio are based on the highest percentage answer of each individual factor compared with the rest. For example, if for one factor we have an answer that collected 70% of the respondents and for another factor the highest percentage is 30%, from the global impact on PPAs the first factor has 70% and the second 30%.
The low level of development of these contracts can be seen from the analysis of the answers given by the respondents, the key factors analysed in this article having an impact on signing PPAs as shown in Table 3.
From the analysis of the percentages shown in same table no. 3 we can observe that the first place is equally occupied by the previous signing by the respondents of PPAs, respectively by the level of the PPAs market, which leads us to the obvious conclusion that both the signing of these contracts and their market level have a significant contribution to the development and promotion of PPAs. In second place, with a percentage of 16% is the attitude of the respondents towards PPAs. Analysing this percentage by referring to the results obtained and described in the previous chapter, we can see that the effect of this factor on the signing of PPAs is a beneficial one, the attitude of the respondents being favourable (65% of the buyers are in favour of such contracts) and open towards these contracts. The third place is occupied by the factor representing the involvement of the state, the percentage allocated to it being, as can be seen, 14%. Thus, it is clear that the level of state involvement plays an important role in the promotion and development of PPAs, being on the podium in the analysis of the impact that key factors play on the signing of these contracts. The other factors, even if they have an impact on signing a PPA, their effect is not a defining one, taking into consideration that 54% of the choice of signing a PPA is taken based on the first 3 factors.
Table 4.
The method of calculating the impact that the key factors have on the signing of the PPAs.
| Factor | Highest % | % of global impact (Tf) |
|---|---|---|
| Signing before PPAs | 76.3 | 19% |
| Level of PPA market | 75.4 | 19% |
| Attitude | 62.9 | 16% |
| State’s implication | 55.6 | 14% |
| Field of activity | 50 | 13% |
| Monthly consumption | 42.2 | 11% |
| Level of knowledge | 32.3 | 8% |
| Global Impact (Tf) | 394.7 | 100% |
Source: authors’ elaboration on sample data.
Additionally, it should be mentioned that the results of the questionnaire were analysed from two perspectives: the perspective of the buyer and the perspective of the seller and presented in the graphic illustrations in Figure 2, Figure 3, Figure 4, Figure 5 and Figure 6.
From the analysis of the diagram above, we can see that with regard to the level of knowledge between the two parties (buyer and seller), the values are quite similar: we are thus talking about a percentage of only 10% (in the case of the seller) who owns a high level of knowledge (7%) and very high (3%), respectively about a percentage of 10% in the case of the buyer divided slightly differently 8% - high level of knowledge and 2% - very high level of knowledge. At the opposite pole, we are talking about a lack of knowledge about PPA, where it is found that more than half of the interviewees have a low or very low level of knowledge: in the case of the seller, we have a total percentage of 57% (30% very low, 27% low ), so that in the case of the buyer, let's talk about a percentage of 60% divided in this way: 26% have a low level of knowledge, respectively 34% have a very low level of knowledge. All these results are somehow concerning, because a very low level of knowledge can be proven both in terms of the buyer and in terms of the seller, even though according to Lei&Sandborn (2018), PPAs have gone from strength to strength, because at the end of 2014, the total number of farms that signed PPA reached 363 and the total capacity 32,641MW. Analysing all the above-mentioned aspects, we can observe that in Romania there is a very low level of knowledge regarding the existence of the PPA, regardless of whether we are talking about buyers or sellers. Thus, we can ask ourselves how a field can be developed, when very few people who work within it know what PPA means or at least have heard of it, even less the persons who do not have information and who are not involved in the area of energy? On the other hand, the low and very low level of knowledge, where more than half of the respondents do not have information and do not know about the existence of the PPA, must be analysed by comparison with the involvement of the state, the only one able to make all efforts to find out the level at which the PPA is located in Romania, respectively to find out its degree of development, being, at the same time, the only one that has the opportunity to take all the necessary measures to help develop and subsequently implement this type of contract.
Figure 5.
The attitude. Source: authors’ elaboration on sample data.
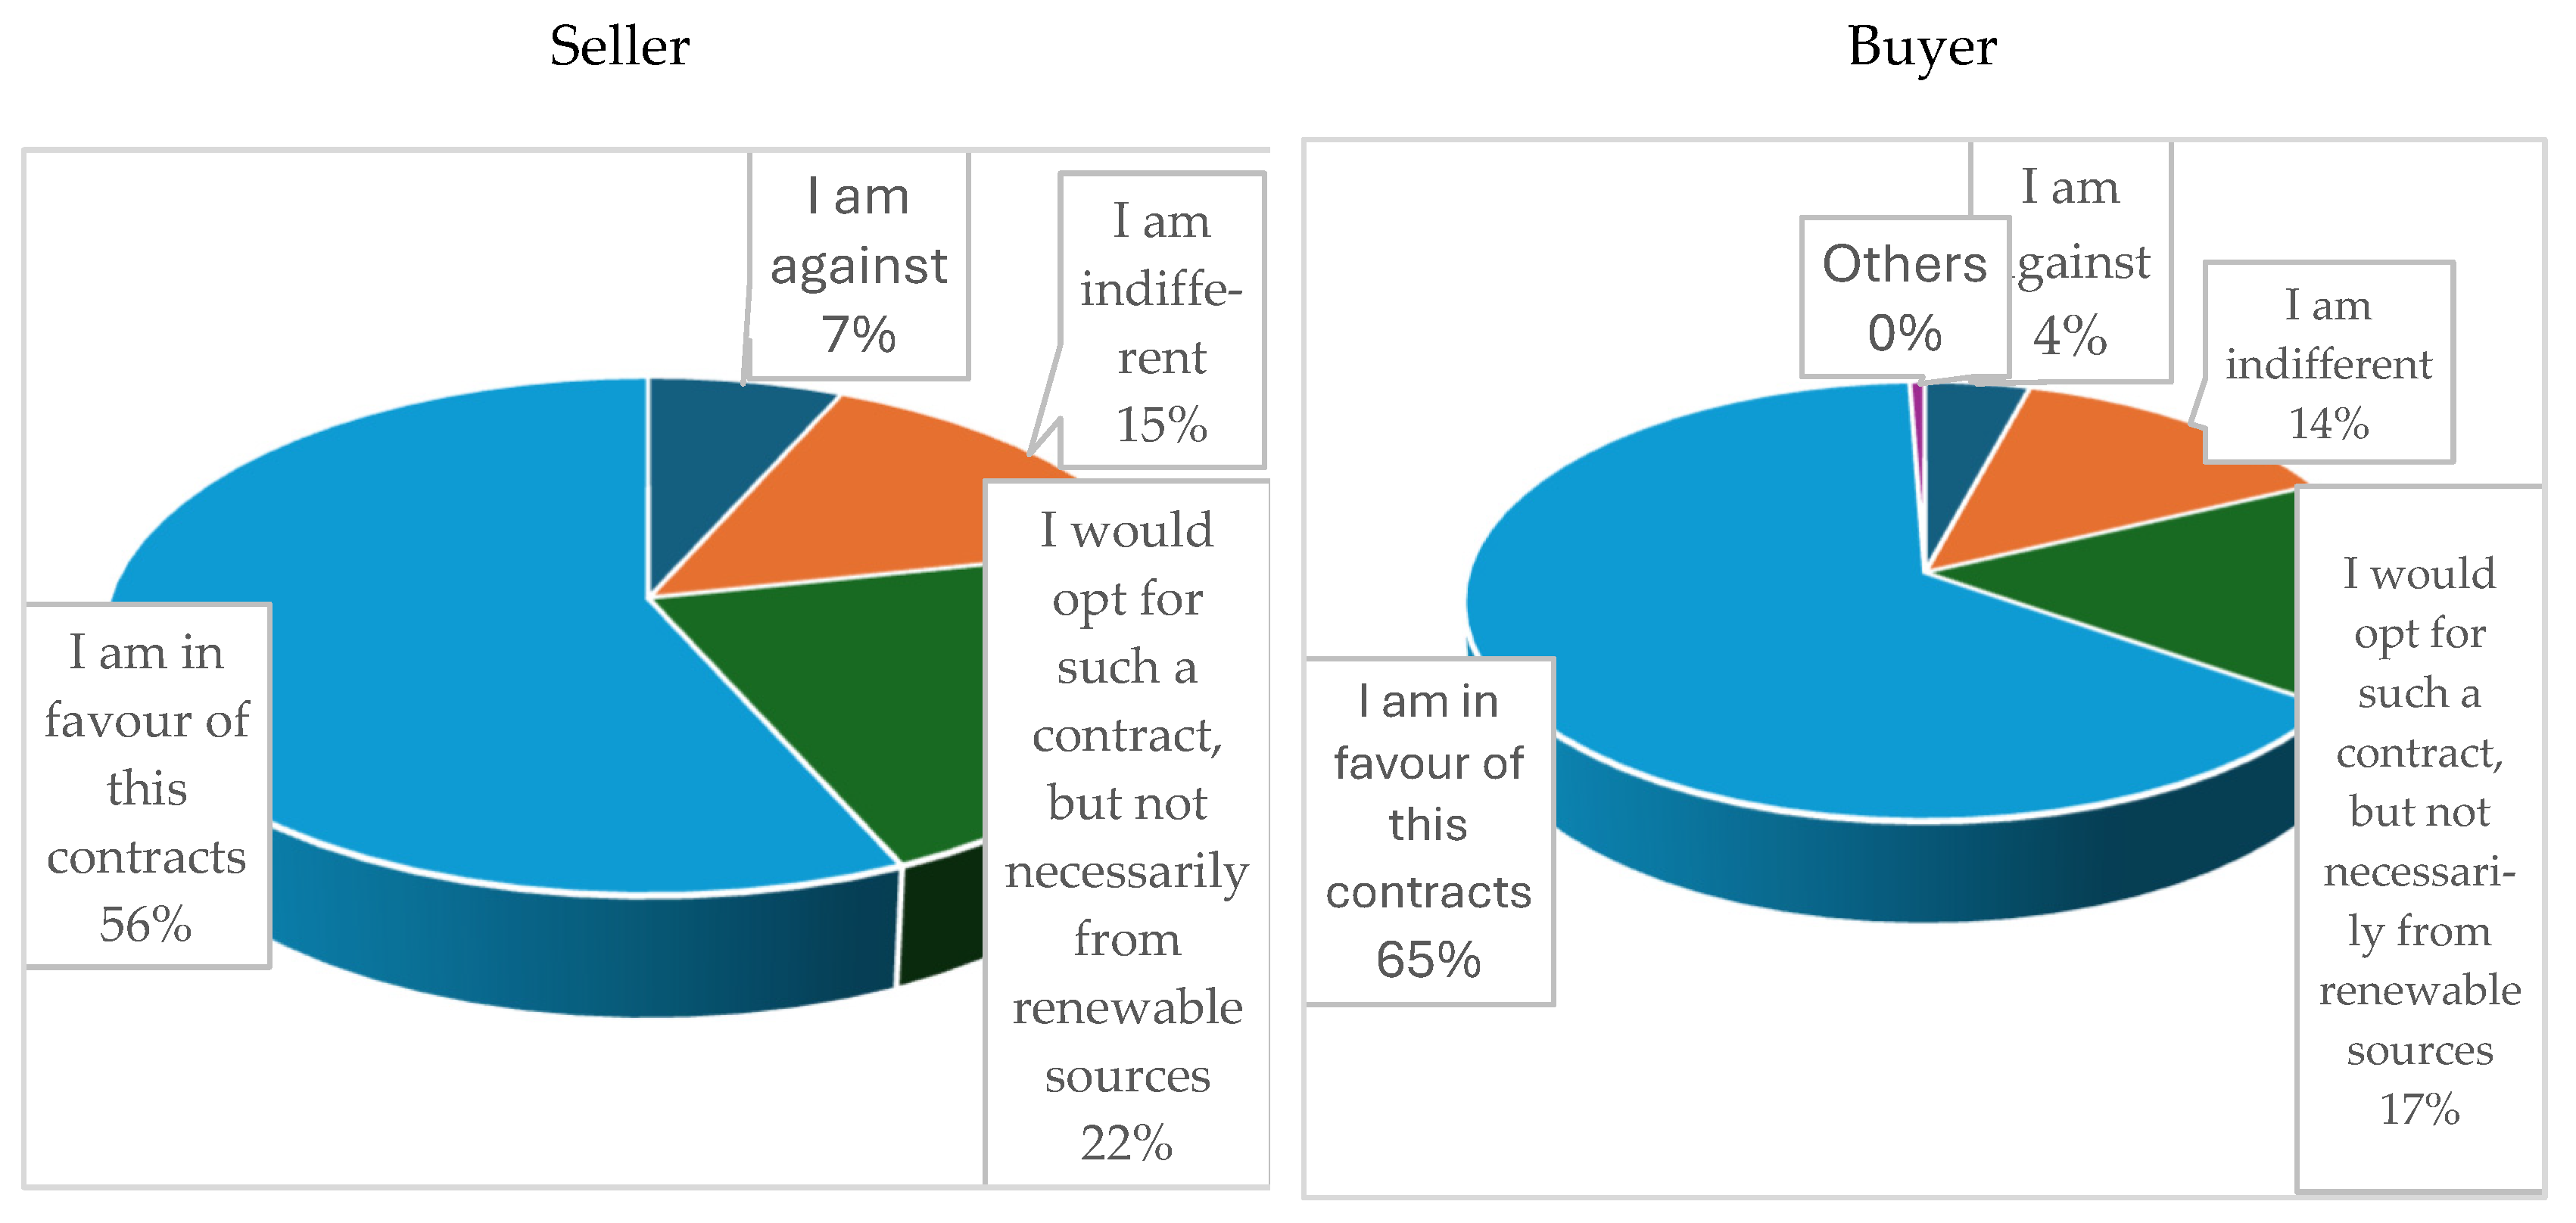
Regarding the attitude, we can see that the results are some gratifying, more than half of the respondents being in favour of concluding such contracts. Thus, we are talking about a percentage of 56% in the case of sellers, respectively about a percentage of 65% in the case of buyers, the latter percentage proving, without a doubt, that the respondents who are buyers have a much more open attitude towards for the signing of the PPAs, respectively for the purchase of energy from renewable energy sources. On the 2nd place are the respondents who consider that they would opt for such a contract, but the purchased energy does not necessarily have to be from renewable energy sources, which means that they did not accurately understand the true role and true meaning of a PPA as an instrument that enable the meet of the related sustainability goals. Thus, although both sides have a positive attitude regarding the conclusion of PPAs, we can see that this attitude is based on the misunderstanding of the true role of this mechanism, which is a useful tool for the promotion and development of the use of energy from renewable sources and not just a simple contract through which electricity is purchased.
Regarding the above-mentioned aspects, the experts found the distribution interesting, showing on one hand the importance of PPAs, and on the other hand, the urgency on taking the needed actions towards the developing of such contracts. But now a question mark arises: what made the respondents have such a positive attitude towards PPAs, as long as we can see from the answers revealed in Figure 2 that the level of knowledge among the respondents is low, more than half of them having less knowledge of PPAs? But regardless of the reasons that were the basis of the answers, the situation is a gratifying one, and the fact that such a large number of the interviewed people consider these contracts to be beneficial can only be encouraging that in the near future they can even be implemented.
Figure 6.
State’s implication. Source: authors’ elaboration on sample data
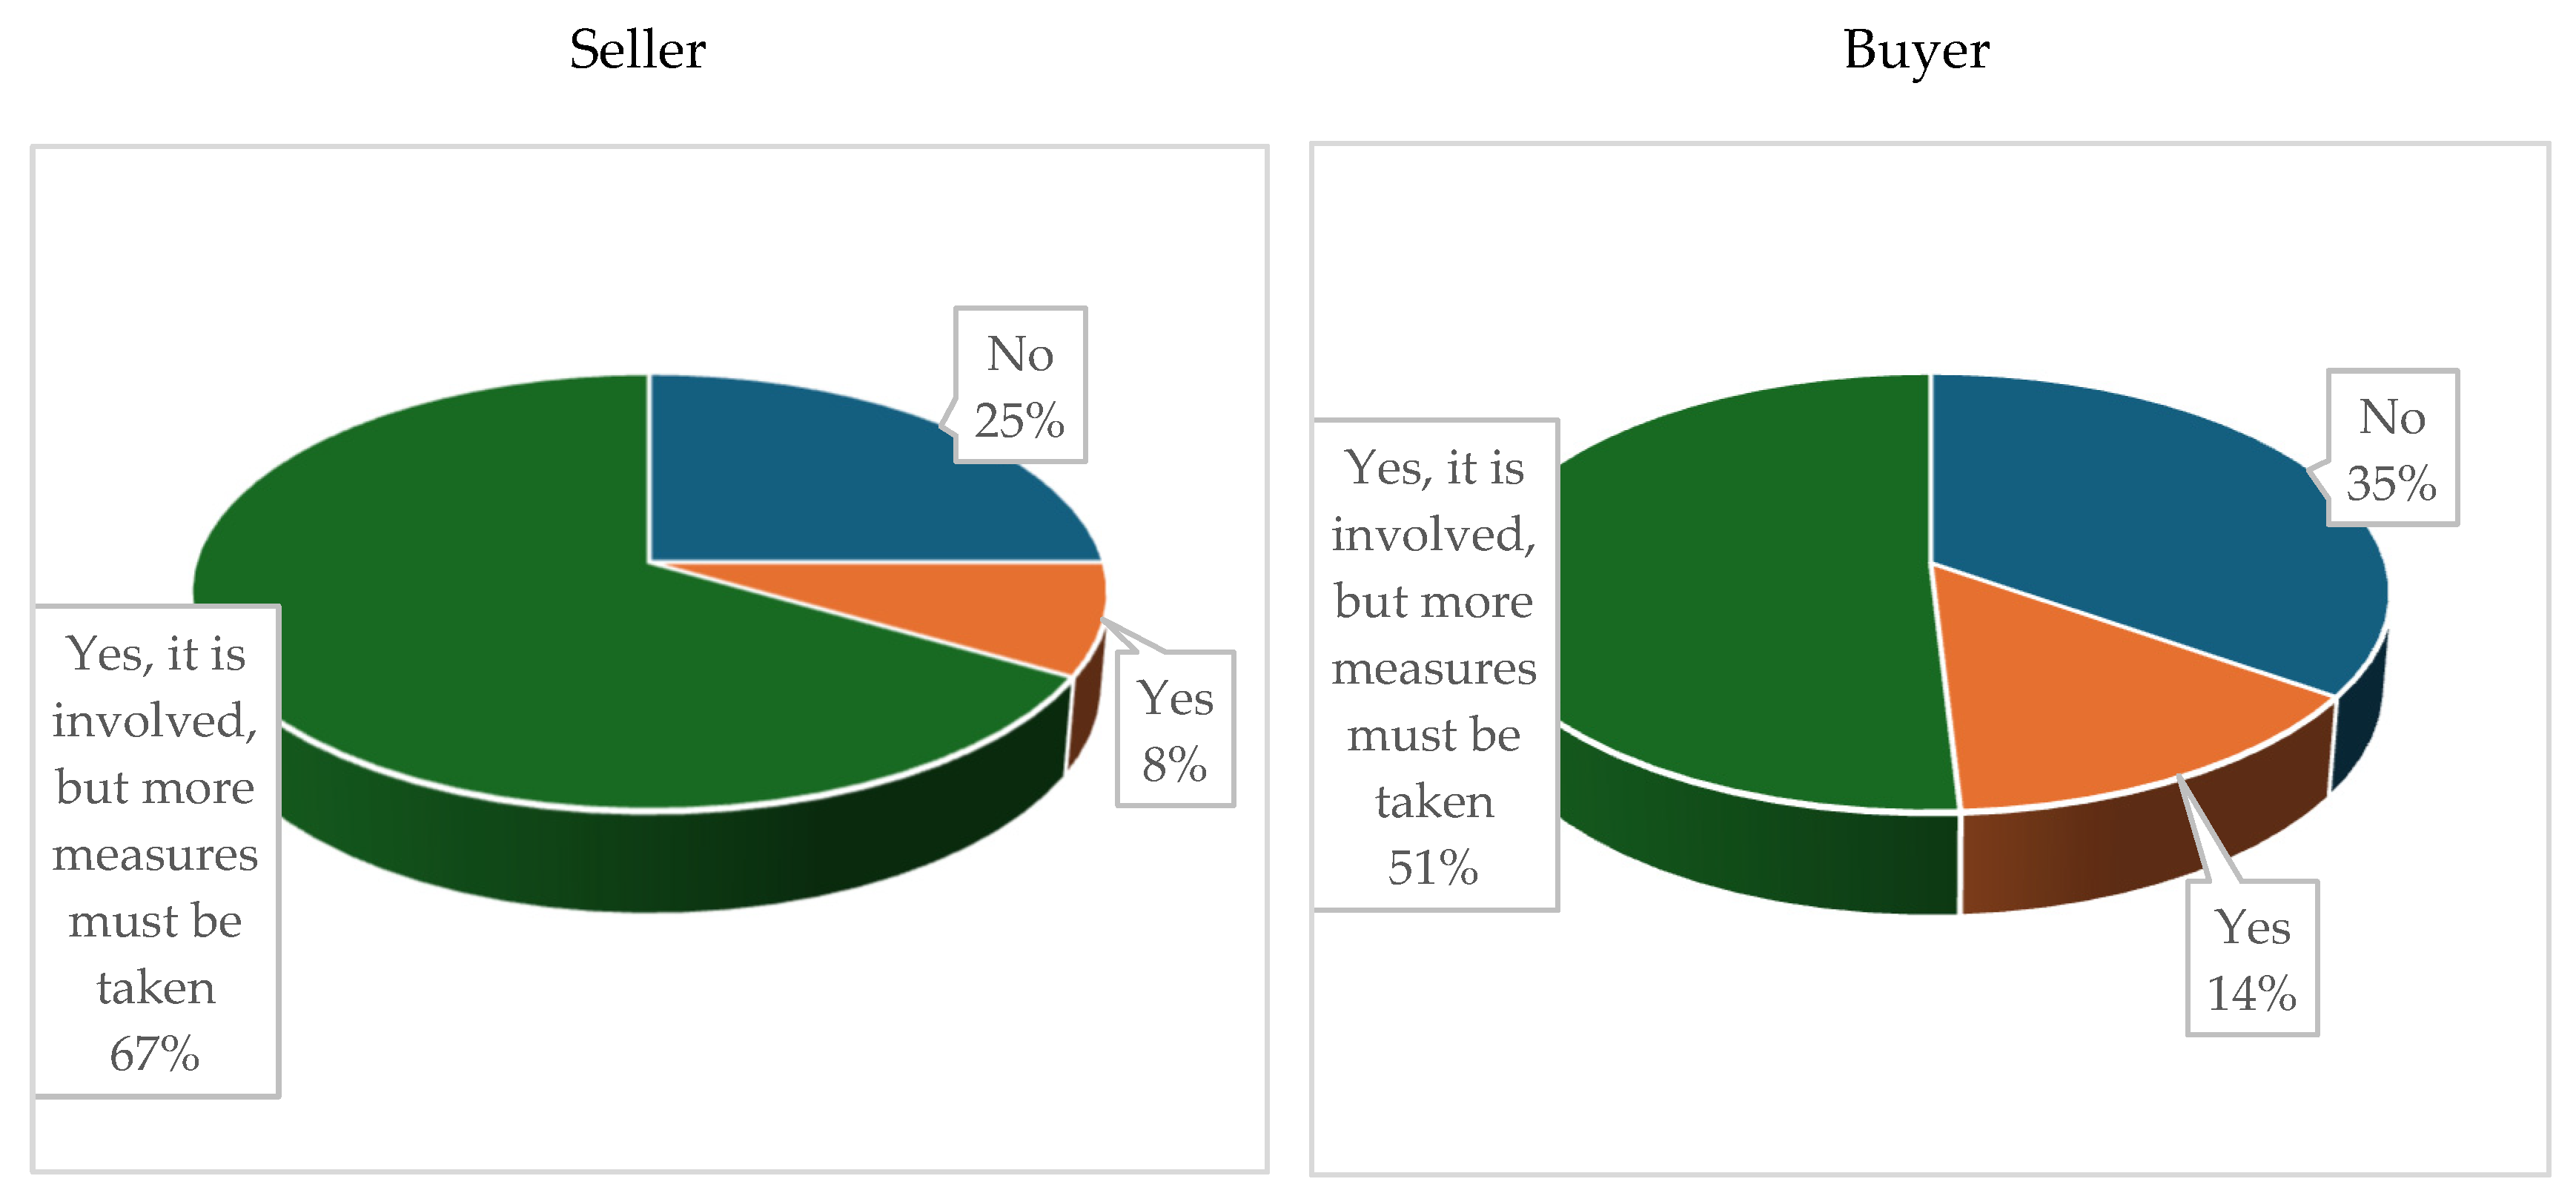
According to the respondents, the state's level of involvement is visible, but it is not sufficient, and it is clearly necessary to take more measures to promote and develop this mechanism. Comparatively analysing the results both in terms of buyers and sellers, we can find that the percentage in terms of the second category is much higher, 67% of them considering that although the involvement of the state is positive, it is it is clear that there is a need to create more facilities to support renewable energy producers. According to the opinion of experts these results should be correlated with the results given to the attitude question (Figure 5), from where can be seen that although the respondents are in favour of these contracts and they have a positive attitude towards them, the involvement of the state is at the beginner level. As far as we can see, even if 76% of the respondents (from the seller category), respectively 51% from (the buyer category) consider that the state is involved, but this involvement is not sufficient, needing much more support and much more allocation of time and resources, we are, however, talking about a percentage of 25% (seller) and 35% (buyer) - quite high percentages - which show that the involvement of the state is very low. Thus, corroborating the result mentioned above, with the low and very low level of knowledge of the respondents, we can clearly state that the measures taken at the state level are insufficient, the more involvement of the legislator being not only necessary, but also urgent, this, of course, if the development of the PPA mechanism is desired, which represents a step forward towards the transition to green energy. As a conclusion from these results, we can say that the state, although it took certain measures, besides the fact that they were not sufficient (and here we refer to both categories), they were also too few from the moment. It can be seen that our conclusion is also in line with the opinion of Ben Belgacem et al (2023), who consider that more regulation is needed in the field of renewable energy, as there are many financial constraints for developing countries. Thus, governments need to encourage the use of renewable energy resources and ensure that there are regulations in place to guarantee that the transition to green energy is done in a responsible and sustainable manner.
Figure 7.
The level of PPA market in Romania. Source: authors’ elaboration on sample data
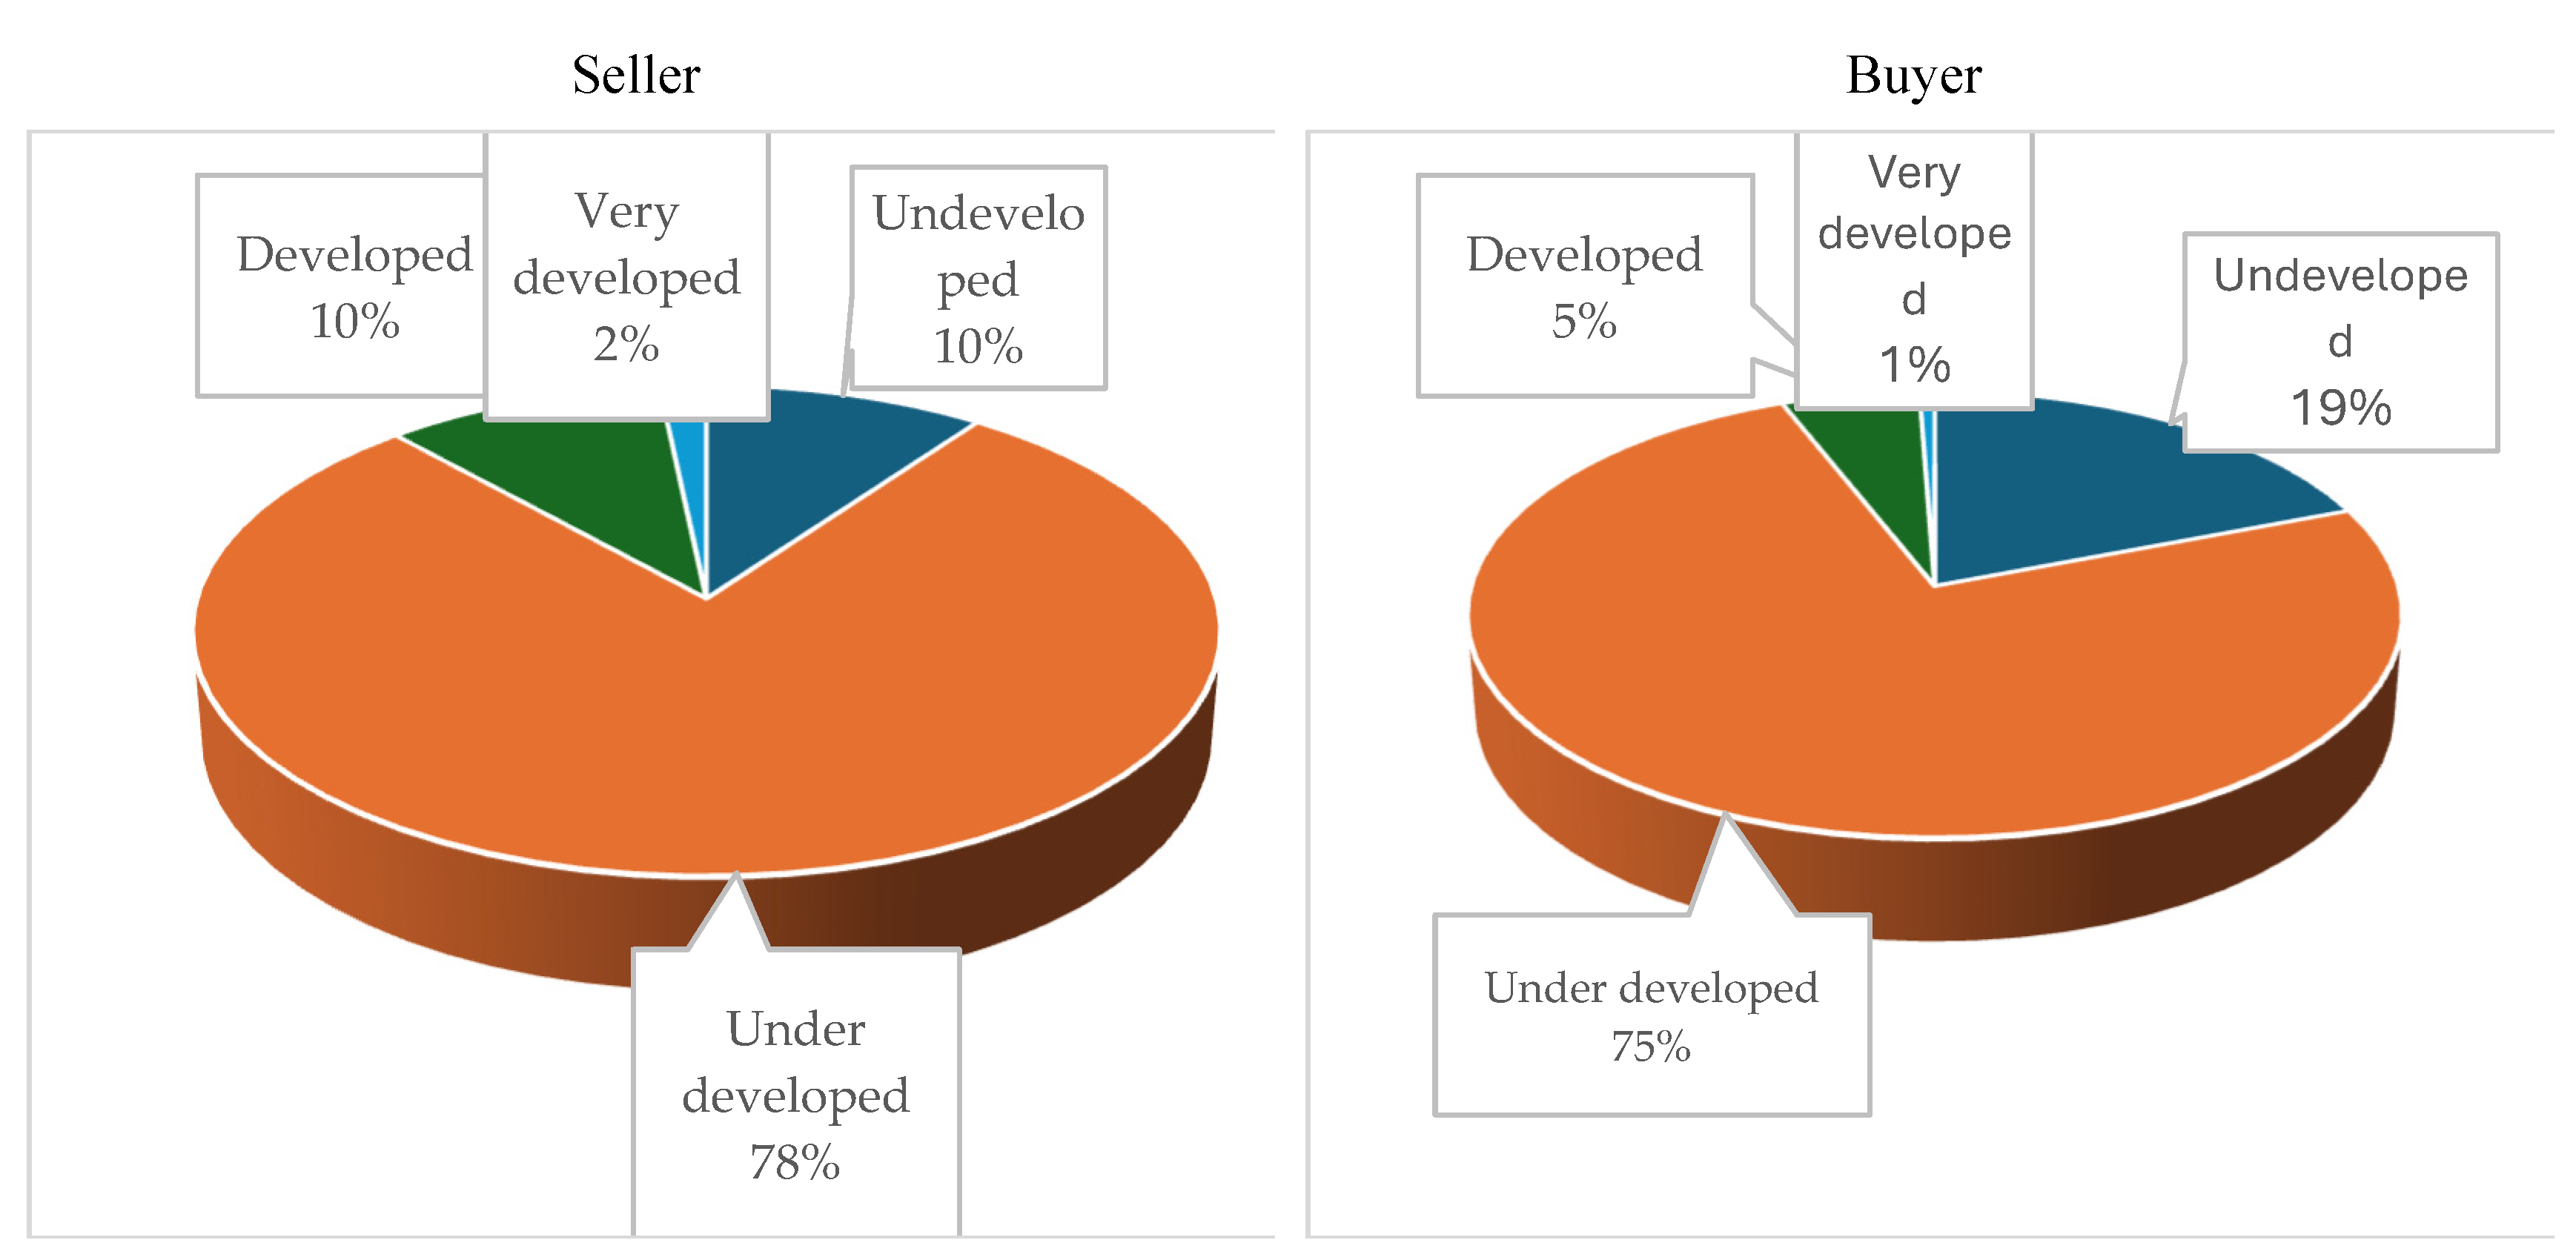
The results show, in an almost overwhelming majority, that the level of development of PPAs in Romania is very low, 78% of the respondents who have the status of sellers, respectively 78% of the respondents who have the status of buyers, having this opinion. Moreover, if we add the percentage of those who consider the market to be undeveloped (10% in the case of sellers, respectively 19% in the case of buyers), we can see that almost unanimously we are talking about a very low level of the PPA market in Romania, which draws attention to the urgent need to take the necessary measures regarding the impetuous obligation of the state to proceed with the promotion and development of this mechanism on the territory of our country. Noting the very small percentages regarding the respondents' appreciation of the existence of a developed and highly developed market (12% in the case of sellers, respectively 6% in the case of buyers) only reinforces the idea presented in the previous paragraph regarding the urgency of taking measures at the state level that to provide for the creation and development of as many facilities as possible granted to both categories of parties in a PPA. At the same time, the adoption of new technologies, including the increase in productivity, will know an efficient increase. (Nowak, Kokocinska, 2024). In this moment, a short comparison between attitude and the level of PPA market must be made: So, regarding the attitude, even if we can see that this is a positive one, more than half of the respondents from both the buyer's side (65%) and the seller's side (56%) being open to concluding PPAs, this situation must be analysed in relation to the development level of the PPAs market, where, as we can see, the situation is different, the results being weaker. In this sense, it can be observed that 75% of the respondents who have the quality of buyers and 78% of the respondents who have the quality of sellers consider that the market is an undeveloped market, while 10% of the sellers and 19% of the buyers appreciate that the level of the market is an underdeveloped one, which means a total percentage of 88% (seller) and 96% (buyer) who are of the opinion that the PPA market in Romania is a poorly developed one. A fast conclusion that can be drawn from this analysis demonstrates the urgency and necessity of the measures to be taken by the state. Despite the information presented above, in this present moment we can see an attempt to recover the energy market in Romania, which appears to be a competitive and dynamic one and although it does not appear to be a mature market like the other western European markets, it is evolving quickly and gives a sign of increased competitiveness (SeeNews, 2023). As far as it is known, PPAs are an effective and viable tool that, according to specialized authors, offer long-term sustainability and safety. Even though according to PWC (2016) and Yashar (2021) for buyers the insecurity of the amount of energy produced by renewable energy producers can bring both economic and technological difficulty. Also Taghizadeh - Hesary et al. (2021) proved that PPAs represents a sustainable and green tool in that they offer long- term security and investment financing opportunity. In accordance with the opinion of Taghizadeh - Hesary et al. (2021) mentioned above, there are also the assessments of Mendicino et. al. (2019) according to which PPAs have the possibility to increase the growth of renewables.This is also the reason why the corporate PPA market (in which large, industrial, electricity-consuming companies increasingly wish to conclude contracts with energy producers from renewable energy sources) is increasingly developed at the European level.
Table 5.
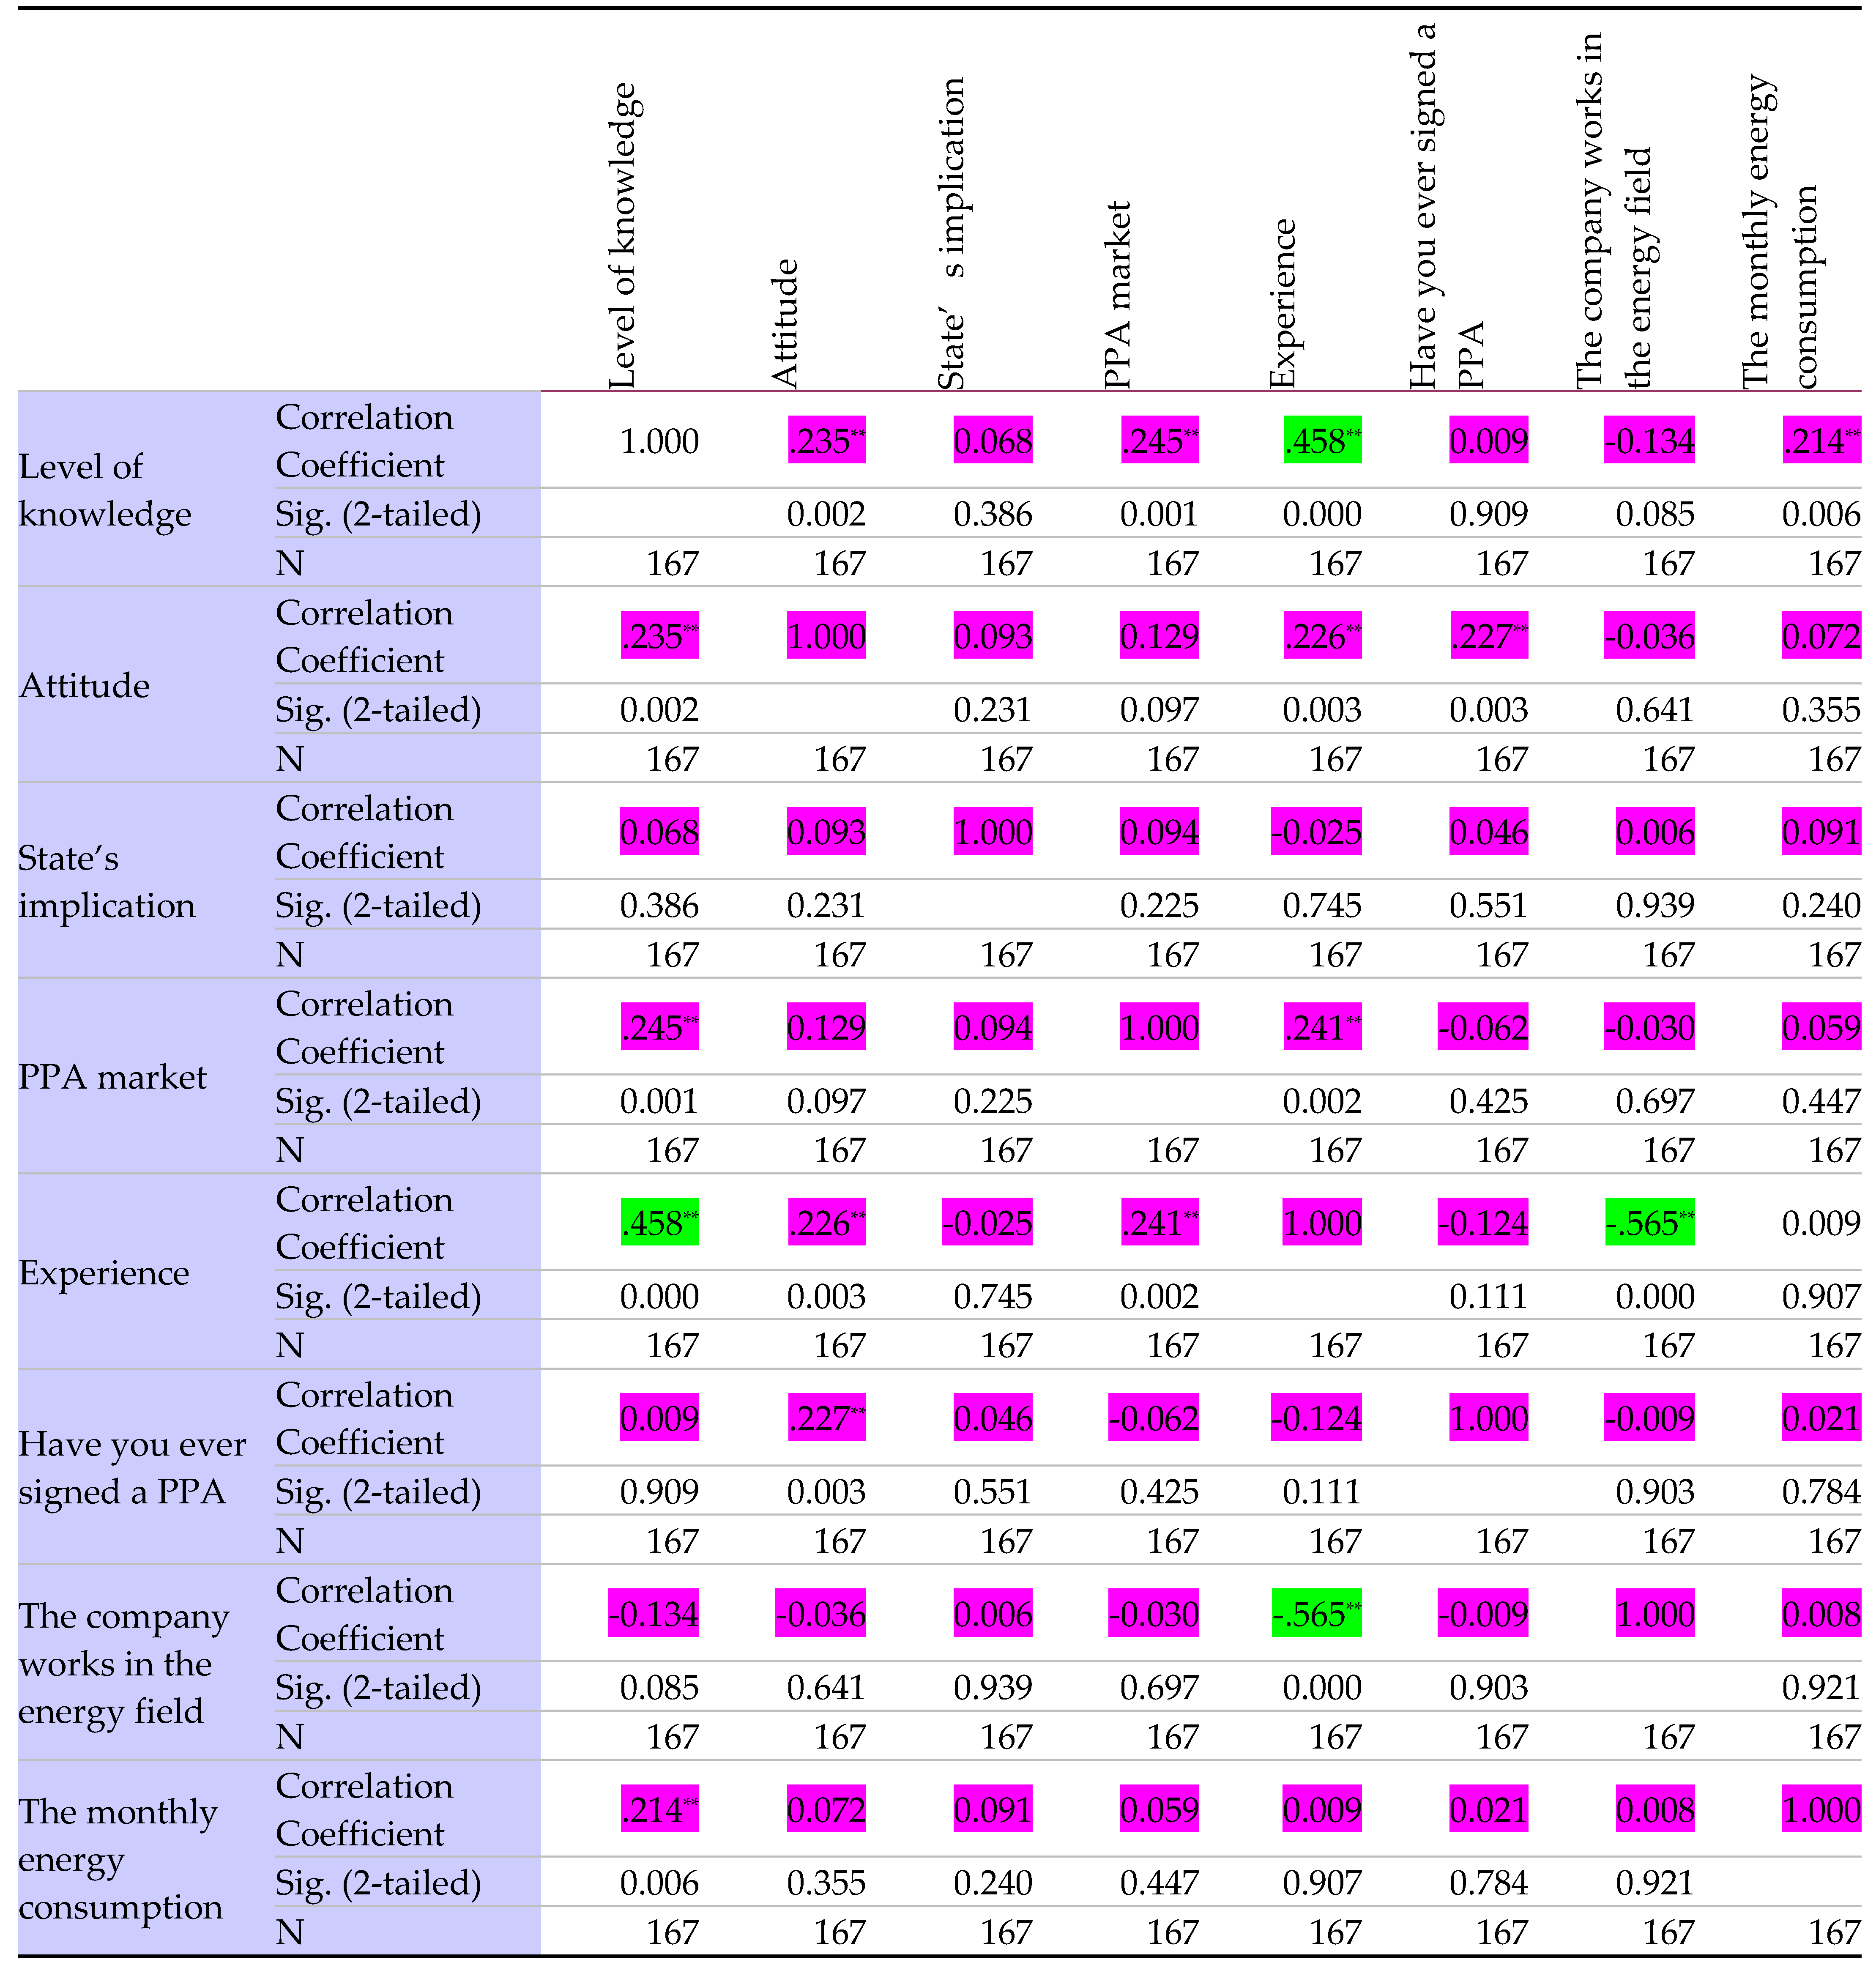
Buyer’s Correlation matrix (Spearman’s rho correlation).
Source: authors’ elaboration on sample data.
Regarding the buyer, Spearman’s rank correlations, as illustrated in Table 2, show that the higher the level of knowledge, the greater the respondents' experience in the field of signing and implementing PPAs. Results revealed a statistically relatively strong relationship between the level of knowledge and the experience that respondents have regarding the PPAs field (correlation coefficient 0.458). This result proves the importance of the level of knowledge being as high as possible: thus, the higher the level of knowledge regarding PPA, that means that the more the respondents are involved or the more information is brought to their attention regarding this type of contracts, thus their experience increases, which inevitably implies a development of this field. This emphasizes that the first hypothesis is partially correct as long as we can see a correlation between the experience and the level of knowledge, but the second part of the first hypothesis proved to be false, like shown below:
Source: authors’ elaboration on sample data.
| ANOVAa | ||||||
| Model | Sum of Squares | df | Mean Square | F | Sig. | |
| 1 | Regression | 9.863 | 2 | 4.931 | 6.671 | .002b |
| Residual | 121.227 | 164 | .739 | |||
| Total | 131.090 | 166 | ||||
| 2 | Regression | 8.498 | 1 | 8.498 | 11.438 | <.001c |
| Residual | 122.592 | 165 | .743 | |||
| Total | 131.090 | 166 | ||||
| a. Dependent Variable: attitude | ||||||
| b. Predictors: (Constant), experience, level of knowledge | ||||||
| c. Predictors: (Constant), level of knowledge | ||||||
| Coefficientsa | ||||||||
| Model | Unstandardized Coefficients | Standardized Coefficients | t | Sig. | 95.0% Confidence Interval for B | |||
| B | Std. Error | Beta | Lower Bound | Upper Bound | ||||
| 1 | (Constant) | 2.883 | .166 | 17.386 | <.001 | 2.555 | 3.210 | |
| Level of knowledge | .174 | .071 | .205 | 2.460 | .015 | .034 | .314 | |
| Experience | .087 | .064 | .113 | 1.359 | .176 | -.039 | .212 | |
| 2 | (Constant) | 2.967 | .154 | 19.259 | <.001 | 2.663 | 3.272 | |
| Level of knowledge | .216 | .064 | .255 | 3.382 | <.001 | .090 | .342 | |
| a. Dependent Variable: attitude Source: authors’ elaboration on sample data | ||||||||
At the same time, we can see a significant correlation between the field in which the company works and the experience (0.565). This demonstrates that working in the energy field or having some responsibilities involving energy field has a major impact on the experience of the respondents and therefore the possibility of entering or not entering into contractual relations within the PPA.
Regarding the involvement of the state, it is to be noticed that there is no clear correlation between it and the other analysed factors which shows that the hypothesis 2 is not confirmed.
The analysis of the correlations in SPSS through the Spearman method, also revealed that there is no correlation between the attitude towards PPAs and the level of knowledge (correlation coefficient 0.235) and between the monthly energy consume and the attitude, where the correlation coefficient is 0.072, which leads us to the idea that hypothesis 4 is false.
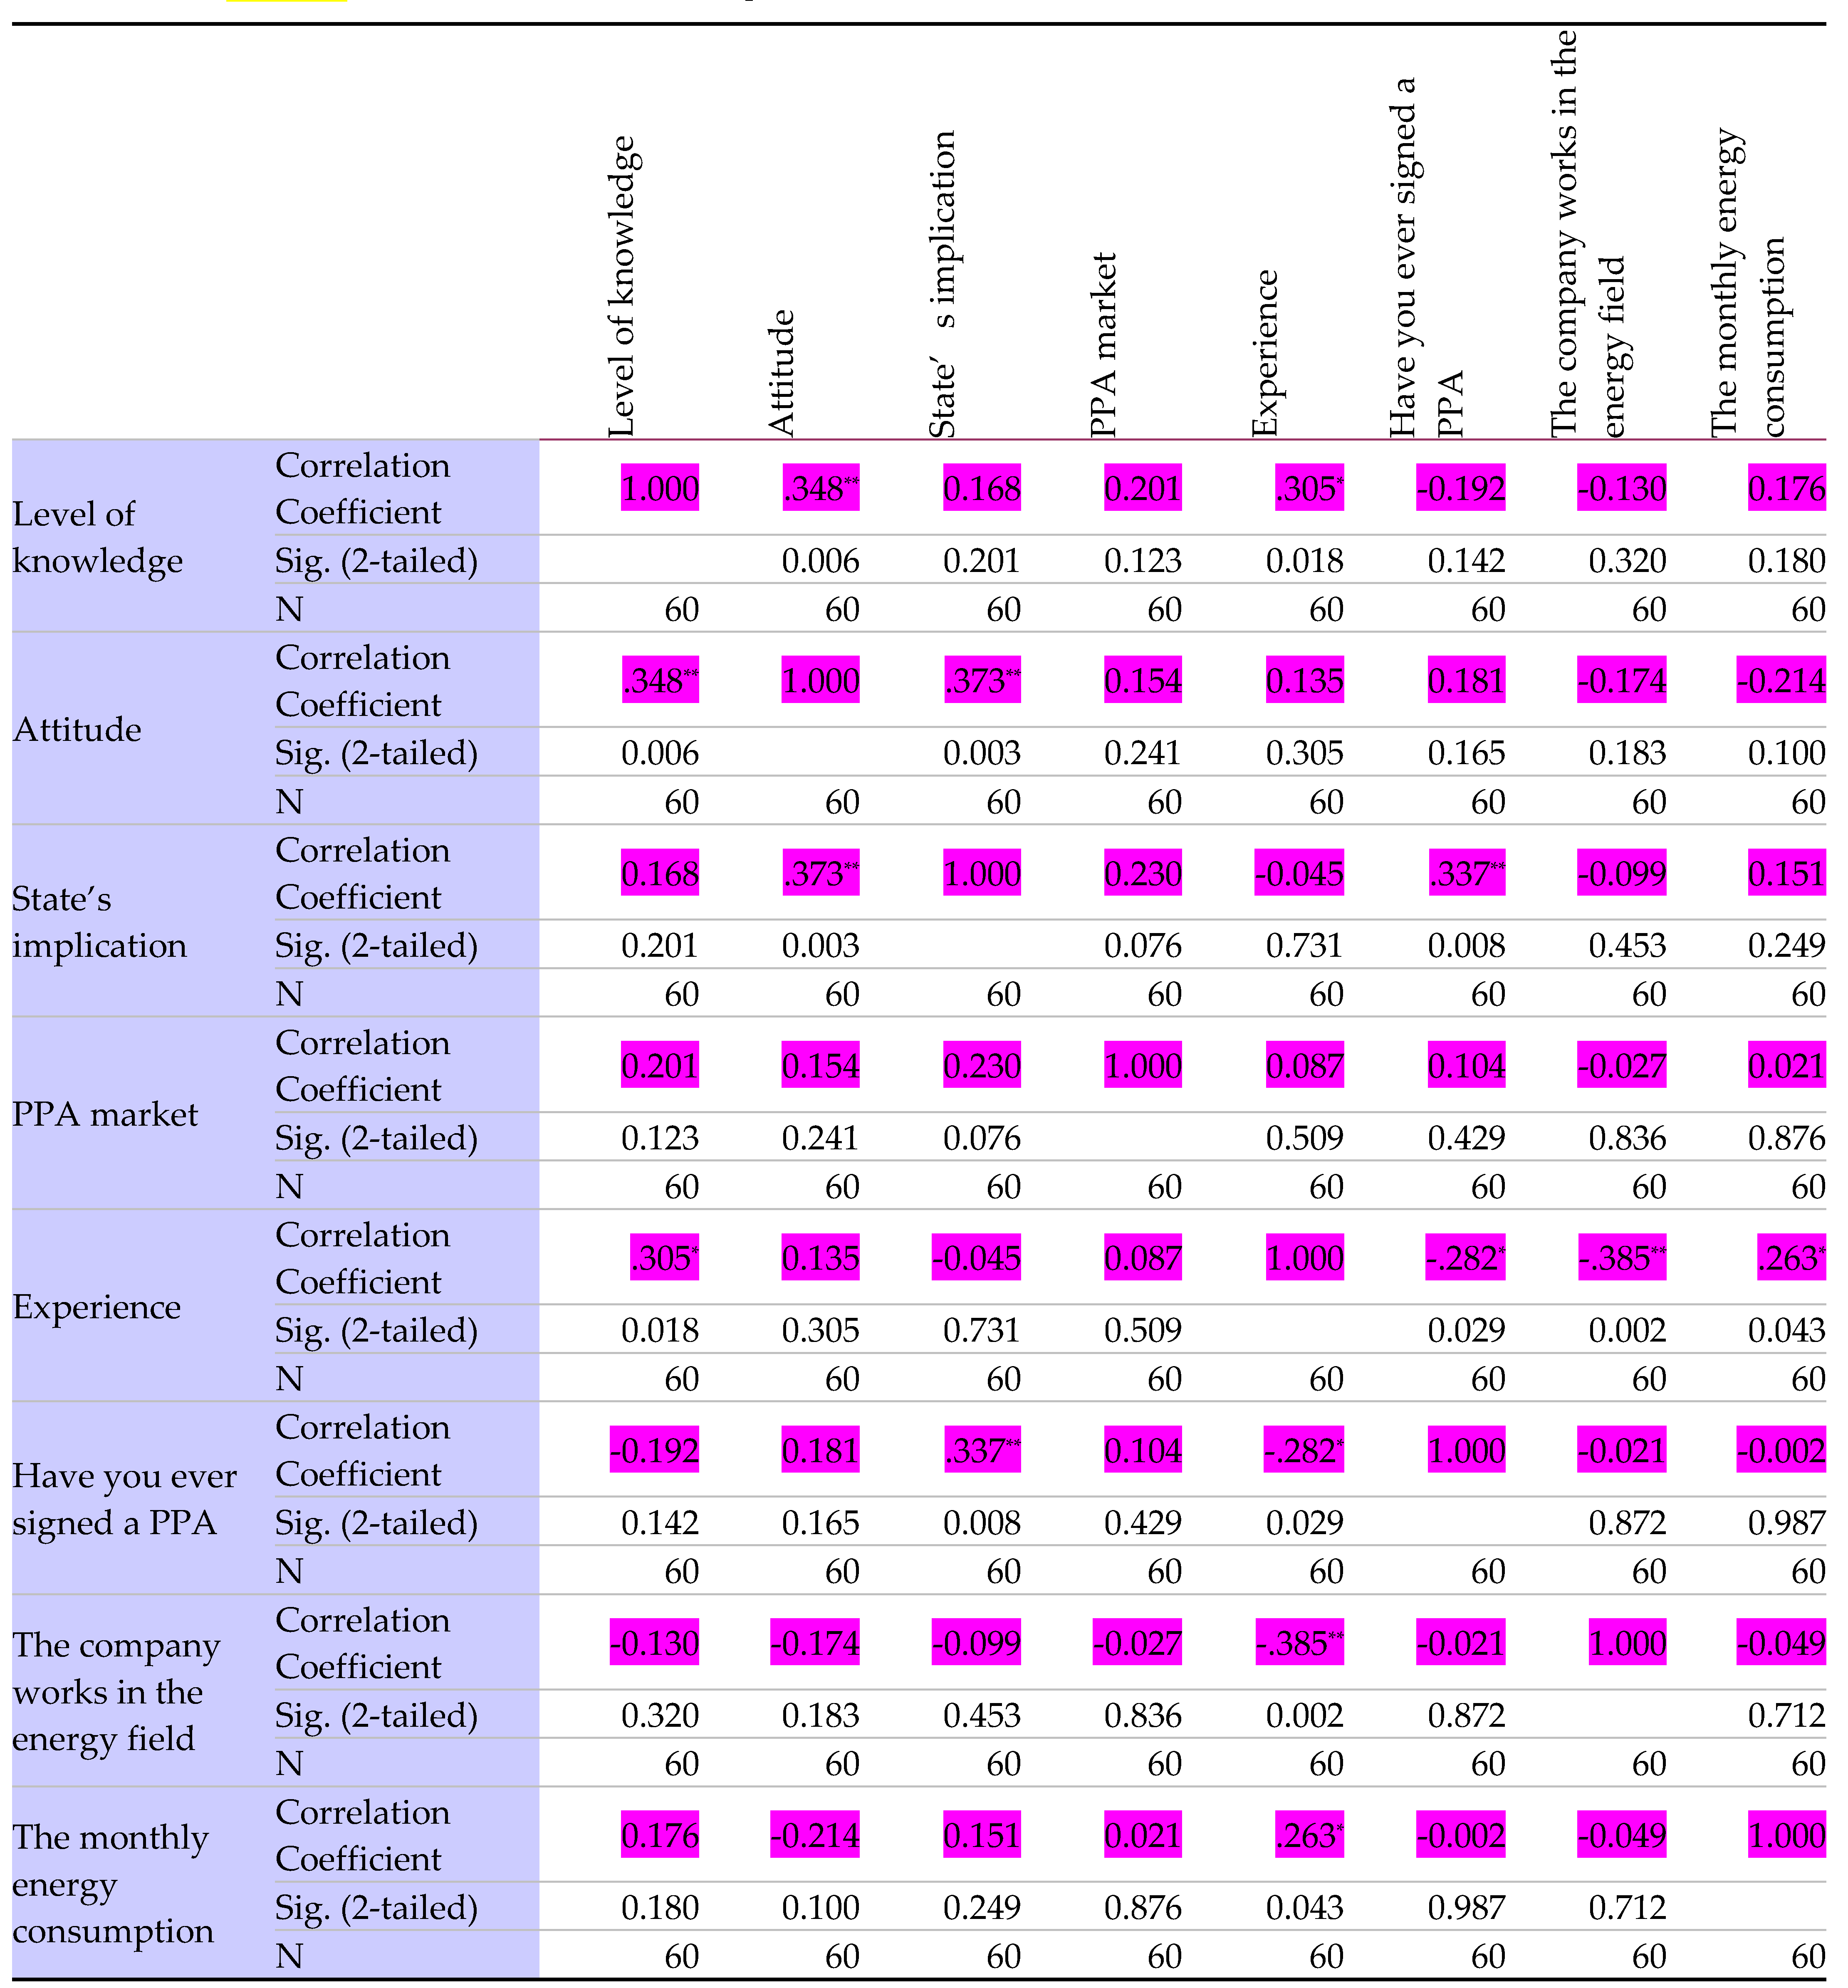
Regarding the Spearman’s rho correlations from the seller’s point of view, when we analyse the results showed in the Table 6, we can definitely see that there is no correlation between the variables taken into consideration, the correlation coefficient in all the cases being very low, situation that does nothing but prove that all our hypotheses are not confirmed.
Nevertheless, regarding the first hypothesis it is to be noticed that there is a low correlation between experience and level of knowledge (0.305) and also between the level of knowledge and attitude (0.348), which proves that the first part of Hypothesis is false. But, taking into consideration that more than half (56%) of the respondents are willing to sign PPAs, we can assume that even if the level of knowledge nor experience are at low levels, sellers can see the benefits of signing PPAs. To check the second part of the Hypothesis, multiple linear Regression was performed using SPSS. Results are presented below:
Source: authors’ elaboration on sample data.
| ANOVAa | ||||||
| Model | Sum of Squares | df | Mean Square | F | Sig. | |
| 1 | Regression | 6.814 | 2 | 3.407 | 4.100 | .022b |
| Residual | 47.369 | 57 | .831 | |||
| Total | 54.183 | 59 | ||||
| 2 | Regression | 6.803 | 1 | 6.803 | 8.328 | .005c |
| Residual | 47.380 | 58 | .817 | |||
| Total | 54.183 | 59 | ||||
| a. Dependent Variable: attitude | ||||||
| b. Predictors: (Constant), experience, level of knowledge | ||||||
| c. Predictors: (Constant), level of knowledge | ||||||
| Coefficientsa | ||||||||
| Model | Unstandardized Coefficients | Standardized Coefficients | t | Sig. | 95.0% Confidence Interval for B | |||
| B | Std. Error | Beta | Lower Bound | Upper Bound | ||||
| 1 | (Constant) | 2.582 | .316 | 8.177 | <.001 | 1.950 | 3.214 | |
| Level of knowledge | .321 | .118 | .359 | 2.732 | .008 | .086 | .557 | |
| Experience | -.012 | .106 | -.015 | -.113 | .911 | -.223 | .199 | |
| 2 | (Constant) | 2.565 | .275 | 9.330 | <.001 | 2.015 | 3.115 | |
| Level of knowledge | .317 | .110 | .354 | 2.886 | .005 | .097 | .537 | |
| a. Dependent Variable: attitude | ||||||||
Analysing the results of regression, even if Sig. has a good value (under 0.05) we can see that this regression is applicable to a small number of respondents, Residuals meaning 47.38 out of 54.183 of Sum of Squares.
Regarding the second hypothesis, as we have showed before, it can be considered false, both form the buyer’s and seller’s point of view, by analysing correlations between development of PPA market and involvement of State, where the coefficient is 0.094 for buyer and 0.230 for seller. From our point of view, this can be interpreted in two ways:
- -
- There are other factors, from private sector, that affects the PPA market, which can be easily explained by the fact that when we are talking about energy from renewable resources the most of energy is produced by private sector (except Hydro).
- -
- PPA Market in Romania is very low developed (proved also by Figure 4) so the respondents cannot find the best way to increase the development, putting this situation partially on the State’s shoulders, asking for more support from its side (67% for seller and 51% for buyer).
The third hypothesis will have a common analysis for both the buyer and the seller and to prove this using SPSS a simple linear regression was performed taking Experience as dependent variable and Parties as independent variable. The result is presented below:
Source: authors’ elaboration on sample data.
| Model Summary | |||||||||
| Model | R | R Square | Adjusted R Square | Std. Error of the Estimate | Change Statistics | ||||
| R Square Change | F Change | df1 | df2 | Sig. F Change | |||||
| 1 | .137a | .019 | .015 | 1.168 | .019 | 4.425 | 1 | 230 | .037 |
| a. Predictors: (Constant), Parties | |||||||||
| Correlations | |||
| parties | experience | ||
| Parties | Pearson Correlation | 1 | .137* |
| Sig. (2-tailed) | .037 | ||
| N | 232 | 232 | |
| Experience | Pearson Correlation | .137* | 1 |
| Sig. (2-tailed) | .037 | ||
| N | 232 | 232 | |
| *. Correlation is significant at the 0.05 level (2-tailed). | |||
Nonparametric Correlations
Source: authors’ elaboration on sample data.
| Correlations | ||||
| Parties | Experience | |||
| Kendall's tau | Parties | Correlation Coefficient | 1.000 | .119* |
| Sig. (2-tailed) | . | .047 | ||
| N | 232 | 232 | ||
| Experience | Correlation Coefficient | .119* | 1.000 | |
| Sig. (2-tailed) | .047 | . | ||
| N | 232 | 232 | ||
| Spearman's rho | Parties | Correlation Coefficient | 1.000 | .131* |
| Sig. (2-tailed) | . | .047 | ||
| N | 232 | 232 | ||
| Experience | Correlation Coefficient | .131* | 1.000 | |
| Sig. (2-tailed) | .047 | . | ||
| N | 232 | 232 | ||
| *. Correlation is significant at the 0.05 level (2-tailed). | ||||
Looking at Model Summary of this regression and also correlations matrix performed using Parametric (Pearson) and nonparametric (Kendall’s tau and Speraman’s rho) bivariate correlations, it is obvious that there is no connection between Experience and Party, so we can say that Hypothesis 3 is confirmed. Sadly, one of the conclusions of this analysis can be that both parties present in Romanian PPA Market have low interest on PPA, so that the Experience is based on individuals, not Companies/Parties.
Although the last hypothesis is not confirmed there being no correlation between monthly consume and attitude where the correlation coefficient is 0.214, taking into consideration that the attitude is in the favour of PPAs (more than 55% in both cases according to Figure 2) we can conclude that PPAs are beneficial for all parties, independent of monthly consume.
5. Conclusions
This study has investigated the main factors which help or prevent the promotion and development of PPAs on the road to climate neutrality and meeting the related sustainability goals. Entering into contractual relations within a PPA depends very much on the measures that will be taken, especially at the national level, for the development and implementation of PPAs.
The research results indicate that at the moment there is still no clear understanding of the PPA mechanism as an instrument for achieving climate neutrality and meeting the related sustainability goals. The Spearman correlations showed that there are no correlations between the level of knowledge, attitude, monthly energy consumption, all analysed from the buyer's and from the seller's point of view.
Another aspect that emerges from the results obtained is that although there is the intention to enter into contractual relations within a PPA, there is no legal framework that allows the start of these relations, there are no legal measures to facilitate this, the procedure is a heavy and unattractive one, many respondents are afraid to sign a PPA, because they do not master this mechanism very well, they do not know what to expect from such a contract and, therefore, refuse to sign a PPA. According to Stanitsas and Kirytopoulos, 2023, the utilities had to develop complex procedures to adapt to an increasing proportion of fluctuating renewable energy costs. On the other hand, corporates are more willing in signing long-term PPAs as renewables become the main energy technology for large energy corporations and as new renewable energy suppliers enter the market. It is essential that they are aware of the risks they may be exposing themselves to. However, it should not be forgotten that regardless of the industry in which the off-taker operates, the creation/development of an appropriate project from the point of view of sustainability can be considered, which means an initial planning, which must be analysed first in turn the impact on the environment, respectively on the resources used. This is the moment when determining the sources of energy used, but also how to reduce electricity consumption are a priority.
But in Romania to build a sustainable PPA market, a fast development of economical/political environments in order to create a solid basis of a long term PPA development, as well as an increasing clean energy production are needed. As seen before, this would be not enough without a social development which involves implementing training courses, conferences and programs to show and explain the benefits that PPA can produce to the clean energy production, such as decarbonisation, attracting investments in clean energy, lower prices.
A criterion to demonstrate the sustainability of PPAs is the long-term planning which plays a major role in increasing the level of knowledge and a positive attitude of people towards involving in signing a PPA. By promoting PPAs and explaining/proving their advantages, not only would society's level of knowledge increase, which will obviously improve their attitude towards entering into such contractual relationships, but also the level of the PPA market would increase significantly, an aspect that will highlight a demand, and therefore an increasingly rapid development of the electricity market from renewable energy sources. The impact on the goals imposed by the European Union, implicitly desired by the member states, will be an obvious one, and what will be highlighted through a clear economic and financial stability, marked by fixed, determined prices, which will become the main benefit of concluding a PPA.
Therefore, if this base will be stable in short time, it will be much easier to create a sustainable PPA market, by planning, involvement of more companies, analysing results and fast response to any negative impact and setting new and higher objectives in decarbonization.
Author Contributions
All authors collectively contributed to the writing, reviewing, and editing of this article.
Conflicts of Interest
The authors declare no conflict of interest.
References
- Ben Belgacem, S.; Khatoon, G.; Alzuman, A. Role of Renewable Energy and Financial Innovation in Environmental Protection: Empirical Evidence from UAE and Saudi Arabia. Sustainability 2023, 15, 8684. [Google Scholar] [CrossRef]
- Bruck, M.; Sandborn, P.; Goudarzis, N. A Levelized Cost of Energy (LCOE) model for wind farms that include Power Purchase Agreements (PPAs). Renew. Energy 2018, 122, 131–139. [Google Scholar] [CrossRef]
- Bruck, M.; Sandborn, P. Pricing bundled renewable energy credits using a modified LCOE for power purchase agreements. Renew. Energy 2021, 170, 224–235. [Google Scholar] [CrossRef]
- Chau, K.T. , Chan C.C., Emerging energy-efficient technologies for hybrid electric vehicles, (2007), Proceedings of the IEEE; 95 (4):821–35.
- Council of European Union (2020), Long-term low greenhouse gas emission development strategy of the European Union and its Member states, Available at HYPERLINK "https://unfccc.int/documents/210328" https://unfccc.int/documents/210328 , accessed at 03th of October 2023.
- David, R. , (2023), Renewable energy sources in the world Developments and forecasts, Energy Industry Review, 50 - 52.
- Gabrielli, P.; Hilsheimer, P.; Sansavini, G. Storage power purchase agreements to enable the deployment of energy storage in Europe. iScience 2022, 25, 104701. [Google Scholar] [CrossRef] [PubMed]
- Hale, T.; Smith, S.M.; Black, R.; Cullen, K.; Fay, B.; Lang, J.; Mahmood, S. Assessing the rapidly-emerging landscape of net zero targets. Clim. Policy 2021, 22, 18–29. [Google Scholar] [CrossRef]
- Huneke, F. , Claußner, M., (2019), Power Purchase Agreements II: Market Analysis, Pricing and Hedging Strategies, Energy Brainpool, 1-22.
- Iancu, L. , (2023), Cooperation in a fragmented world, Energy Industry Review, 3.
- International Energy Outlook, (2011), U.S. Energy Information Administration (EIA) and International Energy Agency.
- IPCC, (2018). Summary for policymakers Global Warming of 1.5 C. An IPCC Special Report on the impacts of global warming of 1.5 C above preindustrial levels and related greenhouse gas emission pathways. In the context of strengthening the global response to the threat of climate change. IPCC, V. Masson-Delmotte, P. Zhai, H-O Pärtner, D. Roberts, J. Skea, P.R. Shukla, A.
- Kumar, P.; Mishra, T.; Banerjee, R. Impact of India's power purchase agreements on electricity sector decarbonization. J. Clean. Prod. 2022, 373. [Google Scholar] [CrossRef]
- Lei, X.; Sandborn, P.A. Maintenance scheduling based on remaining useful life predictions for wind farms managed using power purchase agreements. Renew. Energy 2018, 116, 188–198. [Google Scholar] [CrossRef]
- Level Ten Energy, (2020), Level Ten’s new Restore energy agreement paves the way for more utility-scale storage development. Available at: https://leveltenenergy.com/post/energy-storage-agreement, accessed at 20th of April 2023.
- Liobikien˙e, G. , Miceikien˙e, A., (2023), Contribution of the European Bioeconomy Strategy to the Green Deal Policy: Challenges and Opportunities in Implementing These Policies, Sustainability, 15, 7139.
- Mendicino, L.; Menniti, D.; Pinnarelli, A.; Sorrentino, N. Corporate power purchase agreement: Formulation of the related levelized cost of energy and its application to a real life case study. Appl. Energy 2019, 253. [Google Scholar] [CrossRef]
- Nowak, M.; Kokocińska, M. The Efficiency of Economic Growth for Sustainable Development—A Grey System Theory Approach in the Eurozone and Other European Countries. Sustainability 2024, 16, 1839. [Google Scholar] [CrossRef]
- Parsons, R. , Hidrue, M.K., Kempton, W., Gardner, M. P., (2015), Willingness to pay for vehicle to grid (V2G) electric vehicles and their contact terms, University of Delaware, p. 38.
- Petersen, J. , (2011), Global autos: Don’t believe the hype - analyzing the costs & potential of fuel - efficient technology, In: Shao, S., editor, p.450.
- PWC (2016), Corporate Renewable Energy Procurement Survey Insights. https://www.een ews.net/assets/2017/05/11/document_ew_02.pdf.
- Qiu, Q.; Cui, L.; Yang, L. Maintenance policies for energy systems subject to complex failure processes and power purchasing agreement. Comput. Ind. Eng. 2018, 119, 193–203. [Google Scholar] [CrossRef]
- Regional Center for Renewable Energy an Energy Efficiency, (2012), User’s Guide for Power Purchase Agreement (PPA) Model for electricity generated from renewable energy facilities, Final version, 1-21. Available at https://ppp.worldbank.org/public-private-partnership/sites/ppp.worldbank.org/files/documents/users_guide_ppa_reegf.pdf accessed at 1st May 2023.
- Schmidt, R. , (2008), Information technology energy usage and our planet, In: Thermal and thermomechanical phenomena in electronic systems, ITHERM 11th Intersociety Conference On.
- See News, 2023, Energy redefines Romanian PPA Market with landmark Ursus Brewery deal, available on HYPERLINK "https://seenews.com/press_release/view/enery-redefines-romanian-ppa-market-with-landmark-ursus-brewery-deal-835872" https://seenews.com/press_release/view/enery-redefines-romanian-ppa-market-with-landmark-ursus-brewery-deal-835872 , accessed at 28th February 2024.
- Sinaiko, D., (2018), Structuring solar storage offtake contracts (Storage School), Available at: HYPERLINK "https://www.storage.school/content/2018/1/5/structuring-solar-storage-offtake-contracts" https://www.storage.school/content/2018/1/5/structuring-solar-storage-offtake-contracts , accessed at 29th September 2023.
- Stanitsas, M.; Kirytopoulos, K. Sustainable Energy Strategies for Power Purchase Agreements (PPAs). Sustainability 2023, 15, 6638. [Google Scholar] [CrossRef]
- Yoshino, N. , Rasoulinezhad, E., (2021), Power purchase agreements with incremental tariffs in local cu-rrency: An innovative green finance tool, Global Finance Journal, 1-9.
- The International Renewable Energy Agency (IRENA), (2018), Renewable Energy Statistics, 1-362.
- Tie, S.F.; Tan, C.W. A review of energy sources and energy management system in electric vehicles. Renew. Sustain. Energy Rev. 2013, 20, 82–102. [Google Scholar] [CrossRef]
- Tranberg, B.; Hansen, R.T.; Catania, L. Managing volumetric risk of long-term power purchase agreements. Energy Econ. 2019, 85, 104567. [Google Scholar] [CrossRef]
- Vimpari, J. Financing Energy Transition with Real Estate Wealth. Energies 2020, 13, 4289. [Google Scholar] [CrossRef]
- Windindustry, (2007), Community Wind toolbox. Available at website: https://www.windustry.org/community_wind_toolbox_13_power_purchase_agreement, accessed at 20th of April 2023.
- Xiang, Y.; Zhu, Z.; Coit, D.W.; Feng, Q. Condition-based maintenance under performance-based contracting. Comput. Ind. Eng. 2017, 111, 391–402. [Google Scholar] [CrossRef]
- Ghiassi-Farrokhfal, Y.; Ketter, W.; Collins, J. Making green power purchase agreements more predictable and reliable for companies. Decis. Support Syst. 2021, 144, 113514. [Google Scholar] [CrossRef]
- Wang, F., Rani, T., Razzaq, A., (2022), Environmental Impact of Fiscal Decentralization, Green Technology Innovation and Institution’s Efficiency in Developed Countries Using Advance Panel Modelling, Energy Environ.
Figure 2.
Key factors that influence the development of PPA.
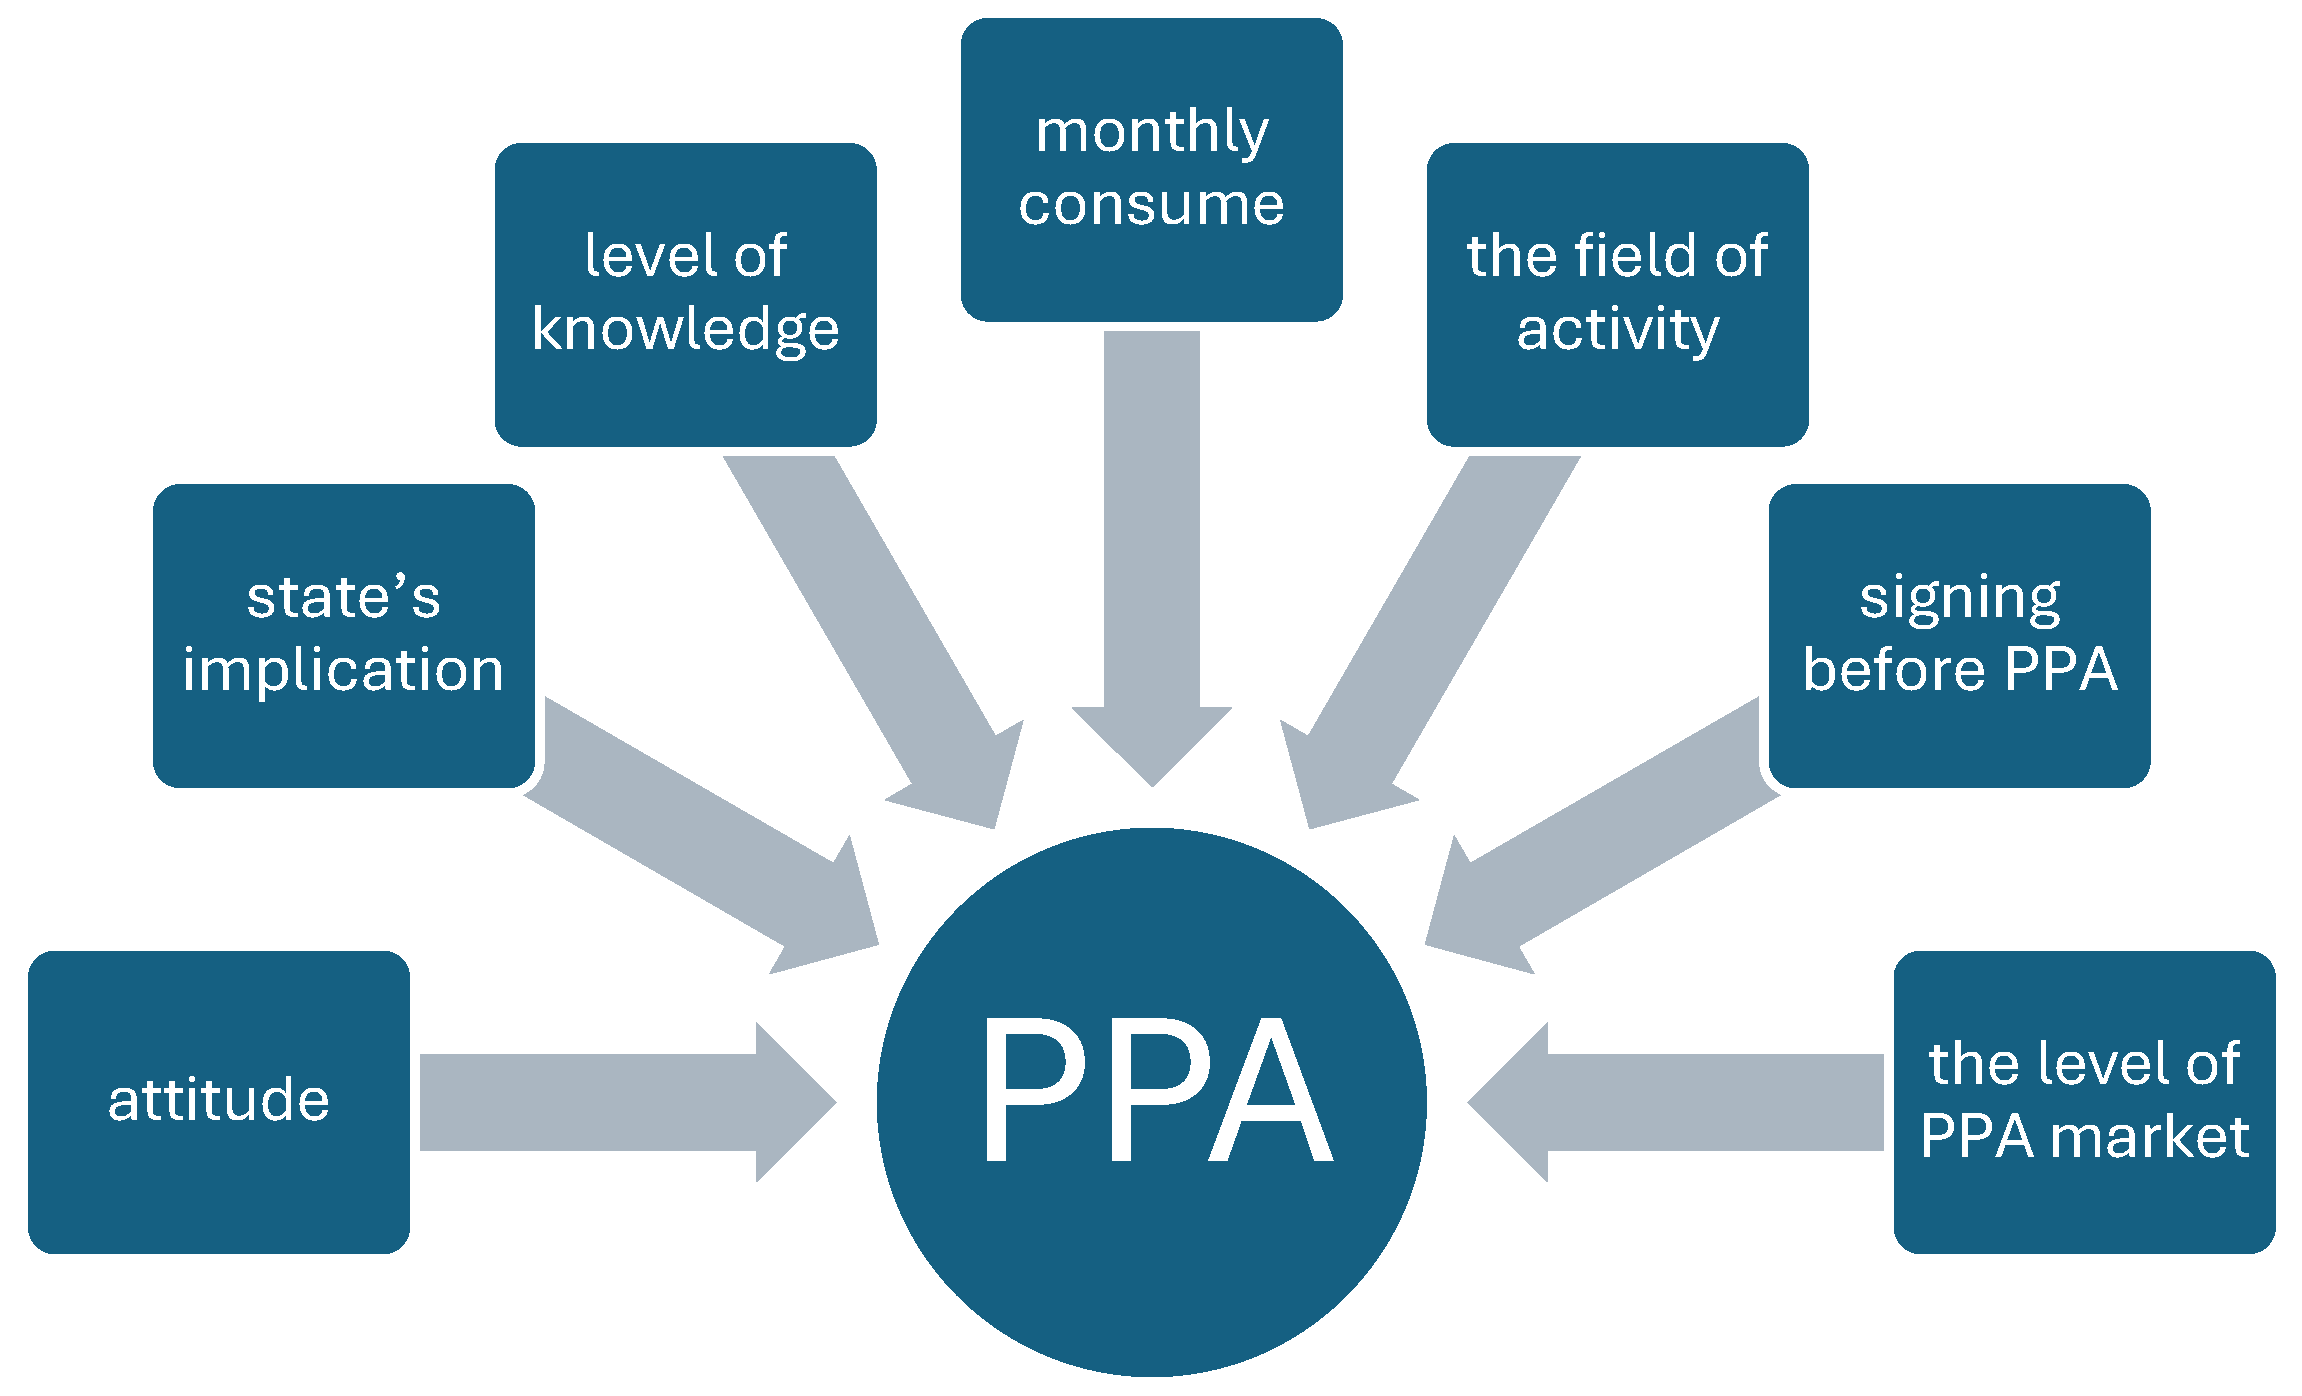
Figure 3.
Key factors – Weight in signing a PPA. Source: authors’ elaboration on sample data
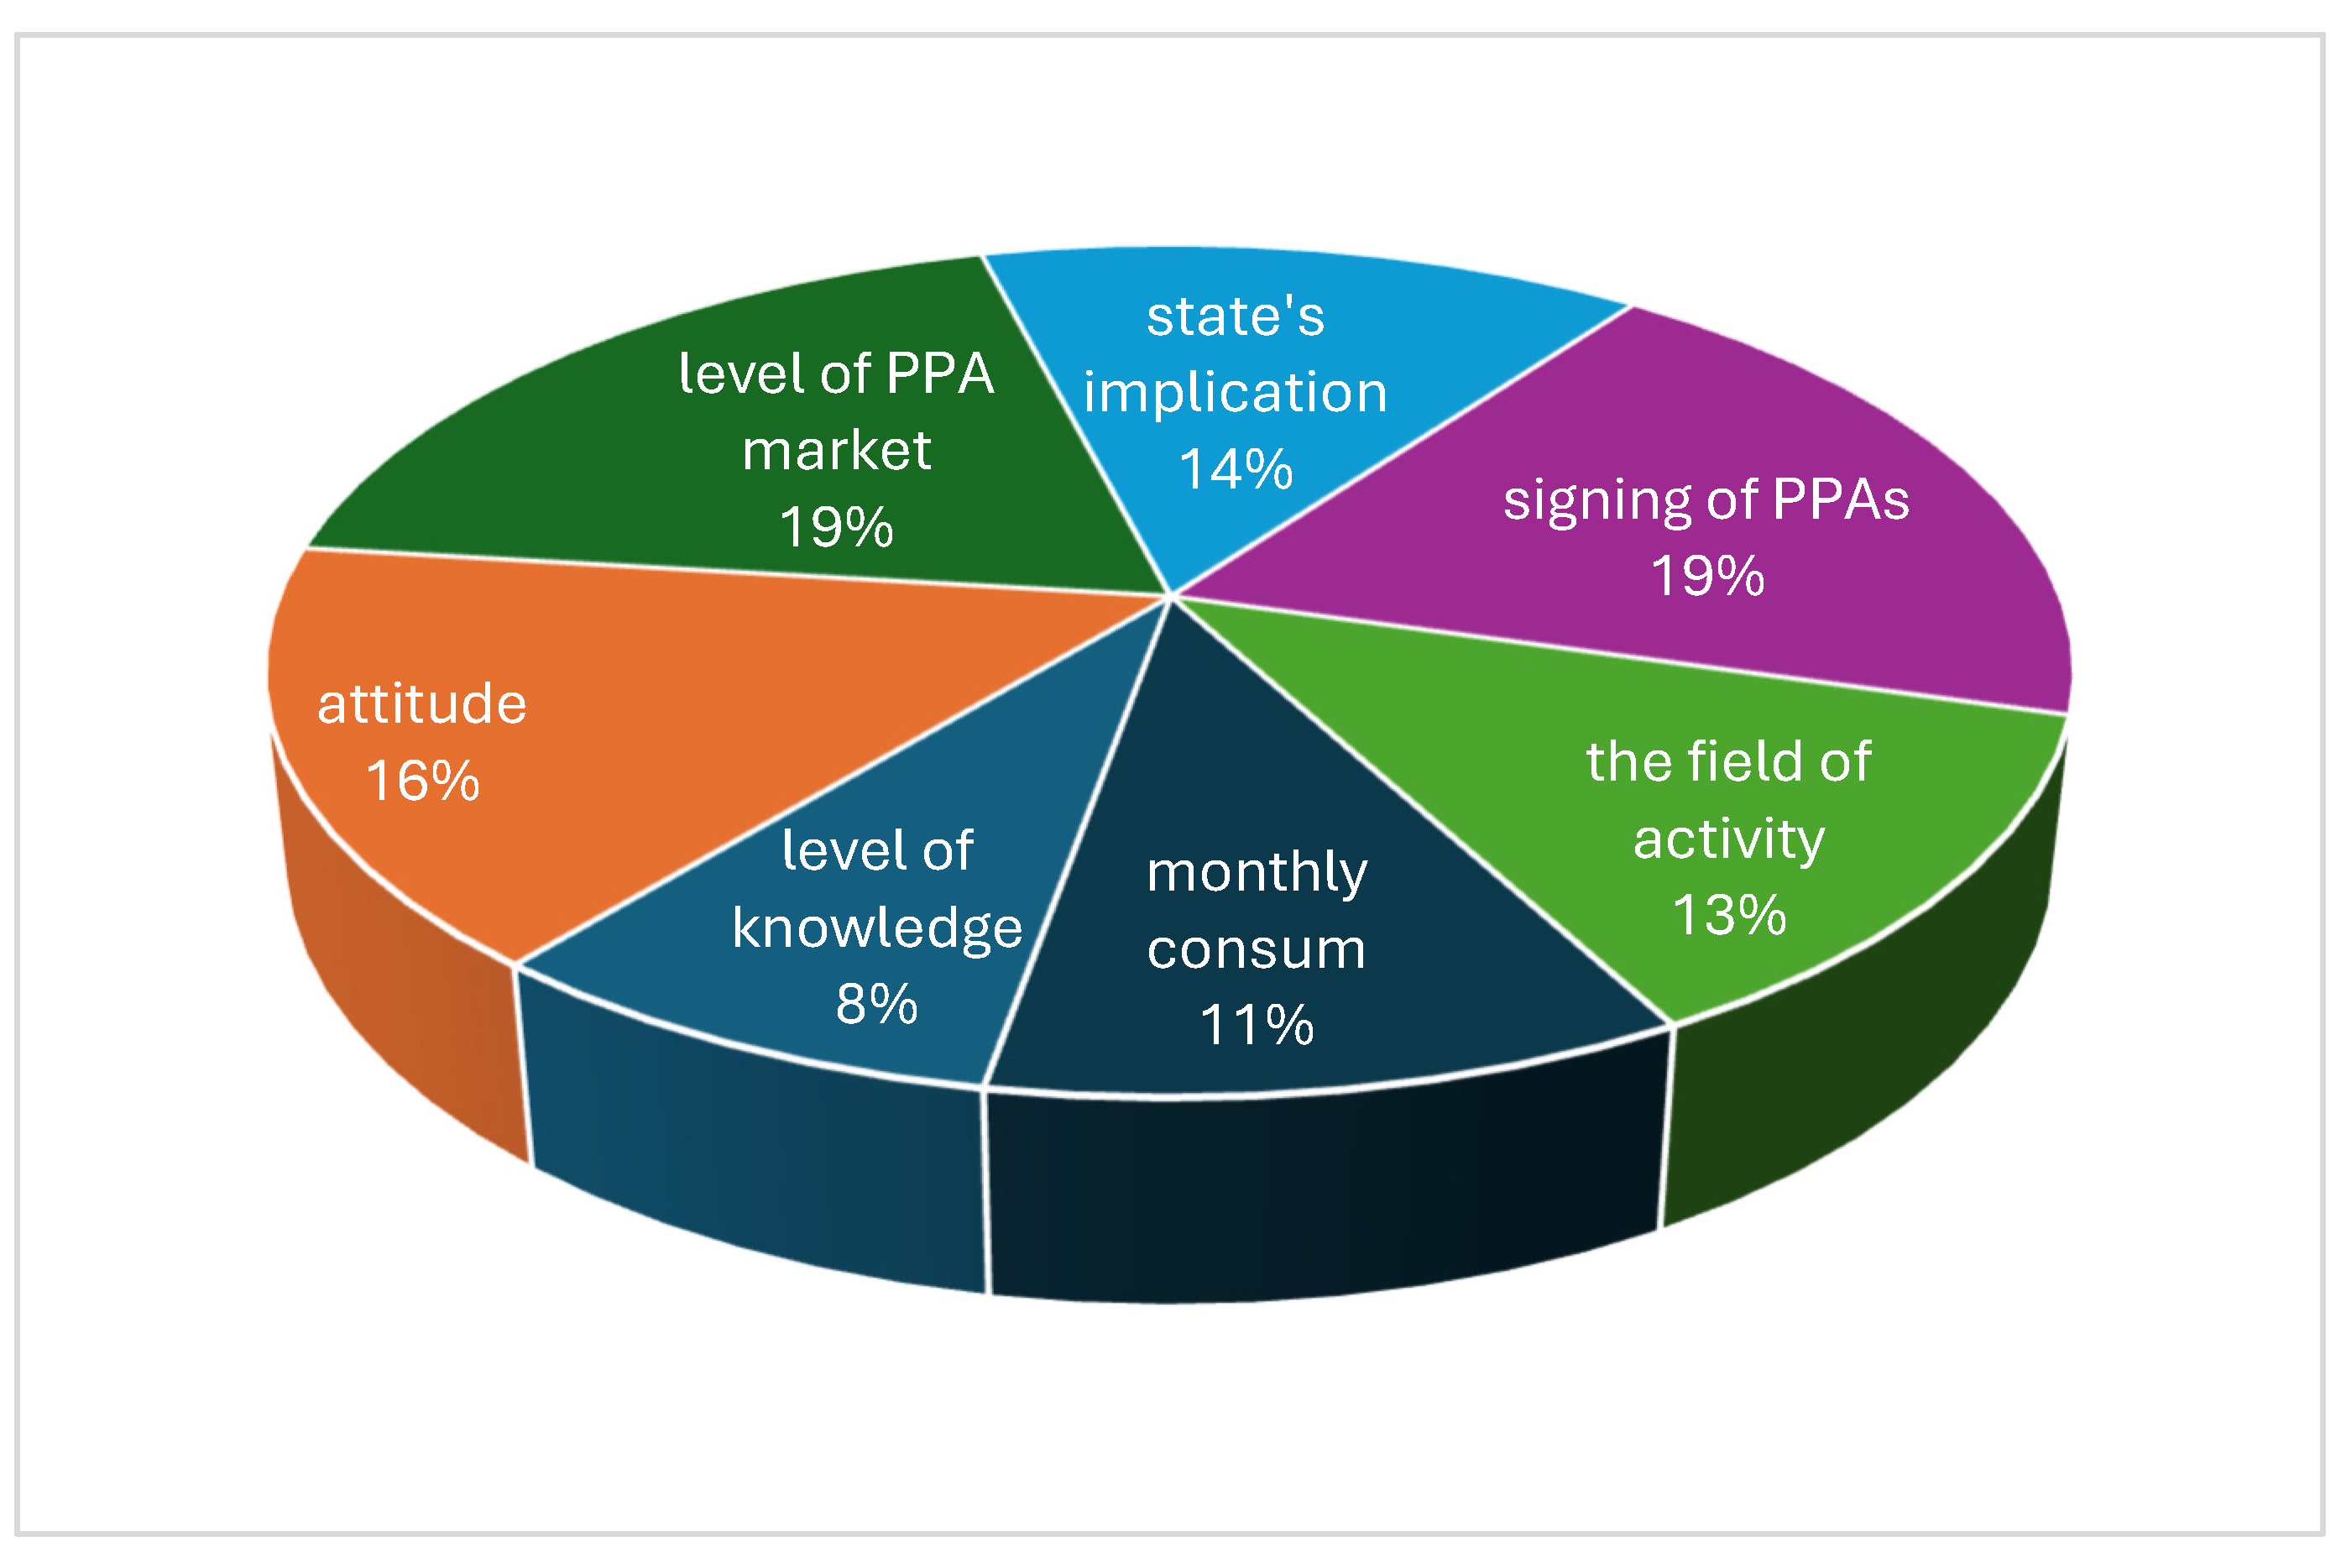
Figure 4.
The level of knowledge. Source: authors’ elaboration on sample data
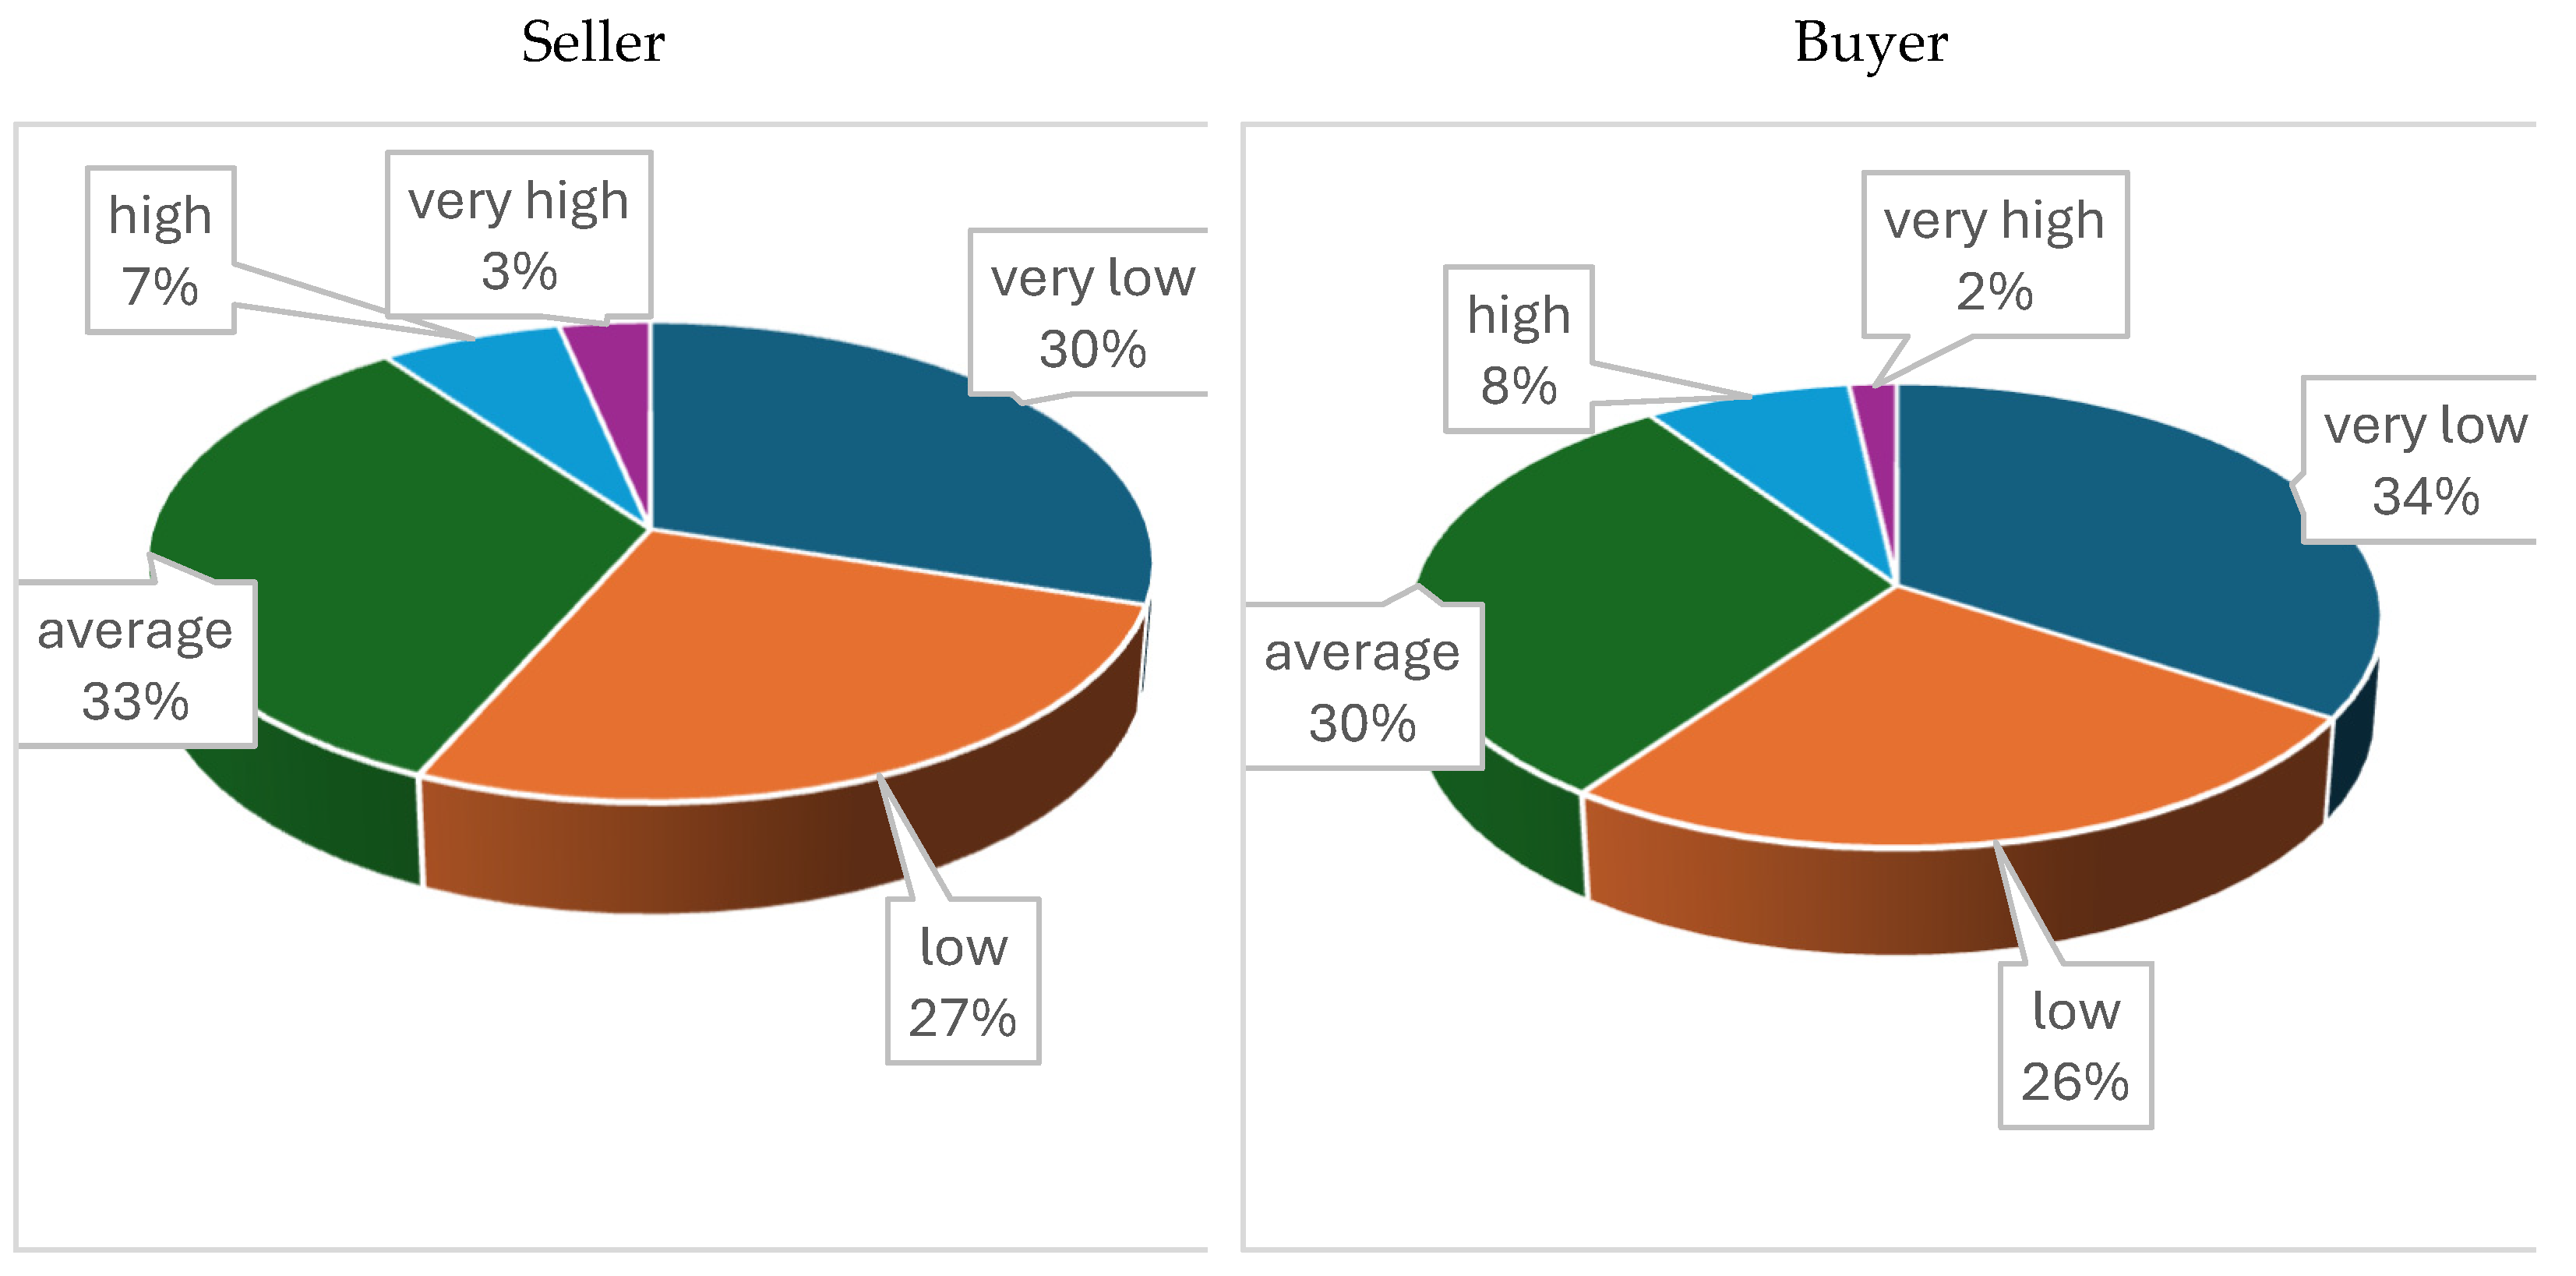
Table 3.
Impact of each key factor on signing PPA.
| Number | Key factors | Percentaje |
|---|---|---|
| 1. | Signing before PPAs | 19% |
| 2. | Level of PPA market | 19% |
| 3. | Attitude | 16% |
| 4. | State’s implication | 14% |
| 5. | Field of activity | 13% |
| 6. | Monthly consum | 11% |
| 7. | Level of knowledge | 8% |
Source: authors’ elaboration on sample data.
Table 6.
Seller’s Correlation matrix (Spearman’s rho correlation).
Source: authors’ elaboration on sample data.
Disclaimer/Publisher’s Note: The statements, opinions and data contained in all publications are solely those of the individual author(s) and contributor(s) and not of MDPI and/or the editor(s). MDPI and/or the editor(s) disclaim responsibility for any injury to people or property resulting from any ideas, methods, instructions or products referred to in the content. |
© 2024 by the authors. Licensee MDPI, Basel, Switzerland. This article is an open access article distributed under the terms and conditions of the Creative Commons Attribution (CC BY) license (http://creativecommons.org/licenses/by/4.0/).
Copyright: This open access article is published under a Creative Commons CC BY 4.0 license, which permit the free download, distribution, and reuse, provided that the author and preprint are cited in any reuse.


