
Submitted:
08 March 2024
Posted:
11 March 2024
You are already at the latest version
Abstract
In this study, we define screening maps for Italy that classify sites based on their potential for triggering landslides. To this end, we analyze seismic hazard maps and hazard disaggregation results on a national scale considering four spectral periods (0.01s, 0.2s, 0.5s, and 1.0s) and three return periods (475, 975, and 2475 years). First, joint distributions of magnitude (M) and distance (R) from hazard disaggregation are analyzed by means of an innovative approach based on image processing techniques to find all modal scenarios contributing to the hazard. In order to obtain the M-R scenarios controlling the triggering of earthquake-induced landslides at any computation node, mean and modal M-R pairs are compared to empirical curves defining the M-R bounds associated with landslide triggering. Three types of landslides are considered (i.e., disrupted slides and falls, coherent slides, and lateral spreads and flows). As a result, screening maps for all of Italy showing the potential for triggering landslides based on the level of seismic hazard are obtained. The maps and the related data are freely accessible at the following web address: https://distav.unige.it/rsni/slideq.php.
Keywords:
earthquake-induced landslides
; landslide triggering
; seismic hazard
; hazard disaggregation
; triggering probability.
1. Introduction
Landslides, one of the important geohazards that have caused tremendous amounts of losses throughout history [1,2], often occur as a consequence of other natural hazards among which earthquakes are one of the main triggering factors. The effects of earthquake-induced ground shaking are often sufficient to cause the failure of slopes that were marginally to moderately stable before the earthquake. During an earthquake, seismic waves propagating through a slope create an acceleration field that exerts an additional body force on the mass of the potential landslide. A landslide occurs when the total force acting on the slope exceeds the strength of the slope materials, leading to a loss of stability [3,4]. This can result in the rapid or gradual movement of materials, posing risks to human settlements, infrastructures, and natural environment.
According to the Italian Catalogue of Earthquake-Induced Ground Failures – CEDIT [5,6,7] landslides account for approximately 55% of all recorded ground effects in Italy, with over two thousand events occurring since 1000 A.D. Following the classification proposed by Keefer [1,8], approximately 40% can be classified as disrupted slides and falls, 22% as coherent slides, and 6% as lateral spreads and flows.
The scope of the present work is the assessment and mapping of the potential for triggering earthquake-induced landslides in Italy. The results can be useful for seismic microzonation purposes, guiding land-use planners in mitigating risks, and enhancing preparedness and emergency response within the framework of disaster risk management. Furthermore, they can be useful for subsequent assessments of landslide susceptibility.
At least in principle, the evaluation of the seismic triggering of landslides implies the assessment of the exceedance of the critical acceleration at the site of interest, whose computation requires the knowledge of site-specific geotechnical parameters (e.g., soil cohesion and friction angle, unit weight). Alternatively, it can be achieved by analyzing the seismic parameters that are commonly related to landslide triggering, such as earthquake magnitude (), source-to-site distance (), peak ground acceleration (PGA) (in the present work, the terms “peak horizontal acceleration” and “peak ground acceleration”, as well as the relative acronyms PHA and PGA, are used interchangeably), Arias intensity (), and spectral acceleration () [1,3,4,8,9,10,11]. Nowadays, the values of most of these parameters can be easily obtained by querying national hazard maps through online web services, at least at the screening level. To deal with the critical role of seismicity in causing landslides, this study uses data from the reference Italian seismic hazard maps [12,13] and the results of the disaggregation of the hazard [14]. Specifically, the primary criterion that we use to define whether a site has the (seismic) potentiality to trigger a landslide is based on comparison of the mean and modal - scenarios from hazard disaggregation with the upper bounds proposed by Keefer (1984). This criterion, which is better described in the next section, is also considered by the Italian Guidelines for Seismic Microzonation released by the SM Working Group [15,16]1. The disaggregation of spectral acceleration hazard corresponding to different spectral periods (T = 0.01s, T = 0.2s, T = 0.5s, and T = 1.0s) is considered. As sites resonate at different fundamental periods depending on local geological characteristics [2], this allows us to select the - pair controlling landslide triggering in relation to local geological conditions (through the use of the site classification system adopted by the Italian building code [17]). As shown by many authors [18,19,20,21], indeed, spectral acceleration at a period equal to the initial fundamental soil period (or to a degraded period corresponding to multiple of the fundamental period) is one of the most effective parameters to predict landslide displacement.
As a result, maps for all of Italy that classify sites based on their (seismic) potential for triggering landslides are obtained. Maps are produced considering disaggregation data corresponding to three different return periods (i.e., disaggregation of the mean annual rate of exceeding acceleration values associated with given return periods): namely, 475, 975, and 2475 years. It is known, indeed, that seismic hazard disaggregation results vary with return period such that the contribution of large-magnitude, close-distance scenarios increases with increasing the return period [14,22]. Therefore, it is expected that for longer return periods, slopes are subjected to stronger ground shaking. It is worth specifying that reference to return periods in the text just indicates that our (partial or final) results are based on the disaggregation of the ground-motion hazard for specific return periods. In the present work, we have not carried out any probabilistic computation aimed at assessing the probability of events occurring over time (e.g., probability of landslide triggering in the next 50 years). The reliability of the results is checked by comparing them with observations of past seismic landslide events in Italy [5,6,7].
Triggering maps and related seismic data (i.e., - pair controlling landslide triggering) are freely available through the dedicated web service at www.distav.unige.it/rsni/slideq.php.
2. A Note on Criteria for the Seismic Triggering of Landslides
As is well known, to induce a landslide on a particular slope, the ground acceleration must exceed the critical acceleration () for a finite length of time [3]. Therefore, any study that aims to evaluate the triggering of landslide events under seismic conditions should first verify whether seismic activity can likely produce acceleration levels above a certain critical value at the site under study. As stated previously, the quantification of typically requires the knowledge of site-specific geotechnical parameters. Over time, researchers have explored the relationship between earthquake-induced landslides and ground-motion parameters using data from various historical earthquakes [1,3,4,8,9,10,11,23,24,25]. There is a general consensus that landslides can be triggered by very low acceleration values. In particular, Wilson and Keefer [3] proposed a value as an approximate lower bound for seismic stability of susceptible slopes, whatever the mechanism of failure. This critical acceleration value of 0.05g is in agreement with observations from the Wenchuan earthquake for which a PGA value of 0.07g has been identified as the minimum threshold value associated with a significant increase in local landslide density, although landslides were also observed for accelerations levels as low as about 0.03g [11]. Moreover, it is consistent with the findings of Jibson [25] showing an empirical range of minimum PGA values needed to trigger small failures on very susceptible slopes between 0.02g and 0.11g.
In the present study, for all nodes considered in the probabilistic seismic hazard assessment of Italy [12,13], the surface peak ground acceleration (, defined as where is the PGA on rock and is a site term that accounts for stratigraphic and topographic amplification according to the Italian building code [17]) is compared to the critical acceleration threshold defined by Wilson and Keefer [3]. This condition has been checked using the same database provided by Barani et al. [26,27] for the three return periods considered. The results, which are not reported here for the sake of brevity, indicate that applying a criterion based on critical acceleration does not provide informative results. This is because values consistently exceed the critical acceleration threshold of 0.05g. For a 475-yr return period, interested readers may refer to the map in Figure 2 in Barani et al. [26], from which it can be deduced that exceeds 0.05g almost everywhere. Therefore, while the condition on critical acceleration should be the primary criterion for assessing the triggering of earthquake-induced landslides, it is not useful to the scope of the present work (however, it may be useful when considering shorter return periods) and, consequently, it has been disregarded in favor of the criterion described below.
A study of worldwide historical earthquakes revealed that the extent of earthquake-induced landslide activity depends on both earthquake magnitude and source-to-site distance [1,8], so that below a certain minimum magnitude (4 for disrupted slides and falls, 4.5 for coherent slides, and 5 for lateral spreads and flows) and beyond a specific source-to-site distance, earthquake-induced landslides would rarely occur. Specifically, Keefer [1] proposed different upper bound curves for different types of earthquake-induced landslides (Figure 2 in [1]). For a given magnitude value, these curves define the critical distance below which earthquake-induced landslides may occur and, consequently, the possibility of triggering a landslide can not be neglected. For a given magnitude, disrupted slides or falls could occur farther from the epicenter than other landslides, and coherent slides could occur as far as or farther from the epicenter than lateral spreads or flows. Thus, these curves are of paramount importance to evaluate the potential for triggering landslides, as they provide a sort of benchmark to define the magnitude-distance scenarios for which landslide triggering can not be discounted (i.e., - pairs that fall below the curves).
3. Methodology
As mentioned above, in the present work we define screening maps for Italy that classify sites based on of their potential for triggering earthquake-induced landslides. To this end, the joint distributions (i.e., probability mass functions, PMFs) of magnitude and distance determined by Barani et al. [14] within the framework of the disaggregation of the seismic hazard of Italy are first analyzed to identify all modal scenarios (i.e., local maxima) contributing to the hazard. For each computation node considered by Barani et al. [14], we define mean and modal - scenarios (denoted by () and (), respectively) for all twelve PMFs resulting from all possible combinations of return periods (475 years, 975 years, and 2475 years) and spectral periods (T = 0.01s, T = 0.2s, T = 0.5s, and T = 1.0s). These scenarios are then compared to the upper-bound curves defined by Keefer [1] for the three types of landslides previously mentioned. Finally, for each return period considered, triggering maps of earthquake-induced landslides are produced via the QGIS software [28]. Each map shows sites where landslides can (or can not) be triggered by seismic activity. For each site, we provide information about the type of triggerable landslide and the earthquake scenario (i.e., - pair) that will most likely trigger a landslide event. An in-depth description of the procedure is given below.
3.1. Hazard Disaggregation: Identification of Modal Scenarios
In order to identify modal scenarios (i.e., local maxima) from each - PMF, an innovative approach based on morphological image processing techniques is implemented. The most common morphological operations are minimum (also known as erosion) and maximum (dilation) filters [29,30,31]. In this study, the latter operation is used. Specifically, each PMF is treated as an image and the maximum filtering operation is individually applied to each pixel (i.e., - bin). The maximum filter scans each pixel in a moving window process and replaces the associated PMF value with the largest value among the neighboring pixels, which overall define the so-called structuring element (also termed as neighborhood). Local maxima are identified by checking for element-wise equality between the original and filtered matrices, resulting in a Boolean matrix within which ‘True’ values indicate the position of the modes. Mathematically, this is expressed by the following equations.
Let O be the matrix associated with a given PMF and S the structuring element, the operation of the maximum filter can be expressed by:
where is the value of the filtered matrix at position (), represents the elements of the matrix that are inside the structuring element at position (), and ‘max’ denotes the maximum value within S.
To define local maxima, a Boolean mask is generated by checking for equality between the elements of the filtered and original matrices. The Boolean mask is a binary matrix with the same size of and . An entry is set to ‘True’ (i.e., 1) if, for a given position in the matrix, the values in both and are equal, indicating a local maximum. Otherwise, the element is set to ‘False’ (i.e., 0). Mathematically, this operation can be expressed as:
where is the value of the Boolean matrix at position ().
In the present work, the structuring element is a 3-by-3 square window encompassing all eight neighboring pixels around the target pixel. The size and configuration (i.e., shape) of the structuring element was defined after a sensitivity analysis aimed at defining the optimal setting of the structuring element to find local maxima in the - PMFs. To this end, we first examined the impact of the structuring element for two different configurations while keeping the window dimension fixed (3-by-3 window): a cross-pattern with 4 neighboring pixels and a square-pattern encompassing all 8 neighboring pixels. Results are shown in Figure 1 for an example PMF. Employing a structuring element with a cross-pattern configuration identifies four modes (Figure 1a). However, the third mode (,) is a fake mode because it is located immediately close to the second mode (,) and has a lower PMF value ().The third mode is erroneously detected because this structuring element (cross-pattern configuration) does not scan the diagonal side of the target pixel and is therefore insensitive to the diagonal elements. This suggests that scanning the area surrounding the target pixel in all directions may result in more effective and reliable peak detection. As shown in Figure 1b, employing a structuring element with a square-pattern configuration correctly identifies three modes.
Then, we examined the impact of the structuring element for two different sizes, while keeping its configuration fixed (a square-pattern configuration including all possible neighboring pixels within the window is considered): a 3-by-3 window, and a 5-by-5 window. Results are shown in Figure 2 for the same example PMF considered in Figure 1. While the 3-by-3 window (Figure 2a) correctly detects the second mode (,), the larger one is insensitive to it because of the presence of a higher-value pixel (yellow bar) within the structuring element. This results in overlooking the contribution of the scenario (Figure 2b), which consequently is not detected as a mode. It follows that under the influence of neighboring pixels with higher values, especially those located at greater distances from the center of the structuring element, potential peaks with lower values may be masked during the filtering operation. In other words, as the size of the structuring element increases, the resolution in detecting local maxima decreases. Thus, a 3-by-3 square window is considered in the analysis (Figure 2a).
3.2. Definition of Reference Period-Dependent - Scenarios
Which - pair should be considered as the reference scenario for earthquake-induced landslides? The mean, the mode, or one of the modes (in the case of multi-modal distributions)? While the mode () undoubtedly represents the scenario with the highest contribution to the hazard, it is sensitive to the size of magnitude and distance bins. In contrast, the mean () is independent of the bin size, but it might represent an unlikely scenario (i.e., it could correspond to a scenario with a small contribution to the overall hazard), particularly in the case of multi-modal distributions [14,22]. In the present work, the selection of the reference scenarios is done regardless of advantages and disadvantages of the mean and mode, but is guided by the conservatism criterion whereby if at least one - pair among those selected from a PMF (i.e., mean and modal pairs) lies below the upper-bound curve of Keefer [1] for a given landslide type, then the triggering of earthquake-induced landslides can not be neglected for that site. In order to avoid the selection of unlikely scenarios in the case of multi-modal distributions, following Barani et al. [26], the minor modes (i.e., 2nd, 3rd, …, mode) are considered in subsequent computations only if their contribution to the hazard is greater than the contribution associated with the mean scenario (in this case, the mean scenario is disregarded). If the contributions associated with the minor modes equal that of the mean, then all selected scenarios are considered. Then, for each PMF, the selected - scenarios are compared to the upper bound curves proposed by Keefer [1], separately for the three types of earthquake-induced landslides. Specifically, for each computation node considered by Barani et al. [14], the reference - pair is selected as follows:
- if all - pairs selected from the PMF stand above the reference upper-bound curve, then the triggering of earthquake-induced landslides can be neglected; in these cases, the modal - pair () is stored as the reference scenario, because of its larger contribution to the hazard.
- if only one of the - pairs is below the reference upper-bound curve, then the triggering of earthquake-induced landslides can not be discounted and that - pair is taken as reference.
- if more than one - pair lies below the reference upper-bound curve, then the triggering of earthquake-induced landslides can not be excluded and the - pair that contributes the most to hazard (i.e., the - scenario with the greatest PMF value) is selected as reference.
Figure 3 compares the mean and modal scenarios associated with an example PMF to the upper bound curves of Keefer [1] for the three different types of landslides. In Figure 3a, as both the (primary) mode and the mean lie below the curve, the reference - pair is chosen according to the highest PMF value.
The criteria above are applied to each computation node for the four considered spectral periods (T = 0.01s, T = 0.2s, T = 0.5s, and T = 1.0s). As a result, for each landslide type and for each return period, geographic distributions of the reference magnitude () and distance () are obtained, as well as maps showing the contribution of the selected scenarios to the hazard (i.e., PMF values). For the case of coherent slides and a return period of 475 years, Figure 4 shows the resulting maps of () and () for spectral periods of T = 0.01s and T = 1.0s, together with those of the related contribution to the hazard. As expected, the maps clearly show that and increase with increasing spectral period, reaching the largest values in a very low seismicity area in southeastern Italy where is between 7.0 and 7.5 and is between 120 and 160 km. In contrast, high magnitude values corresponding to short distances are concentrated in areas characterized by higher seismic activity (e.g., Central and Southern Apennines), whereas low-to-moderate magnitude scenarios associated with local sources dominate in areas of mild-to-moderate but relatively frequent seismic activity (e.g., some areas in the Po Plain and western Alps, and along the northern sector of the Tyrrhenian coast). Figure 4c,f show that the reference M-R scenarios have contributions that, on average, are greater than 5%.
In addition to the previous maps, we have obtained preliminary period-dependent maps of seismic landslide triggering. These maps identify sites (marked with red and gray points) where landslides can (or can not) be triggered by seismic activity. For the case of coherent slides and a return period of 475 years, Figure 5 shows the triggering maps for all spectral periods considered. As expected, the number of red points increases with increasing spectral period.
3.3. Definition of Reference Period-Independent -Scenarios
As is largely known, sites resonate at different fundamental periods. Hence, whereas PGA hazard disaggregation (T ≈ 0.01s) may be appropriate for rock sites (which are known to resonate at high frequencies), it can provide ineffective (i.e., non-conservative) results in the case of soil sites, which generally have resonance periods in the 0.1 – 1.0s range (this range may extend up to longer periods in the case of deep alluvial valleys). As observed above, indeed, the contribution from larger magnitudes and distant sources increases as T increases. Therefore, to improve the evaluation of the triggering potential related to earthquake-induced landslides, it is crucial to relate the preliminary period-dependent triggering maps to ground response, which can be roughly considered through the use of simple site classification systems, such as those proposed by national building codes. In other words, for each site, the reference - pair should be selected so that the spectral period considered in the disaggregation analysis is compatible with ground response. This allows selecting the reference - pair for each site in relation to geological conditions.
Recently, Forte et al. [32] developed a soil classification map for all of Italy (see Figure 9 in [32]) in compliance with the ground types (also referred to as “soil types” or “subsoil classes”) defined by the Italian building code [17] as a function of the parameter (i.e., time-averaged shear-wave velocity above the seismic bedrock, the latter being defined as the rock formation or rigid soil with ). This map is used in conjunction with the maps described in the previous section to define the final maps of and (from here on, we drop the dependence of and on T to indicate the reference period-independent - scenarios). To this end, the following criteria are applied:
- for sites classified as ground type A (i.e., rock sites or stiff soils with ≥ 800m/s).
- for sites classified as ground type B (i.e., soft rock or deposits of dense soil characterized by a gradual increase of the mechanical properties with depth, and 360 ≤ < 800m/s).
- for sites classified as ground type C or D (i.e., sites characterized by deposits of loose-to-medium cohesionless soil with thickness greater than 30m, and 100 ≤ < 360m/s).
- for sites classified as ground type E (i.e., sites of type C or D but thickness of soil deposits smaller than 30 m).
The maps resulting from the application of the criteria above are described in the next section along with the corresponding maps of landslide triggering.
4. Results
Figure 6 shows the period-independent maps of and associated with a return period of 475 years resulting from the application of the criteria described in the previous section. Maps are shown for disrupted slides and falls (Figure 6a,b), coherent slides (Figure 6c,d), and lateral spreads and flows (Figure 6e,f), separately. The maps show that for a given magnitude, disrupted slides and falls may occur (at a given site) farther from the epicenter than coherent slides. The latter, in turn, may occur as far as or farther from the epicenter than lateral spreads and flows. For the same return period of 475 years, Figure 7 shows the period-independent triggering maps for each failure mechanism.
For each landslide type, the entire procedure described in section 3.3 has been repeated for return periods of 975 and 2475 years. The results, which are not reported here for the sake of brevity, show that the number of sites for which the triggering of landslides can not be excluded (red points) increases with increasing the return period. In other words, the longer the return period, the higher the triggering potential.
For each return period considered, the period-independent triggering maps obtained for each category of landslides can be merged into a single comprehensive map. These maps classify sites based on their potential to trigger different types of earthquake-induced landslides. The maps are shown in Figure 8 together with the location of landslides (blue dots) that occurred in Italy in the past [5,6,7]. Sites in red are those where all three types of landslides can potentially be triggered by seismic activity and, consequently, have a higher triggering potential. Sites displayed in orange are those where two types of landslides (disrupted slides and falls and coherent slides) can potentially be triggered, suggesting a moderate triggering potential. Yellow dots indicate sites where seismic activity may potentially trigger disrupted slides and falls exclusively, indicating a relatively lower triggering potential. Finally, green areas denote sites where none of the aforementioned types of landslides are expected to occur, indicating a negligible triggering potential.
Analyzing the triggering maps in conjunction with the geographic distribution of past landslide events shows that most historical observations fall in red or yellow areas, thus indicating the congruence of our results with the data collected in the CEDIT database. Only a handful of CEDIT observations (5 points) fall in areas where the seismic triggering of landslides is not expected (areas in green).
5. Online Application for Data Retrieval
To make our results available to land-use planners and practitioners, we have developed a web service, freely accessible at https://distav.unige.it/rsni/slideq.php. The web service data is stored in a “PostgreSQL” database. All the online components were developed in “PHP” and “HTML5” languages, to ensure adherence to current web standards. Online maps are based on “Leaflet”, an open-source JavaScript library for mobile-friendly interactive maps.
For a specified location (defined by a pair of geographic coordinates), the web service provides the values of and computed according to the site classification adopted in the present study [32]. Specifically, for the three return periods considered, the web service provides the values of and corresponding to each failure mechanism (note that, as no interpolation is performed, the values associated with the node closest to the selected site are returned). In addition, as the actual ground type of the site of interest (e.g., resulting from site-specific data) can differ from that stored in our database, the service allows the user to change it through a user-friendly interface, and returns the updated values of and according to the criteria described in Section 3.3. Alternatively, the web service allows selecting the spectral period T among those considered in the disaggregation analysis (e.g., according to the results of a ground response analysis) to obtain the value of and .
6. Discussion
Despite the congruence of our triggering maps and past observations, some questions can be raised, especially in view of the lack of historical events in many areas where landslide triggering is expected to occur (this could also be due to the incompleteness of historical accounts or to geological conditions that do not favor the occurrence of slope failures) but also considering the occurrence of earthquake-induced landslides (although rare) in areas where landslide triggering could be excluded based on our results. Thus, the following questions need to be answered. First, what is the (conditional) probability that an earthquake of magnitude triggers a landslide at a source-to-site distance ? The knowledge of this probability in conjunction with the triggering maps presented above can guide priorities for action within the framework of risk mitigation programs and the scheduling of focused geological and geotechnical investigations aimed at assessing landslide susceptibility (or, conversely, rule out further studies if the seismic triggering of landslides is very unlikely). Second, can we actually exclude the occurrence of landslide triggering at sites where the and pairs are above the upper bounds of Keefer [1] (we recall that, in these cases, the modal - pair is assumed as the reference scenario)? Although rare, Keefer [8] documented cases of earthquakes that produced landslides at distances significantly greater than indicated by the upper bounds.
To answer the previous questions, for each computation node and for each failure mechanism, we have computed the conditional probability of exceeding specific Arias intensity thresholds for landslide triggering given an earthquake scenario of magnitude and distance : 0.1m/s for disrupted slides and falls, 0.32m/s for coherent slides, and 0.54m/s for lateral spreads and flows [23,24]. This probability, which can be interpreted as the conditional probability of triggering a seismic landslide at a site, is computed as:
where indicates the standard normal cumulative distribution function, is the mean logarithmic Arias intensity () predicted by the ground-motion prediction equation (GMPE) at hand, and is the associated standard deviation. In this application, the GMPE of Sabetta et al. [33] derived for Italy is used. This GMPE uses a linear site-response term to account for ground-motion amplification as a function of (time-averaged shear-wave velocity above 30m depth). The values of employed here are those provided by Forte al. [32].
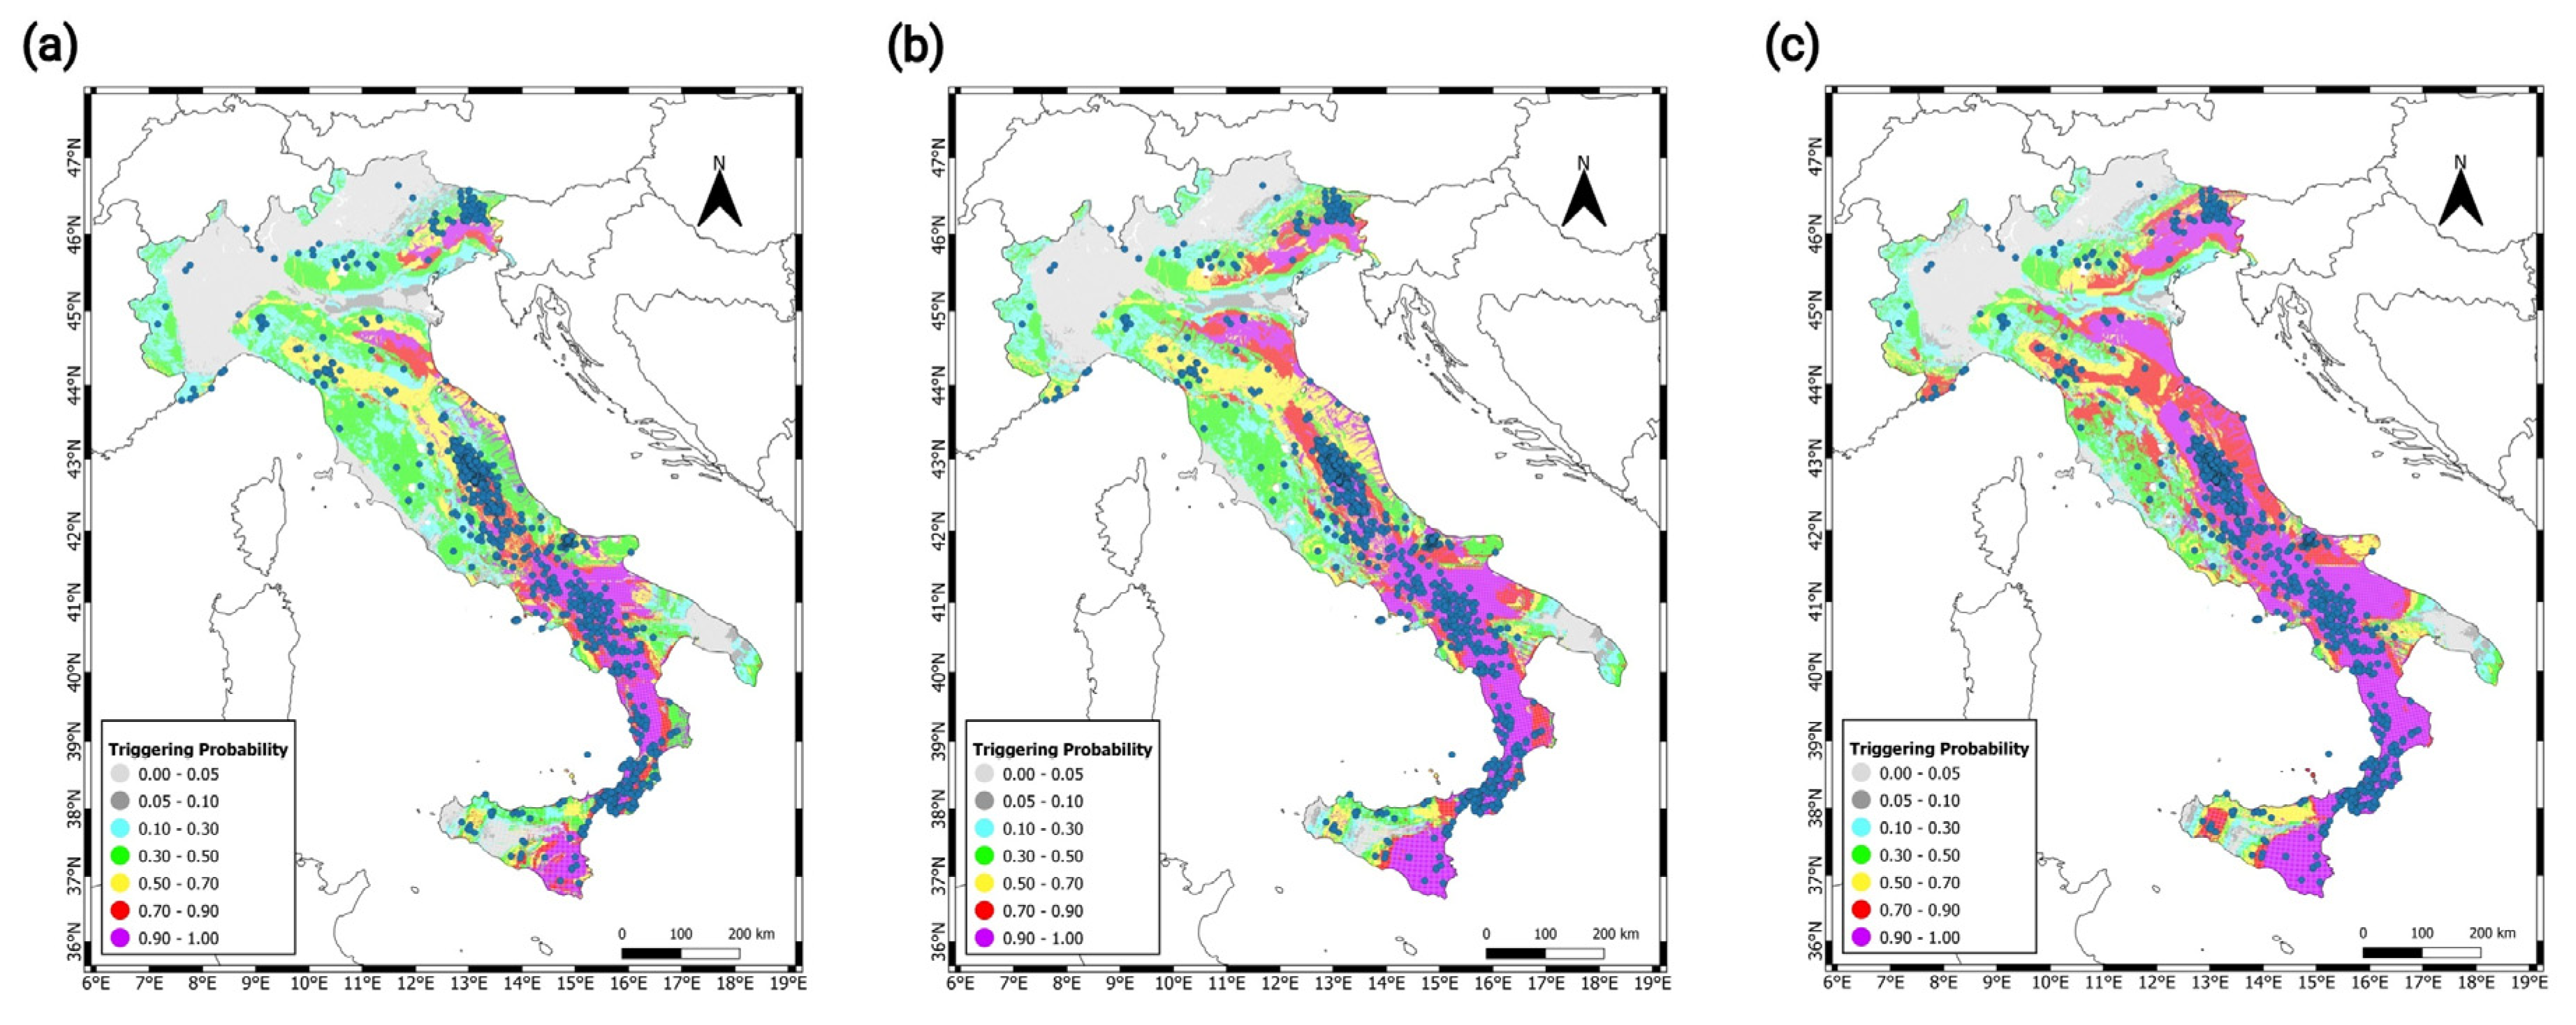
Once the conditional probability for each type of landslide has been assessed (an example is shown in Figure 9 for a return period of 475 years), the probability of triggering either a landslide classified as “disrupted slides or falls”, or “coherent slides”, or “lateral spreads and flows” is computed by using the addition rule for probability (this is equivalent to calculating the probability of at least one triggering, whatever the failure mechanism). To this end, we have assumed that events are independent. As a result, maps showing the geographic distribution of the probability of triggering seismic landslides, whatever the type of failure mechanism, are produced (Figure 10). We remark that, although these maps are based on the disaggregation of the hazard for specific return periods, they must not be confused with maps showing the probability of seismic landslide triggering over time (e.g., in the next 50 years). The latter can be determined through a conventional probabilistic seismic hazard analysis that takes into account the aleatory variabilities in magnitude, source-to-site distance, ground motion, and temporal occurrence of earthquakes.
Compared to the triggering maps in Figure 8, the probability maps shown in Figure 11 provide a finer picture of the landslide triggering potential in Italy, allowing for a clearer discrimination of areas with different levels of triggering potential. The areas characterized by the greatest probability of landslide triggering are those where the ground-motion hazard reaches higher levels (e.g., Central and Southern Apennines, Friuli region in the northeast). Here is where most landslides induced by past seismicity are concentrated. As expected, the probability increases as the reference return period increases.
7. Summary and Conclusions
In the present work, we have analyzed ground-motion hazard maps and the associated hazard disaggregation to define areas in Italy where landslide triggering due to seismic activity can not be excluded and where, therefore, further efforts are required to evaluate landslide susceptibility. The final result is a set of maps corresponding to different return periods (475, 975, and 2475 years) showing areas with different triggering potential based on the values of the magnitude-distance pairs controlling the local ground-motion hazard. Specifically, for each computation node, we have defined the failure mechanism that can be triggered and the earthquake scenario that might most likely induce that type of failure. Three types of landslide mechanisms have been considered: disrupted slides and falls, coherent landslides, and lateral spread and flows. The sites with the highest triggering potential are those where all three types of landslides can be triggered by seismic activity, whereas the sites where only the triggering of disrupted slides and falls is expected to occur have the lower triggering potential. In addition, for each site and failure mechanism, the conditional probability of exceeding given Arias intensity thresholds due to scenario earthquakes of given magnitude and distance was determined. This computation resulted in probabilistic maps which, together with the triggering maps, can guide priorities for action within the framework of risk mitigation programs. Moreover, they can serve as a guide for scheduling focused geological and geotechnical investigations aimed at assessing landslide susceptibility or, conversely, rule out further studies if the triggering of earthquake-induced landslides can be neglected (or is very unlikely). Landslides, indeed, are localized phenomena whose occurrence is intimately related to site-specific geological and geotechnical conditions.
Despite the reliability of our results, which was examined by analyzing the distribution of past events over the Italian territory, improvements can be reached as site-specific data become available. For instance, in situ measurements undoubtedly provide a more accurate definition of ground types. At least as far as this issue is concerned, practitioners and land-use planners can interrogate our results through the web service at https://distav.unige.it/rsni/slideq.php and refine their search by changing the ground type or by selecting the value of the spectral period of interest through a user-friendly interface. The service returns as output the updated magnitude-distance scenarios associated with the seismic triggering of each type of landslide.
Author Contributions
S.A. developed the computer codes for data analysis, carried out most of analyses, wrote the majority of the manuscript, and prepared all figures. S.B. contributed to the analysis of data and writing of the manuscript. G.F. contributed to the data analysis and preparation of Figure 4, Figure 5, Figure 6, Figure 7, Figure 8, Figure 9 and Figure 10. D.S. contributed to the preparation of Figure 4, Figure 5, Figure 6, Figure 7, Figure 8, Figure 9 and Figure 10 and developed the web service for the dissemination of the results (www.distav.unige.it/rsni/slideq.php). All authors reviewed the manuscript and contributed to the interpretation of the results.
Conflicts of Interest
the authors declare no conflicts of interest.
References
- Keefer, D.K. Landslides caused by earthquakes. Bulletin of the Geological Society of America 1984, 95, 406–421.
- Kramer, S.L. Geotechnical earthquake engineering. Prentice-Hall International Series in Civil Engineering and Engineering Mechanics 1996.
- Wilson, R.C.; Keefer, D.K. Predicting areal limit of earthquake-induced landsliding, evaluating eathquake hazards in the Los Angeles region-an earth-science perspective. US Geological Survery Professional Paper 1360. 1985, 317–345.
- Rodriguez, C.E.; Bommer J.J.; Chandler R.J. Earthquake-induced landslides. Soil Dynamics and Earthquake Engineering 1999, 18, 325–346.
- Martino, S.; Prestininzi, A.; Romeo, R.W. Earthquake-induced ground failures in Italy from a reviewed database. Natural Hazards and Earth System Sciences 2014, 14, 799–814. [CrossRef]
- Martino, S. Earthquake-induced landslides in Italy. From the distribution of effects to the hazard mapping. Italian Journal of Engineering Geology and Environment 2017, 1, 53–67. [CrossRef]
- Caprari, P.; Della Seta, M.; Martino, S.; Fantini, A.; Fiorucci, M.; Priore T. Upgrade of the CEDIT database of earthquake-induced ground effects in Italy. Italian Journal of Engineering Geology and Environment 2018, 18, 23–39. [CrossRef]
- Keefer, D.K. Investigating landslides caused by earthquakes–a historical review. Surveys in Geophysics 2002, 23, 473–510. [CrossRef]
- Harp, E.L.; Wilson, R.C. Shaking Intensity Thresholds for Rock Falls and Slides: Evidence from 1987 Whittier Narrows and Superstition Hills Earthquake Strong-motion Records. Bulletin of the Seismological Society of America 1995, 85, 1739–1757.
- Khazai, B.; Sitar, N. Evaluation of factors controlling earthquake-induced landslides caused by Chi-Chi earthquake and comparison with the Northridge and Loma Prieta events. Engineering Geology 2004, 71, 79–95. [CrossRef]
- Wang, X.; Nie, G.; Wang, D. Relationships between ground motion parameters and landslides induced by Wenchuan earthquake. Earthquake Science 2010, 23, 233–242. [CrossRef]
- MPS Working Group. Redazione della mappa di pericolosità sismica prevista dall’Ordinanza PCM 3274 del 20 marzo 2003. Final Report for DPC, INGV, Milano-Roma, http://zonesismiche.mi.ingv.it/ (in Italian) 2004.
- Stucchi, M.; Meletti, C.; Montaldo, V.; Crowley, H.; Calvi, G.M.; Boschi, E. Seismic Hazard Assessment (2003-2009) for the Italian Building Code. Bulletin of the Seismological Society of America 2011, 101, 1885–1911. [CrossRef]
- Barani, S.; Spallarossa, D.; Bazzurro, P. Disaggregation of Probabilistic Ground-Motion Hazard in Italy. Bulletin of the Seismological Society of America 2009, 99, 2638–2661. [CrossRef]
- SM Working Group. Indirizzi e criteri per la microzonazione sismica, Conferenza delle Regioni e delle Province autonome. Dipartimento della protezione civile, Roma, 2008, https://www.protezionecivile.gov.it/it/pubblicazione/indirizzi-e-criteri-la-microzonazione-sismica 2008.
- SM Working Group. Guidelines for Seismic Microzonation, Conference of Regions and Autonomous Provinces of Italy. Civil Protection Department, Rome, https://www.centromicrozonazionesismica.it/it/download/category/9-guidelines-for-seismic-microzonation 2015.
- Ministero delle Infrastrutture e dei Trasporti. Aggiornamento delle “Norme tecniche per le costruzioni”, D.M. 17 Gennaio 2018, Supplemento ordinario alla Gazzetta Ufficiale N. 42 del 20 Febbraio 2018.
- Barani, S.; Bazzurro, P.; Pelli, F. A probabilistic method for the prediction of earthquake-induced slope displacements. In Proceedings of the Fifth International Conference on Recent Advances in Geotechnical Earthquake Engineering and Soil Dynamics, San Diego, California, 24-29May 2010.
- Fotopoulou, S.D.; Pitilakis, K.D. Predictive relationships for seismically induced slope displacements using numerical analysis results. Bulletin of Earthquake Engineering 2015, 13, 3207–3238. [CrossRef]
- Martino, S.; Battaglia, S.; D’Alessandro, F.; Della Seta, M.; Esposito, C.; Martini, G.; Pallone, F.; Troiani, F. Earthquake induced landslide scenarios for seismic microzonation: application to the Accumoli area (Rieti, Italy). Bulletin of Earthquake Engineering 2020, 18, 5655–5673. [CrossRef]
- Bray, J.D.; Macedo, J. Performance-based seismic assessment of slope systems. Soil Dynamics and Earthquake Engineering 2023, 168, 107835. [CrossRef]
- Bazzurro, P.; Cornell, C.A. Disaggregation of seismic hazard. Bulletin of the Seismological Society of America 1999, 89, 501–520.
- Keefer, D.K.; Wilson, R.C. Predicting earthquake-induced landslides, with emphasis on arid and semi-arid environments. Landslides in a semi-arid environment 1989, 2, 118–149.
- Wilson, R.C. Relation of Arias Intensity to Magnitude and Distance in California. US Geological Survey 1993, 2331–1258. [CrossRef]
- Jibson, R.W.; Harp E.L. Ground Motions at the Outermost Limits of Seismically Triggered Landslides. Bulletin of the Seismological Society of America 2016, 106, 708–719. [CrossRef]
- Barani, S.; Ferretti, G.; Scafidi, D. Evaluation of liquefaction triggering potential in Italy: a seismic-hazard-based approach. Natural Hazards and Earth System Sciences 2023, 23, 1685–1698. [CrossRef]
- Barani, S.; Ferretti, G.; Scafidi, D. Update of the liquefaction triggering map of Italy. Accepted for publication in Proceedings of the 18th world conference on earthquake engineering, Milan, Italy, 30 June – 5 July.
- QGIS Geographic Information System. Available online: https://www.qgis.org/en/site/ (accessed on 6 March 2024).
- Gonzalez, R.C.; Woods, R.E. Digital Image Processing. Fourth Edition, Pearson 330 Hudson Street, New York, NY 10013, 2018.
- Sonka, M; Hlavac, V; Boyle, R. Image Processing, Analysis, and Machine Vision. Fourth Edition, Cengage Learning 200 First Stamford Place, 4th Floor Stamford, CT 06902 USA, 2014.
- Gavet, Y.; Debayle, J. Image Processing Tutorials with Python. Spartacus-Idh, 2019.
- Forte, G.; Chioccarelli, E.; De Falco, M.; Cito, P.; Santo, A.; Iervolino, I. Seismic soil classification of Italy based on surface geology and shear-wave velocity measurements. Soil Dynamics and Earthquake Engineering 2019, 122, 79–93. [CrossRef]
- Sabetta, F.; Pugliese, A.; Fiorentino, G.; Lanzano, G.; Luzi, L. Simulation of non-stationary stochastic ground motions based on recent Italian earthquakes. Bulletin of Earthquake Engineering 2021, 19, 3287–3315. [CrossRef]
| 1 | This is the English edition of the original document released by the SM Working Group in 2008. |
Figure 1.
Sensitivity of the maximum filtering operation to the configuration of the structuring element: (a) cross-pattern with 4 neighboring pixels and (b) square-pattern encompassing 8 neighboring pixels. The mean and modal scenarios are shown in yellow and red colors, respectively.
Figure 1.
Sensitivity of the maximum filtering operation to the configuration of the structuring element: (a) cross-pattern with 4 neighboring pixels and (b) square-pattern encompassing 8 neighboring pixels. The mean and modal scenarios are shown in yellow and red colors, respectively.
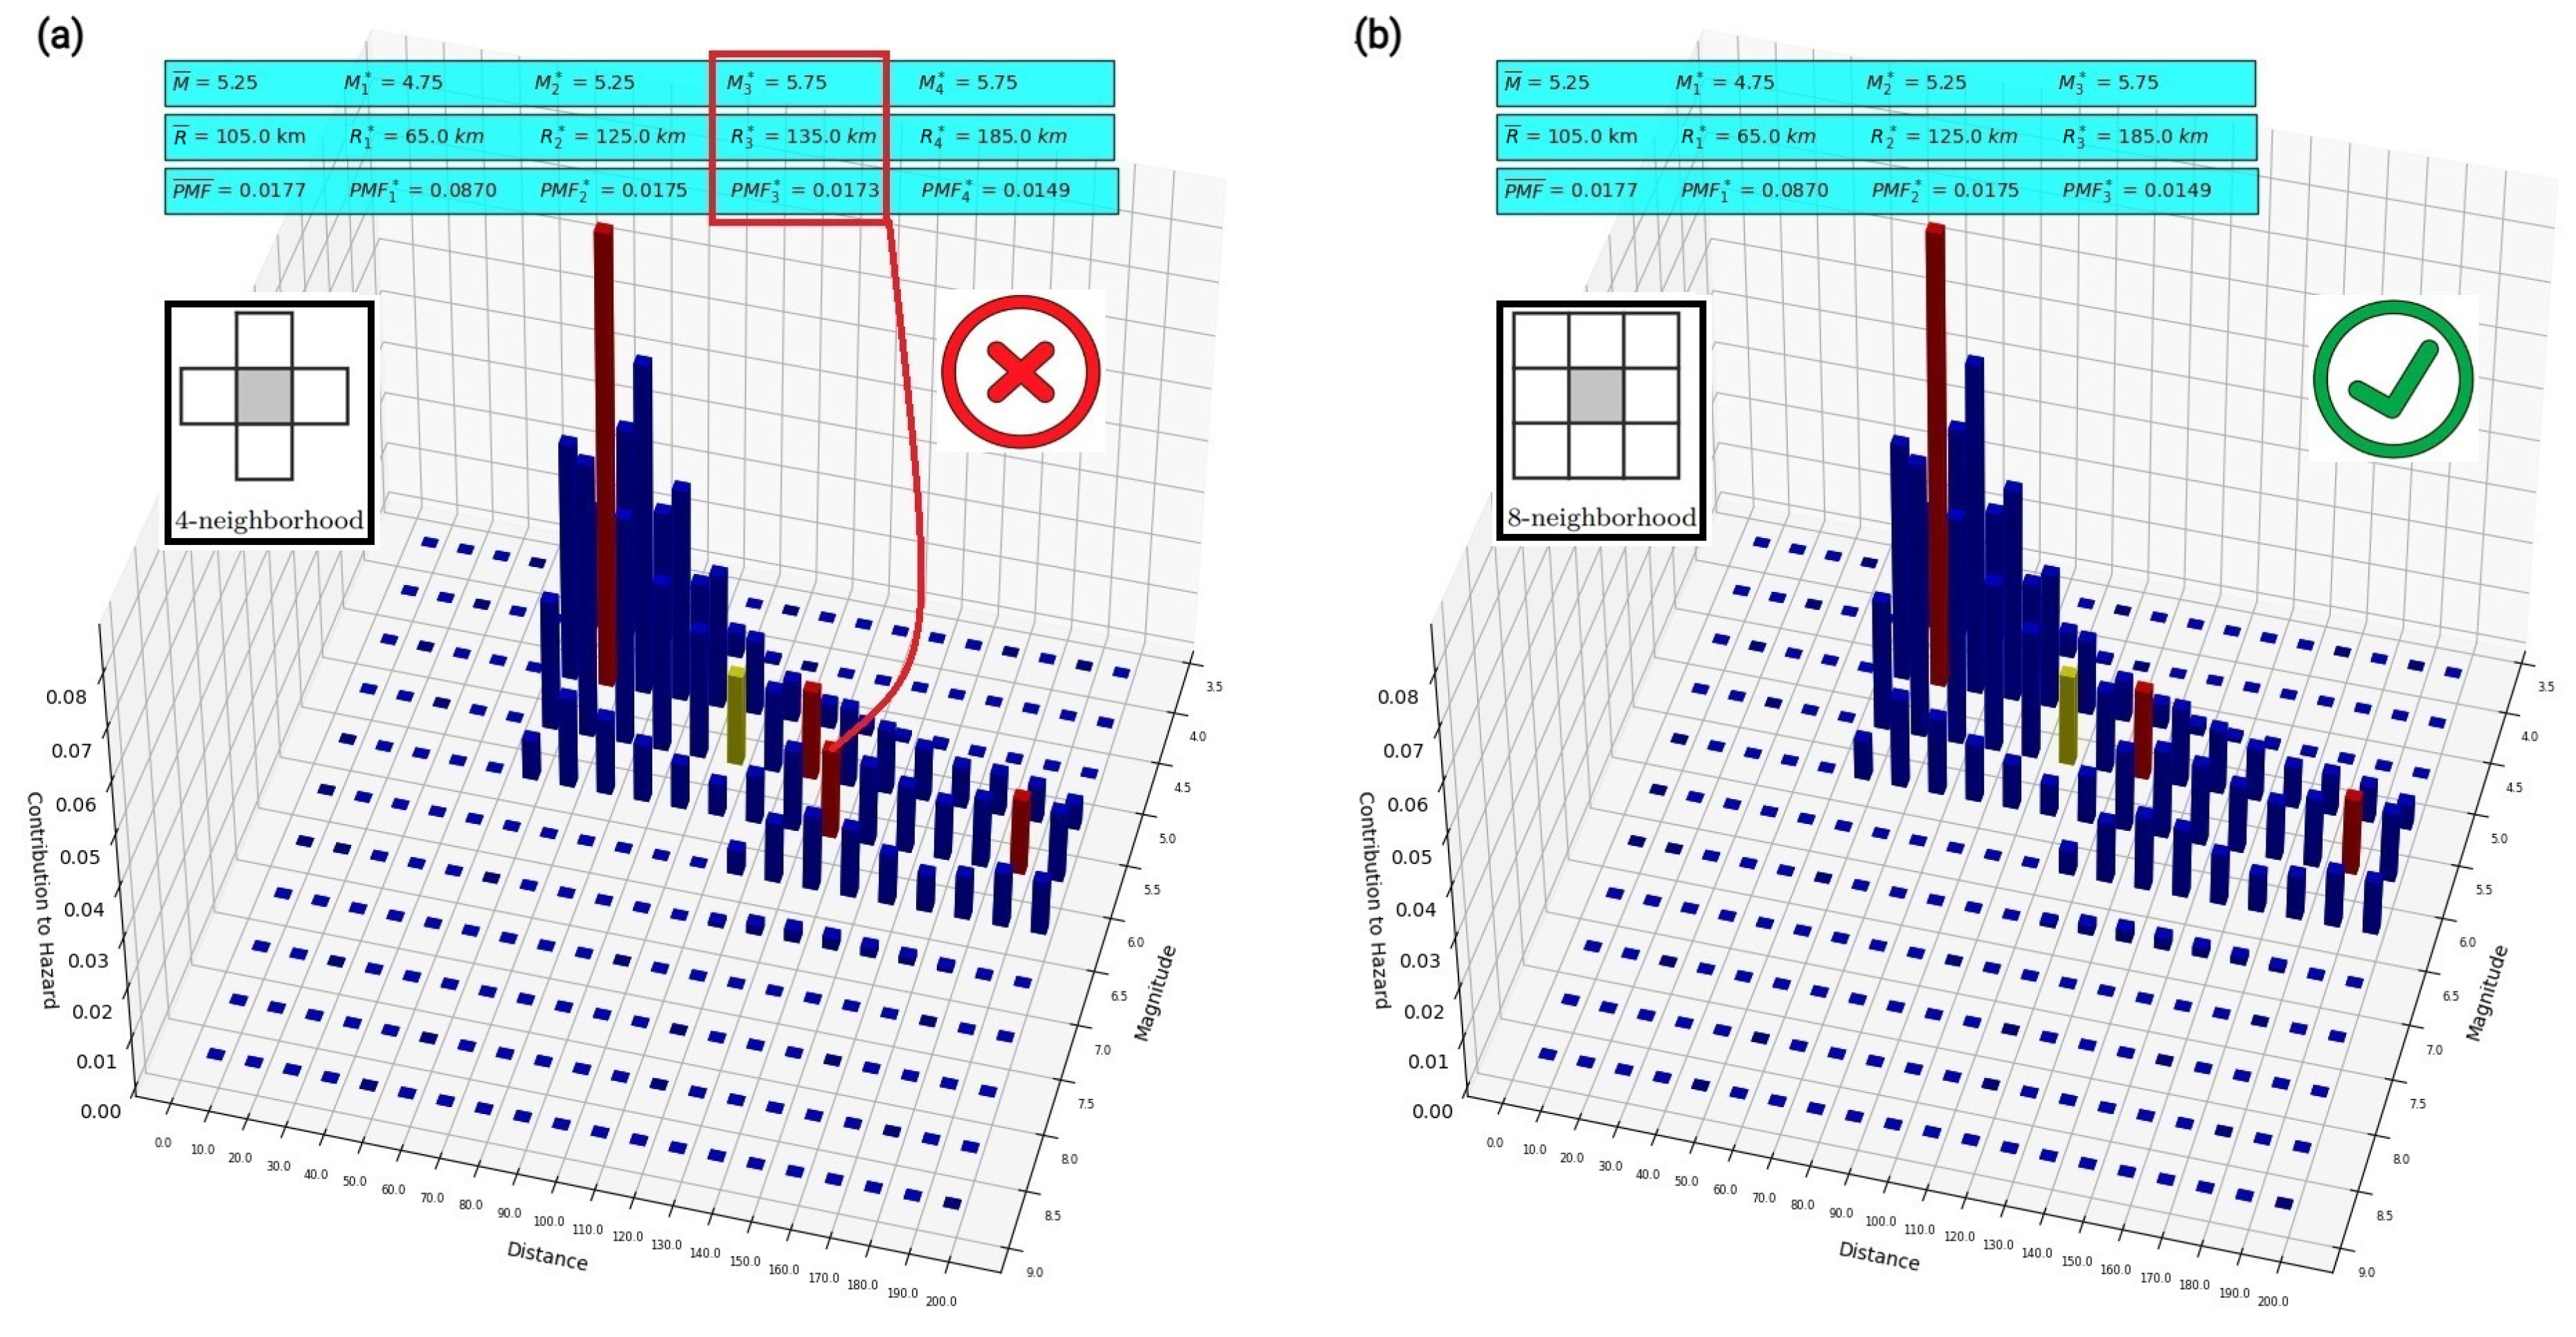
Figure 2.
Sensitivity of the maximum filtering operation to the size of the structuring element: (a) 3-by-3 window and (b) 5-by-5 window. The mean and modal scenarios are shown in yellow and red colors, respectively.
Figure 2.
Sensitivity of the maximum filtering operation to the size of the structuring element: (a) 3-by-3 window and (b) 5-by-5 window. The mean and modal scenarios are shown in yellow and red colors, respectively.
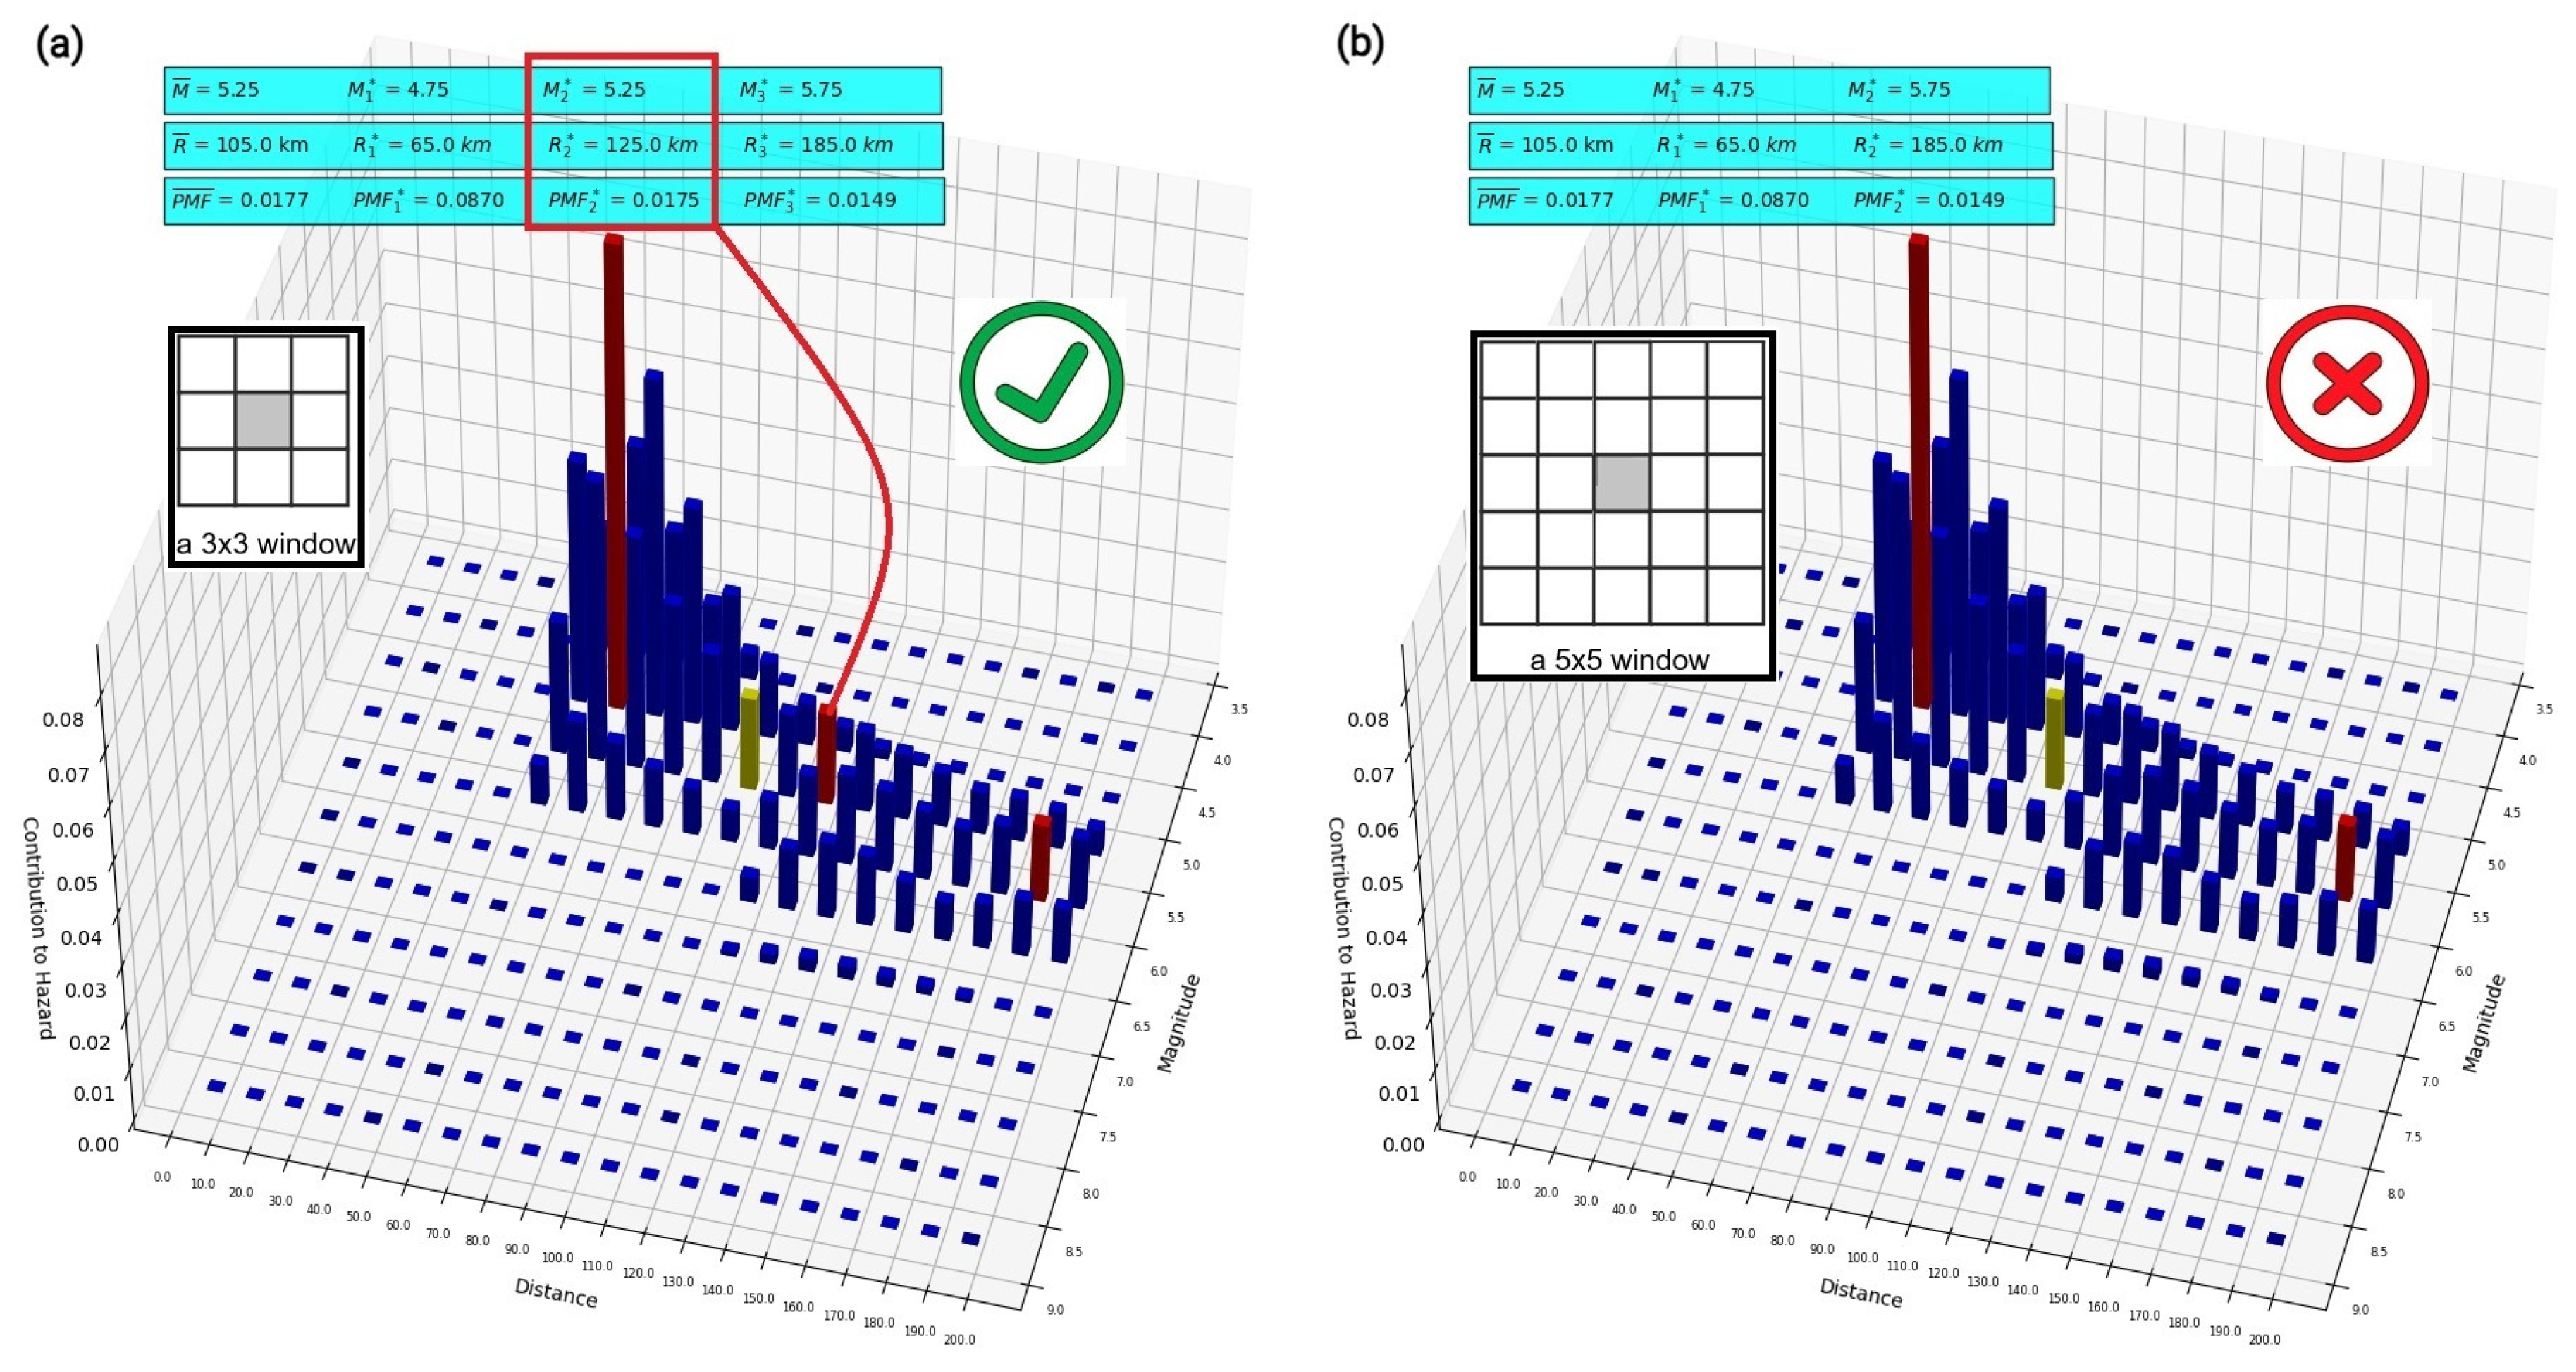
Figure 3.
Comparison of the mean and modal - pairs with the upper-bound curves of Keefer [1] for (a) disrupted slides and falls, (b) coherent landslides, and (c) lateral spreads and flows. The red arrow indicates the reference - scenario.
Figure 3.
Comparison of the mean and modal - pairs with the upper-bound curves of Keefer [1] for (a) disrupted slides and falls, (b) coherent landslides, and (c) lateral spreads and flows. The red arrow indicates the reference - scenario.
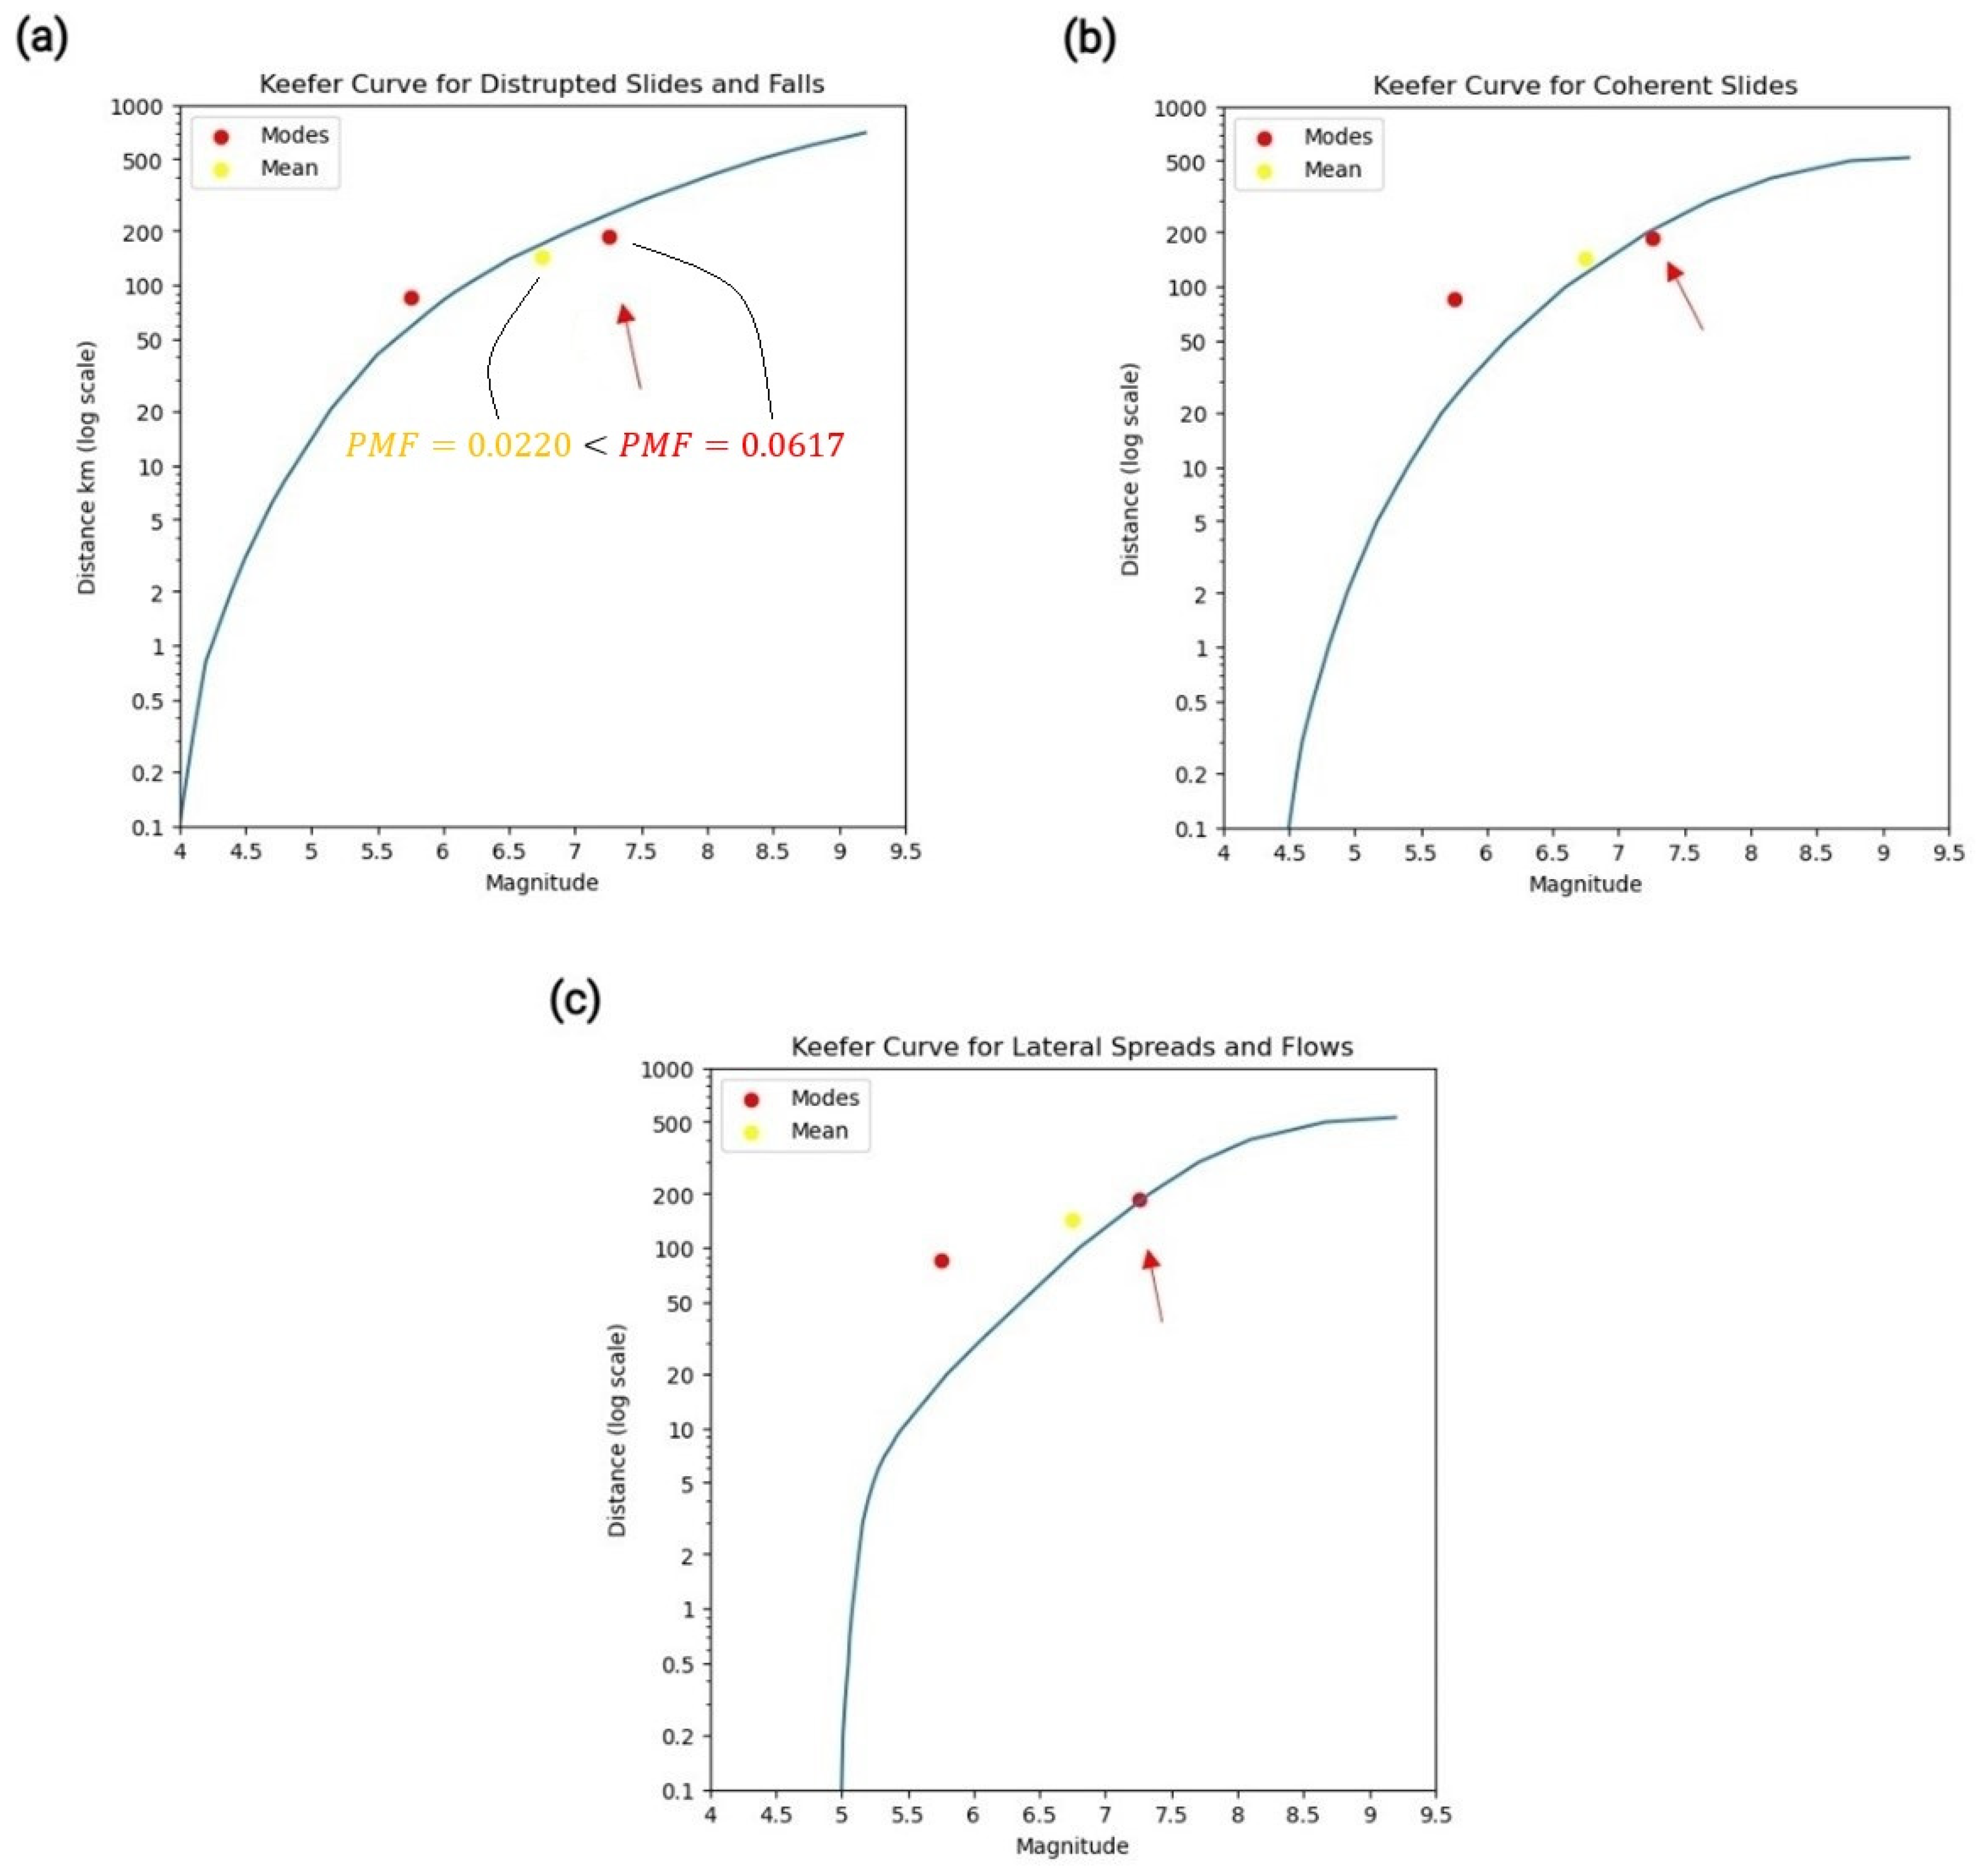
Figure 4.
Geographic distributions of the reference period-dependent magnitude and distance , and of the relative contribution to the hazard (in terms of PMF value) for a 475-yr return period: panels (a), (b), and (c) refer to a response period T = 0.01s, whereas panels (d), (e), and (f) are for T = 1.0s. The figure is provided for coherent slides.
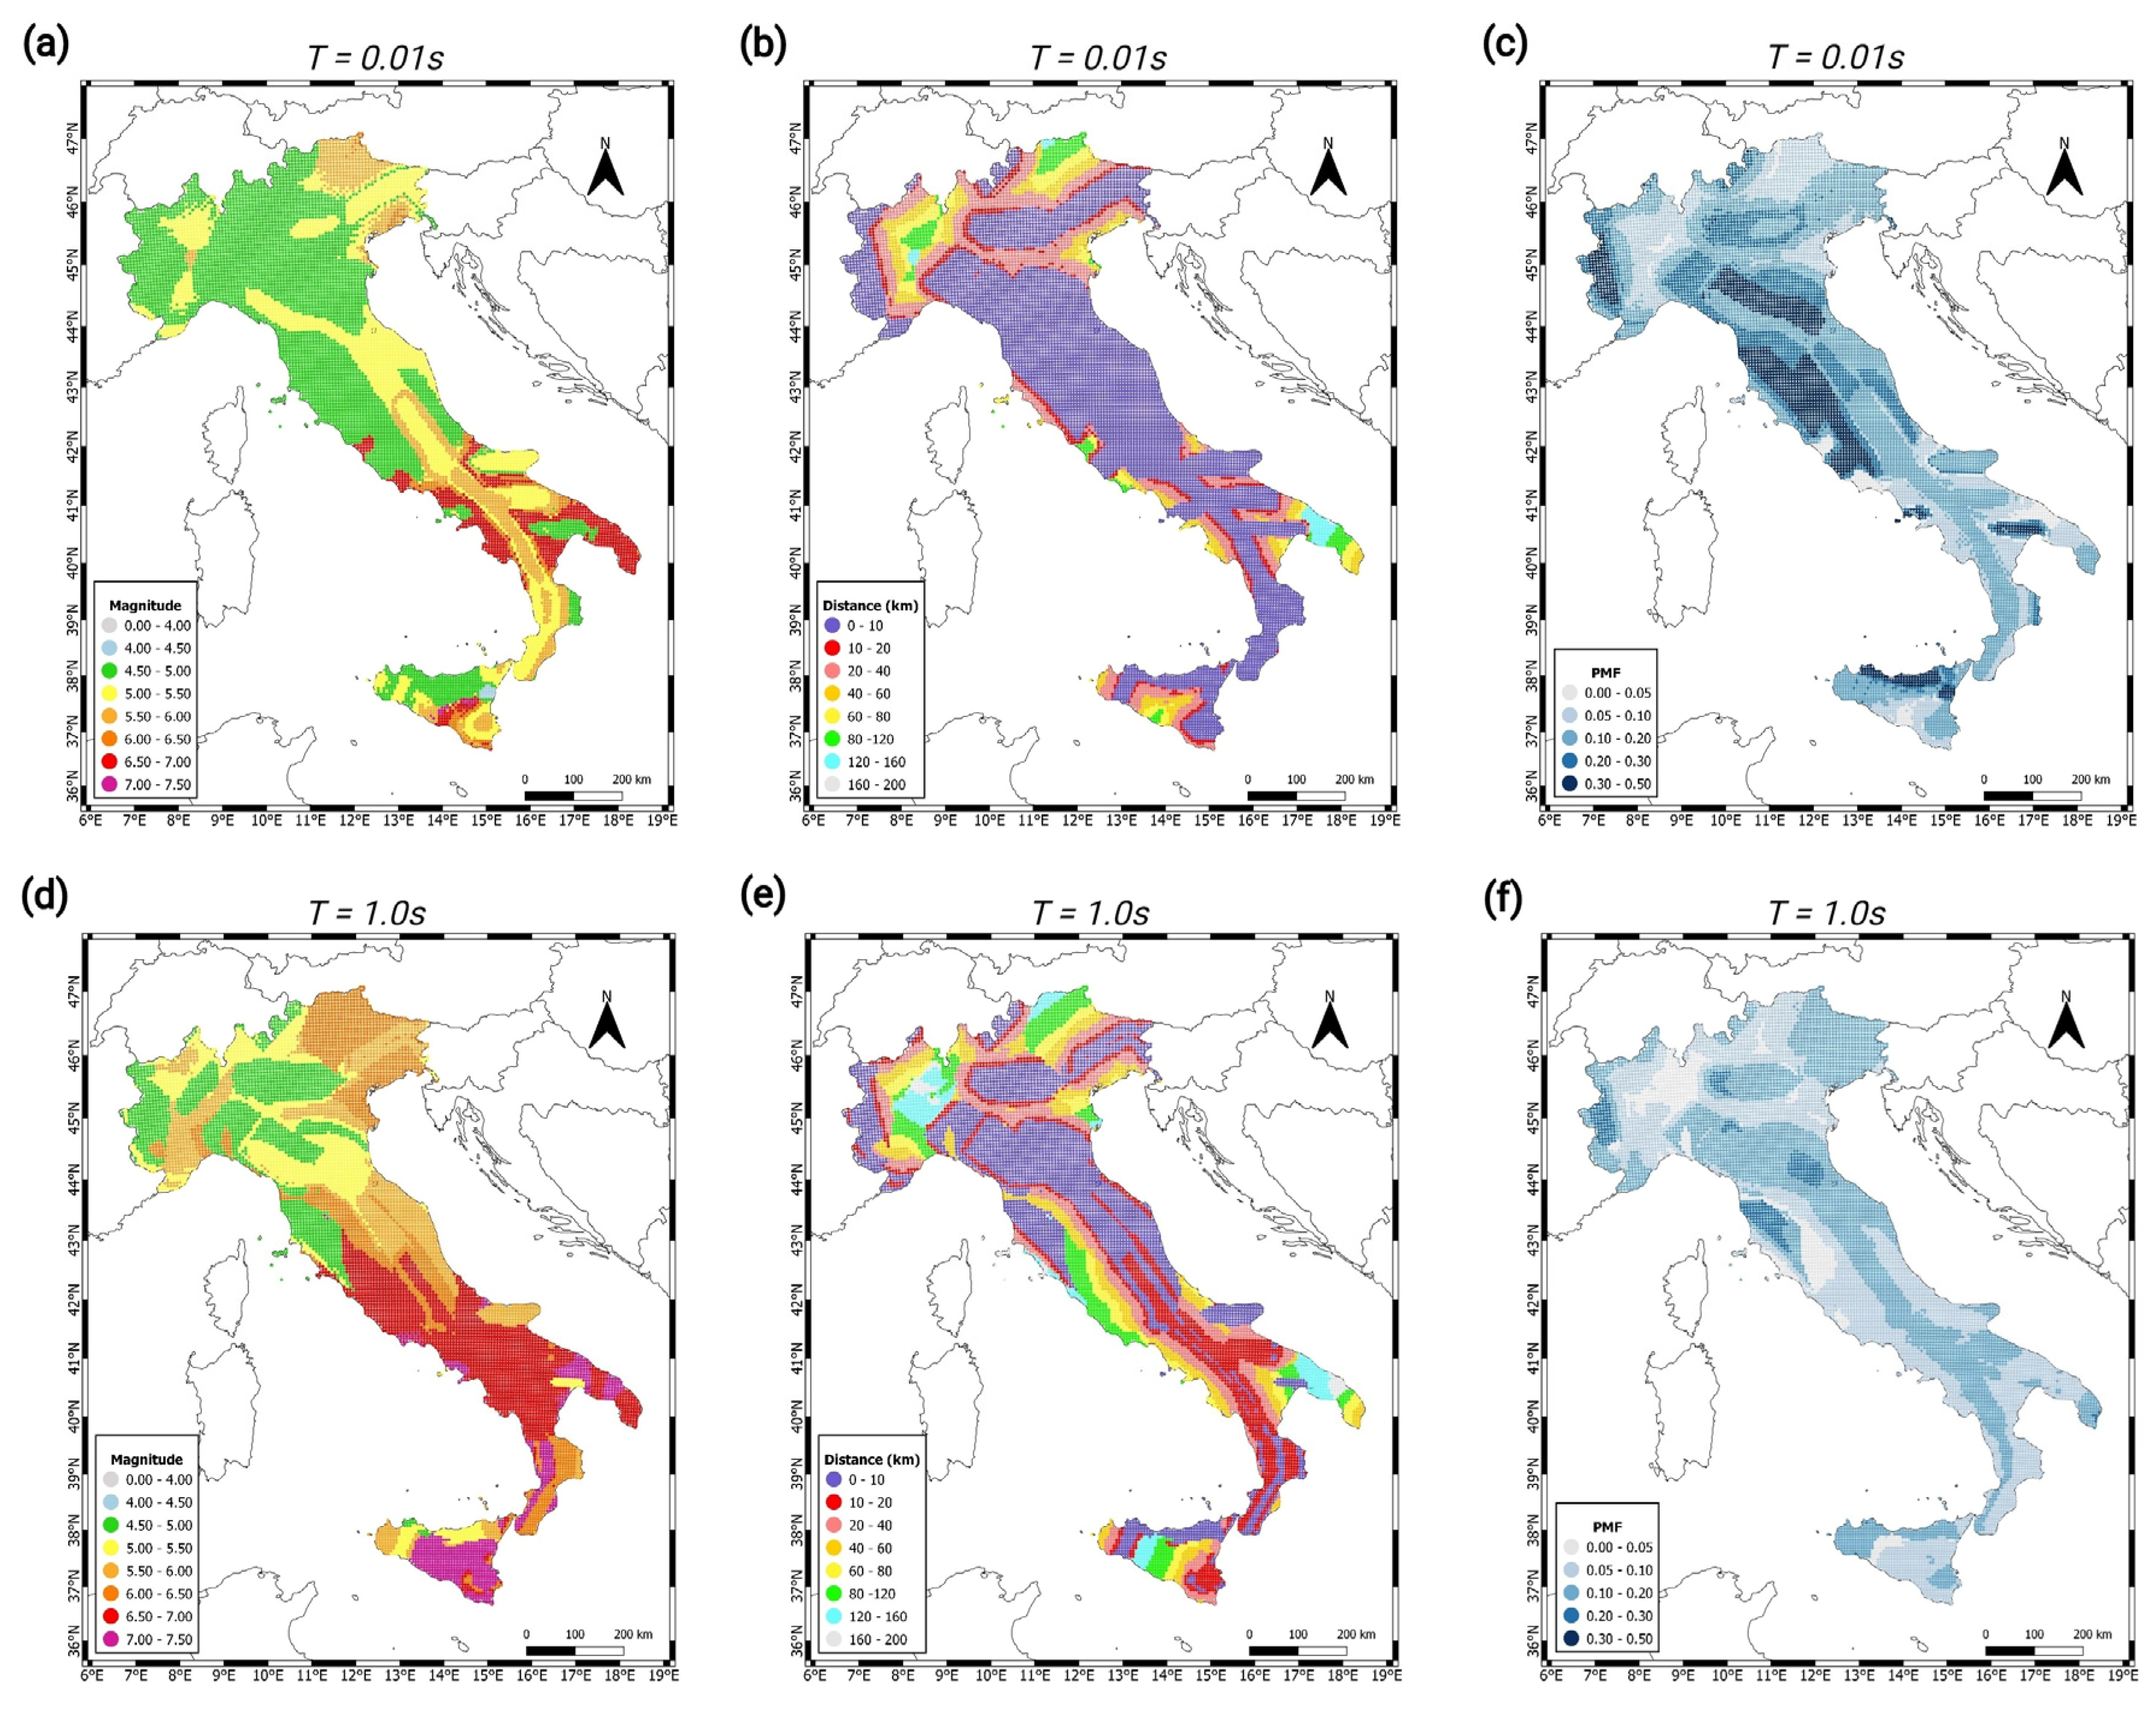
Figure 5.
Preliminary period-dependent maps of seismic triggering of coherent landslides for a 475-yr return period: (a) T = 0.01s, (b) T = 0.2s, (c) T = 0.5s, and (d) T = 1.0s. Sites where landslide triggering is expected to occur are displayed in red.
Figure 5.
Preliminary period-dependent maps of seismic triggering of coherent landslides for a 475-yr return period: (a) T = 0.01s, (b) T = 0.2s, (c) T = 0.5s, and (d) T = 1.0s. Sites where landslide triggering is expected to occur are displayed in red.
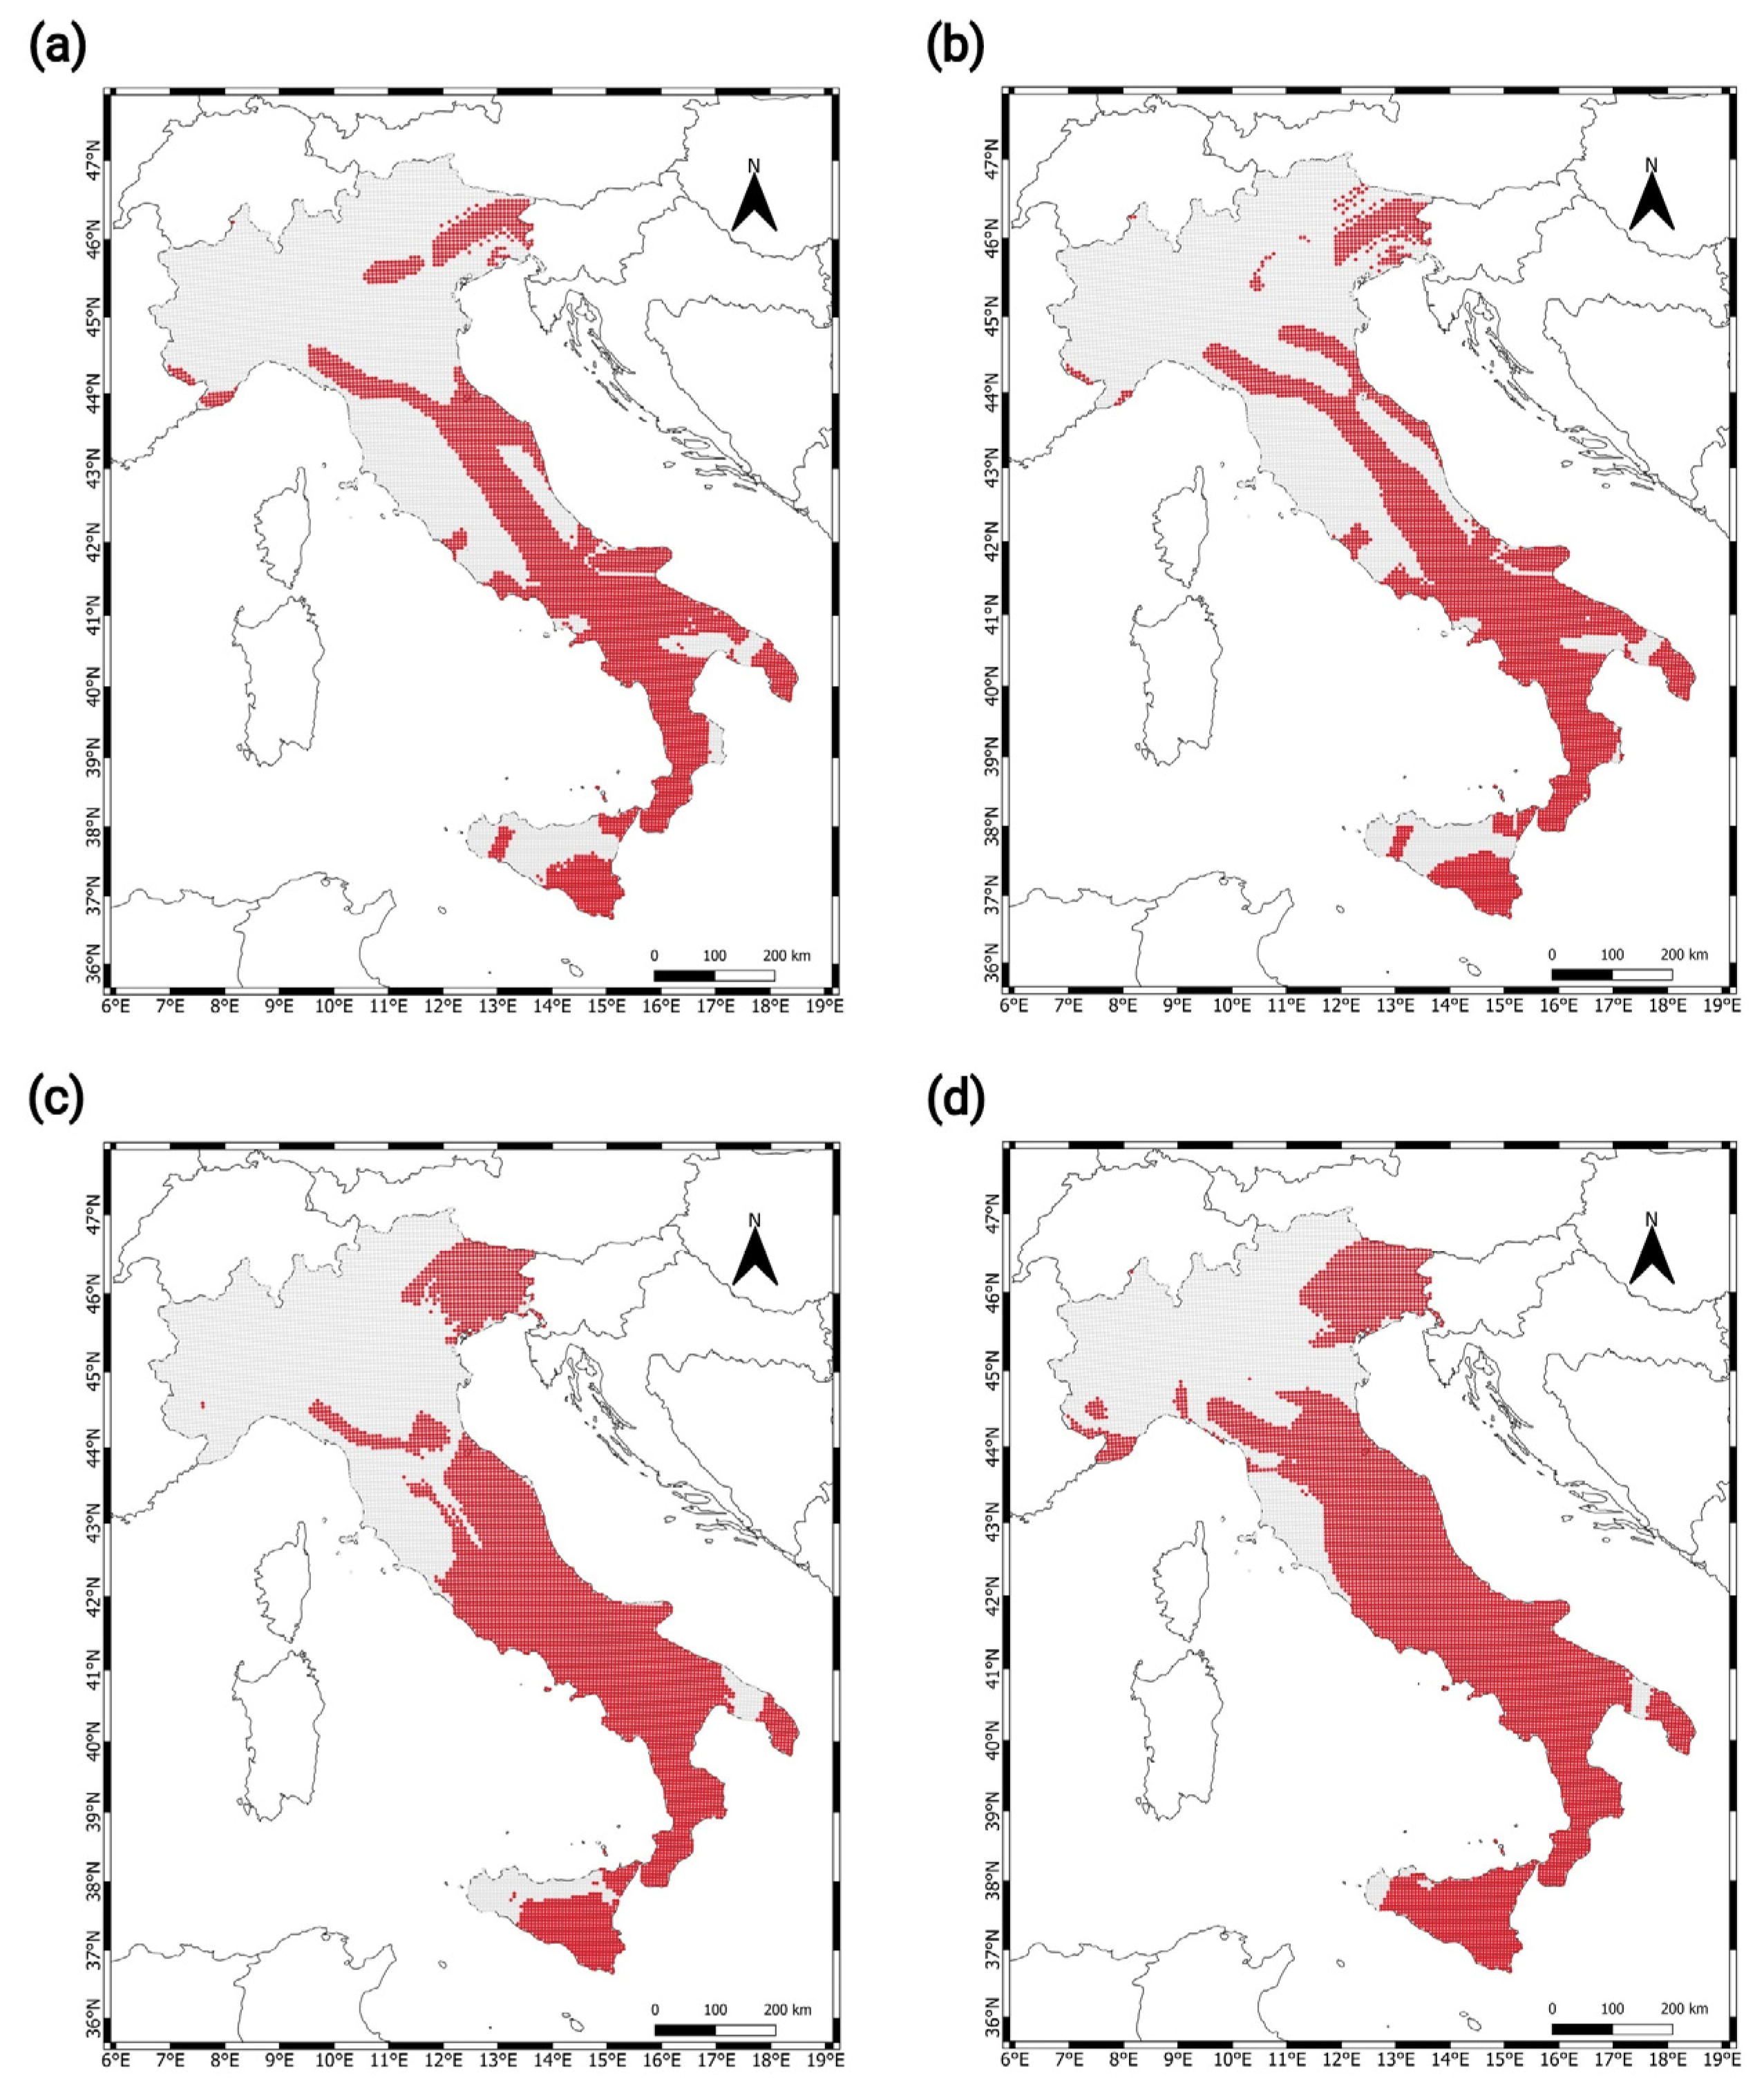
Figure 6.
Maps of reference period-independent magnitude (left column) and distance (right column) scenarios associated with a 475-yr return period for different failure mechanisms: (a) and (b) disrupted slides and falls, (c) and (d) coherent slides, (e) and (f) lateral spreads and flows.
Figure 6.
Maps of reference period-independent magnitude (left column) and distance (right column) scenarios associated with a 475-yr return period for different failure mechanisms: (a) and (b) disrupted slides and falls, (c) and (d) coherent slides, (e) and (f) lateral spreads and flows.
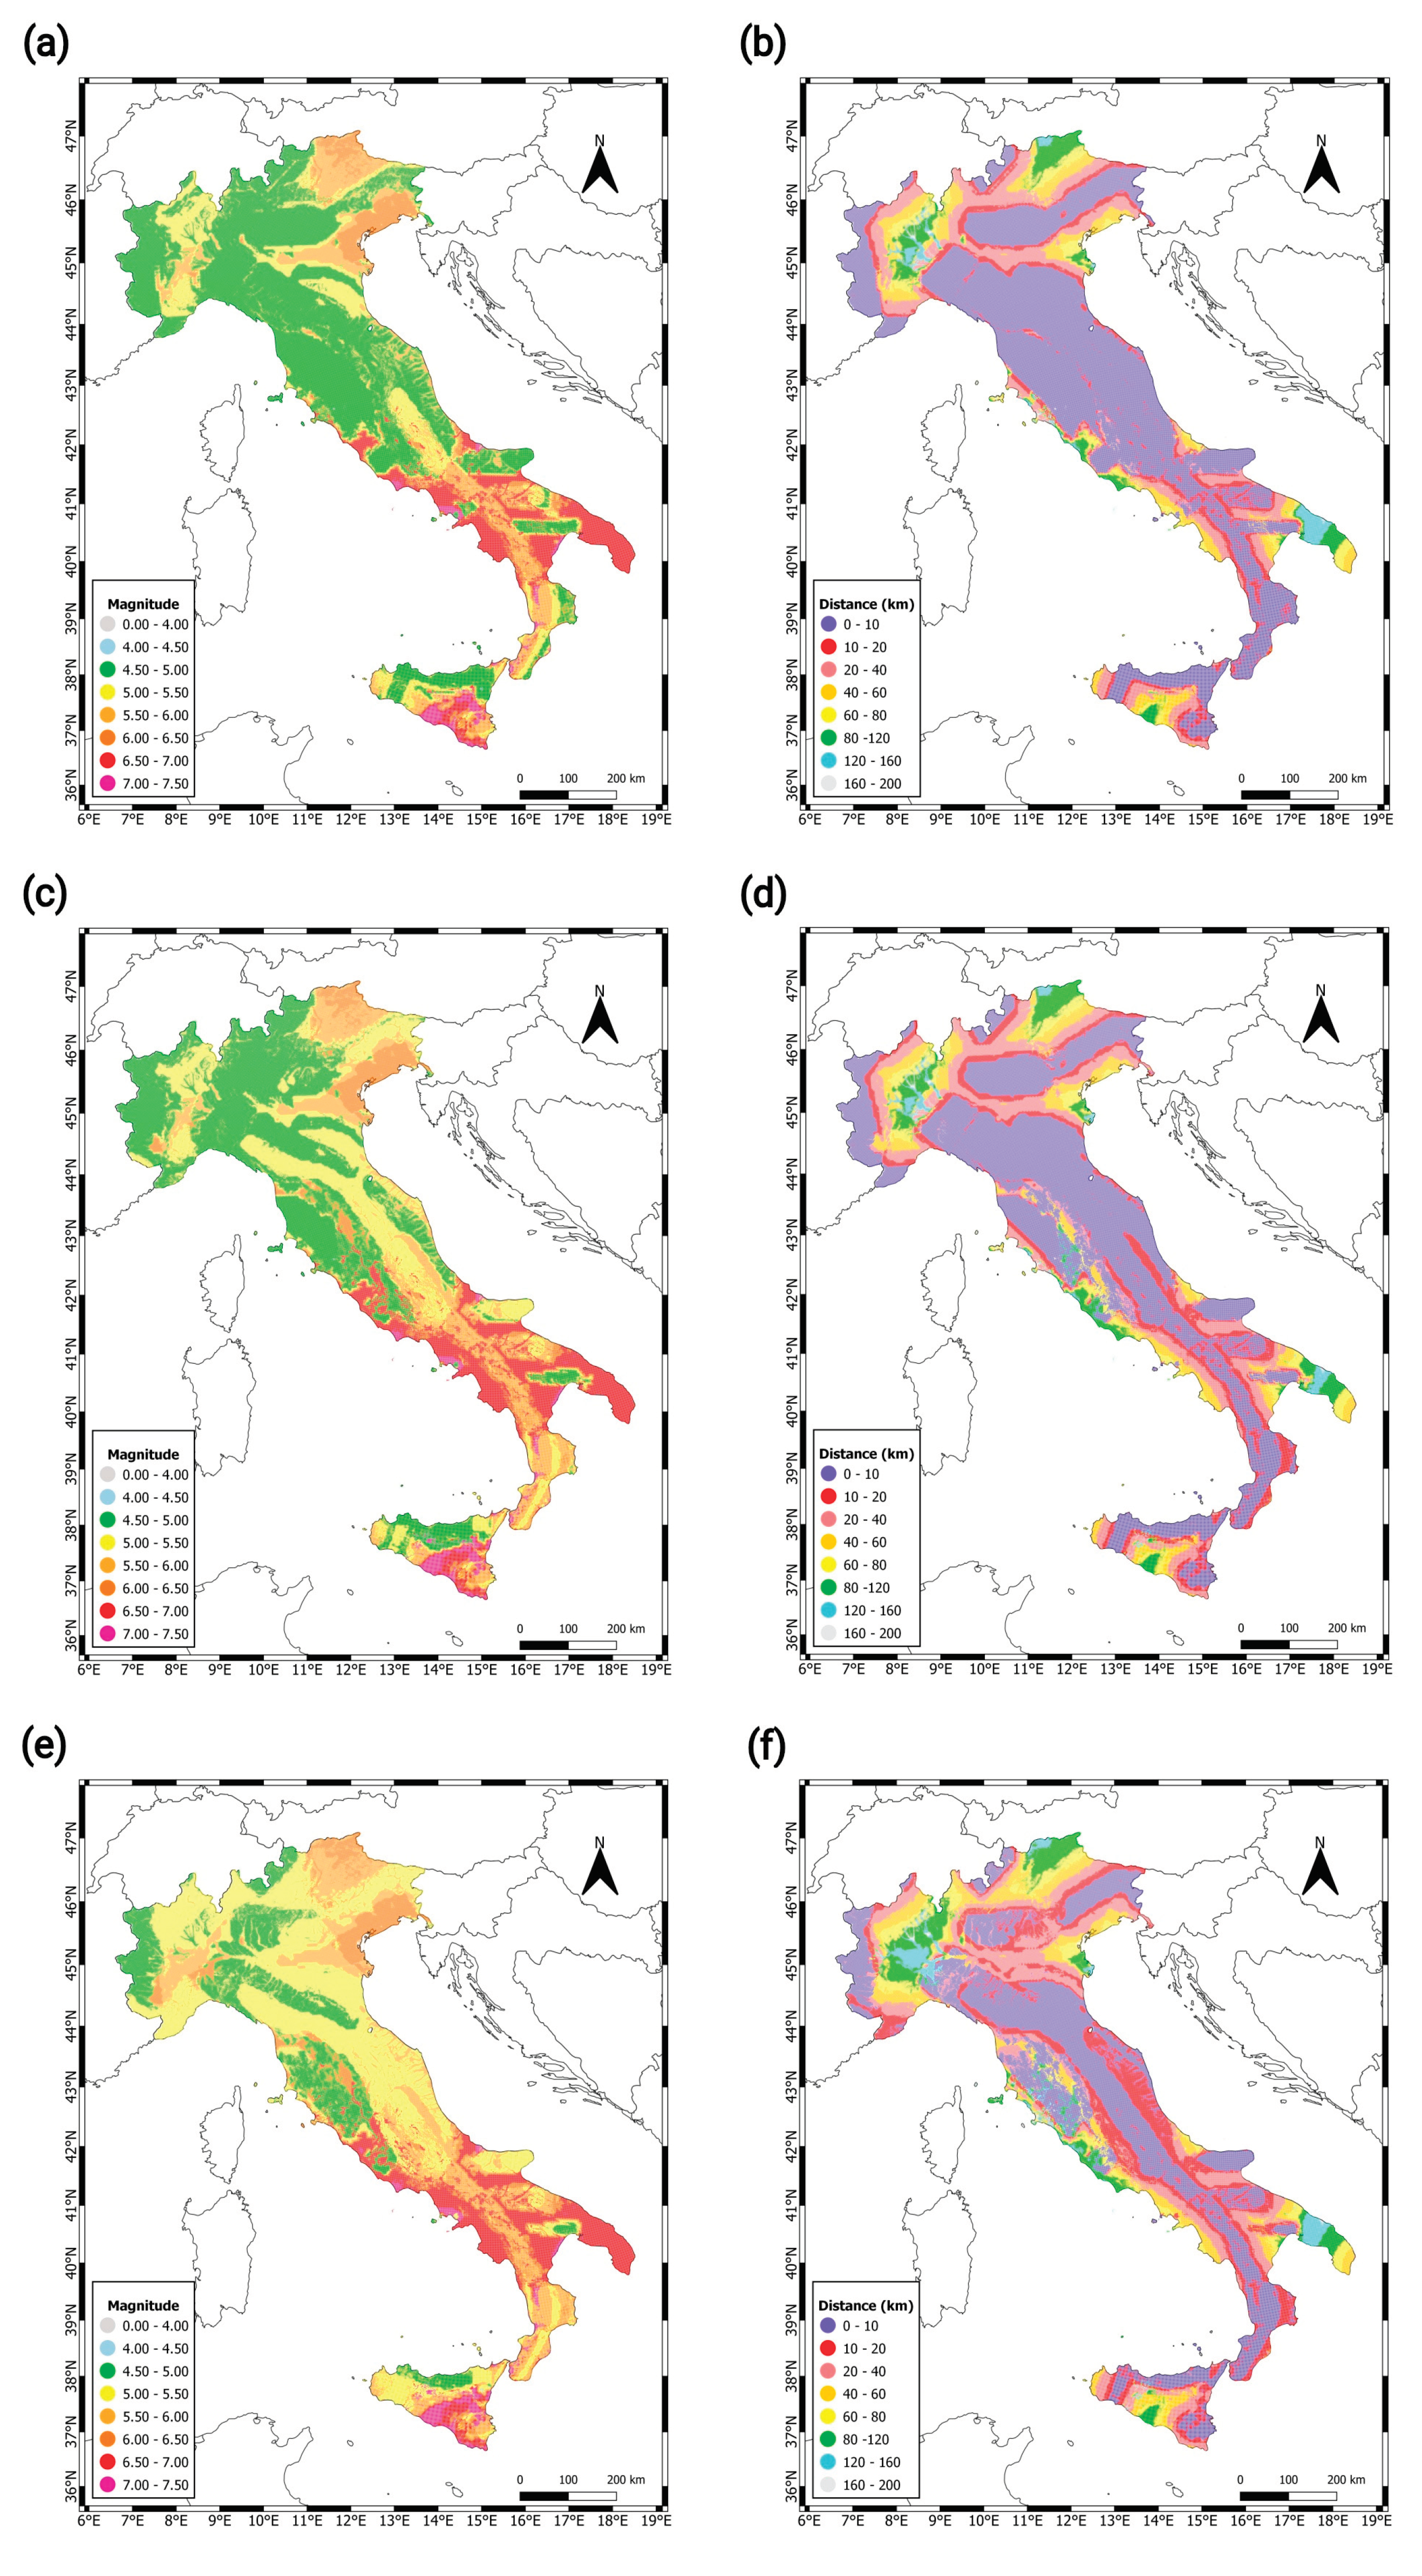
Figure 7.
Period-independent triggering maps associated with a 475-yr return period for different types of landslides: (a) disrupted slides and falls, (b) coherent slides, and (c) lateral spreads and flows. Sites where landslide triggering is expected to occur are displayed in red.
Figure 7.
Period-independent triggering maps associated with a 475-yr return period for different types of landslides: (a) disrupted slides and falls, (b) coherent slides, and (c) lateral spreads and flows. Sites where landslide triggering is expected to occur are displayed in red.
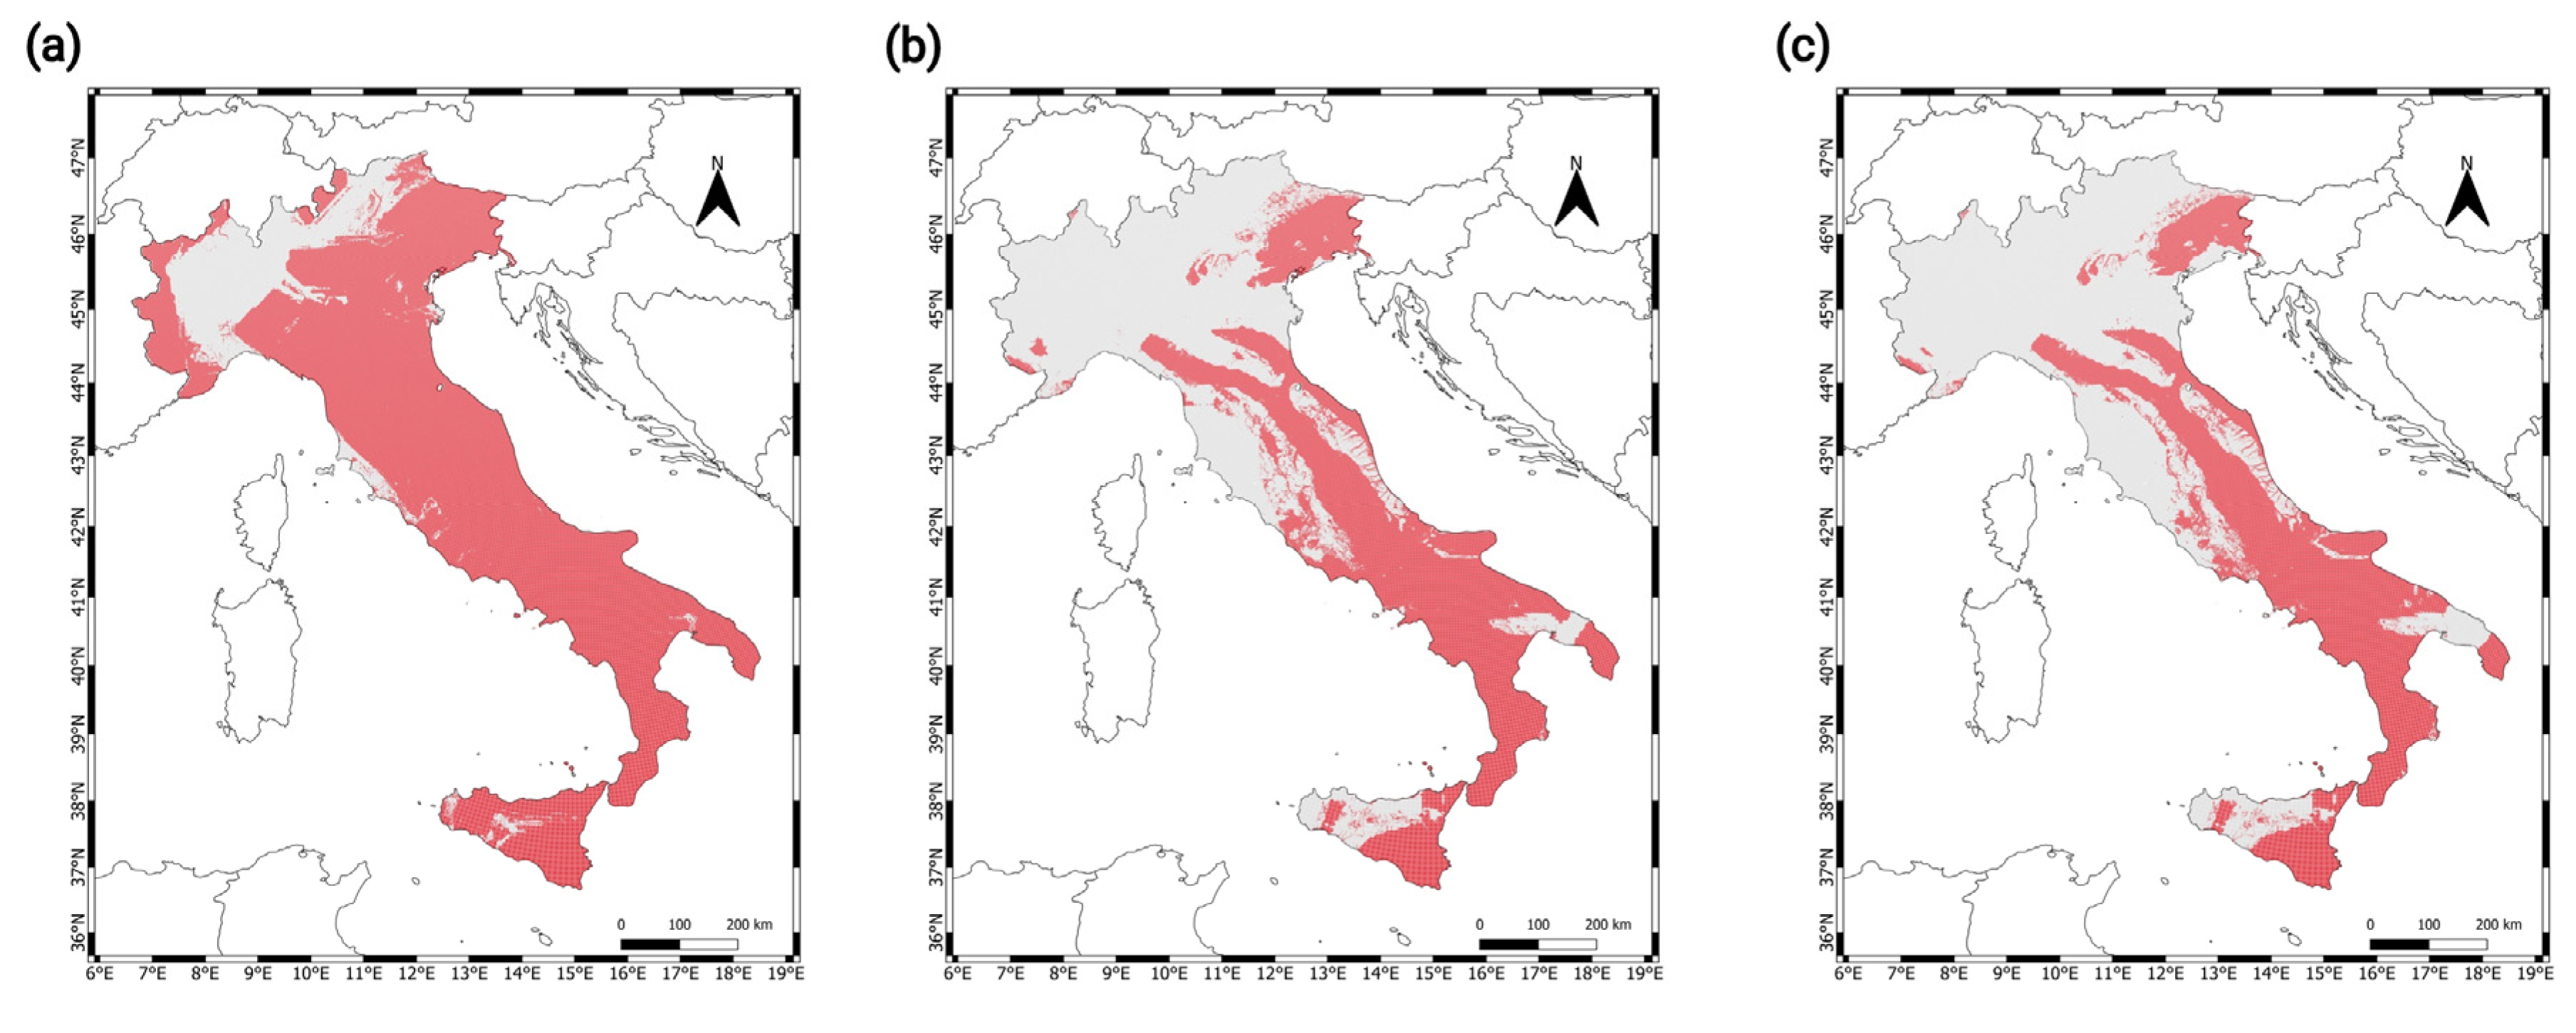
Figure 8.
Maps of seismic landslide triggering corresponding to different return periods: (a) a 475-yr, (b) a 975-yr, and (c) 2475-yr. DSF: disrupted slides and falls; C: coherent slides; LSF: lateral spreads and flows. Historical landslide events in Italy (from the Italian Catalogue of Earthquake-Induced Ground Failures – CEDIT; [7]) are superimposed.
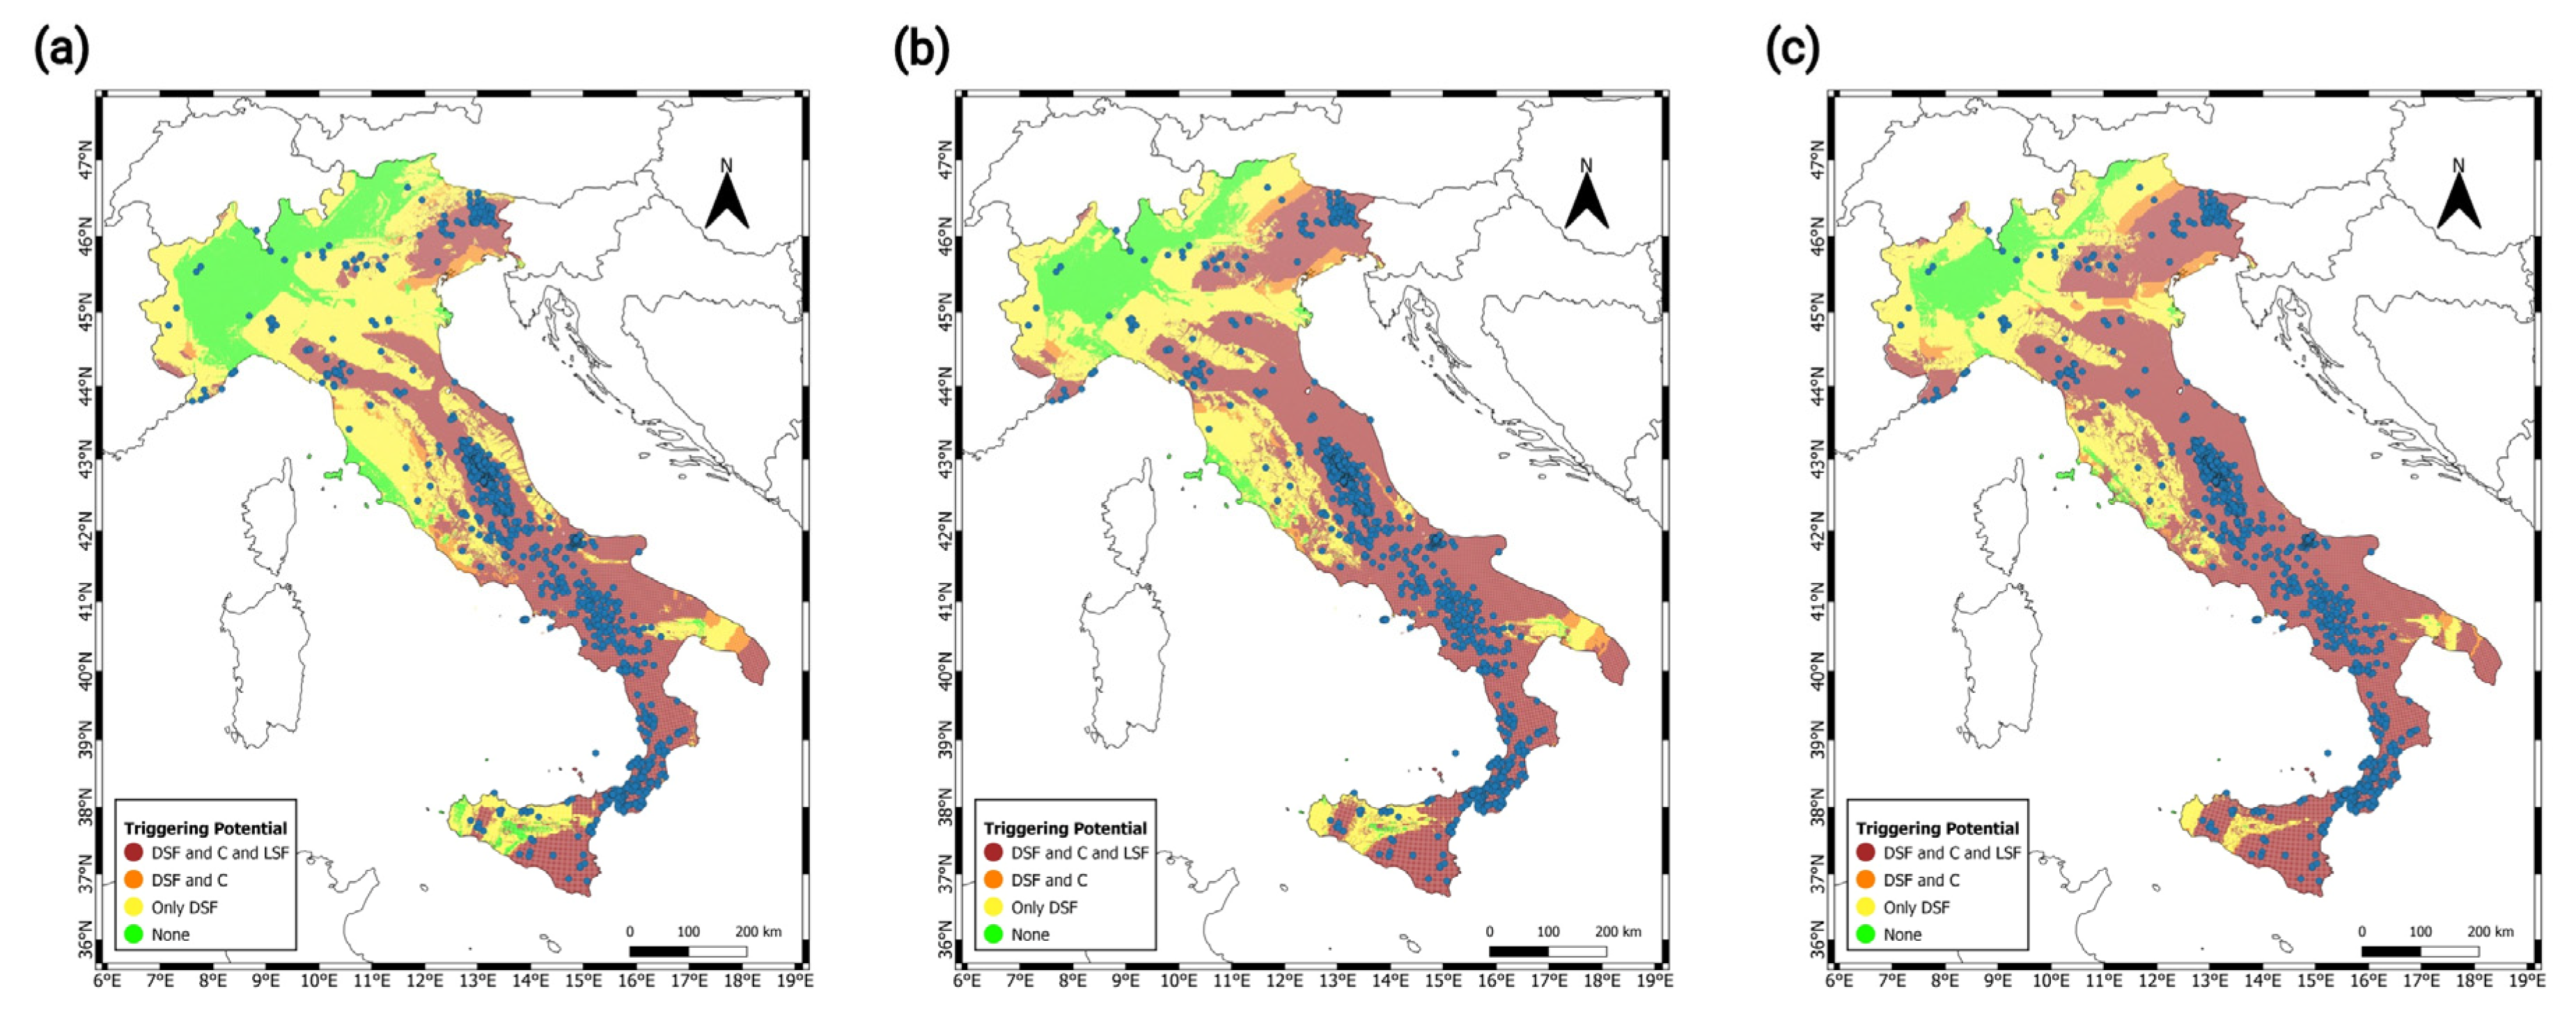
Figure 9.
Maps showing the probability of seismic landslide triggering (see Equation (3)) for (a) disrupted slides and falls, (b) coherent slides, and (c) lateral spreads and flows. All maps refer to source data for a return period of 475 years.
Figure 9.
Maps showing the probability of seismic landslide triggering (see Equation (3)) for (a) disrupted slides and falls, (b) coherent slides, and (c) lateral spreads and flows. All maps refer to source data for a return period of 475 years.
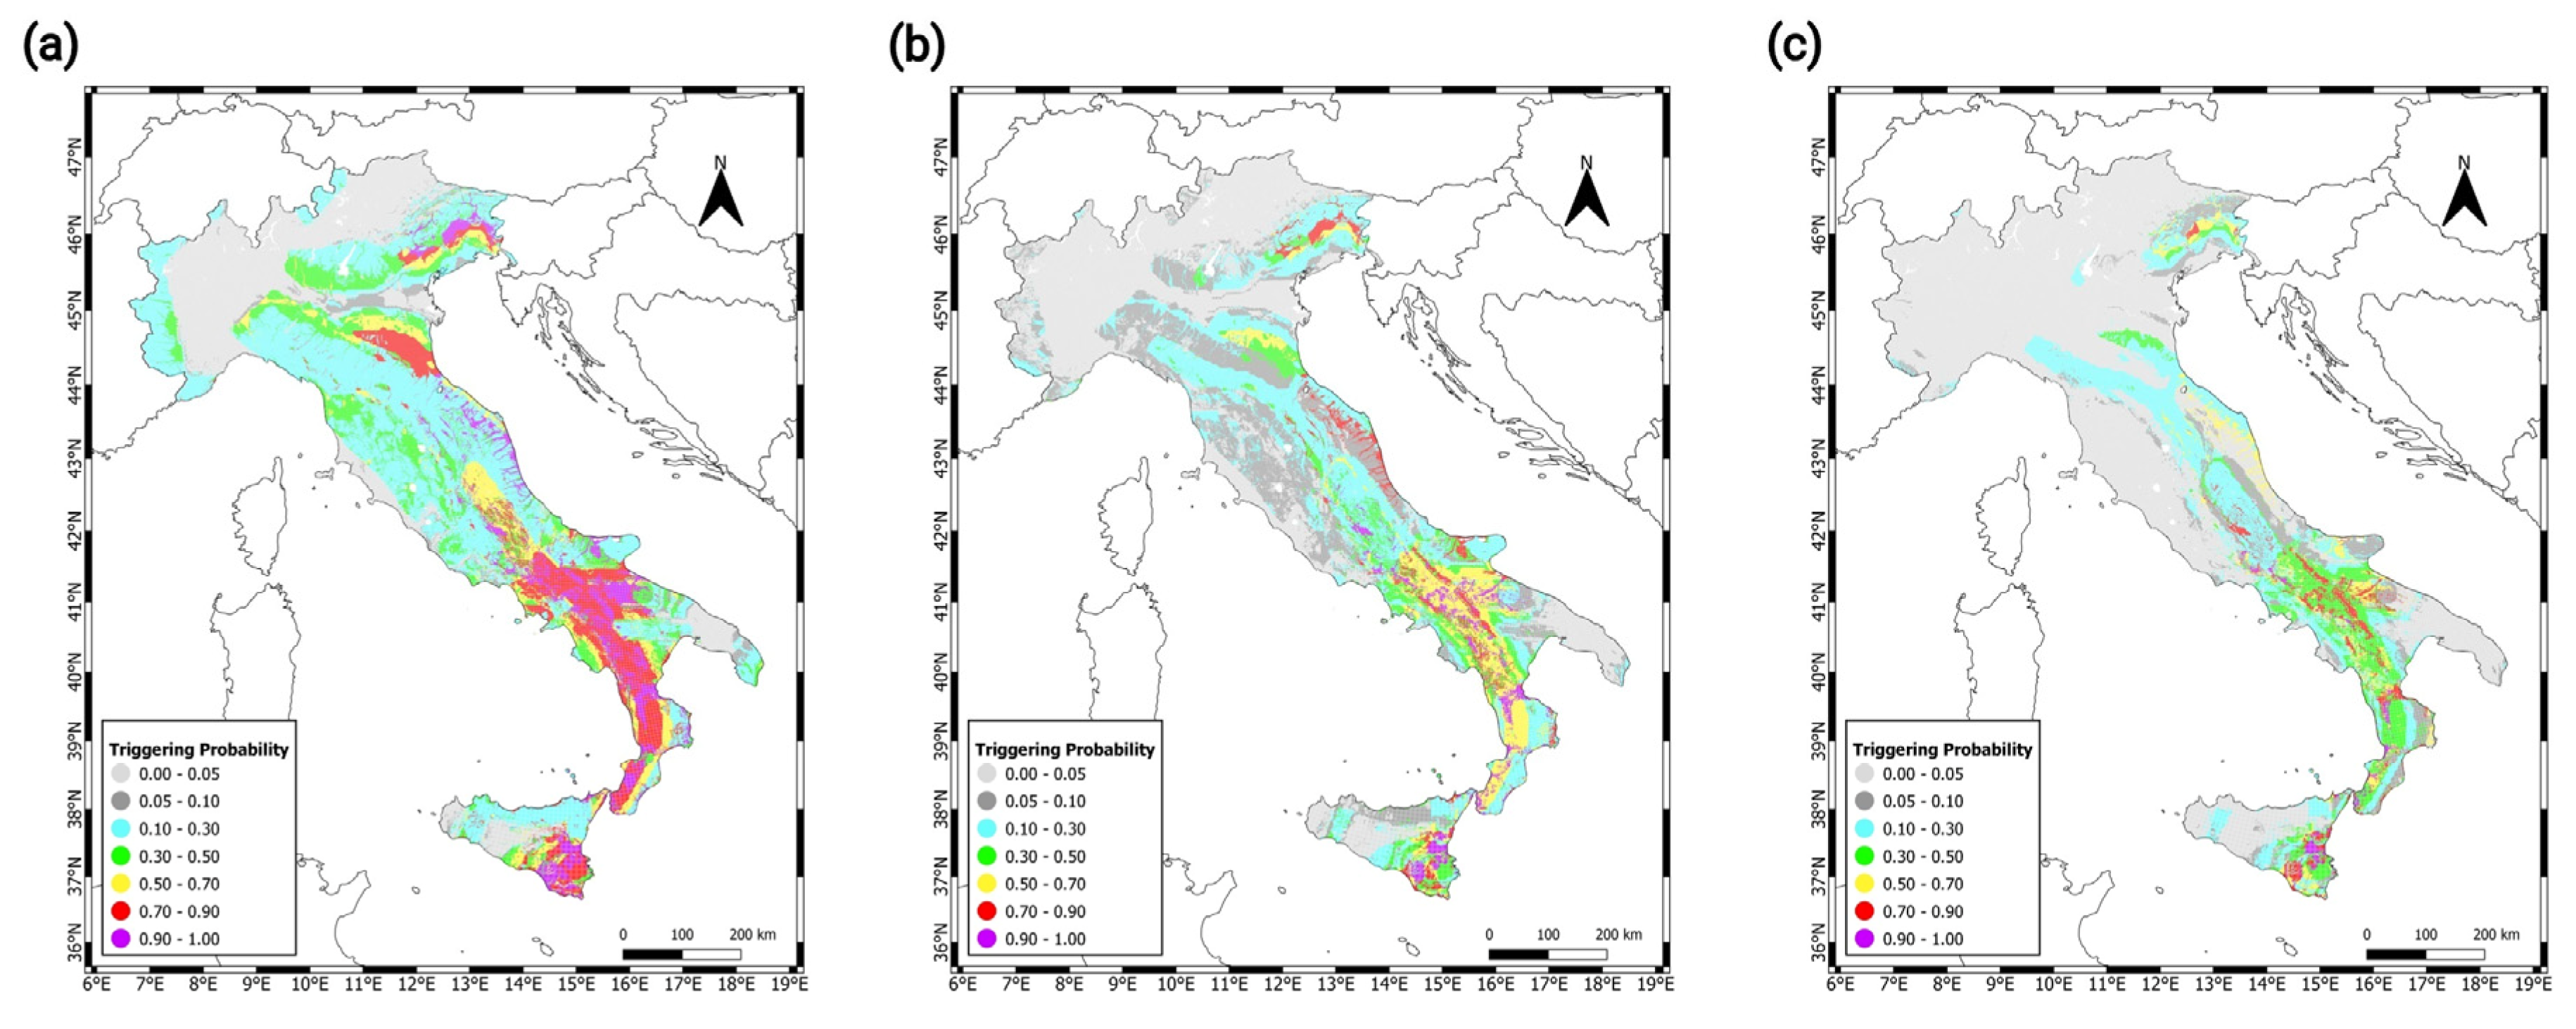
Figure 10.
Maps showing the probability of seismic landslide triggering (i.e., probability of at least one triggering, whatever the failure mechanism) based on hazard disaggregation data corresponding to return periods of 475 years (a), 975 years (b), and 2475 years. Historical landslide events in Italy (from the Italian Catalogue of Earthquake-Induced Ground Failures – CEDIT; [7]) are superimposed.
Disclaimer/Publisher’s Note: The statements, opinions and data contained in all publications are solely those of the individual author(s) and contributor(s) and not of MDPI and/or the editor(s). MDPI and/or the editor(s) disclaim responsibility for any injury to people or property resulting from any ideas, methods, instructions or products referred to in the content. |
© 2024 by the authors. Licensee MDPI, Basel, Switzerland. This article is an open access article distributed under the terms and conditions of the Creative Commons Attribution (CC BY) license (http://creativecommons.org/licenses/by/4.0/).
Copyright: This open access article is published under a Creative Commons CC BY 4.0 license, which permit the free download, distribution, and reuse, provided that the author and preprint are cited in any reuse.


