

Submitted:
08 March 2024
Posted:
10 March 2024
You are already at the latest version
Abstract
The rapid retreat of coastal cliffs poses a profound risk to property, transport infrastructure and public safety both in Ireland and globally. This study combines historical data (maps and orthophotos, 1842 to 2000) with contemporary UAV surveys (2019 to 2023) to quantify cliff top and cliff face retreat along a 250 m wide coastal drumlin at Silverstrand in Galway Bay, Ireland. Retreat rates for the cliff top and cliff face were calculated using 2D mapping and 3D modelling, respectively. Critically, the choice of method appears to have a major impact on apparent rates of cliff top retreat, with output from the 2D mapping approach (0.14 +/- 0.02 m yr-1) being double that of the 3D modelling approach (0.08 +/- 0.02 m year-1). The aperiodic development of a talus cone, which offers temporary protection to the cliff from storm waves, also influences the estimation of cliff retreat. The repeat cycles of talus slope formation and removal in this high wave energy climate suggest that the drumlin transitions between a periodically transport-limited system and supply limited system over short- and long-time periods, respectively, on the continuum of cliff types. These results warrant further research to identify and quantify the rates, patterns, drivers (marine and subaerial processes), and timing of cliff retreat rates in response to climate change.
Keywords:
Soft rock cliff erosion
; coastal erosion
; structure-from-motion
; shoreline detection
1. Introduction
In Ireland, the geomorphic impacts of Late Pleistocene glaciation are particularly evident along the west coast, where the convergence of ice flow and a ready sediment supply has resulted in the widespread formation of coastal drumlins [1]. In those locations where drumlins intersect the modern intertidal zone, chronic coastal erosion is prevalent, resulting in the undercutting of cliffs, slope failure, and the subsequent release of large volumes of sediment into local littoral cells. Instances of this phenomenon have been documented in Clew Bay [2], Strangford Lough [3], and Galway Bay [4]. As waves and tides remove the fine-grained glaciogenic sediments, coarse clastic material is often left behind within the intertidal zone, where it forms a residual lag that serves as a protective barrier against erosion [1]. Depending on their size, exposure to storm waves and regional rates of sea level rise, actively eroding drumlins can potentially supply new sediment for marine dispersal for the next 500 to 2000 years [3]. Therefore, improved understanding of these sediment storage and transfer systems is important for establishing the short- and long-term drivers shaping Ireland’s contemporary coastline. Further, quantifying erosion rates of glacial cliffs provides valuable information for local decision-makers tasked with managing the growing risk of coastal geohazards due to coastal erosion, particularly if these are linked to anthropogenic climate change [5].
Cliffs form approximately 80% of the global coastline and exhibit highly variable rates of erosion and retreat [6,7,8]. It is estimated that approximately 56% of Ireland’s 5,400 km-long coast is dominated by rocky shorelines, of which ~1,288 km is categorized as cliffs; an additional 170 km comprises composite cliffs featuring a mix of hard and soft materials [9]. Cliff retreat rates depend on local parameters such as lithology and slope of the cliff, local climate and tidal range, wave dynamics, sea level trends, and the intertidal and marine environments adjacent the cliff [7,10]. Previous studies have applied different research techniques to analyse cliff changes and erosion rates at numerous sites around the world. Among the most commonly reported methods are Structure-from-Motion (SfM) e.g., [11,12,13], analysis of historical maps and aerial photographs e.g., [13,14,15] and terrestrial Light Detection and Ranging (LiDAR) [16,17,18]. SfM is a photogrammetric approach that is now applied widely in geoscience disciplines, including geomorphology [12,19,20] and glaciology [21,22], to detect landform changes. Exploiting the recent refinement of uncrewed aerial vehicle (UAV) technology, large tracts of even the most inaccessible coastlines can now be mapped accurately, safely, and at relatively low costs [11,12,23]. Digital Surface Models (DSM) and three-dimensional points clouds (PC) of coastal cliffs and adjacent rock platforms can be computed with very high spatial and temporal resolution when georeferenced using ground control points (GCPs). Together, these methods can provide highly accurate baseline data to detect changes in volume and cliff retreat rates [11,24]. Augmenting these observational data, secondary sources derived from historical maps and satellite imagery can provide valuable additional information and invaluable long-term context for the geomorphological change detection analyses. Spanning timescales of decades and centuries, these secondary data are especially important for investigations of coastal landform responses to climate change and anthropogenic pressures [15,25,26], particularly where historical mapping covers several centuries [14,27,28]. In Ireland, the first accurate large-scale maps (six inches represents one mile on the ground) were published during the 19th Century by the Ordnance Service Ireland (OSI) [28].
Depending on the data available, investigations into cliff retreat rates generally rely on one of three key methods. The first method estimates cliff retreat directly from changes in cliff top position, either from historical maps or orthophotos e.g., [13,14,26,27], while the second method employs erosional pins deployed near the base of the cliff to monitor changes in cliff face position e.g., [3,29]. More recently, the development of UAV and LiDAR technologies has provided a third method by providing high-resolution 3D modelling of cliff retreat from remotely sensed data [11,13,19]. Recognising that methodology is largely dictated by data availability, prior research confirms that the choice of cliff top or cliff face estimates has the potential to influence results. For example, [19] and [30] both reported measurable differences between cliff top-derived and cliff face-derived retreat rates in studies of the same cliff. Nonetheless, the processes driving changes in cliff face and cliff top configuration are intrinsically coupled via an erosion-deposition cycle [7,10,31]: cliff face erosion undercuts the cliff, resulting in cliff top failure and formation of a talus cone at the cliff base; this cone protects the cliff face from further erosion until it is removed by wave action, whereupon undercutting resumes [10,16,17,31,32]. Ref. [33,34] both demonstrated that erosion of soft rock cliffs can vary widely over time and that high-energy storms with extended wave run-up can dramatically increase erosion rates on short event timescales.
Previous studies of coastal cliffs in Ireland [3,35,36,37] and the UK [11,19,38,39,40,41], have reported considerable variability in cliff retreat rates (Table 1). Hard rock cliffs composed of sandstones, limestones, basalts and granites often have very low annual retreat rates (0.001–0.1 m) [19,38,39], whereas cliffs comprising softer rock material, such as chalk and glacial till, exhibit much higher rates in the range of decimetres per year [3,35,40,41]. In Ireland, drumlins are prominent features on the landscape and represent evidence of the passage of glacier ice during the Quaternary. In west coast locations such as Galway Bay and Clew Bay (Co. Mayo), drumlins are a quintessential feature of the otherwise rocky coastlines. In almost every case, coastal drumlins in the west of Ireland exhibit severely eroded cliff faces exposing the landform interior of till and glaciofluvial sediments [3,4].
In this study, we measured changes along a 250 m-long escarpment that forms the southern margin of a drumlin at Silverstrand, Galway Bay, on Ireland’s west coast. Combining historical 2D mapping (1842), orthophotography (1995, 2000), and UAV surveys (2019, 2022, 2023), we used a coupled 2D morphometric-3D modelling approach to quantify changes in the cliff top and cliff face over timescales ranging from months to a century.
2. Study Site
2.1. Physiographic Setting
Our study site is the Knocknagoneen drumlin, located immediately west of Galway City on the northern shore of Galway Bay (53° 15' 1.00" N, 9° 7' 23.00" W) (Figure 1). The Knocknagoneen drumlin is the most westerly of three neighbouring drumlins Figure 1 [4,42] and contributes c. 41–64% of its eroded material to the adjacent fringing barrier (stony bank) and an ecologically important inner saltmarsh estuarine ecosystem (Rusheen Bay) that is currently protected by multiple environmental designations [43]. Local sediment dynamics are dictated by marine forces acting upon the three drumlins (Figure 1 and Figure 3). The drumlin’s vertical cliff face is as much as 17 m high and approximately 250 m in length (Figure 2). Fronting the cliff is a sub-horizontal platform of glacial boulders set into clay-rich till, analogous to a Type-A shore platform on the Sunamura scheme [26]. Satellite imagery provides strong evidence of the platform’s size and shape (extending 235 m from cliff), which together demark the original extent of the drumlin prior to erosion (Figure 1). Eroded drumlin material can form a temporary talus slope at the cliffs base (Figure 2 and 4). Approximately 750 m north-east of Knocknagoneen, the Knocknacarragh drumlin exhibits a similar size and form to its neighbour: the 260 m-long cliff is ~15 m high at its mid-point (Figure 3). In contrast, the smallest of the three drumlins, Illaunafamona, exhibits a more limited seaward cliff (< 20 m long, ~10 m high) but highly eroded lateral margins (Figure 3).
Being located c.33 km east of the Aran Islands in the inner bay, the Silverstrand drumlins are relatively protected from the full erosive power of the North Atlantic. Nevertheless, this site experiences a strongly oceanic climate, with year-round wind and high precipitation [44,45], winter storm surges and semidiurnal tides of ~2–5 m [46,47,48]. In interior Galway Bay, waves generally travel from southwest to northeast and exhibit significant wave heights of 2.5–3.0 m [47,48,49]; significant wave height increases considerably during storm events [47,48] and the winter season [49]. According to the classification scheme for soft coastal cliffs, the expected potential hazard level for the site is ‘high to very high’ [50].
The average monthly precipitation recorded at Inis Mór, the most north-western of the Aran Islands located at mouth of Galway Bay c.40 km from study site (Figure 1), is 107 mm and the number of rain days (0.2 mm or more) per month is 21 for the period January 2018–October 2023 (70 months).
Figure 1.
(a) Location of Galway Bay on west coast of Ireland. (b) Location of the Knocknagoneen drumlin (study area), Galway Bay. (c) Satellite image of the study area showing the position of the Knocknagoneen drumlin and adjacent features (Silverstrand, wave-cut platform, fringing barrier and Rusheen Bay. Basemaps are sourced from (a), ESRI Gray (light) ©1995-2021 Esri [51], (b) TerraMetric ©2024 Google and (c) Airbus, CNES / Airbus, Maxar Technologies, ©2024 Google [52].
Figure 1.
(a) Location of Galway Bay on west coast of Ireland. (b) Location of the Knocknagoneen drumlin (study area), Galway Bay. (c) Satellite image of the study area showing the position of the Knocknagoneen drumlin and adjacent features (Silverstrand, wave-cut platform, fringing barrier and Rusheen Bay. Basemaps are sourced from (a), ESRI Gray (light) ©1995-2021 Esri [51], (b) TerraMetric ©2024 Google and (c) Airbus, CNES / Airbus, Maxar Technologies, ©2024 Google [52].
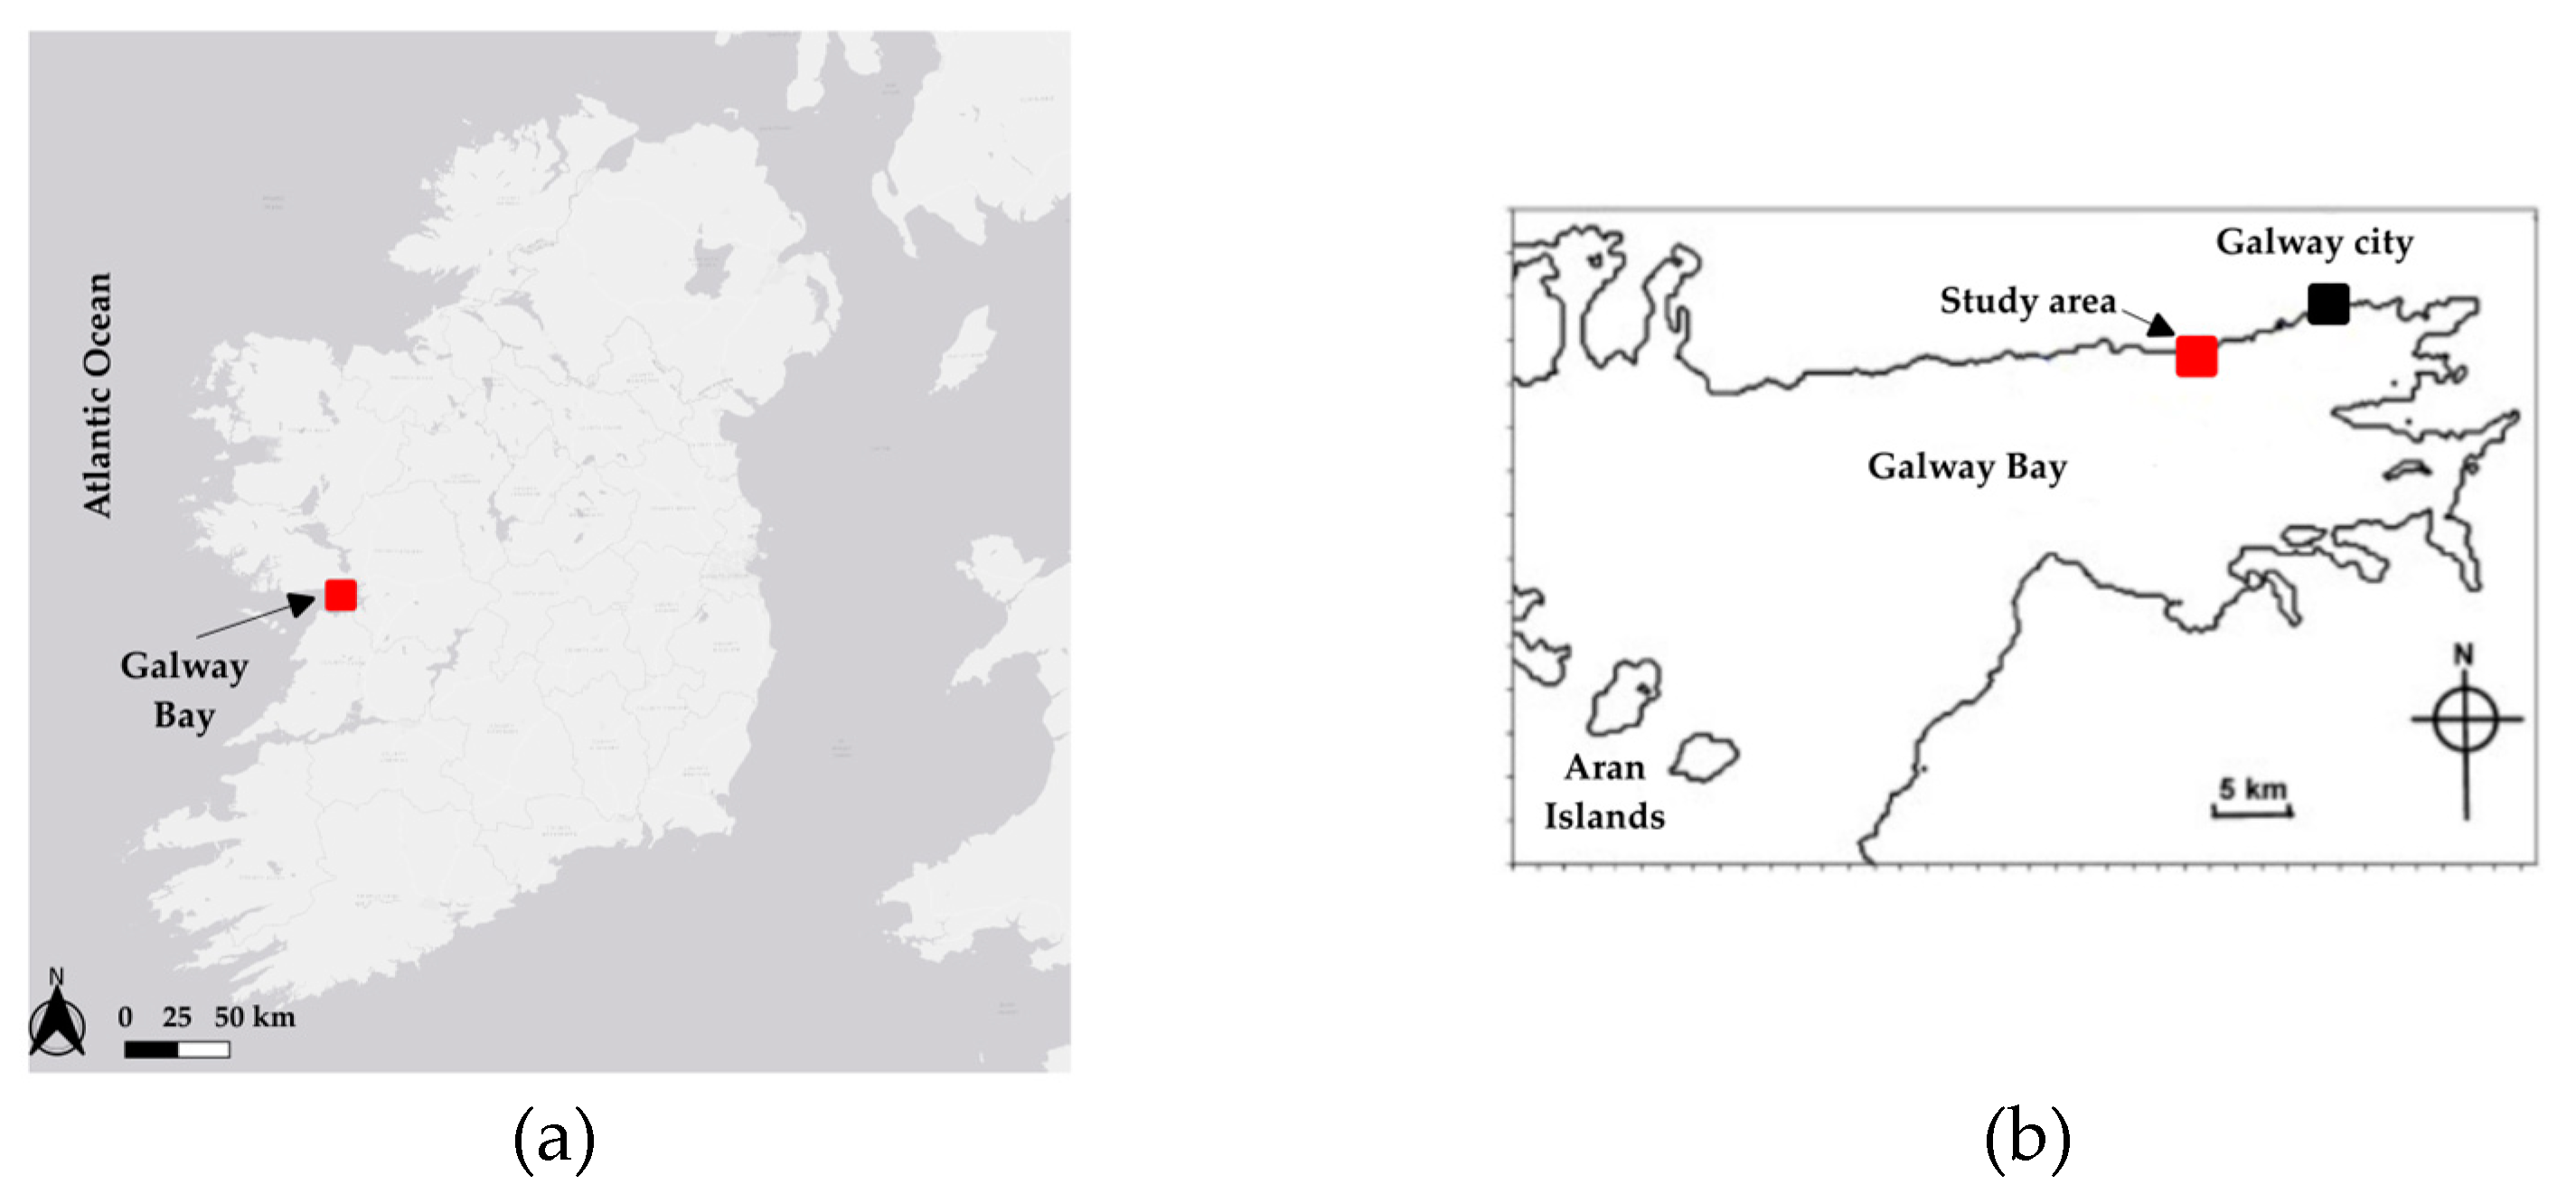
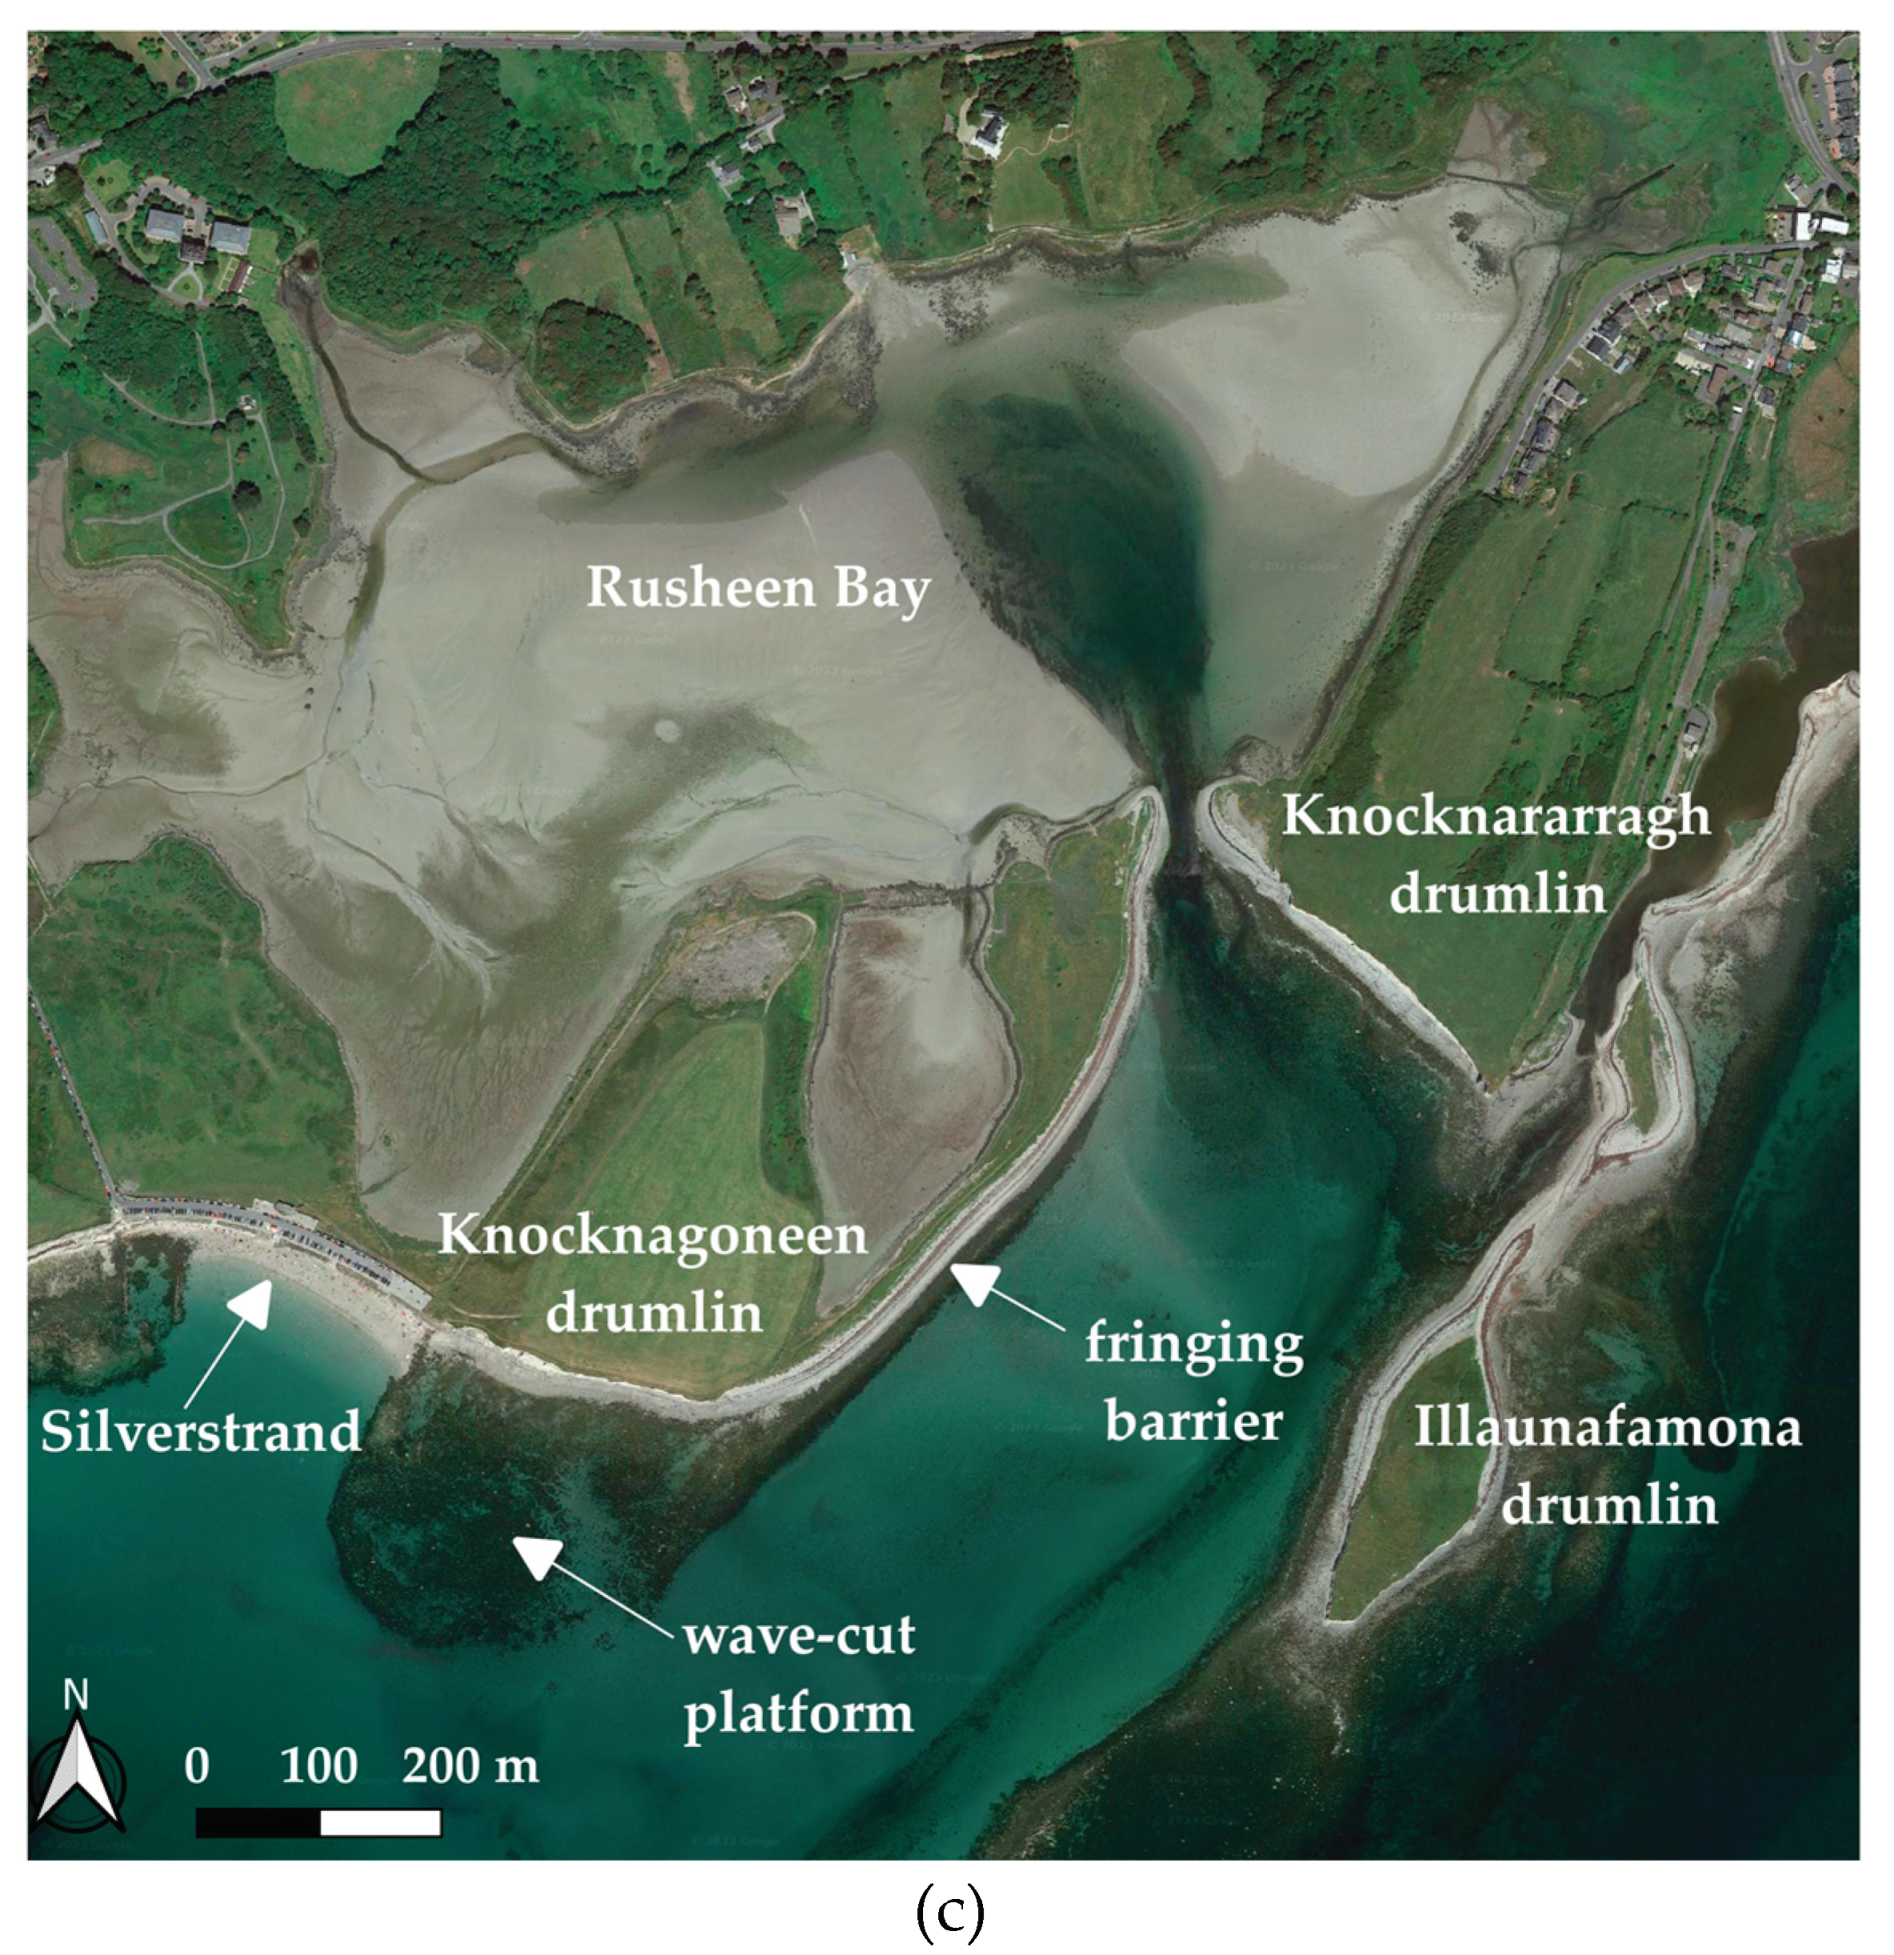
Figure 2.
(a) South-east facing oblique aerial photograph of the exposed cliff face of the Knocknagoneen drumlin. The rectangle denotes the area shown in panel b. (b) Close up photograph highlighting the talus slope (- -) at the cliff base in (a) on 2/10/2019.
Figure 2.
(a) South-east facing oblique aerial photograph of the exposed cliff face of the Knocknagoneen drumlin. The rectangle denotes the area shown in panel b. (b) Close up photograph highlighting the talus slope (- -) at the cliff base in (a) on 2/10/2019.
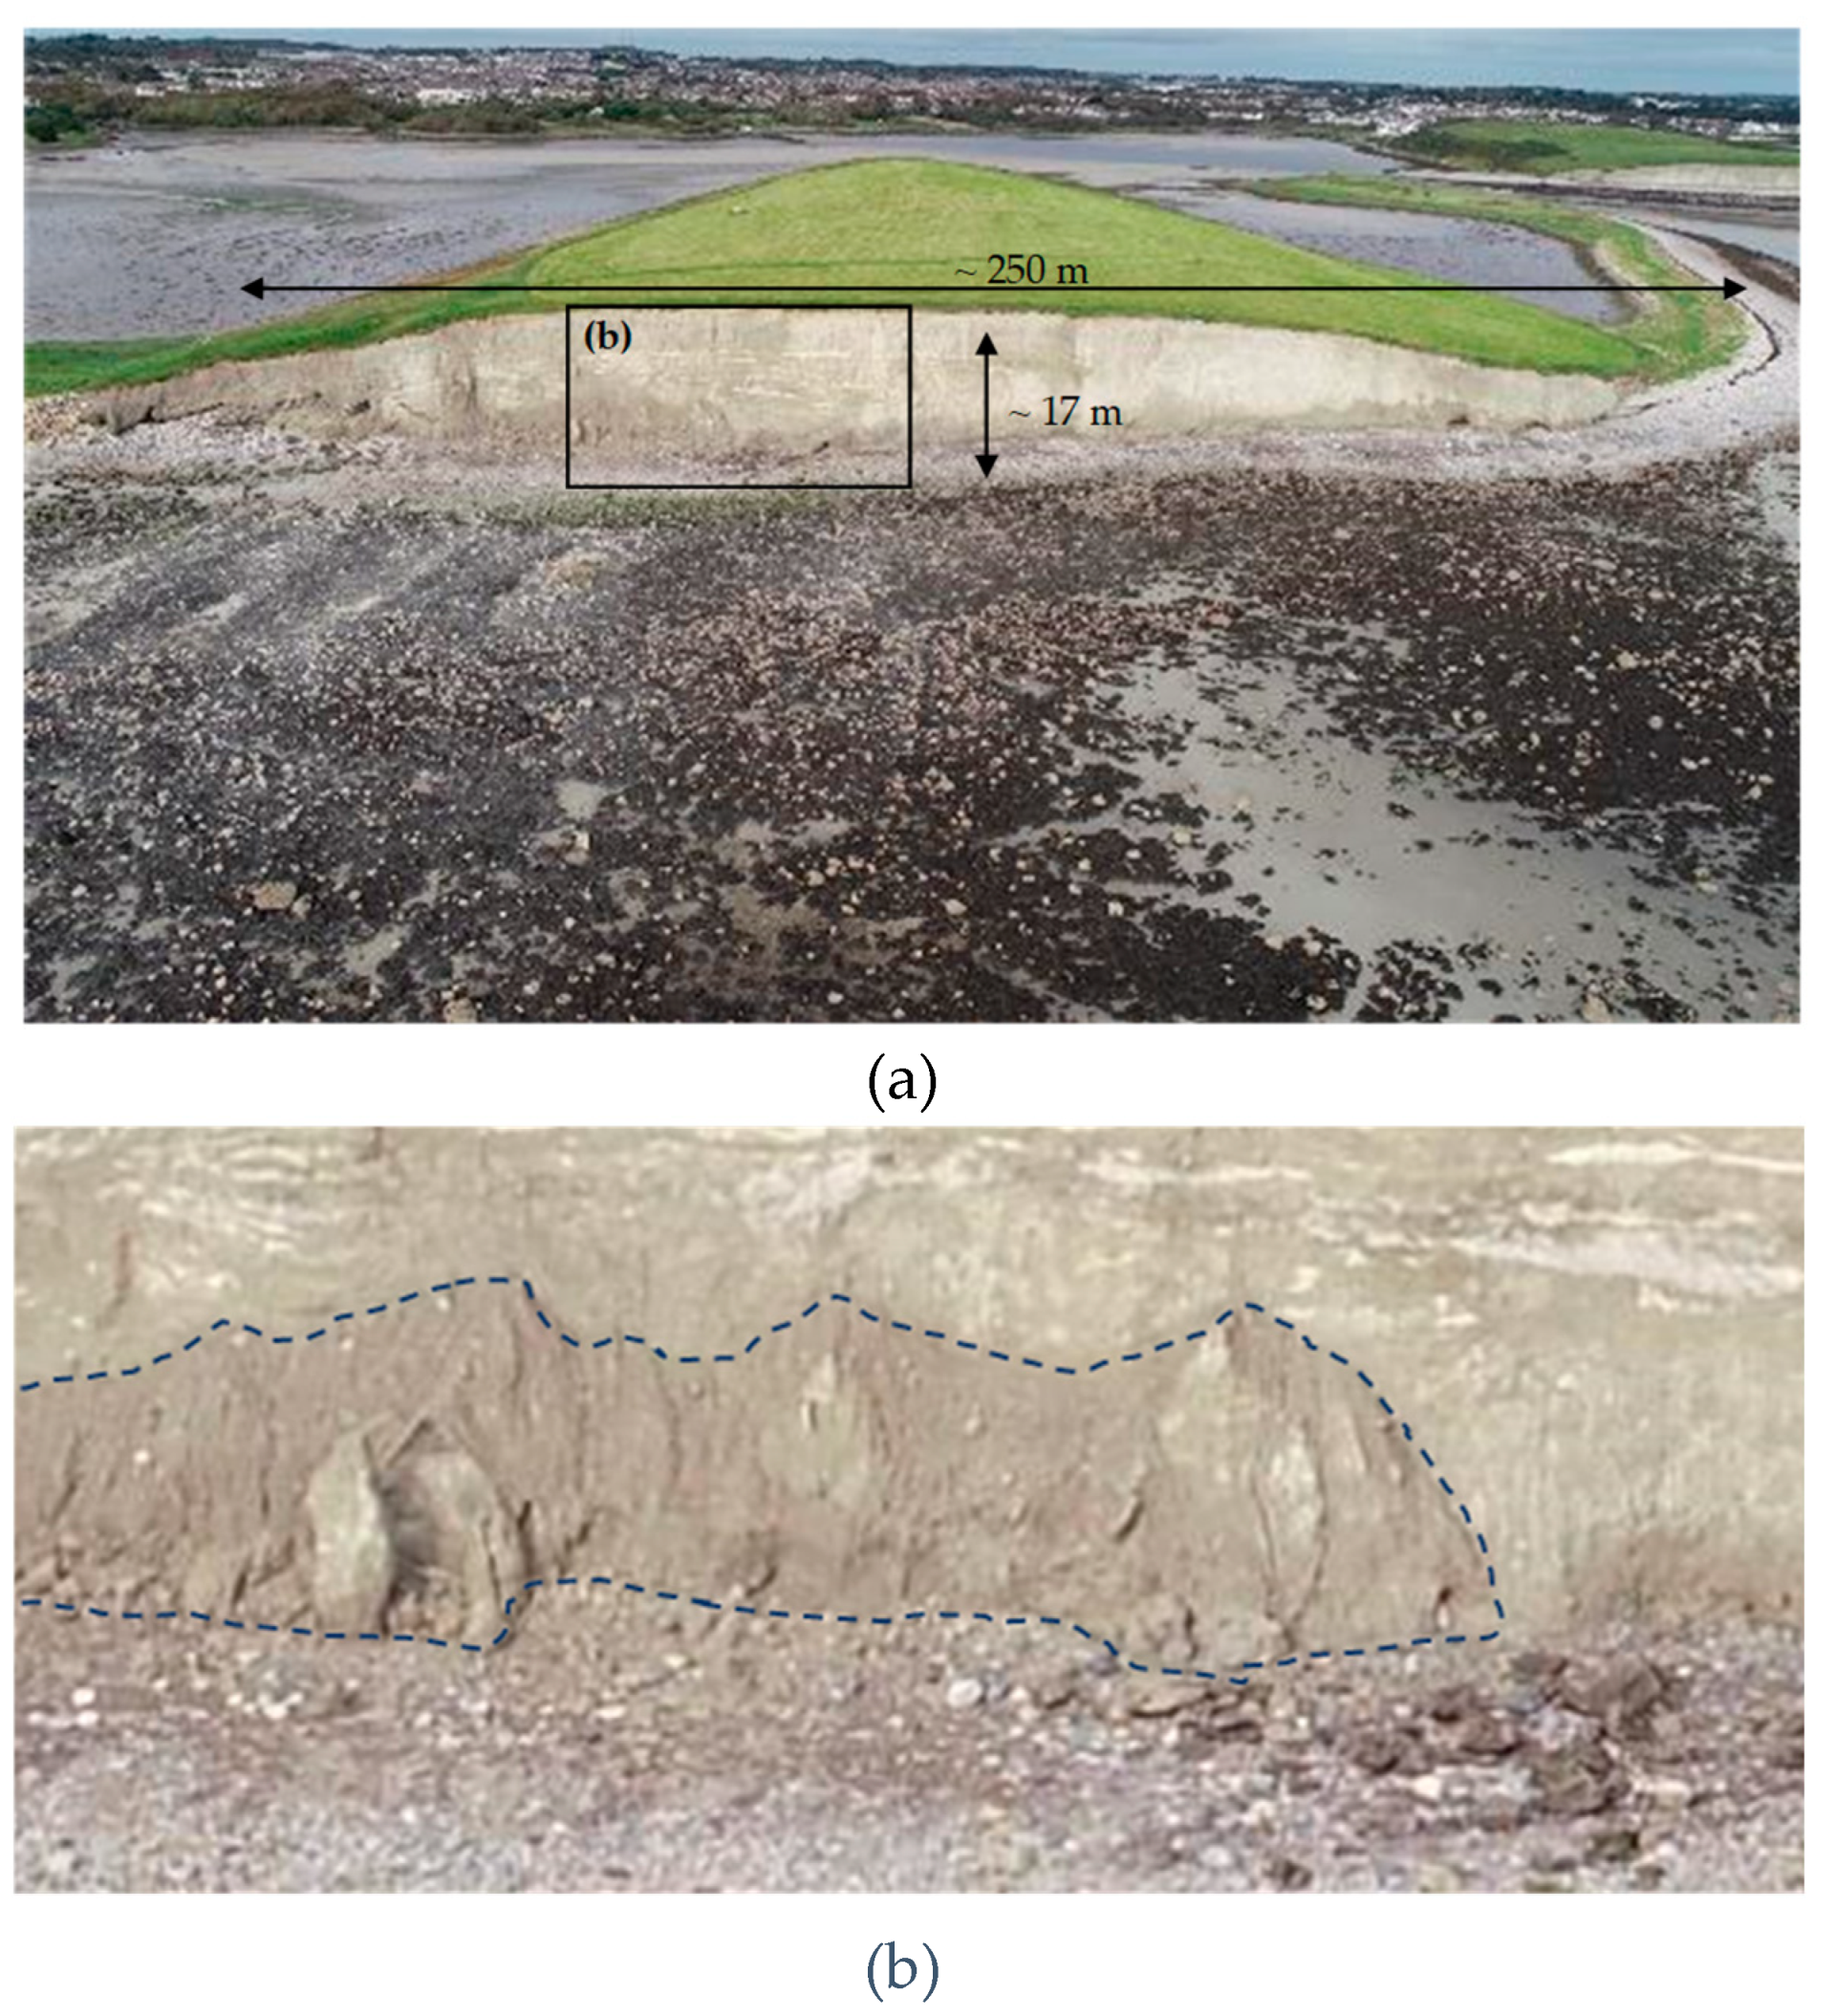
Figure 3.
South-east facing oblique aerial photograph of the study area, showing the downward sloping western cliff face of the Knocknagoneen drumlin (left background) separated from the Knocknacarragh drumlin (right background) by a fringing barrier and tidal inlet feeding Rusheen Bay (middle background). The Illaunafamona drumlin is in the foreground.
Figure 3.
South-east facing oblique aerial photograph of the study area, showing the downward sloping western cliff face of the Knocknagoneen drumlin (left background) separated from the Knocknacarragh drumlin (right background) by a fringing barrier and tidal inlet feeding Rusheen Bay (middle background). The Illaunafamona drumlin is in the foreground.
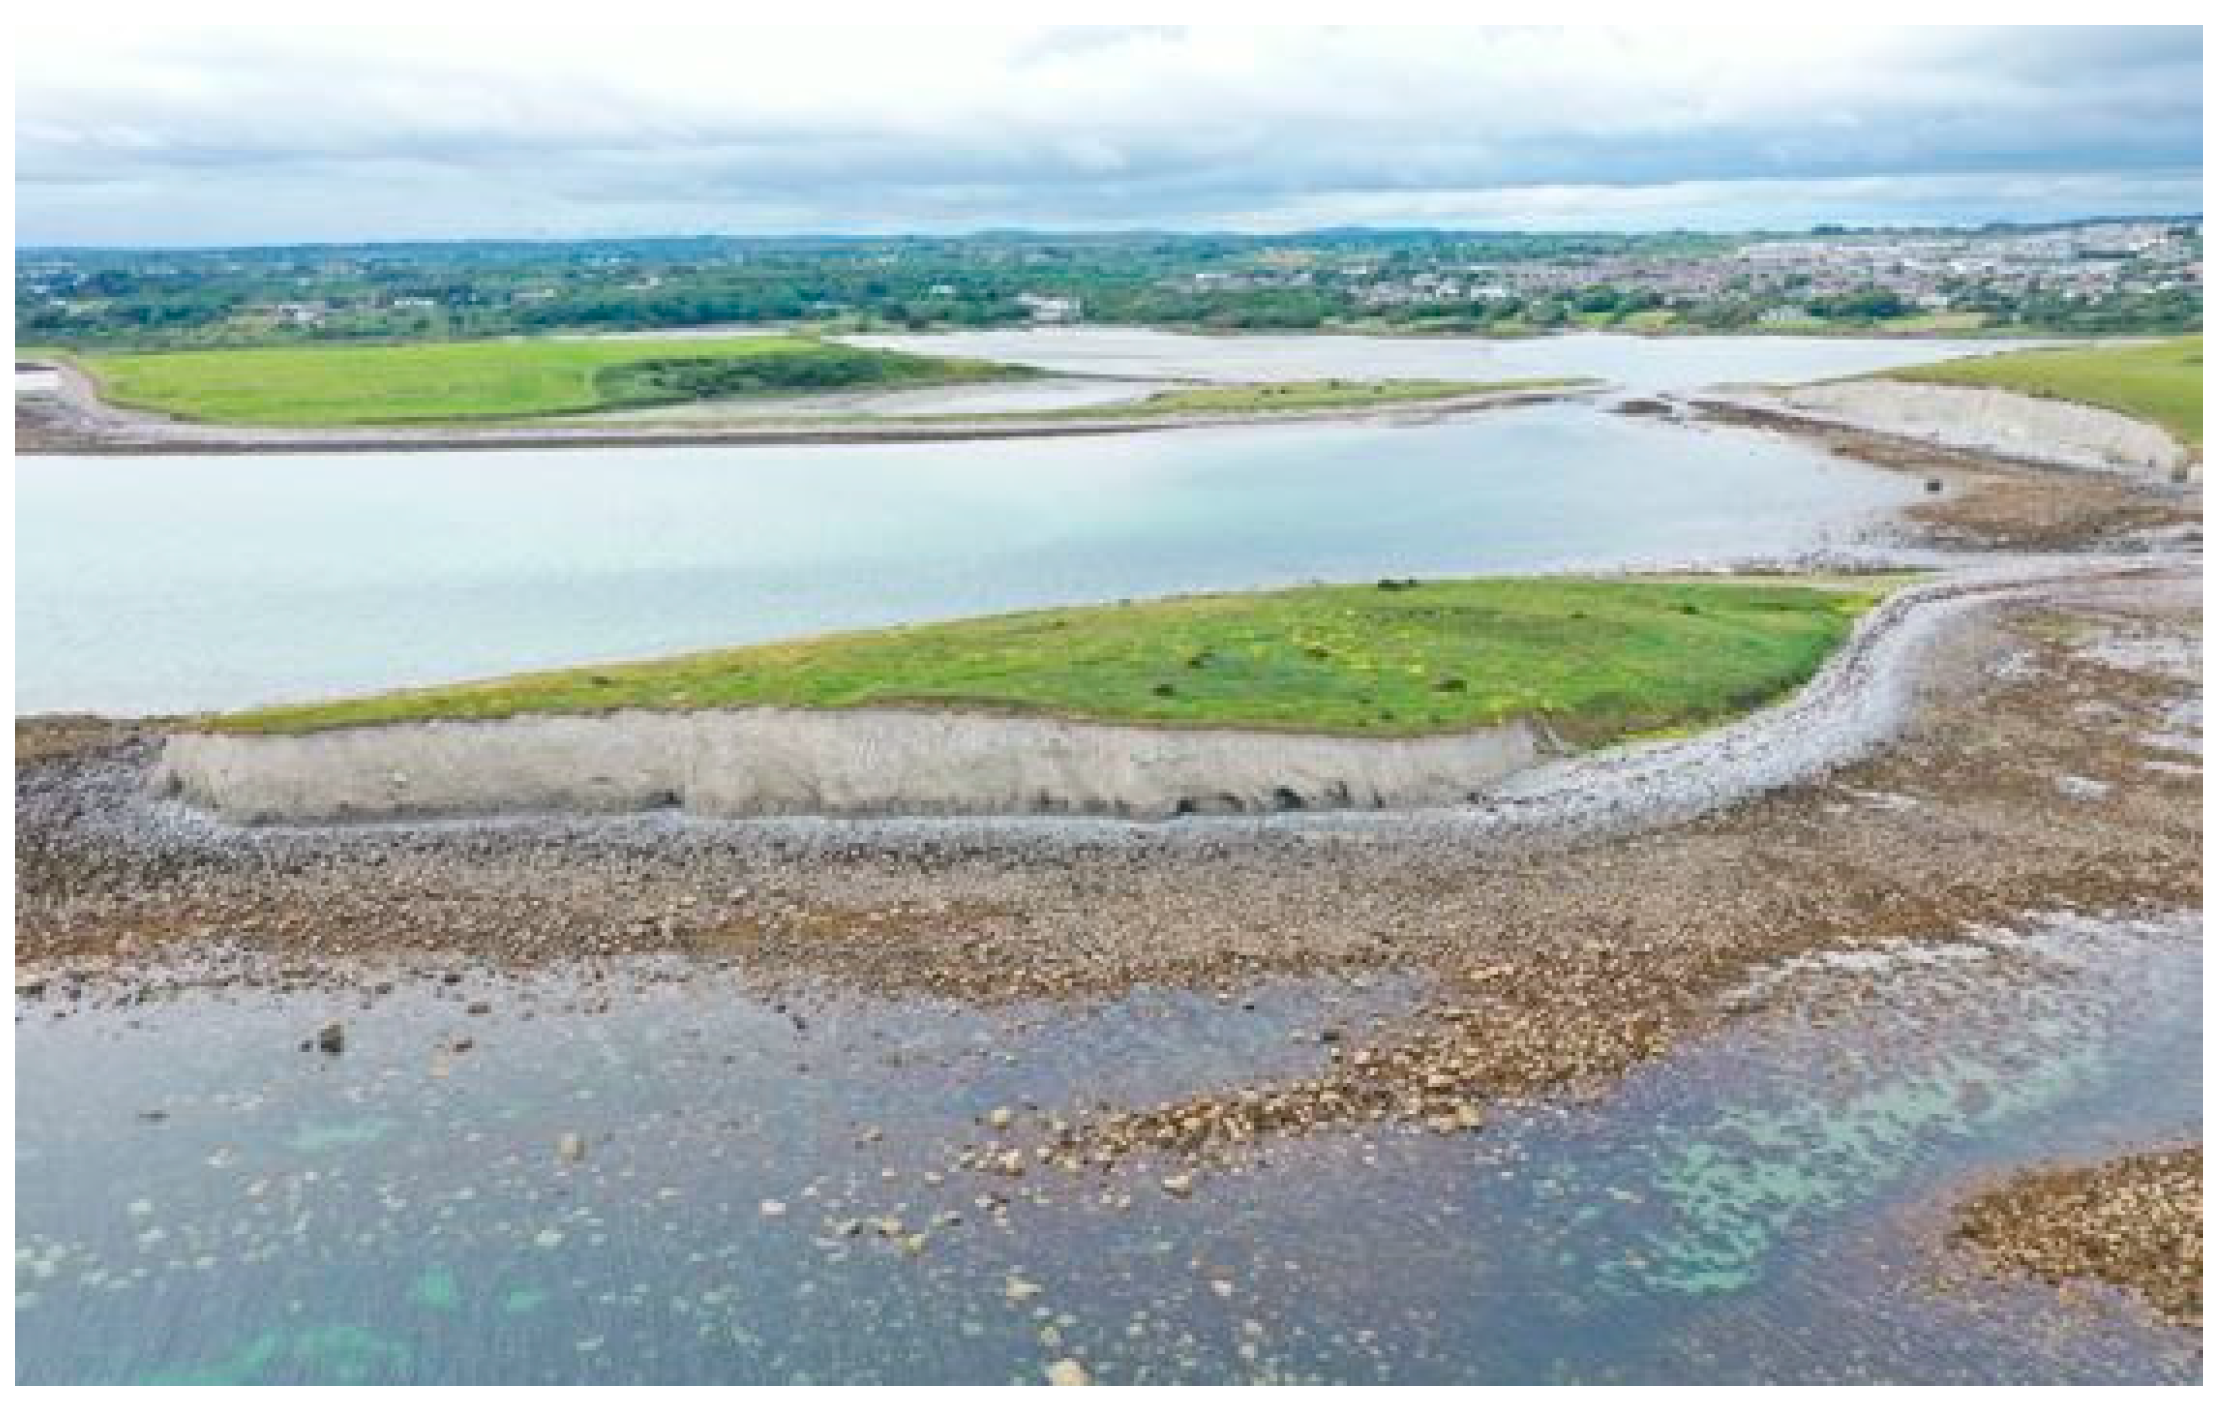
Figure 4.
Oblique aerial photographs of the Knocknagoneen drumlin from January 2018 and November 2023. Although the cliff was not surveyed during the 2018-19 winter season, the first survey of 2019 reveals evidence for the former extent of a major talus cone that developed during that interval. Note the figure standing near the base of the cliff in panel (b) for scale. The talus slope was not present between spring 2020 and winter 2023.
Figure 4.
Oblique aerial photographs of the Knocknagoneen drumlin from January 2018 and November 2023. Although the cliff was not surveyed during the 2018-19 winter season, the first survey of 2019 reveals evidence for the former extent of a major talus cone that developed during that interval. Note the figure standing near the base of the cliff in panel (b) for scale. The talus slope was not present between spring 2020 and winter 2023.
2.2. Geological History
The Knocknagoneen drumlin is a product of the Quaternary ice ages, during which Ireland’s landscape was profoundly shaped by the passage of glacier ice [4]. As a composite drumlin, Knocknagoneen comprises sediments derived from multiple pulses of glaciation. In their sedimentological study of the cliff face, [4] identified four general lithofacies that become gradually coarser-grained with height: muddy diamict at the base is overlain by a pebble-rich diamict, which is overlain in turn by a unit of finer-grained sediments capped with a boulder-rich till. Our own investigations of the drumlin face reveal varved sediments and coarse alluvial material within the basal few metres, indicative of ice-free deposition prior to subsequent glacial overriding. Granite and limestone clasts are common throughout the exposure (Figure 5). Together, the drumlin’s sedimentology is re interpreted as reflecting a mixture of subaquatic and subglacial deposition, which is common at the margins of marine-terminating ice sheets [4]. Previous studies examined ice flow directions using striae indicate that the ice flow direction was south to southwest [53,54], which is reflected in the S-SW orientation of the drumlin [55,56].
Following deglaciation of Galway Bay approximately 17 ka [57], our study area remained above sea level for several millennia before marine incursion during the middle Holocene. At Spiddal beach, ~13 km west of Silverstrand, in situ stumps of mature oak, pine, and birch trees are exposed periodically by storm erosion and afford maximum-limiting radiocarbon ages of 7.4 – 4.8 cal ka for the onset of marine conditions [58,59]. This range aligns with palaeohydrological reconstructions from Loch Mór, Inis Oírr, the south-easternmost of the Aran Islands (Figure 1), which suggest sea level adjacent Galway Bay attained its modern configuration approximately 5.1 ka [60]. At this point, we posit that marine forcing began to erode the Knocknagoneen drumlin [4], manifesting in the formation of the distinct cliff morphologies seen today. While Knocknagoneen’s original morphology is no longer visible, the intertidal shore platform described above confirms the drumlin’s original footprint and provides longer-term context for the erosion rates discussed below.
3. Materials and Methods
For this study, we used historical maps, orthophotos, and recent UAV surveys to investigate changes in cliff top and cliff face position at Knocknagoneen (Table 2). The cliff top changes were analysed using the Shoreline Analysis System (DSAS) Version 5.0 [61,62] in ArcMap, while cliff face changes were detected using a Multiscale Model to Model Cloud Comparison (M3C2) in CloudCompare, v2.13 alpha [63,64]. A detailed overview of the workflows is given in Figure 6.
3.1. Structure from Motion
3.1.1. SfM Data Acquisition
Following similar workflows to those reported in [11,12,13] and elsewhere, we used brightly coloured spray paint to create GCPs (~0.40 m long X-shaped markings) both in the intertidal zone at the cliff base and atop the drumlin near the cliff edge. The GCP coordinates were collected using accurate (0.02–0.03 m) Trimble R8 PPK and R10 RTK Global Navigation and Satellite Systems (GNSS). We used a UAV to collect near-vertical (80°), overlapping (75–80%) images of the entire cliff surface. These images, in conjunction with the GCPs, enabled us to build accurate PCs and DSMs within the workflow outlined in Figure 6. In all, we conducted six field surveys at low tide: 11/06/2019, 02/10/2019, 05/10/2019, 22/11/2022, 21/09/2023, and 21/11/2023 (Table 2).
3.1.2. SfM Data Processing
3.1.2.1. Computation of PCs and DSMs
We used Agisoft Metashape (Version 1.5.5 9097) to generate PCs and DSMs in line with the workflow described by [65]. First, we detected the respective GCP configuration deployed during each field survey and assigned them coordinates using the Irish Transverse Mercator (IRENET95, EPSG: 2157 coordinate system). The quality of the camera alignments was assessed prior to generating high-resolution PCs. Once these had been generated, we used the PCs to calculate DSMs. Specifically, the 05/10/2019 and 21/09/2023 DSMs were used to measure changes in the position of the cliff top. After GCP-based georeferencing, the final RMS errors were 0.01 m for our 05/10/2019 DSM and 0.05 m for the 21/09/2023 DSM. All UAV surveys were implemented to measure cliff face retreat using PC registration and the iterative closest-point algorithm.
For PC alignment and change detection analysis, we used CloudCompare v2.13.alpha [64] following the protocols described by [11,13,63,66]. Since each PC is aligned to the same reference PC, specific GCPs were not needed for registration. We separated PCs into two sections, representing the western and eastern portions of the cliff, to reduce the final registration errors [13,63]. Prior to alignment, each PC was filtered using a statistical outlier removal filter that applies nSigma = 1 and six-point mean distance estimates [13]. Owing to its high lateral coverage and high point density, we chose the 11/06/2019 survey to serve as the reference PC for all subsequent surveys (Table 3). After filtering, the respective PCs for the 02/10/2019, 05/10/2019, 22/11/2022, 21/09/2023, and 21/09/2023 surveys were subsampled to 0.05 m to ensure comparability. The reference PC was not subsampled so as to retain maximum density of reference point data. To improve PC alignment and minimise analytical error, we conducted quality control in CloudCompare to remove vegetation and any part of the PCs generated from inaccurate computations [63]. Final alignment was made using the Iterative Closest Point Algorithm (ICP) [67] in CloudCompare [64], after which, where necessary, we performed a handpicked rough alignment to predefine corresponding points for the ICP. This approach improved the results of our registration process [67].
3.1.2.2. PC Change Detection
We applied the M3C2 algorithm to the five periods listed in Table 3. This algorithm compares two PCs directly, without previous meshing or gridding [63], thereby enabling us to detect specific areas that experienced material loss or gain over time. Since most higher parts of the cliff face are nearly vertical, areas indicating net gain most likely reflect higher registration errors [13]. These areas were excluded from the calculation of erosion and cliff face retreat rates accordingly. Where any apparent change in the position on the cliff face was less than the error of the registration, we assumed that no significant change was detectable within the calculated certainty [63].
3.1.2.3. Cliff Face: Retreat Rate [m yr-1] and Erosion Rate [m3 yr-1]
Changes in the cliff face configuration were calculated using two different parameters. First, we defined the erosion rate (er [m3 yr-1]) as the amount of volume lost from the cliff face over time. We then defined the cliff face retreat rate (cfr [m yr-1]) as the horizontal distance the cliff face had receded over the same period. The latter is key to establishing whether there are significant differences between estimates of cliff retreat based on the cliff top position (Section 3.2) or the cliff face, which would have implications for the selection of survey methodologies.
To estimate er, we first clipped out the cliff face of the reference PC and that of each subsequent PC, whereafter we used the 2.5D volume algorithm in CloudCompare to calculate respective differences in volume. Specifically, the 2.5D volume is calculated by designating the direction from the grid-origin (0/0/0) as the preferred orientation. The best-fit projection direction is Y, reflecting the WNW-ESE orientation of the Knocknagoneen drumlin, which would probably produce an approximately S-N direction of change. We calculated er from the volume of material eroded and the time elapsed between surveys [68], while cfr was calculated as the ratio of the total reference PC surface area and the time elapsed between successive surveys [68].
3.2. Cliff Top Position
3.2.1. Shoreline Digitization and Error Analysis
We used historical maps and orthophotos provided by OSI (Table 2) and georeferenced to the Irish Transverse Mercator geographic coordinate system for Ireland (IRENET95, EPSG: 2157) [28]. This digitised dataset includes the first coloured 6’’ map series of Ireland, which was surveyed in the 1830s and published in 1842 in addition to a black-white orthophoto from 1995 and a colour orthophoto from 2000. Each orthophoto has a reported ground resolution of c. 0.66 m [69]. These data were supplemented with cliff top lines extracted (manual digitisation in ArcMap) from DSM’s generated from our UAV surveys conducted on the 05/10/2019 and 21/09/2023 (RMS errors of 0.01 m and 0.05 m, respectively).
3.2.2. Shoreline Changes
We used DSAS to compute changes in shoreline position over the four periods depicted in Table 4. DSAS is a freely available add-on tool for Esri ArcGis and is applied widely in coastal research [14,15,26,27,70,71,72]. To detect spatial patterns in shoreline changes and erosion rates, we computed perpendicular shoreline transects every metre along the cliff base. Since the shoreline is relatively straight, a transect smoothing distance of 500 m was deemed sufficient [61,62]. We adopted the Weighted Linear Regression (WLR) method to calculate rates of shoreline change for the cliff top. This statistical approach is considered reliable because it accounts for the uncertainty field when calculating long-term rates of shoreline change, specifically by designating a higher impact for ES in the calculation and by adding at least one intermediate shoreline [62,73]. Based on the ES of each shoreline, we calculated weights (w) for each shoreline and included these in our calculations of shoreline change [62,73]. Higher ES values signify lower contributions of the corresponding shoreline to the calculated retreat rate. Finally, we estimated the WLR error by making multiple comparisons of the known distance between the baseline and a shoreline data point with the predicted value for this distance [62,73].
3.3. Storm Event Detection
Wave data were not monitored locally so the Marine Institute East Atlantic SWAN Wave Model dataset was used to derive wave parameters approximately 4 km offshore of the site at 53.2375° -9.0625° in the inner bay. The model provides three-hourly significant wave height, wave period, and wave direction. Thresholds for storm detection are site specific so the method reported in [74] was used as a guide to identify storm events within the modelled wave conditions. We identified storm events as those during which the peak significant wave height (Hs) exceeded 3 m and storm duration exceeded twelve hours (extending over at least one high tide). The start and end of storms occurred when Hs exceeded or fell below 2m.
4. Results
4.1. Cliff Face Changes
According to our assessment, the volume of sediment removed from the cliff between 11/06/2019 and 21/11/2023 was 1197 ± 228 m3 (approximately 3100 tons), a significant proportion (c.53%) of which reflects erosion of the talus slope fringing the drumlin’s western section (Figure 7c). Accordingly, the western section accounts for 59% of the total sediment loss (711 ± 133 m3) and the eastern section 41% (486 ± 95 m3) (Figure 7a). The average rate of cliff face retreat over the same period was -0.34 ± 0.06 m, with the western section experiencing greater recession (-0.46 ± 0.10 m) than the eastern section (-0.22 ± 0.03 m) (Figure 7b).
We used PC analysis to map the spatial distribution of change along the entire cliff face (Figure 8), which again revealed that estimated cliff face retreat rates (cfr [m yr-1]) are considerably higher in the drumlin’s western section than in the eastern section. The most significant changes occurred over the interval 06/10/2019–22/11/2022, reflecting removal of the talus slope by wave action (see Figure 4). Overall, the higher rates along the western section reflect the removal of the talus slope (c.5 m) but this spatial variability was reduced after this sediment was removed.
The restricted interval (three days) between our 02/10/2019 and 05/10/2019 surveys coincided with Storm Lorenzo, which passed over Ireland on 03/10/2019 [75]. According to our storm detection analysis, this system failed to satisfy the criteria for being categorised as a storm when it passed Silverstrand. Specifically, the 12-hour-long event produced average and maximum Hs of 2.43 m and 2.67 m, respectively, which is below the storm detection threshold. Consequently, Storm Lorenzo resulted in minimal change to the drumlin face. Nevertheless, the storm afforded a valuable opportunity to test the applicability and accuracy of the workflow. This analysis confirmed that very little change occurred along the entire cliff face during the event, reinforcing our confidence in the methodology and our subsequent erosion estimates. The highest-magnitude change of the entire study period was observed using the following survey (22/11/2022), by which time the talus slope had been removed entirely (Figure 4).
Using the 11/06/2019 survey as a reference, we observed that cliff face erosion rates are higher for the western section than for the eastern section. Within both sections, the erosion rate is highly consistent, exhibiting values of 160–184 m3 yr-1 and 101–109 m3 yr-1 for the western and eastern sections, respectively. Similarly, retreat rates are also consistent over time, ranging from 0.104 to 0.125 m yr-1 for the western section and from 0.047 to 0.052 m yr-1 for the eastern section. Averaging the values from both sections of the cliff face affords an estimated cliff erosion face retreat of 134 m3 yr-1 and a cliff face retreat rate of 0.077 m yr-1 for the period between 11/06/2019 and 21/11/2023 (1624 days).

Table 5.
Cliff face erosion and retreat rates observed in 2022 and 2023 relative to the 11/06/2019 baseline survey (see Table 3 for details).
Table 5.
Cliff face erosion and retreat rates observed in 2022 and 2023 relative to the 11/06/2019 baseline survey (see Table 3 for details).
| Western section | Eastern section | |||
| er [m3 yr-1] | cfr [m yr-1] | er [m3 yr-1] | cfr [m yr-1] | |
| PC-change III | 184 +/-34 | 0.125 +/-0.023 | 102 +/-6 | 0.052 +/-0.003 |
| PC-change IV | 169 +/-59 | 0.111 +/-0.038 | 101 +/-10 | 0.047 +/-0.005 |
| PC-change V | 160 +/-36 | 0.104 +/-0.023 | 109 +/-13 | 0.05 +/-0.006 |
4.3. Cliff Top Changes
Average cliff top retreat rates (ctr [m yr-1]) are shown in Figure 9 for four different intervals: 1842–2000 (DSAS I), 1842–2019 (DSAS II), 1842–2023 (DSAS III) and 1995–2023 (DSAS IV). The first three intervals exhibit the same rate (0.14 m/year) but with minor differences in the magnitude of uncertainty (+/- 0.02, +/- 0.01 and +/- 0.01, respectively). In contrast, the average retreat rate for the period 1995–2023 (0.16 +/- 0.03 m yr-1) is considerably higher, potentially reflecting greater statistical uncertainty due to shorter duration and limited scale of this dataset (see Section 5). Our estimates also indicate that, for each interval investigated, the cliff’s distal margins experience consistently higher retreat rates than the mid sections (Figure 10); the highest rate of retreat (0.39 m yr-1) occurred in the westernmost part of the cliff between 1995 and 2023.
4.4. Storm Conditions
Applying our storm-detection criteria to 26 months of offshore hydrodynamic data, we detected a total of 30 storms between January 2018 and February 2020. As anticipated, both Hs and storm duration varied seasonally, being greatest during the winter months (December, January, and February). Wave direction was seasonally constant (322–325°; toward east-southeast), reflecting the influence of coastline configuration (Table 6). Together, the maximum significant wave heights and storm durations illustrates the exposure of the Knocknagoneen cliff to high-energy storm events.
5. Discussion
5.1. Cliff Face and Cliff Top Retreat
As reported by previous studies [18,30], estimates of cliff retreat rate can differ markedly depending on the method used. Our short- (28 year) and long-term (181 year) DSAS-based estimates for cliff top retreat (0.14–0.16 m yr-1) are double the cliff face retreat rates predicted by the short-term (4.4 year) PC analysis (0.077 m yr-1), a discrepancy with clear implications for the viability of long-term predictions of coastal change. [18] proposed two plausible causes for this offset, the first being that calculated differences in retreat rates signify variability in the magnitude and frequency of erosional events. Whereas cliff top retreat is driven by larger yet more periodic events (e.g., driven by undermining), cliff face retreat reflects the impact of lower-magnitude, higher-frequency events [16,18,76]. Secondly, [18] suggested that disparate estimates arise because the methods themselves are different: cliff top change is calculated directly from differences in shoreline position, whereas cliff face changes are calculated via the horizontal displacement of an area [18]. Moreover, at our site, average rates of cliff top retreat might be biased by the relatively high rates observed at the cliff’s western end (as much as 0.2 m/year), which are almost double those in the middle part (0.1 m/year).
As depicted in Figure 1, the Knocknagoneen cliff face is fronted by a shore platform extending as much as 235 m into Galway Bay, which provides clear geologic evidence for the drumlin’s former areal extent. According to our two estimates of cliff retreat, this platform began forming either as early as 1700 years ago (PC analysis) or as late as 1500 years ago (DSAS analysis), with the important caveats that cliff erosion may not have been linear nor sea level static during this time. For instance, current estimates of marine inundation in Galway Bay remain variable, suggesting that sea level rose to within the modern intertidal zone during the middle Holocene [58], several millennia later at ~3 ka [77], or as recent as 1500–1000 years ago [59]. We note that, should the modern retreat rate for Knocknagoneen be representative of the longer term, it would align broadly with the model of a more recent marine incursion in Galway Bay [59].
Incorporating the three-dimensional PC analysis into a GIS affords valuable new insight into the spatial and temporal distribution of cliff changes (area and volume) and the effective measurement of cliff retreat rates. Further, quantification of sediment losses and gains provides information on overall cliff stability, and can be correlated with other spatial data such as lithology and geologic structures. In our study, the volume change results are dominated by removal of the prominent talus slope at the base of the cliff’s western section (Figure 11).
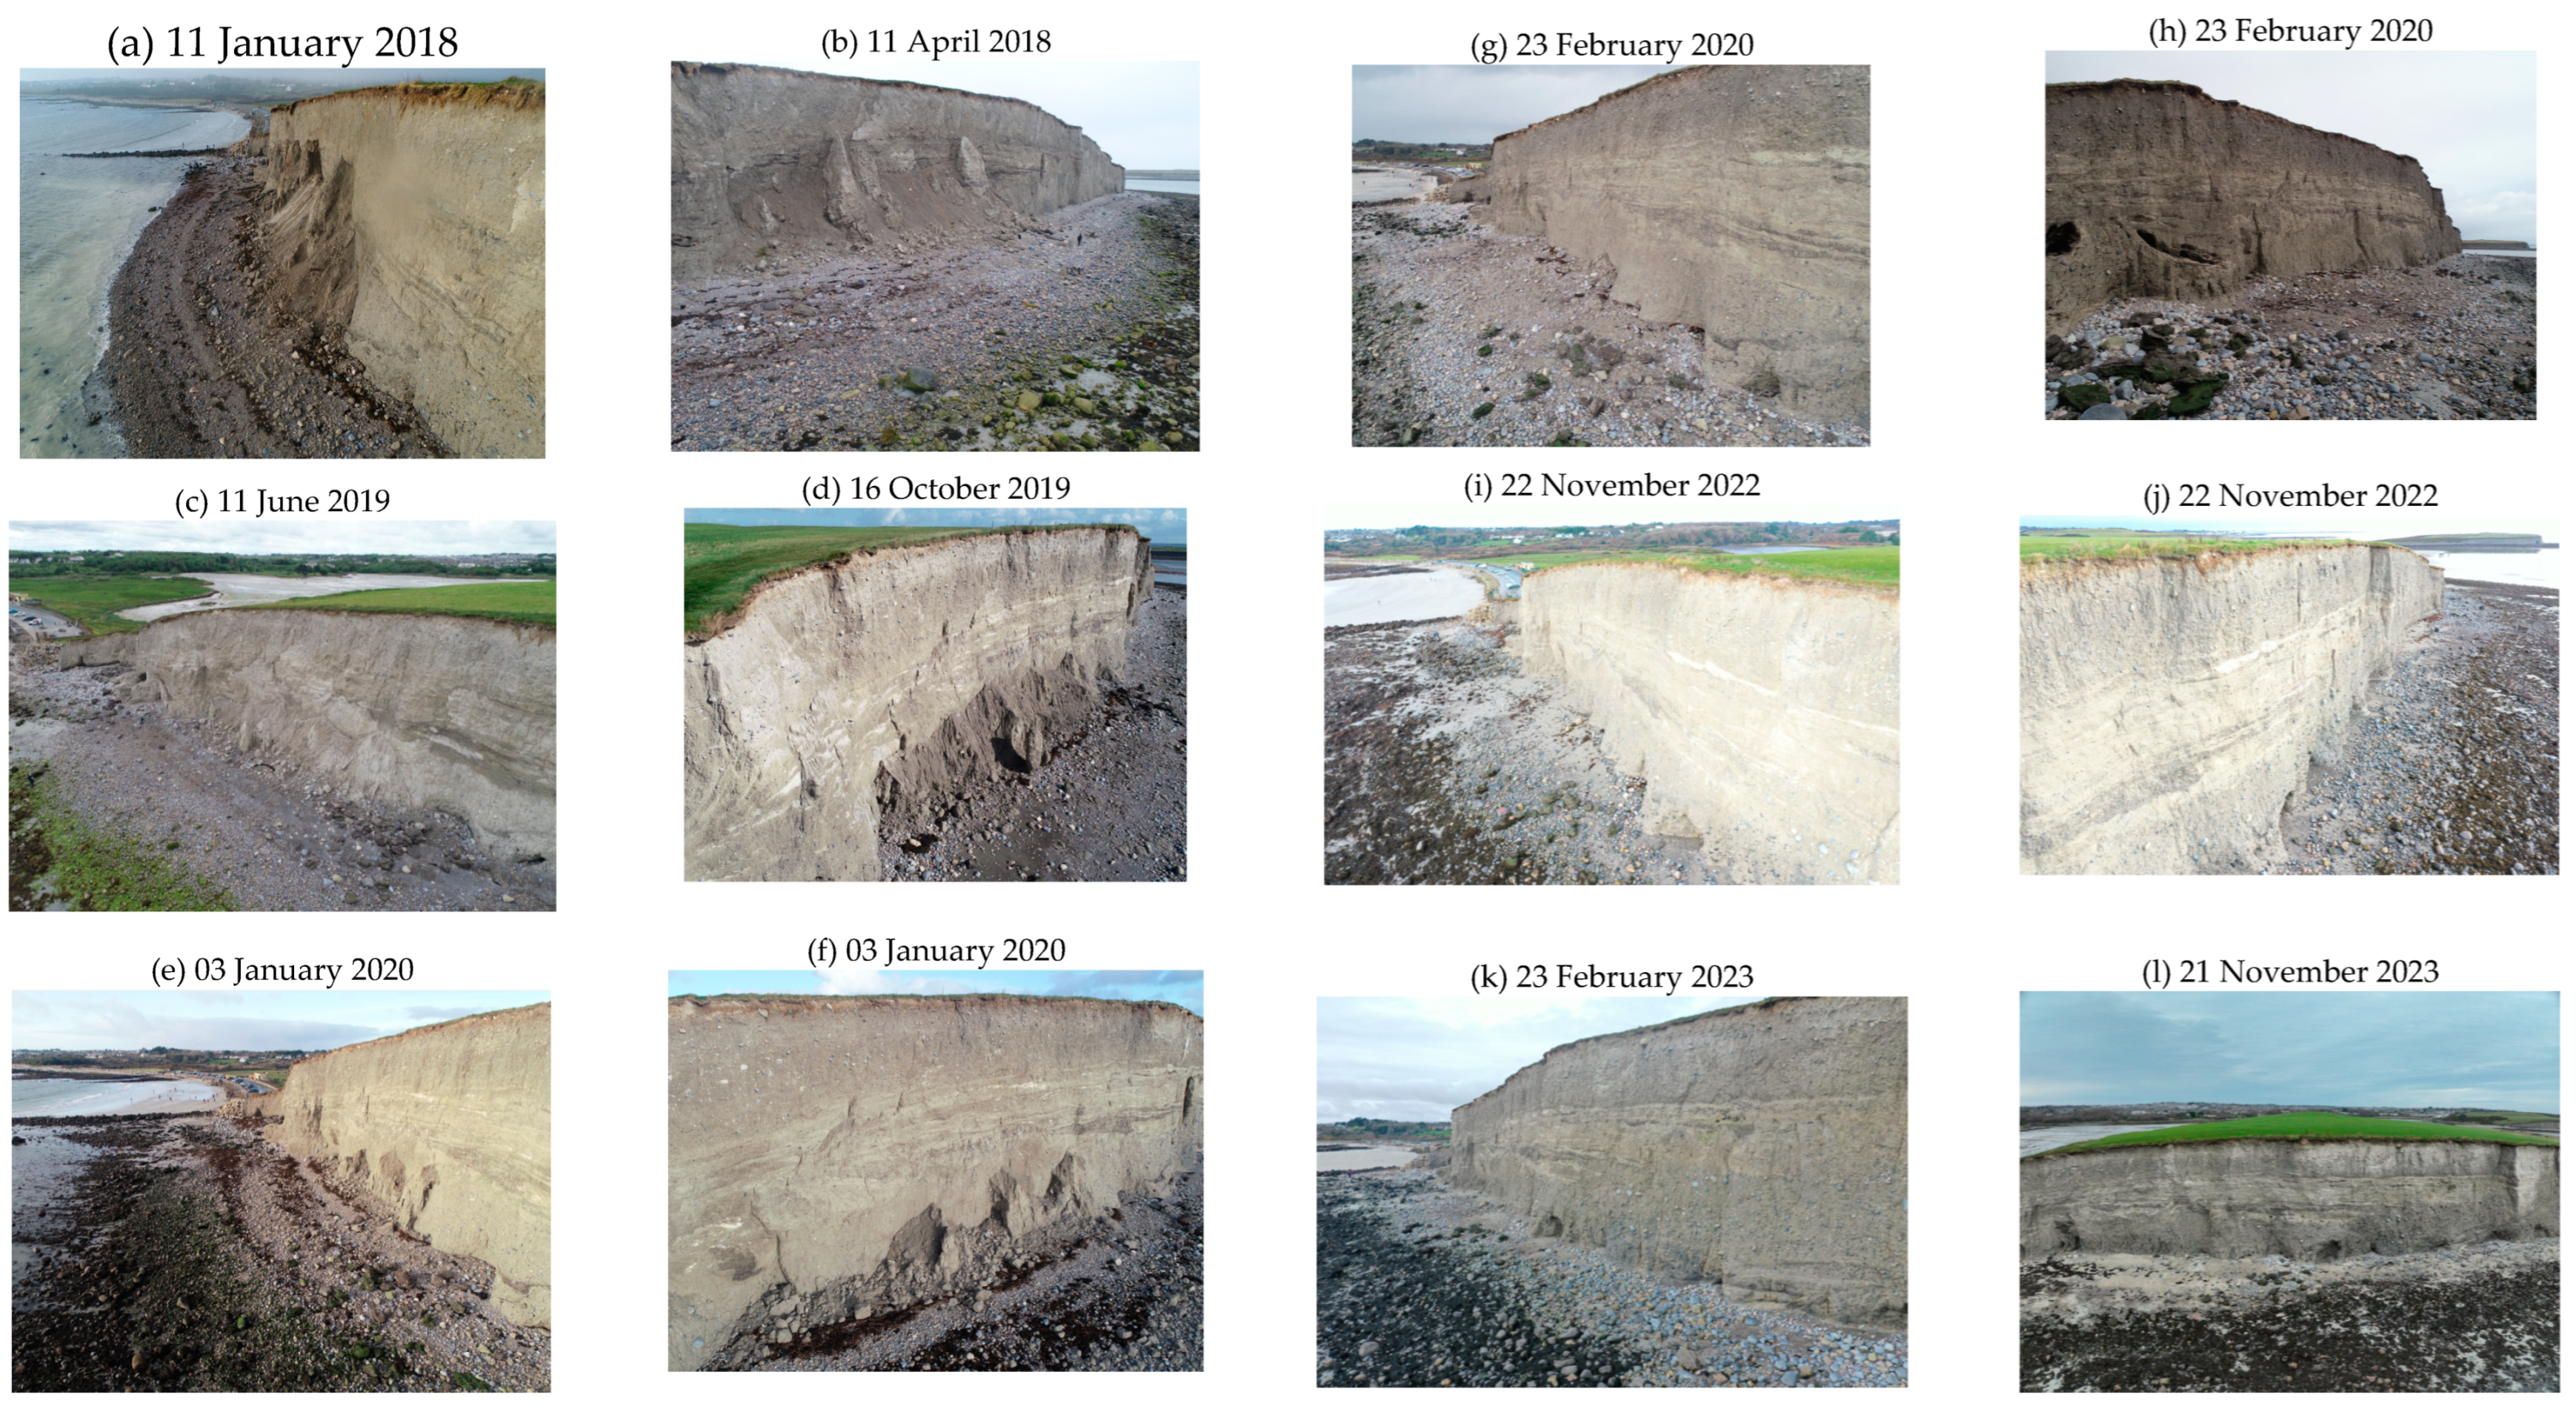
Assuming that the Knocknagoneen drumlin has been subject to multiple cycles of talus slope formation and removal over a protracted period (centuries to millennia), our short-term study provides highly detailed measurements of one part of this cycle – talus slope removal – for a single location along the cliff. It is clear from our results that the aperiodic formation of unconsolidated talus at the cliff base actively protects the lower face from wave erosion [7,10,34]. Thus, the cliff functions as a cascading system in which sediment removed from the face accumulates at its natural angle of repose within the talus slope before being undercut and steepened by marine forces [4,27]. The destabilised deposit is removed by wave actions and incorporated into the local littoral cell. During these relatively short period cycles when the talus debris is stored and removed at the cliff foot, Knocknagoneen can be considered a periodically transport-limited (pTL) cliff on the continuum of transportational cliff types described by [32]. For longer periods (decades - centuries) the drumlin can be considered a supply limited system (SL) as the rapid disposal of the talus slope debris permits continuous wave erosion of the cliff base [32]. Nonetheless, we recognise that any estimates of cliff face and cliff top retreat will vary significantly depending on where within these cycles of talus slope formation–removal the observation period occurs, with important ramifications for the timing of surveys and viability of associated results [32,76,78]. Ultimately, we suggest that the conceptual model of [32,79] is applicable to our study site and propose that, over the course of our repeated surveys, we measured components B–C (Figure 12), during which the talus cone protected the face from erosion and C–A (Figure 12), when talus removal reinstated cliff retreat.
It is noteworthy that the Knocknagoneen and Knocknacarragh drumlin cliffs have being retreating in a very linear fashion the past thousands of years, producing very straight cliff lines. The results show that the spatial variability in cliff face retreat was similar for both sections once the talus slope was removed. Perhaps, this feature is not surprising given the homogenous till composition of both landforms. Being only partially consolidated, glaciogenic sediments such as basal diamictons are highly prone to erosion, scarping, and slumping in high-wave-energy environments such as Galway Bay. Together, these geomorphic processes drive the aperiodic development of basal talus slopes that are subsequently washed away during winter storms, while the continuous cycle of sediment delivery to the coastal littoral cell fosters the formation of features such as fringing barriers (Figure 1 and Figure 3). Furthermore, within active marine wetlands (saltmarsh and mudflats) such as Rusheen Bay, immediately north of Knocknagoneen (Figure 2), the deposition of sediment derived from the drumlin face must match or surpass sea level rise if equilibrium is to be maintained within the basin.
Although we attribute coastal cliff erosion to marine erosion mechanisms, we are cognisant of the potential role of subaerial mechanisms acting on the cliff. Based on repeat visits to the site, there was very limited evidence of rainfall-induced erosion processes such as rilling impacting cliff stability. It is noted that rainfall events can influence sub-surface pore pressures and cliff stability that are not discernible during site visits [79]. The potential influence of subaerial processes requires further investigation especially in wet climates like Galway (see Section 2.1) but it is assumed that marine forces are the dominant control on cliff stability.
5.2. Comparison with Previous Studies
We compared our results from Knocknagoneen with those of previous studies of soft rocky coasts in Northern Ireland [3,35], England [40,41], Northern [27] and Southern California [18,30], Canada [33], Portugal [34], and one global scale study [7]. Details are provided in Table 7. Recognising that the majority of these studies reported cliff top retreat rates, we note that estimates of cliff face and cliff top retreat rates are highly variable and dominated by local environmental conditions [7,10,18] (Table 7, Figure 13).
In terms of material and environmental conditions, the most similar sites to ours are those at St. Georges Bay in Canada [23], and Strangford Lough [3] and Portballintrae, [35] in Northern Ireland (Figure 13). These studies focused on drumlins that, like Knocknagoneen, comprise Late Pleistocene till and occupy positions in sheltered bays fringing the North Atlantic Ocean. Yet, despite these similarities, reported cliff top retreat rates for St. Georges Bay are more than three times higher (0.51 +/- 0.24 m/year) than those calculated for Galway Bay (0.14 +/- 0.01 m/year). In comparison, cliff top retreat rates for Portballintrae (0.17 +/- 0.09) and Strangford Lough (0.08 +/- 0.01 m/year) are more correlative with our findings. Farther south, and beyond the limits of Late Pleistocene glaciation, cliff retreat rates for parts of the Algarve coast [34] exhibit much higher values (and large uncertainties) (Figure 13), reflecting a greater variability in erosion processes. We posit that the higher degree of consolidation of the Silverstrand glacial till compared to the Algarve sediments explains the lower cliff top retreat rates at the former. Similarly, the weakly consolidated cliffs at Eureka, northern California, are a plausible explanation for the elevated cliff top retreat rates at that site [27]. This correlation between cliff top retreat rates and the hardness of cliff material is illustrated in a global study by [7].
6. Conclusions
We combined historical data (1842–2000) and contemporary UAV surveys (2019–2023) to measure rates of cliff top and cliff face retreat along a 250 m-wide coastal drumlin in Galway Bay. Our reconstructions suggest that the average cliff top retreat rate between 1842 and 2023 (0.14 +/- 0.02 m yr-1) was higher than the rate of cliff face retreat for the period 2019–2023 (0.08 +/- 0.02 m yr-1). In agreement with previous investigations, we found that estimated rates of cliff retreat differ markedly depending on the method used, with the DSAS-based rates being approximately double those predicted by PC analysis. We attribute this discrepancy most likely to differences in methodology which reiterates that method choice will have important implications for cliff retreat forecasting. Nevertheless, probable differences in cliff top and cliff face erosion processes should also be considered.
The Knocknagoneen escarpment functions as a cascading system, in which sediment removed from the cliff face accumulates at its natural angle of repose within the talus slope, which is in turn undercut and steepened by wave action. Remobilised sediment is then transported by wave action and incorporated into the local littoral cell. The repeat cycles of talus slope formation and removal in this high wave energy climate suggest that the drumlin transitions between a periodically transport-limited system and supply limited system over short- and long-time periods, respectively, on the continuum of cliff types. Although direct precipitation undoubtedly plays some role in cliff face stability, we conclude that this factor is secondary compared to marine mechanisms, which dominate the cascading system at this soft rocky landform.
References
- Knight, J.; Harrison, S. Paraglacial Evolution of the Irish Landscape. IrishGeog 2018, 51, 171–186. [CrossRef]
- Hanvey, P.M. The Sedimentology and Genesis of Late-Pleistocene Drumlins in Counties Mayo and Donegal, Western Ireland. Unpublished DPhil Thesis, University of Ulster, 1988.
- Greenwood, R.O.; Orford, J.D. Temporal Patterns and Processes of Retreat of Drumlin Coastal Cliffs — Strangford Lough, Northern Ireland. Geomorphology 2008, 94, 153–169. [CrossRef]
- McCabe, A.M.; Dardis, G.F. Sedimentology and Depositional Setting of Late Pleistocene Drumlins, Galway Bay, Western Ireland. SEPM JSR 1989, Vol. 59. [CrossRef]
- Department of Housing, Local Government and Heritage and the Office of Public Works Report of the Inter-Departmental Group on National Coastal Change Management Strategy; 2023; p. 108pp;.
- Emery, K.O.; Kuhn, G.G. Sea Cliffs: Their Processes, Profiles, and Classification. Geol Soc America Bull 1982, 93, 644. [CrossRef]
- Prémaillon, M.; Regard, V.; Dewez, T.J.B.; Auda, Y. GlobR2C2 (Global Recession Rates of Coastal Cliffs): A Global Relational Database to Investigate Coastal Rocky Cliff Erosion Rate Variations. Earth Surf. Dynam. 2018, 6, 651–668. [CrossRef]
- Young, A.P.; Carilli, J.E. Global Distribution of Coastal Cliffs. Earth Surf Processes Landf 2019, 44, 1309–1316. [CrossRef]
- Cullen, N. A Study of Rock Coast Erosion on the Atlantic Coast of Ireland, Trinity College Dublin. School of Natural Sciences, 2019.
- Caplain, B.; Astruc, D.; Regard, V.; Moulin, F.Y. Cliff Retreat and Sea Bed Morphology under Monochromatic Wave Forcing: Experimental Study. Comptes Rendus Geoscience 2011, 343, 471–477. [CrossRef]
- Westoby, M.J.; Brasington, J.; Glasser, N.F.; Hambrey, M.J.; Reynolds, J.M. ‘Structure-from-Motion’ Photogrammetry: A Low-Cost, Effective Tool for Geoscience Applications. Geomorphology 2012, 179, 300–314. [CrossRef]
- Gonçalves, J.A.; Henriques, R. UAV Photogrammetry for Topographic Monitoring of Coastal Areas. ISPRS Journal of Photogrammetry and Remote Sensing 2015, 104, 101–111. [CrossRef]
- Luetzenburg, G.; Townsend, D.; Svennevig, K.; Bendixen, M.; Bjørk, A.A.; Eidam, E.F.; Kroon, A. Sedimentary Coastal Cliff Erosion in Greenland. JGR Earth Surface 2023, 128, e2022JF007026. [CrossRef]
- Ruggiero, P.; Kratzmann, M.G.; Himmelstoss, E.A.; Reid, D.; Allan, J.; Kaminsky, G. National Assessment of Shoreline Change: Historical Shoreline Change Along the Pacific Northwest Coast; Open-File Report; U.S. Geological Survey, 2013;.
- Irrgang, A.M.; Lantuit, H.; Manson, G.K.; Günther, F.; Grosse, G.; Overduin, P.P. Variability in Rates of Coastal Change Along the Yukon Coast, 1951 to 2015. J. Geophys. Res. Earth Surf. 2018, 123, 779–800. [CrossRef]
- Rosser, N.J.; Brain, M.J.; Petley, D.N.; Lim, M.; Norman, E.C. Coastline Retreat via Progressive Failure of Rocky Coastal Cliffs. Geology 2013, 41, 939–942. [CrossRef]
- Williams, J.G.; Rosser, N.J.; Hardy, R.J.; Brain, M.J.; Afana, A.A. Optimising 4-D Surface Change Detection: An Approach for Capturing Rockfall Magnitude–Frequency. Earth Surf. Dynam. 2018, 6, 101–119. [CrossRef]
- Swirad, Z.M.; Young, A.P. Spatial and Temporal Trends in California Coastal Cliff Retreat. Geomorphology 2022, 412, 108318. [CrossRef]
- Swirad, Z.M.; Rosser, N.J.; Brain, M.J. Identifying Mechanisms of Shore Platform Erosion Using Structure-from-Motion (SfM) Photogrammetry. Earth Surf. Process. Landforms 2019, 44, 1542–1558. [CrossRef]
- Vanneschi; Camillo; Aiello; Bonciani; Salvini SfM-MVS Photogrammetry for Rockfall Analysis and Hazard Assessment Along the Ancient Roman Via Flaminia Road at the Furlo Gorge (Italy). IJGI 2019, 8, 325. [CrossRef]
- Piermattei, L.; Carturan, L.; Guarnieri, A. Use of Terrestrial Photogrammetry Based on Structure-from-Motion for Mass Balance Estimation of a Small Glacier in the Italian Alps: SfM-MVS APPROACH FOR GLACIER MASS BALANCE ESTIMATION. Earth Surf. Process. Landforms 2015, 40, 1791–1802. [CrossRef]
- Marcer, M.; Stentoft, P.A.; Bjerre, E.; Cimoli, E.; Bjørk, A.; Stenseng, L.; Machguth, H. Three Decades of Volume Change of a Small Greenlandic Glacier Using Ground Penetrating Radar, Structure from Motion, and Aerial Photogrammetry. Arctic, Antarctic, and Alpine Research 2017, 49, 411–425. [CrossRef]
- Colomina, I.; Molina, P. Unmanned Aerial Systems for Photogrammetry and Remote Sensing: A Review. ISPRS Journal of Photogrammetry and Remote Sensing 2014, 92, 79–97. [CrossRef]
- James, M.R.; Robson, S.; d’Oleire-Oltmanns, S.; Niethammer, U. Optimising UAV Topographic Surveys Processed with Structure-from-Motion: Ground Control Quality, Quantity and Bundle Adjustment. Geomorphology 2017, 280, 51–66. [CrossRef]
- James, L.A.; Hodgson, M.E.; Ghoshal, S.; Latiolais, M.M. Geomorphic Change Detection Using Historic Maps and DEM Differencing: The Temporal Dimension of Geospatial Analysis. Geomorphology 2012, 137, 181–198. [CrossRef]
- DaSilva, M.; Miot Da Silva, G.; Hesp, P.A.; Bruce, D.; Keane, R.; Moore, C. Assessing Shoreline Change Using Historical Aerial and RapidEye Satellite Imagery (Cape Jaffa, South Australia). Journal of Coastal Research 2021, 37. [CrossRef]
- Hapke, C.J.; Reid, D. National Assessment of Shoreline Change, Part 4: Historical Coastal Cliff Retreat along the California Coast; U.S. Geological Survey, 2007;.
- Kenny, P. MapGenie. Ordnance Survey Ireland 2023.
- Boardman, J.; Favis-Mortlock, D. Boardman, J. and Favis-Mortlock, D.T. (2016). The Use of Erosion Pins in Geomorphology. Chapter 3.5.3 in Cook, S.J., Clarke, L.E. and Nield, J.M. (Eds) Geomorphological Techniques (Online Edition). British Society for Geomorphology, London, UK. ISSN: 2047-0371. In; 2016 ISBN 2047-0371.
- Young, A.P. Decadal-Scale Coastal Cliff Retreat in Southern and Central California. Geomorphology 2018, 300, 164–175. [CrossRef]
- Sunamura, T. Rocky Coast Processes: With Special Reference to the Recession of Soft Rock Cliffs. Proceedings of the Japan Academy, Series B 2015, 91, 481–500. [CrossRef]
- Gómez-Pazo, A.; Pérez-Alberti, A.; Trenhaile, A. Tracking the Behavior of Rocky Coastal Cliffs in Northwestern Spain. Environ Earth Sci 2021, 80, 757. [CrossRef]
- Utting, D.; Gallacher, A. Coastal Environments and Erosion in Southwest St. Georges Bay, Antigonish County. Mineral Resources Branch Report of Activities 2008, 2009–1.
- Nunes, M.; Ferreira, Ó.; Loureiro, C.; Baily, B. Beach and Cliff Retreat Induced by Storm Groups at Forte Novo, Algarve (Portugal). Journal of Coastal Research 2011, 795–799.
- McKenna, J.; Carter, R.W.G.; Bartlett, D. Coast Erosion in Northeast Ireland:-Part II Cliffs and Shore Platforms. Irish Geography 1992, 25, 111–128. [CrossRef]
- Thébaudeau, B.; Trenhaile, A.S.; Edwards, R.J. Modelling the Development of Rocky Shoreline Profiles along the Northern Coast of Ireland. Geomorphology 2013, 203, 66–78. [CrossRef]
- Cullen, N.D.; Bourke, M.C. Clast Abrasion of a Rock Shore Platform on the Atlantic Coast of Ireland: Clast Abrasion of a Rock Shore Platform. Earth Surf. Process. Landforms 2018, 43, 2627–2641. [CrossRef]
- Benjamin, J. Regional-Scale Controls on Rockfall Occurrence. PhD Thesis, Durham University, 2018.
- Shadrick, J.R.; Hurst, M.D.; Piggott, M.D.; Hebditch, B.G.; Seal, A.J.; Wilcken, K.M.; Rood, D.H. Multi-Objective Optimisation of a Rock Coast Evolution Model with Cosmogenic \chem^10Be Analysis for the Quantification of Long-Term Cliff Retreat Rates. Earth Surface Dynamics 2021, 9, 1505–1529. [CrossRef]
- Shadrick, J.R.; Rood, D.H.; Hurst, M.D.; Piggott, M.D.; Wilcken, K.M.; Seal, A.J. Constraints on Long-Term Cliff Retreat and Intertidal Weathering at Weak Rock Coasts Using Cosmogenic 10 Be, Nearshore Topography and Numerical Modelling. Earth Surf. Dynam. 2023, 11, 429–450. [CrossRef]
- Dornbusch, U.; Robinson, D.A.; Moses, C.A.; Williams, R.B.G. Temporal and Spatial Variations of Chalk Cliff Retreat in East Sussex, 1873 to 2001. Marine Geology 2008, 249, 271–282. [CrossRef]
- Hennessy, R.; Meehan, R.; Gallagher, V.; Parkes, M.; Glanville, C. The Geological Heritage of Galway City. An Audit of County Geological Sites in Galway City; Geological Survey Ireland, 2020;.
- Smith, R. Implications of Proposed Engineering for Soft Rock Coast & Saltmarsh Sediment Dynamics, University of Galway, 2019.
- Peel, M.C.; Finlayson, B.L.; McMahon, T.A. Updated World Map of the Köppen-Geiger Climate Classification. Hydrol. Earth Syst. Sci. 2007, 11, 1633–1644. [CrossRef]
- Fiaschi, S.; Holohan, E.; Sheehy, M.; Floris, M. PS-InSAR Analysis of Sentinel-1 Data for Detecting Ground Motion in Temperate Oceanic Climate Zones: A Case Study in the Republic of Ireland. Remote Sensing 2019, 11, 348. [CrossRef]
- Ren, L.; Nash, S.; Hartnett, M. Observation and Modeling of Tide- and Wind-Induced Surface Currents in Galway Bay. Water Science and Engineering 2015, 8, 345–352. [CrossRef]
- Calvino, C.; Dabrowski, T.; Dias, F. A Study of the Sea Level and Current Effects on the Sea State in Galway Bay, Using the Numerical Model COAWST. Ocean Dynamics 2022, 72, 761–774. [CrossRef]
- Calvino, C.; Dabrowski, T.; Dias, F. A Study of the Wave Effects on the Current Circulation in Galway Bay, Using the Numerical Model COAWST. Coastal Engineering 2023, 180, 104251. [CrossRef]
- Atan, R.; Goggins, J.; Harnett, M.; Agostinho, P.; Nash, S. Assessment of Wave Characteristics and Resource Variability at a 1/4-Scale Wave Energy Test Site in Galway Bay Using Waverider and High Frequency Radar (CODAR) Data. Ocean Engineering 2016, 117, 272–291. [CrossRef]
- Miccadei, E.; Mascioli, F.; Ricci, F.; Piacentini, T. Geomorphology of Soft Clastic Rock Coasts in the Mid-Western Adriatic Sea (Abruzzo, Italy). Geomorphology 2019, 324, 72–94. [CrossRef]
- ESRI Esri Gray (Light) 2021.
- Google Google Satellite 2024.
- Greenwood, S.L.; Clark, C.D. Reconstructing the Last Irish Ice Sheet 1: Changing Flow Geometries and Ice Flow Dynamics Deciphered from the Glacial Landform Record. Quaternary Science Reviews 2009, 28, 3085–3100. [CrossRef]
- Smith, M.J.; Knight, J. Palaeoglaciology of the Last Irish Ice Sheet Reconstructed from Striae Evidence. Quaternary Science Reviews 2011, 30, 147–160. [CrossRef]
- Clark, C.D.; Hughes, A.L.C.; Greenwood, S.L.; Spagnolo, M.; Ng, F.S.L. Size and Shape Characteristics of Drumlins, Derived from a Large Sample, and Associated Scaling Laws. Quaternary Science Reviews 2009, 28, 677–692. [CrossRef]
- Spagnolo, M.; Clark, C.D.; Hughes, A.L.C.; Dunlop, P.; Stokes, C.R. The Planar Shape of Drumlins. Sedimentary Geology 2010, 232, 119–129. [CrossRef]
- Foreman, A.C.; Bromley, G.R.M.; Hall, B.L.; Jackson, M.S. A 10Be-Dated Record of Glacial Retreat in Connemara, Ireland, Following the Last Glacial Maximum and Implications for Regional Climate. Palaeogeography, Palaeoclimatology, Palaeoecology 2022, 592, 110901. [CrossRef]
- Williams, D.M.; Doyle, E. Dates from Drowned Mid-Holocene Landscapes on the Central Western Irish Seaboard. Irish Journal of Earth Sciences 2014, 32, 23–27. [CrossRef]
- O’Connell, M.; Molloy, K. Mid- and Late-Holocene Environmental Change in Western Ireland: New Evidence from Coastal Peats and Fossil Timbers with Particular Reference to Relative Sea-Level Change. The Holocene 2017, 27, 1825–1845. [CrossRef]
- Schettler, G.; Romer, R.L.; O’Connell, M.; Molloy, K. Holocene Climatic Variations and Postglacial Sea-Level Rise Geochemically Recorded in the Sediments of the Brackish Karst Lake An Loch Mor, Western Ireland. Boreas 2006, 35, 674–693. [CrossRef]
- Himmelstoss, E.A.; Farris, A.S.; Henderson, R.E.; Kratzmann, M.G.; Ergul, A.; Zhang, O.; Zichichi, J.L.; Thieler, E.R. Digital Shoreline Analysis System (Version 5) 2018.
- Himmelstoss, E.A.; Henderson, R.E.; Kratzmann, M.G.; Farris, A.S. Digital Shoreline Analysis System (DSAS) Version 5.1 User Guide; Open-File Report; U.S. Geological Survey, 2021;.
- Lague, D.; Brodu, N.; Leroux, J. Accurate 3D Comparison of Complex Topography with Terrestrial Laser Scanner: Application to the Rangitikei Canyon (N-Z). ISPRS Journal of Photogrammetry and Remote Sensing 2013, 82, 10–26. [CrossRef]
- CloudCompare CloudCompare 2022.
- Agisoft LCC Agisoft Metashape User Manual Professional Edition, Version 2.0; 2023;.
- Cullen, N.D.; Verma, A.K.; Bourke, M.C. A Comparison of Structure from Motion Photogrammetry and the Traversing Micro-Erosion Meter for Measuring Erosion on Shore Platforms. Earth Surface Dynamics 2018, 6, 1023–1039. [CrossRef]
- Chen, Y.; Medioni, G. Object Modeling by Registration of Multiple Range Images. In Proceedings of the Proceedings. 1991 IEEE International Conference on Robotics and Automation; 1991; pp. 2724–2729 vol.3.
- Hartmeyer, I.; Keuschnig, M.; Delleske, R.; Krautblatter, M.; Lang, A.; Schrott, L.; Prasicek, G.; Otto, J.-C. A 6-Year Lidar Survey Reveals Enhanced Rockwall Retreat and Modified Rockfall Magnitudes/Frequencies in Deglaciating Cirques. Earth Surf. Dynam. 2020, 8, 753–768. [CrossRef]
- OSI MapGenie WMS 2023.
- Asoni(s), S.G.; Stavrou, A.; Lawrence, J.A. Developing a GIS Based Methodology for Coastal Chalk Cliff Retreat Using Multiple Datasets. In Proceedings of the Engineering in Chalk; ICE Publishing: Imperial College, London, UK, January 2018; pp. 369–374.
- Terres De Lima, L.; Fernández-Fernández, S.; Marcel De Almeida Espinoza, J.; Da Guia Albuquerque, M.; Bernardes, C. End Point Rate Tool for QGIS (EPR4Q): Validation Using DSAS and AMBUR. IJGI 2021, 10, 162. [CrossRef]
- Vallarino Castillo, R.; Negro Valdecantos, V.; Moreno Blasco, L. Shoreline Change Analysis Using Historical Multispectral Landsat Images of the Pacific Coast of Panama. JMSE 2022, 10, 1801. [CrossRef]
- Genz, A.S.; Fletcher, C.H.; Dunn, R.A.; Frazer, L.N.; Rooney, J.J. The Predictive Accuracy of Shoreline Change Rate Methods and Alongshore Beach Variation on Maui, Hawaii. Journal of Coastal Research 2007, 23, 87–105.
- Guisado-Pintado, E.; Jackson, D.W.T. Coastal Impact From High-Energy Events and the Importance of Concurrent Forcing Parameters: The Cases of Storm Ophelia (2017) and Storm Hector (2018) in NW Ireland. Front. Earth Sci. 2019, 7, 190. [CrossRef]
- Zelinsky, D.A. Tropical Cyclone Report: Hurricane Lorenzo (AL132019); United States National Hurricane Center, 2019;.
- Lim, M.; Rosser, N.J.; Allison, R.J.; Petley, D.N. Erosional Processes in the Hard Rock Coastal Cliffs at Staithes, North Yorkshire. Geomorphology 2010, 114, 12–21. [CrossRef]
- Jordan, S.F.; Murphy, B.T.; O’Reilly, S.S.; Doyle, K.P.; Williams, M.D.; Grey, A.; Lee, S.; McCaul, M.V.; Kelleher, B.P. Mid-Holocene Climate Change and Landscape Formation in Ireland: Evidence from a Geochemical Investigation of a Coastal Peat Bog. Organic Geochemistry 2017, 109, 67–76. [CrossRef]
- Williams, J.G.; Rosser, N.J.; Hardy, R.J.; Brain, M.J. The Importance of Monitoring Interval for Rockfall Magnitude-Frequency Estimation. J. Geophys. Res. Earth Surf. 2019, 124, 2841–2853. [CrossRef]
- Brooks, S.M.; Spencer, T.; Boreham, S. Deriving Mechanisms and Thresholds for Cliff Retreat in Soft-Rock Cliffs under Changing Climates: Rapidly Retreating Cliffs of the Suffolk Coast, UK. Geomorphology 2012, 153–154, 48–60. [CrossRef]
Figure 5.
Cross section of the Knocknagoneen drumlin, modified from [4], depicting the four different lithofacies described in that study.
Figure 5.
Cross section of the Knocknagoneen drumlin, modified from [4], depicting the four different lithofacies described in that study.
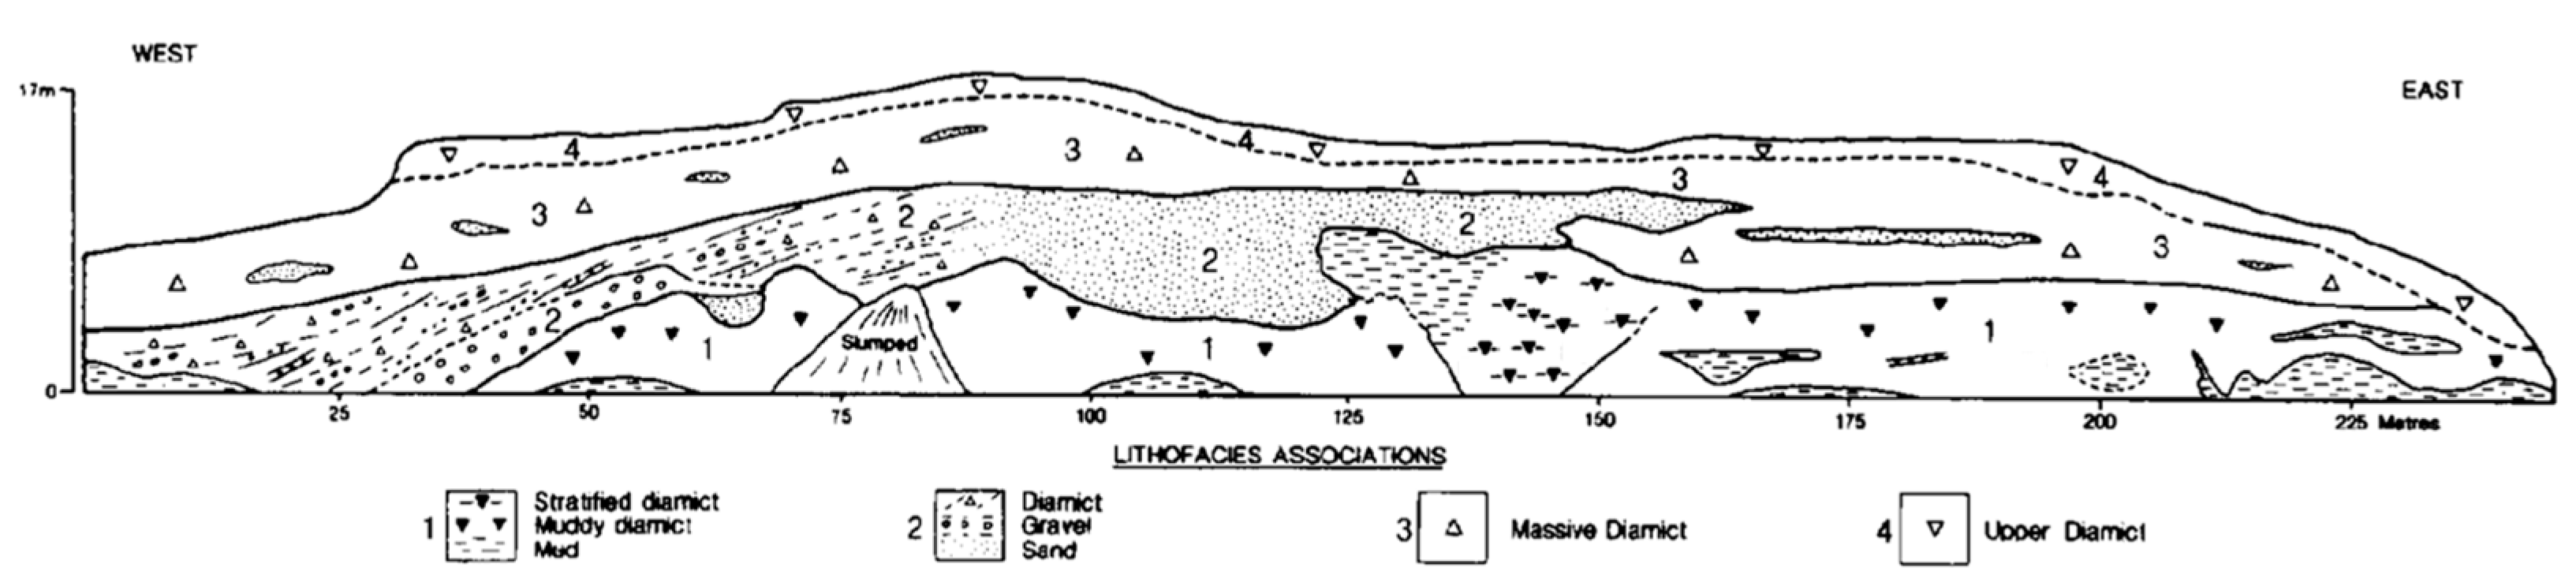
Figure 6.
Step-by-step workflow to compute PCs and DSMs from UAV imagery.
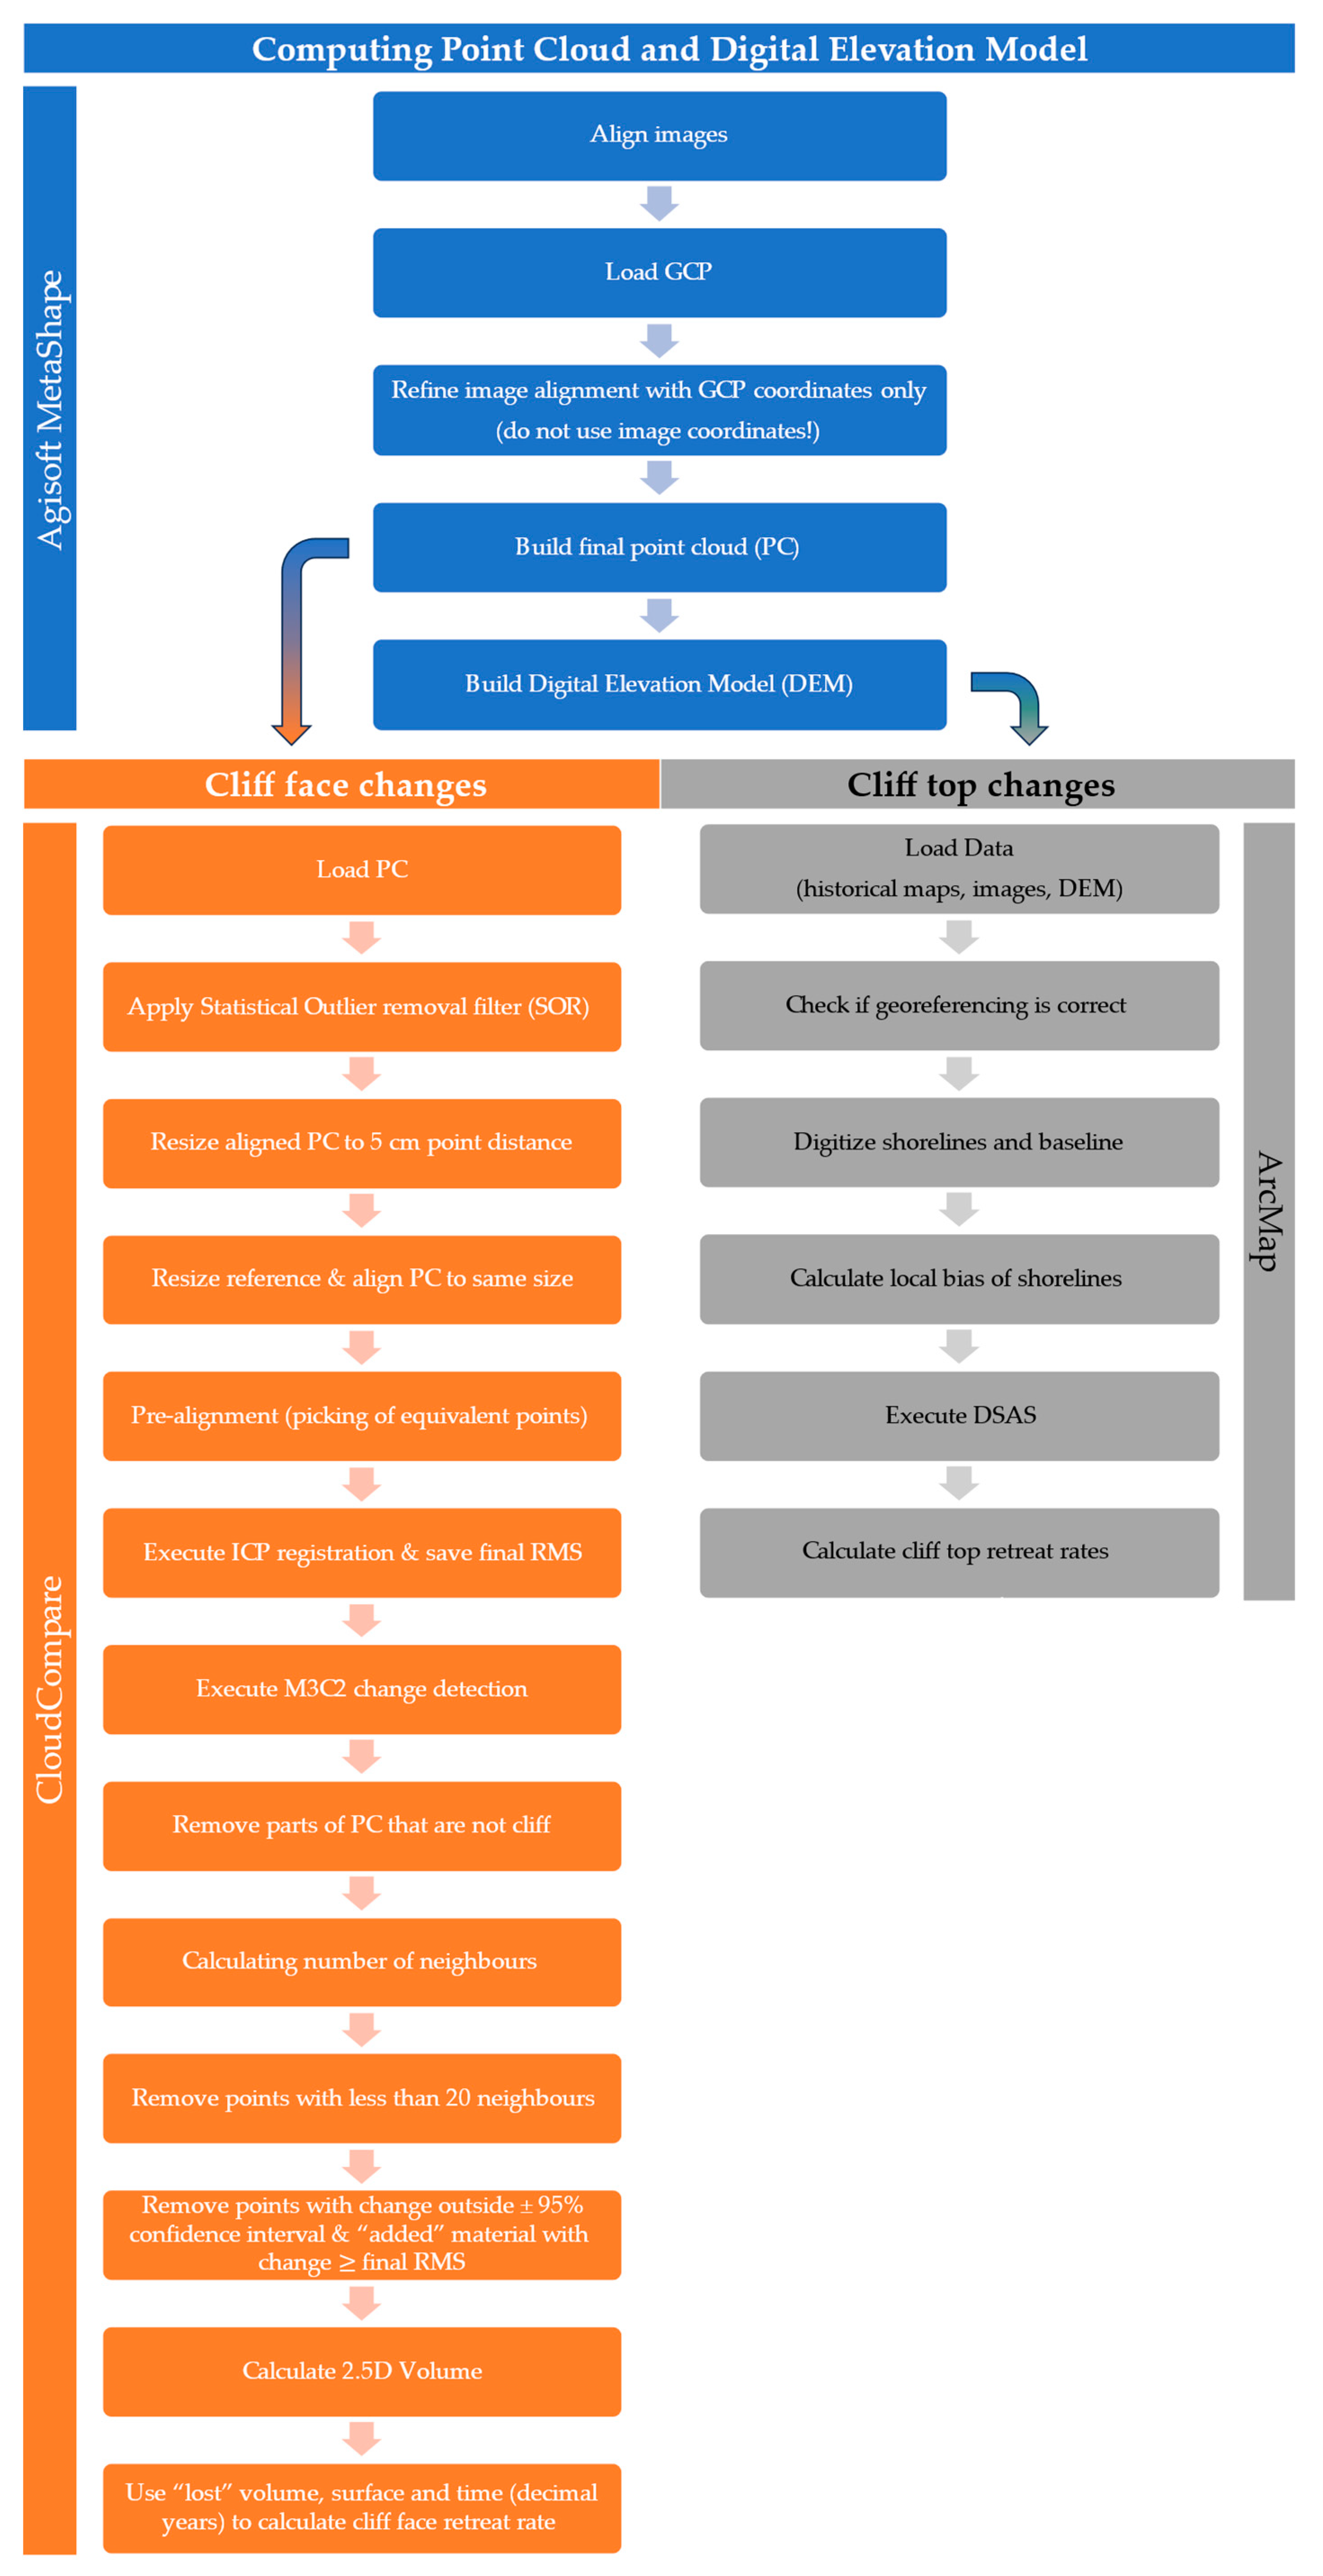
Figure 7.
(a) Total volume of sediment lost from the cliff face between 11/06/2019 and 21/11/2023. (b) Average retreat rate of the cliff face over the same period. (c) Changes in cliff face along the western (left panel) and eastern (right panel) sections for the same period (note the scale difference between Figure 7c and Figure 8a).
Figure 7.
(a) Total volume of sediment lost from the cliff face between 11/06/2019 and 21/11/2023. (b) Average retreat rate of the cliff face over the same period. (c) Changes in cliff face along the western (left panel) and eastern (right panel) sections for the same period (note the scale difference between Figure 7c and Figure 8a).
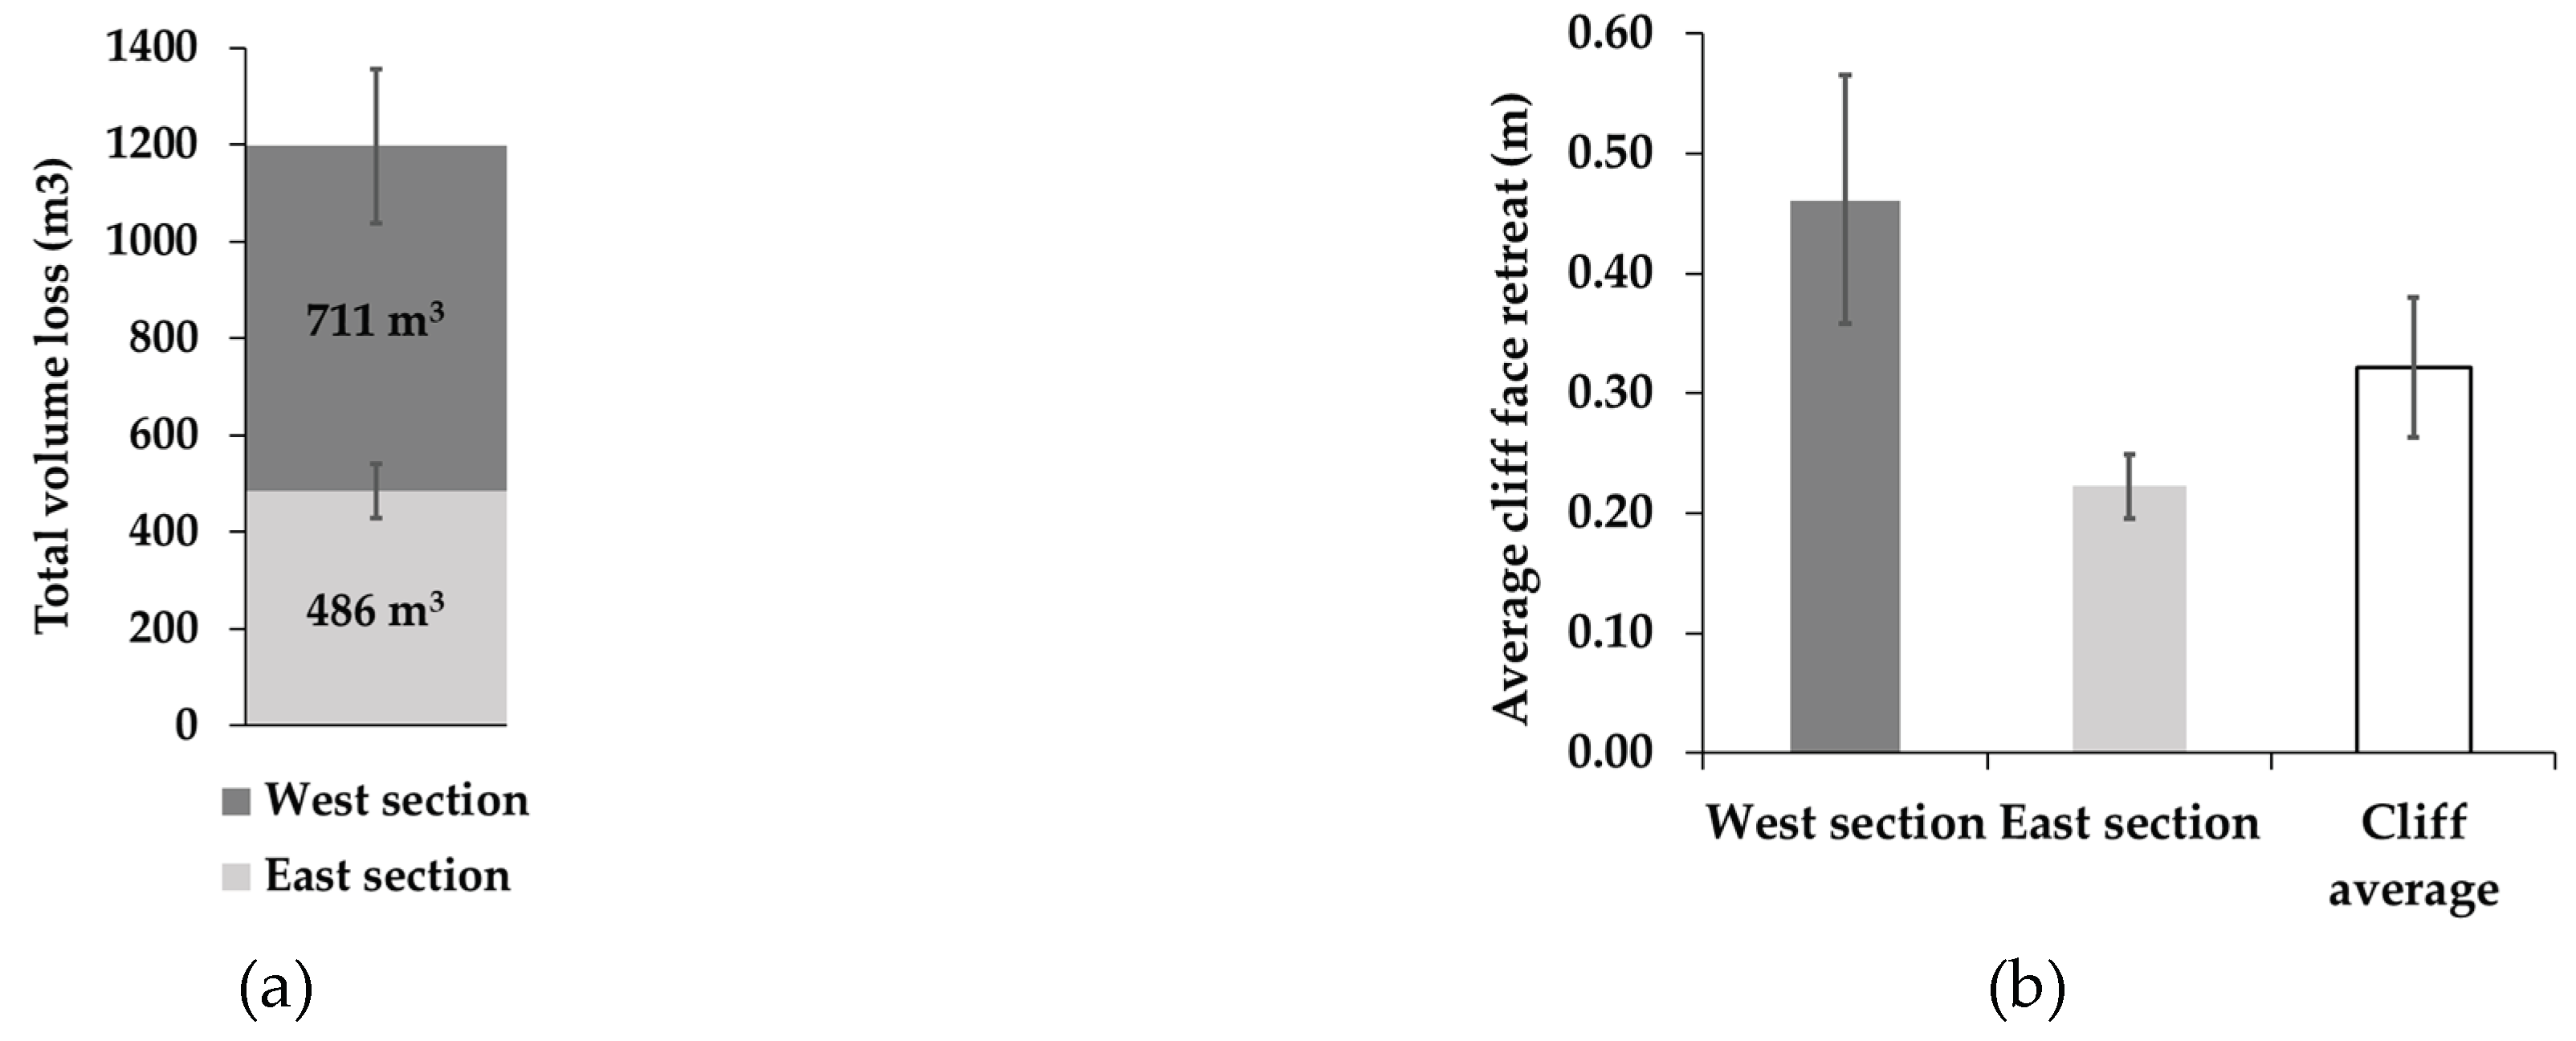
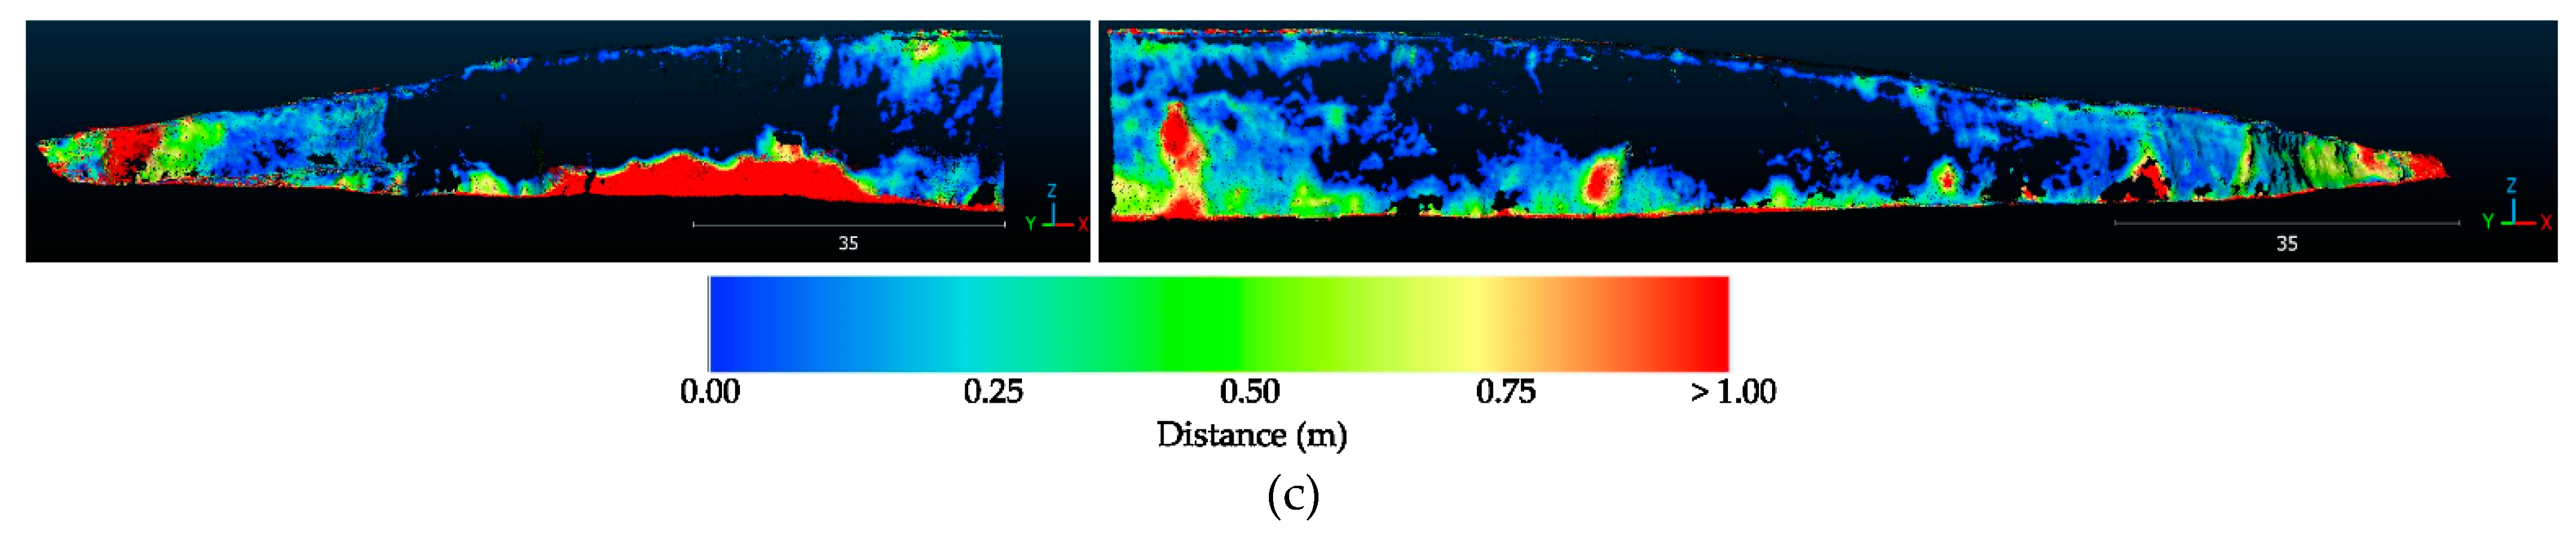
Figure 8.
Mapped cliff face changes and calculated rates of erosion and cliff face retreat. (a) Cliff face changes in the western (left panels) section and eastern (right panels) sections calculated using PC analysis. Positive values indicate sediment loss, while negative values indicate sediment gain. (b) Erosion rates (er) and cliff face retreat rates (cfr) for the western and easter sections. The upper panel depicts the rates of erosion and cliff face retreat between 11/06/2019–02/10/2019 and 05/10/2019. The lower panel shows the rates for 11/06/2019–22/11/2022, 21/09/2023, and 21/11/2023.
Figure 8.
Mapped cliff face changes and calculated rates of erosion and cliff face retreat. (a) Cliff face changes in the western (left panels) section and eastern (right panels) sections calculated using PC analysis. Positive values indicate sediment loss, while negative values indicate sediment gain. (b) Erosion rates (er) and cliff face retreat rates (cfr) for the western and easter sections. The upper panel depicts the rates of erosion and cliff face retreat between 11/06/2019–02/10/2019 and 05/10/2019. The lower panel shows the rates for 11/06/2019–22/11/2022, 21/09/2023, and 21/11/2023.
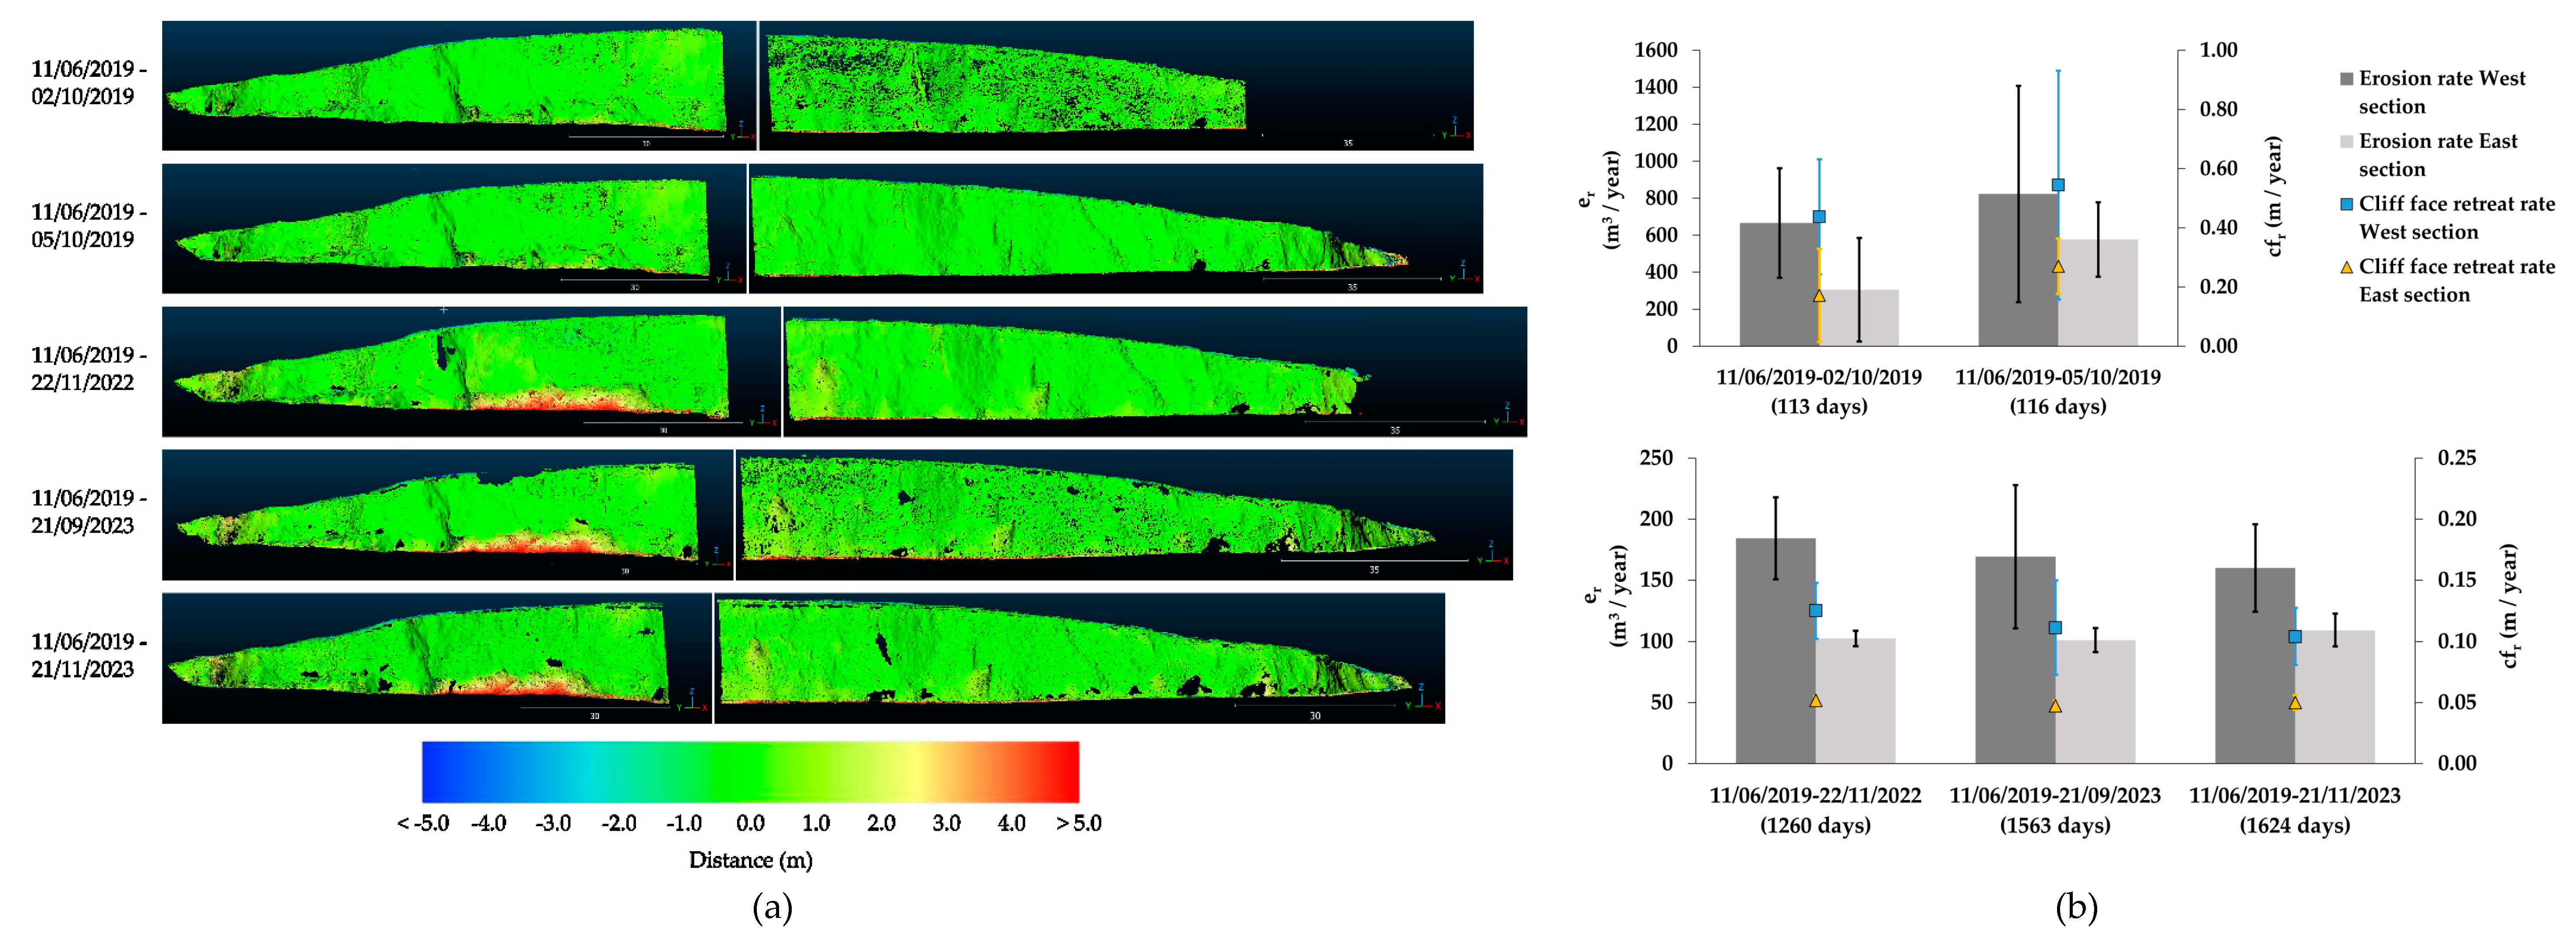
Figure 9.
Average cliff top retreat rates for the periods 1842–2000 (DSAS I), 1842–2019 (DSAS II), 1842–2023 (DSAS III) and 1995–2023 (DSAS IV).
Figure 9.
Average cliff top retreat rates for the periods 1842–2000 (DSAS I), 1842–2019 (DSAS II), 1842–2023 (DSAS III) and 1995–2023 (DSAS IV).
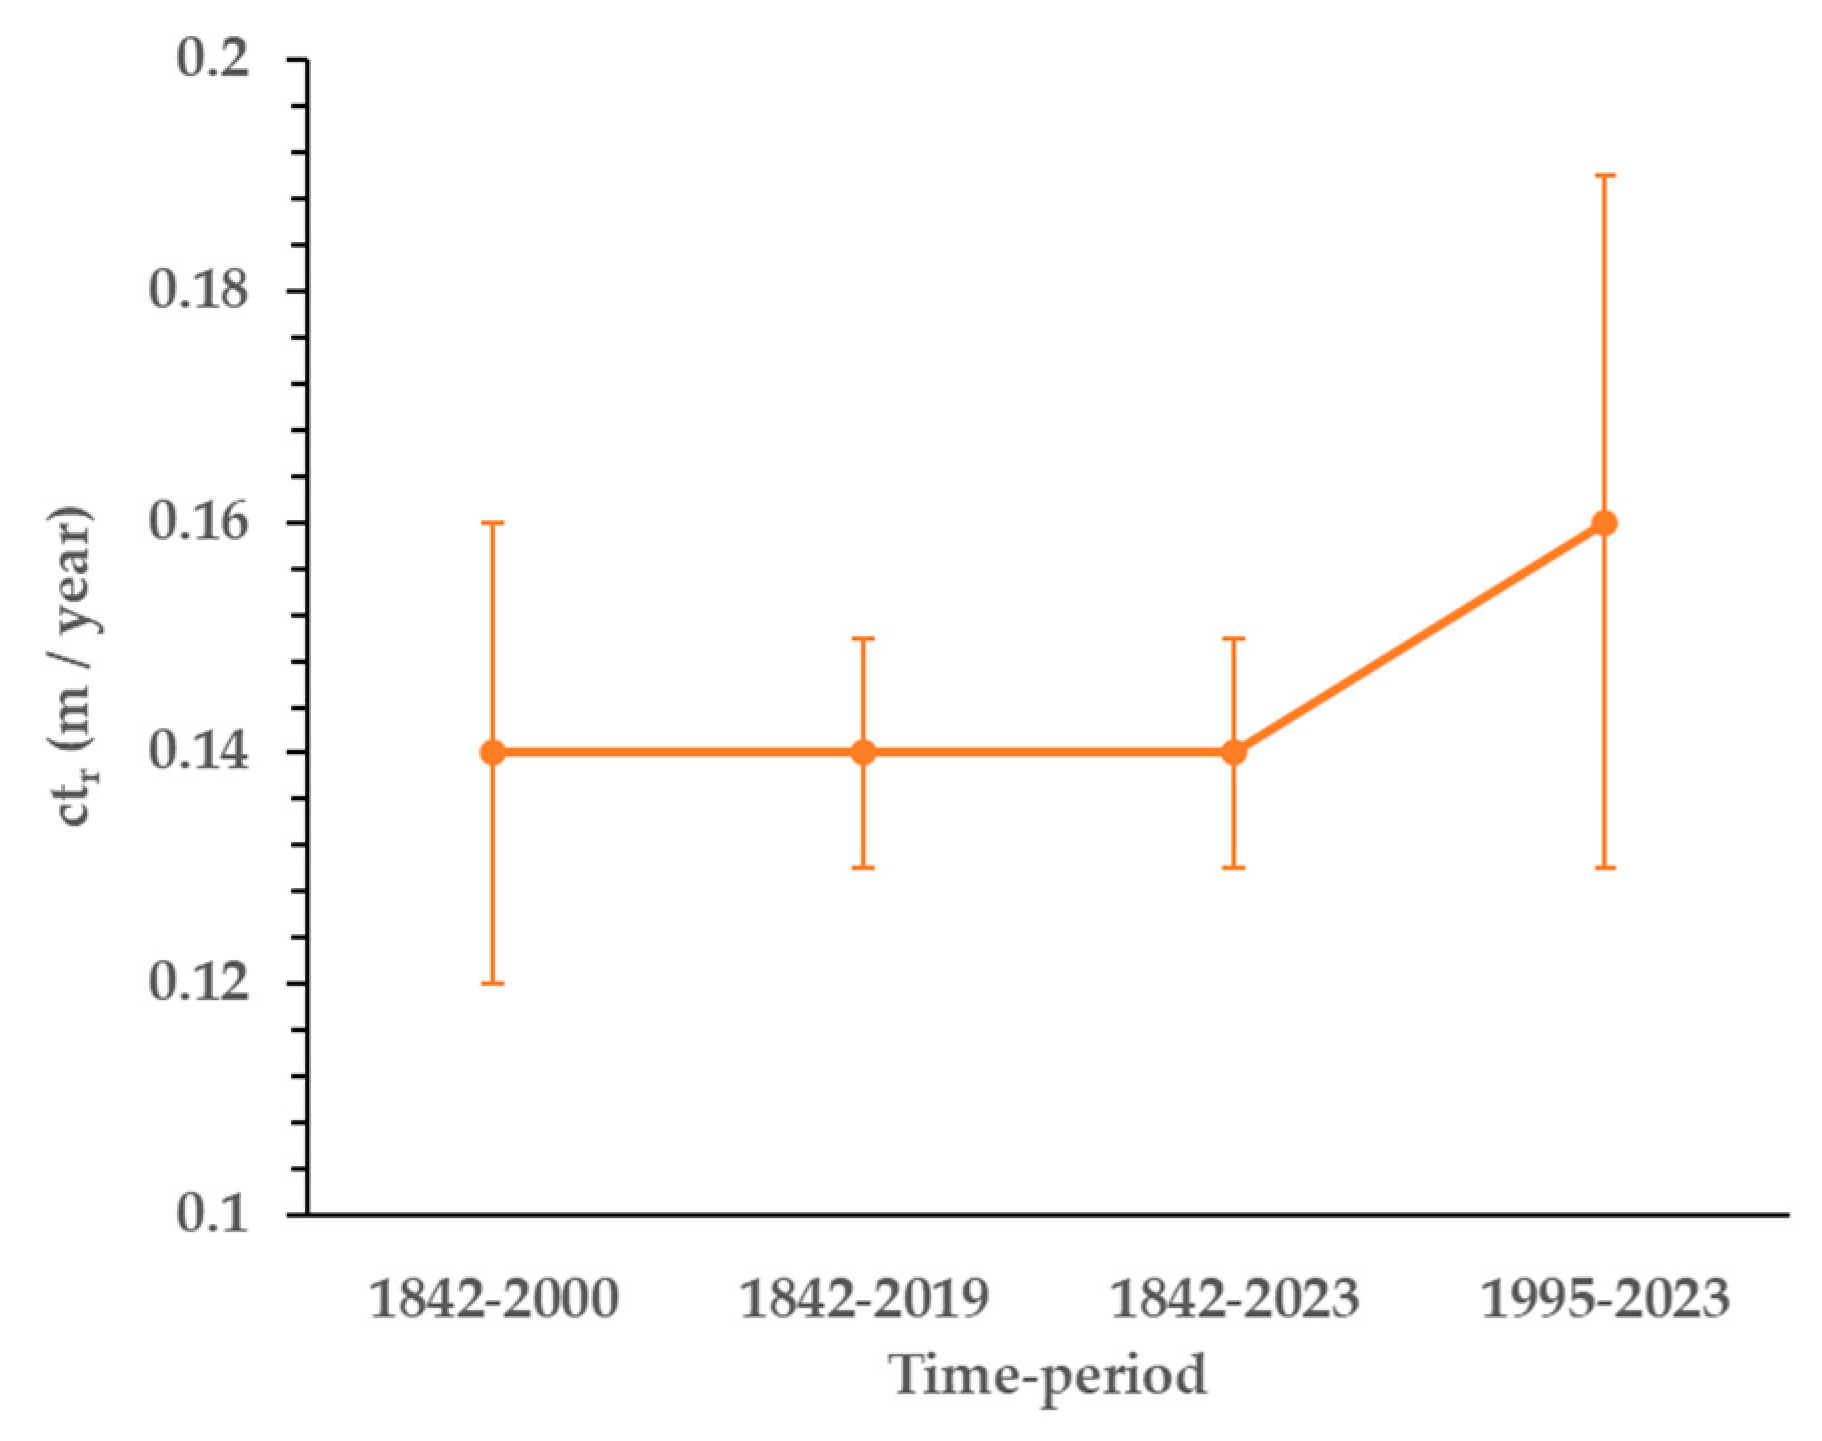
Figure 10.
Spatial distribution of cliff top retreat rates for (a) 1842–2023 (DSAS III) and (b) 1995–2023 (DSAS IV).
Figure 10.
Spatial distribution of cliff top retreat rates for (a) 1842–2023 (DSAS III) and (b) 1995–2023 (DSAS IV).
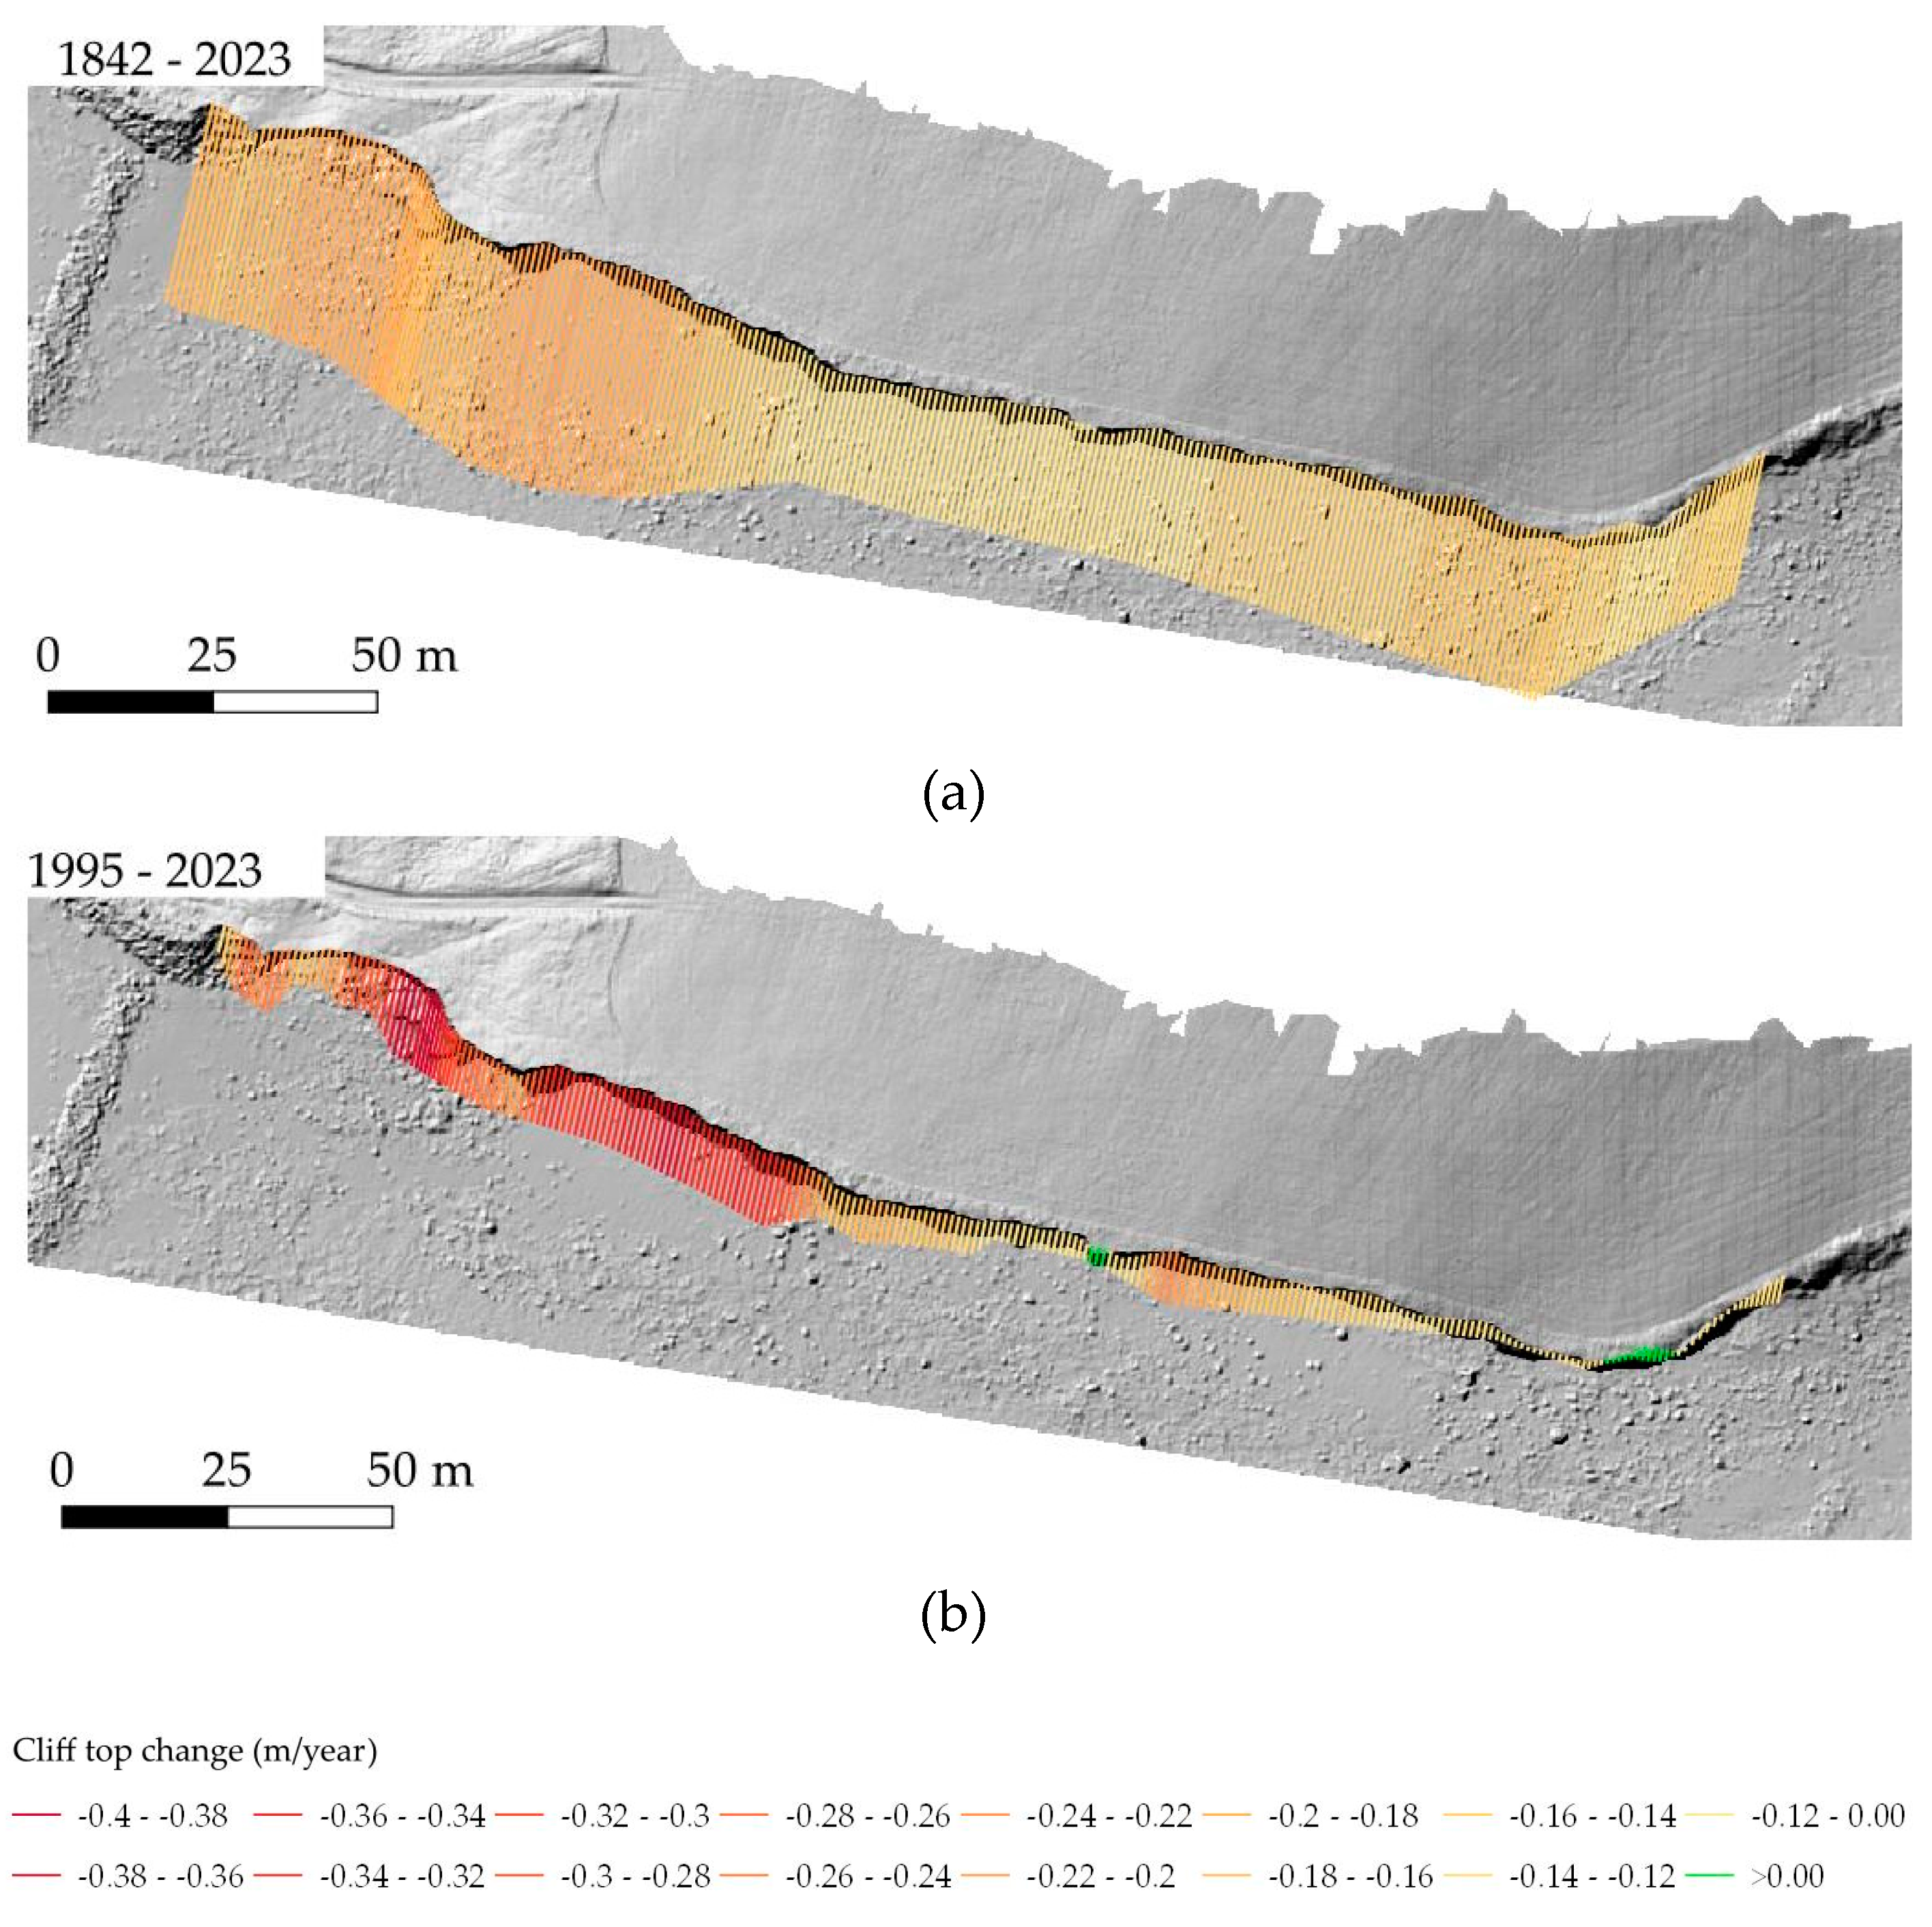
Figure 11.
Removal of the prominent talus slope between 11/01/2018 and 23/02/2023. For reference, the red arrows mark the same feature (a deformed lens of glacio-fluvial material) in both photographs.
Figure 11.
Removal of the prominent talus slope between 11/01/2018 and 23/02/2023. For reference, the red arrows mark the same feature (a deformed lens of glacio-fluvial material) in both photographs.
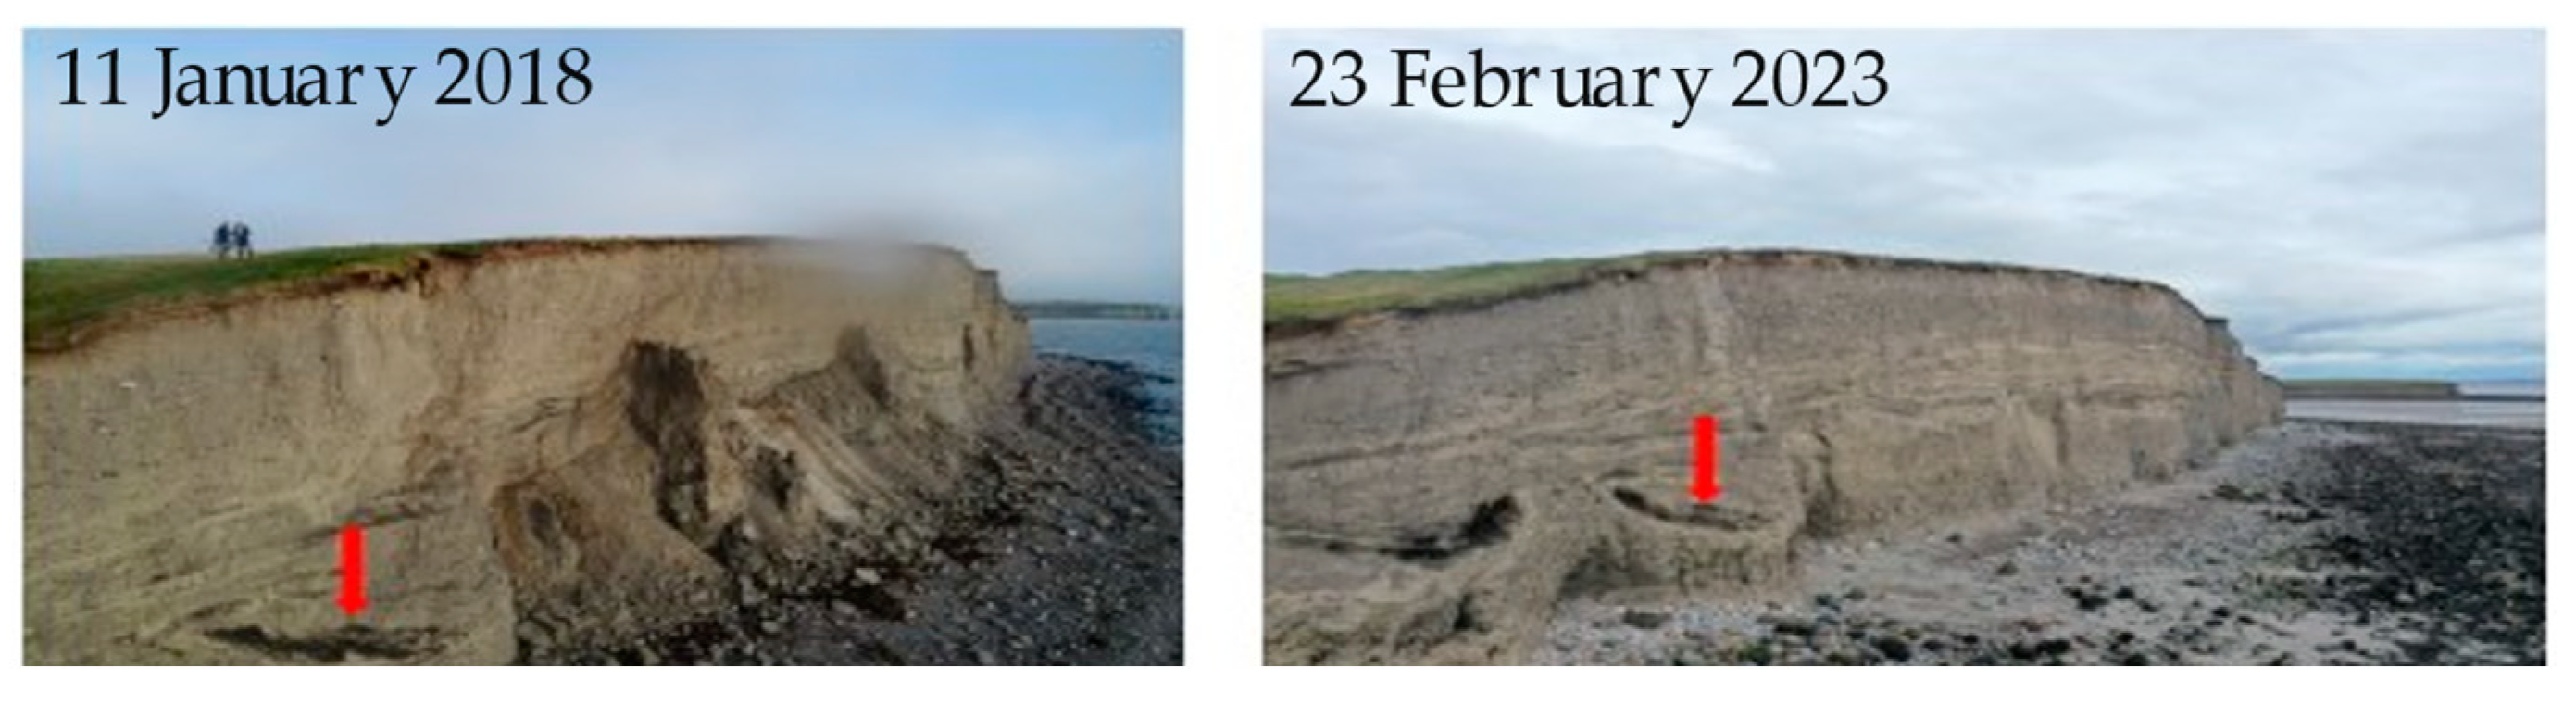
Figure 12.
Cliff retreat rates vary over time depending on the formation and erosion of a talus slope at the cliff base (pTL cliff type). Component A–B reflects the gradual growth of the talus slope, which reduces cliff erosion; component B–C represents protection of the cliff base from storm waves by talus; component C–A reflects the gradual removal of talus, resulting in the reactivation of cliff erosion and a decrease in cliff width. Figure adapted from [32].
Figure 12.
Cliff retreat rates vary over time depending on the formation and erosion of a talus slope at the cliff base (pTL cliff type). Component A–B reflects the gradual growth of the talus slope, which reduces cliff erosion; component B–C represents protection of the cliff base from storm waves by talus; component C–A reflects the gradual removal of talus, resulting in the reactivation of cliff erosion and a decrease in cliff width. Figure adapted from [32].
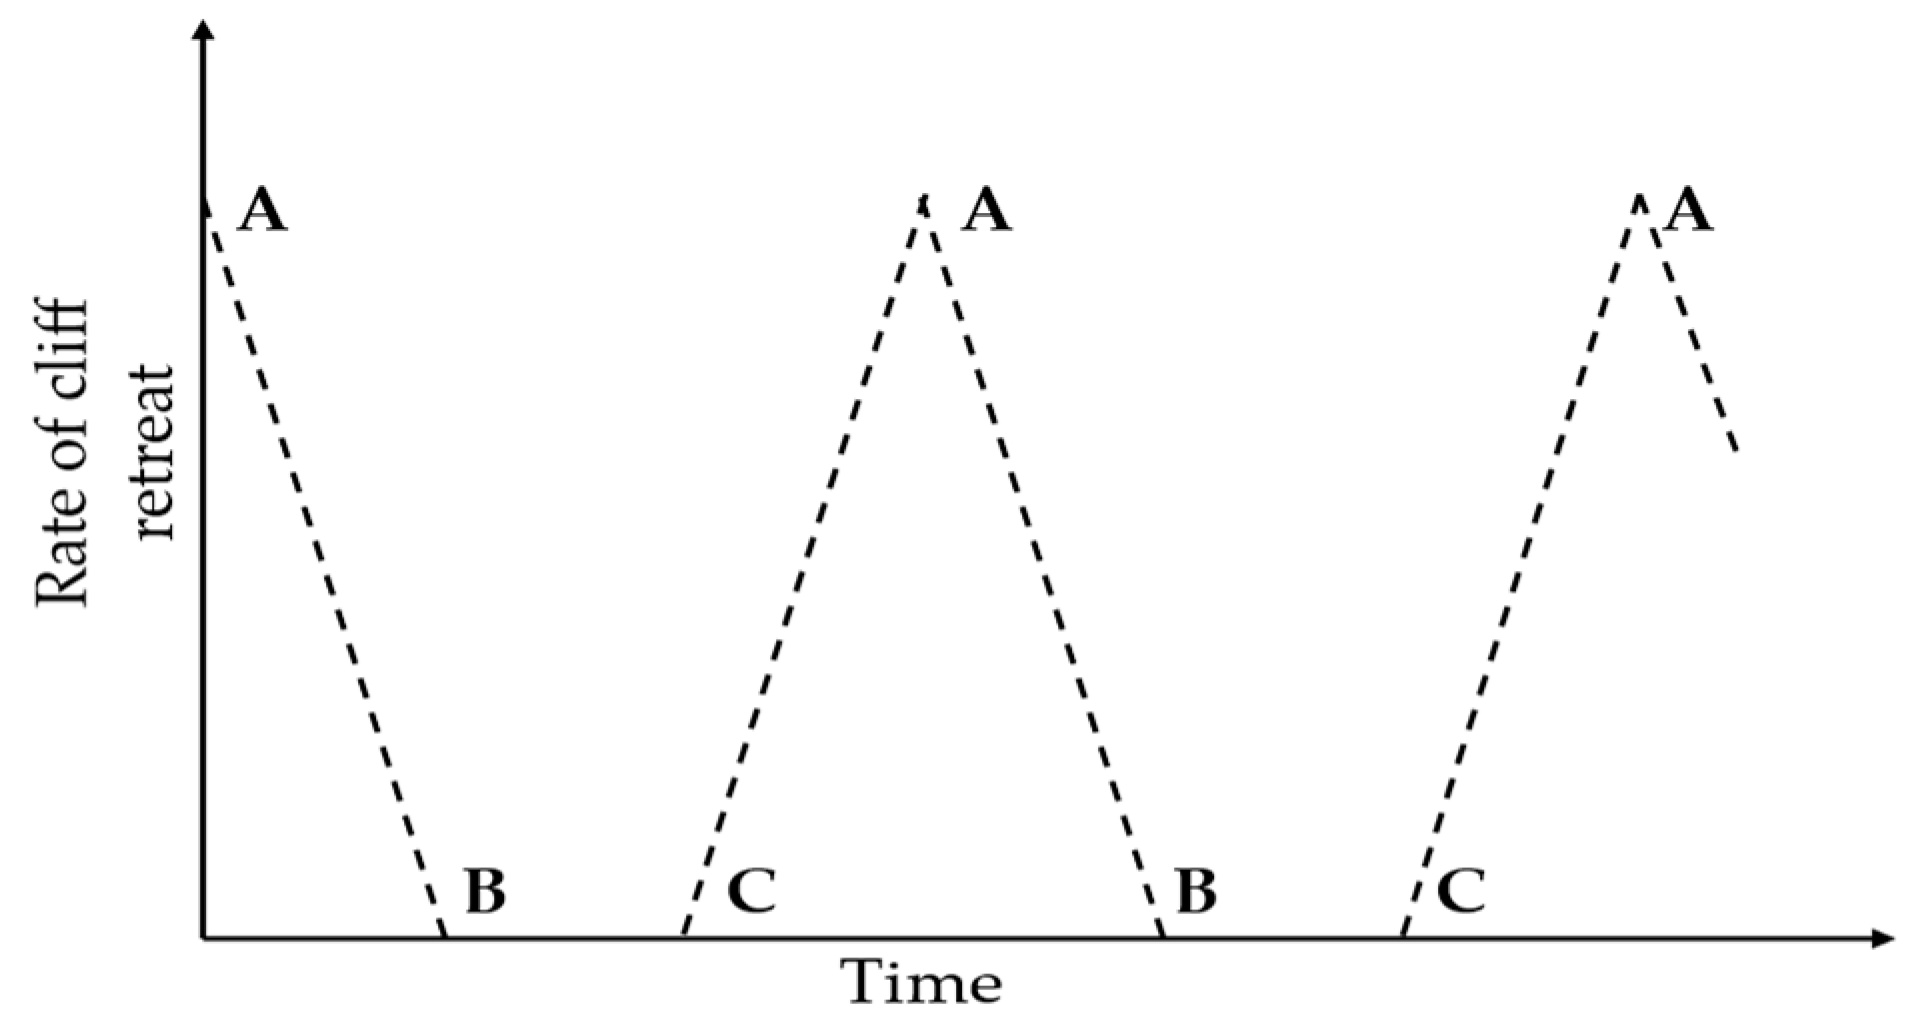
Figure 13.
Comparison of cliff top and cliff face retreat rates calculated for different studies (Table 7). In some cases, the error bars are negative values that are most likely statistical artefacts. Since all the studies investigated erodible soft rock cliffs, an advancing cliff line is implausible. In cases where multiple values for cliff face and cliff top retreat rates were reported, median values and median absolute deviations are listed.
Figure 13.
Comparison of cliff top and cliff face retreat rates calculated for different studies (Table 7). In some cases, the error bars are negative values that are most likely statistical artefacts. Since all the studies investigated erodible soft rock cliffs, an advancing cliff line is implausible. In cases where multiple values for cliff face and cliff top retreat rates were reported, median values and median absolute deviations are listed.
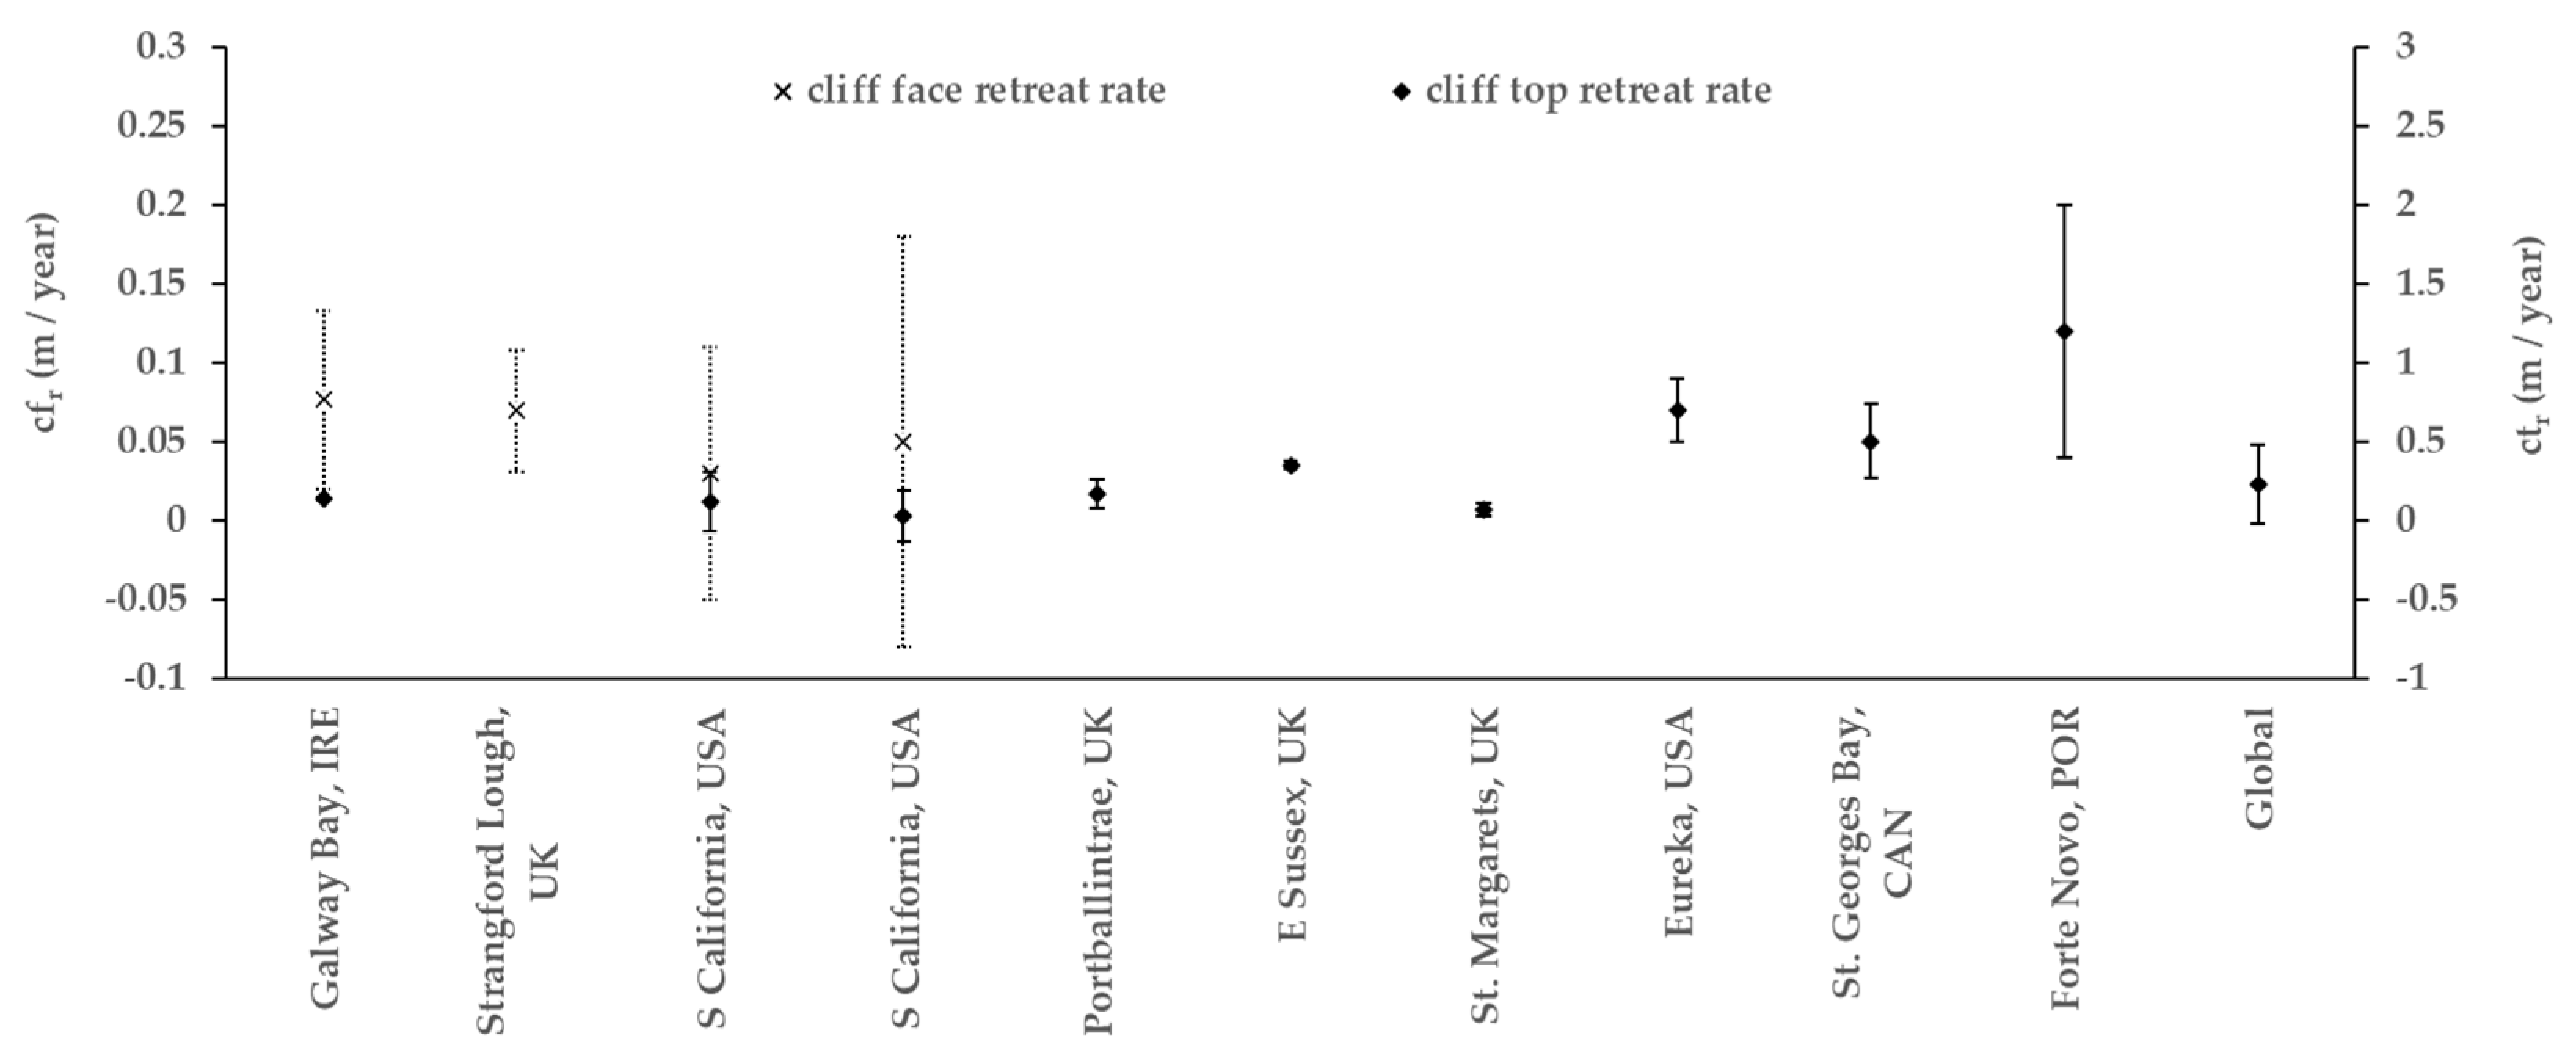
Table 1.
Summary of previous studies estimating coastal cliff retreats in Ireland and Great Britain.
Table 1.
Summary of previous studies estimating coastal cliff retreats in Ireland and Great Britain.
| Retreat rate (m/year) | 0.00 – 0.52 | 0.01 – 0.16 | 0.27 – 0.41 | 0.02 – 0.10 | 0.01 – 0.03 | 0.07 +/- 0.043 |
| Methods | Historical maps and aerial photographs | Erosion pins | Historical maps and aerial photographs | Airborne LiDAR | Cosmogenic nuclide analysis and coastal evolution modelling | Historical maps |
| Cliff length | Not reported | Not reported | 23 km | 20.459 km | Not reported | ~ 5.5 km |
| Number of cliffs | 5 | 16 | 5 | 2 | 1 | 1 |
| Study period (years) | 156 | 3 | 128 | 3 | Not reported | 122 |
| Age | Holocene | Holocene | Cretaceous | Jurassic | Carboniferous | Cretaceous |
| Cliff lithology | Till | Till | Chalk | Sandstone, mudstone |
Sandstone, mudstone |
Chalk |
| Region | Portballintrae, UK |
Strangford Lough, UK |
E Sussex, UK |
N Yorkshire, UK |
Bideford, UK |
St. Margarets, UK |
| Study | McKenna et al. 1992 | Greenwood & Orford 2008 | Dornbusch et al. 2008 | Benjamin 2018 | Shadrick et al. 2021 | Shadrick et al. 2023 |
Table 2.
Overview of the primary and secondary data sources used in this study.
| Data source | Date | Feature | UAV model | Images collected | GCPs |
|---|---|---|---|---|---|
| OSI 6”map | 1842 | Cliff top | |||
| OSI orthophoto | 1995 | Cliff top | |||
| OSI orthophoto | 2000 | Cliff top | |||
| UAV | 11/06/2019 | Cliff face | DJI Phantom 4 Pro | 118 | 6 |
| UAV | 02/10/2019 | Cliff face | DJI Phantom 4 Pro | 257 | 9 |
| UAV | 05/10/2019 | Both | DJI Phantom 4 Pro | 185 | 5 |
| UAV | 22/11/2022 | Cliff face | DJI Mavic 2 Pro | 321 | 9 |
| UAV | 21/09/2023 | Both | DJI Mavic 3M | 348 | 5 |
| UAV | 21/11/2023 | Cliff face | DJI Mavic 3M | 513 | 9 |
Table 3.
Overview of reference and comparative survey dates used in the SfM analysis.
| Time period | Reference survey date | Comparison survey date | Duration between surveys (days) |
|---|---|---|---|
| PC-change I | 11/06/2019 | 02/10/2019 | 1260 |
| PC-change II | 11/06/2019 | 05/10/2019 | 1563 |
| PC-change III | 11/06/2019 | 22/11/2022 | 1624 |
| PC-change IV | 11/06/2019 | 21/09/2023 | 113 |
| PC-change V | 11/06/2019 | 21/11/2023 | 116 |
Table 4.
Overview of DSAS analysis. For data provided by OSI, 01 January was used in lieu of the exact dates of acquisition, these being unavailable.
Table 4.
Overview of DSAS analysis. For data provided by OSI, 01 January was used in lieu of the exact dates of acquisition, these being unavailable.
| Time period | Reference date | Analysed date |
|---|---|---|
| DSAS I | 1842 | 01/01/2000 |
| DSAS II | 1842 | 05/10/2019 |
| DSAS III | 1842 | 21/09/2023 |
| DSAS IV | 1995 | 21/09/2023 |
Table 6.
Storm events between 01/2018 and 02/2020.
| # Storms | Hs Average (m) |
Hs Max (m) |
Direction ° |
Duration Average (hrs) |
|
| Winter | 21 | 3.15 | 5.44 | 322 | 95 |
| Spring | 5 | 3.06 | 5.32 | 323 | 62 |
| Summer | 0 | ||||
| Autumn | 4 | 2.89 | 4.84 | 325 | 61 |
Table 7.
Summary of previous studies used for comparison with Knocknagoneen data.
| ctr (m/year) |
0.14 +/- 0.01 | 0.12 +/- 0.19 | 0.03 +/- 0.16 | 0.17 +/- 0.09 | 0.36 +/- 0.03 | cliff top retreat rate |
0.07 +/- 0.04 | 0.70 +/- 0.20 | 0.51 +/- 0.24 | 1.20 +/- 0.80 | 0.23 +/- 0.25 | |
| cfr(m/year) | 0.08 +/- 0.01 | 0.07 +/- 0.04 | 0.03 +/- 0.08 | 0.05 +/- 0.13 | cliff face retreat rate | |||||||
| Methods | SfM and historical maps and aerial images | Erosion pins 0.5m above cliff base | Airborne LiDAR | Airborne LiDAR | historical maps and aerial photographs |
historical maps and aerial photographs |
Methods | historical maps |
Airborne LiDAR and historical maps | Historical images | Airborne LiDAR and UAV | Statistical comparison of previous studies |
| total studied cliff length |
~ 250 m | ~ 120 km | ~ 120 km | 23 km |
total studied cliff length |
~ 5.5 km |
~ 154 km | ~ 200m | ~ 400 m | |||
| Number of cliffs |
1 | 16 | 1 | 1 | 5 |
5 | Number of cliffs |
1 | 1 | 2 | 1 | 403 |
| Study period | 181 | 3 | 11.5 | 5-7 | 156 |
128 |
Study period | 122 |
70 | 58 | 0.25-0.36 | |
| Age | Holocene | Holocene | Pleistocene | Pleistocene | Holocene |
Cretaceous |
Age | Cretaceous |
Quaternary | Holocene | Pliocene - Pleistocene | |
| Cliff lithology | Till | Till | Base: consolidated mudstones-sandstones Top: weak consolidated sandstone-mudstone |
Base: consolidated mudstones-sandstones Top: weak consolidated sandstone-mudstone |
Till |
Chalk |
Cliff lithology | Chalk |
Unconsolidated Quaternary | Till | Poorly to non-consolidated red sands and sandstones | Weak rock general |
| Region | Galway Bay, IRE | Strangford Lough, UK | S California, USA | S California, USA | Portballintrae, UK |
E Sussex, UK |
Region | St. Margarets, UK |
Eureka, USA | St. Georges Bay, CAN | Forte Novo, POR | Global |
| Study | This study | Greenwood & Orford 2008 | Young 2018 | Swirad & Young 2022 | McKenna et al. 1992 |
Dronbusch et al. 2008 |
Study | Shadrick et al. 2023 |
Hapke & Reind 2007 | Utting & Gallacher 2008 | Nunes et al. 2011 | Premaillon et al. 2018 |
Disclaimer/Publisher’s Note: The statements, opinions and data contained in all publications are solely those of the individual author(s) and contributor(s) and not of MDPI and/or the editor(s). MDPI and/or the editor(s) disclaim responsibility for any injury to people or property resulting from any ideas, methods, instructions or products referred to in the content. |
© 2024 by the authors. Licensee MDPI, Basel, Switzerland. This article is an open access article distributed under the terms and conditions of the Creative Commons Attribution (CC BY) license (http://creativecommons.org/licenses/by/4.0/).
Copyright: This open access article is published under a Creative Commons CC BY 4.0 license, which permit the free download, distribution, and reuse, provided that the author and preprint are cited in any reuse.