Submitted:
02 March 2024
Posted:
05 March 2024
Read the latest preprint version here
Abstract
This paper explores the capability of various machine learning algorithms, including Random Forests and advanced gradient boosting techniques such as XGBoost, LightGBM, and CatBoost, to predict customer churn in the telecommunications sector. For this analysis, a dataset available to the public was employed. The performance of these algorithms was assessed using recognized metrics, including Accuracy, Precision, Recall, F1-score, and the Receiver Operating Characteristic Area Under Curve (ROC AUC). These metrics were evaluated at different phases: subsequent to data preprocessing and feature selection; following the application of SMOTE and ADASYN sampling methods; and after conducting hyperparameter tuning on the data that had been adjusted by SMOTE and ADASYN. The outcomes underscore the notable efficiency of upsampling techniques such as SMOTE and ADASYN in addressing the imbalance inherent in customer churn prediction. Notably, the application of random grid search for hyperparameter optimization did not significantly alter the results, which remained comparatively unchanged. The algorithms' performance post- ADASYN application marginally surpassed that observed after SMOTE application. Remarkably, LightGBM achieved an exceptional F1-score of 89% and an ROC AUC of 95% subsequent to the ADASYN sampling technique. This underlines the effectiveness of advanced boosting algorithms and upsampling methods like SMOTE and ADASYN in navigating the complexities of imbalanced datasets and intricate feature interdependencies.
Keywords:
customer churn prediction
; machine learning
; classification techniques
; SMOTE
; ADASYN
; Random Forest
; XGBoost
; LightGBM
; CatBoost
Introduction
Customer Relationship Management (CRM) represents a strategic methodology that bolsters the interactions between enterprises and their clientele. As an essential mechanism for obtaining profound comprehension of consumer behavior and requirements, CRM endeavors to nurture more substantial and impactful connections, thereby cultivating enduring and devoted customer collectives. This paradigm holds marked importance across diverse sectors, notably within banking, insurance, and telecommunications. Within the telecommunications domain—a pivotal contributor to both global revenue and socio-economic progress—companies encounter fierce rivalry. These entities diligently work to enlarge their clientele while emphasizing the retention of current patrons, mindful of the considerable expenditures linked to new customer acquisition. Hence, customer retention emerges as a pivotal factor for elevating profit margins and diminishing marketing expenditures in the telecommunication industry.
Presently, the sector is contending with the phenomenon of customer defection, or ‘churn’, which has incited a strategic pivot from the acquisition of new customers towards the retention of the existing ones. CRM databases now serve a crucial role, methodically chronicling every individual customer interaction. These repositories prove indispensable for anticipating and fulfilling customer requisites, utilizing a synergy of commercial practices and machine learning (ML) strategies. The fundamental objective of ML paradigms in this scenario is the bifurcation of customers into two distinct categories—those likely to churn and those who are not—constituting a binary classification quandary. A spectrum of ML techniques has been advocated for the foresight of churn, encompassing Decision Trees (DT), Artificial Neural Networks (ANNs), Random Forests (RF), Logistic Regression (LR), Support Vector Machines (SVM), alongside progressive gradient boosting frameworks such as XGBoost, CatBoost, and LightGBM. Within this milieu, ensemble methodologies, particularly those boosting and bagging algorithms, have been acclaimed for their proficiency in resolving classification dilemmas, with a notable focus on churn prognostication [1,2,3,4,5,6,7].
Purpose of the Study
This investigation is devoted to the pressing issue of customer attrition, colloquially termed ‘churn’, within the telecommunications industry. Churn poses a formidable challenge, compelling providers to shift their strategies towards the retention of existing customers, given the substantial expenditure involved in acquiring new subscribers. Central to this strategic pivot is the deployment of predictive systems for customer churn which stand as integral components in the orchestration of customer relationship management. Such systems are instrumental in prognosticating customer behaviors by meticulously recording every interaction on a customer-by-customer basis and employing a blend of commercial procedures and machine learning techniques to dissect and comprehend these behaviors.
The objective of this research is the formulation of efficacious tools enabling businesses to segregate customers into binary classifications: those at risk of churn and those expected to remain. The study scrutinizes an array of machine learning algorithms to construct a robust model for predicting churn. This encompasses the utilization of Random Forests and sophisticated gradient boosting methods such as XGBoost, CatBoost, and LightGBM. Notably, ensemble methodologies, especially those involving boosting and bagging algorithms, are recognized for their superior performance in addressing the binary classification intricacies associated with churn prediction.
What sets this research apart is its in-depth exploration of the impact of ensemble machine learning approaches on imbalanced datasets, particularly when augmented by oversampling techniques like SMOTE and ADASYN. The research aims to elucidate the synergy between these advanced machine learning techniques and the specific challenges presented by imbalanced datasets in the realm of churn prediction.
I. Related Wwork
The realm of churn prediction is a well-trodden area of research, with a plethora of methodologies proposed for the development of efficient churn models. The exploration of techniques such as Random Forests, XGBoost, CatBoost, and LightGBM has been prevalent across numerous analyses. The recent progress in ensemble techniques, particularly with boosting and bagging algorithms, has augmented the precision of churn prediction models considerably. Our study augments the existing body of knowledge by providing an exhaustive analysis of the confluence between ensemble machine learning techniques, hyperparameter tuning, and oversampling methods like SMOTE and ADASYN in the context of imbalanced datasets and predictive accuracy, thereby marking a distinct contribution to the literature.
Herein, we delineate a synopsis of diverse ensemble machine learning methods applied in churn prediction:
- Ensemble Learning: This paradigm amalgamates the outputs from an array of models to formulate a singular, more potent classifier. It capitalizes on the collective strength of numerous weaker models to erect a more robust and accurate predictive model. Within this framework, bagging and boosting are two principal strategies [1,2,8].
A) Bagging: This technique involves training multiple models on distinct segments of the training dataset and amalgamating their outputs through methods such as majority or average voting, as illustrated in Figure 1. An extension of Decision Trees, Random Forests, employs bagging to achieve enhanced performance over individual DTs [8,9,10,11,12,13], as depicted in Figure 2.
B) Boosting: Boosting iteratively integrates weak learners to construct a more formidable model, thereby mitigating the model’s bias, as illustrated in Figure 3. Techniques like XGBoost, LightGBM, and CatBoost fall under this category.
These methods counteract overfitting by optimizing the loss function and are adept at processing categorical data and managing datasets of considerable magnitude [8,14,15,16,17,18,19,20].
In our methodical investigation, we endeavor to shed light on the efficacy of sophisticated techniques in the domain of churn prediction, highlighting the intricate relationship between model intricacy, equilibrium in data distribution, and the quest for accuracy in prediction results.
Each of these methodologies presents distinct advantages, rendering them appropriately tailored for various facets of churn prediction within the telecommunication sector. For those desiring a more profound comprehension, reference is made to this study [21], which proffers a thorough and comparative analytical discourse relevant to this field of inquiry.
II. Method
This paper delves into the deployment of various ensemble machine learning methodologies for forecasting customer turnover in the telecommunications industry. Leveraging a dataset that is publicly available, the study explores the implementation of multiple machine learning models, including Random Forests, and advanced gradient boosting techniques such as XGBoost, LightGBM, and CatBoost.
The fundamental objective of these machine learning models is to discern and segregate customers into dichotomous categories: those likely to churn and those expected to remain, thereby addressing a binary classification challenge. Such differentiation holds paramount importance in the telecommunications realm, where the sustenance of customer loyalty is instrumental for revenue preservation and the minimization of marketing expenditures, especially in light of the substantial costs entailed in the acquisition of new patrons.
For the purpose of evaluation, the study employs standard metrics including Precision, Recall, F1-score, and the Receiver Operating Characteristic Area Under Curve (ROC AUC). These metrics collectively furnish an in-depth evaluation of the models’ efficacy, particularly in their precision and capacity to accurately classify individuals into the churn or non-churn segments.
The contribution of this research to the academic domain is significant, providing an exhaustive exploration of the impact of diverse ensemble machine learning techniques upon imbalanced datasets and their subsequent effect on predictive precision. The study aims to equip subscription-based enterprises with efficacious predictive instruments for customer churn, a critical component in today’s data-driven commercial landscape.
A. Training and Validation Process
The research utilizes k-fold cross-validation to assess the performance of classifiers, acknowledging, however, that this approach may encounter challenges when applied to datasets with imbalanced class distributions. Specifically, certain folds might not contain sufficient instances of the minority class, potentially skewing evaluation outcomes. To mitigate this issue, stratified sampling is implemented during the process of train-test splitting or within the framework of k-fold cross-validation. This technique guarantees a proportional representation of minority class samples in each partition, thereby ensuring a more balanced and accurate assessment.
Moreover, the paper underscores the criticality of addressing data imbalance through methods such as up-sampling after the division of the dataset. This step is crucial to prevent data leakage, a phenomenon that could artificially inflate the perceived efficacy of the predictive models. By adhering to this precaution, the study aims to present a more reliable evaluation of model performance, avoiding the pitfalls associated with overfitting to the training data. This comprehensive approach to handling imbalanced datasets not only enhances the integrity of the research findings but also contributes valuable insights into effective strategies for data preprocessing in machine learning endeavors.
B. Evaluation Metrics
The research incorporates a diverse array of metrics to scrutinize the efficacy of machine learning models, emphasizing the reduction of error rates and the quantification of inaccurately predicted values. Given the inherent limitations of standard accuracy metrics, particularly their tendency to disproportionately reflect the majority class in imbalanced datasets, alternative evaluation methods are necessitated. Consequently, precision, recall, and the F1-score, all of which are extrapolated from the confusion matrix, emerge as superior metrics for appraising the performance of machine learning models concerning minority classes. The F1-score, which amalgamates precision and recall in a harmonic mean, offers a comprehensive and balanced evaluation of a model’s aggregate performance, encapsulating both the model’s capacity to identify true positives and its precision in doing so. This nuanced approach to model assessment ensures a more accurate and equitable evaluation, crucial for applications involving imbalanced data distributions.
In Table 1, the abbreviations utilized are as follows: TP for True Positive, indicating cases correctly identified as positive; FP for False Positive, referring to negative cases incorrectly labeled as positive; FN for False Negative, representing positive cases wrongly categorized as negative; and TN for True Negative, denoting cases accurately recognized as negative. The evaluation metrics of Precision, Recall, Accuracy, and F1-score are calculated based on these outcomes using the respective formulas:
- Precision (also known as Positive Predictive Value) quantifies the accuracy of positive predictions. It is calculated asessentially the ratio of correctly predicted positive observations to the total predicted positives.
- Recall (or Sensitivity) measures the model’s ability to correctly identify all positive cases. It is defined asrepresenting the fraction of true positives detected over all actual positives.
- Accuracy assesses the overall correctness of the model, computed aswhich is the proportion of true results (both true positives and true negatives) among the total number of cases examined.
- F1-score provides a balance between Precision and Recall, serving as a harmonic mean of the two metrics. It is calculated aswhich combines the precision and recall of a model into a single metric by taking their harmonic mean, thereby offering a measure of the model’s accuracy in cases where an equal importance is placed on precision and recall.

Table 1.
The confusion matrix.
| Predicted Class | |||
|---|---|---|---|
| Churners | Non-churners | ||
| Actual Class | Churners | TP | FN |
| Non-churners | FP | TN | |
Additionally, the Receiver Operating Characteristic (ROC) Curve is utilized for model evaluation purposes. This graphical representation plots the True Positive Rate (TPR) against the False Positive Rate (FPR) at various decision threshold levels, as illustrated in Figure 4. The Area Under the ROC Curve (AUC) provides a singular metric to gauge the efficacy of a model, summarizing its ability to distinguish between the classes across all thresholds.
However, in the context of significantly imbalanced datasets, the Precision–Recall (PR) curve is often deemed more suitable. This is because the PR curve specifically emphasizes the model’s performance regarding the minority class by plotting Precision against Recall, offering a more nuanced view of the model’s capability to correctly predict positive instances amidst a large number of negatives.
Despite this, given that the dataset under investigation in this research does not demonstrate an excessively high level of imbalance, the utilization of the PR AUC (Area Under the Precision-Recall Curve) for evaluation purposes may not be strictly necessary. The ROC AUC remains a valuable and informative metric for assessing model performance within the scope of this study, providing a broad overview of model effectiveness in distinguishing between classes.
These metrics collectively offer a comprehensive evaluation of a machine learning model’s performance, particularly in scenarios with imbalanced class distributions, where traditional accuracy alone may not provide a complete picture.
C. The Challenge of Imbalanced Data
In environments characterized by imbalanced datasets, model performance indicators can be disproportionately influenced by the dominant class, overshadowing the intricate dynamics of specific algorithms in response to this imbalance. This disproportion often results in an obscured representation of the minority class and the challenges associated with predicting it accurately.
Addressing these inherent biases in algorithms necessitates an approach that transcends traditional accuracy metrics. Strategies that intentionally recalibrate the distribution of classes, such as specialized sampling techniques, become instrumental in mitigating these biases. These methods ensure that the performance of algorithms is not superficially adequate but deeply attuned to accurately recognizing and predicting instances of the minority class.
In this context, ensemble techniques like Random Forest and advanced gradient boosting methods, including XGBoost, CatBoost, and LightGBM, provide valuable insights and capabilities. Random Forest, by leveraging a multitude of decision trees and aggregating their results, naturally accommodates class imbalances by offering each tree a balanced perspective through its bootstrap sample. Similarly, gradient boosting algorithms like XGBoost, CatBoost, and LightGBM are intrinsically designed to progressively focus on challenging instances, especially those that are frequently misclassified, gradually enhancing the model’s aptitude for predicting minority class instances. Coupled with judiciously chosen sampling methods like SMOTE or ADASYN, these sophisticated techniques can significantly improve the model’s ability to discern and predict the underrepresented class, fostering a more balanced and insightful understanding of the data.
D. Sampling Techniques
The presence of imbalanced datasets often culminates in the development of classifiers biased towards the majority class, exhibiting elevated accuracy rates for the non-churned segment while failing to accurately predict churned customers. To mitigate such discrepancies, an array of sampling methodologies has been introduced, aimed at modifying the class distribution to forge a more balanced dataset. Broadly categorized, these sampling techniques fall into undersampling, which involves the elimination of instances from the majority class, and oversampling, which entails the augmentation of instances within the minority class [22]. The objective behind these approaches is to recalibrate the class distribution, thereby enhancing the classifier’s ability to deliver more equitable and informed predictions.
- Synthetic Minority Over-Sampling Technique (SMOTE)
The Synthetic Minority Over-Sampling Technique (SMOTE) [23] represents an advanced form of oversampling designed to rectify data imbalance by generating synthetic instances of the minority class. Distinguished from elementary replication techniques, SMOTE employs an interpolation strategy to create synthetic samples by interpolating between existing minority instances. This method of augmentation not only improves the representation of the minority class but also contributes to a richer and more varied decision-making landscape. The provision of a diversified decision space is particularly advantageous for models such as Support Vector Machines (SVMs), which depend critically on the distribution of data points for their predictive accuracy.
- Adaptive Synthetic Sampling Approach (ADASYN)
The Adaptive Synthetic Sampling Approach (ADASYN) is a sophisticated oversampling technique devised to tackle the challenges posed by imbalanced datasets, particularly enhancing the predictive performance regarding the minority class. Introduced by He et al., ADASYN focuses on generating synthetic samples adjacent to the boundary regions where the minority class instances are under-represented [24]. Unlike its predecessor, the Synthetic Minority Over-sampling Technique (SMOTE), ADASYN dynamically adjusts the number of synthetic samples for each minority instance based on the degree of difficulty in learning, with more synthetic instances generated for those harder to learn. This method ensures a more nuanced and adaptive approach to rectifying class imbalance, aiming to provide a balanced dataset that allows machine learning models to achieve better generalization. By effectively addressing the skewed distribution, ADASYN aids in mitigating the bias towards the majority class, thereby fostering an improved classification performance across various models, including neural networks, decision trees, and support vector machines [24]. This adaptive oversampling method is particularly valued for its ability to enhance the decision boundary’s diversity, making it a critical tool in the repertoire for dealing with imbalanced data in predictive modeling.
E. Hyperparameters Tuning
The optimization of hyperparameters is pivotal in enhancing the performance of machine learning algorithms. Initially configured with default settings, the careful tuning of these hyperparameters to suit specific datasets significantly improves their operational efficiency. In this context, Random Grid Search within PyCaret serves as a key technique for hyperparameter optimization. Unlike sophisticated methods such as the Bayesian optimization approach used by Optuna [25], Random Grid Search simplifies the process by randomly selecting combinations of hyperparameters from a predefined grid. This approach, while less advanced than methods employing Tree-Structured Parzen Estimator (TPE) [26,27] for sampling, provides a straightforward and effective means of exploring the hyperparameter space without the computational complexity associated with more nuanced optimization frameworks.
Random Grid Search operates under the principle of randomness, which, contrary to the targeted sampling strategies like Covariance Matrix Adaptation (CMA) [28] and Gaussian Processes (GPs) [27] utilized by Optuna, treats each hyperparameter combination independently without prior consideration of their performance. This method’s strength lies in its ability to cover a broad range of the hyperparameter space, offering a practical balance between computational efficiency and the likelihood of identifying near-optimal configurations.
In our current study, we employ Random Grid Search via PyCaret with a specific focus on optimizing the Area Under the Curve metric for several esteemed machine learning models, including Random Forest, CatBoost, XGBoost, and LightGBM. By adopting Random Grid Search, we aim to mitigate overfitting and enhance the models’ ability to generalize, thereby improving overall model performance. The role of hyperparameters remains critical in this process, dictating the extent to which these algorithms can effectively engage with the dataset, albeit through a less computationally intensive approach compared to the Optuna framework.
III. Results
This section explores the framework and outcomes of simulations designed to scrutinize a range of classification methodologies for predictiong customer churn. The exposition is organized into two subsections: Simulation Framework and Outcomes of Simulations.
A. Simulation Framework
The principal objective of this investigation is to examine the efficacy of various classification strategies, notably Random Forest, XGBoost, LightGBM, and CatBoost, in the context of customer churn prediction. These analyses were executed utilizing the Python programming environment, alongside integral libraries such as Pandas, NumPy, and Scikit-learn. A dataset sourced from Kaggle [29], comprising 20 variables across 4250 training and 750 test instances, served as the basis for these simulations. This dataset delineates a churn rate of 14.1% against an active subscriber engagement of 85.9%. Prior to model evaluation, preliminary data processing tasks were undertaken, including the management of categorical attributes, refinement of features, and exclusion of outliers. Subsequently, the models were appraised on metrics including Accuracy, Precision, Recall, F1-score, and ROC AUC.
B. Outcomes of Simulations
The investigation’s evaluation of machine learning algorithms, utilizing the test dataset as a foundation for assessing performance on previously unseen data, focused on key metrics including Accuracy, Precision, Recall, F1-score, and ROC AUC. The measurement of these metrics was conducted at various stages: initial step, post-data preprocessing and feature selection; subsequently, sampling step, following the application of SMOTE and ADASYN sampling techniques; and finally, tuning step, after the implementation of hyperparameter optimization on the data modified by SMOTE and ADASYN.
- Initial Step: Following the execution of data preprocessing and feature delineation, the results were methodically aggregated into a tabular format. This compilation underscored the superior performance exhibited by the boosting algorithms, particularly in relation to the F1-score and ROC AUC metrics, as delineated in Table 2. Key findings are highlighted in bold for enhanced clarity. Among the models evaluated, CatBoost distinguished itself as a top performer, securing an impressive F1-score of 63% and an ROC AUC of 85%.
Additionally, the ROC curves for these models, following pre-processing and feature selection, are depicted in Figure 5, showcasing the comparative efficacy across the various algorithms.
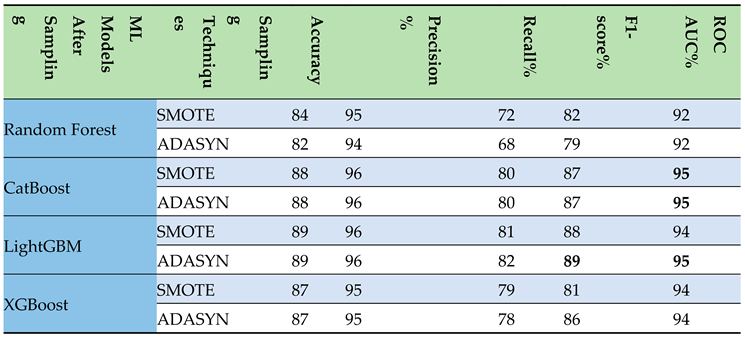
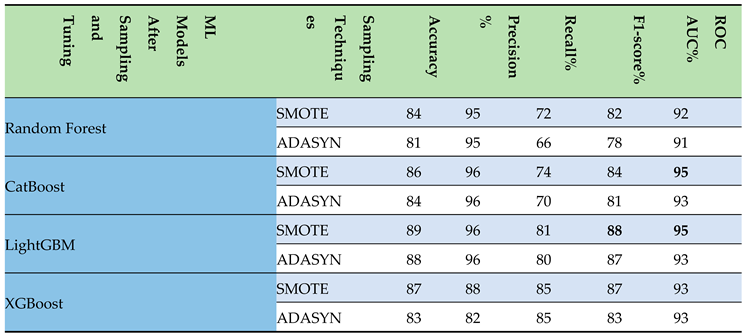
- Sampling Step: Subsequent to the implementation of data sampling techniques such as SMOTE and ADASYN, the outcomes were systematically organized into a table. This structured presentation highlighted the enhanced efficacy of the CatBoost and LightGBM models, particularly with respect to the F1-score and ROC AUC metrics, as detailed in Table 3. Key findings are highlighted in bold for improved readability. Among these, LightGBM distinguished itself, attaining an impressive F1-score of 89% and an ROC AUC of 95% after applying ADASYN.
Figure 5.
The ROC AUC of the ML models after initial step.
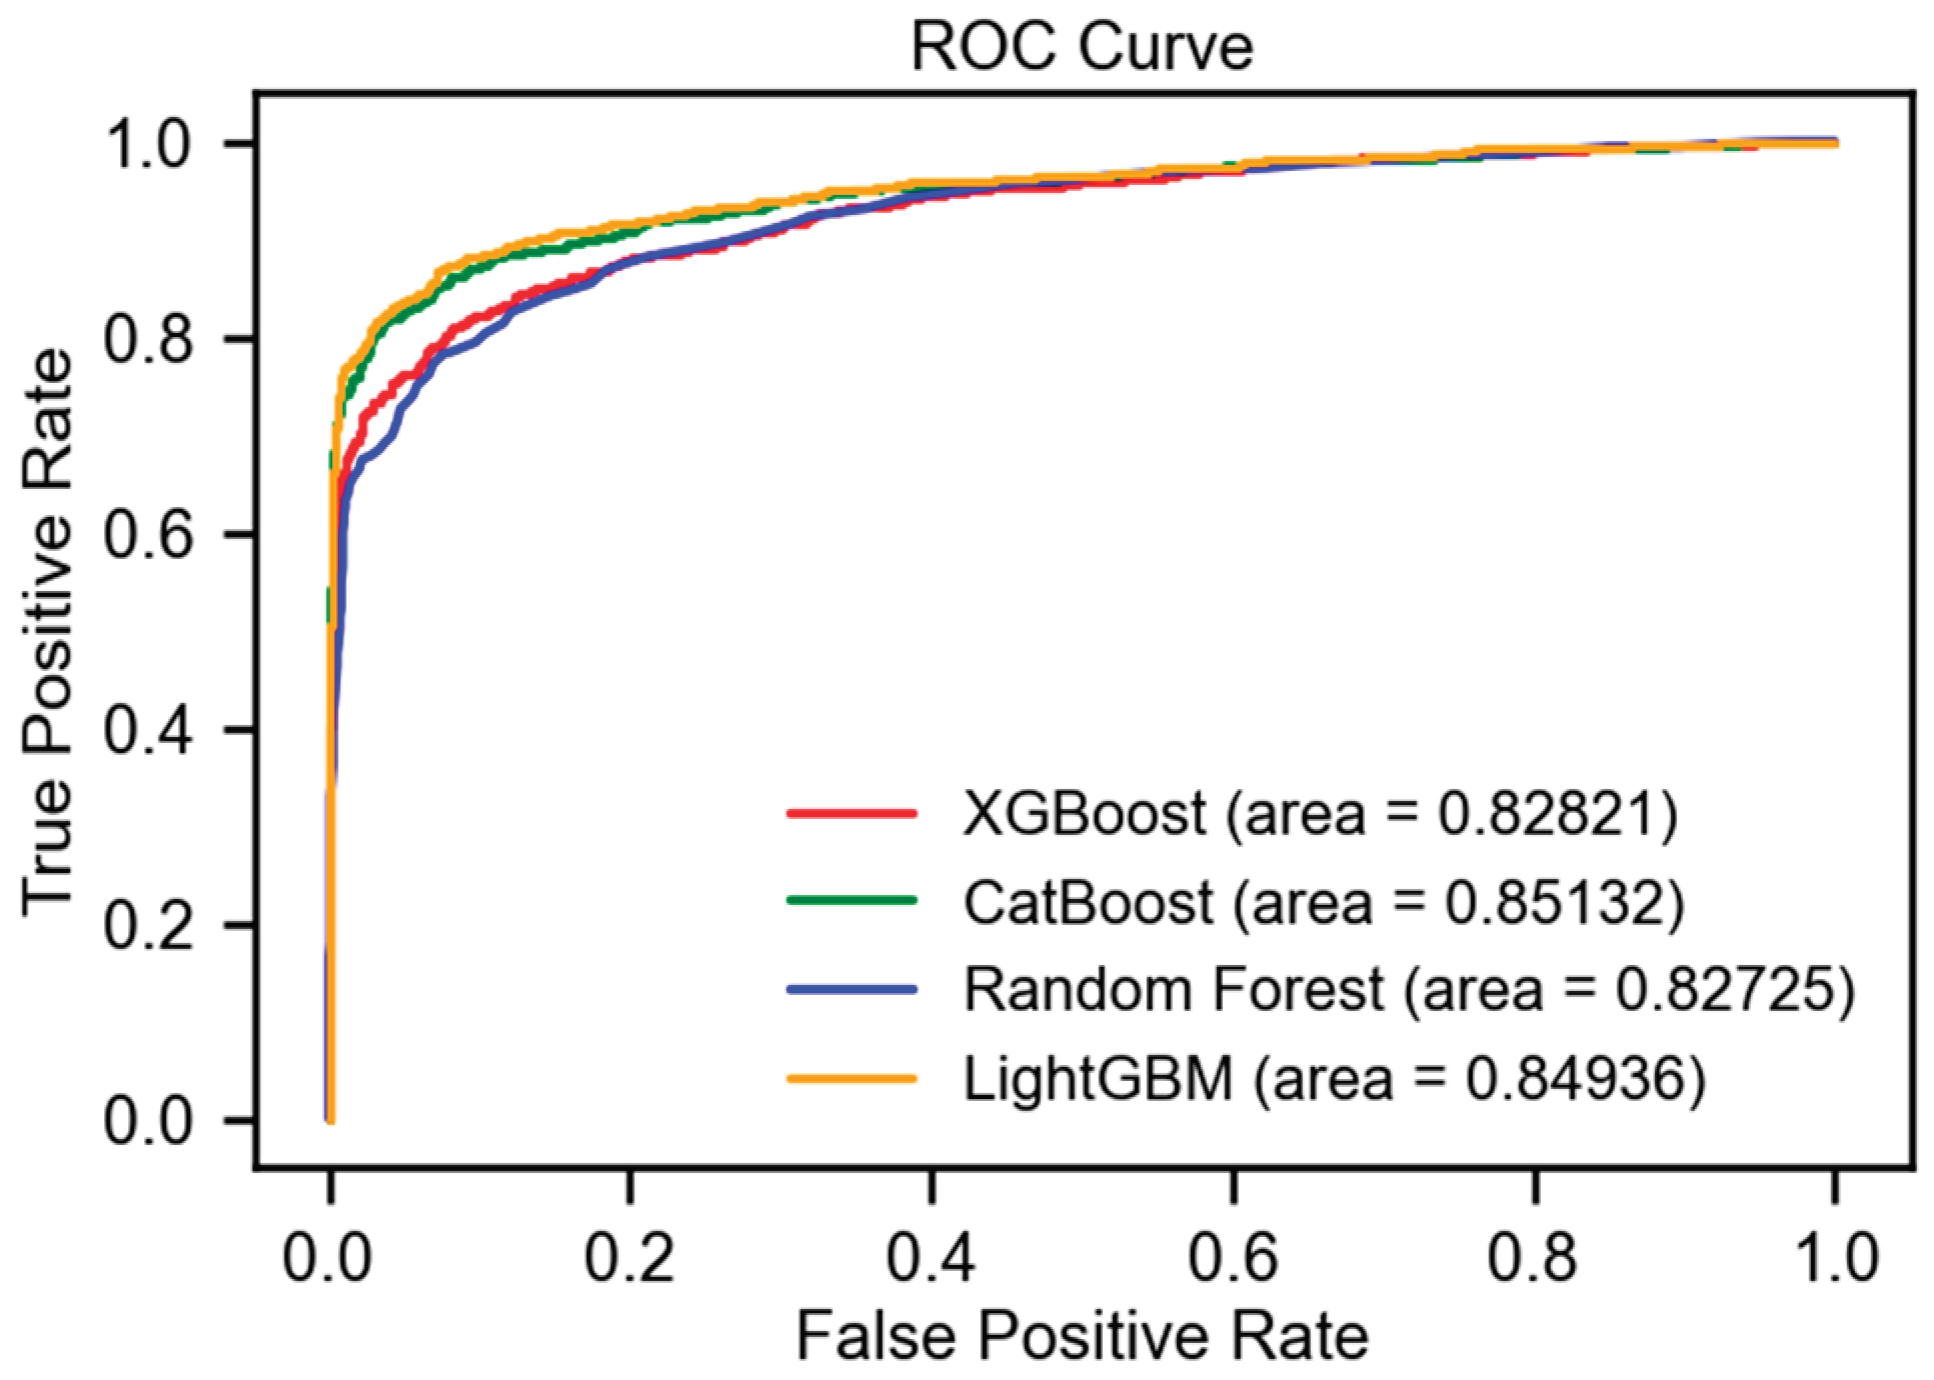
Table 2.
Evaluation scores of the ml models after initial step.
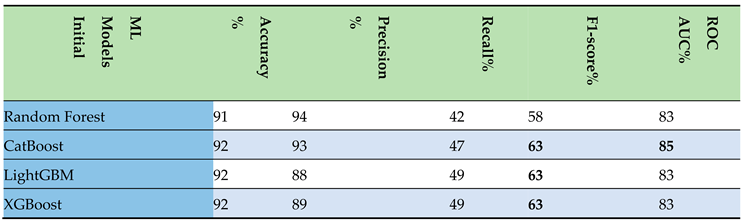 |
Table 3.
Evaluation scores of the ml models after applying upsampling techniques.
 |
Furthermore, the ROC curves for these models, post-application of sampling techniques, are depicted in Figure 6, showcasing the relative performance across different algorithms.
- Tuning Step: Following the hyperparameter tuning of models on upsampled data, the results were meticulously organized in a tabular format. This arrangement illuminated the superior performance of the CatBoost and LightGBM models, especially in terms of the F1-score and ROC AUC metrics, as presented in Table 4. Key findings are highlighted in bold to enhance legibility. Notably, LightGBM achieved a commendable F1-score of 88% and an ROC AUC of 95%, figures that remained consistent with its performance prior to the implementation of hyperparameter tuning.
Additionally, the ROC curves of these models, following the application of sampling techniques, are exhibited in Figure 7, illustrating the comparative efficacy among various algorithms.
In summary, this section accentuates the efficacy of diverse machine learning algorithms in predicting customer churn, specifically underscoring the formidable performance of boosting models such as LightGBM in managing the dataset under consideration.
IV. Conclusions and Future Work
This paper meticulously explored the effectiveness of several machine learning algorithms, including Random Forests, XGBoost, LightGBM, and CatBoost, in the realm of customer churn prediction within the telecommunications sector. Utilizing a publicly accessible dataset, the study embarked on a comprehensive analysis, deploying a variety of established evaluation metrics such as Accuracy, Precision, Recall, F1-score, ROC AUC. These metrics were assessed at pivotal stages, including after initial data preprocessing and feature selection, following the application of SMOTE and ADASYN sampling methods, and subsequent to the implementation of hyperparameter tuning on the data refined by these sampling techniques.
The insights garnered from this research underscore the significant impact of SMOTE and ADASYN upsampling techniques in mitigating the challenges associated with imbalanced datasets prevalent in churn prediction. While the application of random grid search for hyperparameter tuning did not markedly enhance the results, the study revealed a slight superiority in model performance post-ADASYN application compared to SMOTE, with LightGBM emerging as particularly noteworthy. LightGBM’s impressive performance, achieving an F1-score of 88% and an ROC AUC of 95% after ADASYN application, highlights the potent capability of advanced boosting algorithms in navigating the intricate landscape of imbalanced datasets and feature interrelations.
Building upon the findings of this study, future research can extend in several precise directions to enhance the understanding and effectiveness of machine learning models in churn prediction. Specific areas for further exploration include:
- Advanced Sampling Techniques: Beyond SMOTE and ADASYN, future investigations could evaluate the efficacy of more recent upsampling methods such as Borderline-SMOTE, SVMSMOTE, and K-Means SMOTE. These techniques offer nuanced approaches to balancing datasets by focusing on the samples near the decision boundary, leveraging support vector machines, or employing clustering methods to generate synthetic samples, respectively.
- Integration of Novel Hyperparameter Optimization Algorithms: While this study utilized random grid search, subsequent research could delve into the application of cutting-edge optimization techniques. Bayesian optimization, Genetic Algorithms, and Particle Swarm Optimization (PSO) are notable for their potential to efficiently navigate the hyperparameter space with the aim of uncovering optimal model configurations.
- Exploration of Emerging Machine Learning Models: The rapid advancements in artificial intelligence herald the introduction of new and innovative models. Research can expand to include the evaluation of models such as Deep Learning architectures (e.g., Convolutional Neural Networks for tabular data and Recurrent Neural Networks for sequence prediction), Graph Neural Networks (GNNs) for relational data, and Transformer models adapted for time series forecasting. These models could offer superior performance in capturing complex patterns and relationships in customer data.
By addressing these specific areas, future research can significantly contribute to both the theoretical understanding and practical application of machine learning in churn prediction, ensuring that models remain effective, adaptable, and aligned with the latest developments in artificial intelligence and data science.
References
- K. Alok and J. Mayank, Ensemble Learning for AI Developers. Berkeley, CA, USA: BApress, 2020.
- M. Van Wezel and R. Potharst, “Improved customer choice predictions using ensemble methods,” Eur. J. Oper. Res., vol. 181, pp. 436-452, 2007. [CrossRef]
- Ullah, B. Raza, A.K. Malik, M. Imran, S.U. Islam, and S.W. Kim, “A Churn Prediction Model Using Random Forest: Analysis of Machine Learning Techniques for Churn Prediction and Factor Identification in Telecom Sector,” IEEE Access, vol. 7, pp. 60134-60149, 2019. [CrossRef]
- P. Lalwani, M.K. Mishra, J.S. Chadha, and P. Sethi, “Customer churn prediction system: A machine learning approach,” Computing, vol. 104, pp. 271-294, 2021. [CrossRef]
- N. Mazhari, M. Imani, M. Joudaki, and A. Ghelichpour, “An overview of classification and its algorithms,” in Proceedings of the 3rd Data Mining Conference (IDMC’09), Tehran, Iran, Dec. 15-16, 2009.
- M. Ahmed, H. Afzal, I. Siddiqi, M.F. Amjad, and K. Khurshid, “Exploring nested ensemble learners using overproduction and choose approach for churn prediction in telecom industry,” Neural Comput. Appl., vol. 32, pp. 3237-3251, 2018. [CrossRef]
- M. Joudaki, M. Imani, M. Esmaeili, M. Mahmoodi, and N. Mazhari, “Presenting a New Approach for Predicting and Preventing Active/Deliberate Customer Churn in Telecommunication Industry,” in Proceedings of the International Conference on Security and Management (SAM), 2011.
- I.H. Witten, E. Frank, and M.A. Hall, Data Mining: Practical Machine Learning Tools and Techniques. San Francisco, CA, USA: Elsevier Science & Technology, 2016.
- T.K. Ho, “Random decision forests,” in Proceedings of the 3rd International Conference on Document Analysis and Recognition, Montreal, QC, Canada, vol. 1, Aug. 14-16, 1995.
- L. Breiman, “Random forests,” Mach. Learn., vol. 45, pp. 5-32, 2001. [CrossRef]
- J. Karlberg and M. Axen, Binary Classification for Predicting Customer Churn. Umeå, Sweden: Umeå University, 2020.
- D. Windridge and R. Nagarajan, “Quantum Bootstrap Aggregation,” in Proceedings of the International Symposium on Quantum Interaction, San Francisco, CA, USA, Jul. 20-22, 2016.
- J.C. Wang and T. Hastie, “Boosted Varying-Coefficient Regression Models for Product Demand Prediction,” J. Comput. Graph. Stat., vol. 23, pp. 361-382, 2014. [CrossRef]
- E. Al Daoud, “Intrusion Detection Using a New Particle Swarm Method and Support Vector Machines,” World Acad. Sci. Eng. Technol., vol. 77, pp. 59-62, 2013.
- E. Al Daoud and H. Turabieh, “New empirical nonparametric kernels for support vector machine classification,” Appl. Soft Comput., vol. 13, pp. 1759-1765, 2013. [CrossRef]
- E. Al Daoud, “An Efficient Algorithm for Finding a Fuzzy Rough Set Reduct Using an Improved Harmony Search,” Int. J. Mod. Educ. Comput. Sci. (IJMECS), vol. 7, pp. 16-23, 2015. [CrossRef]
- Y. Zhang and A. Haghani, “A gradient boosting method to improve travel time prediction,” Transp. Res. Part C Emerg. Technol., vol. 58, pp. 308-324, 2015. [CrossRef]
- Dorogush, V. Ershov, and A. Gulin, “CatBoost: Gradient boosting with categorical features support,” in Proceedings of the Thirty-first Conference on Neural Information Processing Systems, Long Beach, CA, USA, Dec. 4-9, 2017.
- G. Ke, Q. Meng, T. Finley, T. Wang, W. Chen, W. Ma, Q. Ye, and T.Y. Liu, “Lightgbm: A highly efficient gradient boosting decision tree,” in Advances in Neural Information Processing Systems, vol. 30, 2017.
- Klein, S. Falkner, S. Bartels, P. Hennig, and F. Hutter, “Fast Bayesian optimization of machine learning hyperparameters on large datasets,” in Proceedings of the Machine Learning Research PMLR, Sydney, NSW, Australia, Aug. 6-11, 2017.
- M. Imani and H.R. Arabnia, “Hyperparameter Optimization and Combined Data Sampling Techniques in Machine Learning for Customer Churn Prediction: A Comparative Analysis,” Technologies, vol. 11, no. 6, 167, 2023. [CrossRef]
- M. Kubat and S. Matwin, “Addressing the curse of imbalanced training sets: one-sided selection,” in Proceedings of the International Conference on Machine Learning (ICML), vol. 97, no. 1, 1997.
- N.V. Chawla, K.W. Bowyer, L.O. Hall, and W.P. Kegelmeyer, “SMOTE: synthetic minority over-sampling technique,” Journal of Artificial Intelligence Research, vol. 16, pp. 321-357, 2002. [CrossRef]
- H. He, Y. Bai, E.A. Garcia, and S. Li, “ADASYN: Adaptive synthetic sampling approach for imbalanced learning,” in 2008 IEEE International Joint Conference on Neural Networks (IEEE World Congress on Computational Intelligence), pp. 1322-1328, Jun. 2008.
- T. Akiba, S. Sano, T. Yanase, T. Ohta, and M. Koyama, “Optuna: A next-generation hyperparameter optimization framework,” in Proceedings of the 25th ACM SIGKDD International Conference on Knowledge Discovery & Data Mining, pp. 2623-2631, Jul. 2019.
- J. Bergstra, D. Yamins, and D. Cox, “Making a science of model search: Hyperparameter optimization in hundreds of dimensions for vision architectures,” in International Conference on Machine Learning, PMLR, 2013.
- J. Bergstra, R. Bardenet, Y. Bengio, and B. Kégl, “Algorithms for hyper-parameter optimization,” in Advances in Neural Information Processing Systems, vol. 24, 2011.
- N. Hansen and A. Ostermeier, “Completely derandomized self-adaptation in evolution strategies,” Evolutionary Computation, vol. 9, no. 2, pp. 159-195, 2001. [CrossRef]
- R. Christy, “Customer Churn Prediction 2020, Version 1,” 2020. [Online]. Available online: https://www.kaggle.com/code/rinichristy/customer-churn-prediction-2020 (accessed on 20 January 2022).
Figure 1.
The bagging techniques approach.
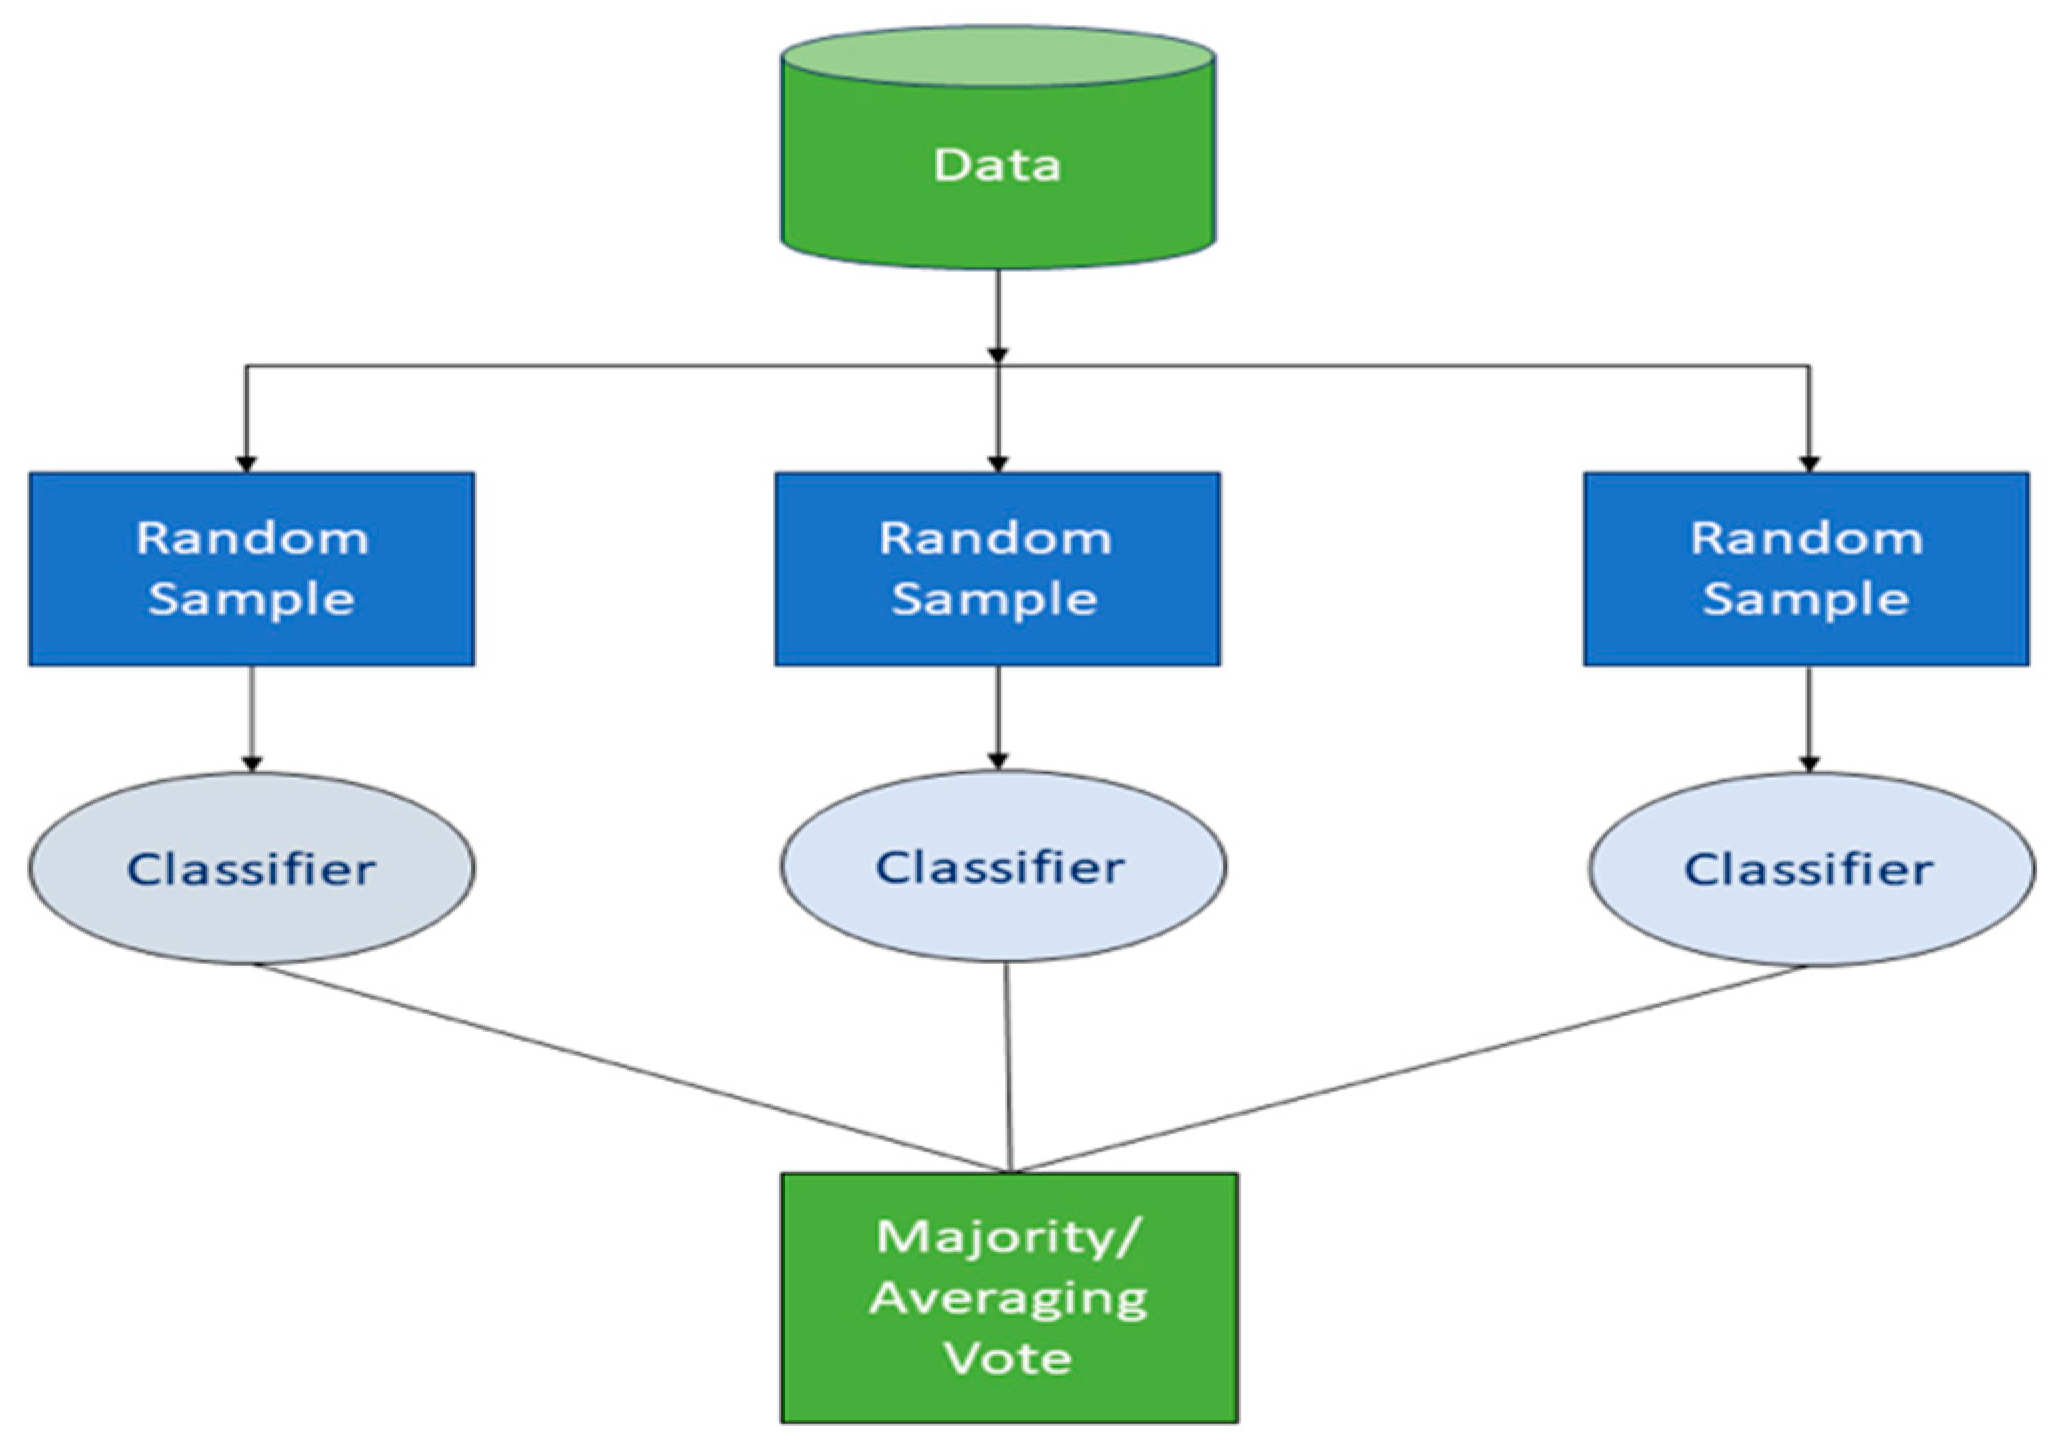
Figure 2.
The Random Forest classifier approach.
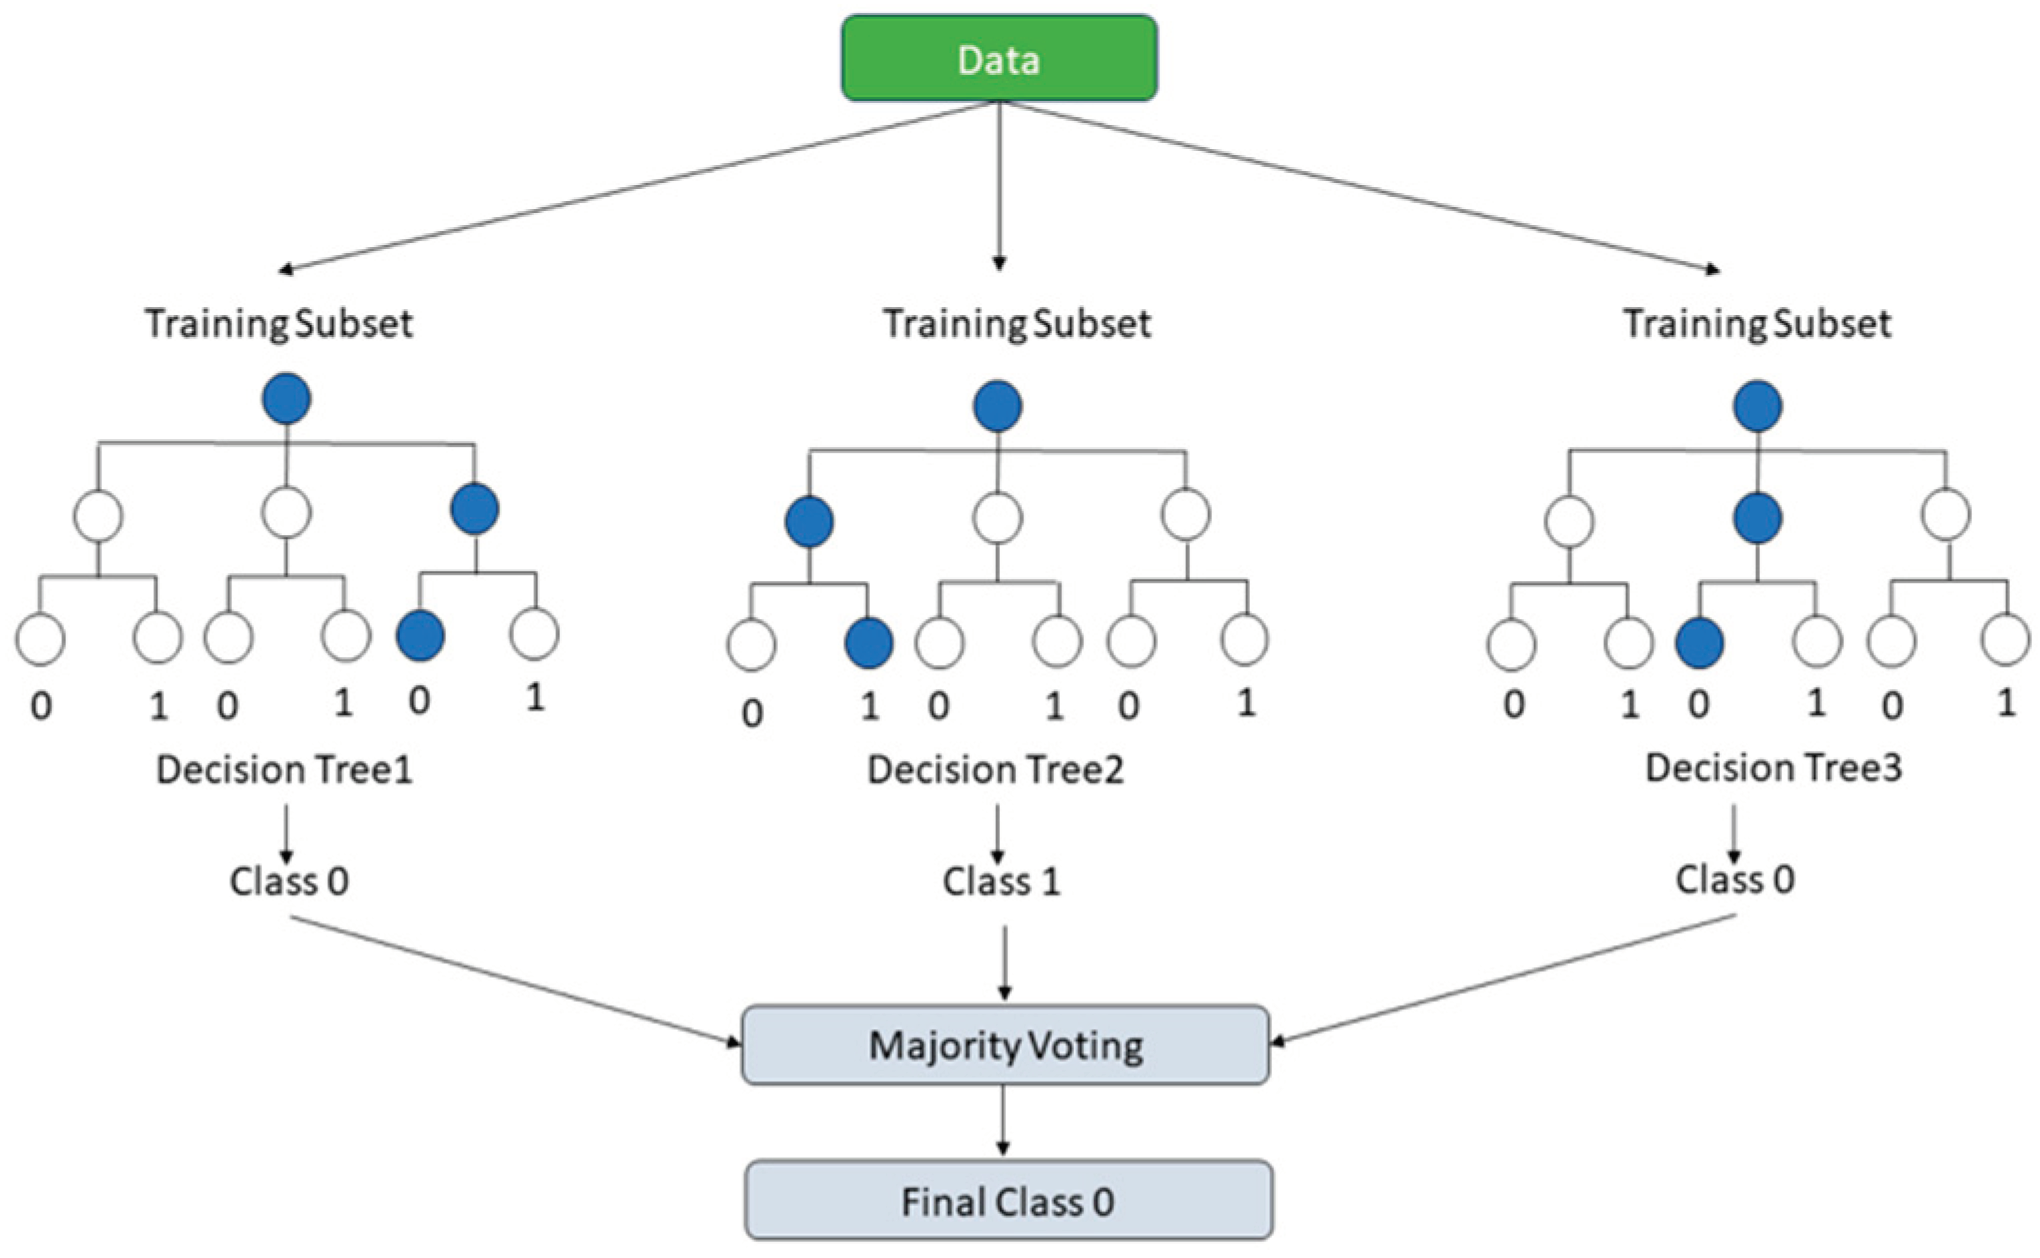
Figure 3.
The boosting techniques approach.
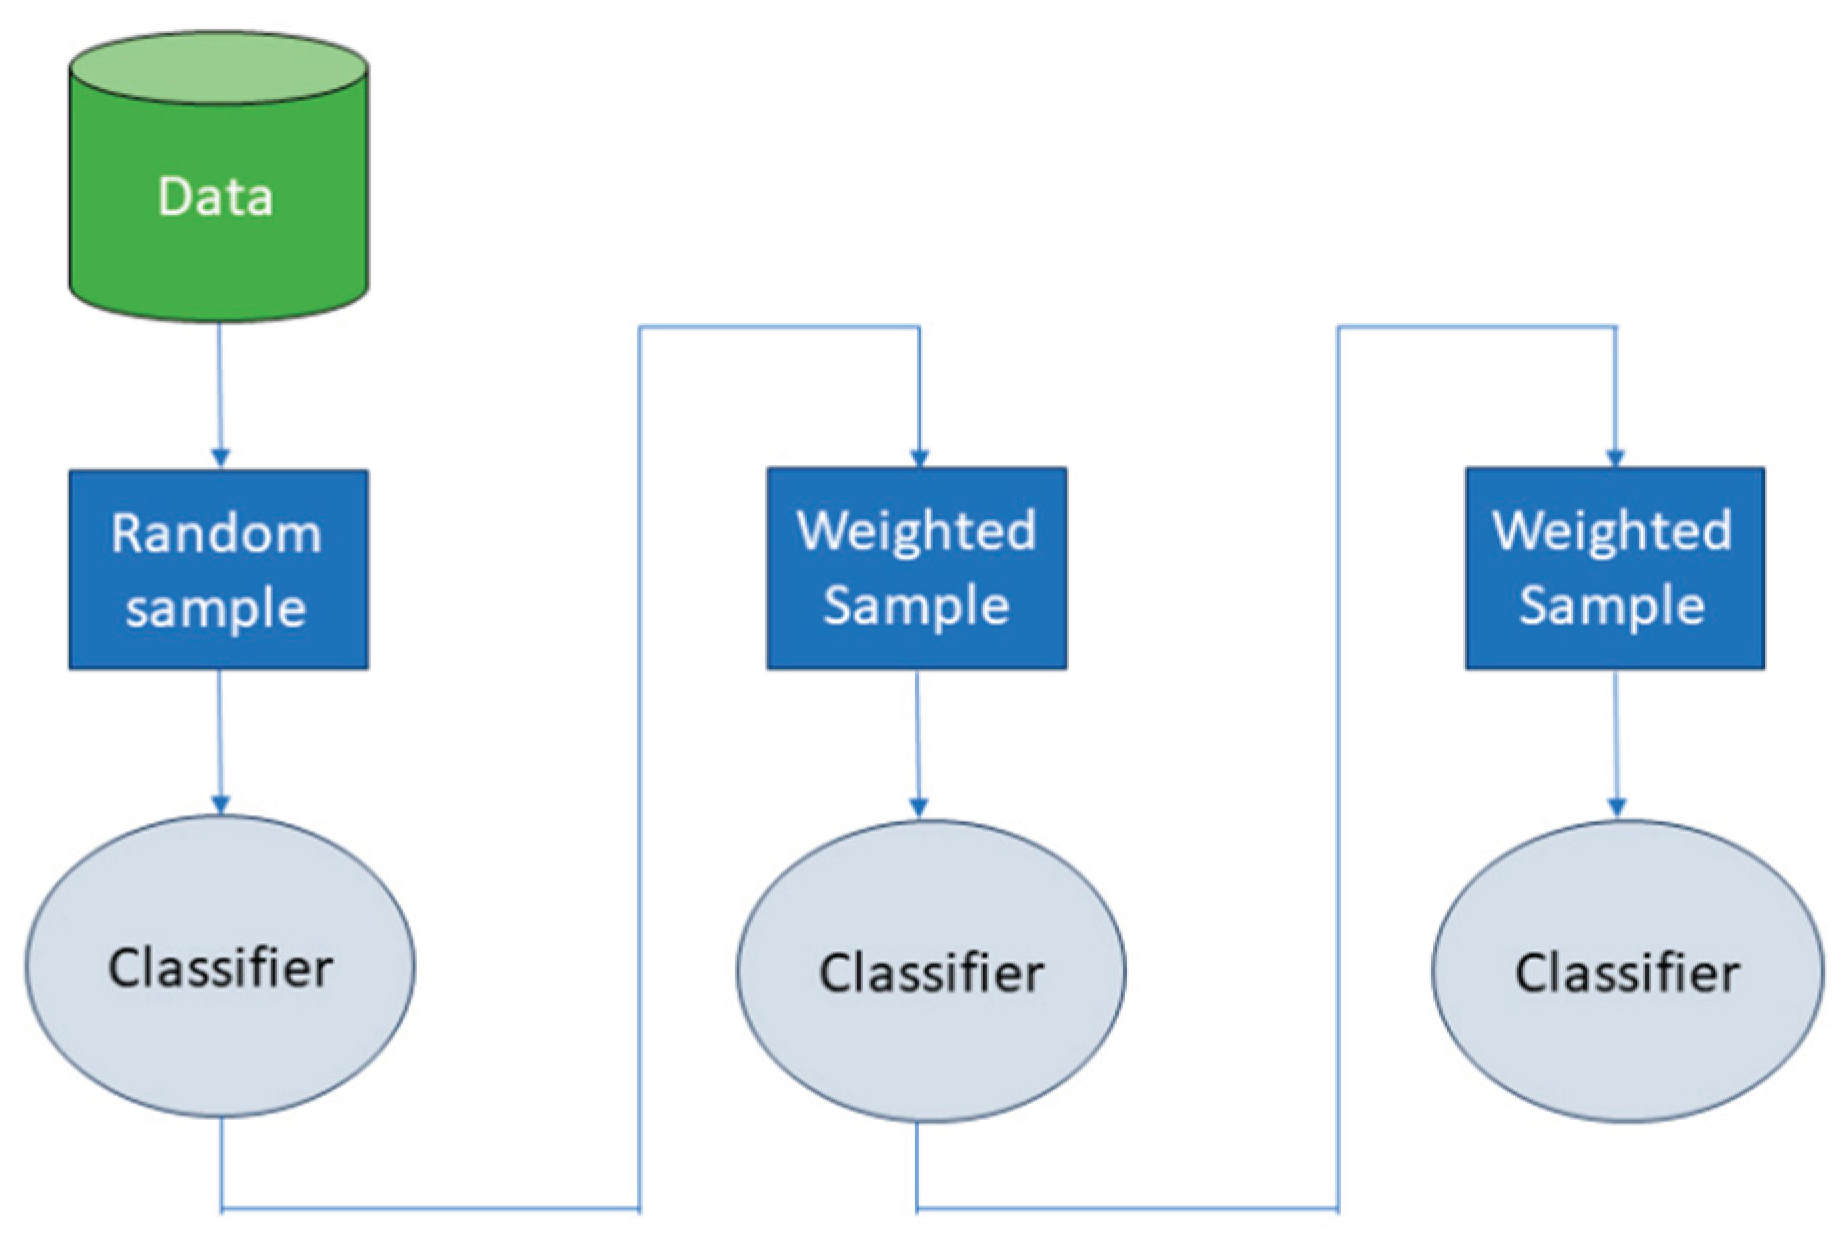
Figure 4.
The ROC curve.
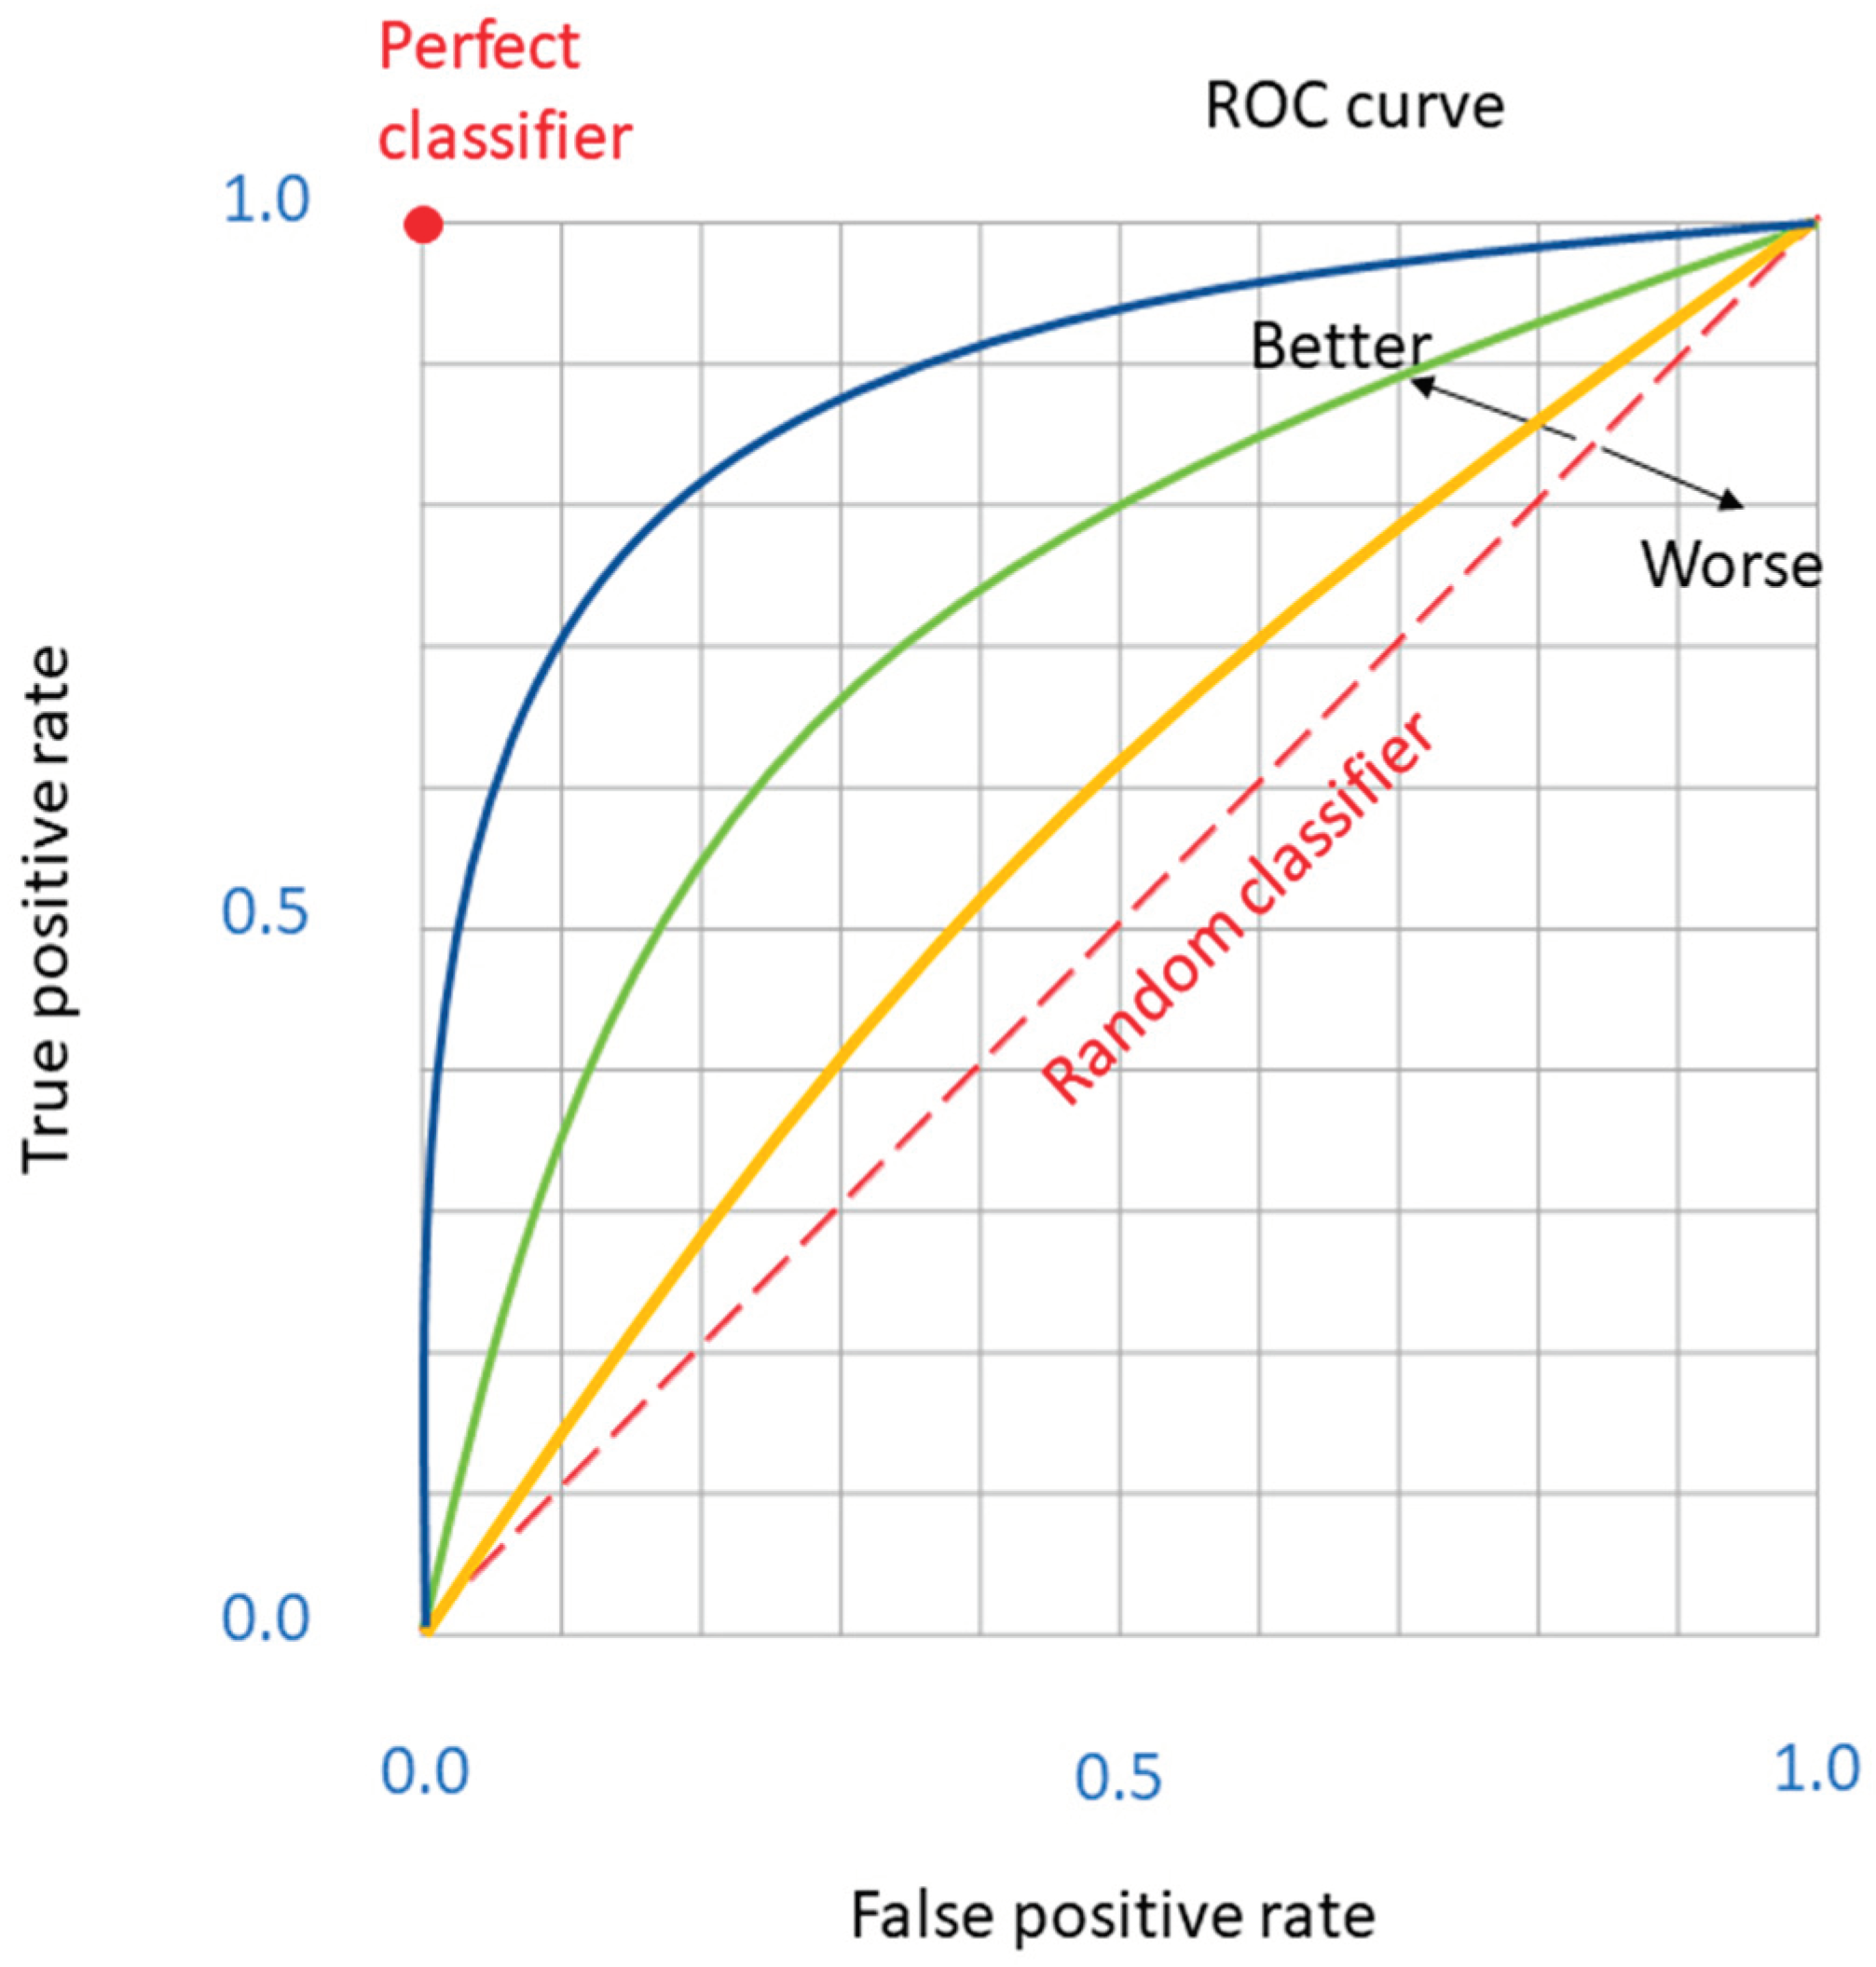
Figure 6.
a. The ROC AUC of the ML models after applying SMOTE. b. The ROC AUC of the ML models after applying ADASYN.
Figure 6.
a. The ROC AUC of the ML models after applying SMOTE. b. The ROC AUC of the ML models after applying ADASYN.
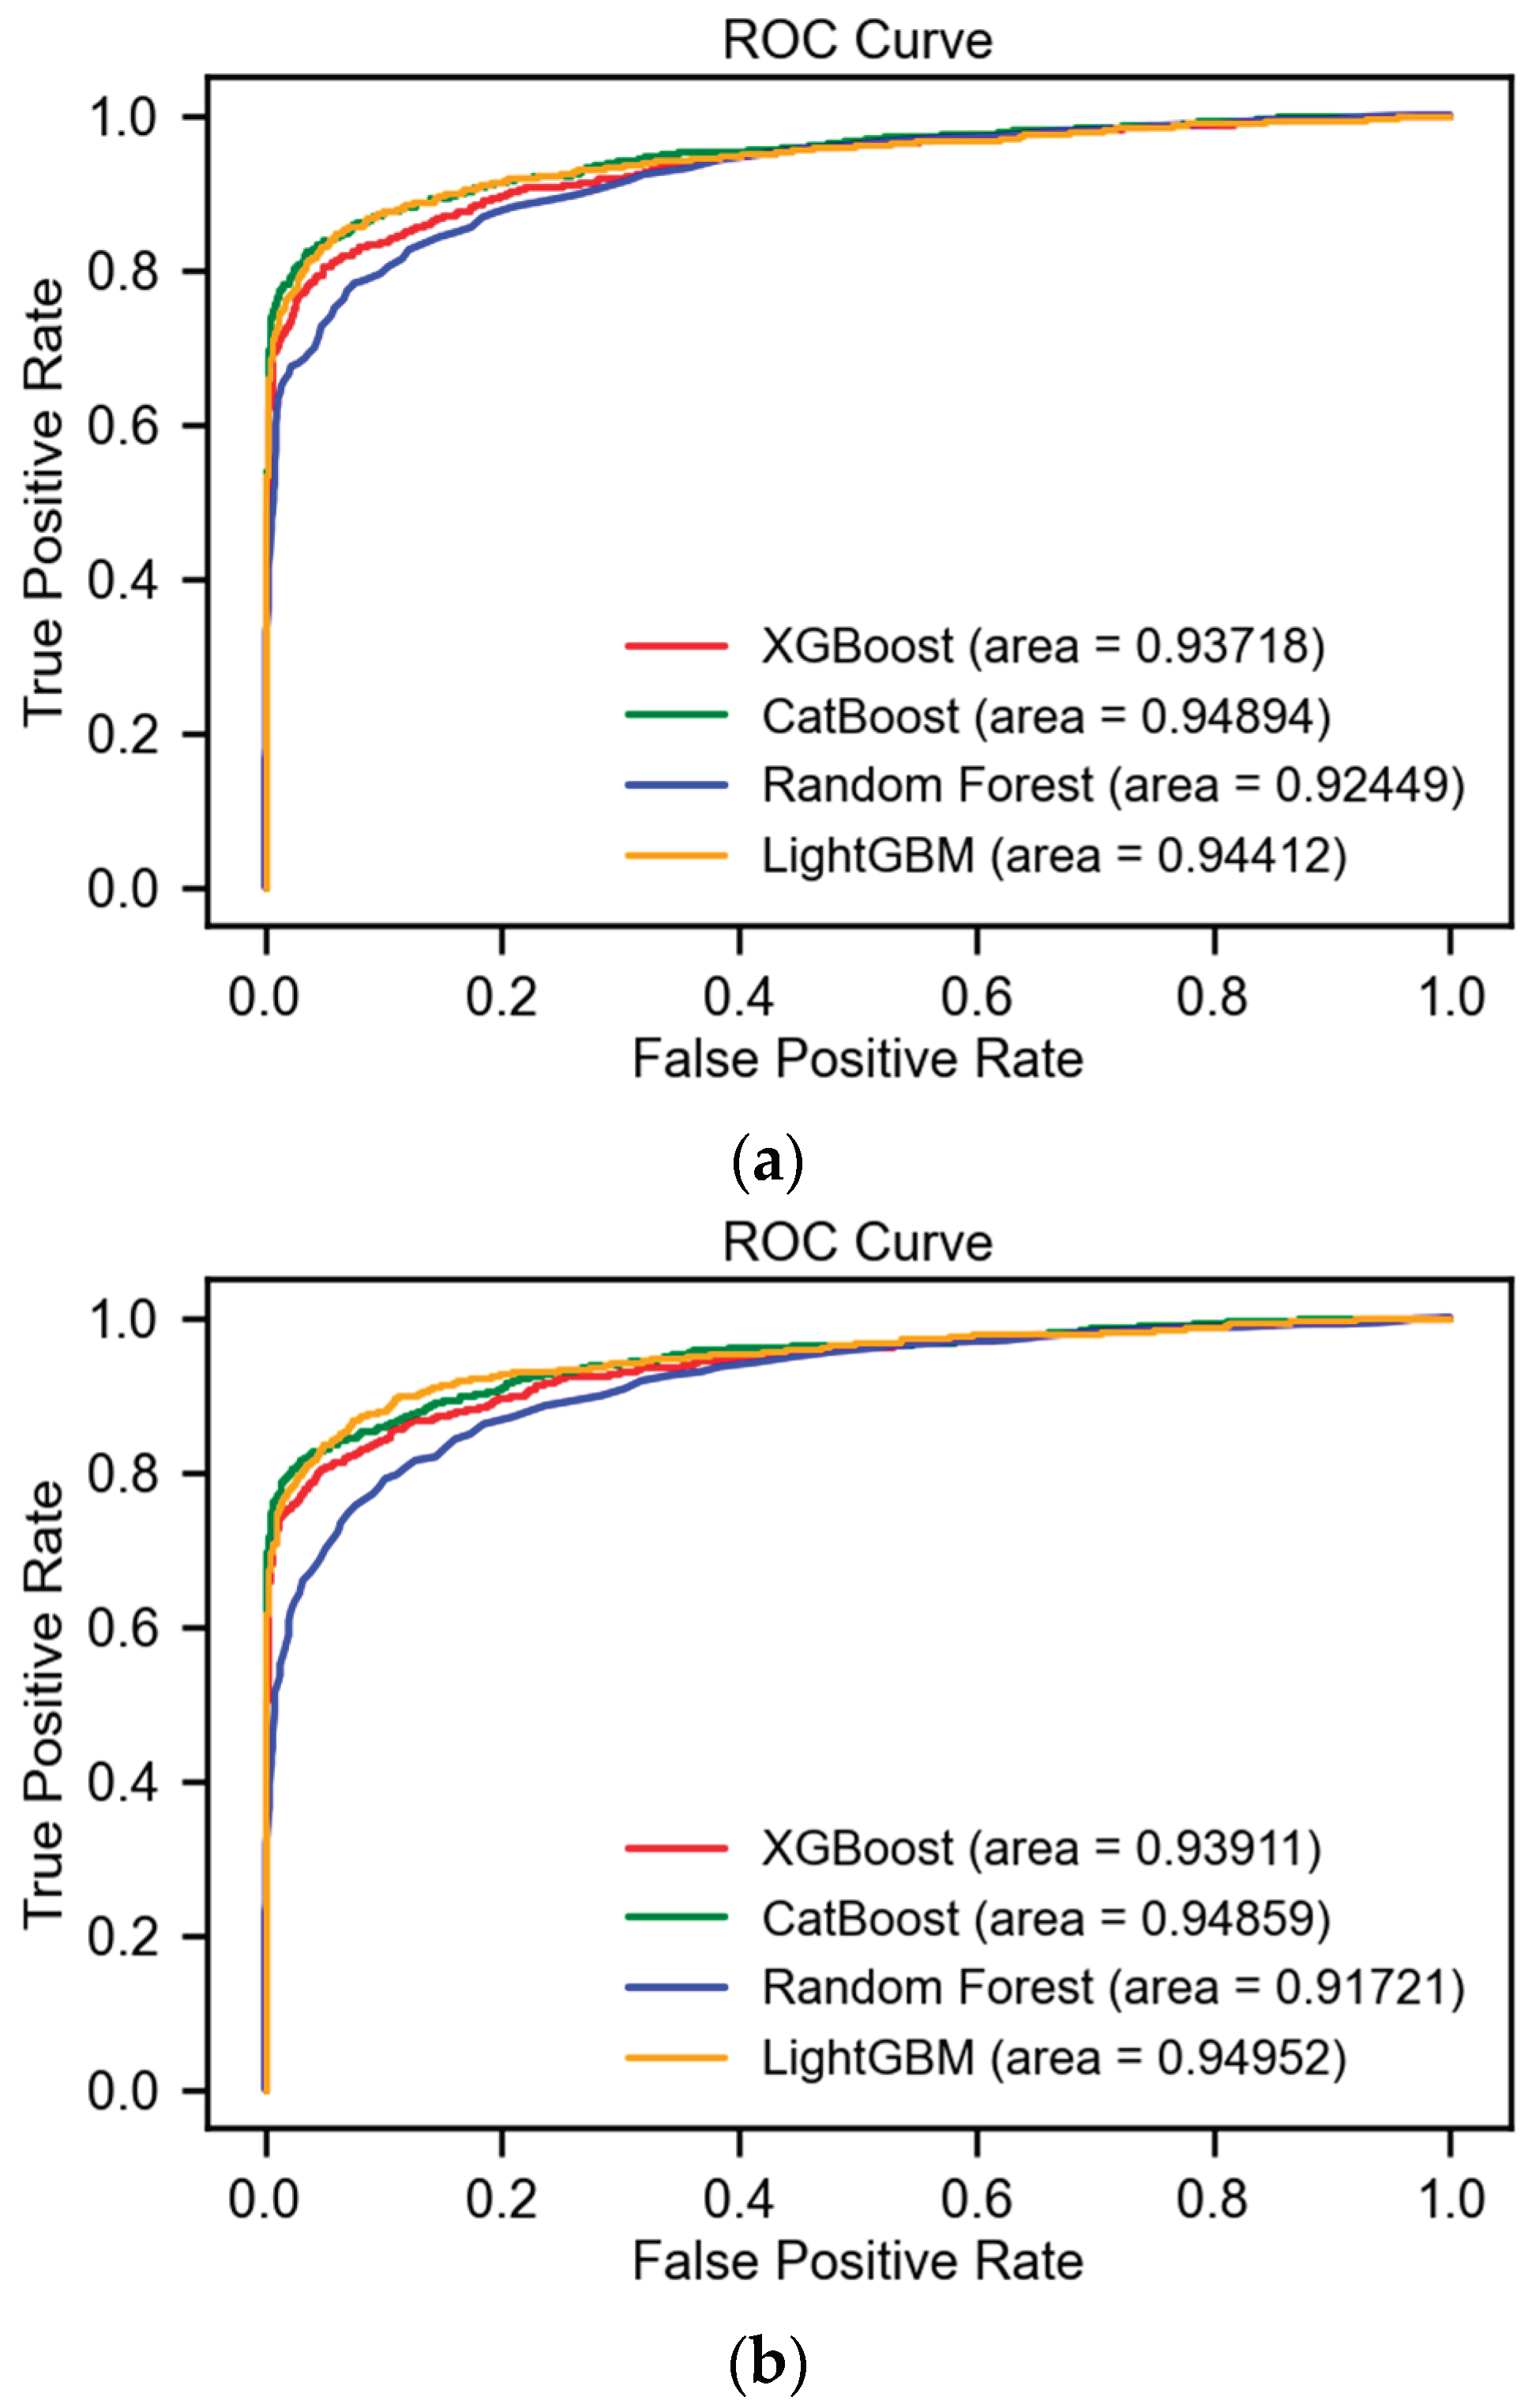
Figure 7.
a. The ROC AUC scores of the ML models following hyperparameter tuning on SMOTE-upsampled data. b. ROC AUC scores of the ML models following hyperparameter tuning on ADASYN-upsampled data.
Figure 7.
a. The ROC AUC scores of the ML models following hyperparameter tuning on SMOTE-upsampled data. b. ROC AUC scores of the ML models following hyperparameter tuning on ADASYN-upsampled data.
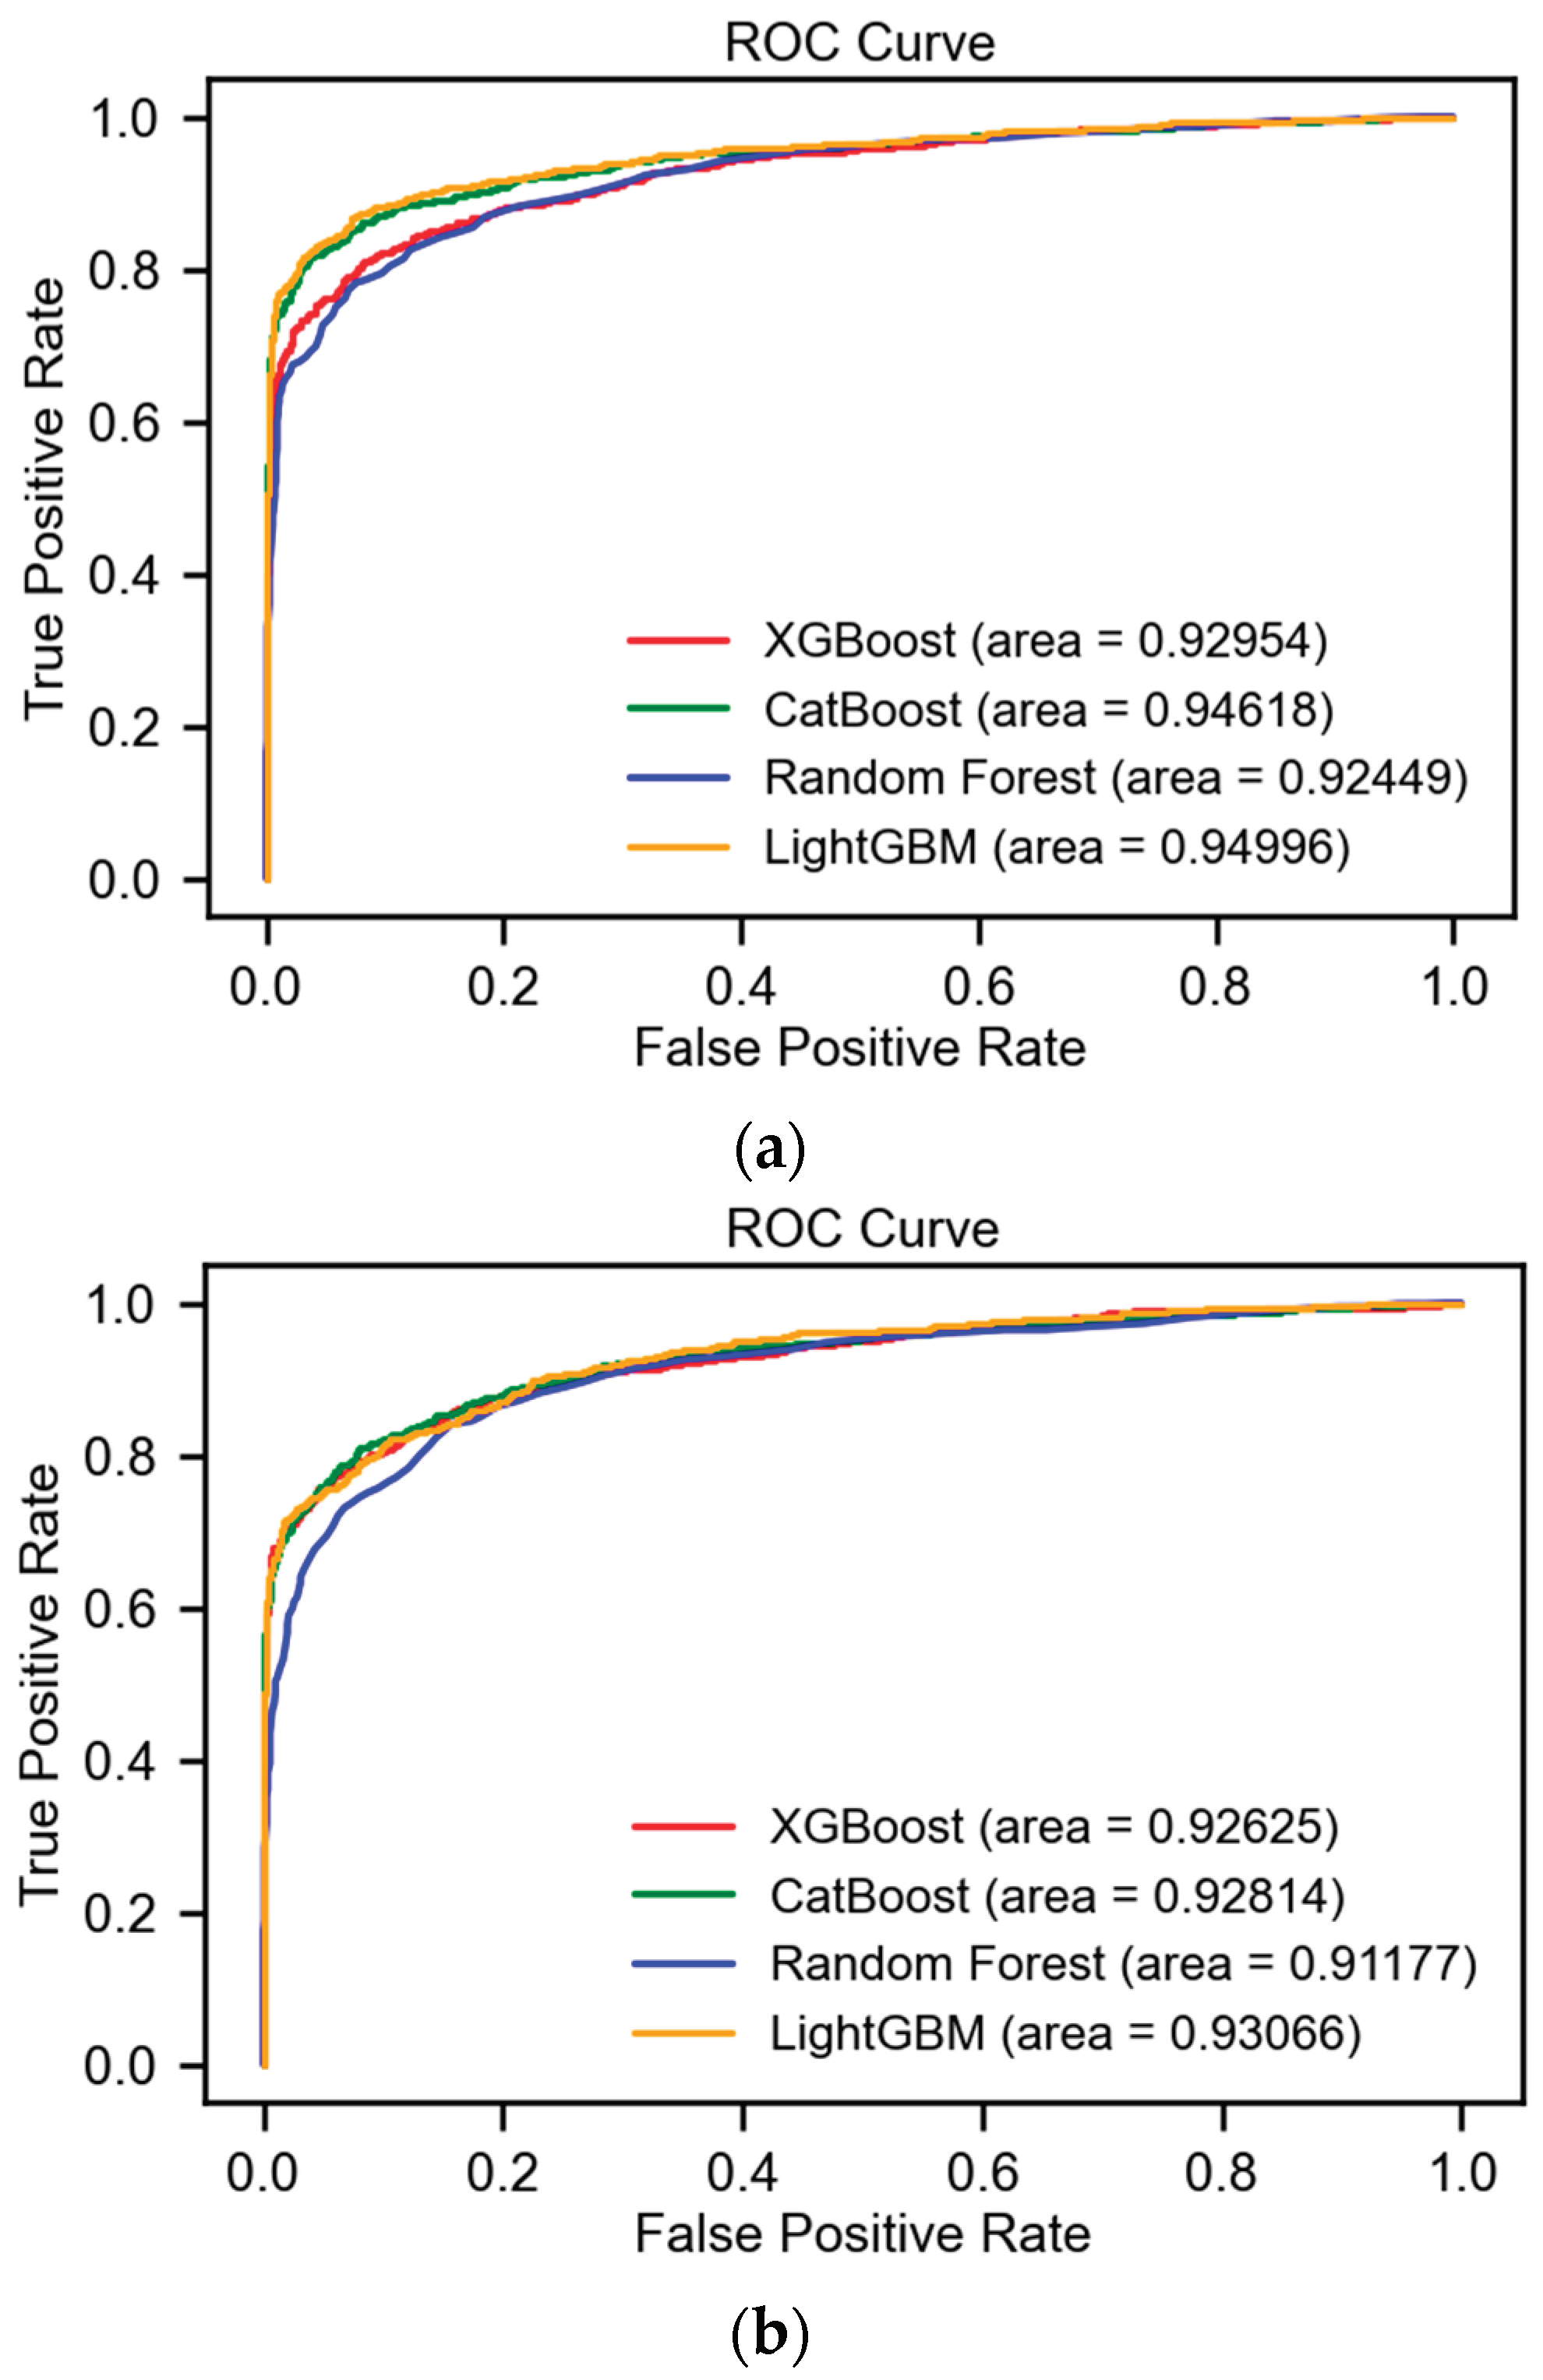
Table 4.
Evaluation scores of the ml models following hyperparameter tuning on upsampled data.
 |
Disclaimer/Publisher’s Note: The statements, opinions and data contained in all publications are solely those of the individual author(s) and contributor(s) and not of MDPI and/or the editor(s). MDPI and/or the editor(s) disclaim responsibility for any injury to people or property resulting from any ideas, methods, instructions or products referred to in the content. |
© 2024 by the authors. Licensee MDPI, Basel, Switzerland. This article is an open access article distributed under the terms and conditions of the Creative Commons Attribution (CC BY) license (http://creativecommons.org/licenses/by/4.0/).
Copyright: This open access article is published under a Creative Commons CC BY 4.0 license, which permit the free download, distribution, and reuse, provided that the author and preprint are cited in any reuse.


