Submitted:
04 March 2024
Posted:
04 March 2024
You are already at the latest version
Abstract
Autonomous vehicle technology, employing image sensors for road marking recognition, is largely dependent on the Lane Departure Warning System (LDWS) to prevent vehicular deviations from driving lanes. The effectiveness of image-based lane recognition, however, is susceptible to environmental influences like weather conditions and the surrounding road environment. This study investigates the impact of road marking retro-reflectivity on LDWS under varied environmental conditions. Conducted at the Yeoncheon SOC Demonstration Research Center, the experiments encompassed a spectrum of weather scenarios, incorporating rainfall and shifts between day and night lighting. Controlled wear was applied to white, yellow, and blue road markings, followed by measuring their retro-reflectivity at different stages of degradation. The LDWS's performance was evaluated by assessing the recognition rates of these markings under these diverse environmental settings. The study reveals that enhanced retro-reflectivity significantly boosts LDWS detection, especially in challenging weather conditions. Furthermore, the research led to the development of a simulation framework to analyze the cost-effectiveness of road marking maintenance, aligning it with the safety needs of autonomous vehicles. This framework suggests the necessity for updated road marking guidelines that cater to the advanced needs of driver assistance systems and autonomous vehicle technology.
Keywords:
LDWS
; autonomous vehicle
; road markings
; retro-reflectivity
; environmental conditions
; simulation framework
1. Introduction
Lane Departure Warning System (LDWS) is a key component in advancing driver assistance technologies [1,2,3,4]. It plays a crucial role in preventing accidents that occur when vehicles unintentionally deviate from their lanes, a frequent concern in regular driving. Additionally, LDWS significantly enhances lane recognition which is a vital function for autonomous vehicles [5,6]. LDWS operates by continuously monitoring and analyzing road markings to detect deviations from the intended lane [7,8,9]. The effectiveness of this system heavily relies on the visibility and clarity of these road markings, emphasizing their importance beyond mere design elements to important components in supporting driver assistance technologies.
Currently, domestic standards for road markings in South Korea are primarily developed for general drivers in installation, maintenance, and repainting (Table 1). These standards do not yet consider specific criteria for LDWS, which may require different considerations given their reliance on machine perception of road boundaries for navigation. As illustrated in Table 1, the existing national guidelines stipulate retro-reflectivity values with general driving conditions. This regulation may lead to potential gaps in safety for autonomous driving systems, which necessitate a clear and consistent interpretation of road markings under a variety of operational conditions.
The reliability of vision-based LDWS is significantly influenced by environmental factors, particularly changes in weather and lighting [10,11,12]. Given that LDWS rely on visual cues, variations in lane image quality due to weather changes can adversely affect performance. To overcome these challenges and ensure consistent system functionality, high retro-reflectivity of road markings is imperative [13]. Determining the level of retro-reflectivity that can guarantee lane recognition by LDWS, regardless of weather conditions, is critical for the safety of vehicles employing this technology.
The objective of this research was to establish a threshold of retro-reflective for road markings that vision-based LDWS can reliably detect, thus proposing a set of reflective performance guidelines. The experiments were designed to test the lane recognition rate of LDWS across a spectrum of retro-reflectivity levels for white, yellow, and blue road lines. We systematically combined various conditions including different levels of rainfall, day and night cycles, and vehicle light statuses (on/off) to comprehensively evaluate the performance of LDWS under realistic and controlled conditions. This approach allowed us to determine the critical retro-reflectivity values necessary for the LDWS to function effectively and safely, regardless of environmental conditions. Building upon these findings, we developed a simulation framework that utilizes established thresholds to evaluate road marking maintenance strategies. This framework was designed to optimize the balance between cost-effectiveness and the stringent safety requirements of autonomous vehicle ecosystems.
2. Materials and Methods
This study aimed to establish a set of guidelines for autonomous vehicles, focusing on road markings as a crucial element for the effective operation of LDWS. To achieve this aim, the research was structed to include field experiments, preliminary testing, main experiment, evaluation, and the formation of guidelines. The initial stage involved configuring field experiments that accurately reflected real-world conditions, followed by preliminary tests to simulate the integrity of road surfaces. Subsequently, the main experiment was conducted, involving scenario-based repetitive testing to gather comprehensive data. After the completion of these experiments, an in-depth evaluation and analysis were conducted to interpret the results. The final stage entailed a set of guidelines based on the insights gained from the experiments.
2.1. LDWS Functionality Tests
LDWS functionality tests were conducted with stringent adherence to the safety requirements for autonomous vehicles as stipulated by the Ministry of Land, Infrastructure, and Transport. Key aspects of the vehicle test conditions included maintaining the ambient temperature on the test track within 0 to 45 deg. Additionally, the tests involved a vehicle equipped with LDWS accelerating from a stationary state to 60 km/h and then executing a lane departure at a specified lateral speed within a weather simulation section (Figure 1). The evaluation of the LDWS’s effectiveness focused primarily on the road marking recognition rate. This rate was calculated as the percentage of correct recognitions, formulated by dividing the number of road markings recognized by the total number of trials and then multiplying the result by 100%.
2.2. Experimental Scenarios
The experimental scenarios were designed to assess the luminance of road markings at various stages of road marking wear, specifically for white, yellow, and blue color markings. Prior to field application, a preliminary analysis was conducted to determine the rate of luminance reduction due to surface abrasion, ensuring the scenarios were reflective of actual road conditions. To rigorously evaluate the LDWS’s capability to detect road markings under various degrees of wear and environmental conditions, the scenarios integrated factors such as color, wear extent (considering the degree of erosion), luminance, and weather conditions (rainfall). To reflect the complexities of realistic driving environments, the testing conditions were varied. Rainfall intensities were set at incremental levels of dry road surface, wet road surface, 20mm/h and 40mm/h to simulate wet conditions. In terms of road marking wear, the experiments included stages of various degradations. The luminance conditions were controlled to simulate the visibility during the day and at night, with specific scenarios including daytime brightness, nighttime with street lighting and vehicle headlight, and nighttime with only vehicle headlights on (Table 2). These detailed parameters, in conjunction with a controlled track environment that replicated actual road conditions, allowed for a series of repeated trials to provide a thorough assessment of the LDWS’s performance across a spectrum of realistic and challenging driving scenarios.
2.3. Scenario Implementation
The Yeoncheon SOC (System of Control) Demonstration Research Center in Korea was utilized to establish diverse environmental conditions for analytical evaluation. The total length of the weather simulation test section spanned 200 meters. The initial 100 meters, located outside the tunnel shield, facilitated vehicle acceleration (Figure 1). The subsequent 100 meters inside the tunnel shield were dedicated to performing lane changes and calculating the lane detection rate. Within the shielded section, precipitation was synthetically generated, ranging from 20 mm/h to 40 mm/h (Figure 2). Lighting conditions were regulated according to the time of day and the use of tunnel illumination. Daytime tests ran from 12:00 to 15:00, and nighttime sessions performed after 21:00 with adjustable tunnel lighting (Table 2).
2.4. Vehicle’s Speed and Trajectory
The methodology for evaluating the LDWS’s detection accuracy was developed. The LDWS-equipped vehicle sufficiently accelerated outside of a shielded area and then passed through a simulation zone (tunnel shield) to execute a lane change within a specified section. It enables the measurement of the system’s recognition rate under controlled yet realistic conditions. The vehicle’s speed was maintained at 60 km/h, the operational speed for the LDWS, ensuring the system’s activation during testing. The lateral departure angle and speed were calculated to result in a trajectory with a tangent of 3.5/40 (equivalent to an angle of 5.01 degrees), corresponding to a lateral speed of 1.458 m/s (Figure 1). The trials were designed to minimize error and provide an accurate assessment of the LDWS’s performance in various weather-induced visibility conditions.
2.5. Preliminary Test
Prior to the main experiments of the LDWS’s capability tests, a series of preliminary experiments were conducted at the Yeoncheon SOC Demonstration Research Center to determine the relationship between the number of grindings and retro-reflectivity reduction. The test track was marked with White, yellow, and blue lane markings (Figure 3A). These markings underwent a systematic abrasion process using a grinder (Figure 3B), followed by measurements of the retro-reflective coefficient. Measurement points were marked alongside the markings. Subsequent to grinding, these points underwent multiple assessments to ensure the reliability of the data. The retro-reflective coefficients were obtained using a retro-reflectometer (LTL-XL, Delta), calibrated before each measurement session with standard samples provided by the manufacturer (Figure 3C).
The preliminary findings indicated a decline in the retro-reflective coefficient with successive grinding frequency for test track lane markings (Figure 4). The results confirmed the SOC center’s capability to effectively simulate road marking wear and retro-reflectivity degradation.
2.6. Experimental Procedures
The LDWS road marking recognition rate experiment followed a protocol that incorporated varying weather conditions. The procedure included an initial application of road markings, simulation of wear through repeated grinding (Table 3), verification of retro-reflective coefficients, and a sequence of tests in both daytime and nighttime conditions, replicated ten times each to maintain experimental consistency. Additional tests replicated rainy conditions also repeated ten times to ensure robust data.
2.7. Simulation Framework for Efficient Road Management
To enhance the practical applications of our experimental findings, a simulation framework was developed to analyze the cost-effectiveness of various road marking repainting scenarios. This framework specifically evaluated the impact of repainting on the performance of LDWS, particularly under challenging weather conditions. Central to this framework was the monitoring of road markings’ retro-reflectivity, assessing whether it fell below the thresholds outlined in Table 1. A non-linear regression model () was employed to establish between the LDWS recognition rate and the retro-reflectivity of road markings. This model took into account variations in luminance and weather conditions, where x denoted the target recognition rate, and y represented the required retro-reflectivity. The model’s hyperparameter, , was optimized using a grid search method within the range [0, 2], aiming to maximize the r2 statistics and thus providing a more precise estimation of necessary retro-reflectivity thresholds (Figure 5). The non-linear model bridged the gap between theoretical data and actionable guidelines.
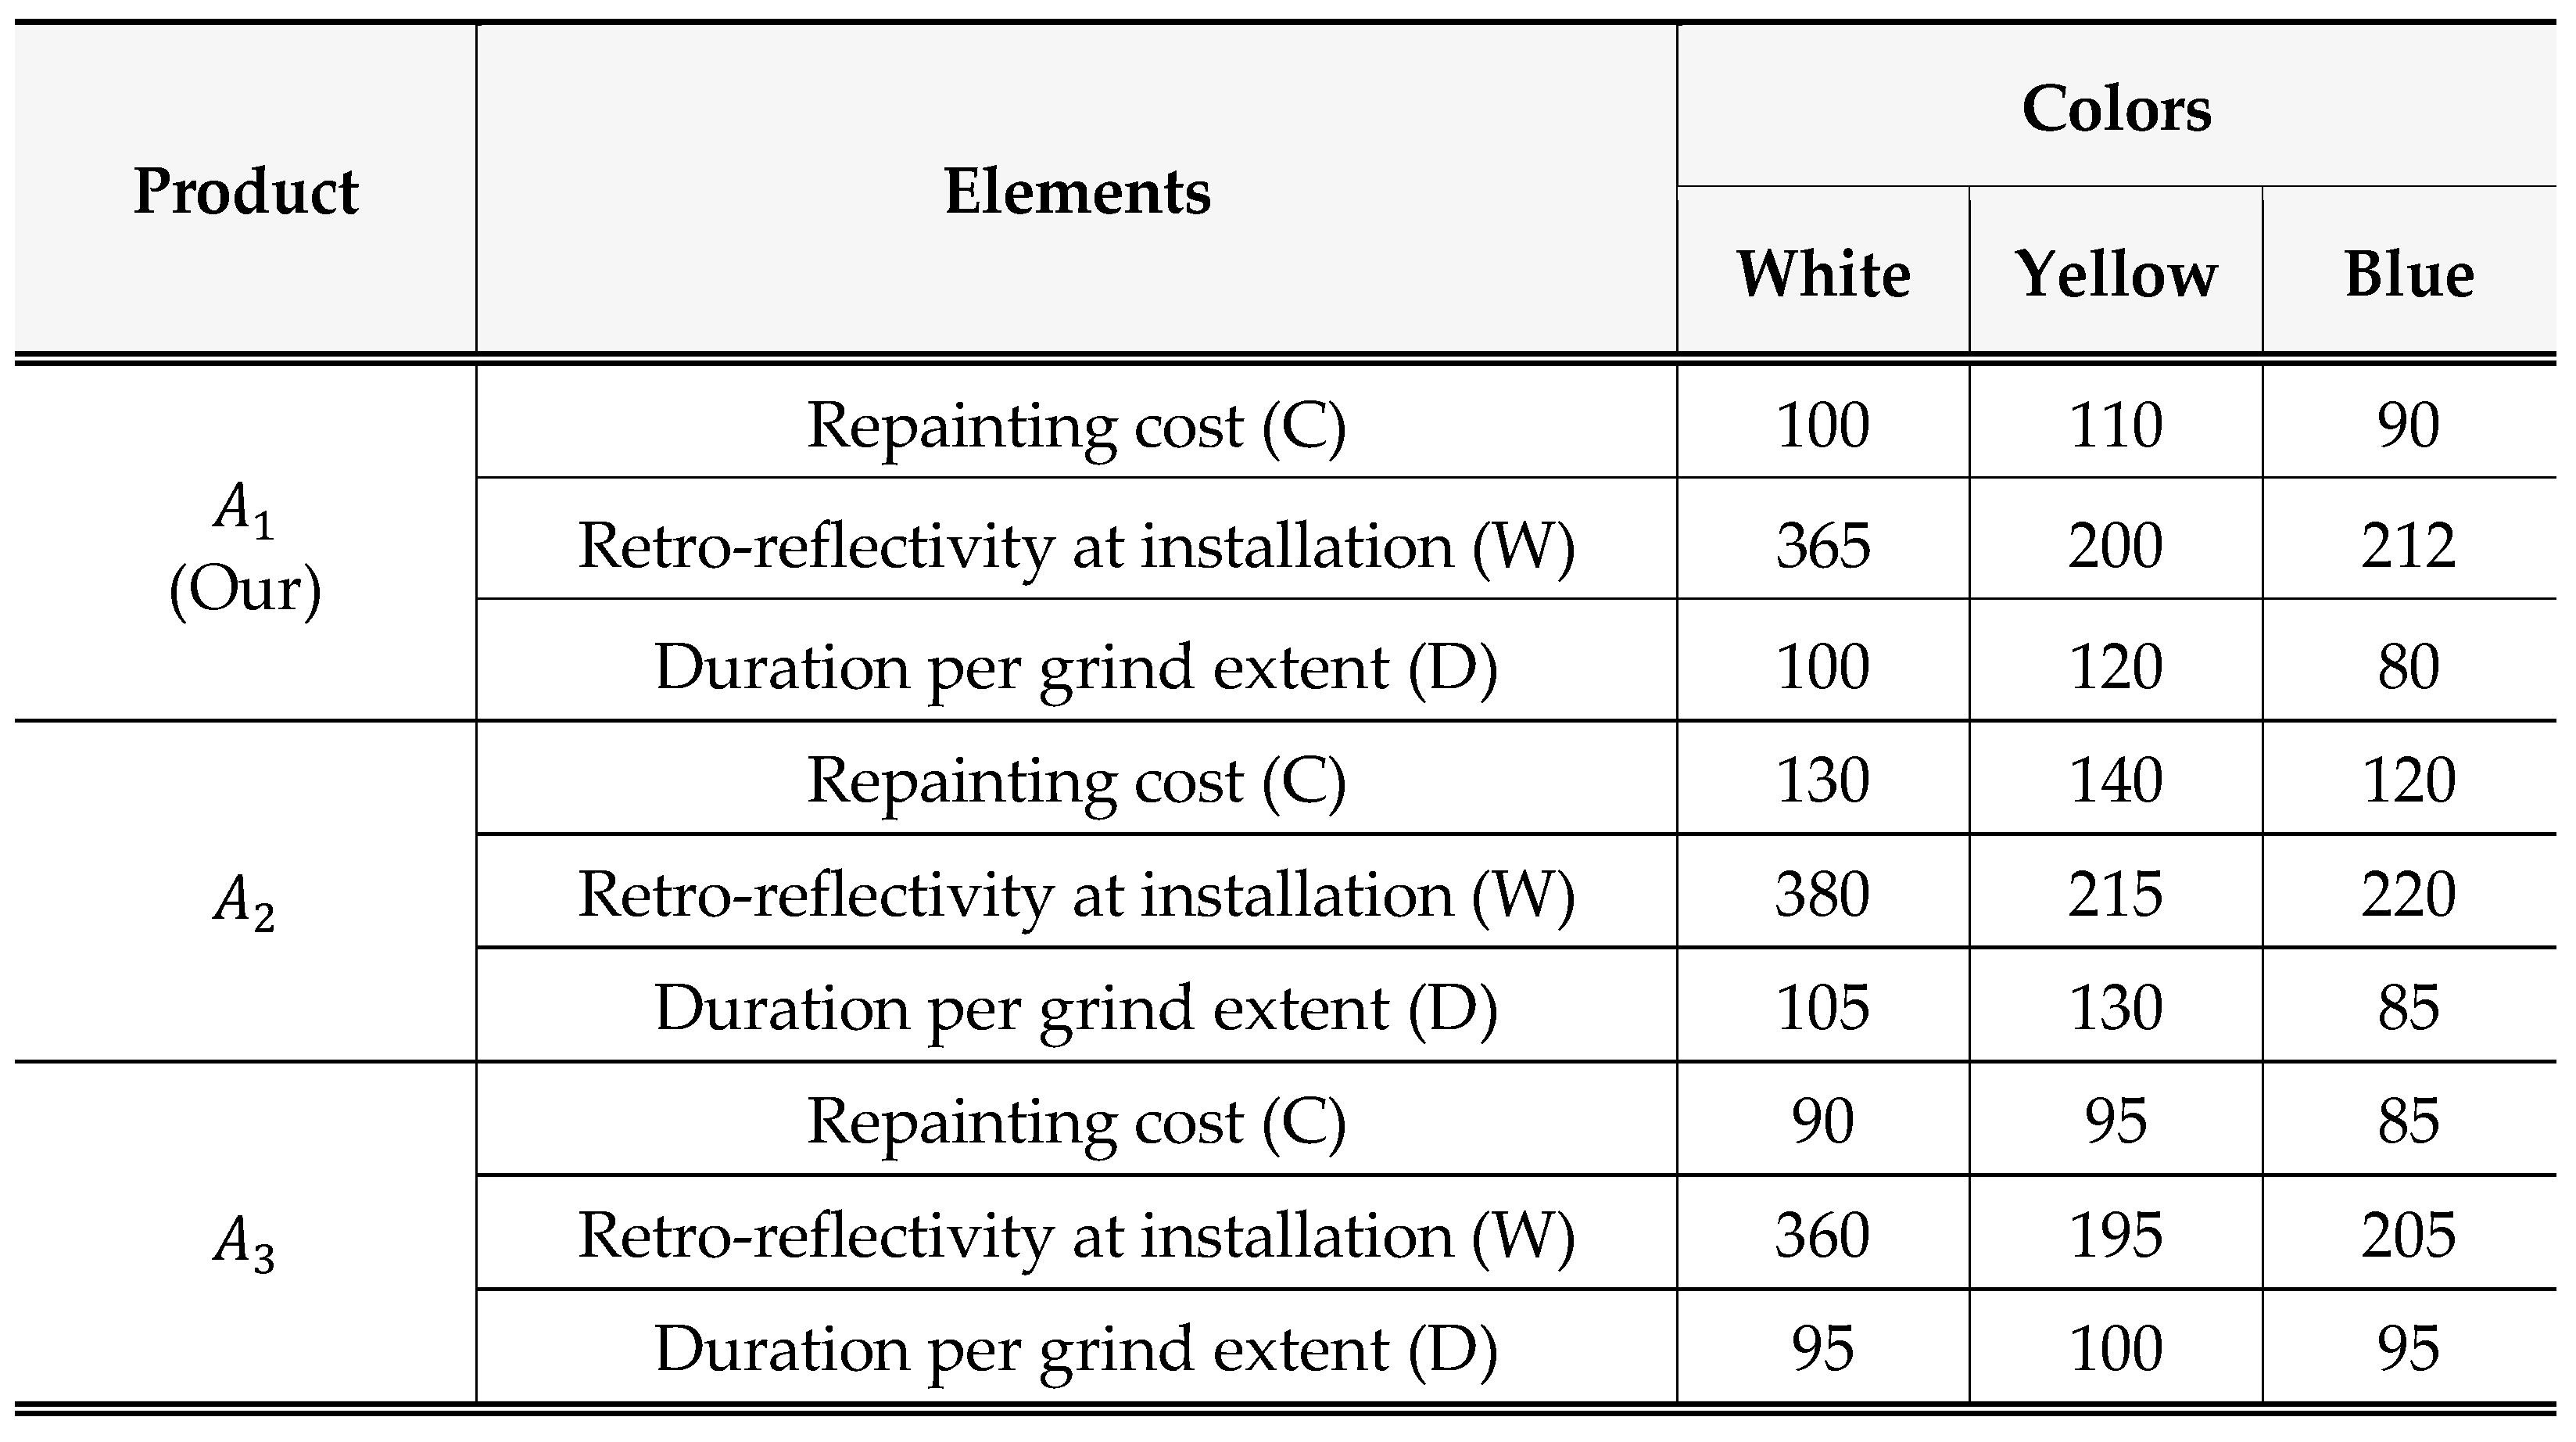
In its practical application, the framework facilitated cost comparisons among different road marking paint products. Key factors considered in this comparison included: 1) the repainting cost per kilometer for each product (C), 2) the initial retro-reflectivity of these products (W), and 3) the duration taken for each product’s retro-reflectivity to diminish by one level of wear (D), a measure that varies based on regional environmental conditions. For this simulation, three hypothetical products were assumed (Table 4): A1 (currently used in our research), A2 (a more expensive but higher quality alternative to A1), and A3 (a cheaper but lower quality option compared to A1). The simulation framework, denoted as (Alg. 1), calculated the total cost of maintaining a specified target recognition rate (TR) over a certain simulation period (ST), under various luminance and weather conditions (LW). This simulation aided in identifying the most efficient repainting strategy, balancing cost and LDWS performance.
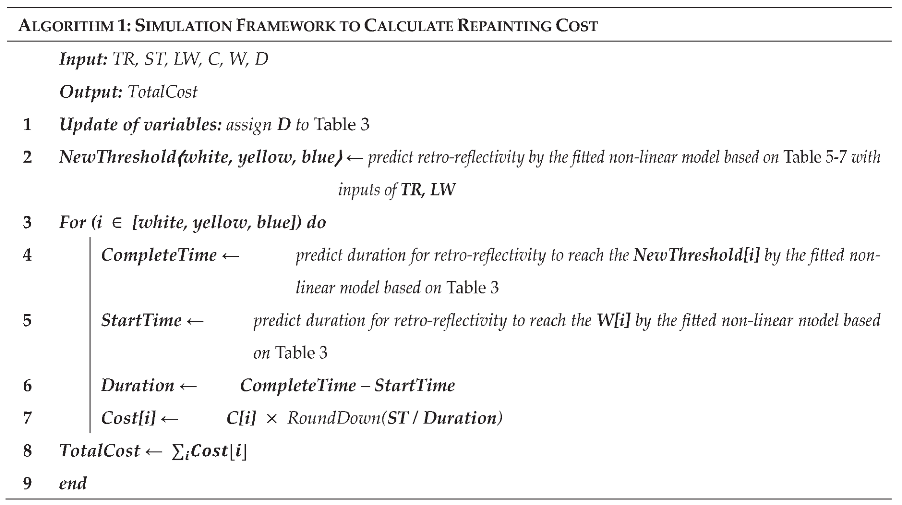

Table 4.
Elements of three paint products (unit: 1000 KRW/km for C; mcd/(m2∙Lux) for W; days for D).
Table 4.
Elements of three paint products (unit: 1000 KRW/km for C; mcd/(m2∙Lux) for W; days for D).
3. Results
3.1. White Lane
In the replicated weather simulation experiments for white lane markings, a 100% recognition rate was achieved during the day across all rainfall conditions including 20 and 40 mm/h. However, nighttime conditions revealed variations in lane recognition rates correlated with decreases in the retro-reflective coefficient. Repeated trials on dry and wet surfaces at night demonstrated changes in recognition rates. Regardless of nighttime lighting, a recognition rate above 90% was consistently observed, but at lower retro-reflectivity values of 142 mcd/(m2∙Lux) and 104 mcd/(m2∙Lux), the recognition rates dropped to 90% (Table 5).
Under nocturnal rainfall conditions, recognition rates fell below 70% for retro-reflective values of 142 mcd/(m2∙Lux) and 104mcd/(m2∙Lux). Specifically, at a rainfall intensity of 20 mm/h with a retro-reflectivity of 142 mcd/(m2∙Lux), the LDWS recognition rate decreased to 70% (Table 5). As precipitation increases to 40 mm/h and 50 mm/h, the lane recognition rate dropped below 50% at a retro-reflectivity of 142 mcd/(m2∙Lux). At 104mcd/(m2∙Lux), the recognition rate decreased to 50% when rainfall reached 20 mm/h. Furthermore, with rainfall intensifying beyond 40 mm/h, the rate diminished to below 30%.
3.2. Yellow Lane
During the daytime, the yellow lane markings achieved a 100% recognition rate under all rainfall conditions. Even when the retro-reflectivity approached 76mcd/(m2∙Lux), the recognition rate remained above 90% regardless of nighttime lighting or surface moisture. However, during night rain conditions with an intensity of 20 mm/h, the recognition rate fell to 50% at a retro-reflectivity of 76mcd/(m2∙Lux) (Table 6).
3.3. Blue Lane
For the blue lane markings, a 100% recognition rate was achieved during daytime conditions. Nighttime trials showed a consistent 90% recognition rate on wet surfaces, independent of lighting presence (Table 7). The recognition rate significantly dropped to 50% at the 60 mcd/(m2∙Lux) under rainfall intensity of 20 mm/h. Additionally, to maintain a recognition rate above 70% during nighttime rainfall at the same intensity, a retro-reflectivity of at least 130 mcd/(m2∙Lux) was required.
3.4. Simulation
The simulation framework’s cost analysis, applied to two alternative paint products A2 and A3, in addition to the currently used product A1, yielded significant insights into efficient road management strategies. The alternatives were defined as A2 being more expensive but of higher quality, and A3 as a cheaper but lower quality option.
The simulation framework revealed that product A3 emerged as the most cost-efficient option for target recognition rates below 79%. Conversely, the current product A1 was found to be the most effective solution for target recognition rates exceeding 79% under the condition of 40 mm/h rainfall intensity and no additional lighting (Figure 6). Additionally, the cost-efficiency ranking of the three alternatives varied depending on different luminance and weather conditions. At a 60% target recognition rate, A3 was the most cost-effective product across all conditions. Shifting to a 70% recognition rate, A1 outperformed under extreme conditions of heavy rainfall with lighting and moderate rainfall without lighting, while A3 remained the preferred option elsewhere. At an 80% recognition target, the trend continued with A1 leading in heavy rain scenarios, whether illuminated or not, and A3 favored in less severe weather conditions (Figure 7).
4. Discussion
The study aimed to evaluate the impact of weather conditions and wear on the lane recognition rates for blue, white, and yellow road markings. Conducted at the Yeoncheon SOC Demonstration Research Center, various weather scenarios were simulated, incorporating changes in rainfall, lighting, and diurnal cycles. Wear was artificially induced on the markings to assess degradation effects. Recognition rates were determined through ten iterations per condition. The outcomes include: 1) During daytime, the lane recognition rate was 100% under all weather conditions for all colors. 2) At night under heavy rainfall, white lane markings showed a recognition rate below 50% when the retro-reflectivity dropped to 142 and 104 mcd/(m2∙Lux). 3) Yellow markings’ recognition halved at night under 20mm/h rainfall at 76 mcd/(m2∙Lux). 4) Over 70% recognition for blue markings at night required a retro-reflectivity of at least 130 mcd/(m2∙Lux) under 20mm/h rainfall.
For stable autonomous driving, a recognition rate above 70% is essential for LDWS functionality. In our findings, rainfall exceeding 20 mm/h at night significantly diminishes the recognition rate for LDWS. Our research revealed that under such conditions, the recognition rates for white, yellow, and blue lane markings dropped below the critical 70% threshold. Specifically, when the retro-reflectivity fell to 142 mcd/(m2∙Lux) for white and 104 mcd/(m2∙Lux) for yellow, the recognition rates dropped to around 50%. For blue markings, the recognition rate sharply decreased to 50% when the retro-reflectivity was at 60 mcd/(m2∙Lux) during nighttime rainfall. These findings underscore the need for higher retro-reflectivity standards in road markings to support the reliable operation of LDWS in autonomous vehicles, especially under challenging weather conditions.
In our findings, the retro-reflectivity of lane markings is a crucial factor in maintaining high recognition rates for LDWS. High retro-reflectivity levels consistently resulted in robust recognition rates across white, yellow and blue lane markings regardless of weather conditions, lighting or the time of day. Specifically, our study demonstrated that when retro-reflectivity was maintained at or above 253 mcd/(m2∙Lux) for white lines, 164 mcd/(m2∙Lux) for yellow lines, and 132 mcd/(m2∙Lux) for blue lines, the LDWS achieved a 100% recognition rate in all tested conditions. Thus, emphasizing the necessity of setting higher retro-reflectivity for road markings would ensure the effective functioning of autonomous driving systems.
Current guidelines for road markings do not consider the increased retro-reflectivity requirements identified in our study, particularly under challenging conditions like heavy rainfall at night. For instance, while standard retro-reflectivity for road markings is typically set below 100 mcd/(m2∙Lux) [14], our study indicates that higher values are necessary to maintain effective LDWS performance, 140 mcd/(m2∙Lux) for white line, 160 mcd/(m2∙Lux) for yellow line, and 130 mcd/(m2∙Lux) for blue line markings. This difference would arise because conventional standards are designed for human drivers under a broader range of conditions, whereas autonomous vehicles rely heavily on consistent and clear road markings for navigation, especially in challenging environments. Therefore, our findings suggest a need to a revise these standards to accommodate the specific needs of autonomous vehicle technology.
The simulation framework provided a predictive cost analysis based on the degradation rate of the retro-reflectivity over time and its impact on LDWS recognition rates. The results indicate that the most cost-effective product selection depends on the target recognition rate and specific environmental conditions, which underscores the need for a dynamic road maintenance planning process. Such findings have profound implications for transportation policy and the progression of autonomous vehicle infrastructures. They suggest a shift from traditional road maintenance methods towards adaptive strategies that meet the intricate requirements of autonomous navigation systems. Clearly, it becomes that updating the standards for road marking retro-reflectivity is not only a matter of regulatory compliance but also a critical step towards optimizing the financial and functional aspects of road infrastructure management in the era of autonomous driving.
There are limitations to consider, while our findings contribute valuable insights into LDWS performance under varying retro-reflectivity levels and weather conditions. Firstly, the specificity of the LDWS models tested may not include the full diversity of systems in use today. Each LDWS may respond differently to the conditions, and further research would be needed to generalize these results across all types of systems. Additionally, the simulated environmental conditions cannot replicate all the conditions of real-world scenarios. Factors such as the interaction with other vehicles, varying light sources, and unexpected road obstruction were not accounted for and could affect the performance of LDWS in practice. Future studies could aim to involve a broader range of LDWS technologies and more complex environmental simulations to build upon the foundation established by the present study.
5. Conclusion
In conclusion, our study not only highlights the critical influence of retro-reflectivity and adverse weather on LDWS efficiency but also underscores the need for revised road marking standards that account for the heightened requirements of autonomous vehicle systems. The identified retro-reflectivity thresholds, vital for maintaining optimal lane recognition, call for updated guidelines and advanced LDWS that can adapt to a broader spectrum of environmental variables. Additionally, our simulation framework for cost-effective road management advocates for the strategic selection of road marking products based on their performance in varied conditions, which could guide future policy and the development of more resilient autonomous driving technologies. It is essential for stakeholders, including vehicle manufacturers and road maintenance authorities, to integrate these insights into practice, fostering safer and more reliable autonomous navigation.
Author Contributions
Conceptualization, S.P. and S.M.; methodology, S.L, S.J. and J.K.; software, J.K. and S.L.; validation, S.J., S.L. and J.K.; formal analysis, Y.K. and J.K.; investigation, S.L.; resources, S.P.; data curation, S.J., J.K., and S.M.; writing—original draft preparation, S.J.; writing—review and editing, S.P. and S.M.; visualization, S.J. and J.K.; supervision, S.P. and S.M.; project administration, S.P. and S.M.; funding acquisition, S.P. and S.M. All authors have read and agreed to the published version of the manuscript.
Funding
This research was partly funded by Korea Institute of Police Technology (KIPoT) grant funded by the Korean government (KNPA) (No. 092021C26S02000, Development of Transportation Safety Infrastructure Technology for Lb.4 Connected Autonomous Driving, 60%), Basic Science Research Program through the National Research Foundation of Korea(NRF) funded by the Ministry of Education (No. RS-2023-00247958, Development of XR Cross-modal Neural Interface with Adaptive Artificial Intelligence, 39%), and INHA UNIVERSITY Research Grant (1%).
Institutional Review Board Statement
Not applicable
Informed Consent Statement
Not applicable.
Data Availability Statement
The data presented in this study are available on request from the corresponding author.
Conflicts of Interest
The authors declare that the research was conducted in the absence of any commercial or financial relationship that could be constructed as a potential conflict of interest.
References
- Zhang, J.; Si, J.; Yin, X.; Gao, Z.; Moon, Y.S.; Gong, J.; Tang, F. Lane Departure Warning Algorithm Based on Probability Statistics of Driving Habits. Soft comput 2021, 25, 13941–13948. [Google Scholar] [CrossRef]
- Jung, C.R.; Kelber, C.R. A Lane Departure Warning System Based on a Linear-Parabolic Lane Model. In Proceedings of the IEEE Intelligent Vehicles Symposium, 2004; IEEE, 2004; pp. 891–895. [Google Scholar]
- Son, J.; Yoo, H.; Kim, S.; Sohn, K. Real-Time Illumination Invariant Lane Detection for Lane Departure Warning System. Expert Syst Appl 2015, 42, 1816–1824. [Google Scholar] [CrossRef]
- Haris, M.; Hou, J.; Wang, X. Lane Line Detection and Departure Estimation in a Complex Environment by Using an Asymmetric Kernel Convolution Algorithm. Vis Comput 2023, 39, 519–538. [Google Scholar] [CrossRef]
- Anbalagan, S.; Srividya, P.; Thilaksurya, B.; Senthivel, S.G.; Suganeshwari, G.; Raja, G. Vision-Based Ingenious Lane Departure Warning System for Autonomous Vehicles. Sustainability 2023, 15, 3535. [Google Scholar] [CrossRef]
- Wu, J.; Chen, X.; Bie, Y.; Zhou, W. A Co-Evolutionary Lane-Changing Trajectory Planning Method for Automated Vehicles Based on the Instantaneous Risk Identification. Accid Anal Prev 2023, 180, 106907. [Google Scholar] [CrossRef] [PubMed]
- Sultana, S.; Ahmed, B.; Paul, M.; Islam, M.R.; Ahmad, S. Vision-Based Robust Lane Detection and Tracking in Challenging Conditions. IEEE Access 2023. [Google Scholar] [CrossRef]
- Dewangan, D.K.; Sahu, S.P. Towards the Design of Vision-Based Intelligent Vehicle System: Methodologies and Challenges. Evol Intell 2023, 16, 759–800. [Google Scholar] [CrossRef]
- Ghanem, S.; Kanungo, P.; Panda, G.; Satapathy, S.C.; Sharma, R. Lane Detection under Artificial Colored Light in Tunnels and on Highways: An IoT-Based Framework for Smart City Infrastructure. Complex & Intelligent Systems 2023, 9, 3601–3612. [Google Scholar]
- Pagale, M.; Mulik, S.; Purohit, R.; Thakare, A.; Hanchate, R.; Jadhav, S. Design and Implementation of Lane Detection Using Hough Transformation. In Proceedings of the 2023 2nd International Conference on Applied Artificial Intelligence and Computing (ICAAIC); IEEE, 2023; pp. 927–932. [Google Scholar]
- Malligere Shivanna, V.; Guo, J.-I. Object Detection, Recognition, and Tracking Algorithms for ADASs—A Study on Recent Trends. Sensors 2023, 24, 249. [Google Scholar] [CrossRef] [PubMed]
- Dilek, E.; Dener, M. Computer Vision Applications in Intelligent Transportation Systems: A Survey. Sensors 2023, 23, 2938. [Google Scholar] [CrossRef] [PubMed]
- Hadi, M.; Sinha, P.; Easterling IV, J.R. Effect of Environmental Conditions on Performance of Image Recognition-Based Lane Departure Warning System. Transp Res Rec 2007, 2000, 114–120. [Google Scholar] [CrossRef]
- Manual for Installing and Managing Traffic Road Markings. Korea National Police Agency 2020.
Figure 1.
LDWS testing environment and procedure. A) shows the real test track with a shielded section for weather simulation. B) The diagram illustrates the test setup where a vehicle equipped with LDWS accelerates to 60 km/h and performs a lane departure at a pre-defined lateral angle. The vehicle starts 100 meters outside of the shielded area for acceleration and then enters a 100-meter section inside the shield, where the lane departure is executed.
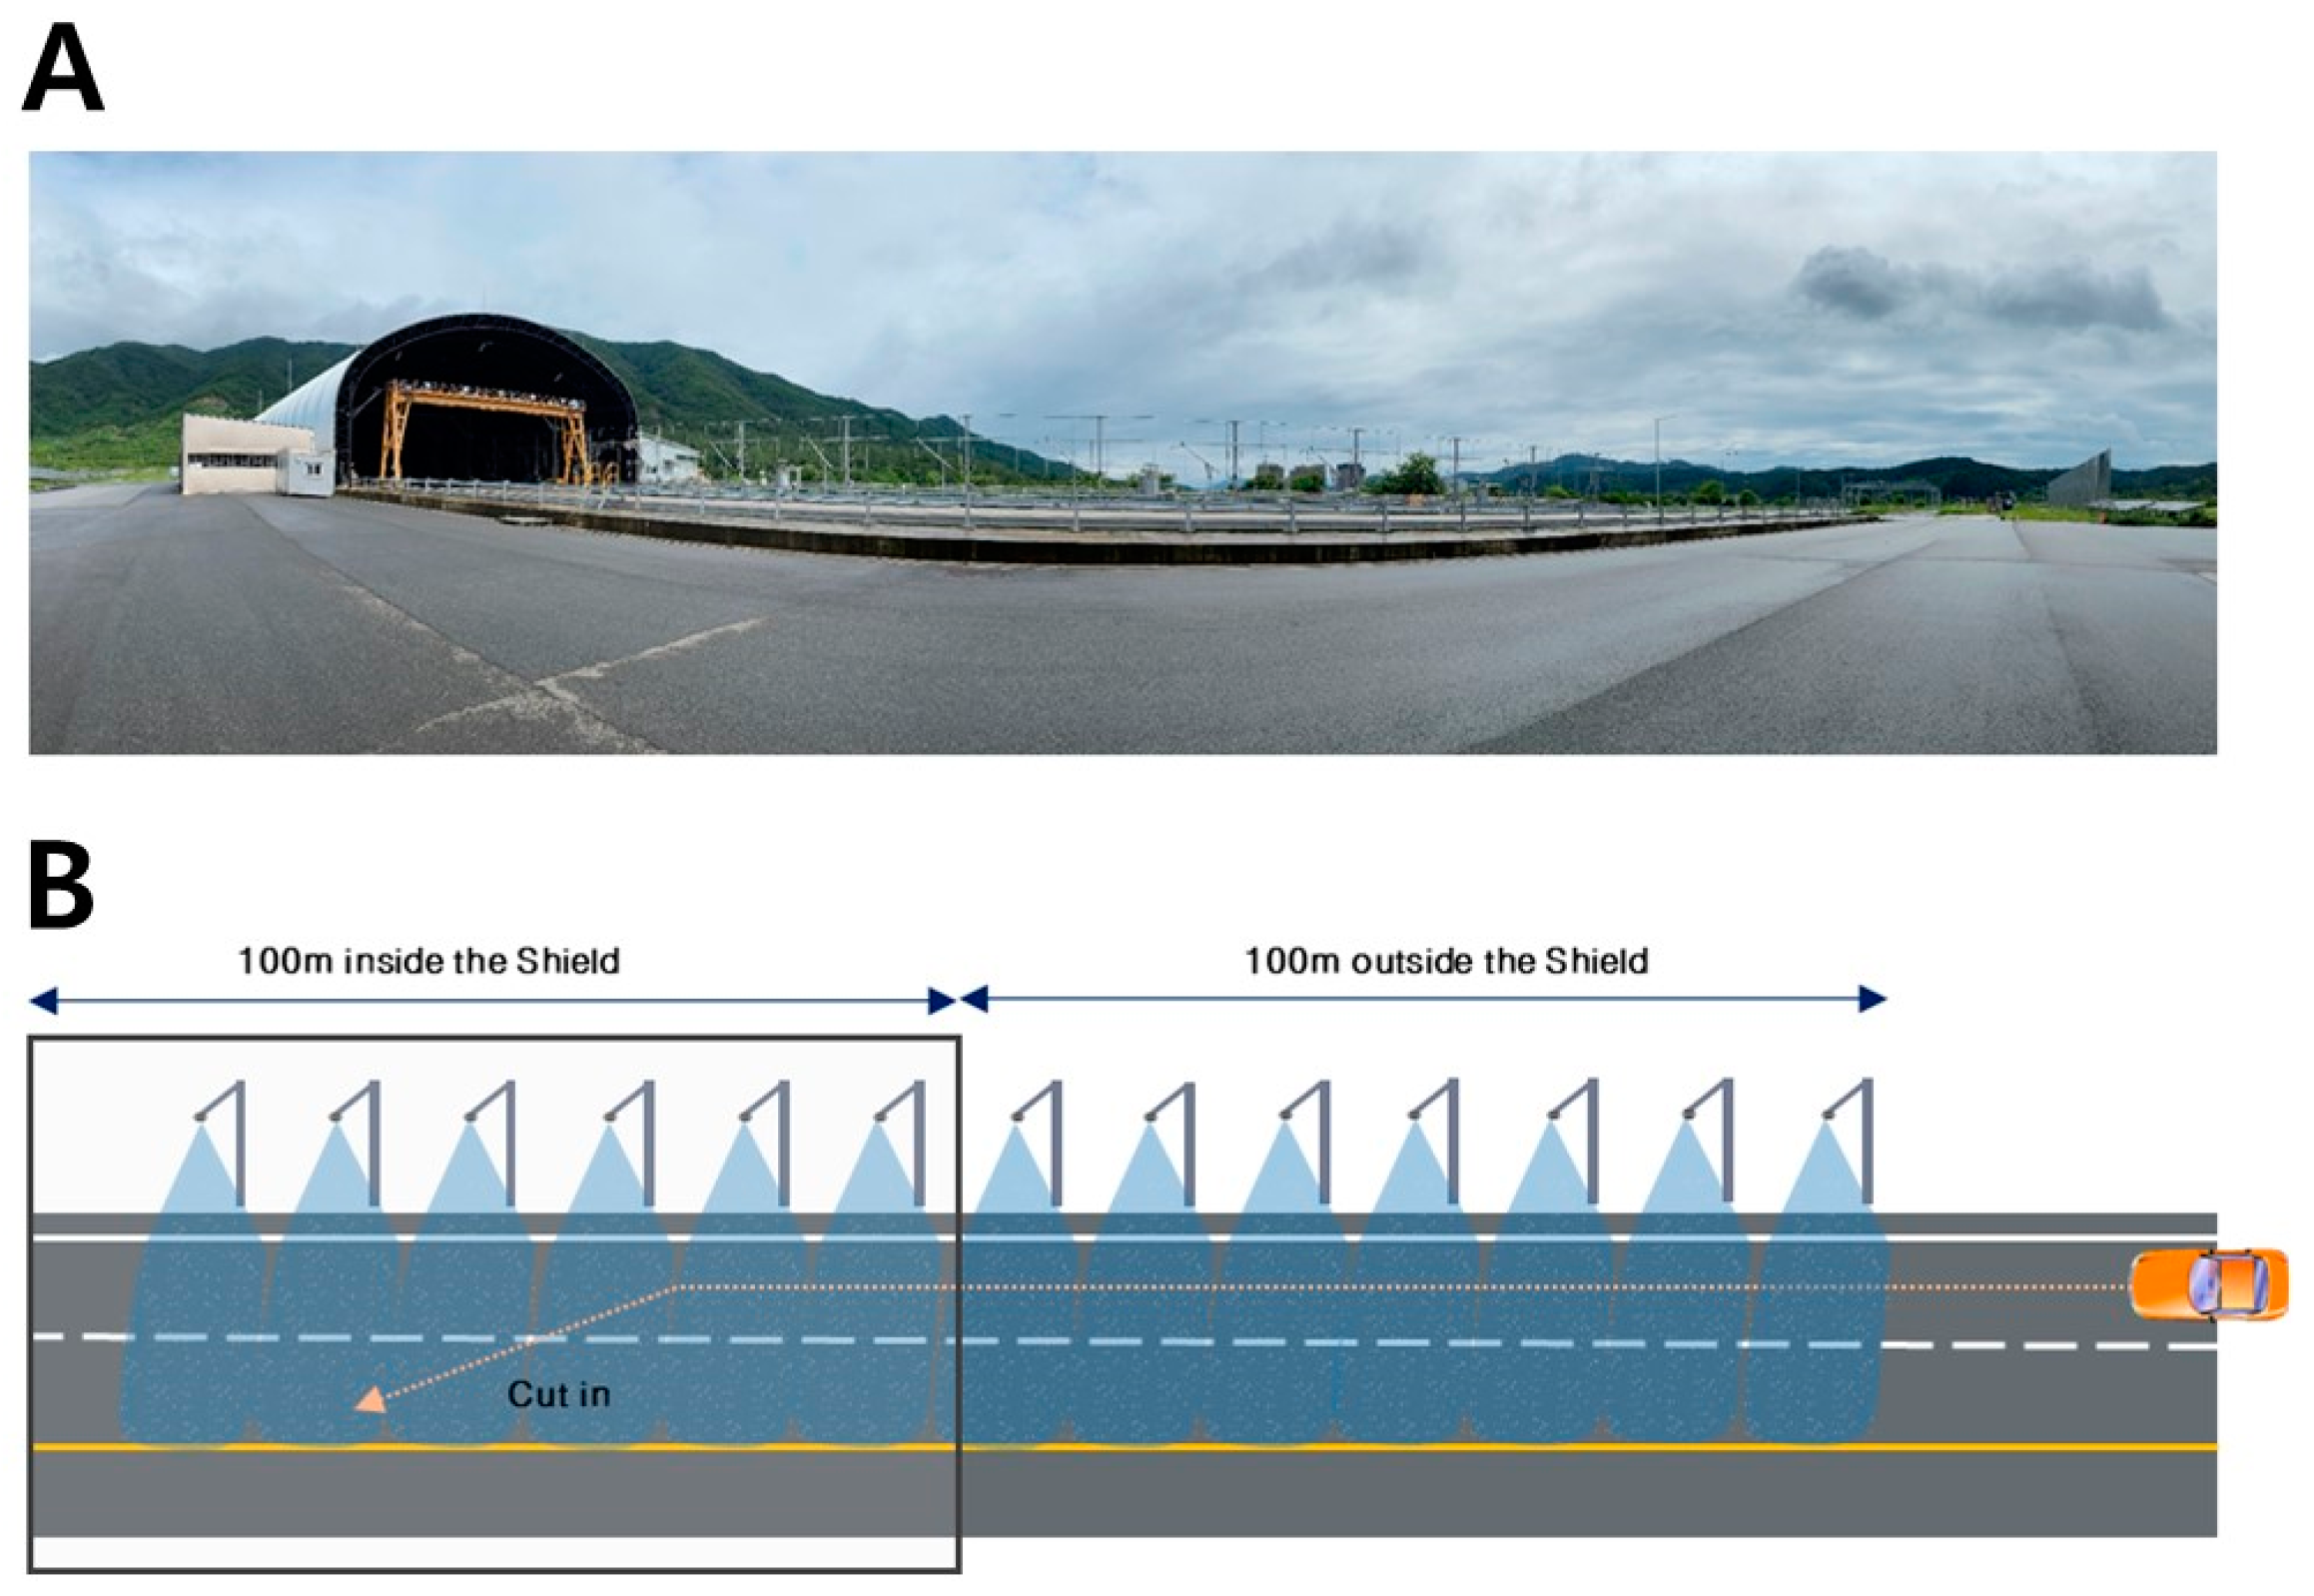
Figure 2.
Weather simulation equipment for LDWS testing. A) Fog generation system used to replicate various visibility conditions for assessing LDWS functionality. B) Rain simulation setup designed to create different intensities of rainfall to evaluate the impact on LDWS performance.
Figure 2.
Weather simulation equipment for LDWS testing. A) Fog generation system used to replicate various visibility conditions for assessing LDWS functionality. B) Rain simulation setup designed to create different intensities of rainfall to evaluate the impact on LDWS performance.
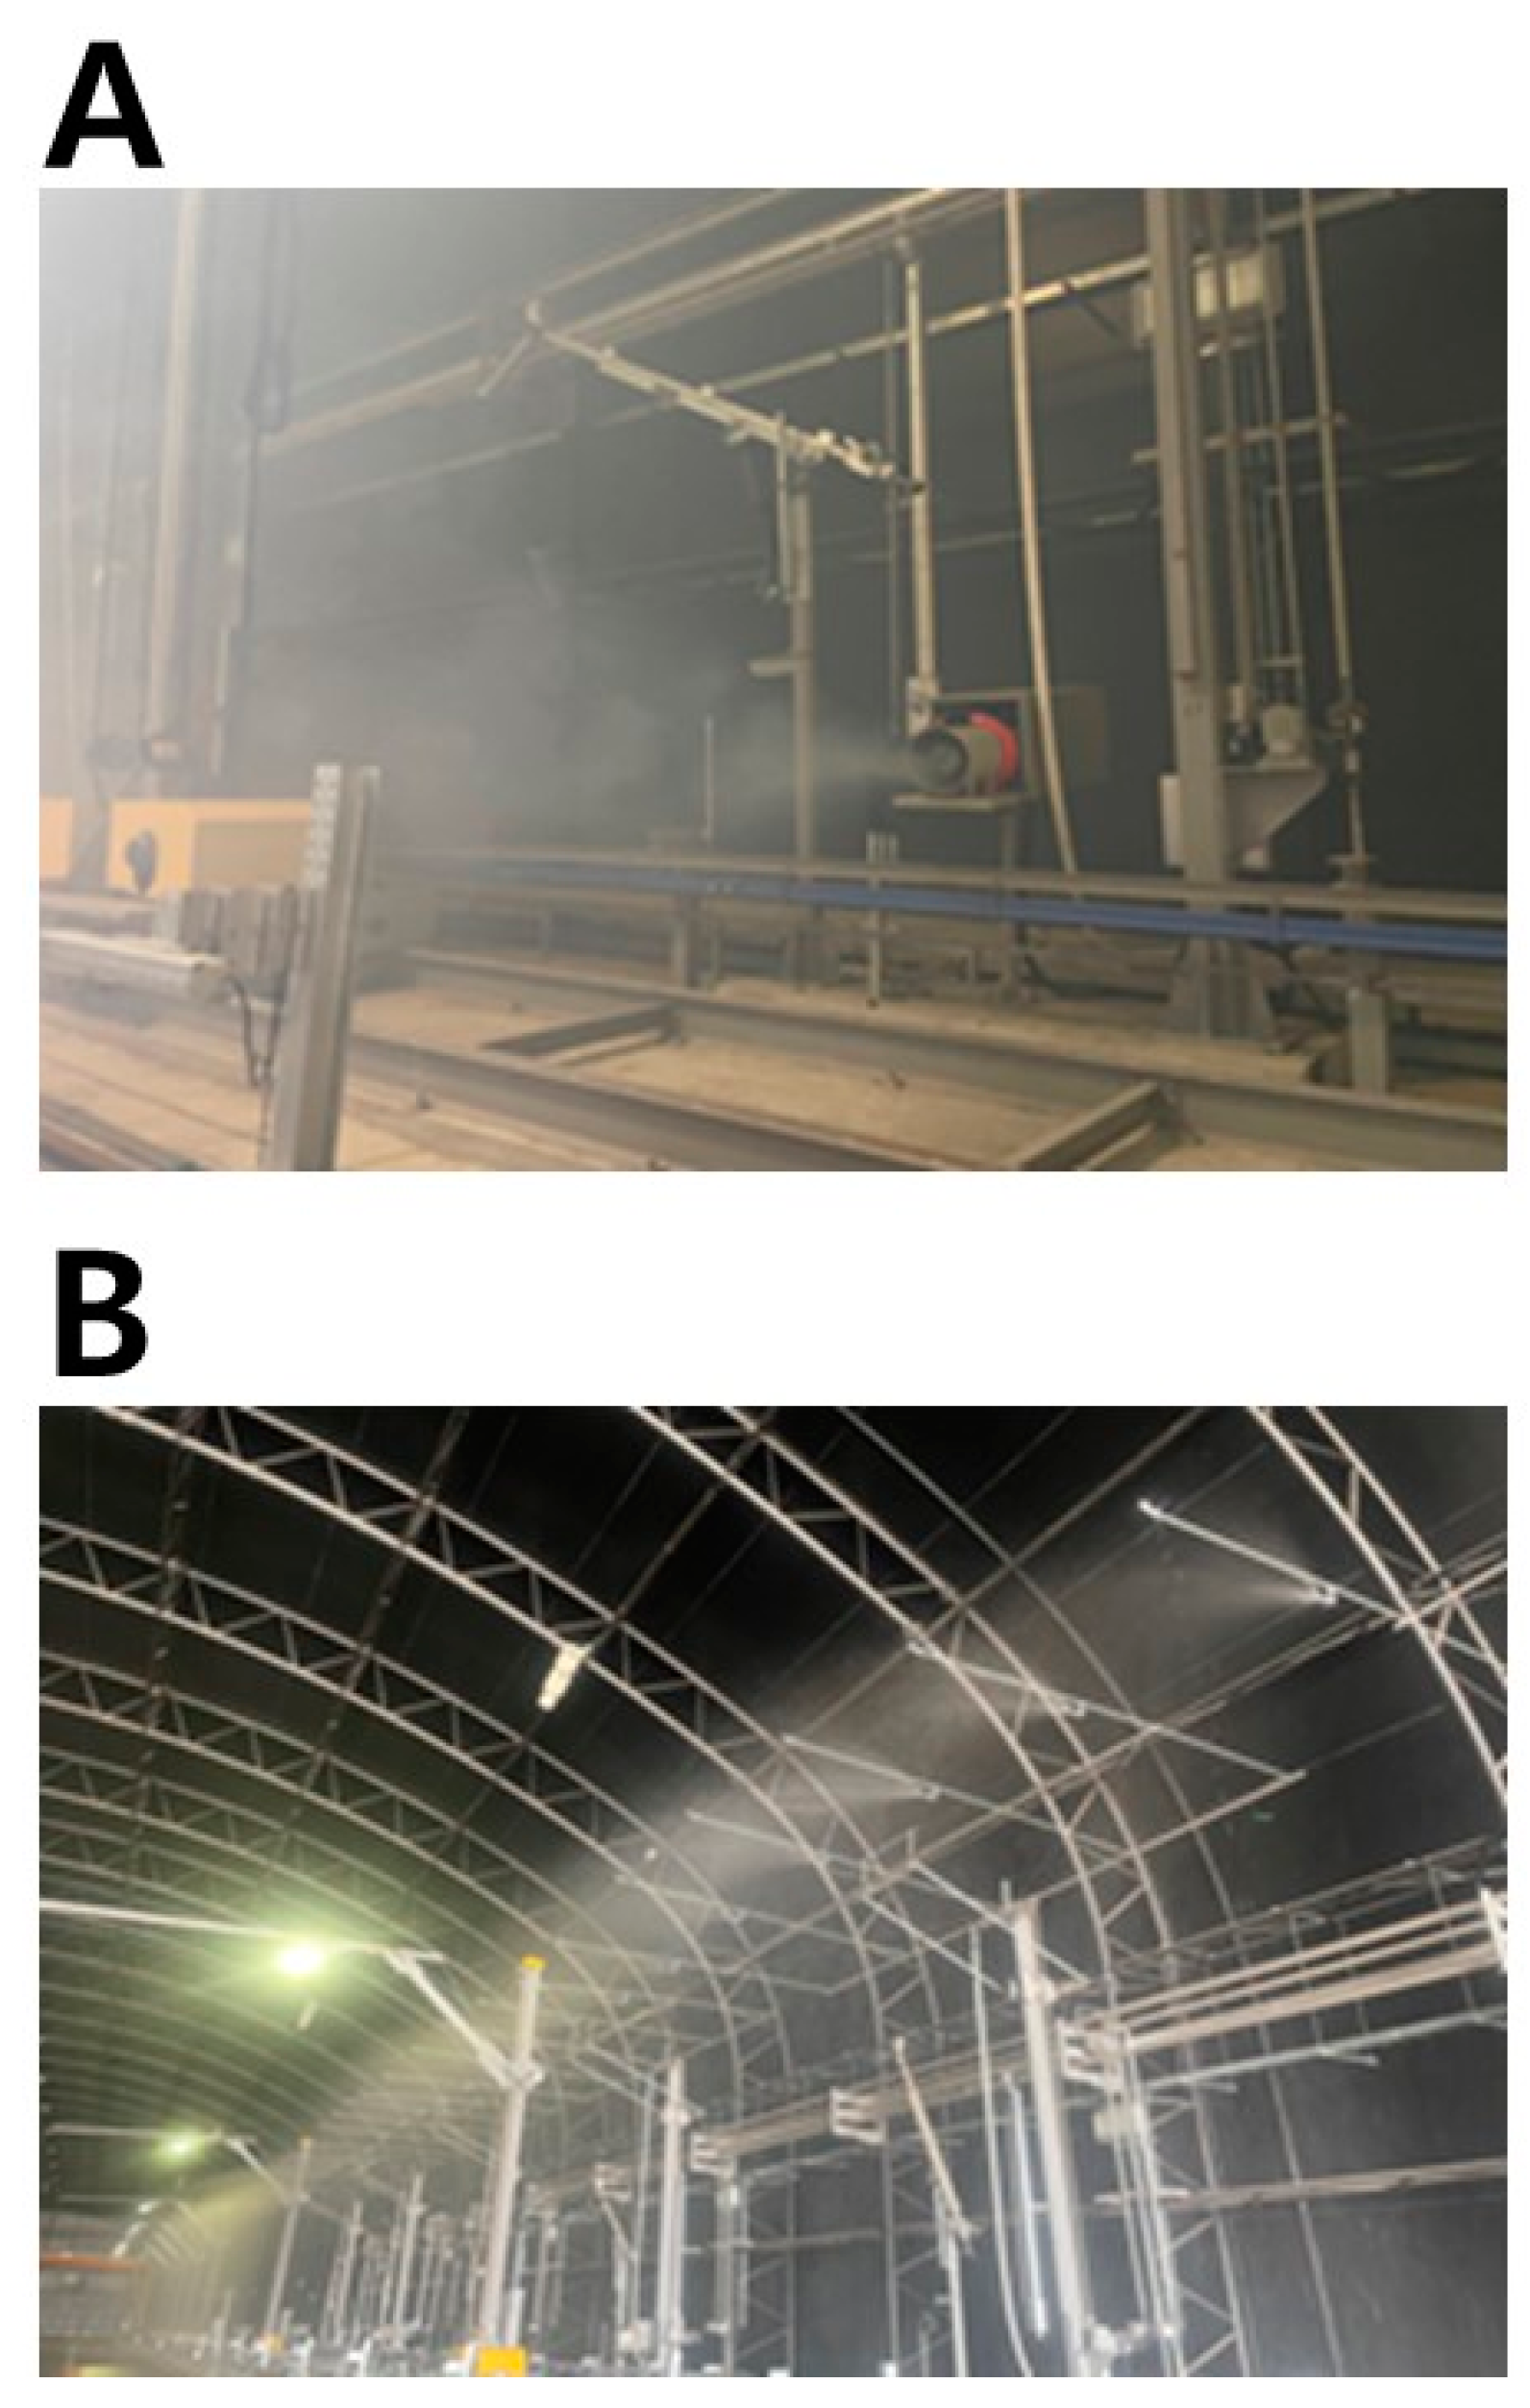
Figure 3.
Road marking application (A), abrasion process (B), and retro-reflectivity measurement (C) for preliminary test.
Figure 3.
Road marking application (A), abrasion process (B), and retro-reflectivity measurement (C) for preliminary test.
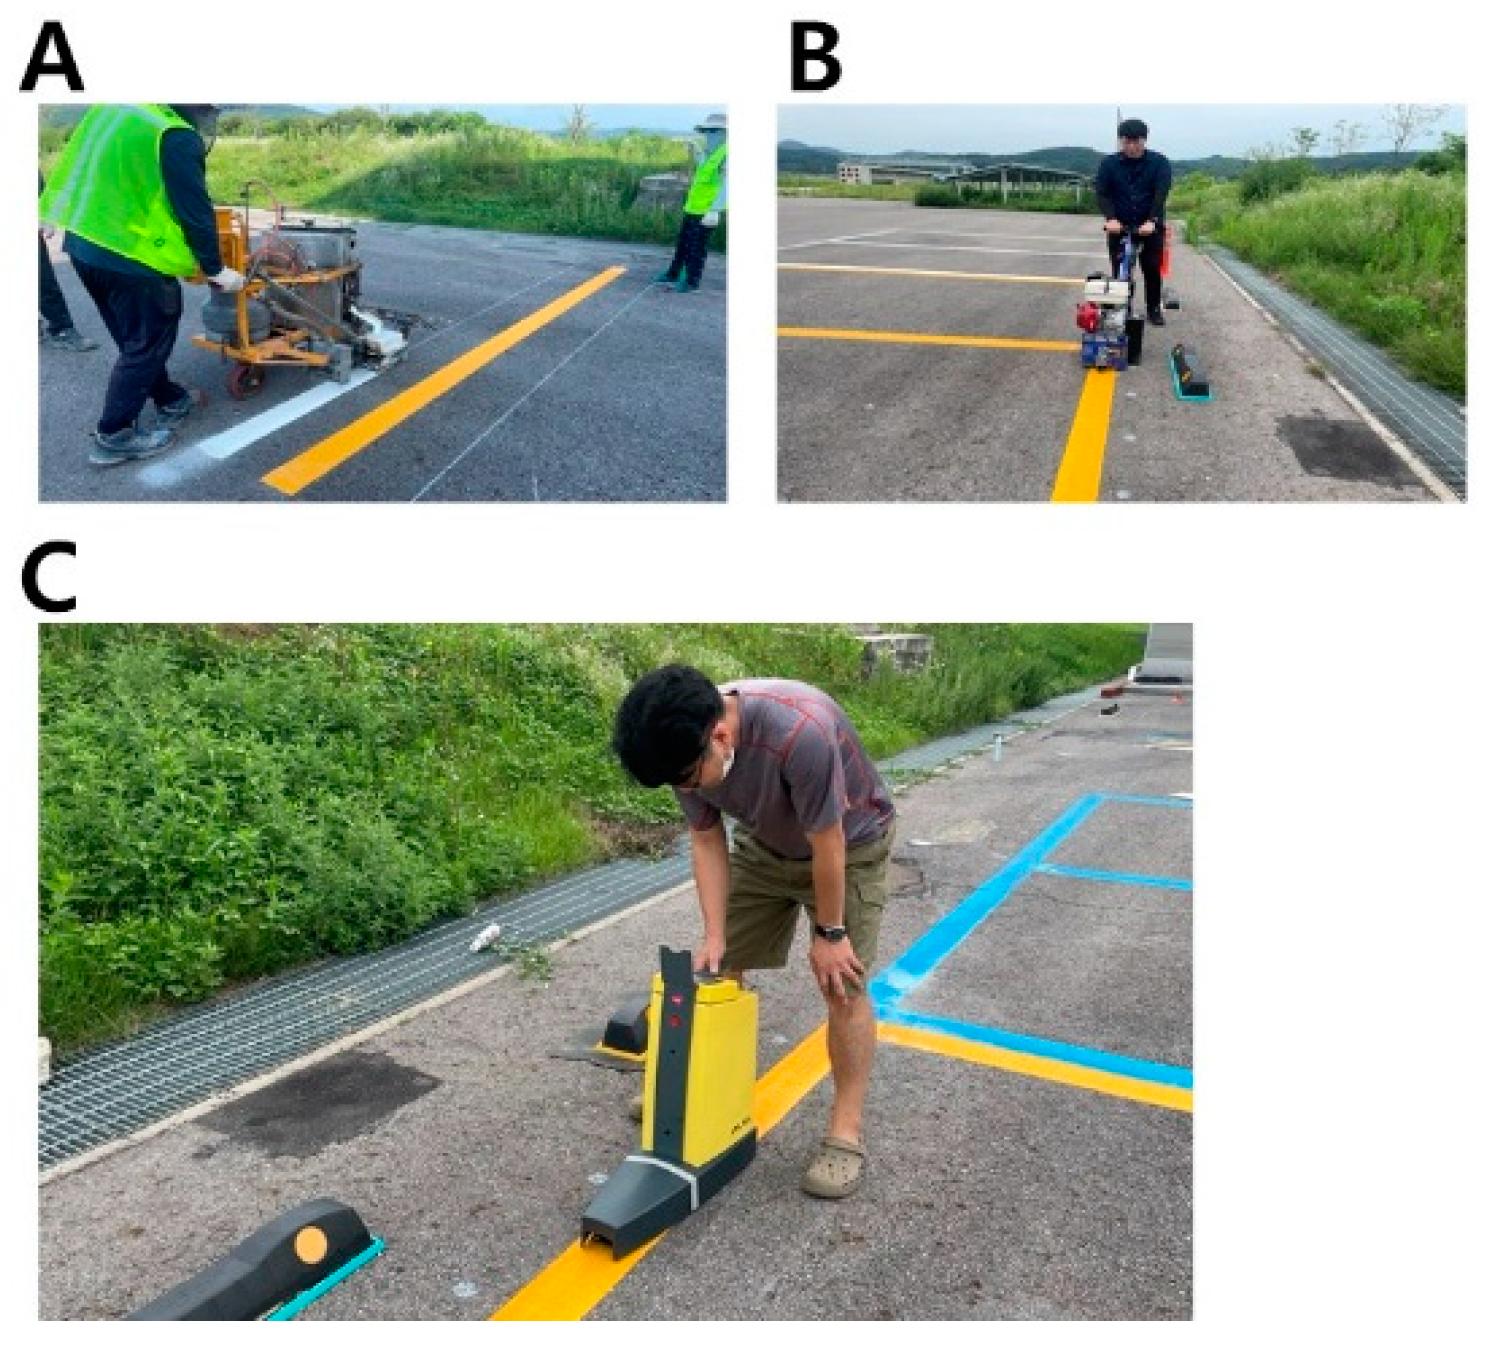
Figure 4.
Preliminary test results on retro-reflectivity coefficients variation by grinding frequency. This figure illustrates the diminishing retro-reflectivity coefficients of white (A), yellow (B), and blue (C) lane markings as a function of grinding frequency. The x-axis represents the abrasion stages, while the y-axis measures the retro-reflective coefficients. In all colors, the lane markings exhibit a consistent decline in retro-reflectivity in response to successive grinding stages.
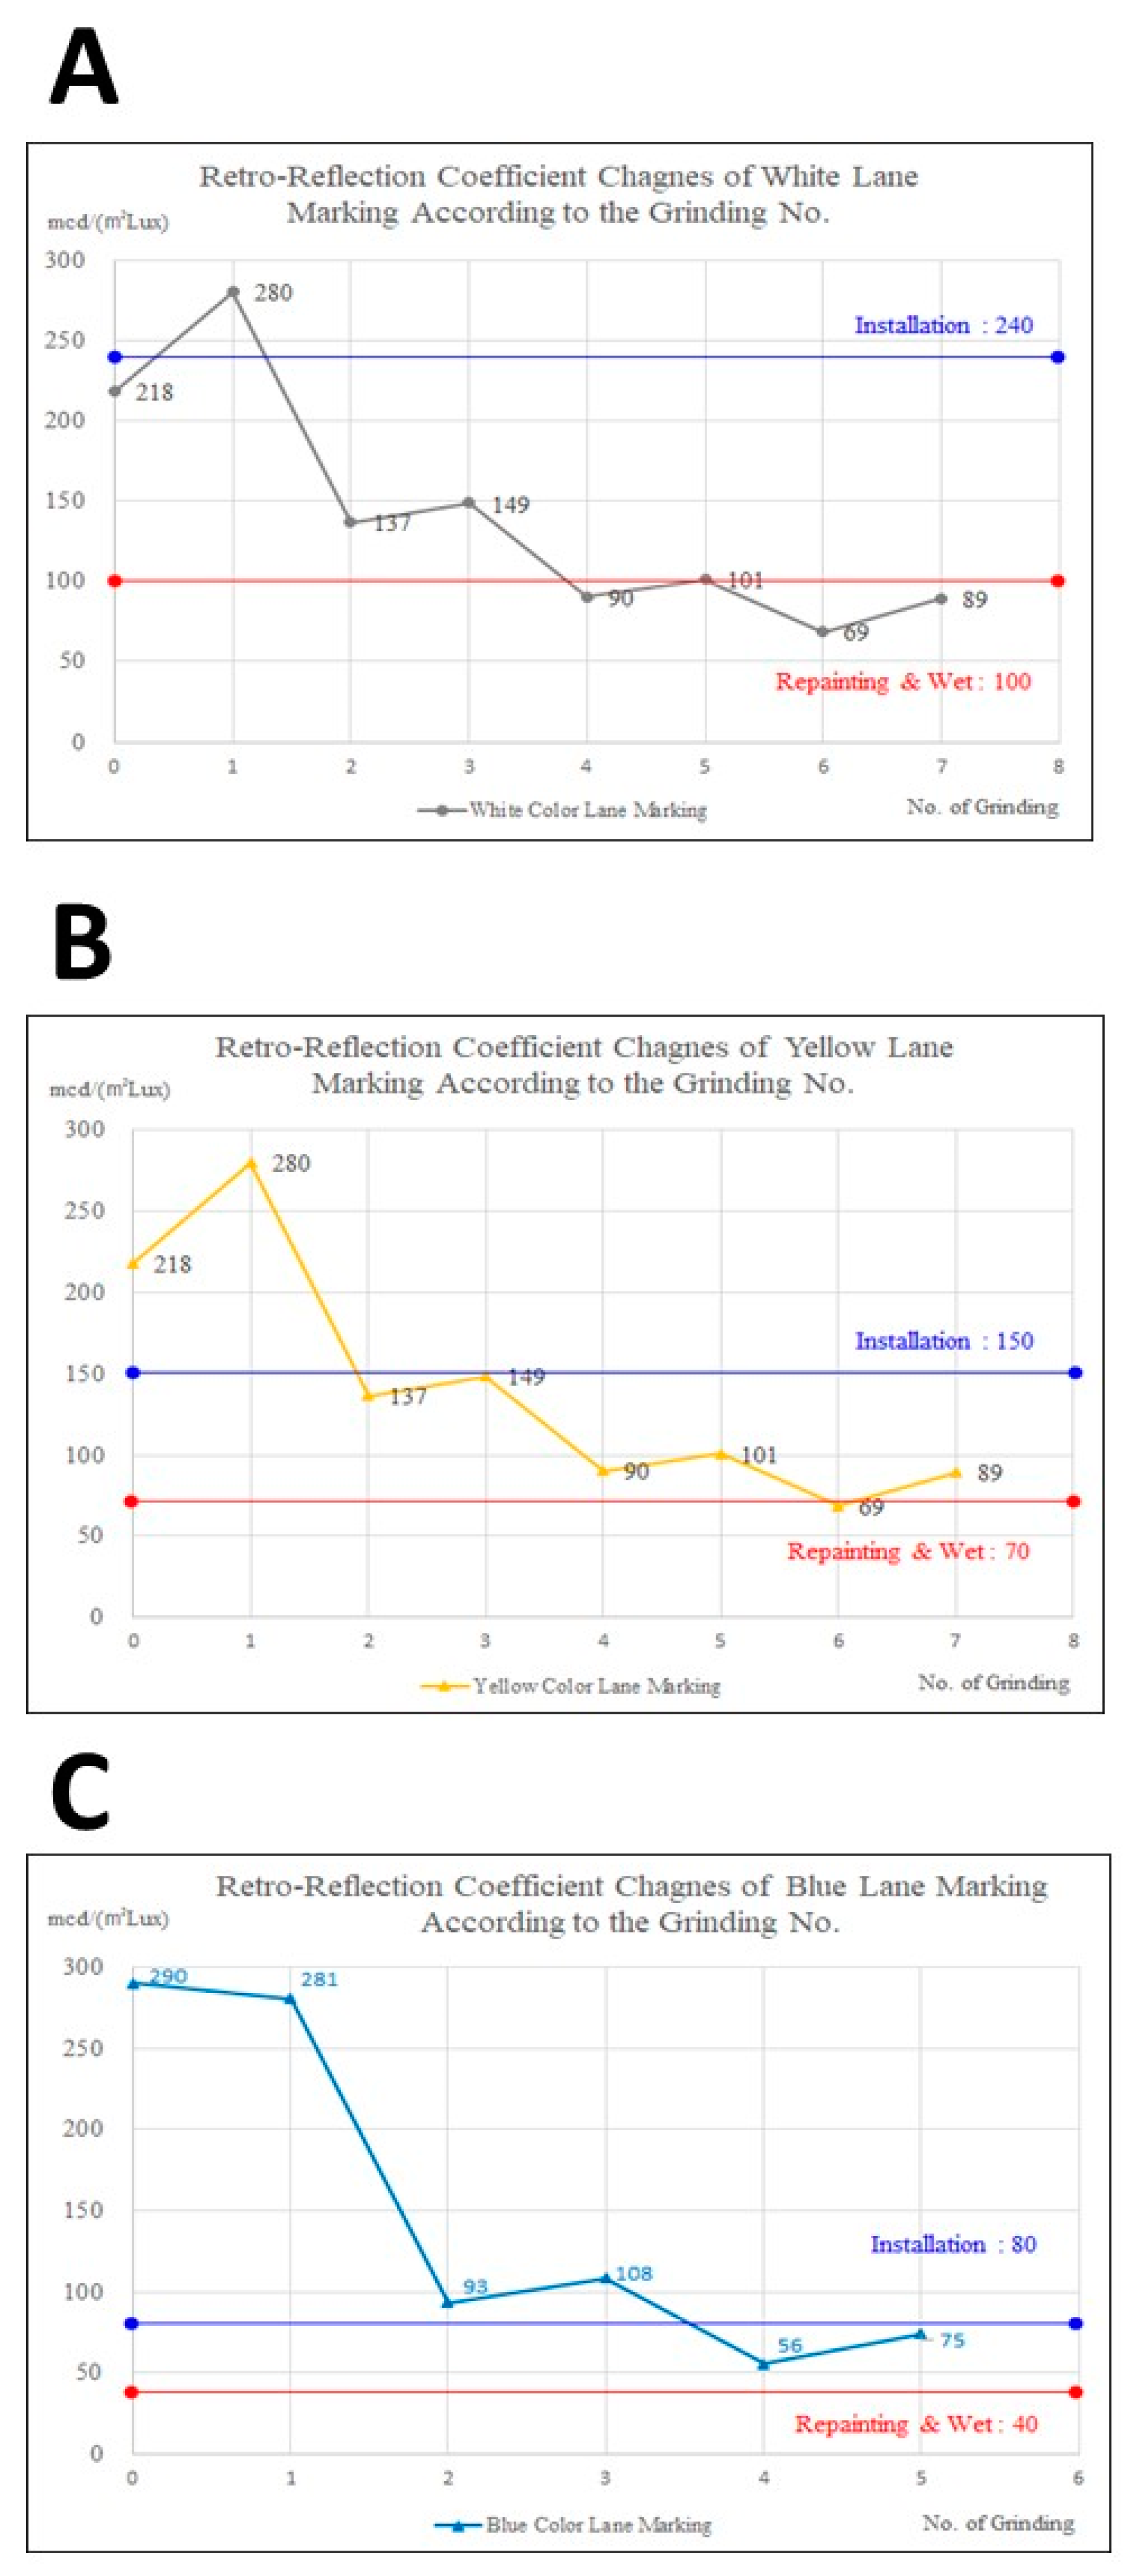
Figure 5.
Trend between LDWS recognition rate and retro-reflectivity under the condition of 40 mm/h rainfall intensity and no additional lighting. The red curve line represents the fitted non-linear regression model (), where the hyperparameter is optimized through a grid search in the range [0, 2] to achieve the maximum r2 statistics.
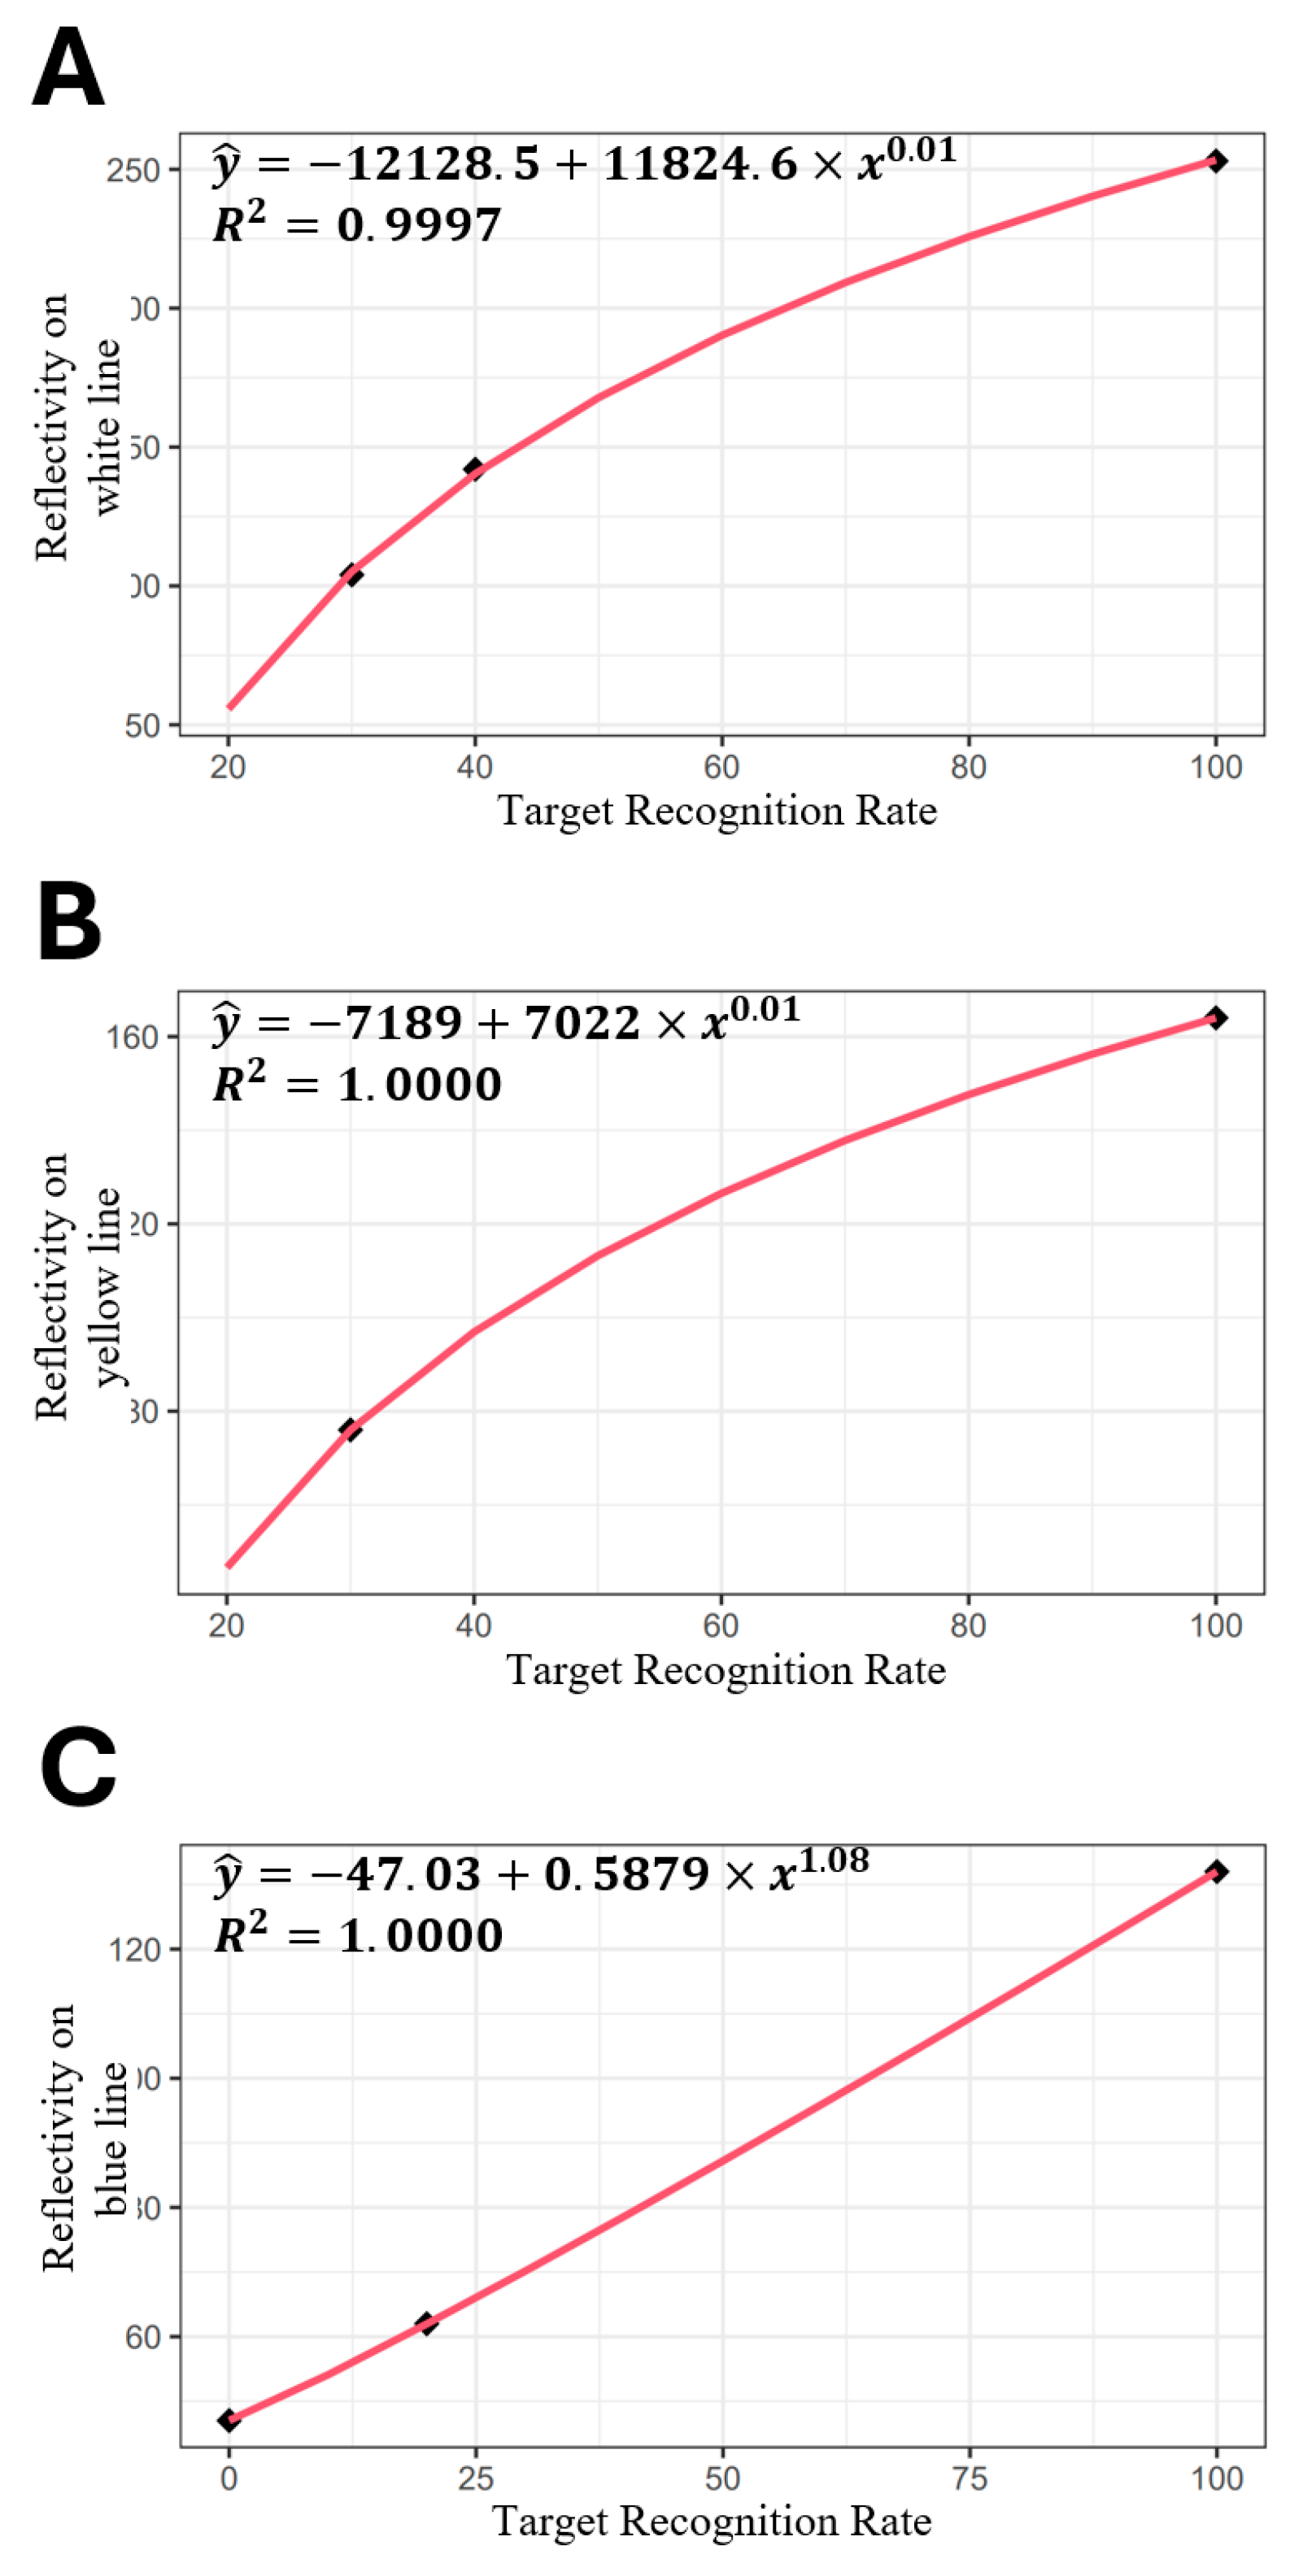
Figure 6.
Comparative analysis of total costs for three alternative road marking products () across a range of target recognition rates. The simulation conditions are set to a rainfall intensity of 40 mm/h and the absence of additional lighting.
Figure 6.
Comparative analysis of total costs for three alternative road marking products () across a range of target recognition rates. The simulation conditions are set to a rainfall intensity of 40 mm/h and the absence of additional lighting.
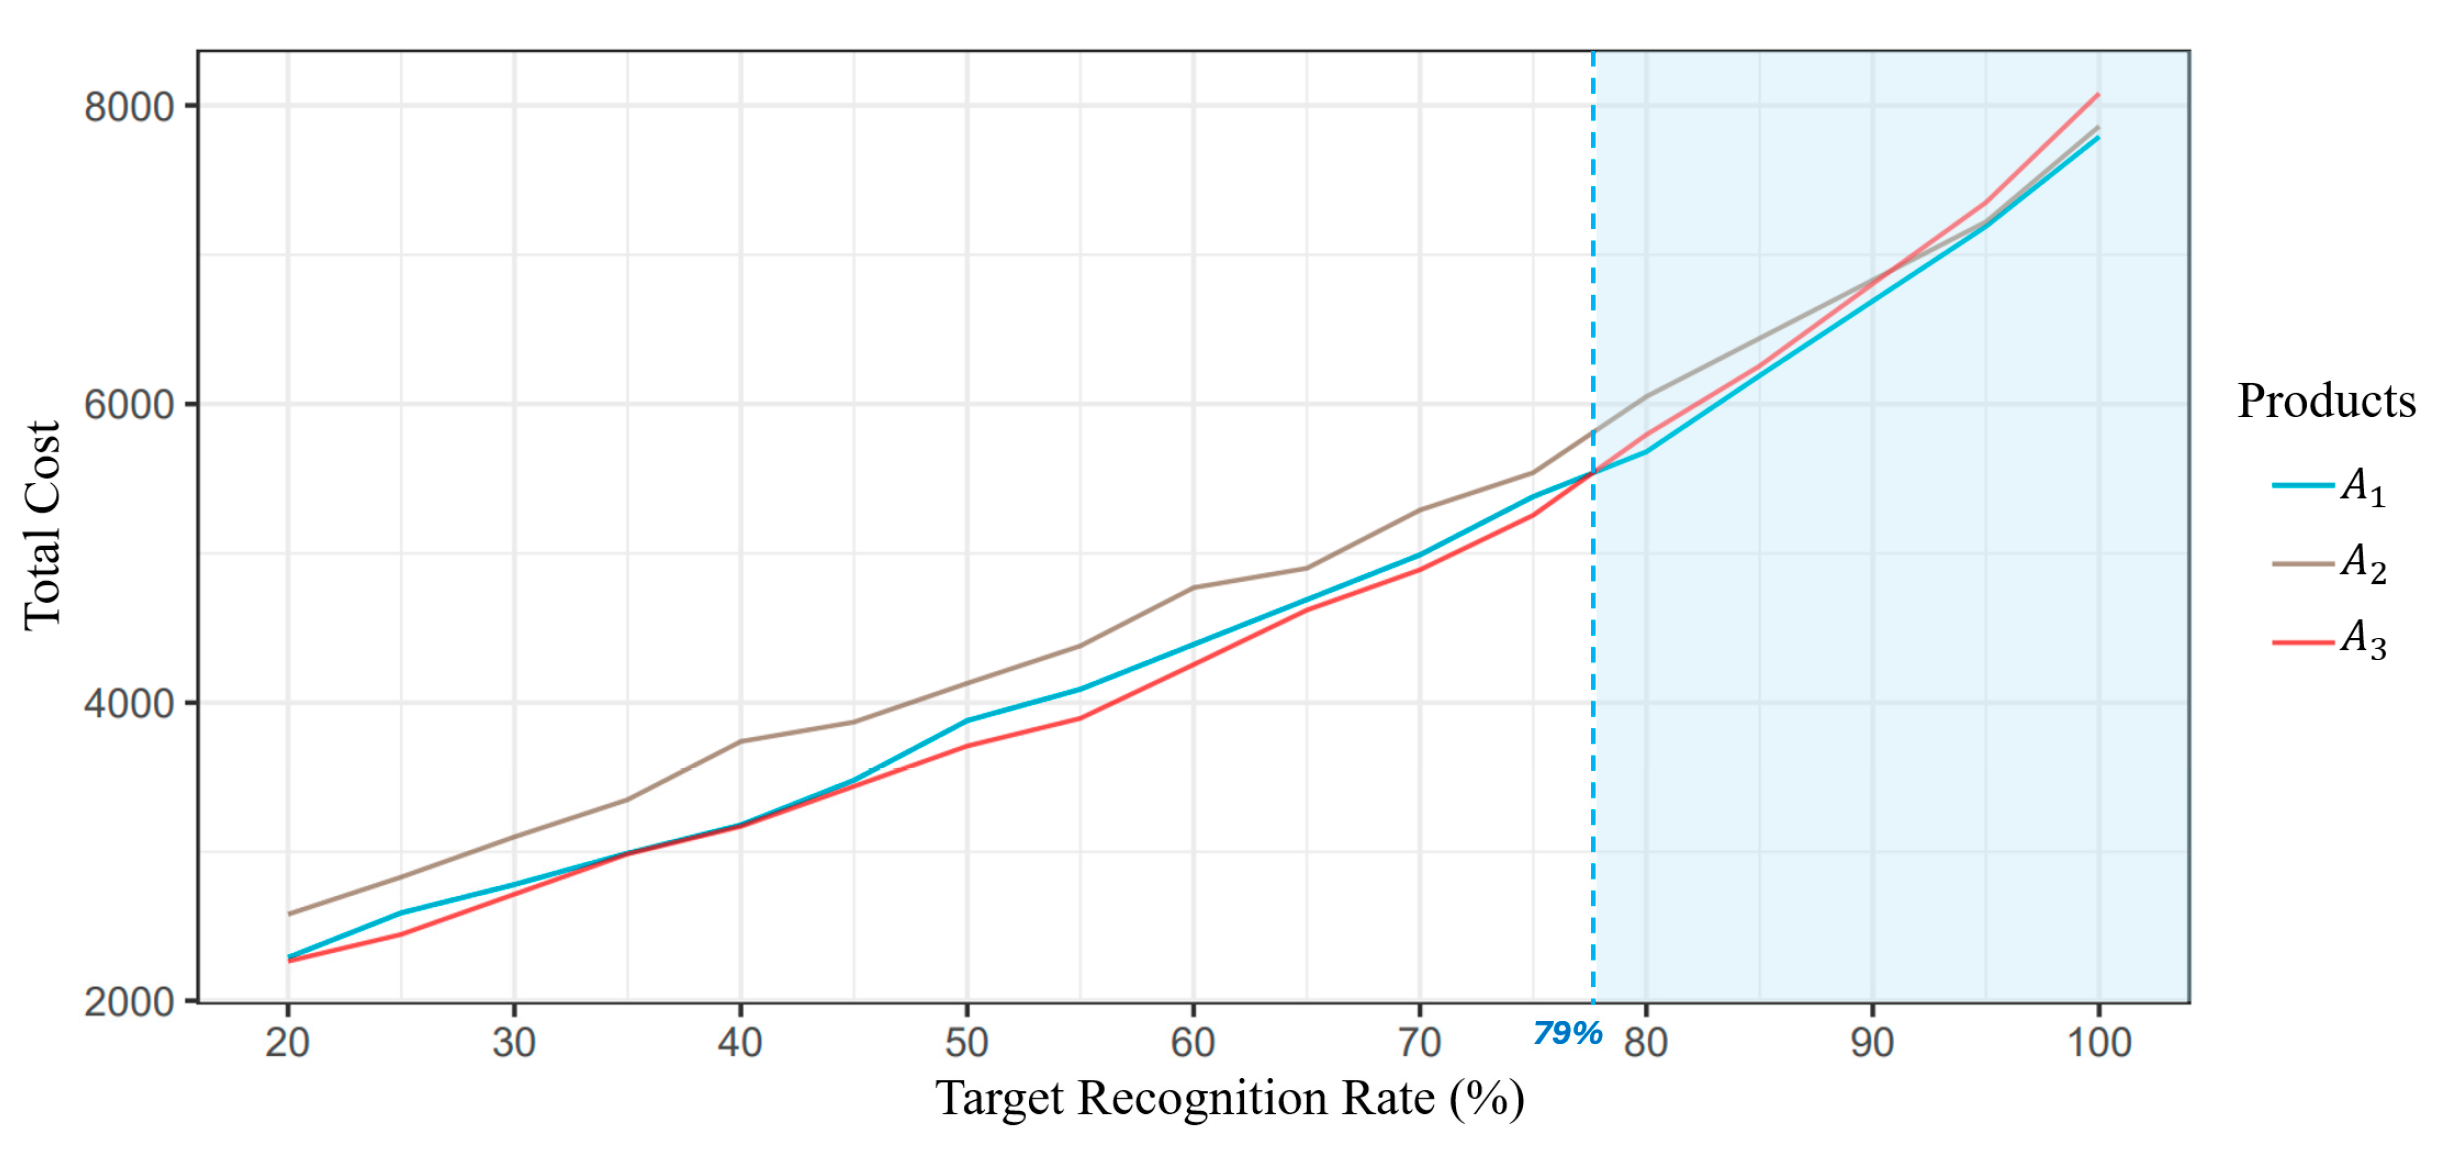
Figure 7.
Cost comparison among three alternative road marking products () at target recognition rates of 60%, 70%, and 80%, under various luminance and weather conditions. The graph illustrates the efficiency of each product, with lower total costs indicating more cost-effective alternatives.
Figure 7.
Cost comparison among three alternative road marking products () at target recognition rates of 60%, 70%, and 80%, under various luminance and weather conditions. The graph illustrates the efficiency of each product, with lower total costs indicating more cost-effective alternatives.
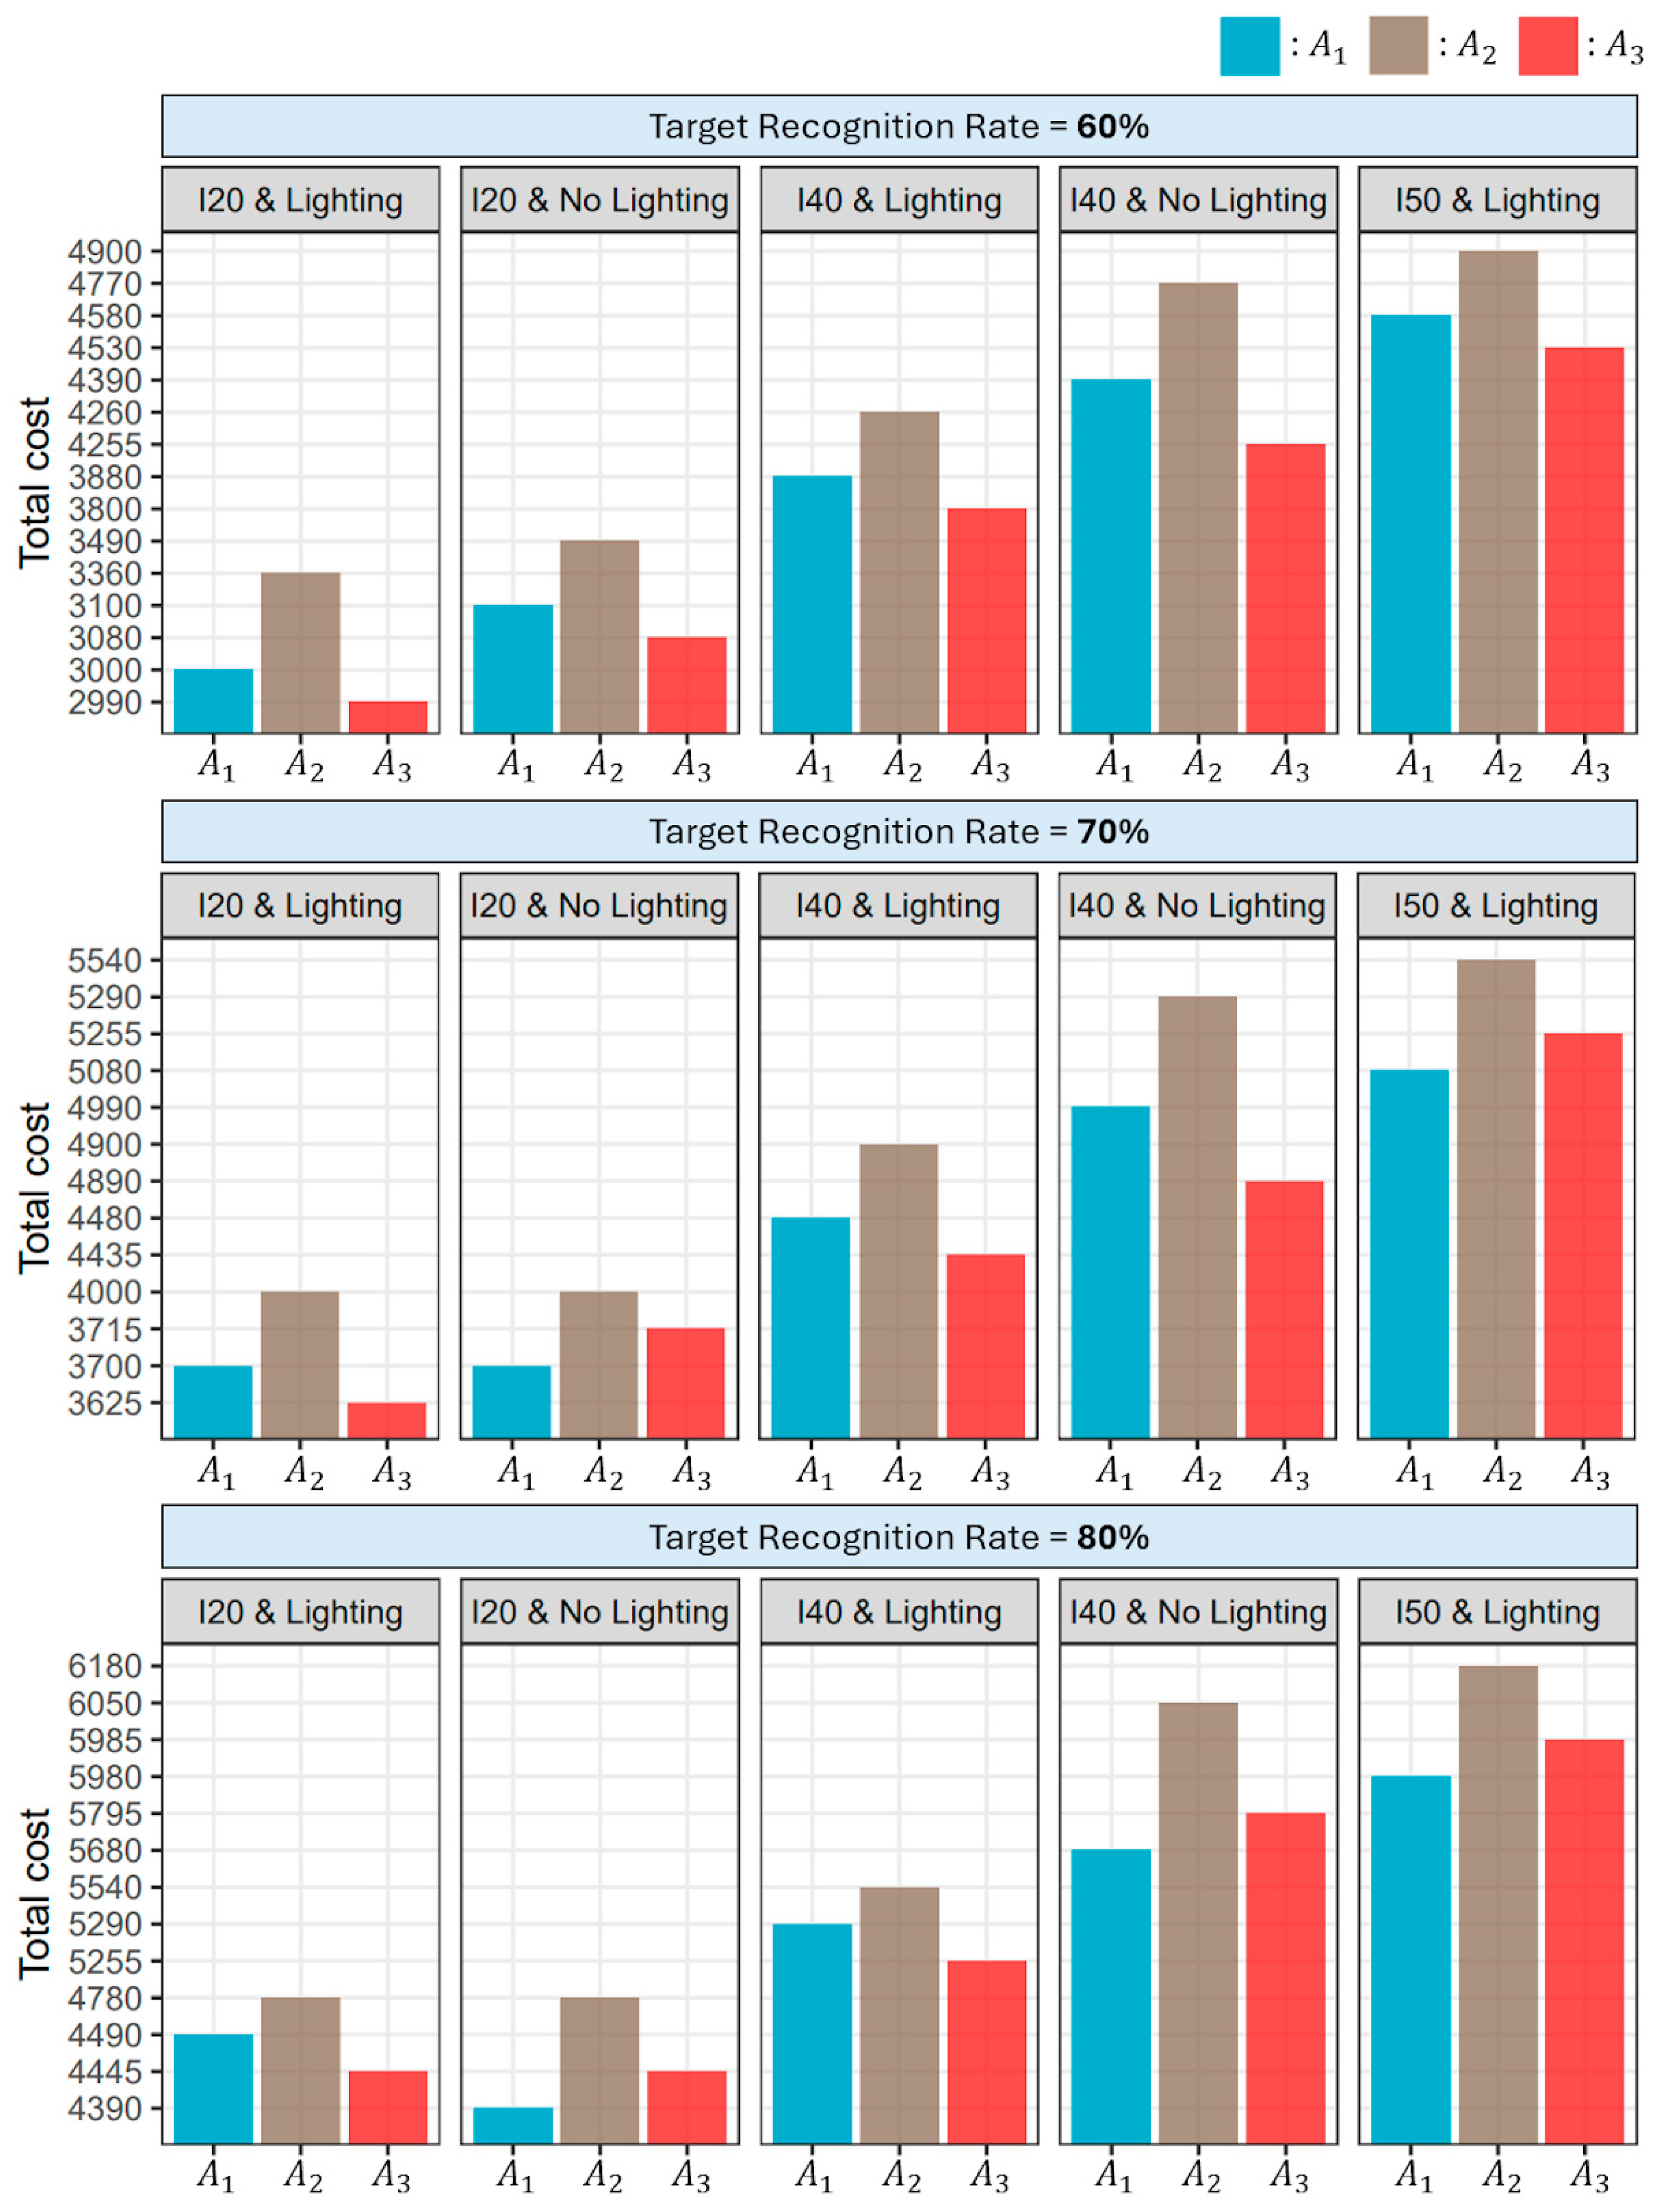
Table 1.
Retro-reflectivity standards for road markings (Manual for installation and management of traffic road markings, Korea National Police Agency, 2020).
Table 1.
Retro-reflectivity standards for road markings (Manual for installation and management of traffic road markings, Korea National Police Agency, 2020).
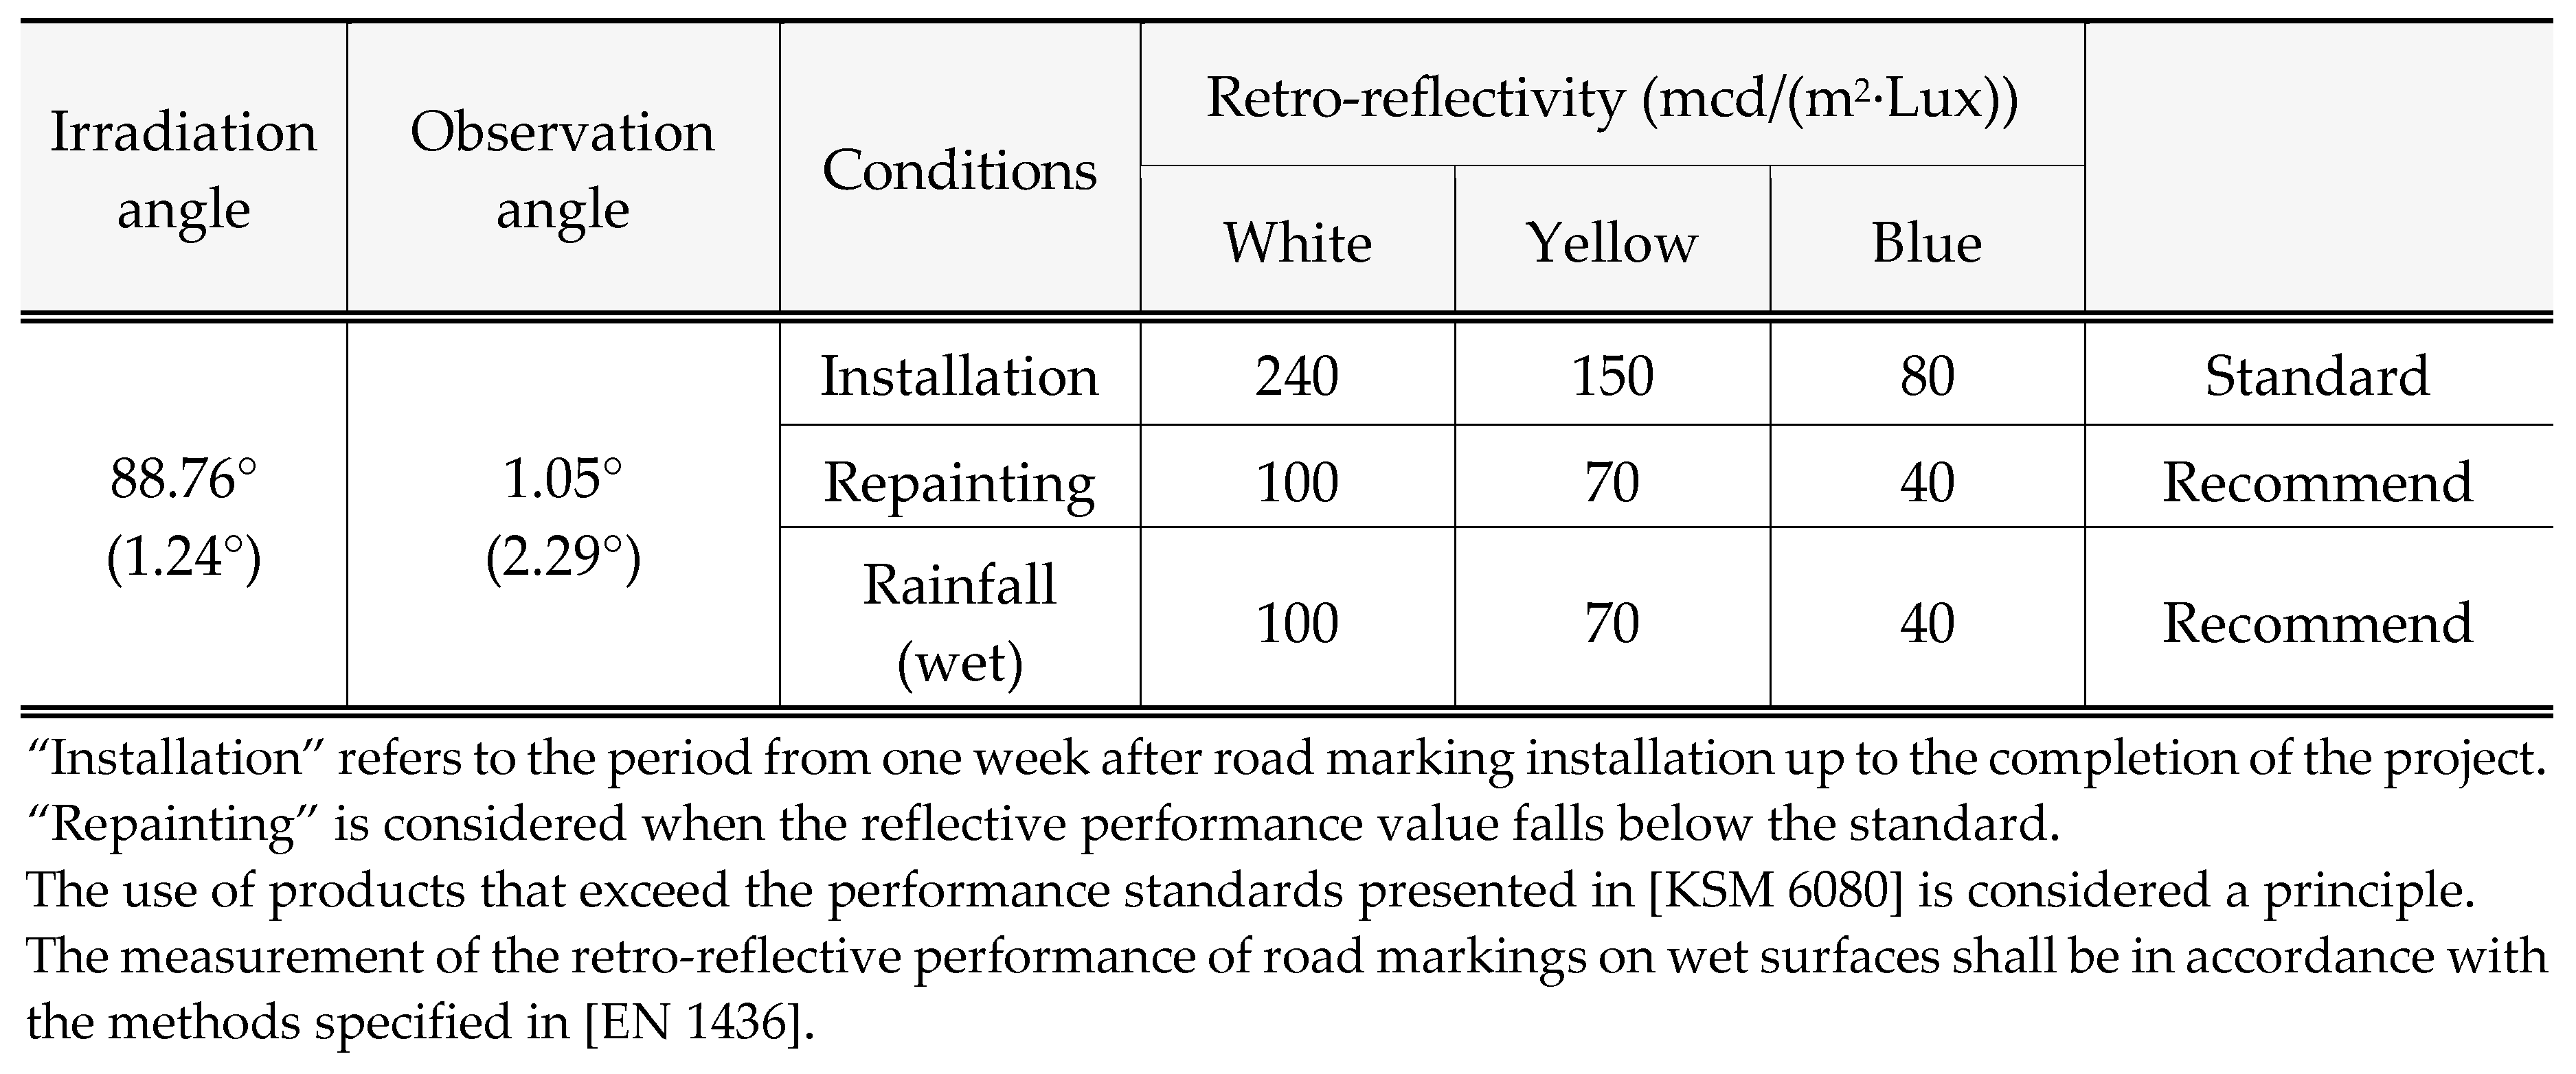
Table 2.
Evaluation parameters for LDWS performance testing.
| Parameters | Conditions |
|---|---|
| Road marking color | White, yellow, and blue |
| Road marking wearing (grinding frequency) |
No grinding, 2 grindings, 4 grindings, and 8 grindings |
| Luminance | Daytime, nighttime (road lighting on & vehicle lighting on), and nighttime (road lighting off & vehicle lighting on) |
| Weather conditions | Normal (dry), wet, rainfall (20 mm/h), rainfall (40 mm/h), fog low visibility (below 50m), and fog high visibility (below 100m) |
Table 3.
Measured retro-reflectivity coefficients as a function of grinding frequency for the experiment (Unit: mcd/(m2∙LUX)).
Table 3.
Measured retro-reflectivity coefficients as a function of grinding frequency for the experiment (Unit: mcd/(m2∙LUX)).
| Color | Initial | 2 Grindings | 4 Grindings | 8 Grindings |
|---|---|---|---|---|
| White | 365 | 253 | 142 | 104 |
| Yellow | 200 | 164 | 76 | - |
| Blue | 212 | 132 | 62 | 47 |
Table 5.
LDWS recognition rate for white road markings during nighttime (Average of 10 trials, unit: %).
Table 5.
LDWS recognition rate for white road markings during nighttime (Average of 10 trials, unit: %).
| 365 mcd/(㎡Lux) |
253 mcd/(㎡Lux) |
142 mcd/(㎡Lux) |
104 mcd/(㎡Lux) |
|
|---|---|---|---|---|
| Dry & Lighting | 100 | 100 | 100 | 100 |
| Dry & No Lighting | 100 | 100 | 100 | 100 |
| Wet & Lighting | 100 | 100 | 90 | 90 |
| Wet & No Lighting | 100 | 100 | 90 | 90 |
| I=20(㎜/h) & Lighting | 100 | 100 | 70 | 60 |
| I=20(㎜/h) & No Lighting | 100 | 100 | 70 | 50 |
| I=40(㎜/h) & Lighting | 100 | 100 | 50 | 40 |
| I=40(㎜/h) & No Lighting | 100 | 100 | 40 | 30 |
| I=50(㎜/h) & Lighting | 100 | 100 | 40 | 20 |
| I = rainfall intensity | ||||
Table 6.
LDWS recognition rate for yellow road markings during nighttime (Average of 10 trials, unit: %).
Table 6.
LDWS recognition rate for yellow road markings during nighttime (Average of 10 trials, unit: %).
| 200 mcd/(㎡Lux) |
164 mcd/(㎡Lux) |
76 mcd/(㎡Lux) |
|
|---|---|---|---|
| Dry & Lighting | 100 | 100 | 100 |
| Dry & No Lighting | 100 | 100 | 100 |
| Wet & Lighting | 100 | 100 | 90 |
| Wet & No Lighting | 100 | 100 | 90 |
| I=20(㎜/h) & Lighting | 100 | 100 | 50 |
| I=20(㎜/h) & No Lighting | 100 | 100 | 50 |
| I=40(㎜/h) & Lighting | 100 | 100 | 40 |
| I=40(㎜/h) & No Lighting | 100 | 100 | 30 |
| I=50(㎜/h) & Lighting | 100 | 100 | 20 |
| I = rainfall intensity | |||
Table 7.
LDWS recognition rate for blue road markings during nighttime (Average of 10 trials, unit: %).
Table 7.
LDWS recognition rate for blue road markings during nighttime (Average of 10 trials, unit: %).
| 212 mcd/(㎡Lux) |
132 mcd/(㎡Lux) |
62 mcd/(㎡Lux) |
47 mcd/(㎡Lux) |
|
|---|---|---|---|---|
| Dry & Lighting | 100 | 100 | 100 | 100 |
| Dry & No Lighting | 100 | 100 | 100 | 100 |
| Wet & Lighting | 100 | 100 | 90 | 90 |
| Wet & No Lighting | 100 | 100 | 90 | 90 |
| I=20(㎜/h) & Lighting | 100 | 100 | 50 | 0 |
| I=20(㎜/h) & No Lighting | 100 | 100 | 50 | 0 |
| I=40(㎜/h) & Lighting | 100 | 100 | 30 | 0 |
| I=40(㎜/h) & No Lighting | 100 | 100 | 20 | 0 |
| I=50(㎜/h) & Lighting | 100 | 100 | 10 | 0 |
| I = rainfall intensity | ||||
Disclaimer/Publisher’s Note: The statements, opinions and data contained in all publications are solely those of the individual author(s) and contributor(s) and not of MDPI and/or the editor(s). MDPI and/or the editor(s) disclaim responsibility for any injury to people or property resulting from any ideas, methods, instructions or products referred to in the content. |
© 2024 by the authors. Licensee MDPI, Basel, Switzerland. This article is an open access article distributed under the terms and conditions of the Creative Commons Attribution (CC BY) license (https://creativecommons.org/licenses/by/4.0/).
Copyright: This open access article is published under a Creative Commons CC BY 4.0 license, which permit the free download, distribution, and reuse, provided that the author and preprint are cited in any reuse.


