Submitted:
28 February 2024
Posted:
28 February 2024
You are already at the latest version
Abstract
The scientific community has shown considerable interest in Industry 4.0 due to its capacity to revolutionise the manufacturing sector through digitalisation and data-driven decision-making. However, the actual implementation of Industry 4.0 within complex industrial settings presents obstacles that are typically beyond the scope of mainstream research articles. In this paper, a comprehensive case-study detailing our collaborative partnership with a leading medical device manufacturer is presented. The study traces their evolution from a state of limited digitalisation to the development of a digital intelligence platform that leverages data and machine learning models to enhance operations across a wide range of critical machines and assets. The main business objective was to enhance the energy efficiency of the manufacturing process, thereby improving its sustainability measures while also saving costs. The project encompasses energy modelling and analytics, Fault Detection and Diagnostics (FDD), renewable energy integration and advanced visualisation tools. Together, these components enable informed decision making in the context of energy efficiency.
Keywords:
Industry 4.0
; Energy Efficiency
; Sustainability
; FDD
; Renewable Integration
; Smart Manufacturing
1. Introduction
The term Industry 4.0, which refers to the fourth industrial revolution, was introduced in an initiative of the German government [1,2]. This is a paradigm shift driven by various technological advancements that is reshaping how the manufacturing industry operates. It has enormous potential to enhance sustainability, energy efficiency and reduce the environmental impact of manufacturing. It also offers financial incentives to manufacturers such as the promise of improved cost efficiency and product quality.
Since its introduction in 2011, Industry 4.0 has been one of the most highly researched topics in the scientific community. Some of its technological components such as Internet of Things (IoT), Big Data, Artificial Intelligence and Machine Learning, Augmented and Virtual Reality etc. have been at the top of the hype cycle of emerging technologies during this period [3], and have received the attention of the industry as well as academia [4,5,6] . These technologies facilitate Smart Manufacturing by enabling a high degree of interconnection of physical assets, digital tools as well as human operators [7]. The over-arching goal is to enable advanced optimisation and control, automated performance monitoring, decision-making and seamless communication across the production floor.
A comprehensive study spanning almost 750 German manufacturing companies found that the various drivers of this paradigm shift include not only strategic and operational incentives for the companies, but environmental and social factors as well [8]. Some of these strategic and operational incentives include increased flexibility, reduced time-to-market and optimised resource utilisation. Decision making is supported by real-time data analytics ensuring that the organisation can maintain a competitive edge. On the other hand, environmental factors include reduction in the energy consumption and carbon footprint.
Plans for Industry 5.0, such as the European Commission’s white paper [9], are already in development, which integrate a human-centred approach. However, the evidence of Industry 4.0 implementation is scarce and this concept is still in “the blue sky” phase [10]. There have been comprehensive literature reviews on the technological as well as managerial barriers [10,11] to the implementation of Industry 4.0. Each and every industrial implementation case has its unique problems, and bespoke solutions are required to overcome them.
This paper is focused on the approach taken to deliver and deploy a configurable Industry 4.0 solution to address specific needs for a leading medical device manufacturer. The basis of this is driven by the EU DENiM project [12] which brings together an interdisciplinary team to develop a modular digital intelligence platform. The DENiM solution enables the manufacturing sector to manage manufacturing systems in an energy efficient manner through systematic requirements analysis, data management, modelling and decision support tools.
The main requirements and interests as well as the unique strengths and weaknesses of the company were understood at the outset of the project, and a pathway to achieve the business objectives was charted. This paper describes the trajectory from a state of minimal digitalisation to a customised Industry 4.0 solution.
The rest of the paper is organised as follows: Section 2 provides some background information and gives a high-level overview of the production process. The project implementation plan and the main functional blocks to be implemented are discussed. The following sections then elaborate on each of the functional blocks of the implementation. Each of them enumerates the challenges as well as the solutions used to overcome them. As energy efficiency was one of the key interests of this project, Section 3 is dedicated to the discussion of energy-centric data analytics and predictive models of the production assets. This section also discusses the application of these models in production planning and anomaly detection. Any production site is supported by auxiliary services such as HVAC systems - both for maintaining indoor air quality as well as providing chilled water and compressed air for critical production processes. These systems are prone to faults which lead to energy and cost inefficient operation. Therefore, automated fault detection and diagnosis was a key consideration and described in Section 5. This production facility also houses onsite renewable energy assets in the form of wind turbines and a solar PV unit. Optimising the energy from these sources was an important objective of this project which is discussed in Section 6. A context driven user interface for advanced energy analytics as well as an extended reality environment that provides an immersive experience for the user is described in Section 7. Section 8 highlights the positive impacts of this implementation on business operations by discussing the achievements against each of the performance targets. Finally, Section 9 summarises the paper and lists the potential for further work at this production facility.
2. Background
This section begins with a brief introduction of the production process, identifying the key assets within the scope of the project. We then give a brief overview of the project plan including the specific targets as well as the functional blocks comprising the Industry 4.0 implementation.
2.1. Production Process
The production facility located in Cork, Ireland, is split over two separate buildings. The facility produces various medical products which are classified into different product families based on their application. A schematic of the of the facility is given in Figure 1.
Many of these product types are medical implants manufactured from ultra high molecular weight polyethylene (UHMWPE). Although there are variations across each product, the overall production process can be boiled down to the eight steps shown in Figure 2 and described below:
- Issue Material: the raw material is allocated to each of the product families. Operators use printers and barcode scanners to enable tracking.
- Saw: The material undergoes processing in machine saws to obtain blocks of the required size for each product family.
- Machine: The individual blocks are processed using CNC machines to obtain the finished product.
- Inspect: The products are inspected for compliance and defective ones are scrapped. Various machines are used during this stage.
- Clean: The products are cleaned and sterilised in a multi-stage cleanline. The stages include water-baths as well as air-dryers. The parameters such as temperature, flow-rate, pH etc. are tightly controlled.
- Label: Each product is assigned labels.
- Package: The products are sealed and packaged.
- Ship: The products are shipped from the facility.
The devices and assets considered within the scope of this project can broadly be classified into three categories:
- Production Specific Assets: this category includes all the machine tools and devices that are directly involved in the production process such as electric saws, CNC machines, cleanlines, as well as sealing and packaging equipment.
- Production Support Assets: this includes the auxiliary assets which are not directly involved in the production process but nevertheless serve other critical aplications. Examples include Air Handling Units (AHUs), chilled water system, air compressors etc.
- Renewable Energy Assets: this category includes the wind turbines, photovoltaic panels and other assets which provide the facility with alternate sources of electricity.
Table 1 gives a description of the various assets involved at each step of the production process. The table also gives the information about the status of energy monitoring of each category of assets. As can be seen from the table, only the cleanline machines are equipped with energy sensors.
2.2. Project Plan
When it comes to the actual implementation, Industry 4.0 is an open ended concept, and does not prescribe specific guidelines [13]. Instead, manufacturing companies need to focus on their specific needs when prioritising the implementation of industry 4.0 technologies [14]. In our case study, the overarching aim of the industry 4.0 solution was to enhance not only individual efficiency, but also the integration of the various assets across the three categories mentioned above. A key focus area of this implementation was to monitor and improve energy efficiency.
An effective implementation of industry 4.0 goes beyond simply upgrading the technologies; some of the critical success factors identified in a case study [16] include involvement of top management leadership, project planning, conducting preparatory activities, establishment of inter-functional teams, continuous development and lean management. In a nutshell, industry 4.0 is not just about technology, it encompasses all business activities and impacts all organisational units within a company. Given this context, a systematic procedure derived from the HyDAPI [15] methodology was used. This methodology is a hybrid of lean management principles and data-driven modelling techniques which aims to aid organisations in their transition to industry 4.0. This methodology was also validated on real-world case studies, and, therefore, recognises and addresses the practical challenges that arise in these contexts. For this research, seven steps were adapted and reformulated from the HyDAPI methodology (Figure 3), with the overarching aim of streamlining the tasks and ensuring all targets are achieved. These stages are described below:
- Project Charter: a project charter was created using the template shown in Figure 4. This identified all the stakeholders including, business management, production engineers, utilities technicians, research partners as well as representatives within the funding agency. The key tasks were identified and assigned. Additionally, the project management aspects were also included.
- Process Overview: the high-level view of the production process is shown in Figure 2. The intricate details of the process were discussed through several meetings, some of which were held at the facility. The research partners were also given the opportunity to shadow production engineers to better understand the process.
-
Business Requirements Specification: High-level meetings with the management were held to formulate the business requirements. Three broad areas were identified which are described below and the associated metrics are shown in Figure 5.
- Digitalisation: Monitoring assets in real-time as well as equipping them with data-driven decision support systems
- Energy Efficiency: improving energy efficiency by optimising operation or detecting and addressing faults. This aspect also includes the optimisation of renewable energy sources available at the facility.
- Cost/Energy Savings: The above two will lead to savings in terms of electricity consumption as well as cost.
These requirements were then translated into functional blocks, which are defined as the individual modules of the industry 4.0 solution, whose coordinated operation will fulfil the business requirements. The different functional blocks are described later in this section. - Data Catalogue: A data catalogue with high level overview of all the data sources was developed as shown in Figure 6. This also identifies the personnel responsible for maintaining the datasets.
- Data Architecture: This step delves into the details of each data source. While some data points correspond to physical assets, others reflect overall aggregates coming from a higher level of abstraction.
- Data Assessment: A detailed data assessment was carried out for each of the asset types identified in the data catalogue. The minimum data requirements for each of the functional blocks were listed. For instance, for the production assets, energy sensors are the minimum requirement. The details of each will be given in the respective sections.
- Connection Plan: from the above six steps it emerged that the minimum data requirements were not fulfilled for most of the functional blocks. In some cases, the assets were not equipped with sensors, whereas in others, the data was being collected but not stored on the site’s data historian. One of the key steps taken was the installation of energy meters on most of the production assets. As can be seen in Figure 5, having 85% of the production assets equipped with real-time energy monitoring capabilities was one of the concrete targets of this project.
These seven steps not only ensure a meticulous approach but also play a pivotal role in realising the Industry 4.0 solution. The four main focal points that characterise our approach are:
- Stakeholder Engagement: for the success of an industry 4.0 project, it is important to engage business managers, operators and research partners from inception to conclusion.
- Business Understanding: industry 4.0 is not just about upgrading technology; it is crucial to quantify the impact of these advancements on business operations.
- Tasks and Interdependencies: the overall objectives need to be broken down into individual tasks for any project. However, due to the interconnected nature of industry 4.0 functional blocks, the interdependencies must also be identified.
- Data Assessment: data plays a central role in industry 4.0. However, the initial data seldom meets the requirements to be able to support the project objectives. A connection plan is devised to obtain the necessary additional data as well as establish an appropriate digital architecture.
In a set of preliminary meetings, the core business needs, data availability and feasibility of solutions was discussed with all the relevant stakeholders. These meetings also decided the structure of the Industry 4.0 solution and its various functional components. The main functional blocks of the implementation are listed below.
- Energy Modelling & Analytics
- Fault Detection & Diagnosis
- Renewable Integration
- Advanced Visualisation Tools
3. Digital Infrastructure
This section provides a description of the digital infrastructure, detailing its components and their functionalities. The details of the implementation are also provided. The core digital platform consists of three pillars – the data platform, semantic model and APIs– which support the other functional blocks. While it is beyond the scope of this paper to give complete details, the next few subsections briefly describe these components which make up the digital infrastructure.
3.1. Data Platform
The DENiM project revolves around an integrated platform for all the digital services, energy models and analytics, decision support systems as well an advanced user interface. Various software tools were surveyed and a list of general guidelines were developed. However, each of the pilot industrial sites had their own software tools and systems which could be integrated within the DENiM platform. Thus, in the final implementation, the general guidelines were customised for each pilot. Figure 7 provides a schematic of the structure and components customised for this case study.
The platform consists of four layers:
- The first layer consists of the hardware and software specifications of the platform.
- The second layer consists of the database and the core services of the DENiM platform.
- The third layer contains the interfaces for the various digital tools part of the DENiM project. This is where the pilot specific customisations are made. Specifically, the Qlik operations management system as well as the OSI Pi data historian were integrated into the platform.
- The last layer consists of the back-end of all the digital tools implemented in Python.
3.2. Semantic Model Manager
A semantic model is essential in this project as it provides a structured framework for representing data and knowledge. By capturing the meaning and relationships between entities and concepts, semantic models enable accurate data interpretation, reasoning, and inference, enhancing decision-making processes. With data coming from multiple sources, resolving contextual information is key to interoperability.
4. Energy Efficiency
As seen in Section 2, the production process involves the operation of several machine tools in the various stages. This section goes into the details of the steps taken to improve the energy efficiency of the production process. Table 1 shows the energy consumption of the assets involved in the process. Step 8, i.e., Ship, is excluded as it involves no electricity consumption at the site. To optimise the return on investment, the focus was on the assets with a large power consumption. In this case, a Significant Energy User (SEU) was defined as any asset with a rated power consumption greater than 3 kW. Therefore, the assets within the scope are the Electric Saws, CNC Lathes and the Cleanlines.
4.1. Data
As part of the the connection plan, IoT energy monitors from EpiSensor were installed on all the assets under scope i.e., 2 electric saws, 10 CNC lathes and 2 multi-stage cleanlines. These provide energy consumption data at one-minute intervals and are connected to the local network, so the data can be read and exported on OSI Pi the data historian. When it comes to developing energy models of CNC machines, there are several important process parameters such as spindle speed, cutting depth and thickness, material removal rate (MRR) etc. which are needed for accurate energy modelling. However, at this site, even though a limited amount of offline data could be obtained, getting these process variables through the data historian was deemed infeasible within the project duration. The only other information available was the production details obtained from the company’s Operations Management System (OMS). This production details report consists of data logged by the operators after each batch of products progresses through any step of the production process. The details logged includes information such as
- Product code
- Machine code
- Number of units produced/processed
- number of parts scrapped
4.2. Data Analysis
The two datasets have different temporal resolutions – the energy data is available at one-minute resolution whereas the number of production log entries depends on the number of product batches processed during any given shift. There are two shifts of twelve hours within a 24-hour period – 7 AM to 7 PM, and, 7 PM to 7 AM. Thus, the first step in the data analysis was to obtain shift-wise aggregates of the energy consumption and production details. An example of the resampled and aggregated data is shown in Figure 8. It is immediately clear from the data that idling energy is a significant proportion of the total. For instance, in rows 1 and 4 of the sample dataset, even when a single unit is produced there is a considerable amount of energy consumed within that shift.
4.3. Idling Energy
One of the main targets of this project was to monitor energy consumption and identify potential for idle energy reduction. In the literature, idling power is defined as the energy consumption of a machine when it is powered on but not performing the actual machining operation. However, in this case, as the process data is not available, it is not possible to estimate the idling energy. Analysis of the data showed that the assets were being powered on even during shifts with no production. The overall energy consumption during that shift is considered as idling energy in this context as it is unnecessary energy consumption and presents a potential for saving. It was also found that for a large number of shifts, a small number of products were being manufactured. Apart from idle energy, we also quantify the energy being consumed in shifts where the production output is less than five and less than ten. The overall energy efficiency could be improved by optimising the production schedule. The results from the analysis are reported in Figure 9, where the terms ’Idle 5’ and ’Idle 10’ refer to shifts with less than five and ten units produced respectively. The aggregates over various categories of assets are presented in Table 2. For instance, for the lathes over 71% of the total energy is being consumed in shifts with less than 10 units produced. Thus, there is a tremendous energy savings potential that can be realised by implementing idle time reduction and schedule optimisation. It is worth mentioning that this was uncovered from simple data analysis, even despite the lack of detailed process data. The true potential of idle energy savings could be even higher if data were available at a finer resolution.
4.4. Energy Models
One of the main objectives of this Industry 4.0 project was to improve the energy efficiency of the high energy consuming production assets. However, as mentioned in the previous subsections, there are a couple of data availability and quality issues. Firstly, there is no data on the process parameters which are directly related to the energy consumption. Furthermore, the production data is logged at variable intervals throughout the shifts. The data has to be resampled to get shift-wise aggregates of energy and production. As there are only two variables available, linear regression was chosen as the method for analysis. As mentioned before, there are various different product families that are produced in this facility, and each one has a different machining procedure. Thus, they have different amounts of energy required during machining. For the assets in consideration in this case study, the Saws and Cleanlines were used for multiple product families. However, the lathes were dedicated to a single product. There were only a few lathes which were used for multiple products, but this was done during separate shifts. Those datapoints where different products were produced in the same shift were removed before carrying out the analysis. The dataset for modelling therefore consists of the production and energy consumption information segregated by product type. We develop regression models for each of the machines for specific product types.
A sample result from the analysis is shown in Figure 10. It can be seen that the models predict energy consumption with reasonable accuracy. This can be used in two applications:
- Production Planning: the model aids production planning by providing an estimate of the energy required to produce a given number of units of a certain type of product within a shift
- Anomaly Detection: as can be seen in Figure 10, the model also flags some anomalous energy consumption patterns which might be caused due to tool wear or faults in the auxiliary machine systems. Thus, the model can also serve as a fault detection tool.
5. Fault Detection & Diagnosis
Over time, mechanical equipment undergoes degradation leading to deviations from the normal behaviour. If left unchecked, this deviation may worsen which leads to the equipment’s inability to achieve its desired function, resulting in downtime. This deviation from the standard condition is known as a fault [17] and the identification and root cause analysis of its occurrence is the focus of the area of fault detection and diagnosis (FDD). While FDD is key to identifying the early signs of equipment failure, it is also a means of identifying inefficient energy consumption, especially in the case of Heating Ventilation and Air-Conditioning (HVAC) equipment. For example, Air Handling Units (AHUs), provide fresh and thermally comfortable air to manufacturing spaces. During normal operation, AHUs leverage damper and valve positions to provide the required amount of airflow at the appropriate temperature. However, a faulty valve position may lead to excessive heating or cooling of the air, and to ensure it meets the requirements of the room, the AHU will compensate for the fault. As the AHU is still capable of performing its desired function, this energy-wasting fault may go unnoticed. This is a significant issue in HVAC equipment as unnoticed faults may account for up to 20% of energy consumed [18]. Therefore, early detection and diagnosis of hidden faults is a key energy conservation measure.
The Industry 4.0 paradigm brings new tools and approaches that can detect these hidden faults, but they may not yet be applicable in a practical setting. Many different types of data-driven algorithms have been successfully applied to FDD problems as outlined in multiple systematic reviews of the landscape [19–22]. However, in [21] it was reported that about 65% of these studies utilise datasets from experiments in a laboratory setting such as those in [23,24]. The obvious issue that arises here is that these approaches would not be applicable if the same data quality and quantity is absent in the practical setting. Therefore, domain expertise plays a major role in FDD.
The main production support assets at this facility include AHUs, chillers and air compressors. However, a limited amount of data was available for the chilled water system and air compressors. Therefore, at this stage we only considered the AHUs.
5.1. AHU FDD
As mentioned above, the production facility consists of two large buildings, each of which is served by several Air Handling Units (AHUs). AHUs are one of the most important components of the HVAC system of a building and the literature is full of FDD methods for AHUs [21]. However, there are various data availability and quality issues when it comes to real-world application. One of the reliable approaches, the Air Handling Unit Performance Assessment Rules (APAR), is an expert systems approach introduced by House et al. [25]. Only eleven data points are required to implement this ruleset. Moreover, it solely depends on the current data sample, and therefore, does not depend on the sampling interval and nor does it require to store previous data. Some sample rules are shown in Table 3. Whenever a rule evaluates to true, it indicates the presence of some fault as the AHU is deviating from expected behaviour.
The APAR ruleset was implemented on four AHUs for which data is available. To evaluate the potential impact of the FDD tool, data for the year 2022 was analysed. The AHU was considered to be in faulty operation when the data triggered any rule. In particular, the faults such as stuck dampers, passing coils etc. which cause excessive energy consumption were considered. The energy consumption during faulty operation was computed and compared against the normal operation. As an example, the energy consumption of one of the AHUs is shown in Figure 11 which captures the difference between the normal operation and operation under the damper stuch fault.
By taking a mean value of the energy consumption for required amount of heating/cooling based on the indoor and outdoor temperatures, the excessive energy consumption due to the fault can be estimated. Aggregating the estimated savings across all the faults it was found that for an overall consumption of 610,000 kWh, the excess energy consumption was 97,000 kWh. Thus, almost 16% savings can be made by implementing the FDD tool.
6. Renewable Integration
The lower costs of the technologies employed by renewable energy sources (RES) make their implementation in the industry more attractive, to supply the energy consumption of the electricity grid, taking advantage of renewable sources in the generation of electricity. Industries are increasingly opting for RES integration in their various production processes. The implementation and optimisation of RES allow to increase the production profits as well as minimise the consumption of energy produced by fossil fuels.
The aim of this tool is to minimise costs and emissions by maximising the use of renewable energy in the production process. For this purpose, a strategy based on a supervisory controller has been designed, using model-based Predictive Control (MPC). This control algorithm is based on the calculation of a real-time optimisation of a functional, where dynamic models of all generation and demand assets are considered.
This tool has been designed for a medical device manufacturing plant. A schematic diagram of such a plant can be seen in Figure 12.
This scheme of the manufacturing plant can be considered as a microgrid with the following assets:
- Renewable energy sources (RESs): there is a wind turbine and a solar plant in this factory.
- Battery bank (B). Store energy and discharge when it’s needed.
- Combined Heat and Power (CHP). Produced energy and heat from gas.
- Remaining consumption: all consumption that cannot be manipulated. It is about 90% of the total.
- Manipulable demand as a group of CNCs.
All these assets have been modelled in order to be able to control them within the MPC. In particular, more accurate models have been developed for the RESs, as these are the energy sources to be maximised. The developed models can be found in [26] together with all the in-depth development of this tool. Only the models implemented for the RESs, the high-level development of the tool and some of the results obtained will be shown below.
6.1. Renewable Energy Sources Modelling
Several industries have now incorporated or plan to implement renewable energy sources to mitigate the increasing costs associated with energy consumption driven by high electricity prices. In this context, the adoption of an energy-efficient strategy is evident through the implementation of microgrids in industrial manufacturing plants. These microgrids use sustainable sources, such as solar and wind energy, to efficiently and sustainably supply the energy demands of various production processes. This approach not only contributes to resource optimisation but also represents a significant step towards reducing the industrial carbon footprint and transitioning to more sustainable energy systems.
In this case study, an industrial manufacturing plant is composed of a microgrid that uses solar and wind resources to supply energy to various production processes. The solar resource is harnessed through a photovoltaic installation (PV) and the wind resource is harnessed with an onshore wind turbine (WT). This microgrid structure not only offers an efficient solution to local energy needs but also exemplifies how the integration of renewable sources can be key to improving sustainability in the industrial environment.
Given that the case study involves an optimization process aimed at minimizing the energy consumption of the power grid, this indirectly leads to the maximization of energy utilization from renewable sources throughout the day. To execute the energy demand management process within the industry, models predicting the power generated by each renewable energy source (RES) are essential. On the other hand, these RESs present a highly non-linear characteristic, as they depend mainly on irradiance in the case of PV and on wind speed in the case of WT. Given the limited forecast of the meteorological variables on the horizon, namely wind speed and global irradiance, and taking into account the complexity of the nonlinear model governing renewable energy generation, the selected approach for prediction is the application of dynamic Neurofuzzy Systems.
6.1.1. Neurofuzzy Model of RES
Neurofuzzy modelling emerges as an effective technique for modelling and controlling non-linear systems. This methodology proves successful in effectively expressing the original non-linear model. This approach is based on Adaptive Neuro-Fuzzy Inference Systems (ANFIS) that was introduced by [27]. Once ANFIS completes its learning process, it generates a fuzzy inference system (FIS) that can be considered a grey-box model, as the rules defining the system’s behaviour can be extracted from it [28]. Furthermore, this modeling technique offers advantages such as fast update ability and quick execution, as mentioned in [29,30].
In order to obtain predictive models for both renewable sources, a series of historical operating data for each facility is used. The historical data is collected through a digital platform, to which the measurements made by the sensors of each facility are transmitted. It should be pointed out that WT data logging is performed every 10 minutes in accordance with IEC 61400, while for PV it is performed every 1 minute. The historical data from both systems are treated before being used in ANFIS training. For this, outliers and inconsistent data are removed and completed by interpolation for each variable.
The prediction of the active power generated by each RES depends, in the case of PV, only on the irradiance on an inclined surface and the current active power . For WT, only wind speed and current active power are used. These variables are stored in a matrix and , respectively. In the case of PV modelling, the requires direct global radiation , diffuse radiation , and reflected radiation . The calculation of the irradiance in the inclined plane is given by
For a detailed description of the Equation (1), refer to [31].
The variables that compose matrices and have different scales, which can affect the learning process due to inconsistencies. It is solved by the normalization process, thus avoiding the atypical nature and magnitude of the variables, as noted in [30,32]. Hence, each variable of both matrices must be normalized to zero mean and unit variance to give them equal weight by
The normalised data where is organised into sets: training, checking, and validation.
The proposed modelling approach integrates principal component analysis (PCA) with ANFIS, following the methodology presented in [29,33]. PCA is applied to normalised data sets to reduce their input space, resulting in the loading matrix , which contains the coefficients of the principal components of each variable. This matrix is used to project the original data onto the components with the highest variability. For the wind turbine, the first principal component represents a variability of , while, in the case of the PV field, the first principal component represents a variability of . Therefore, the projection of each data set for both RES is on the first principal component. In both cases, the projection is obtained by
where denotes the score matrix, incorporating a newly projected component within its corresponding principal component. In addition, denotes for the active power of each energy source in a future state. Consequently, these sets are configured for use in the learning process of each ANFIS.
The ANFIS network for each power source utilizes the projected data from the training and validation sets, applying a hybrid learning approach in its learning process. In the case of the ANFIS used to model the photovoltaic plant, the input consists of the projection of irradiance and active power onto the first principal components, while the output is the active power at the next time step , as shown in Figure 13. On the other hand, for the ANFIS used to model the wind turbine, the input includes the projection of wind speed and active power onto the first principal component, and the output is the active power at the next time step , as illustrated in Figure 14.
Figure 13 and Figure 14 depict the structure of the active power prediction models for wind turbines and photovoltaics, respectively. Here, and represent vectors that contain the first principal component obtained from the earlier performed PCA.
Finally, the validation process involves comparing the predicted output with the corresponding validation data set for each Renewable Energy Source (RES). The validation set for the photovoltaic installation comprises 51 days, while for the wind turbine, it covers 58 days. In other words, it is a new dataset containing input-output samples that were not used in the learning process for both cases. Three error indices were utilized to compare the output of with the actual predicted output data: the mean absolute error (), Root Mean Square Error (), and the coefficient of determination . Figure 15 and Figure 16 illustrate that both and effectively predict the actual values of active power for both RES. These evaluations consider data throughout the day and night. The error indices obtained from both models are presented in Table 4.
Validation metrics indicate that the neurofuzzy prediction models () have good accuracy and capture the nonlinear dynamics over the entire operating range (day and night). Based on the mean error, it is possible to infer that the neurofuzzy models overestimate the active power in both cases, as is positive. The of is , and for , it is , which are low values considering that the photovoltaic system has a nominal operating power of and in the case of the wind turbine. Finally, the linear regression between the predicted and actual active power of the outlet gives the coefficients of determination for both models. It indicates that the models explain of the variation in the output variable through the input variable. Therefore, it can be said that the obtained models show a good fit with the data, a high ability to explain the variability in the output variable through the input variable, and that both are good at making predictions.
6.2. Tool architecture
The architecture of this tool can be seen in Figure 17. At the top you can see the Model Predictive Control (MPC) and the data processing module.
This tool receives the data and sends the results through the DENiM platform. It receives all the data necessary for the models to predict the operation of the factory.
It also sends the control actions that the factory must follow to optimise its operation. These actions are of two types:
- Actions that are executed automatically, such as battery operation.
- Operator aids for starting up the various machines in the manufacturing process. These are shown through the visualisation tool below.
In the following, the MPC and the data processing module will be briefly discussed.
6.2.1. Model Predictive Control
The MPC works by obtaining the optimal control action for a given horizon. To do this, the models must predict the behaviour of the system at that horizon and an optimiser obtains the optimal control signal.
Due to the typology of the problem, a genetic algorithm has been chosen to optimise the whole process in each iteration of the controller.
The controller obtains the control action every sample time, set at 30min. Once obtained, it is sent to the platform.
6.2.2. Data Processing module
This module processes all the data from DENiM Platform for the MPC. This data consists in:
- Input data for the models such as wind speed, solar radiation, electricity market prices, gas prices, etc. These data are obtained from forecasting databases that are updated in real time.
- Feedback from the plant. Data from the plant’s sensors, warnings from the plant’s workers, production carried out, etc.
- Data from other tools. Among these data is the schedule optimised by the Sustainable Production Planning tool. This tool optimises the daily schedule by taking into account the carbon footprint, emission reductions, the life cycle of the assets, etc. This schedule is incorporated into the MPC as a starting point for optimisation at the beginning of the day.
The MPC, in each sample, optimises a given horizon (24 hours in this case). At each sample, this fixed-length horizon advances throughout the day, starting at the current instant. This phenomenon is called a sliding horizon.
In order for the MPC to optimise on this sliding horizon, it needs to obtain the new data and feed back the plant data. This module is also responsible for adjusting the data within this sliding horizon.
With this sliding horizon, uncertainties and disturbances affecting the system, input data, etc. are counteracted. This is because in each sample, possible drifts are corrected thanks to this feedback.
6.3. Results
Finally, this section will show some of the results obtained.
In order to obtain the goodness of the results, an initial scenario is necessary to compare them. This scenario consists of obtaining the behaviour of the plant before implementing this tool. This baseline behaviour can be seen in Figure 18. As can be seen, neither the advantages of the battery nor CHP are used, losing the advantage of the price difference between gas and the market. In addition, production is not subject to any optimisation or forecasting of renewables, discarding renewable energy in some instances (red fragments in Figure 18).
After implementing the MPC, the generated energy profiles can be seen in Figure 19. Looking at the profile, one can see:
- The profile of the manipulable process has been adjusted to times when the market price is lower or renewable energy production is higher.
- The inclusion of the battery means that renewable energy losses are minimised, bearing in mind that at the end of the day there is an excess of renewable energy that cannot be harnessed on this day.
- In some instances, power is produced from CHP to take advantage of the weighted price difference between gas and electricity from the market.
On this particular day, this tool was able to achieve an 18% saving while using 5% more RES.
7. User Interface
To support end users in understanding system performance and efficiency a set of easy and intuitive tools are required to visualise data. Specifically, the objective is to develop a set of modular components that ensure key performance metrics are visible, events are prioritised and the most pertinent information is presented to relevant stakeholders via a common frontend in the right context. This will provide improved awareness of energy flows and data across different levels of granularity within the manufacturing process (facility, product, process, planning), thus enabling greater visibility and shorter reaction times to ensure sustained energy savings. These tools will also provide mechanisms to incorporate data, metrics and performance indicators that are generated by other decision support tools. Following a review of implementation technologies and approaches, the tool architecture has been enhanced to provide a more generalised integration of data from the DENiM platform. The functional components are shown in Figure 20. The motivation was to enable to support multiple modes of engagement for end users (i.e., traditional web-based dashboard and 3D visualisation for digital twin). These common components include the following:
- Authorisation Controller: facilitates integration with the DENiM authorisation and access control mechanisms to ensure appropriate authorisation and access control to data sources.
- Historical Data Controller: provide a mechanism to load, query and interrogate of historical data received via the DENiM connectors
- Site Management Controller: capture a hierarchy of the physical assets, properties and data for a specific site configuration, this is supported by the use of the DENiM semantic model.
- Events Controller: Managing any notifications or updates that need to be propagated to the user (e.g., fault alert)
- Data Models: definition of local data models that align and map to visual widgets and components.
The Client API provides the intermediate access to these common data processing components, equally if appropriate (i.e., simple data queries with no pre-processing requirements) the client can access data directly through the DENiM data platform API (known as DAFT).
7.1. Dashboard Visualisation
To support an analytical view of energy performance, a web-based dashboard is provided, these provide a familiar approach to data visualisation for users. The dashboard tool collates the various pieces of data and presents the most relevant information for the user to help them make informed decision on performance and status of their assets, they can begin at the highest level of abstraction (site level) and drill down to specific assets, meters or components. To following provides an example of the visual components used to capture the energy flows relating to assets identified as significant energy users. The first view of interest for the user is the current energy performance indicators (EnPI) relating to the site as a whole (Figure 21).
This can also be supported by graphs to track energy usage (e.g., electricity) across buildings, processes or product lines (user configurable). A key aspect is to provide the user with a representation of performance against the current baseline and expected usage, it provides a very quick opportunity for the user to establish if they are on track with expected usage (baselines may be derived from past performance or energy models). It should be noted all data presented in the tool is extracted from the core data and analytics platform utilising a standardised API.
The user is presented with a widget that provides the current weather status in their location to provide context for external factors that impact usage (or generation). In addition they can view historical usage patterns as shown in Figure 22, this heatmap can identify specific time periods (days, weeks across a year time frame where energy produced may be particularly high. A user can traverse different features of interest to see the impact over the year.
The user can create a more granular view at production level through a tracking of Energy Performance Indicators (EnPI). Figure 23 provides an example of the energy impact of production across two buildings on and overall total production for the site. Data including actual usage, baseline, energy cost of units produced and tracking of performance year to date is presented to the user. This eliminates the need for the user to gather data from different sources (e.g., energy meters, production data, manufacturing systems) as it is automatically collected and accessible via the DENiM platform.
To focus more on specific energy contributors as part of a production process the user can access asset specific performance tracking graphs. Examples of these are shown in Figure 24, these can also be utilised to monitor the performance of energy models. Utilising the semantic model defining the site within the DENiM platform the visualisation tool is able to query and interrogate data for a specific asset. Data can be current reading, historical data points, model outputs and baseline data points. Given the analysis period (e.g., biweekly) the user is presented with the data in a graph. By hovering over a particular data point the user is presented with more information regarding the value and related source of the data. In addition the user can include control limits, i.e., upper and lower bounds that indicate if the asset is performing within the expected performance range (bottom left graph). If required the EnPI for the specific asset can also be added, therefore the user can get in one place, the consumption, expected consumption, the bounds within it should operate and the overall tracking of EnPI for the asset.
To support the user in establishing a breakdown of energy usage a Sankey diagram is utilised as shown in Figure 25. Leveraging the semantic model of a site each asset that is metered is aggregated to depict the total energy demand. This is broken down further to each asset type and asset. The user can easily get a perspective on the location and quantities of energy being used across the site and hone in on the specific assets that may need attention. It is envisaged that this will be further linked to the identification of faults or issues that have been identified by the DENiM modelling components.
The DENiM dashboarding also supports integration of data outputs from other tools. For example, the sustainable planning tool provides the output to the DENiM platform capturing the optimal scheduling to maximise energy efficiency. Figure 26 provides an example output of the sustainable planning module, it shows the main impact of the planning (e.g., CO2 emissions, Renewable Energy, etc). By integrating with the DENiM core platform and following the defined information and semantic models the visualisation tool is easily extensible and customisable to the user needs. The next step for the visualisation is to conduct usability testing and enhance the visual representation as per pilot user requirements based on DENiM evaluation steps.
7.2. Digital Twin Visualisation
A set of visualisation tools was designed and developed to present data to the user extracted from the various monitored parameters within the manufacturing site. In this section, we will cover a desktop-based graphical user interface (GUI) application (Windows app) and its immersive mixed reality (MR) equivalent running on the Microsoft HoloLens 2 [34] as an alternative modality. The exploration of these visualisation mediums allows us to evaluate whether the intuitiveness of these interfaces has any significant positive impact regarding data interpretation and consequently, informed decision-making. The key aspect of these user interfaces is to transform raw data into consumable and actionable information. It is worthwhile to note that the various data processing, simulations, and models have already been handled by the central platform, hence the GUI applications visually present the result of those computations, significantly reducing the processing costs of the applications.
One of the more common approaches is to develop a digital model of the building which involves virtualising the physical manufacturing floor with all the relevant assets and equipment. This allows the user to have a level of immersion as the interface facilitates switching views through a camera system. Although an attempt to virtually replicate the site as closely as possible was made, there is currently no automatic, bi-directional data flow. Due to the limited level of integration and manual data exchange, categorising it as a digital model instead of a digital twin is more accurate. It is nonetheless a beneficial representation in terms of a centralised graphical interface for users to gain visibility of the various operations. The virtualisation process begins with generating 3D models. The 3D model of the building site was created based on the existing floor plans which allowed for an up-to-scale model of the floor layout. This was achieved by extruding the walls using SketchUp[ref here], a 3D modeling computer-aided design (CAD) program for a broad range of drawing and design applications. The floor plan also detailed the positions of each of the asset equipment which include: lathe machines, saws, chillers, air-handling units (AHUs), and other auxiliary equipment. Various 3D models of the assets were available from vendors and other free sources that were used in the application.
The development platform used to create the 3D environment is the game engine, Unity 3D[ref here] which is primarily used to develop 3D and 2D games. The flexibility and extensibility of the game engine offer a scalable framework in which each ’game object’ within the scene environment can be attributed to various ’Components’ through scripting that enable it to behave in several ways. It has an extensive library of systems that can work together to deliver a cohesive user experience which includes a seamless camera system, networking, graphs, animations, custom user interface (UI) widgets, sound effects motion graphics; all of which enhance the interaction with data through the GUI. Using individual scripts allows the developer to implement custom game logic and behaviour which is particularly useful when testing various functions. The GUI application connects to an API developed to make queries to which it receives the lightweight JavaScript Object Notation (JSON) payload which has been pre-configured according to the aforementioned semantic model. This JSON is deserialised and relevant key values are then graphically displayed e.g., graphs, charts, texts, trigger animations, etc.
The workflow for this development utilizes Unity 3D (LTS 2021.3.18f1) for environment creation. 3D models are optimized with tools like Blender (3.5.1). Building structures are modeled with SketchUp, and files are converted to FBX (Filmbox, Autodesk). Smaller 3D models enhance application performance. Game objects within the engine are assigned components, including custom scripts. The prototype authenticates users based on DENiM API Fetch Tables (DAFT) registration. User navigation includes a splash screen, login, and access to tables related to equipment data. Web tokens enhance security, offering features like stateless operation, enhanced authentication, CORS, CSRF protection, and time-limited access.
The building view displays assets in a top, isometric perspective. Interactible graphical models represent equipment. User controls involve mouse drag for panning and right-click hold for rotation. Menus enable interaction with the navigation system, switching the camera to selected assets. Equipment associations with data parameters are emphasized. The GUI includes an intuitive menu design, tab systems, highlight functions, and interactive graphs. Faults are represented as 3D object overlays, aiding in issue localization. Key GUI functionalities include authorization, a camera system, a tab system, highlight functions, and graphs (see Figure 27).
Fault occurrences impact KPIs like cost, carbon emissions, and energy optimizations. Hovering on faults displays descriptions; clicking highlights potential root causes. Graph widgets offer detailed views and comparisons of parameters. Visualizations are developed as a minimal viable product, ensuring contextualized data for energy managers, production planners, and stakeholders. Visualizations are deployed on-premise using the DENiM architecture manager, encapsulated as containers, and accessed through a URL. The digital twin visualization can be provided as an executable and used on-site or via VPN to the main DENiM platform APIs.
8. Key Performance Indicators (KPIs)
This section describes the added value the DENiM approach brought to the business operations at the site. As mentioned in Section 2, various KPIs were set out at the beginning of the project to quantitatively measure the progress. While most of these targets were met, some could not be achieved primarily due to challenges around data availability and quality. Some of these specific issues will also be highlighted in following discussions that provide the details of each KPI.
- KPI-1 85% of Production Assets Monitored: Of the assets within scope, the significant energy users (SEUs) were defined to be those with a rated power consumption of more than 3kW. With the connection plan fully implemented, 95% of the identified assets have been equipped with IoT sensors and meters, providing monitoring of energy consumption of these assets.
- KPI-2 25% of Production Assets equipped with FDD The production assets includes the saws, lathes and cleanlines. Energy models have been developed for the lathes which also aid in detecting abnormal energy consumption patterns and offer limited but valuable fault detection. Thus, this KPI has also been reached with approximately 70% of assets being equipped with fault detection.
- KPI-3 50% of Production Support Assets equipped with FDD Besides the AHUs, the assets within scope include Chillers and air compressors. Due to the lack of data, this KPI has not been met. However, when data is made available, it is possible to extend the developed FDD tools to cover 75% of the assets.
- KPI-4 Reduce Complexity of Data Collection & Energy Audits The complexity of data generation was reduced with two digital services deployed which automatically computed the performance indicators for all assets. Additionally, the integration of the visualisation tool on the platform enabled easy access and visualisation of data aggregated from multiple sources. To enhance the accuracy and quickly identify the faults with sensors, a data validation tool was also incorporated which implemented five different kinds of data checks.
- KPI-5 95% accuracy in predicting energy consumption of production assets This KPI could not be achieved due to the lack of data. For accurate energy prediction, monitoring the process parameters is a must. Nevertheless, the simple models based on linear regression are still helpful in production planning as well as anomaly detection.
- KPI-6 10% idle energy reduction and schedule optimisation: As mentioned in section , the data analysis is based on shift-wise aggregates. In the various scenarios shown, this KPI is met more than satisfactorily. Furthermore, data at a higher resolution will only improve this KPI.
- KPI-7 10% savings by optimising renewable integration The renewable integration module was shown to improve renewable integration by approximately 18%. Thus, this KPI is also met.
- KPI-8 15% savings through FDD: Considering the AHU FDD, and assuming that the scenario for 2022 is generally valid for any year, a saving of approximately 16% can be made by quickly repairing faults which consume excessive energy compared to normal operation.
The continued tracking of progress at the site can be supported beyond these KPIs by using the energy efficiency pathway as outlined in [35]. This provides the industrial organisation with a set of milestones and levels to measure and track progress in their digitalisation journey. The use of the DENiM solutions and tools provided the medical manufacturing site with a clear trajectory to enhance their current processes and procedures for assessment and reporting of energy efficiency through advanced digital tools.
9. Conclusions
In summary, this article describes the successful implementation of an Industry 4.0 project at the production facility of a medical device manufacturer. One of the main focus areas was improving the energy efficiency. This encompassed not only the production assets, but production support assets as well as renewable energy assets.
One common theme that emerged in the various tasks of this project was the gap between research and real world challenges. The majority of research is conducted in controlled laboratory settings, limiting its relevance to industrial problems. The main reason for this disparity is the lack of data. However, other factors contribute, such as not having enough financial or human resources, and not fully understanding what businesses need.
To address these challenges, we implemented a systematic project management framework. A project charter was created which defined the roles of all stakeholders and also included some administrative details. The main challenges faced in the business operations were understood and technological solutions were devised to address them. These objectives were concretised by formulating them in terms of KPIs. A limited amount of data was availble at the start of the project, so a connection plan was put into place to obtain the data necessary for achieving the objectives.
The main tasks identified at this stage of the project were energy modelling and analytics for the production assets, FDD for production support assets and optimisation of the renewable energy assets. In spite of the efforts to gather data by means of IoT sensors, it was still limited as the essential process parameters were inaccessible. Nevertheless, this project highlights that significant impact is possible even through simple modelling and analytical methods.
While Industry 4.0 relies on enhanced automation of processes, decision-making is still at the heart of any industry. With that in mind, we also developed an advanced user interface and data visualisation module. This facilitates informed decision-making by making it easy to interpret complex data.
Overall, this paper enriches the literature on Industry 4.0 by offering a practical perspective and demonstrating how businesses can successfully implement Industry 4.0 principles to address their immediate needs and challenges. We hope that the insights and lessons learned from this real-world implementation provide valuable guidance for both researchers and practitioners seeking to leverage Industry 4.0 technologies in diverse industrial contexts.
Author Contributions
The work presented in this article is the result of a collaboration of all authors. A.R.: analysis of data, writing of first draft, conceptualisation; J.J.: analysis of data, writing, A.J.: analysis of data, writing; D.W.: analysis of data, writing; A.d.J.: software, writing; AMcG: software, writing, review and editing; K.B.: supervision, review and editing; A.H.: project administration, review and editing
Funding
The authors want to thank the European Commission for funding this work under Project DENiM. This project has received funding from the European Union’s Horizon 2020 research and innovation programme under grant agreement No 958339.
Conflicts of Interest
The authors declare no conflicts of interest.
References
- Kagermann, H.; Lukas, W.D.; Wahlster, W. Industrie 4.0: Mit dem Internet der Dinge auf dem Weg zur 4. industriellen Revolution. VDI nachrichten 2011, 13, 2–3. [Google Scholar]
- Kagermann, H. Change through digitization—Value creation in the age of Industry 4.0. In Management of permanent change; Springer, 2014; pp. 23–45. [Google Scholar]
- Inc., J.R.G. Gartner’s 2015 Hype Cycle for Emerging Technologies Identifies the Computing Innovations That Organizations Should Monitor. Available online: https://www.gartner.com/en/newsroom/press-releases/2015-08-18-gartners-2015-hype-cycle-for-emerging-technologies-identifies-the-computing-innovations-that-organizations-should-monitor accessed on 09/11/2023.
- Zhong, R.Y.; Ge, W. Internet of things enabled manufacturing: A review. International Journal of Agile Systems and Management 2018, 11, 126–154. [Google Scholar] [CrossRef]
- Cioffi, R.; Travaglioni, M.; Piscitelli, G.; Petrillo, A.; De Felice, F. Artificial intelligence and machine learning applications in smart production: Progress, trends, and directions. Sustainability 2020, 12, 492. [Google Scholar] [CrossRef]
- Damiani, L.; Demartini, M.; Guizzi, G.; Revetria, R.; Tonelli, F. Augmented and virtual reality applications in industrial systems: A qualitative review towards the industry 4.0 era. IFAC-PapersOnLine 2018, 51, 624–630. [Google Scholar] [CrossRef]
- Zheng, P.; Wang, H.; Sang, Z.; Zhong, R.Y.; Liu, Y.; Liu, C.; Mubarok, K.; Yu, S.; Xu, X. Smart manufacturing systems for Industry 4.0: Conceptual framework, scenarios, and future perspectives. Frontiers of Mechanical Engineering 2018, 13, 137–150. [Google Scholar] [CrossRef]
- Müller, J.M.; Kiel, D.; Voigt, K.I. What drives the implementation of Industry 4.0? The role of opportunities and challenges in the context of sustainability. Sustainability 2018, 10, 247. [Google Scholar] [CrossRef]
- for Research, D.G.; Innovation, E.C. Industry 5.0 - Towards a sustainable, human-centric and resilient European industry. Available online: https://research-and-innovation.ec.europa.eu/knowledge-publications-tools-and-data/publications/all-publications/industry-50-towards-sustainable-human-centric-and-resilient-european-industry_en accessed on 28/01/2024.
- Bajic, B.; Rikalovic, A.; Suzic, N.; Piuri, V. Industry 4.0 implementation challenges and opportunities: A managerial perspective. IEEE Systems Journal 2020, 15, 546–559. [Google Scholar] [CrossRef]
- Rikalovic, A.; Suzic, N.; Bajic, B.; Piuri, V. Industry 4.0 implementation challenges and opportunities: A technological perspective. IEEE Systems Journal 2021, 16, 2797–2810. [Google Scholar] [CrossRef]
- Consortium;, T.D. DENiM:Unlocking the Energy Saving Potential in Manufacturing Systems. https://denim-fof.eu/.
- Buer, S.V.; Semini, M.; Strandhagen, J.O.; Sgarbossa, F. The complementary effect of lean manufacturing and digitalisation on operational performance. International Journal of Production Research 2021, 59, 1976–1992. [Google Scholar] [CrossRef]
- Frank, A.G.; Dalenogare, L.S.; Ayala, N.F. Industry 4.0 technologies: Implementation patterns in manufacturing companies. International journal of production economics 2019, 210, 15–26. [Google Scholar] [CrossRef]
- Clancy, R.; Bruton, K.; O’Sullivan, D.T.; Cloonan, A.J. The HyDAPI framework: A versatile tool integrating Lean Six Sigma and digitalisation for improved quality management in Industry 4.0. International Journal of Lean Six Sigma 2022. [Google Scholar] [CrossRef]
- Pozzi, R.; Rossi, T.; Secchi, R. Industry 4.0 technologies: Critical success factors for implementation and improvements in manufacturing companies. Production Planning & Control 2023, 34, 139–158. [Google Scholar]
- Isermann, R. Fault-diagnosis applications: Model-based condition monitoring: actuators, drives, machinery, plants, sensors, and fault-tolerant systems; Springer Science & Business Media, 2011. [Google Scholar]
- Roth, K.W.; Westphalen, D.; Feng, M.; Llana, P.; Quartararo, L. Energy Impact of Commercial Building Controls and Performance Diagnostics: Market Characterization. Energy Impact of Building Faults and Energy Savings Potential 2005, 413. [Google Scholar]
- Matetić, I.; Štajduhar, I.; Wolf, I.; Ljubic, S. A Review of Data-Driven Approaches and Techniques for Fault Detection and Diagnosis in HVAC Systems. Sensors 2022, 23, 1. [Google Scholar] [CrossRef] [PubMed]
- Zhao, Y.; Li, T.; Zhang, X.; Zhang, C. Artificial intelligence-based fault detection and diagnosis methods for building energy systems: Advantages, challenges and the future. Renewable and Sustainable Energy Reviews 2019, 109, 85–101. [Google Scholar] [CrossRef]
- Chen, Z.; O’Neill, Z.; Wen, J.; Pradhan, O.; Yang, T.; Lu, X.; Lin, G.; Miyata, S.; Lee, S.; Shen, C.; others. A review of data-driven fault detection and diagnostics for building HVAC systems. Applied Energy 2023, 339, 121030. [Google Scholar] [CrossRef]
- Mirnaghi, M.S.; Haghighat, F. Fault detection and diagnosis of large-scale HVAC systems in buildings using data-driven methods: A comprehensive review. Energy and Buildings 2020, 229, 110492. [Google Scholar] [CrossRef]
- Wen, J.; Shun, L. RP-1312 – Tools for Evaluating Fault Detection and Diagnostic Methods for Air-Handling Units. https://www.techstreet.com/standards/rp-1312-tools-for-evaluating-fault-detection-and-diagnostic-methods-for-air-handling-units?product_id=1833299 accessed on 28/01/2024.
- Granderson, J.; Lin, G. Inventory of data sets for afdd evaluation. Building Technology and Urban Systems Division, Lawrence Berkeley National Laboratory 2019. [Google Scholar]
- House, J.M.; Vaezi-Nejad, H.; Whitcomb, J.M. An expert rule set for fault detection in air-handling units/discussion. Ashrae Transactions 2001, 107, 858. [Google Scholar]
- Gómez, J.; Chicaiza, W.D.; Escaño, J.M.; Bordons, C. A renewable energy optimisation approach with production planning for a real industrial process: An application of genetic algorithms. Renewable Energy 2023, 118933. [Google Scholar] [CrossRef]
- Jang, J.S. ANFIS: Adaptive-network-based fuzzy inference system. IEEE Transactions on Systems, Man, and Cybernetics 1993, 23, 665–685. [Google Scholar] [CrossRef]
- Lindskog, P. Fuzzy Identification from a Grey Box Modeling Point of View. In Fuzzy Model Identification: Selected Approaches; Hellendoorn, H., Driankov, D., Eds.; Springer Berlin Heidelberg: Berlin, Heidelberg, 1997; pp. 3–50. [Google Scholar] [CrossRef]
- Chicaiza, W.D.; Sánchez, A.J.; Gallego, A.J.; Escaño, J.M. Neuro-fuzzy Modelling of a Linear Fresnel-type Solar Collector System as a Digital Twin. Joint Proceedings of the 19th World Congress of the International Fuzzy Systems Association (IFSA), the 12th Conference of the European Society for Fuzzy Logic and Technology (EUSFLAT), and the 11th International Summer School on Aggregation Operators (AGOP). Atlantis Press, 2021, pp. 242–249. [CrossRef]
- Chicaiza, W.D.; Machado, D.O.; Len, A.J.G.; Gonzalez, J.M.E.; Alba, C.B.; de Andrade, G.A.; Normey-Rico, J.E. Neuro-Fuzzy Digital Twin of a High Temperature Generator. IFAC-PapersOnLine 2022, 55, 466–471, 11th IFAC Symposium on Control of Power and Energy Systems CPES 2022. [Google Scholar] [CrossRef]
- Duffe, J.A.; Beckman, W.A. Design of Photovoltaic Systems, fourth edition; Copyright 2013 by JohnWiley & Sons,Inc.; 2013. [Google Scholar]
- Machado, D.; Chicaiza, W.; Escaño, J.; Gallego, A.; de Andrade, G.; Normey-Rico, J.; Bordons, C.; Camacho, E. Digital twin of a Fresnel solar collector for solar cooling. Applied Energy 2023, 339, 120944. [Google Scholar] [CrossRef]
- Rodríguez, F.; Chicaiza, W.D.; Sánchez, A.; Escaño, J.M. Updating digital twins: Methodology for data accuracy quality control using machine learning techniques. Computers in Industry 2023, 151, 103958. [Google Scholar] [CrossRef]
- Corporation, M. Microsoft Hololens. https://www.microsoft.com/en-ie/hololens accessed on 28/01/2024.
- Group, H.D.F...P.W. Pathways to Energy Efficient Manufacturing through Digitisation, 2023. [CrossRef]
Figure 1.
Layout of production facility
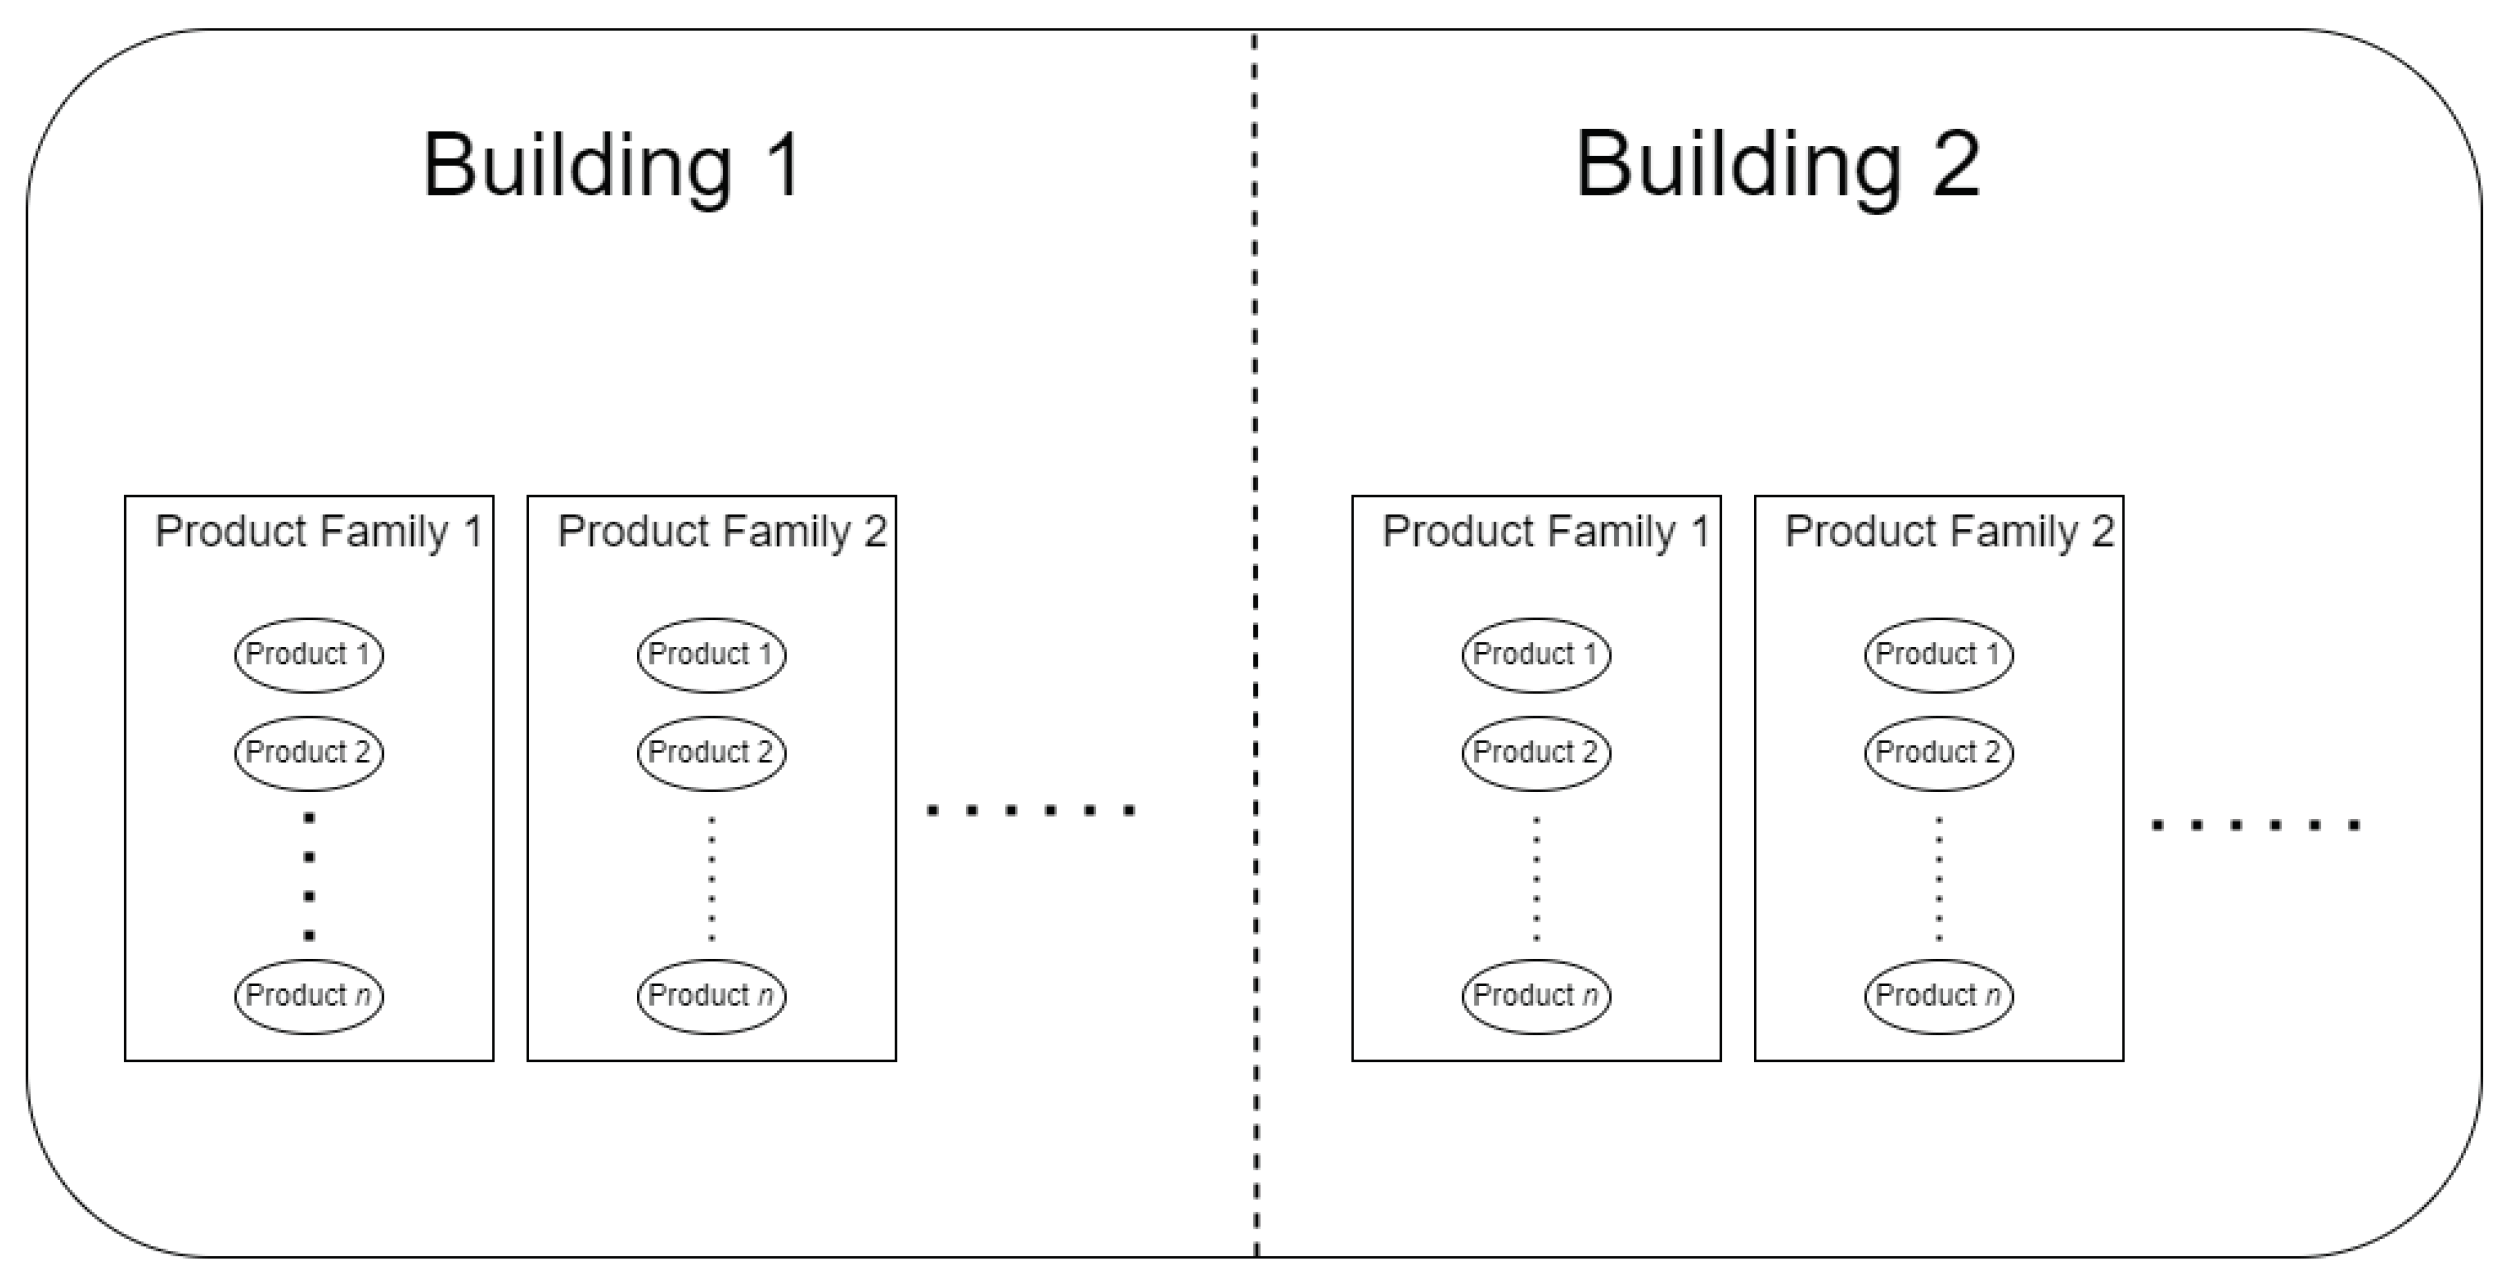
Figure 2.
Schematic diagram of production process
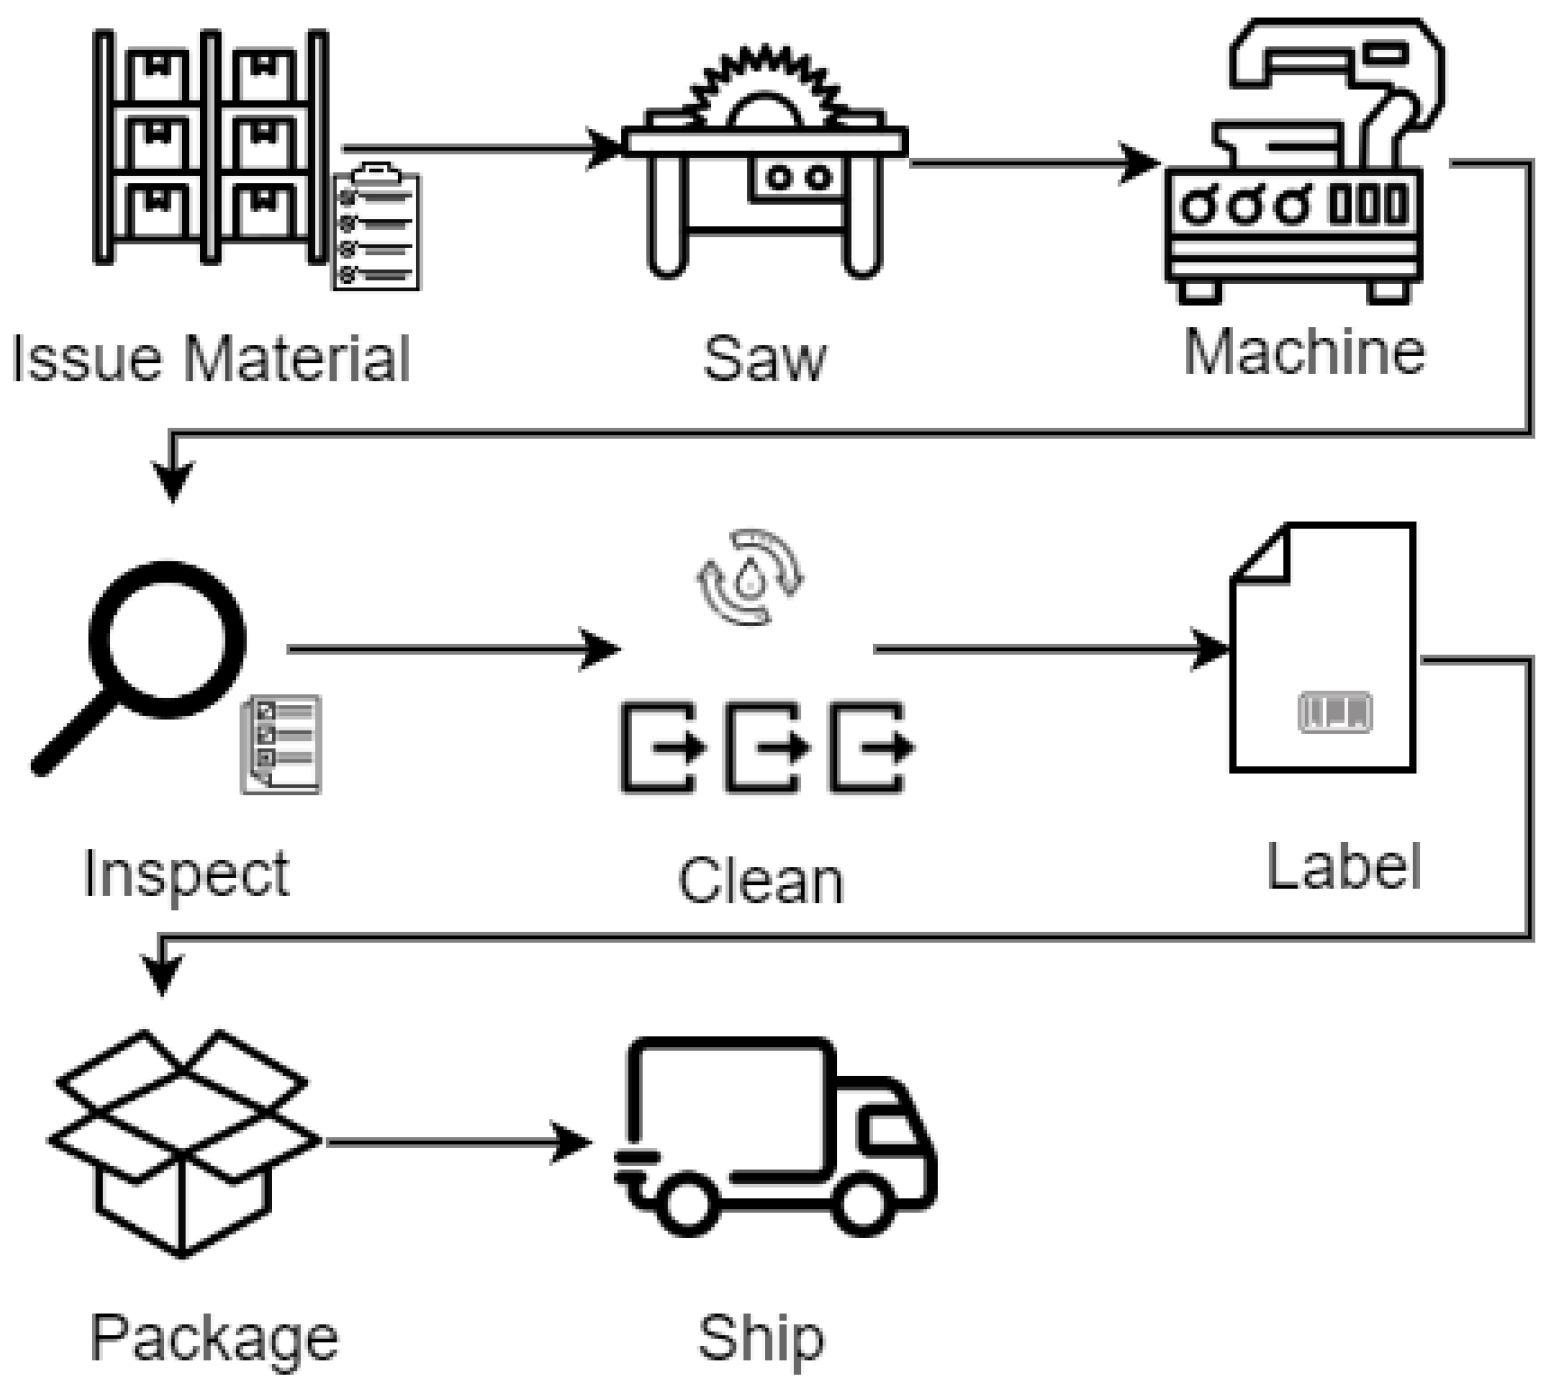
Figure 3.
Seven stage project management process adapted from HyDAPI methodology [15]
Figure 3.
Seven stage project management process adapted from HyDAPI methodology [15]
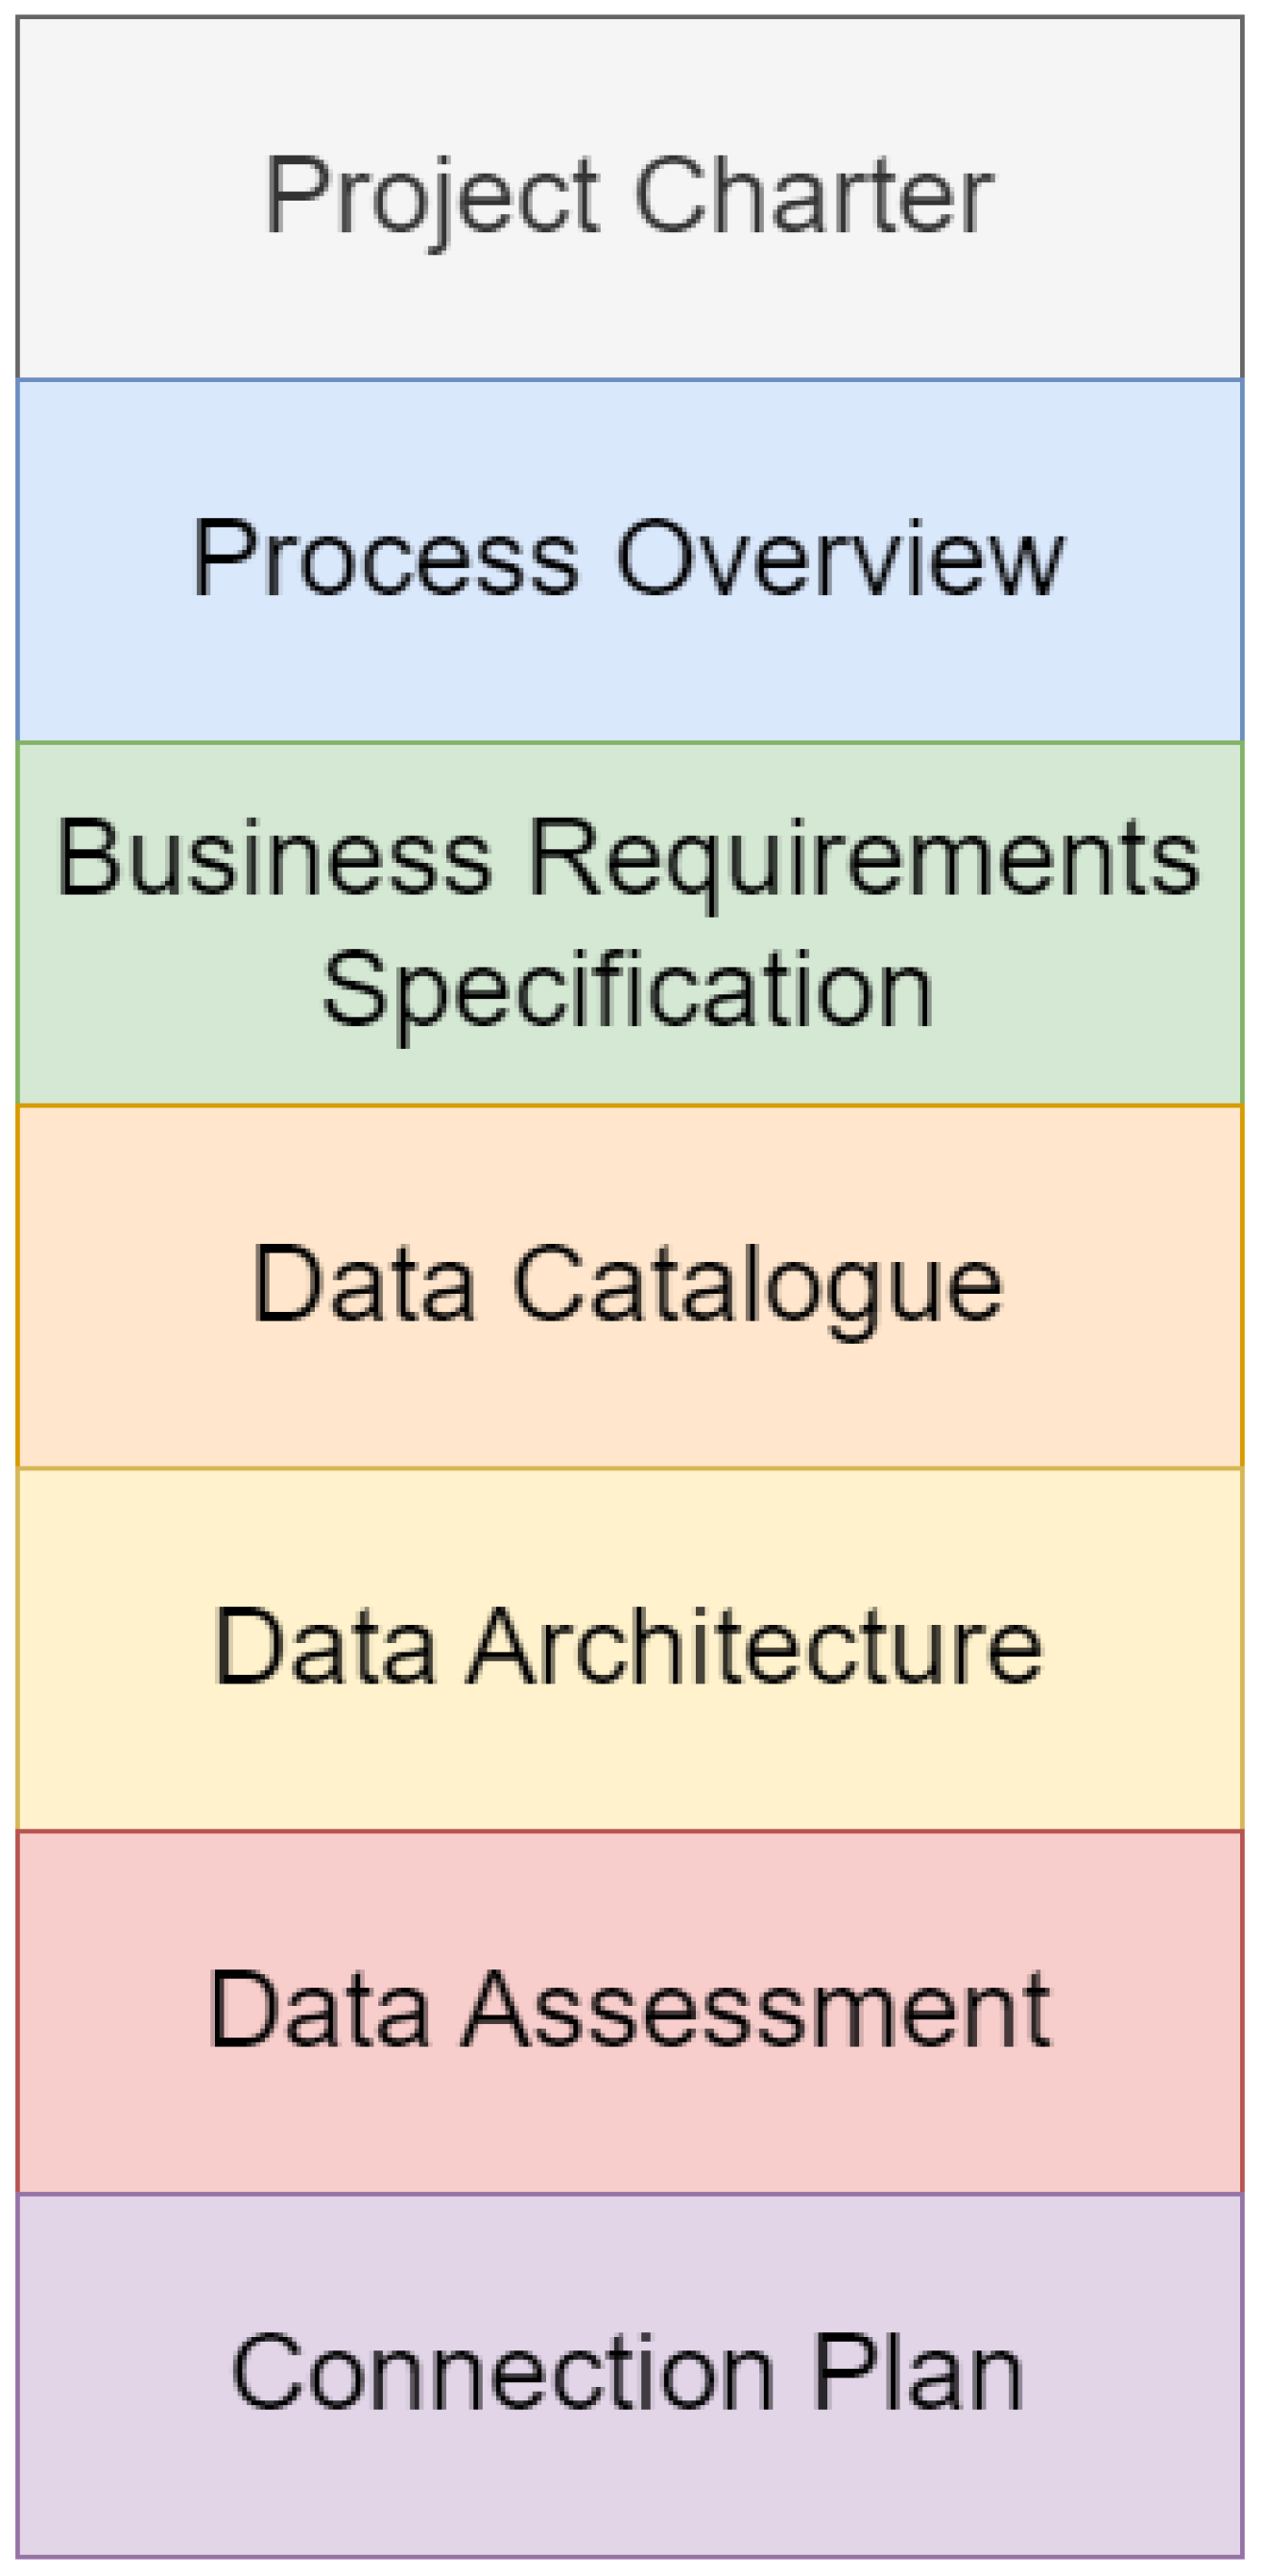
Figure 4.
Project Charter Template
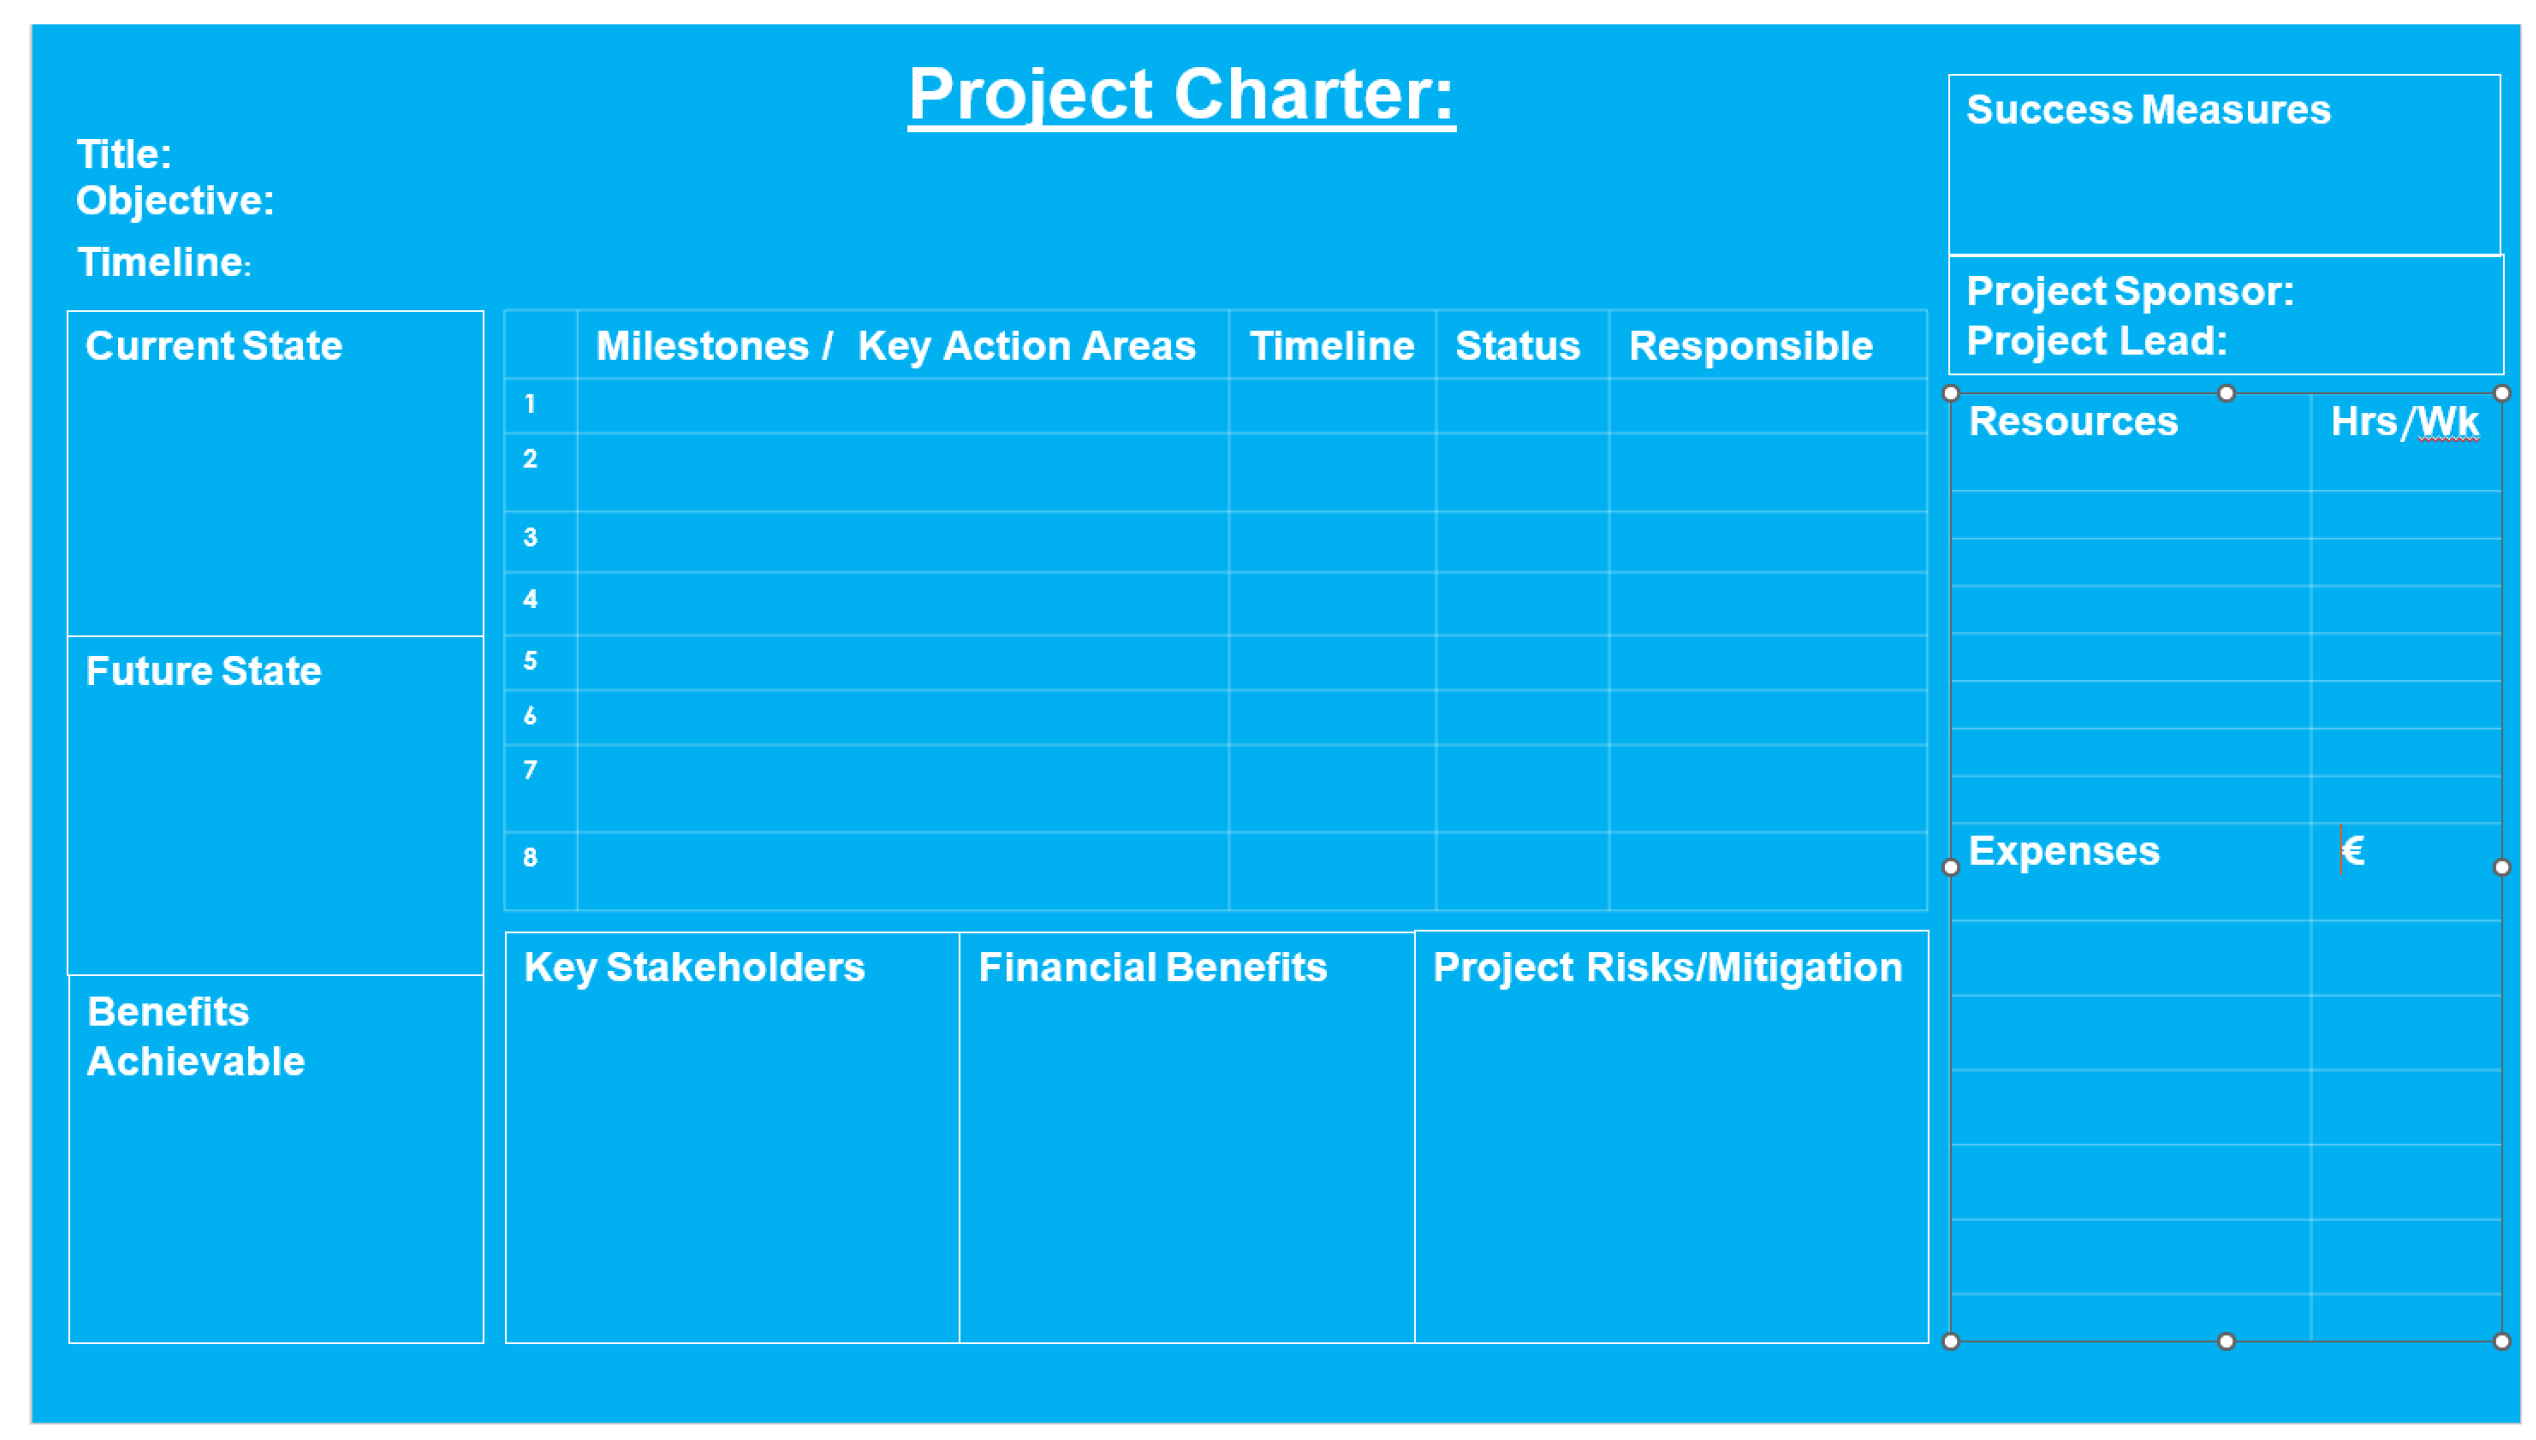
Figure 5.
KPIs to evaluate project success
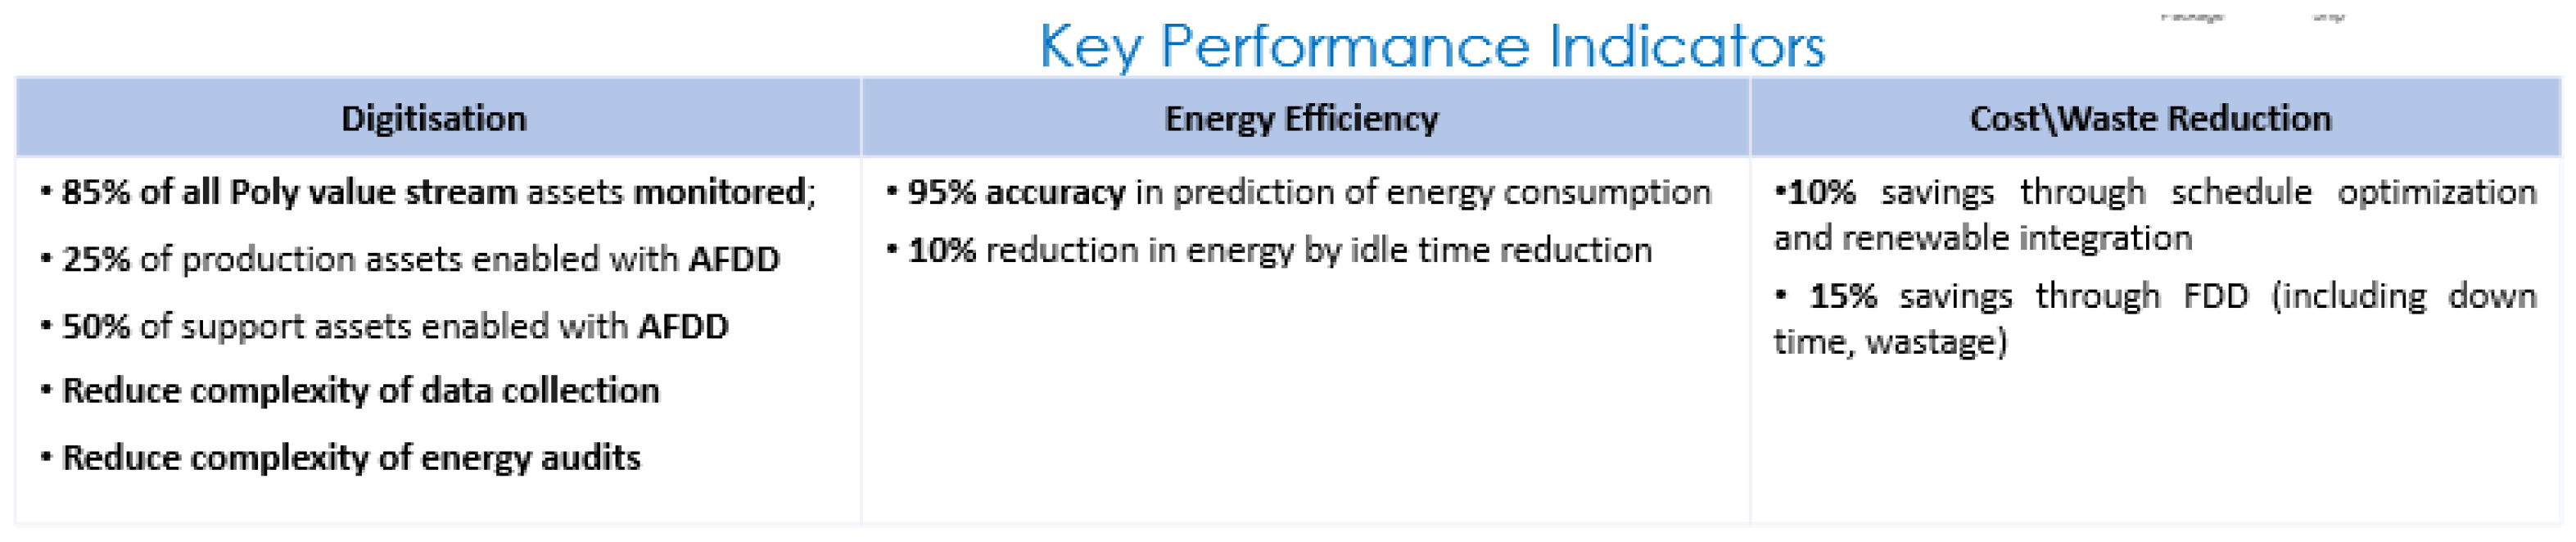
Figure 6.
Data Catalogue
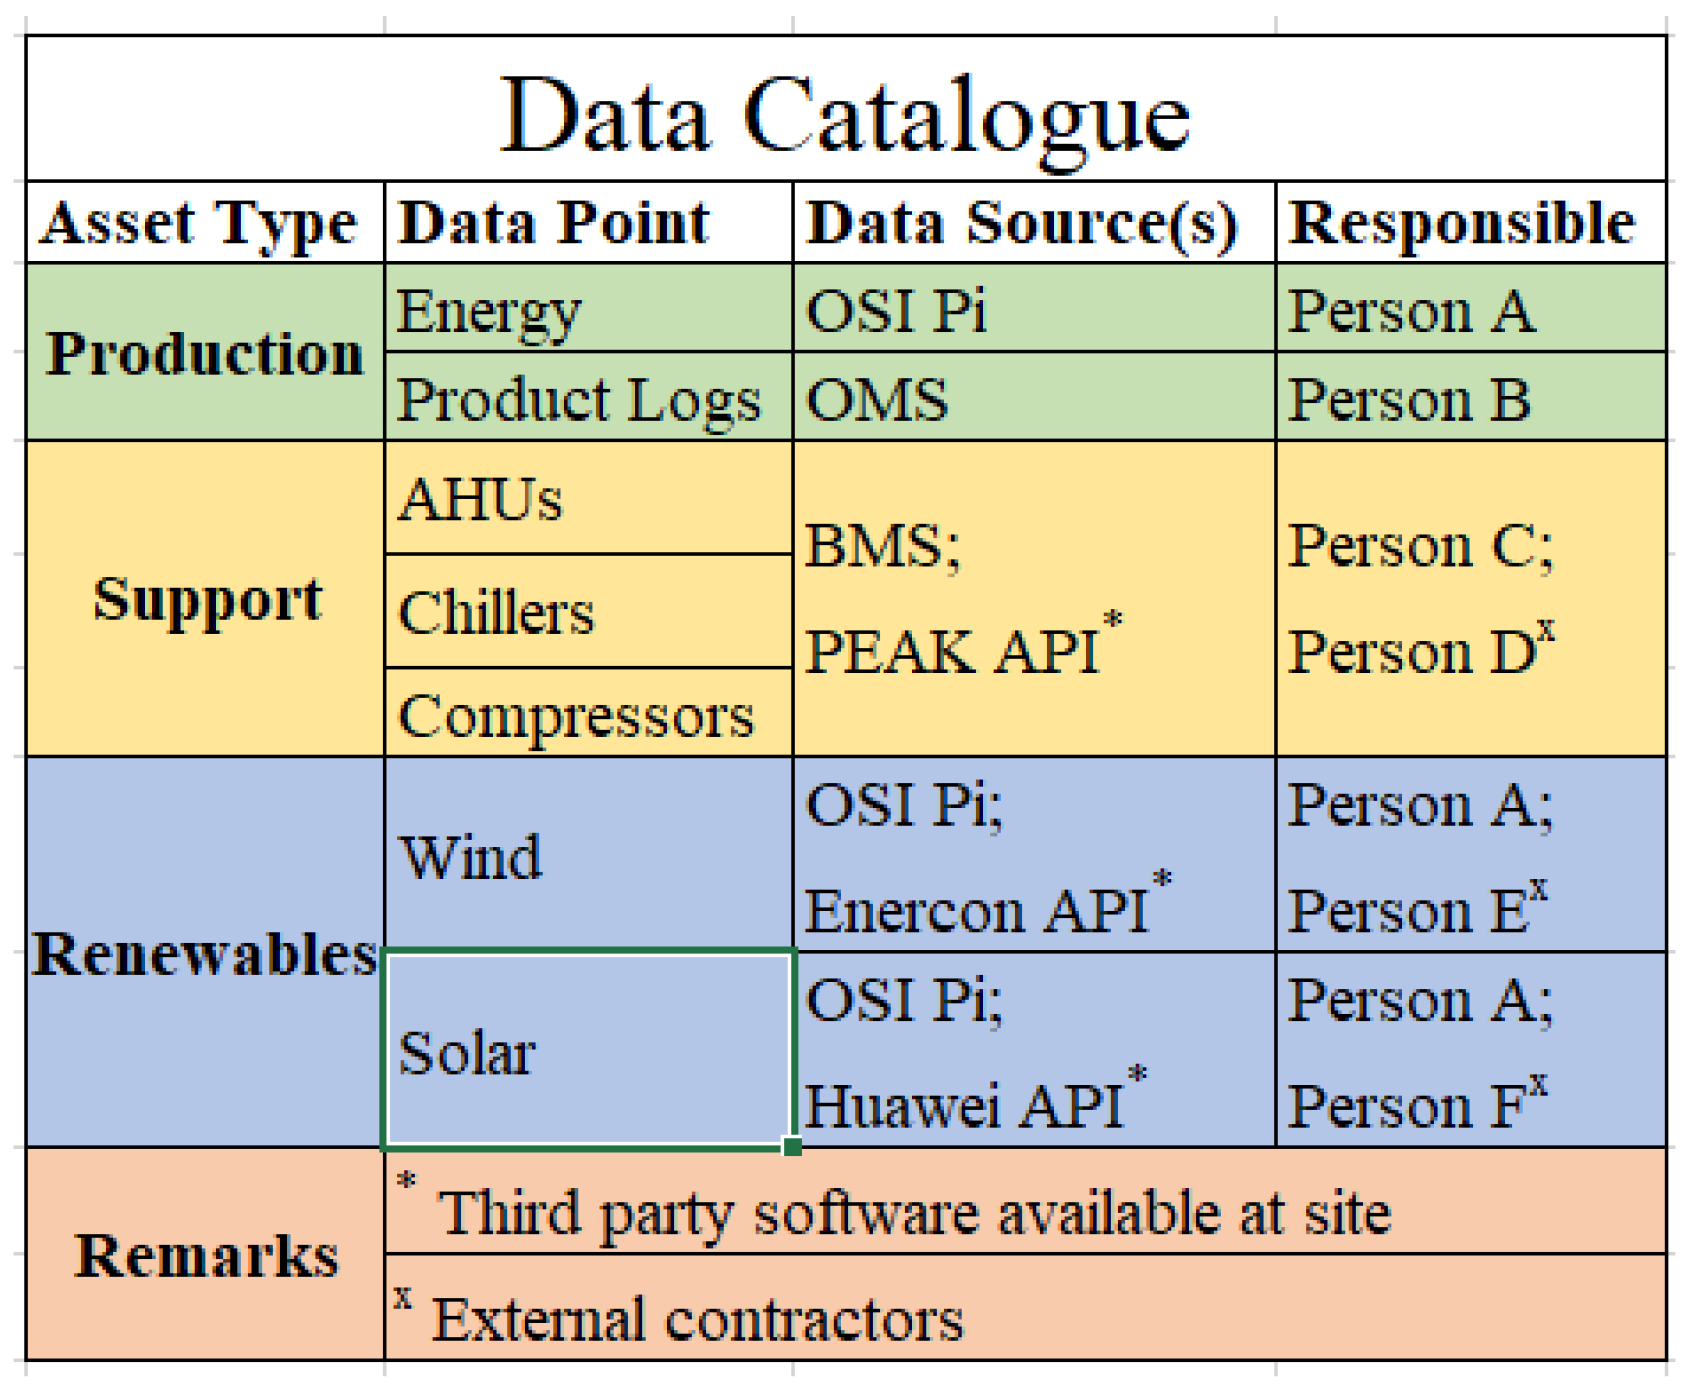
Figure 7.
Schematic diagram of the digital platform at this pilot site
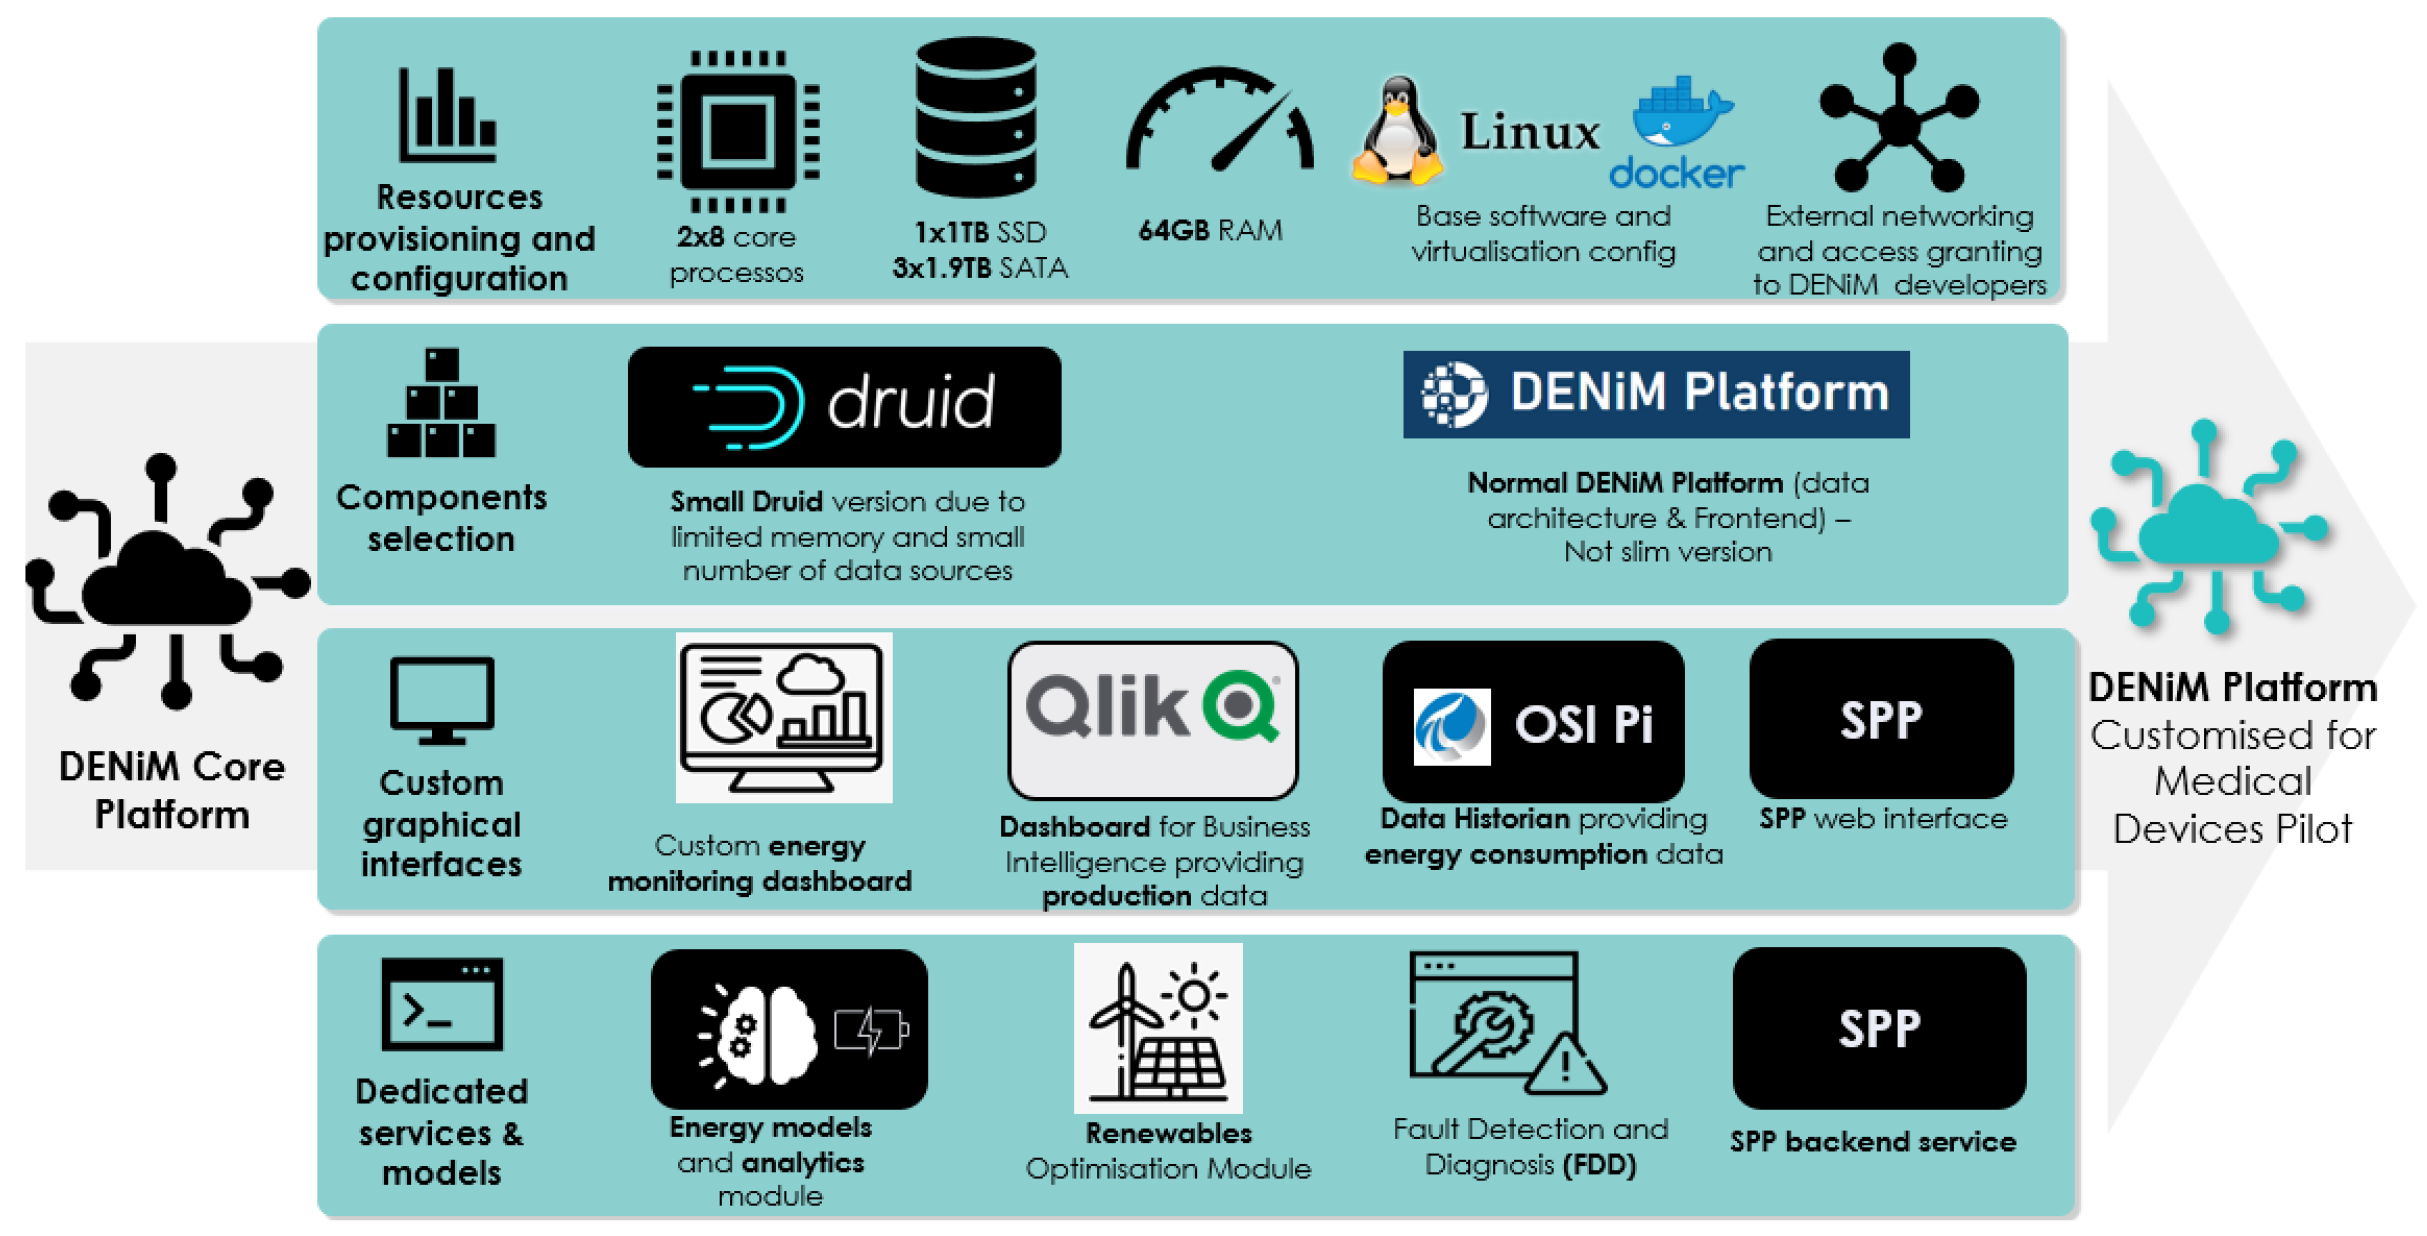
Figure 8.
Sample merged dataset for energy analytics
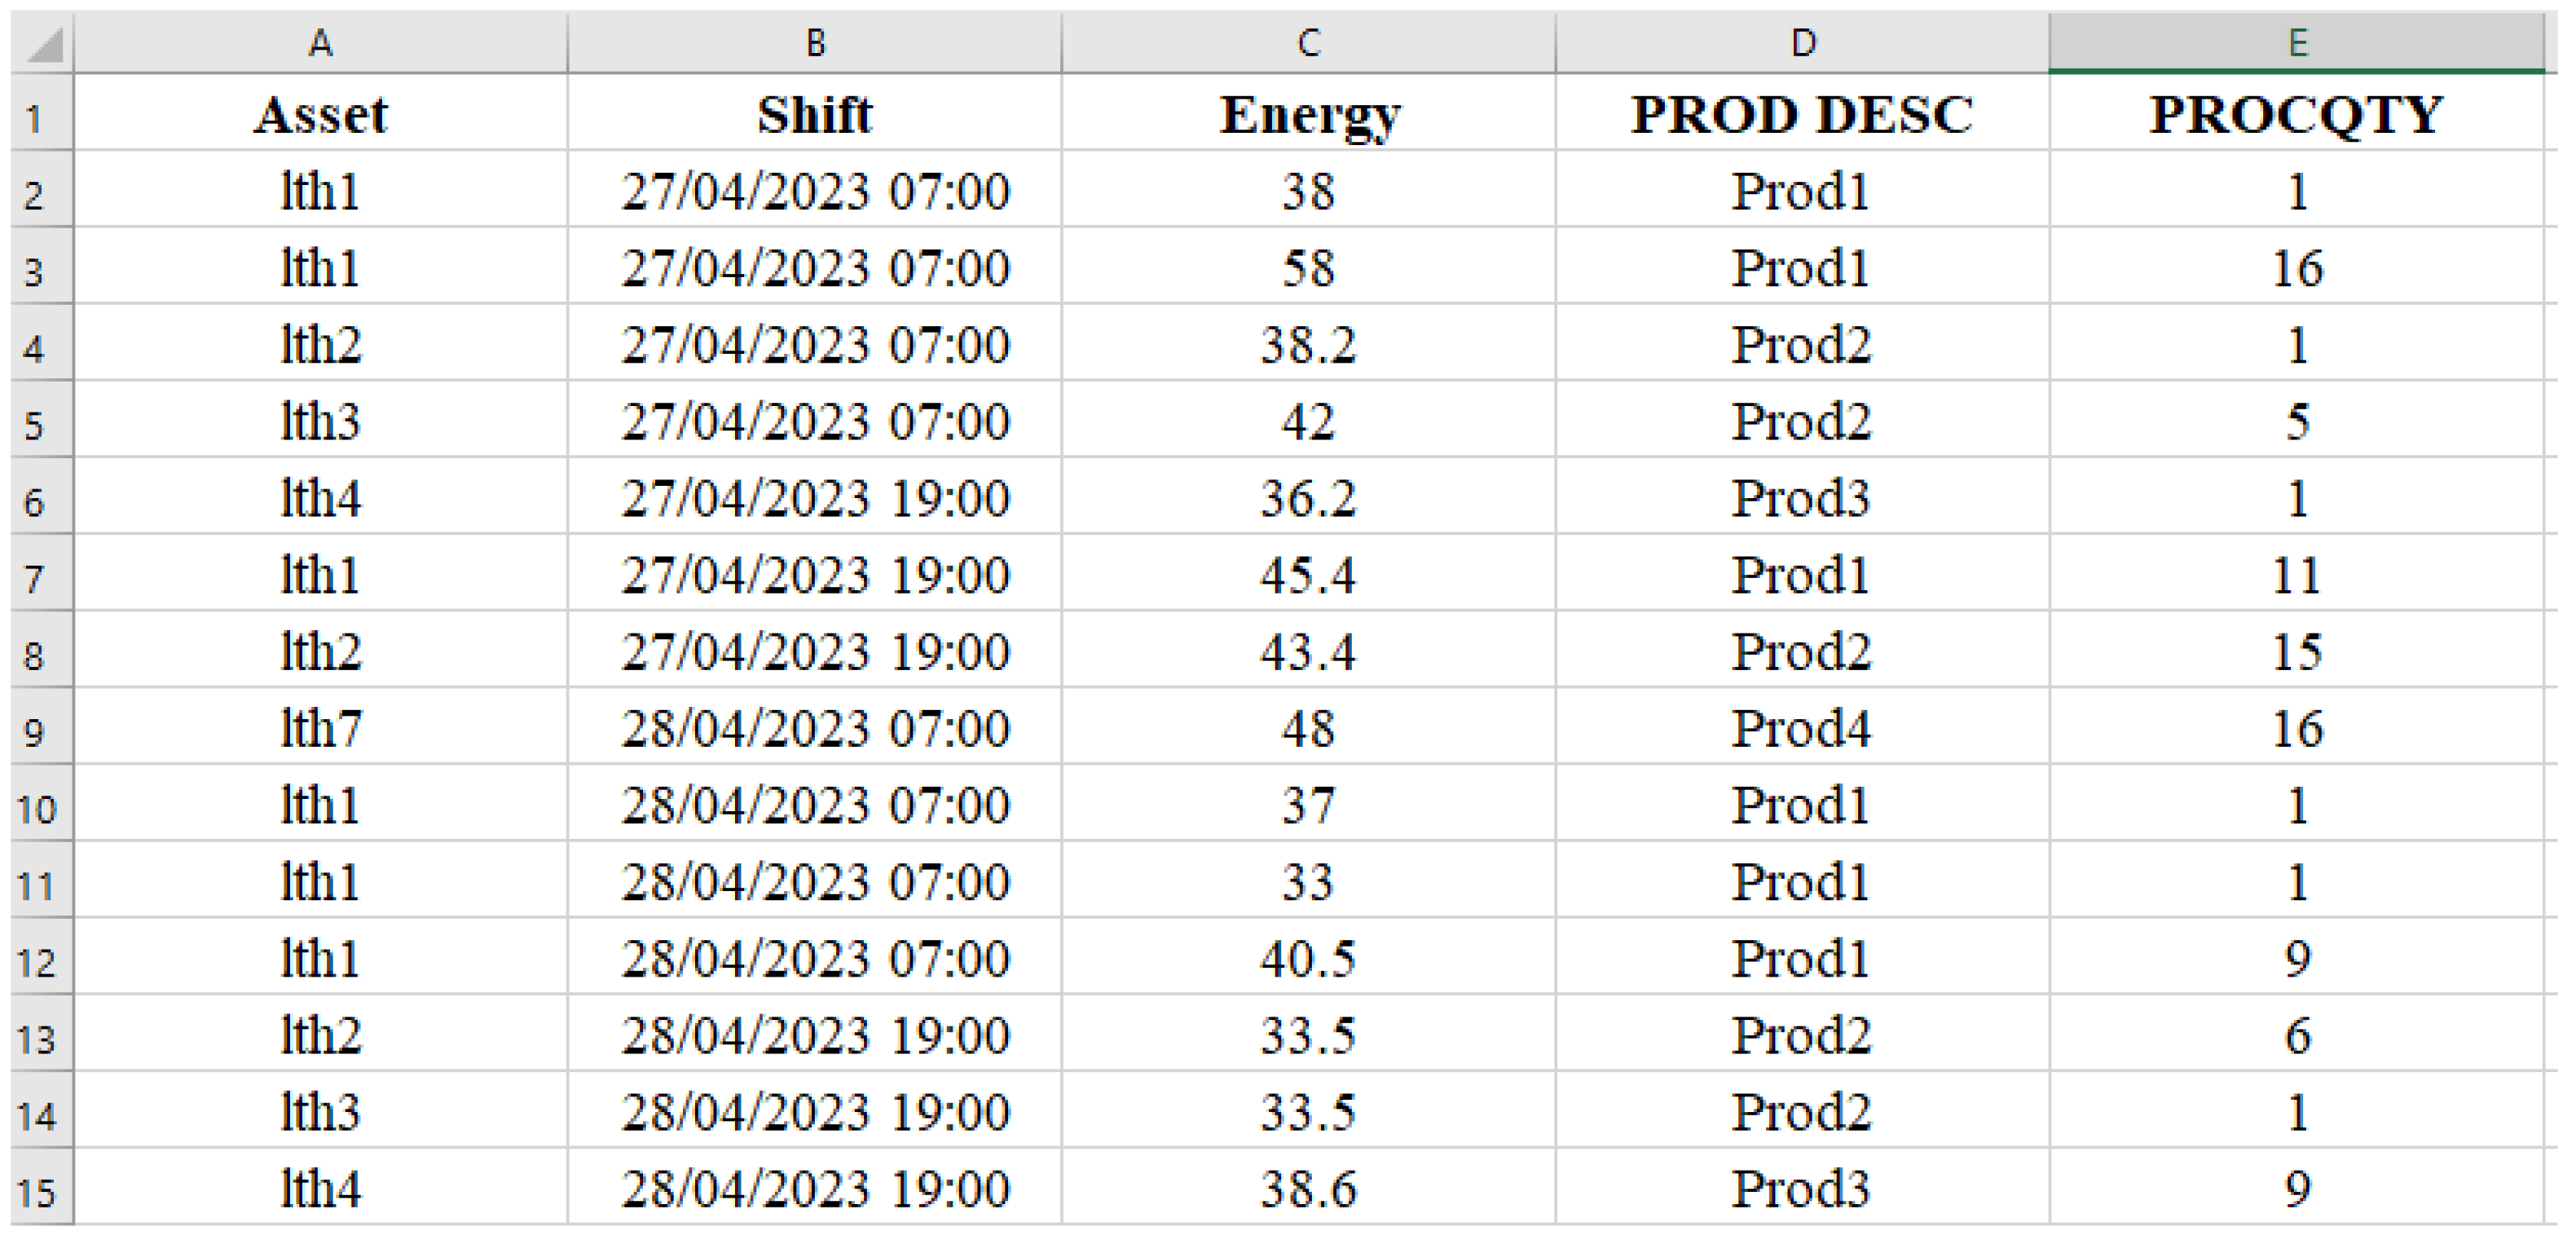
Figure 9.
Results from Data Analysis of Idling Energy
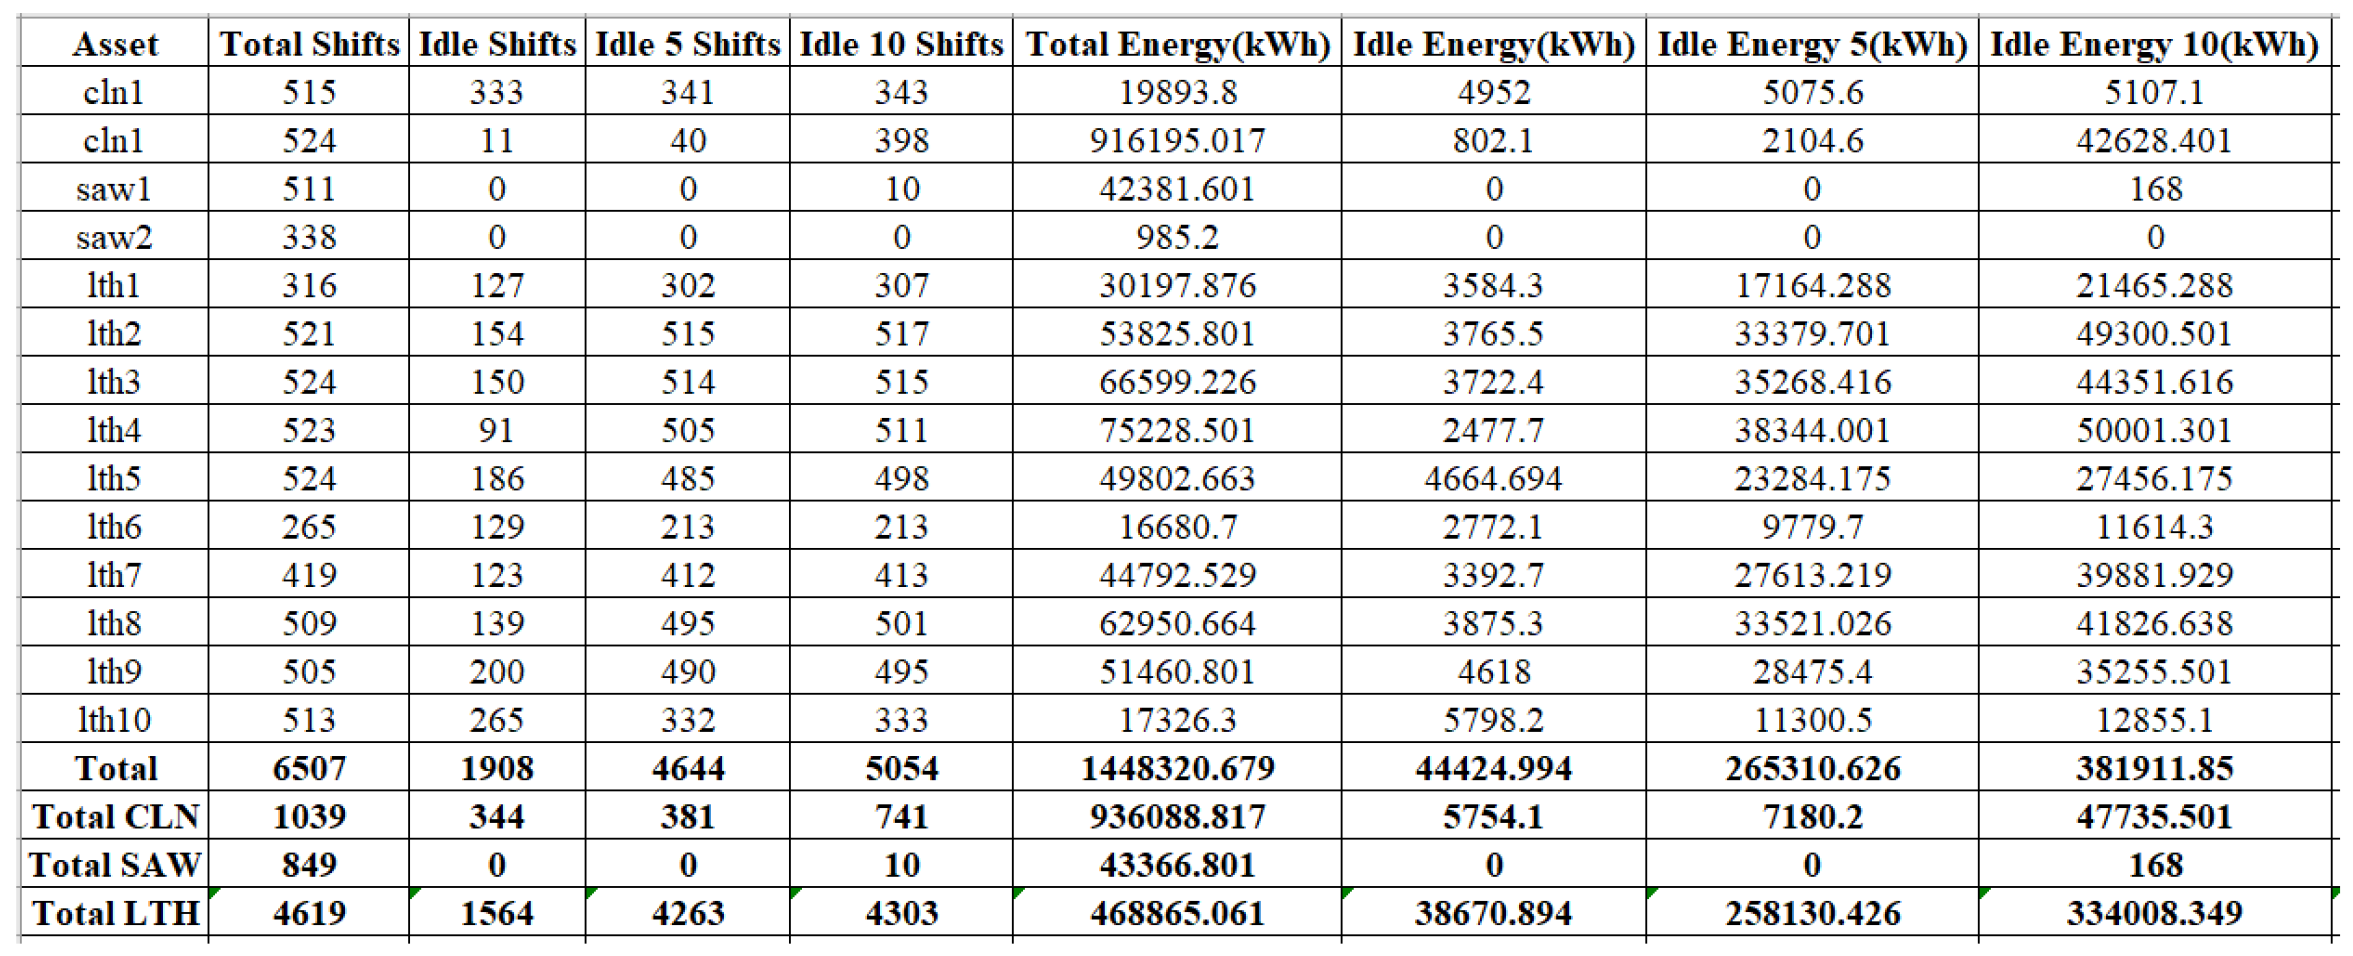
Figure 10.
Sample results of the energy model
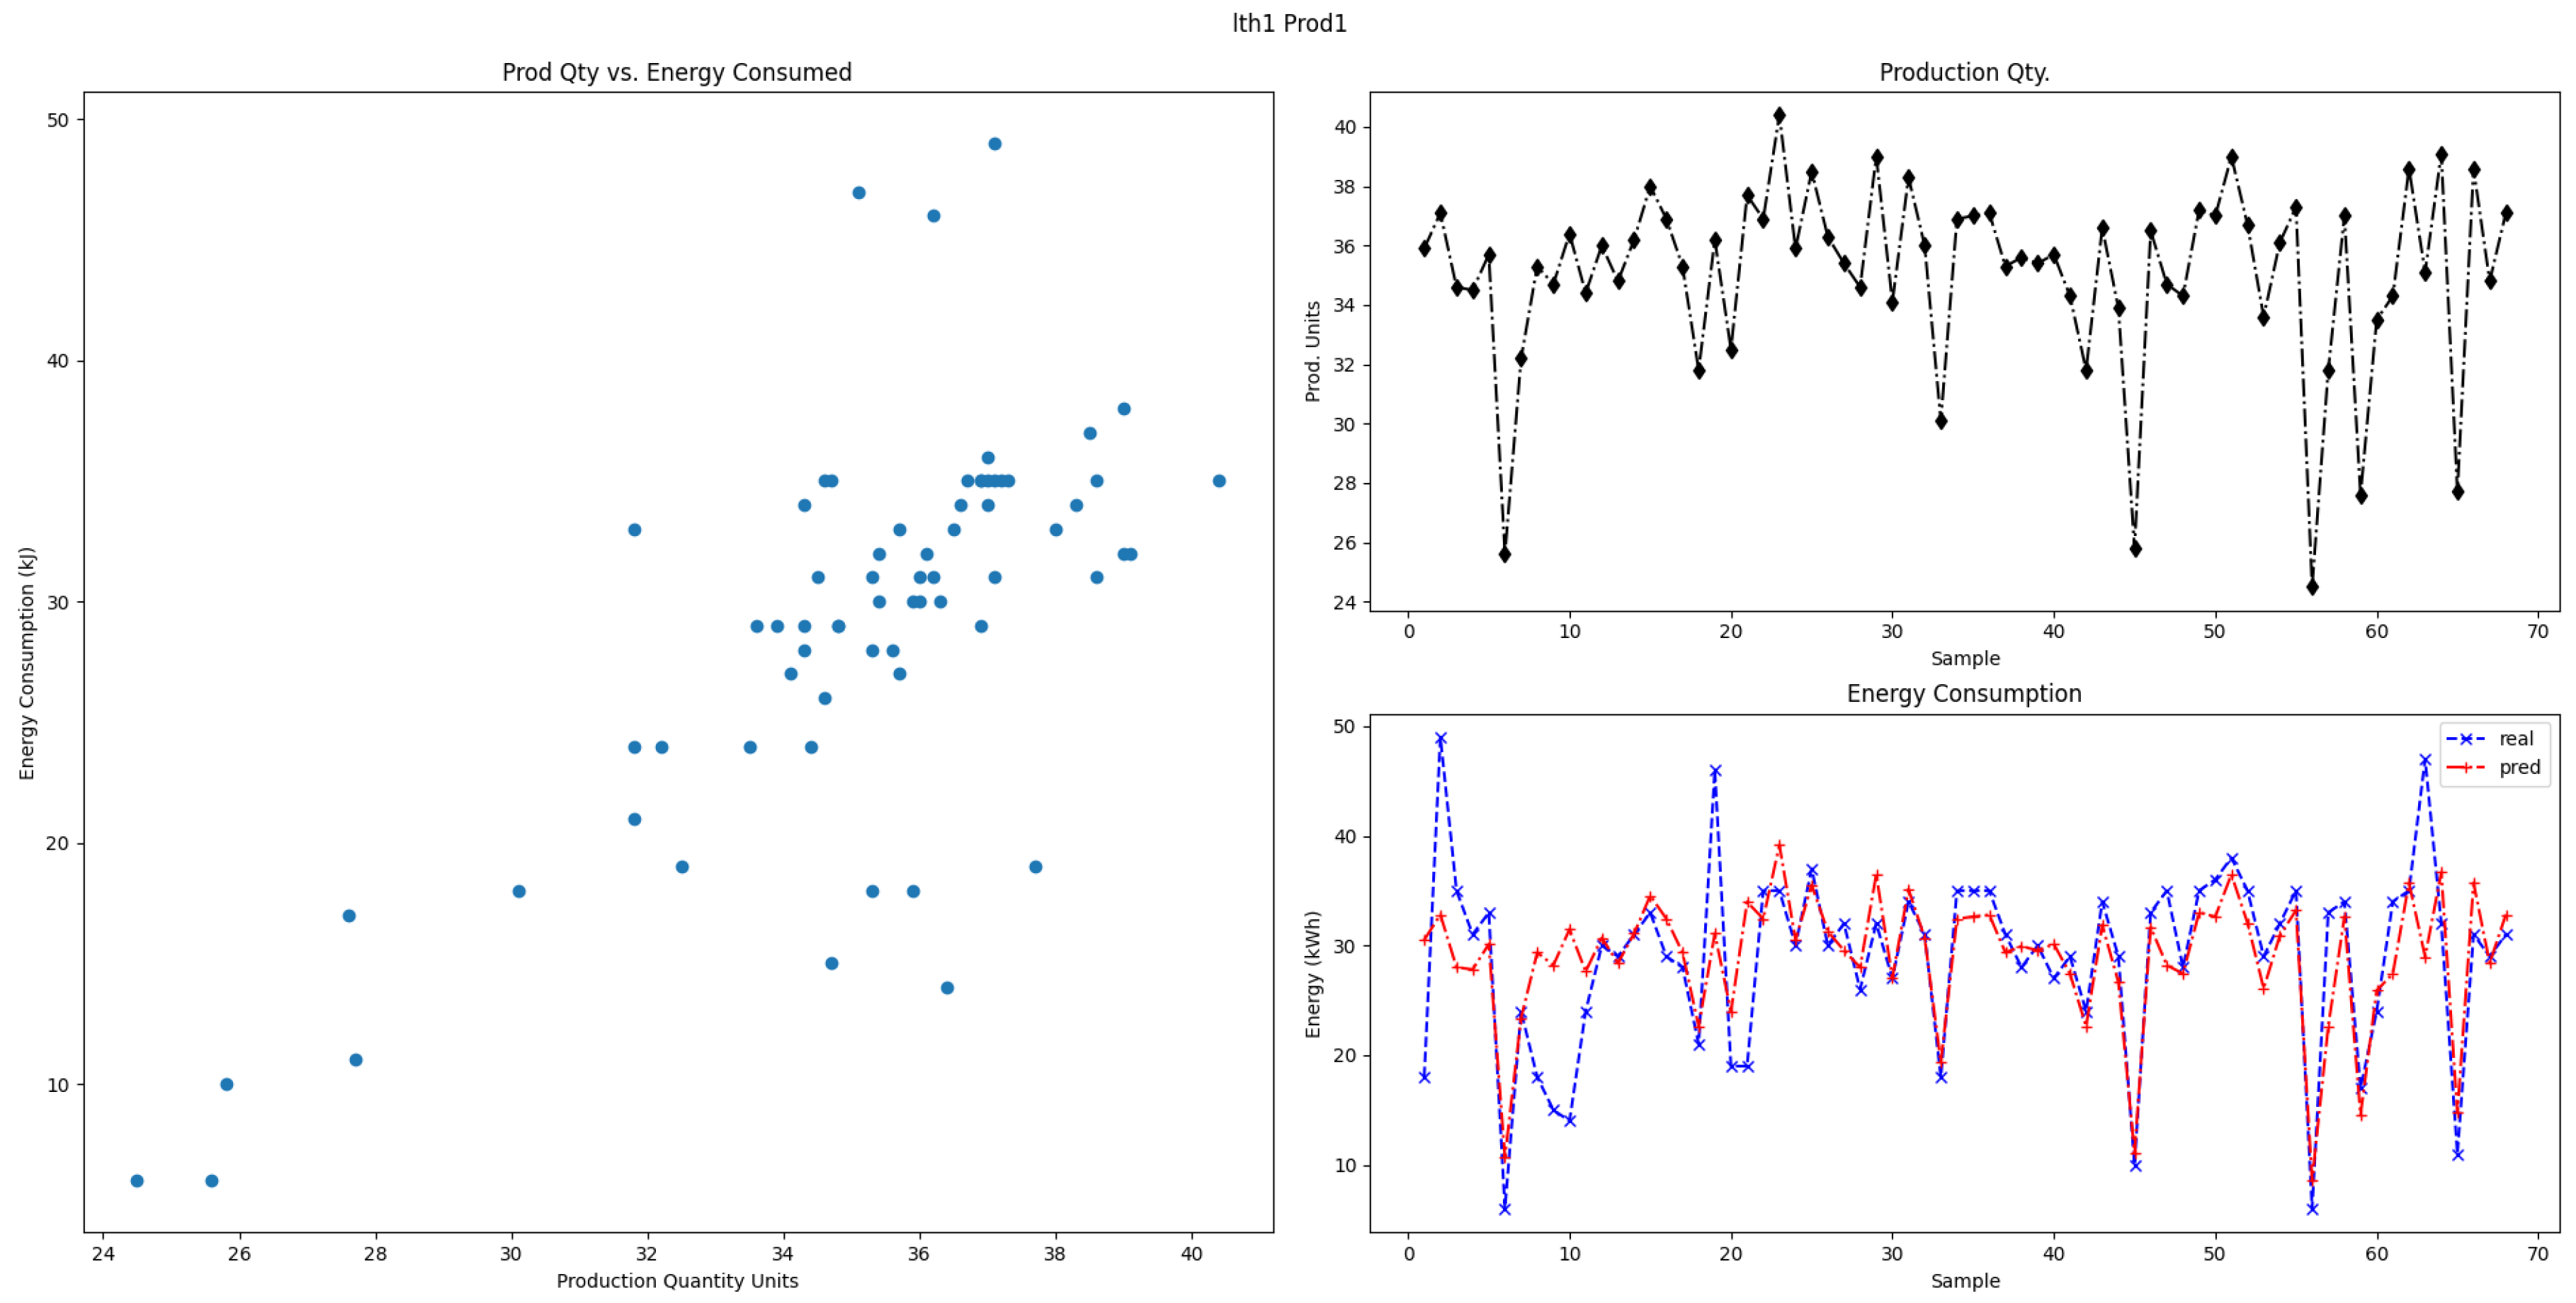
Figure 11.
Energy consumption for normal operation vs. damper stuck fault
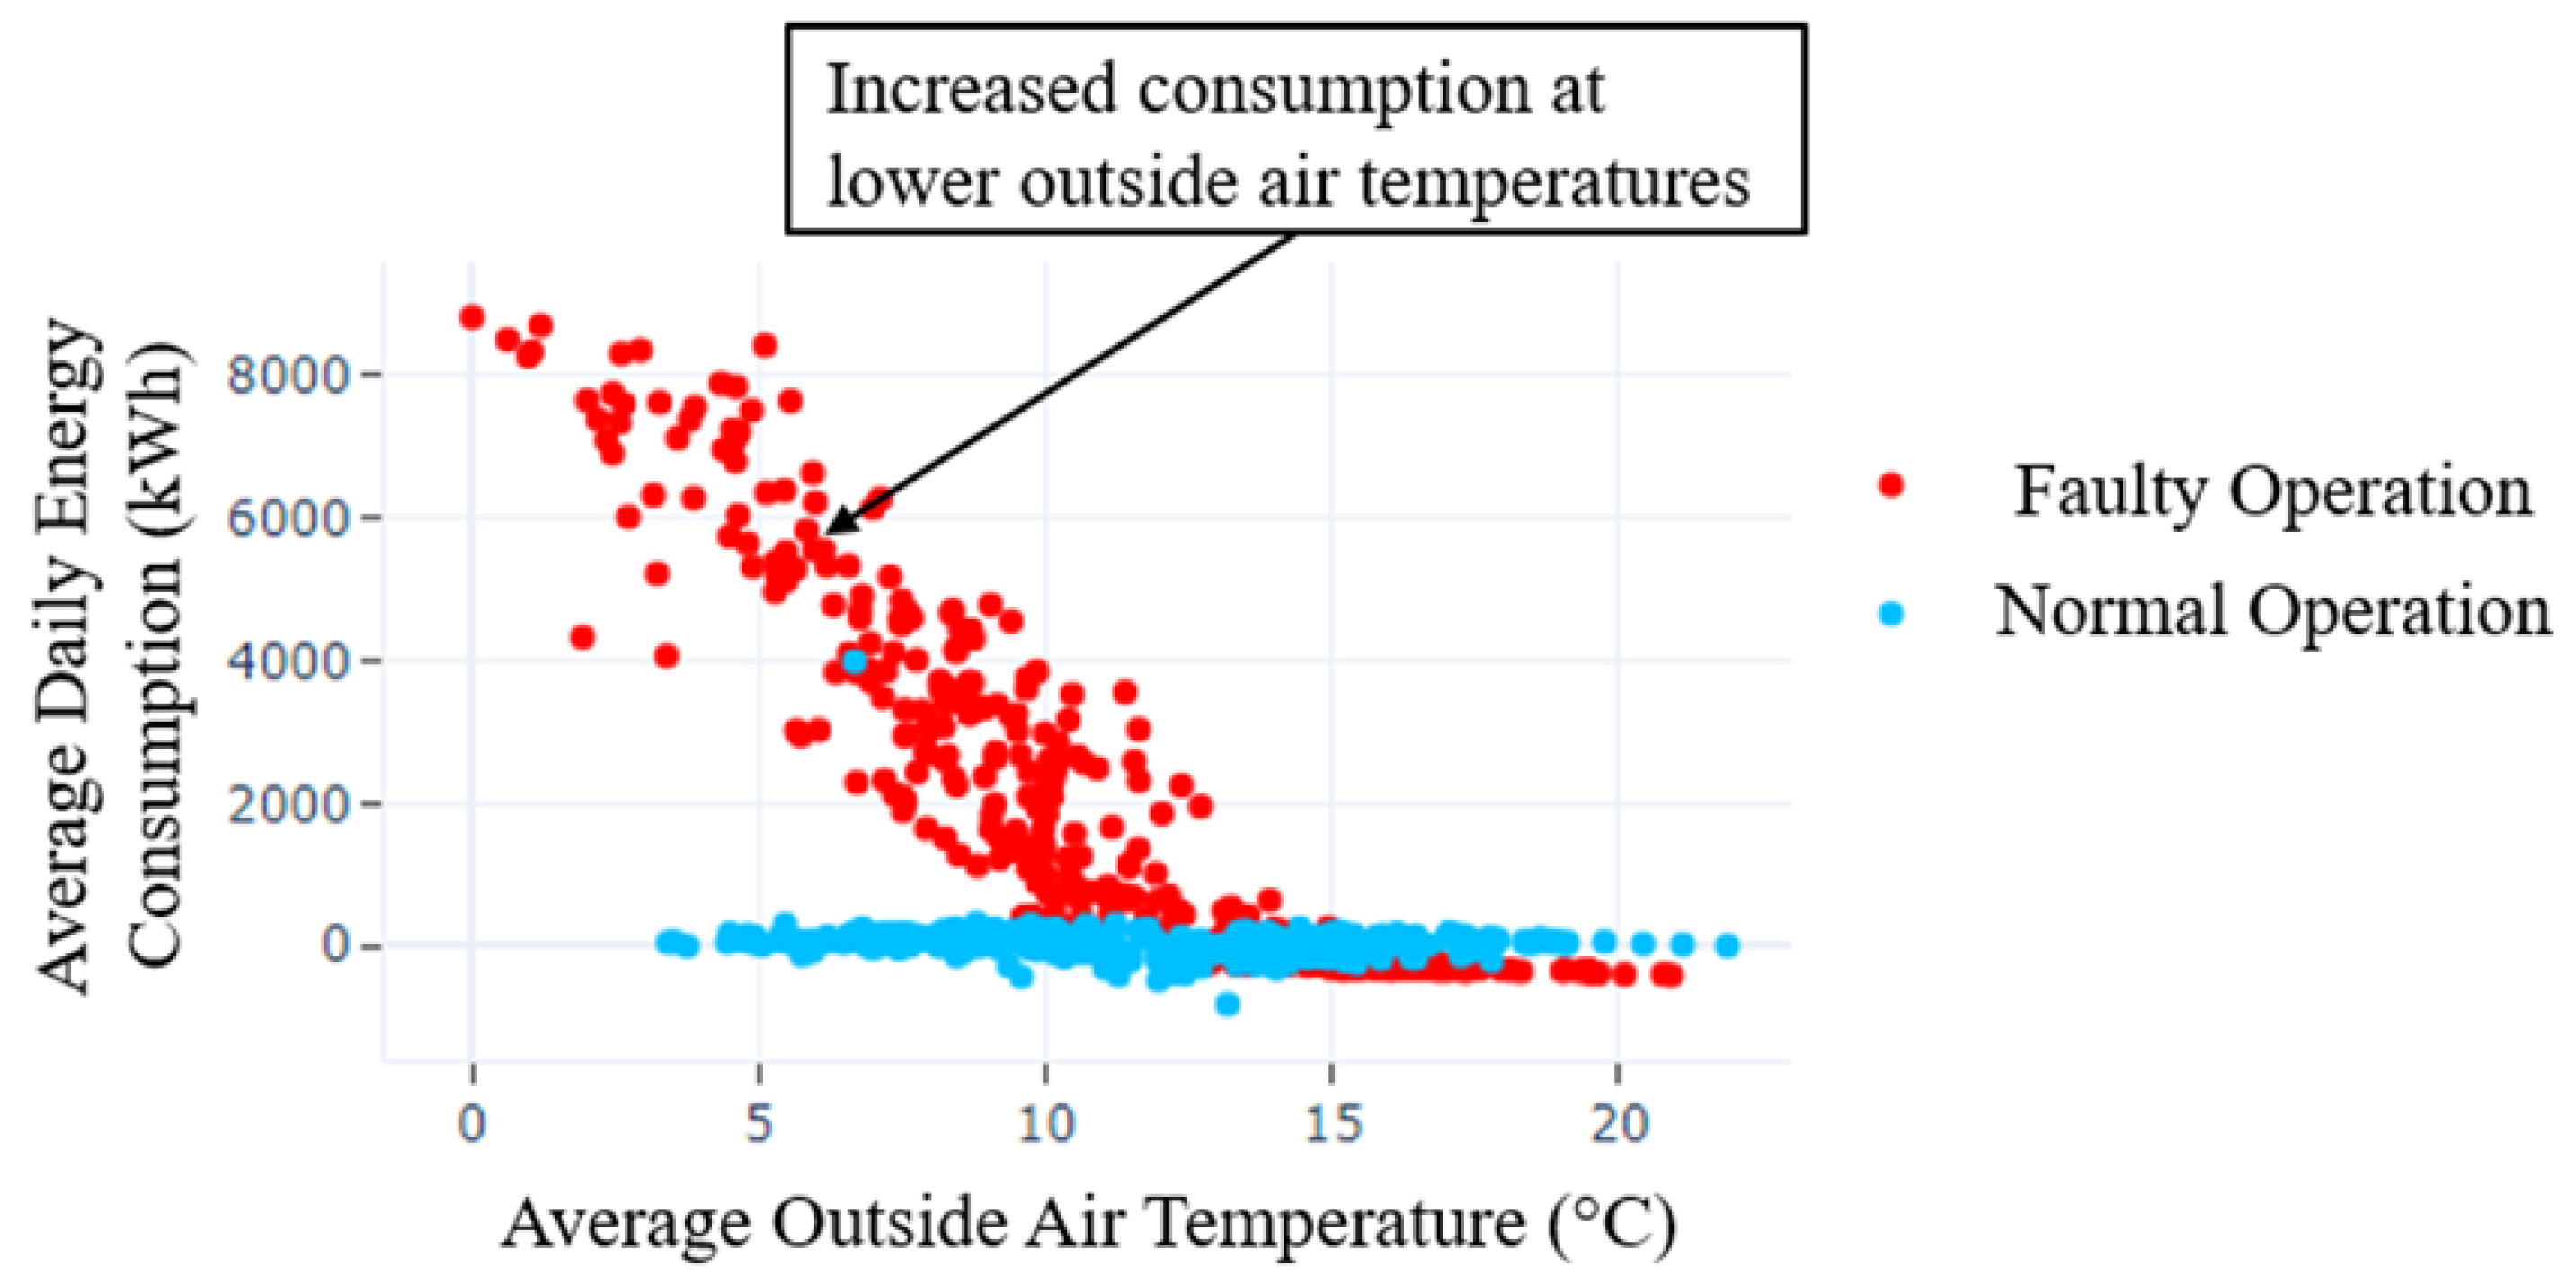
Figure 12.
Schematic diagram of the microgrid at the facility
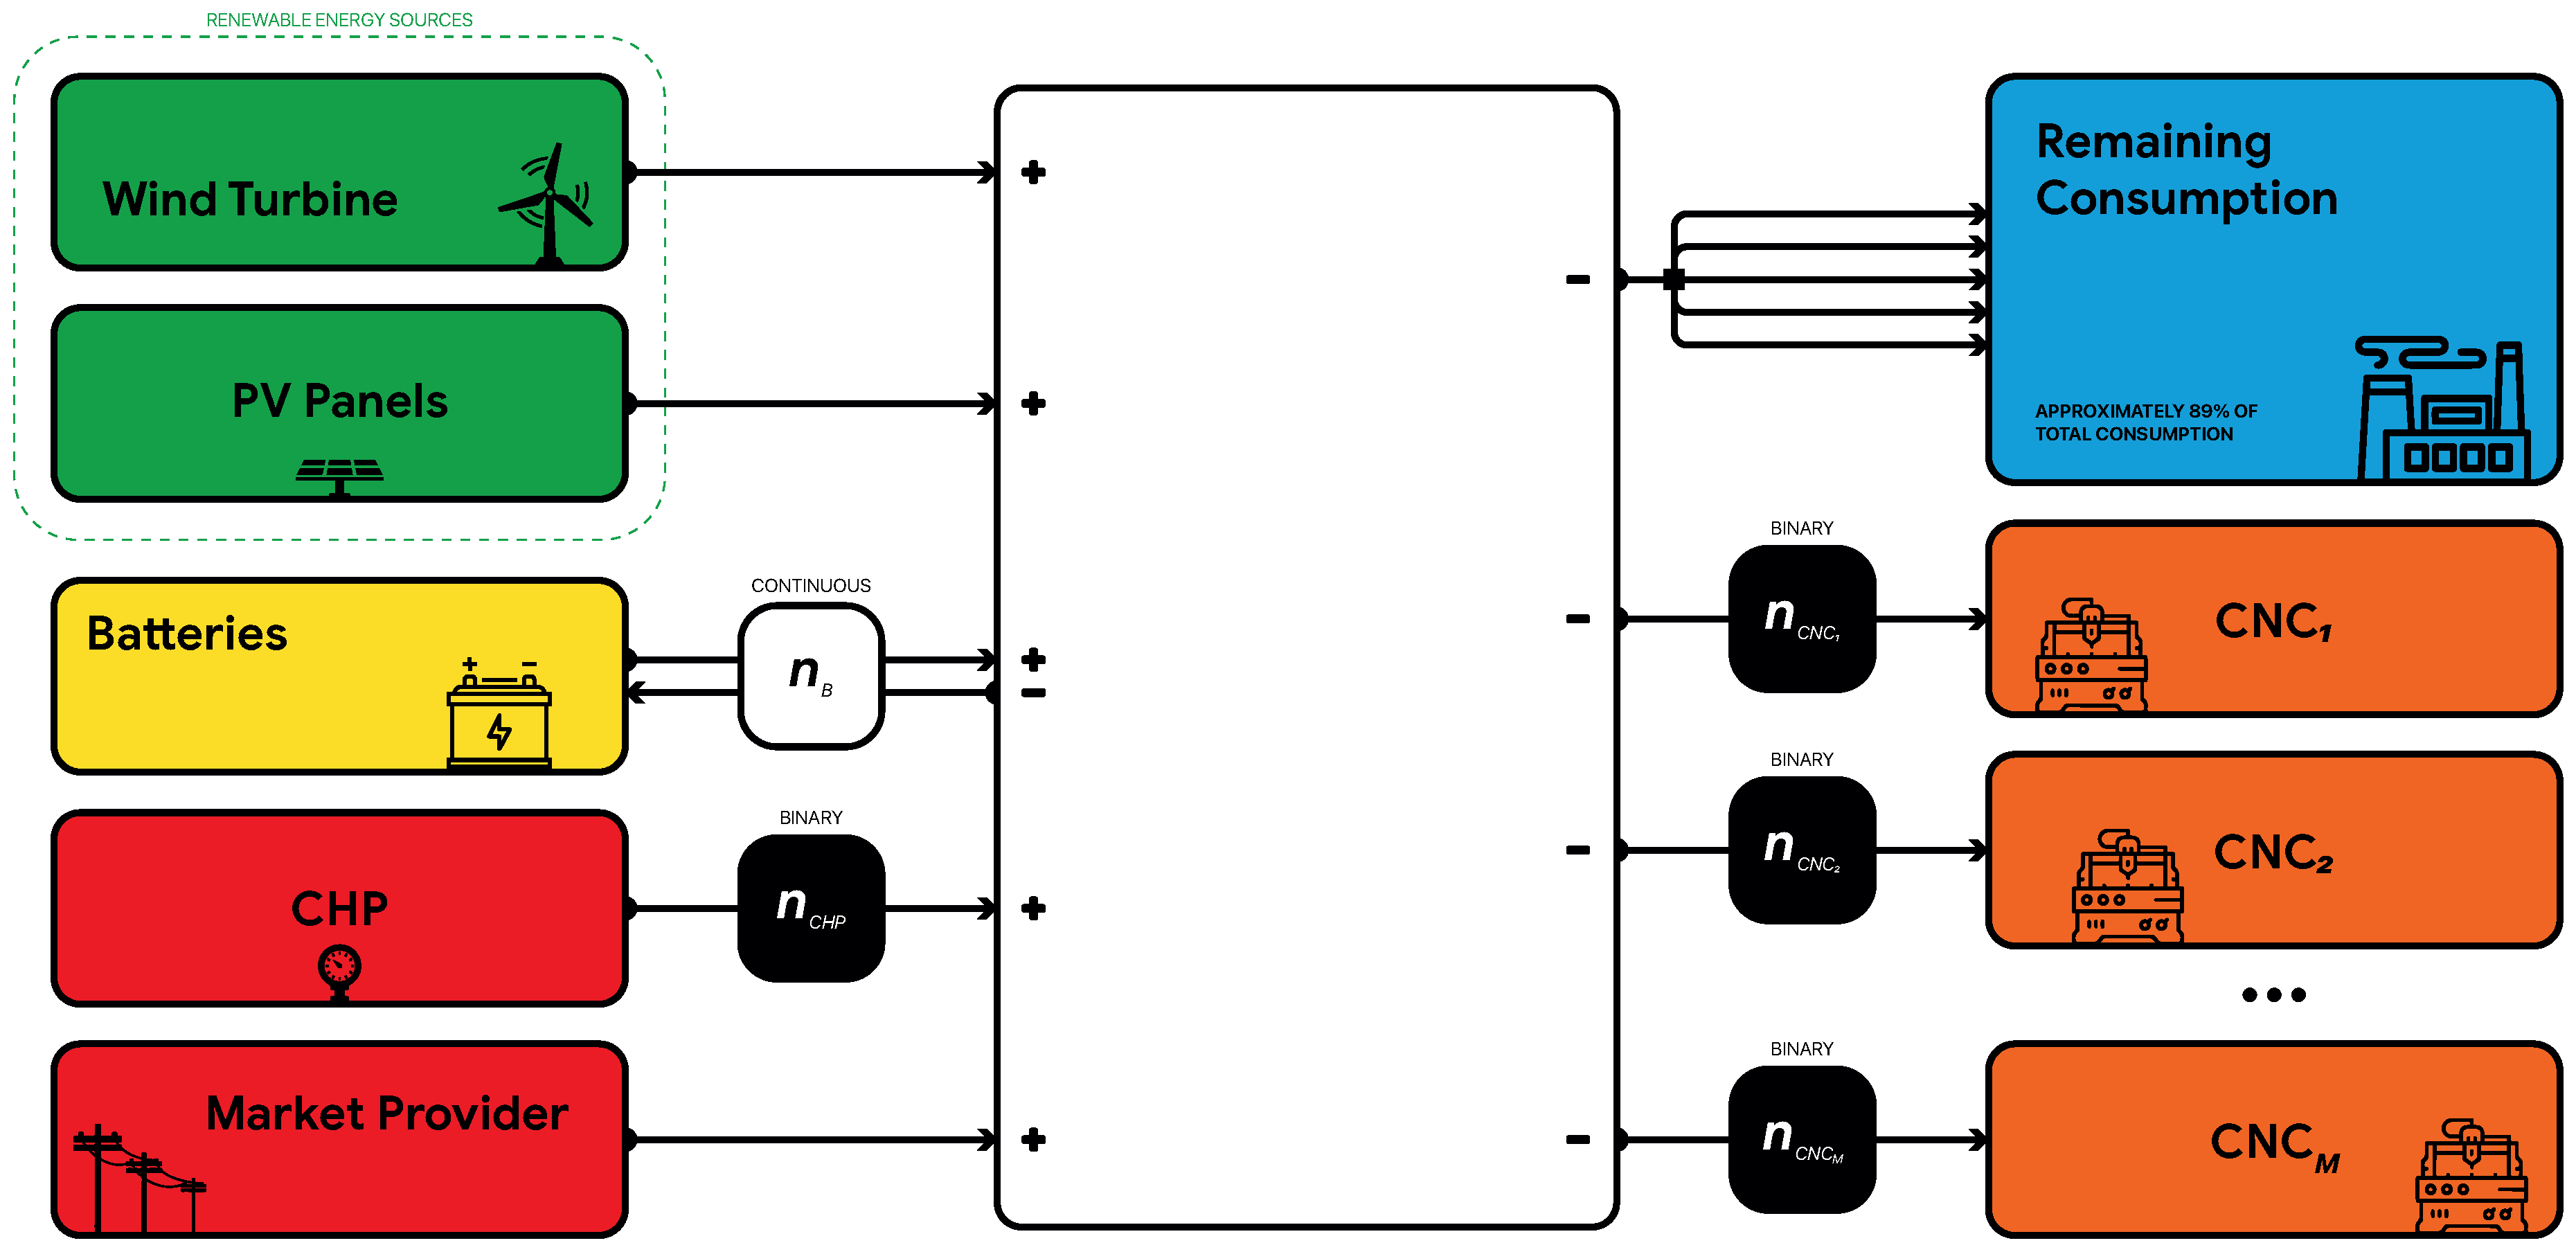
Figure 13.
Neurofuzzy Mode to predict the active power of a Photovoltaics plant
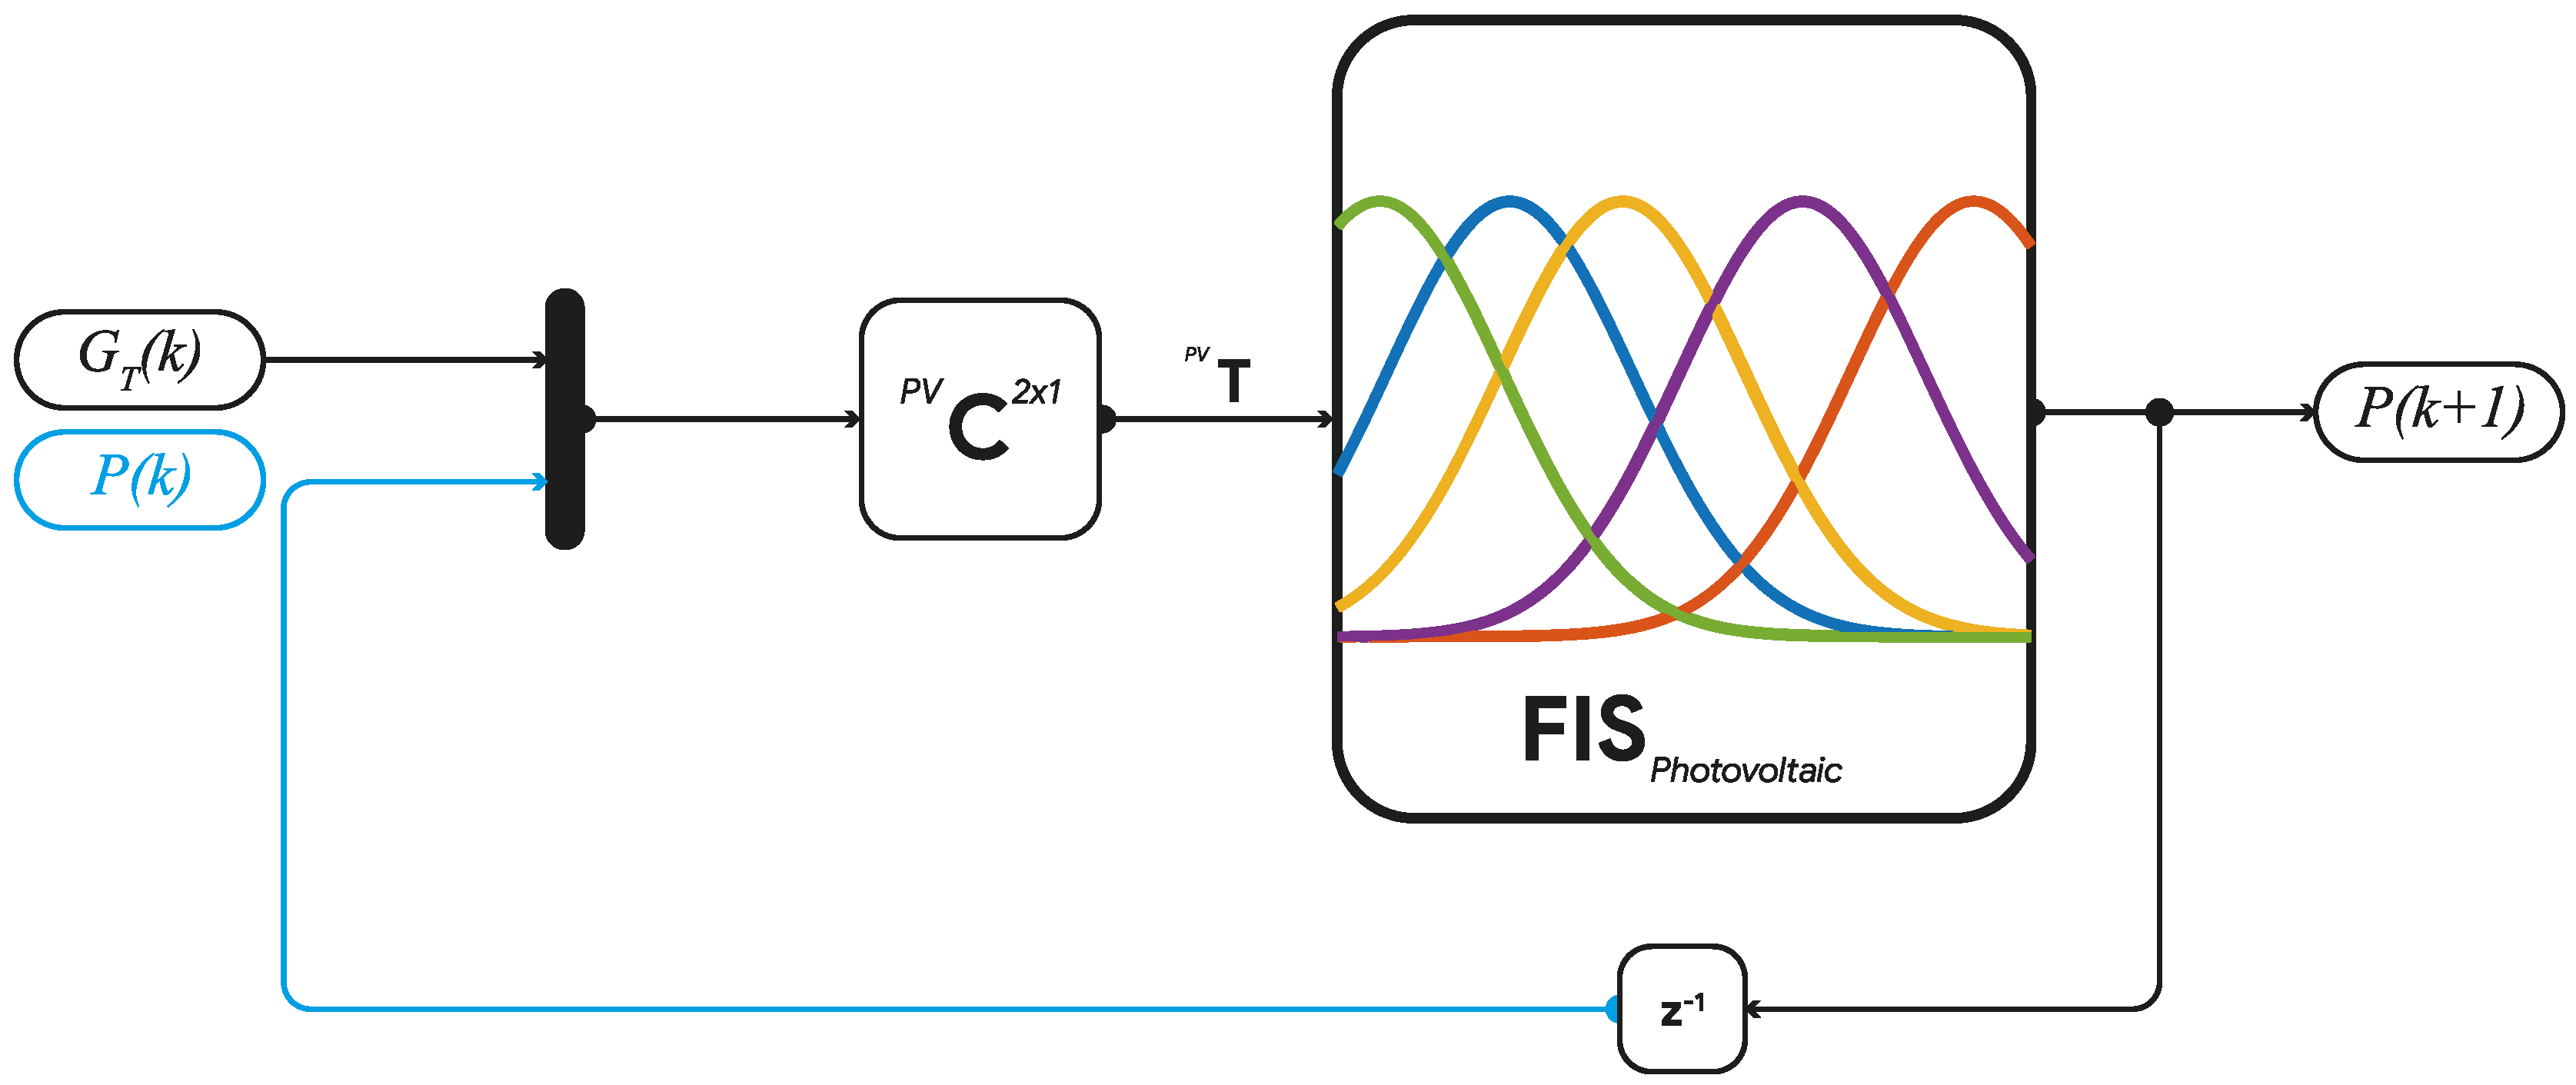
Figure 14.
Neurofuzzy Model to predict the active power of a wind turbine.
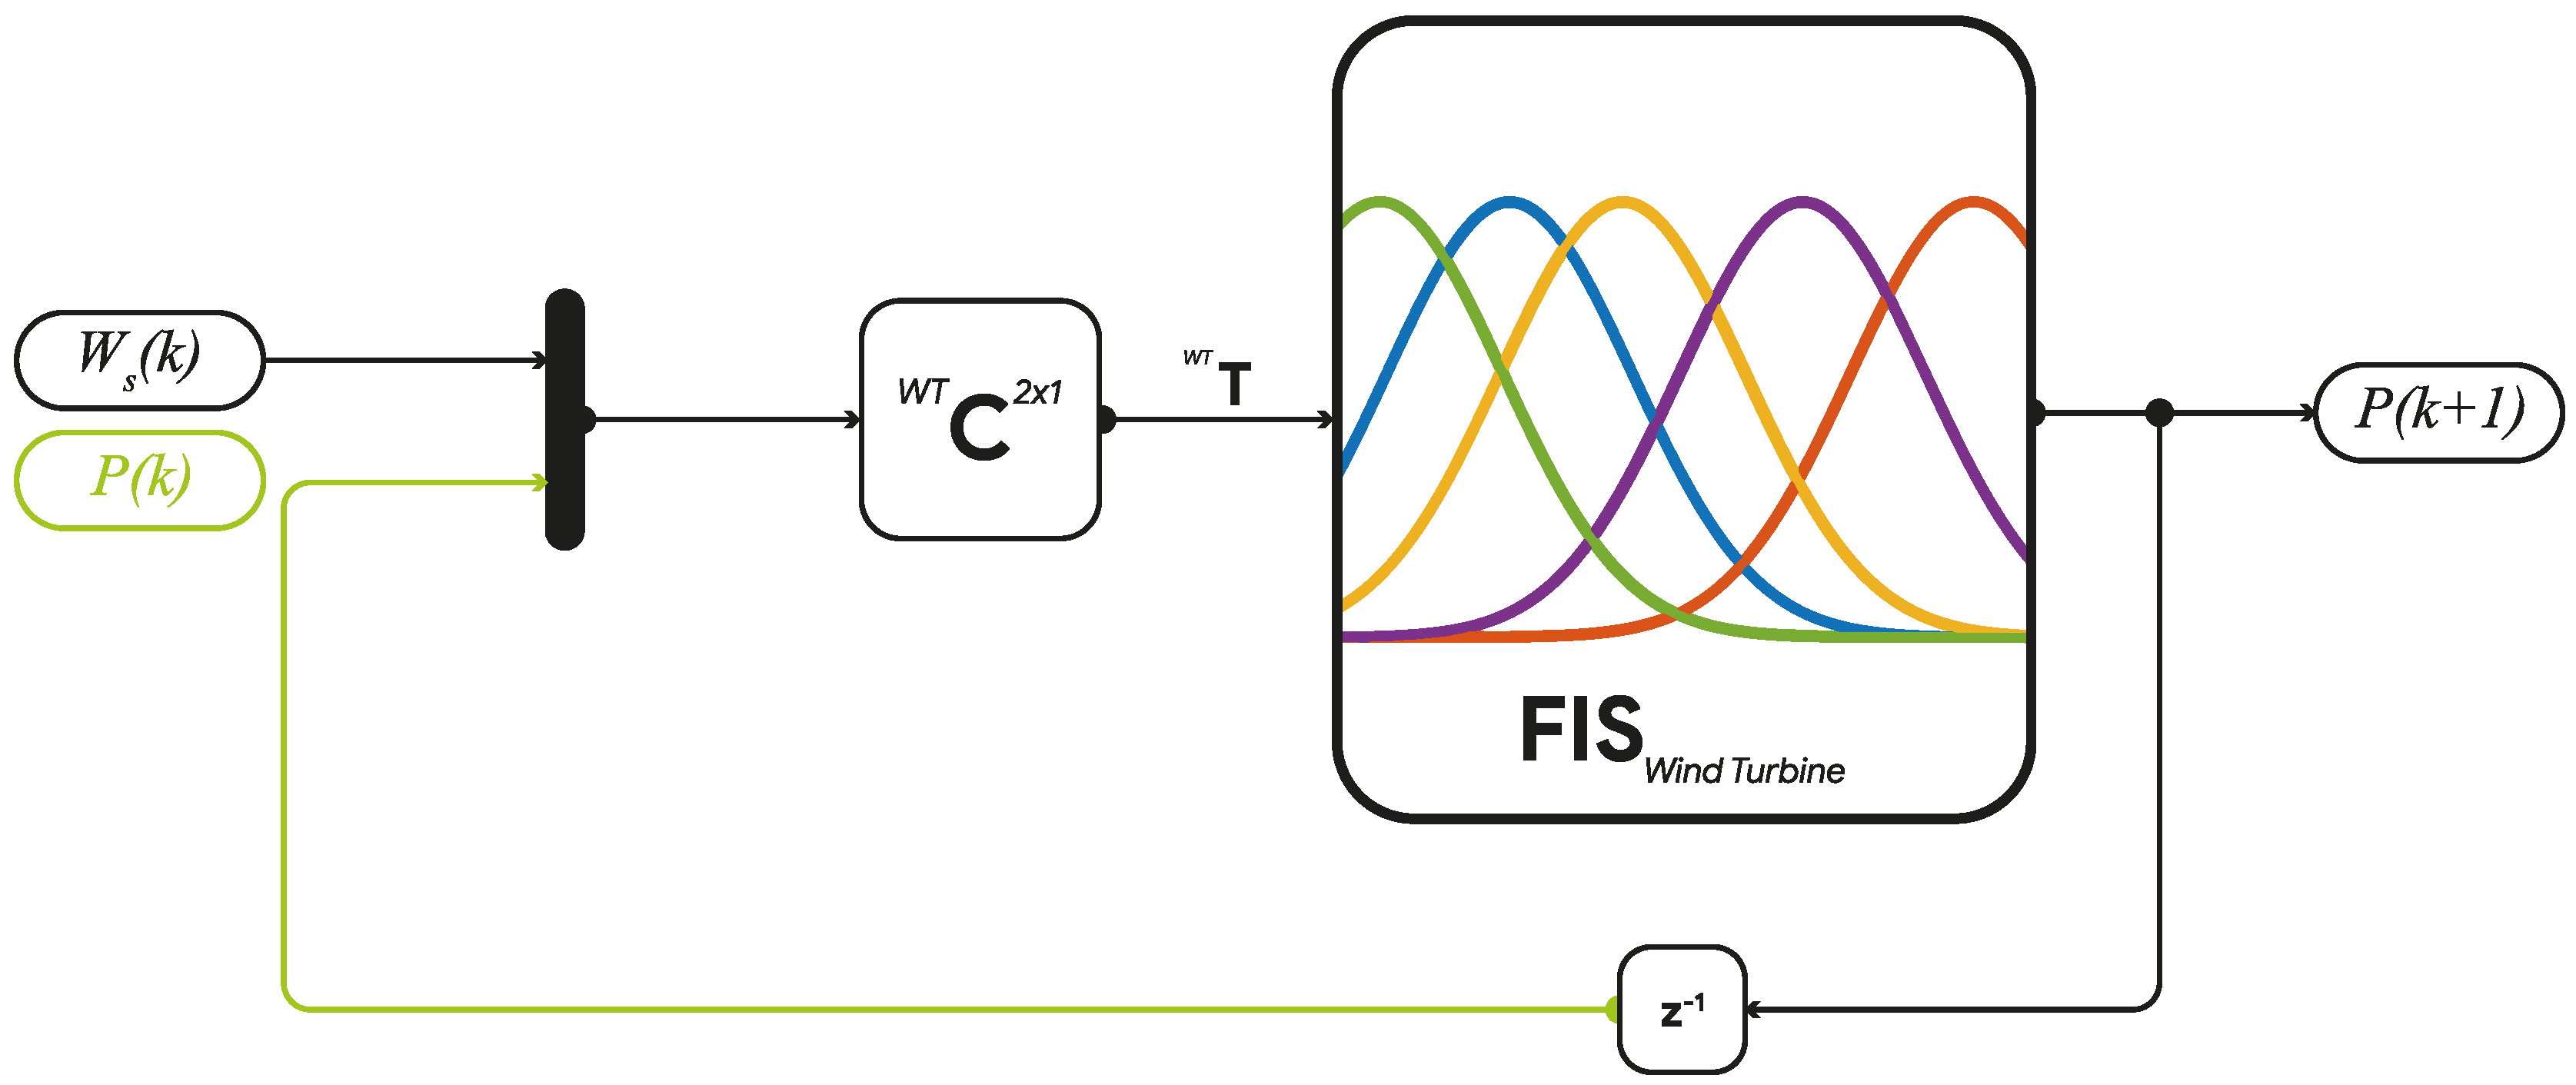
Figure 15.
Photovoltaic : Validation results
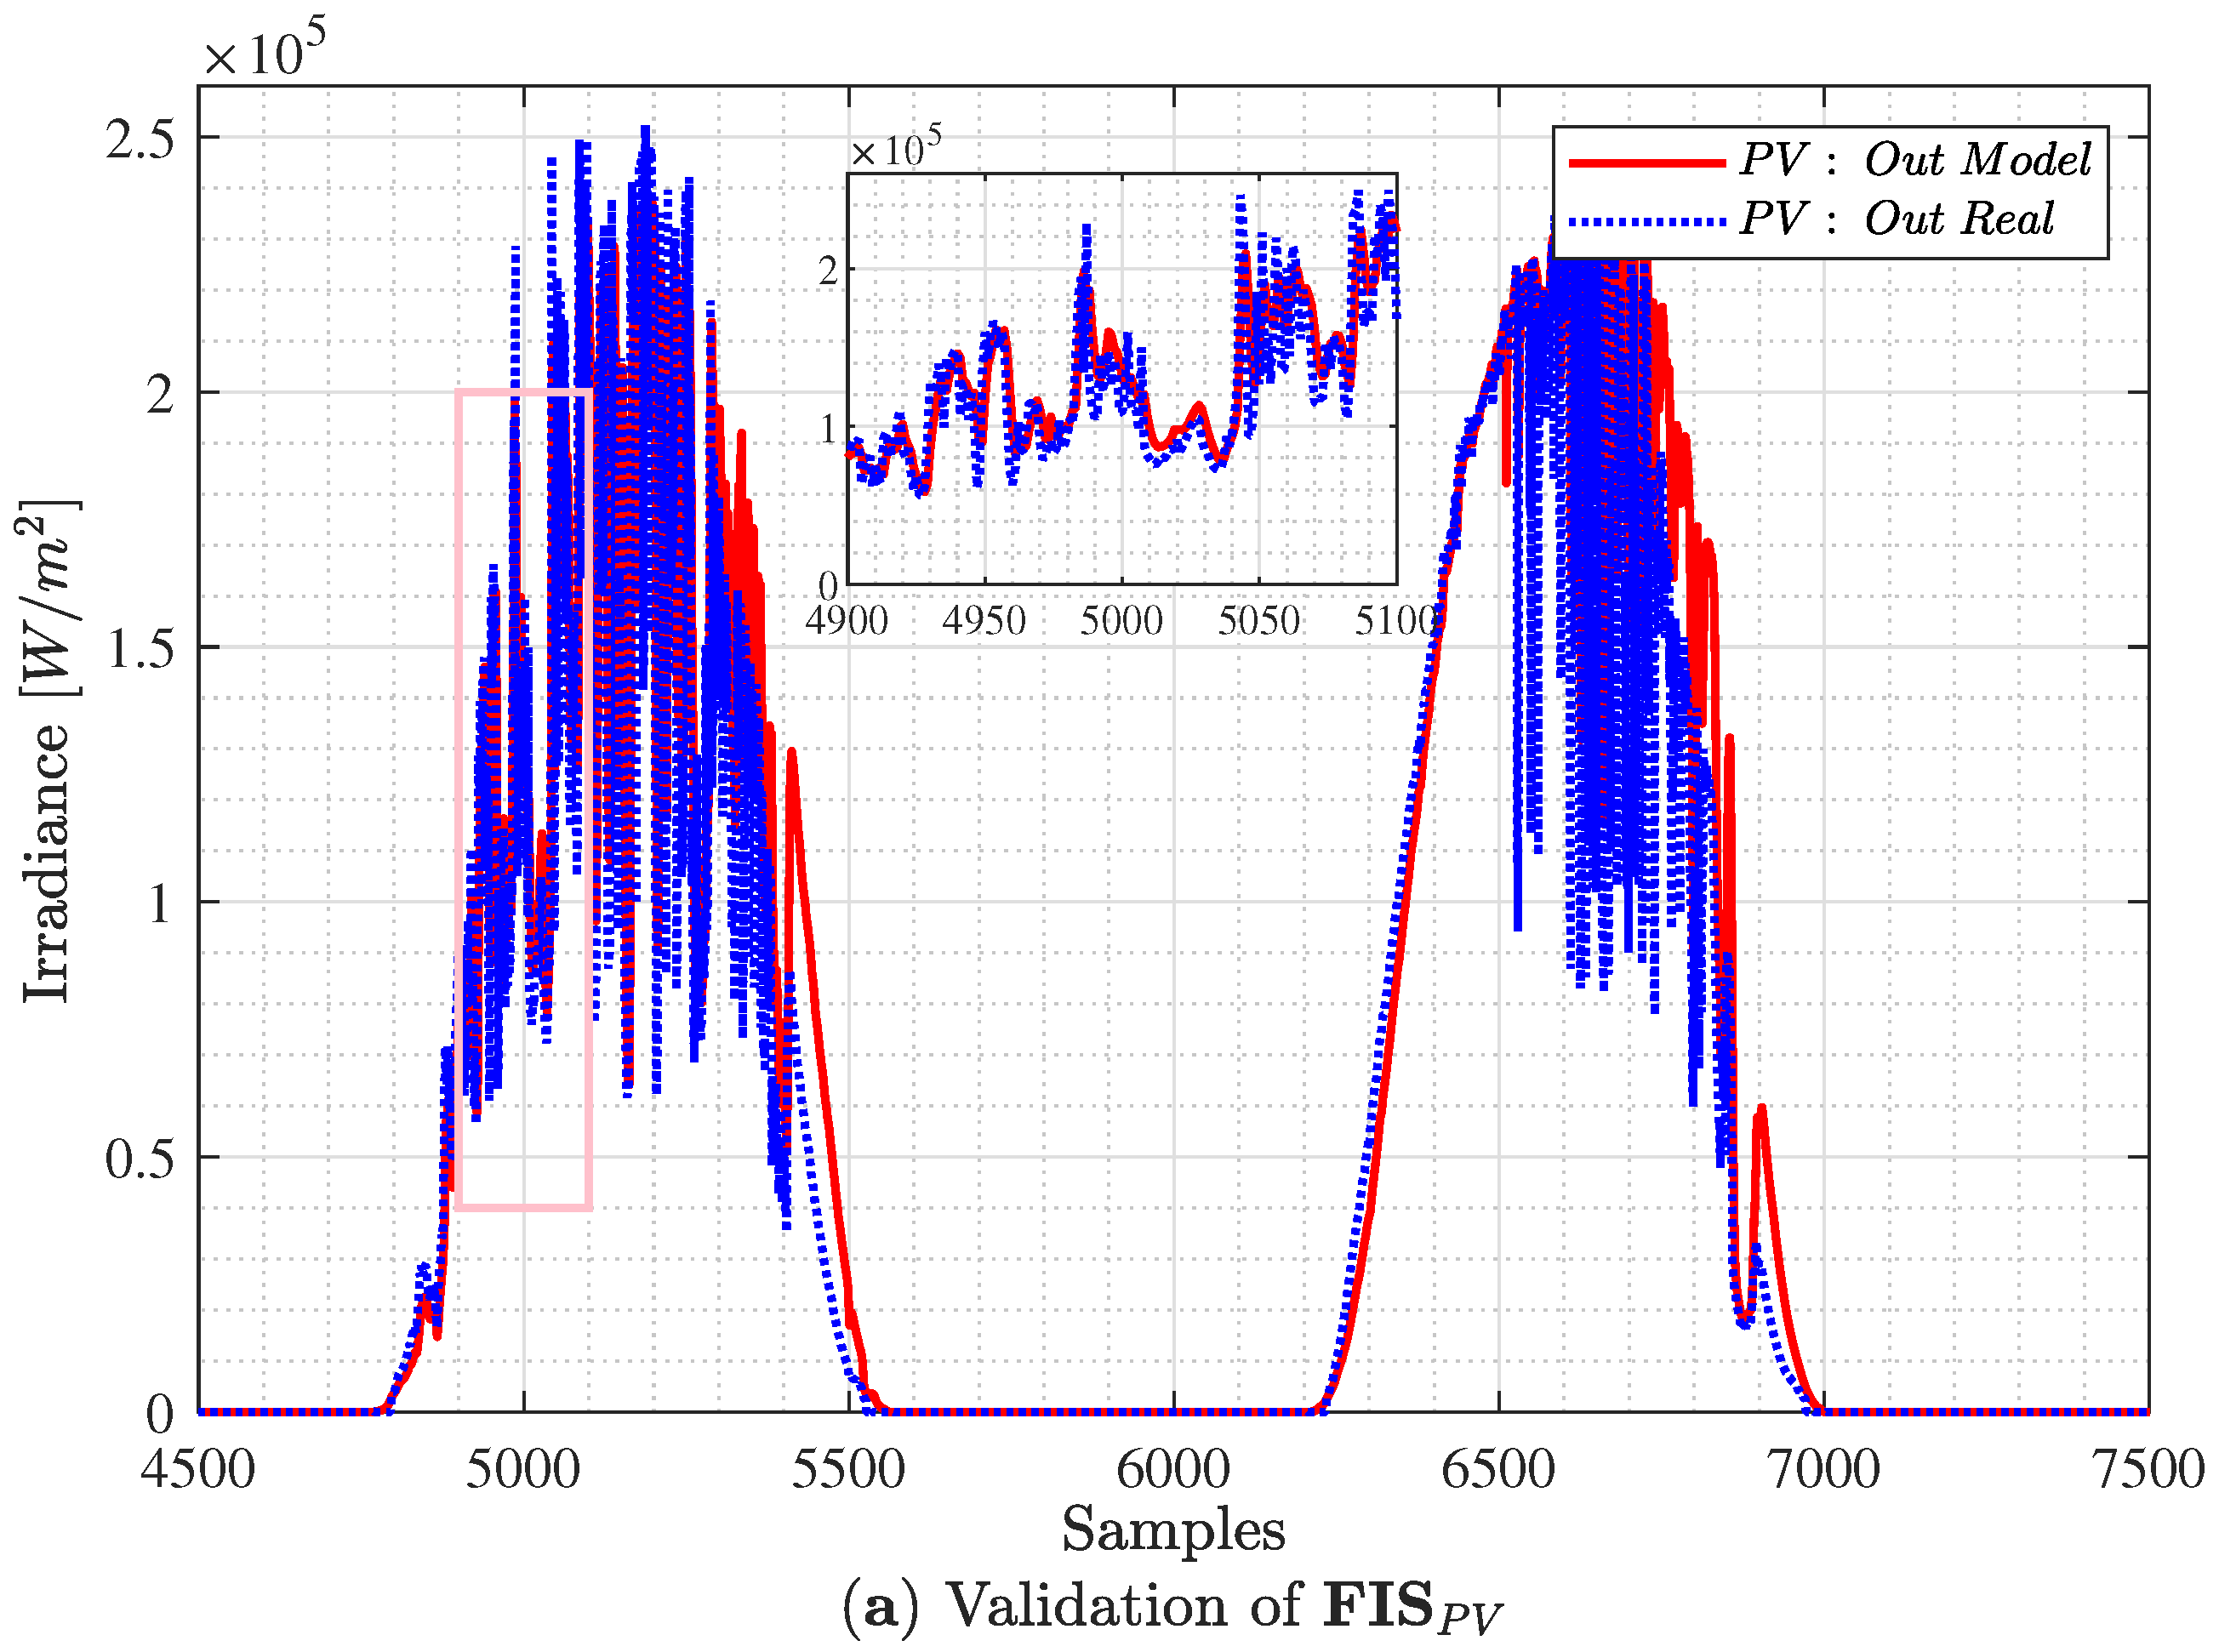
Figure 16.
Wind Turbine : Validation results
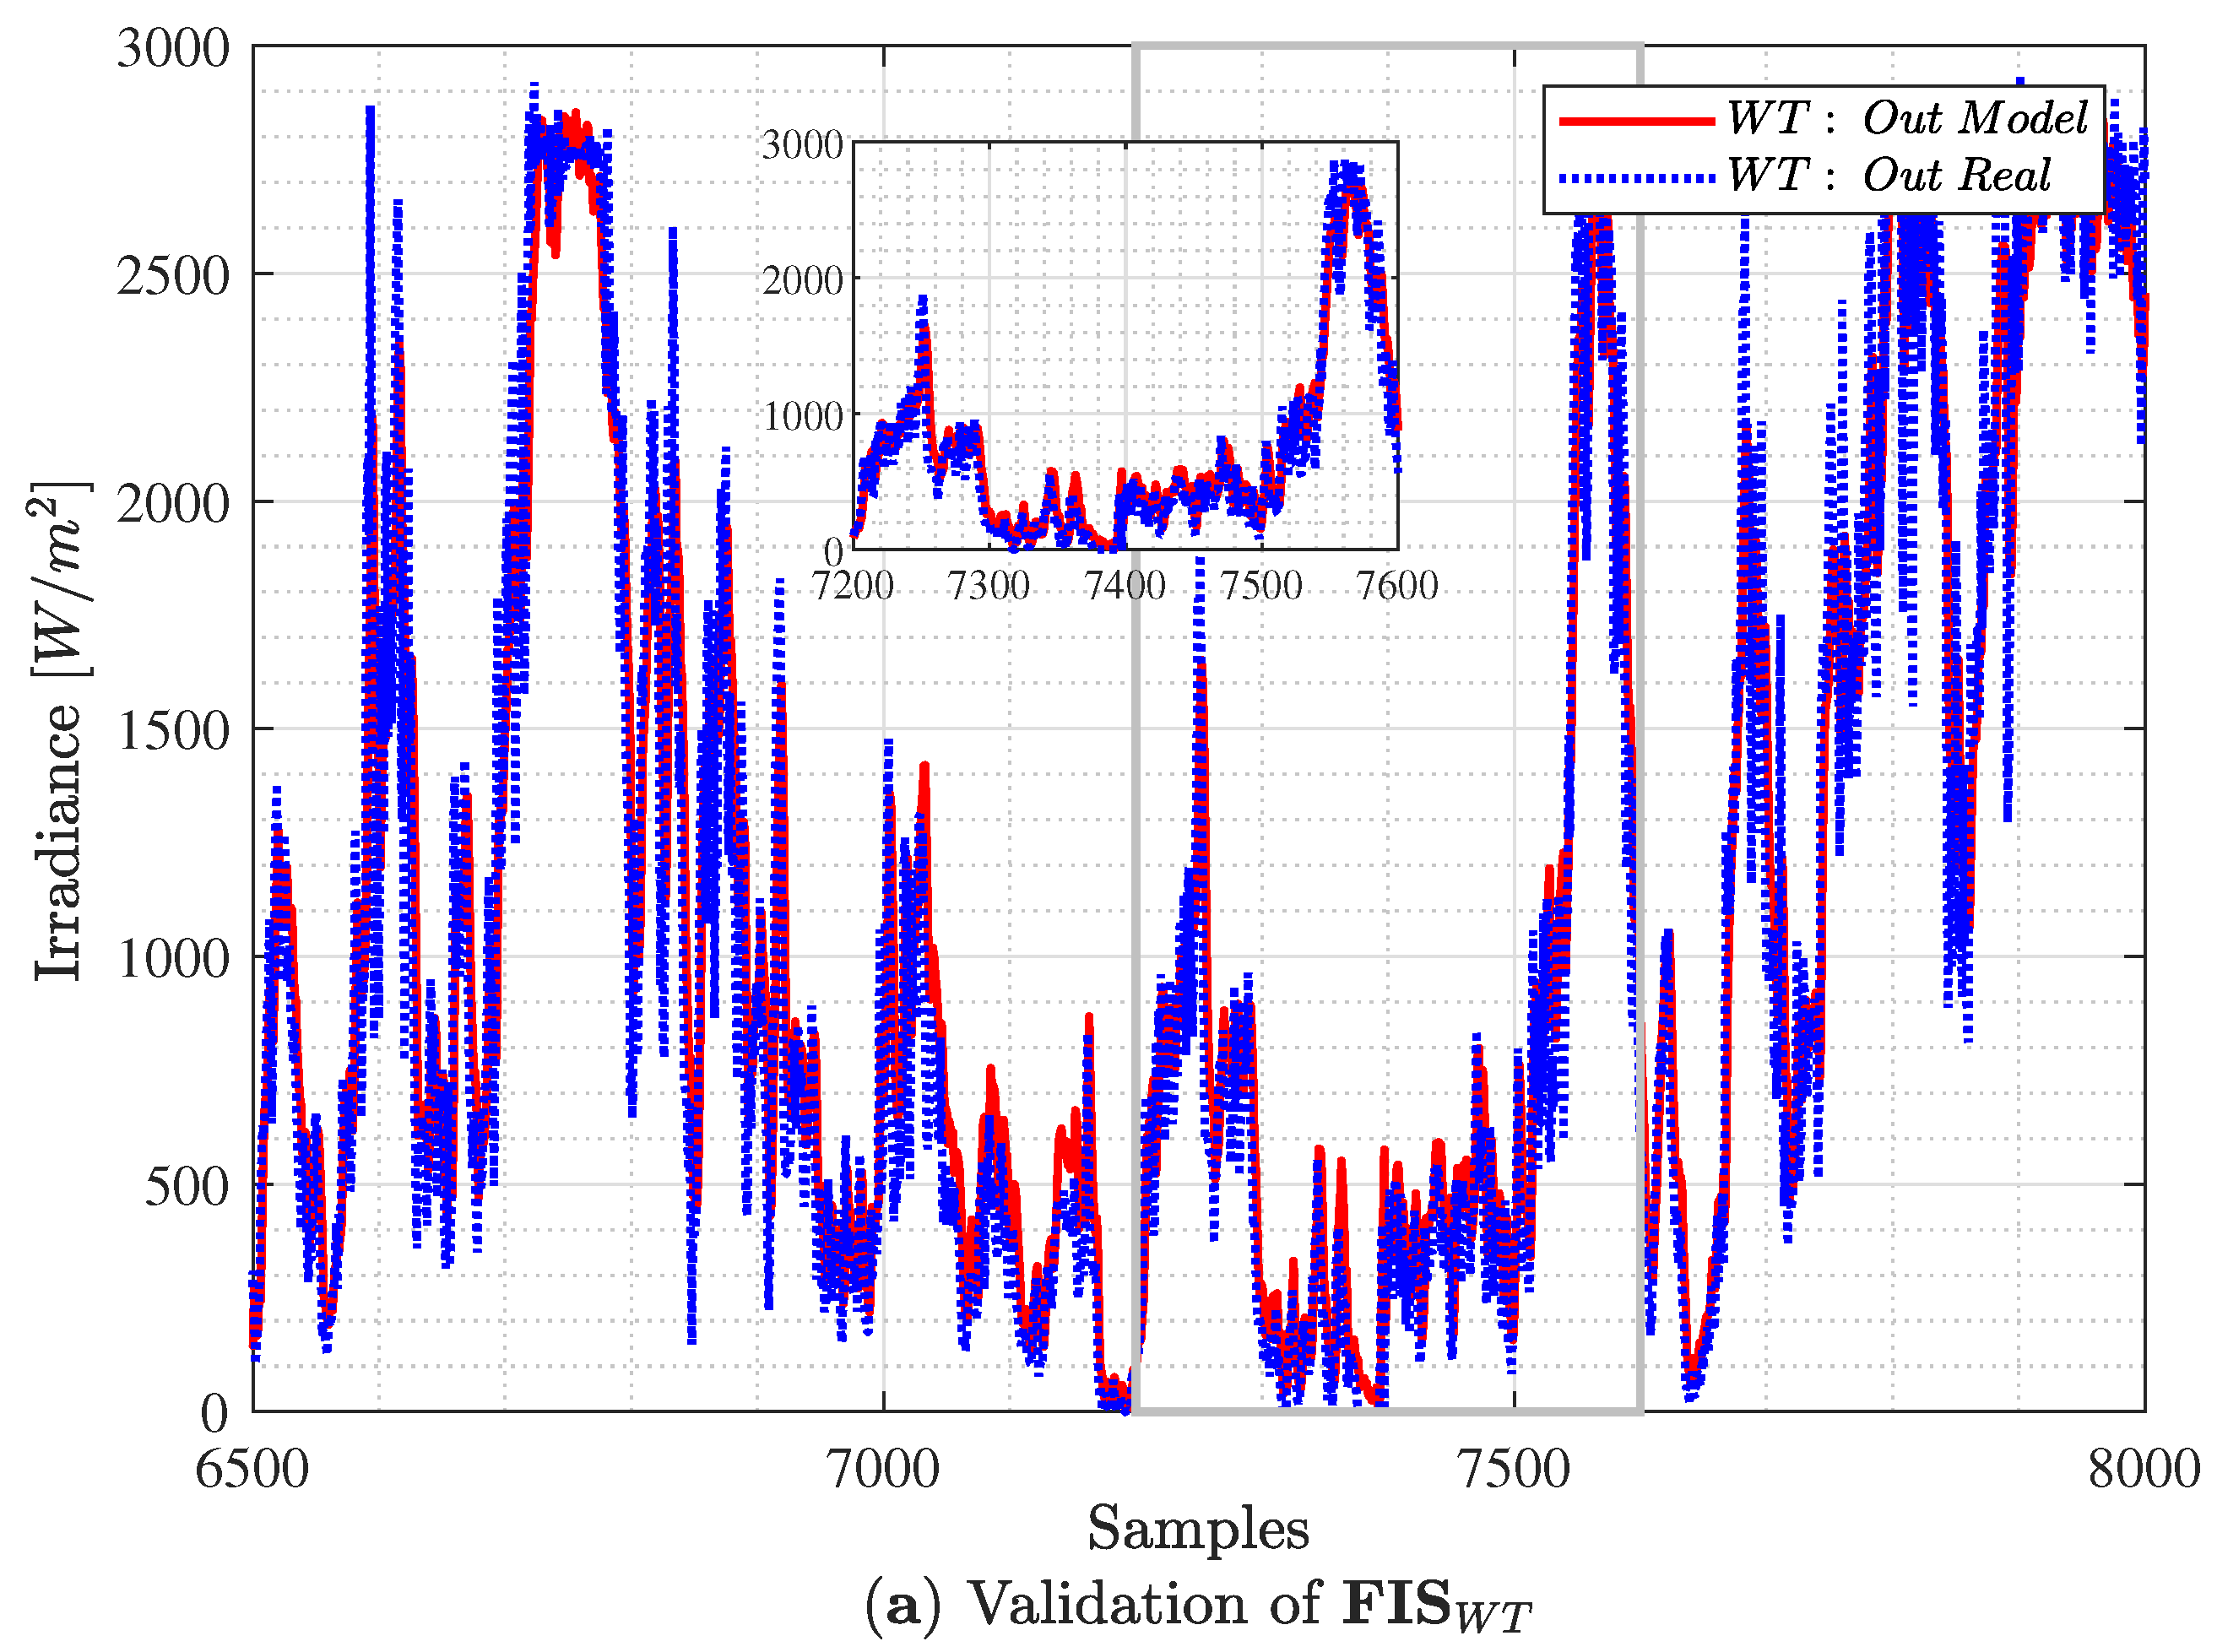
Figure 17.
Tool Architecture
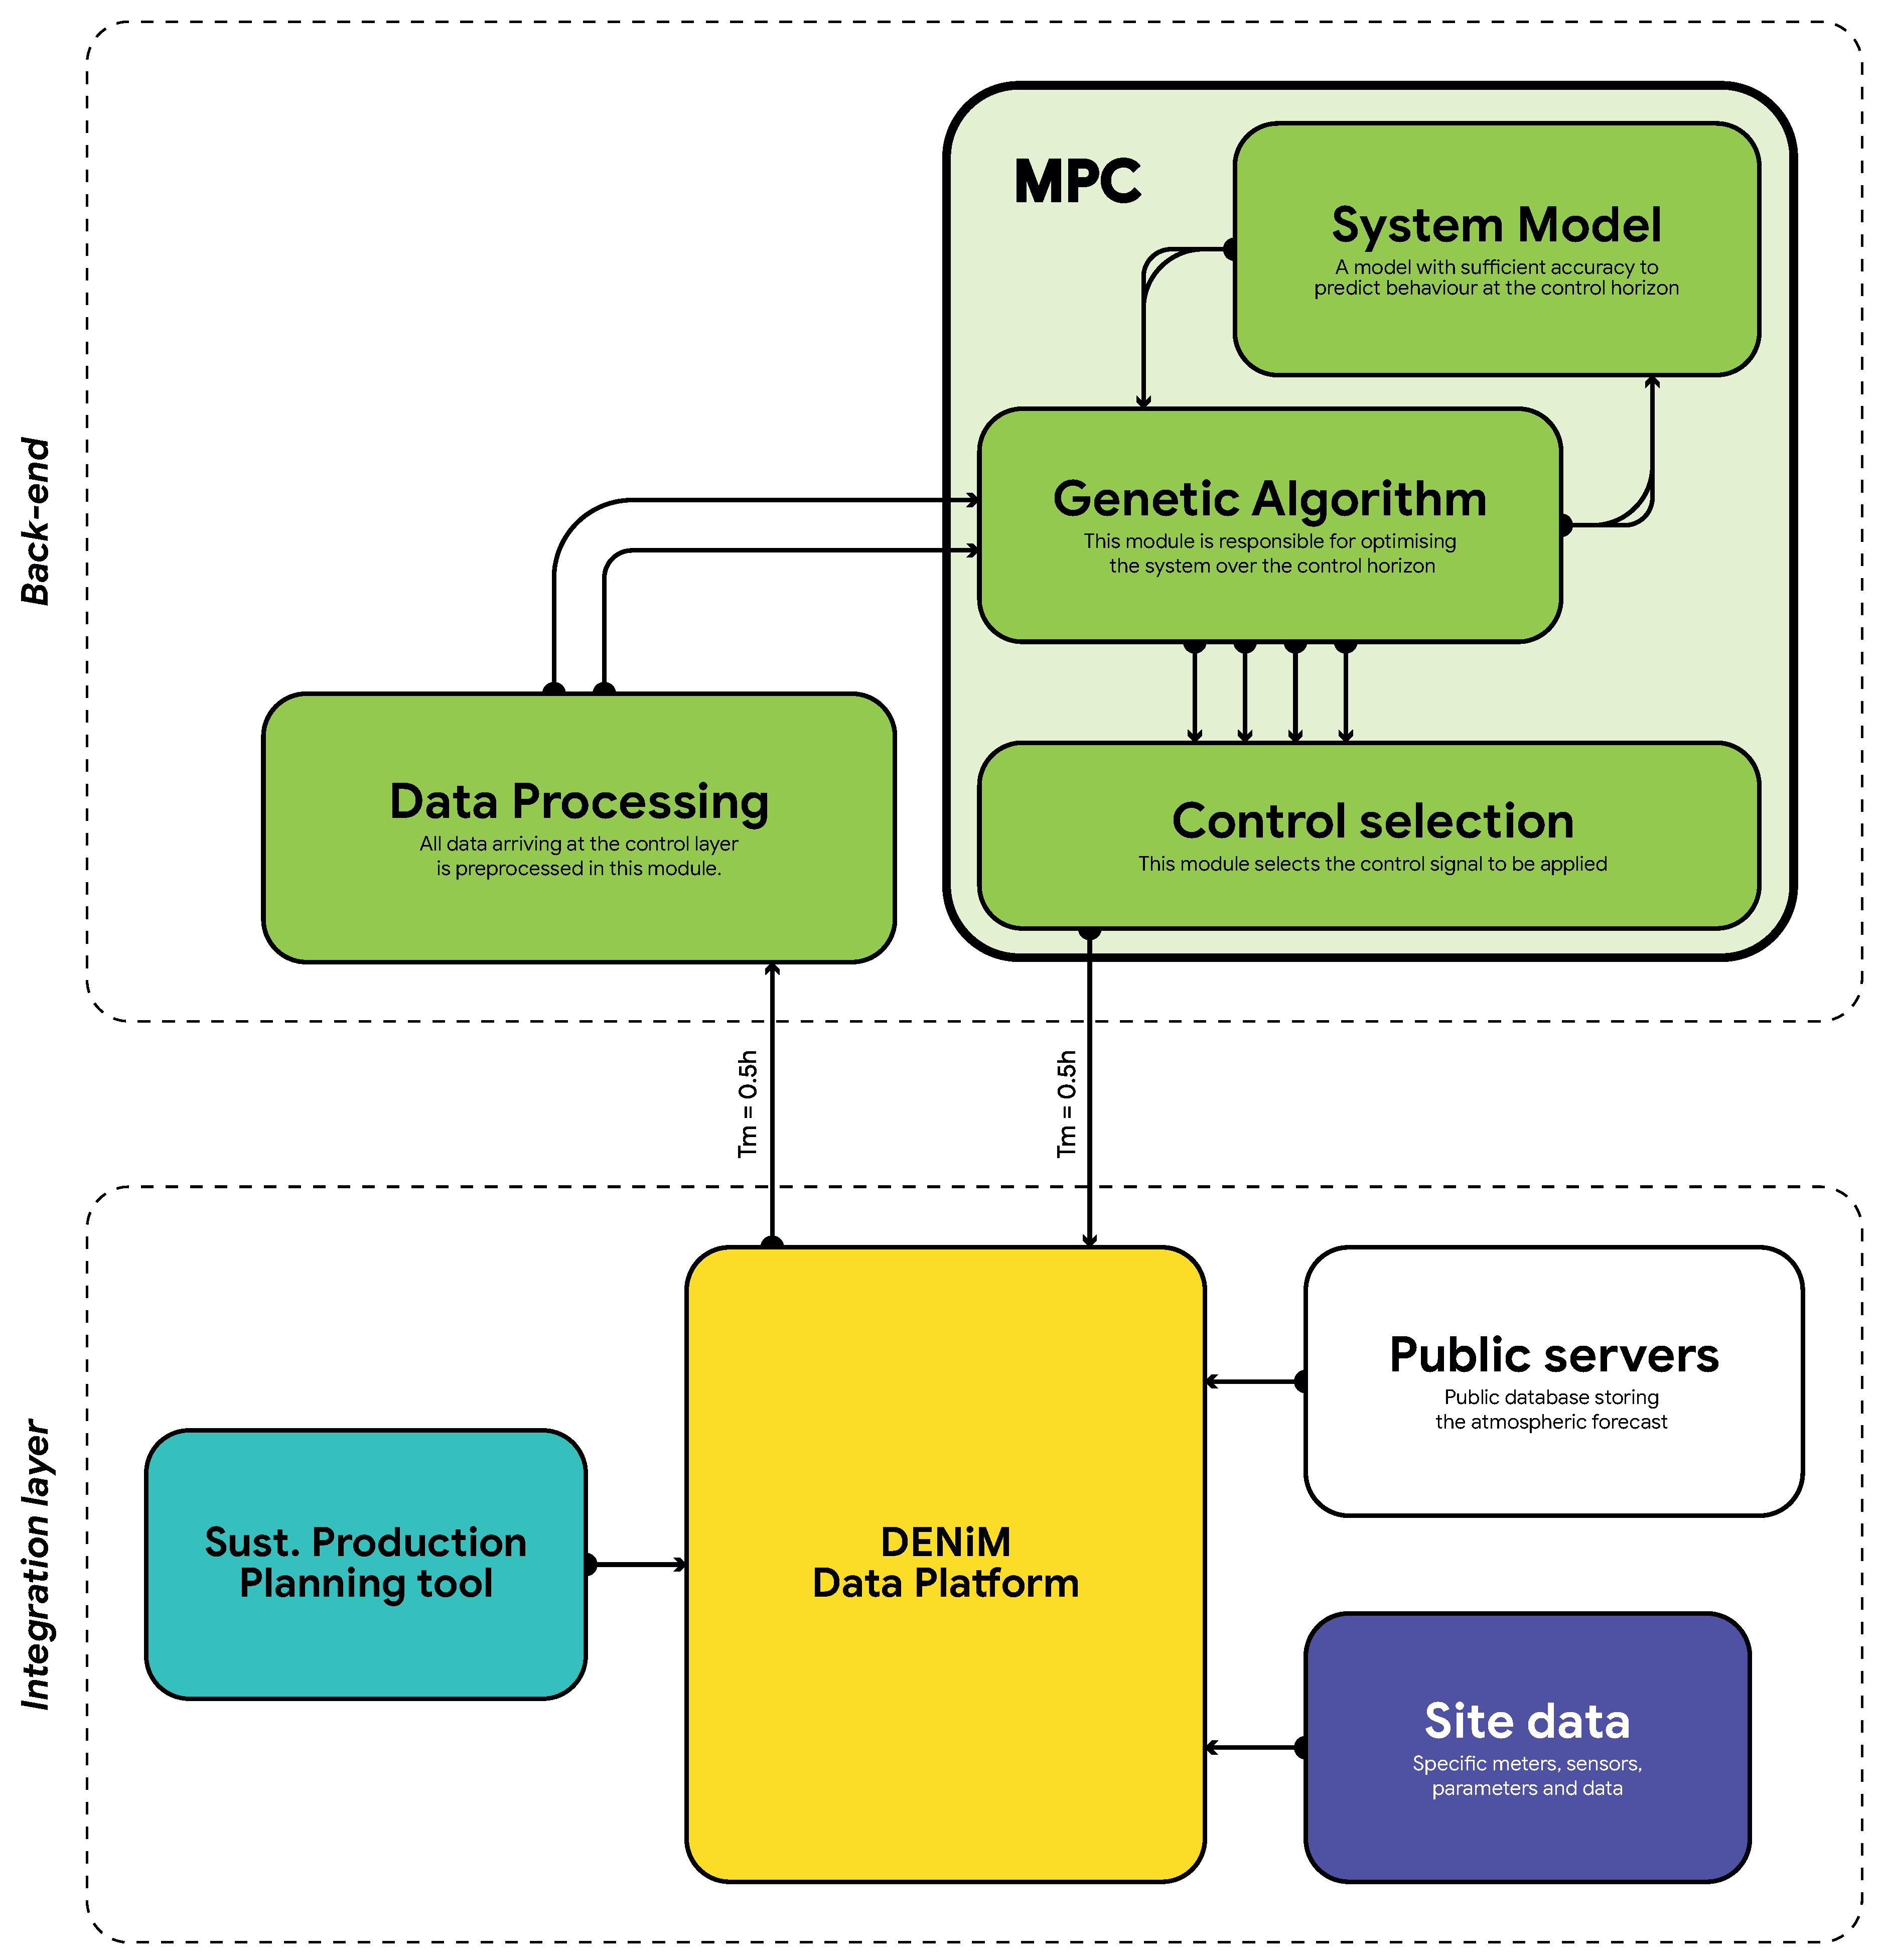
Figure 18.
Baseline behaviour

Figure 19.
Optimised behaviour
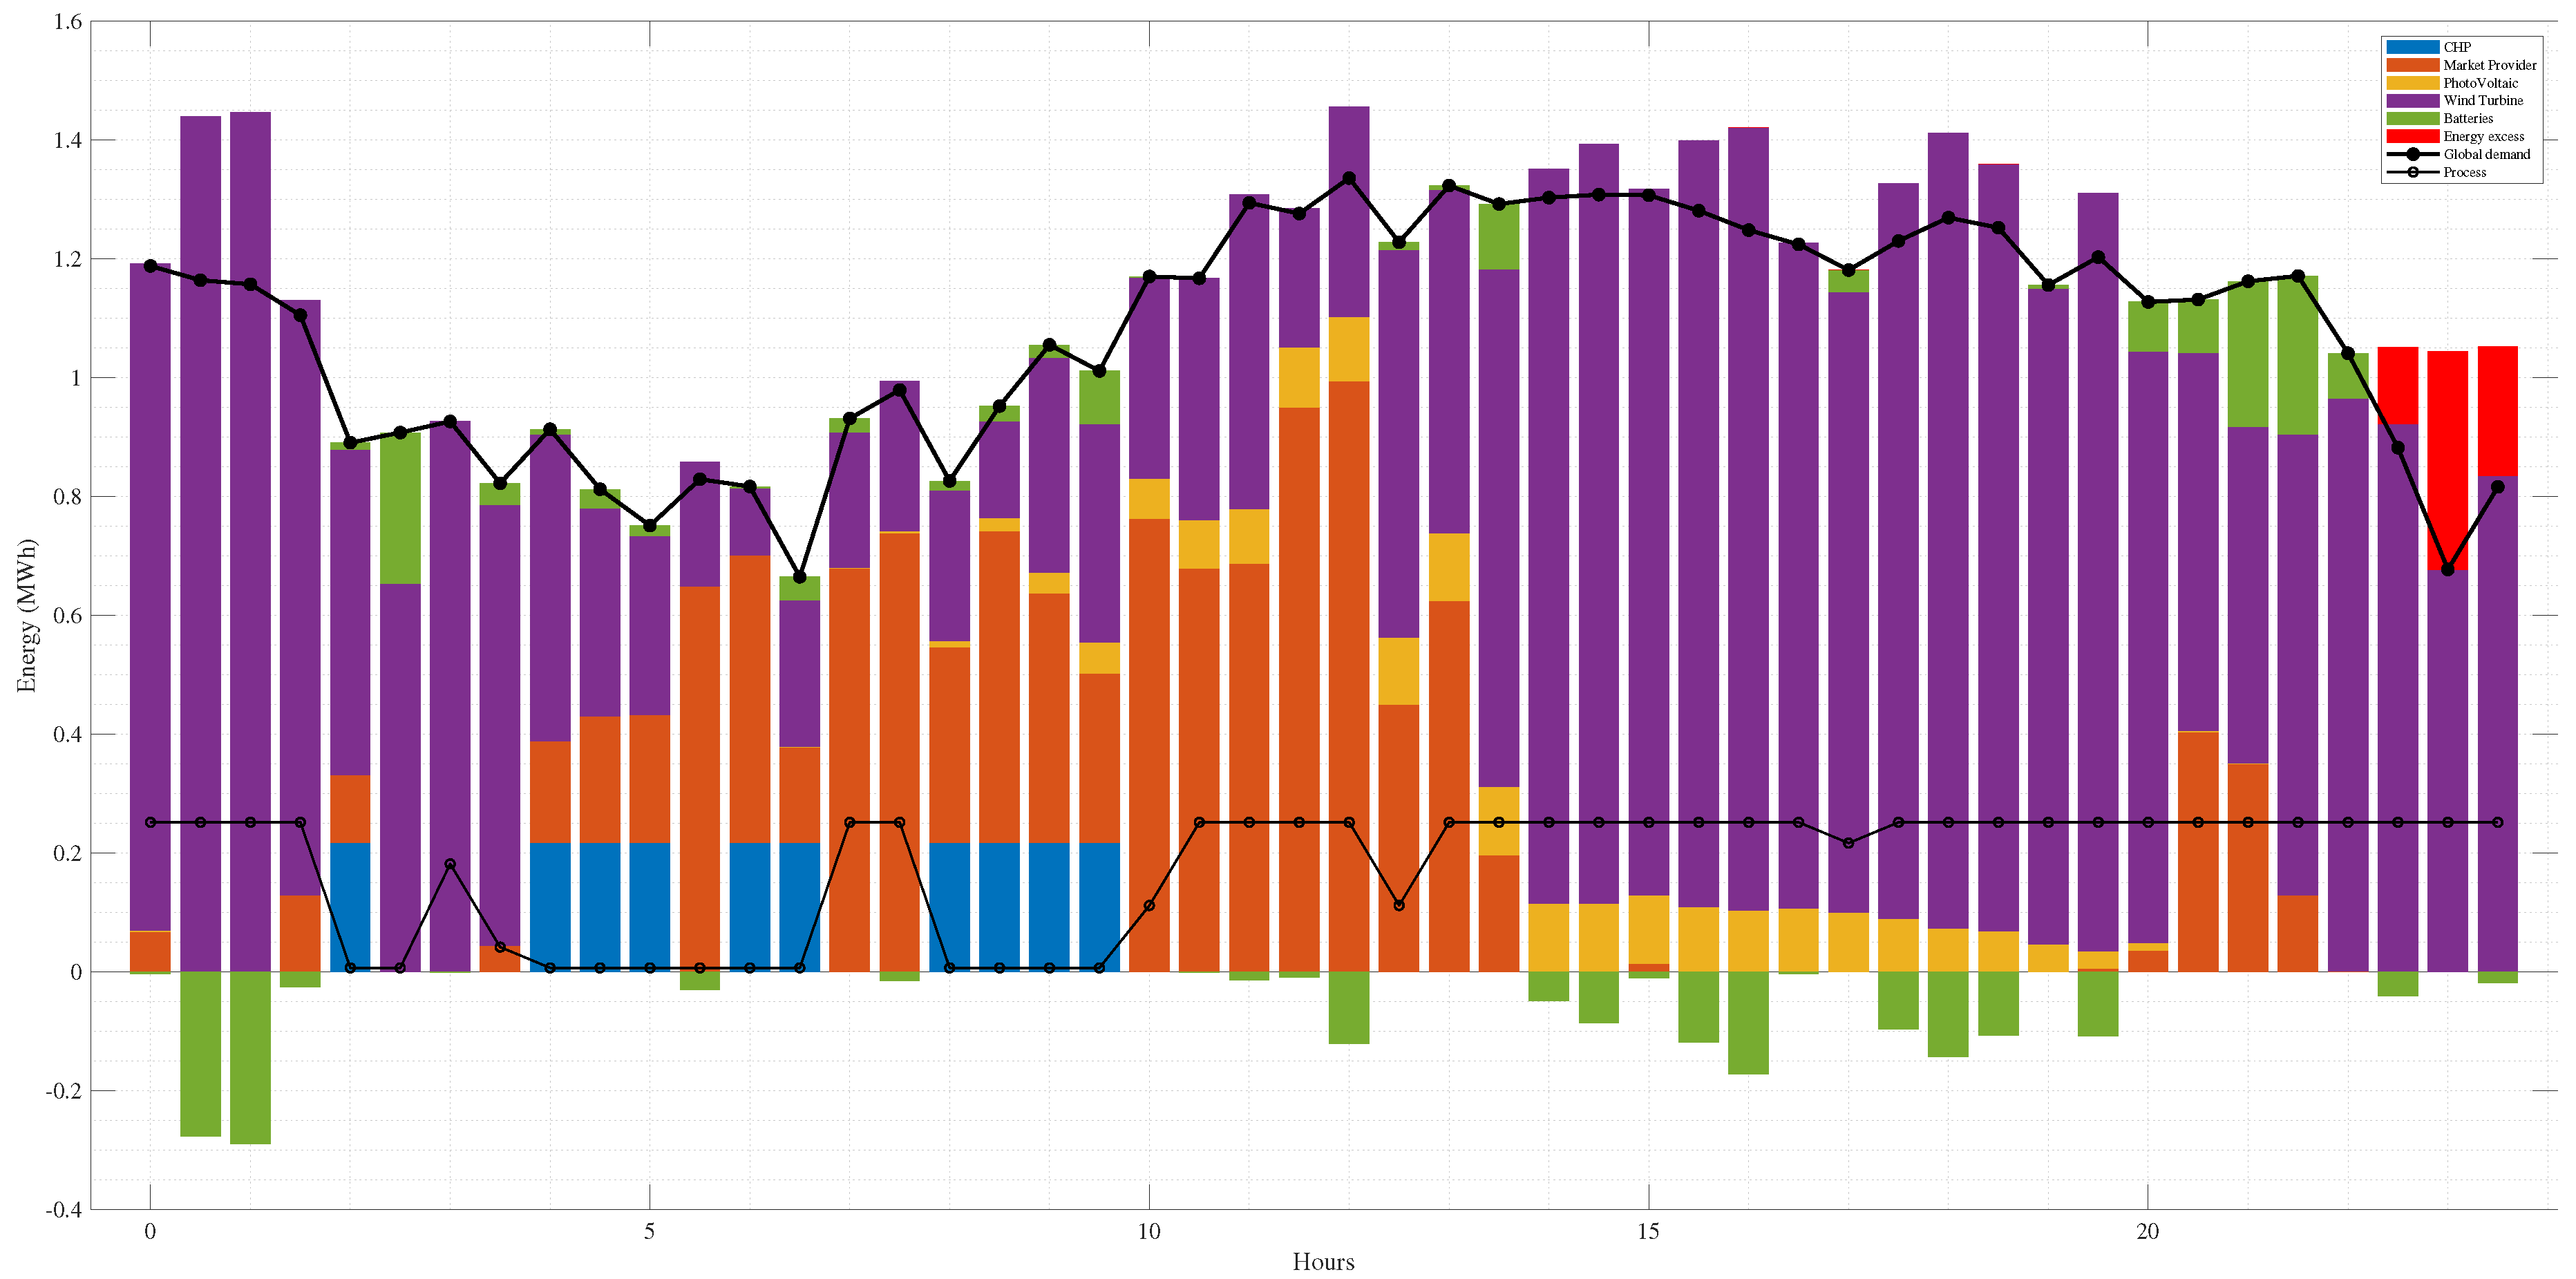
Figure 20.
User Interface Highlevel Architecture
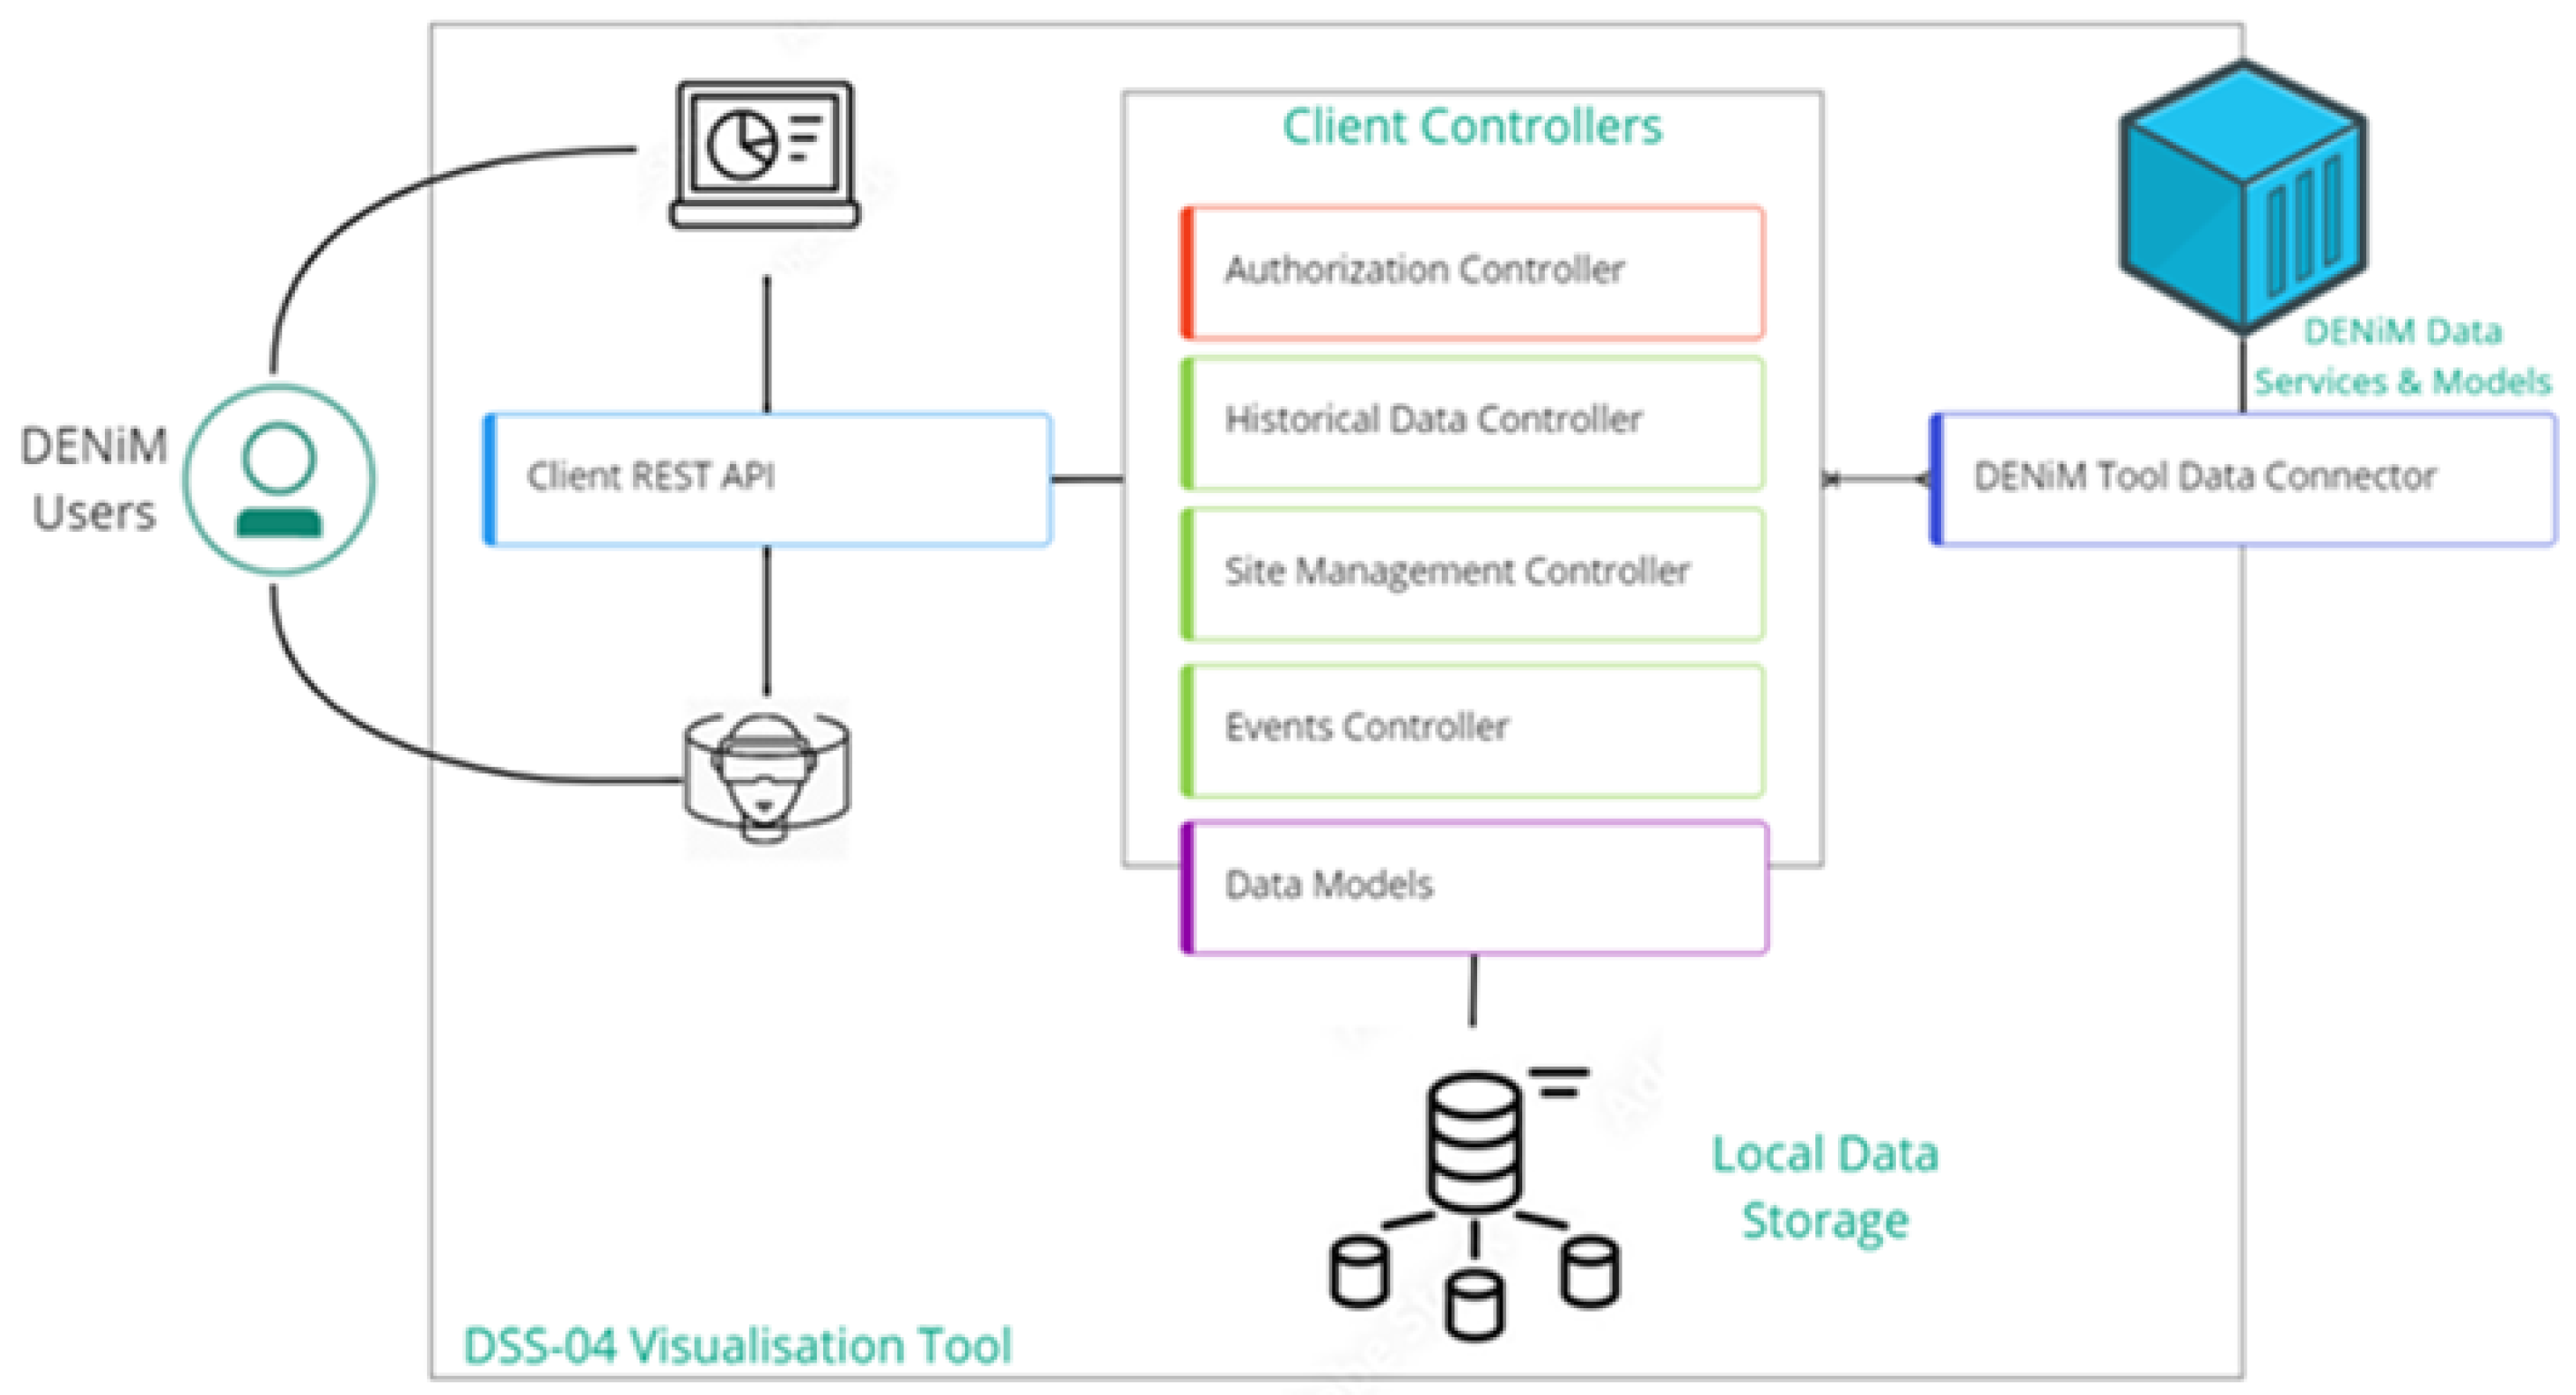
Figure 21.
Site Level Dashboard
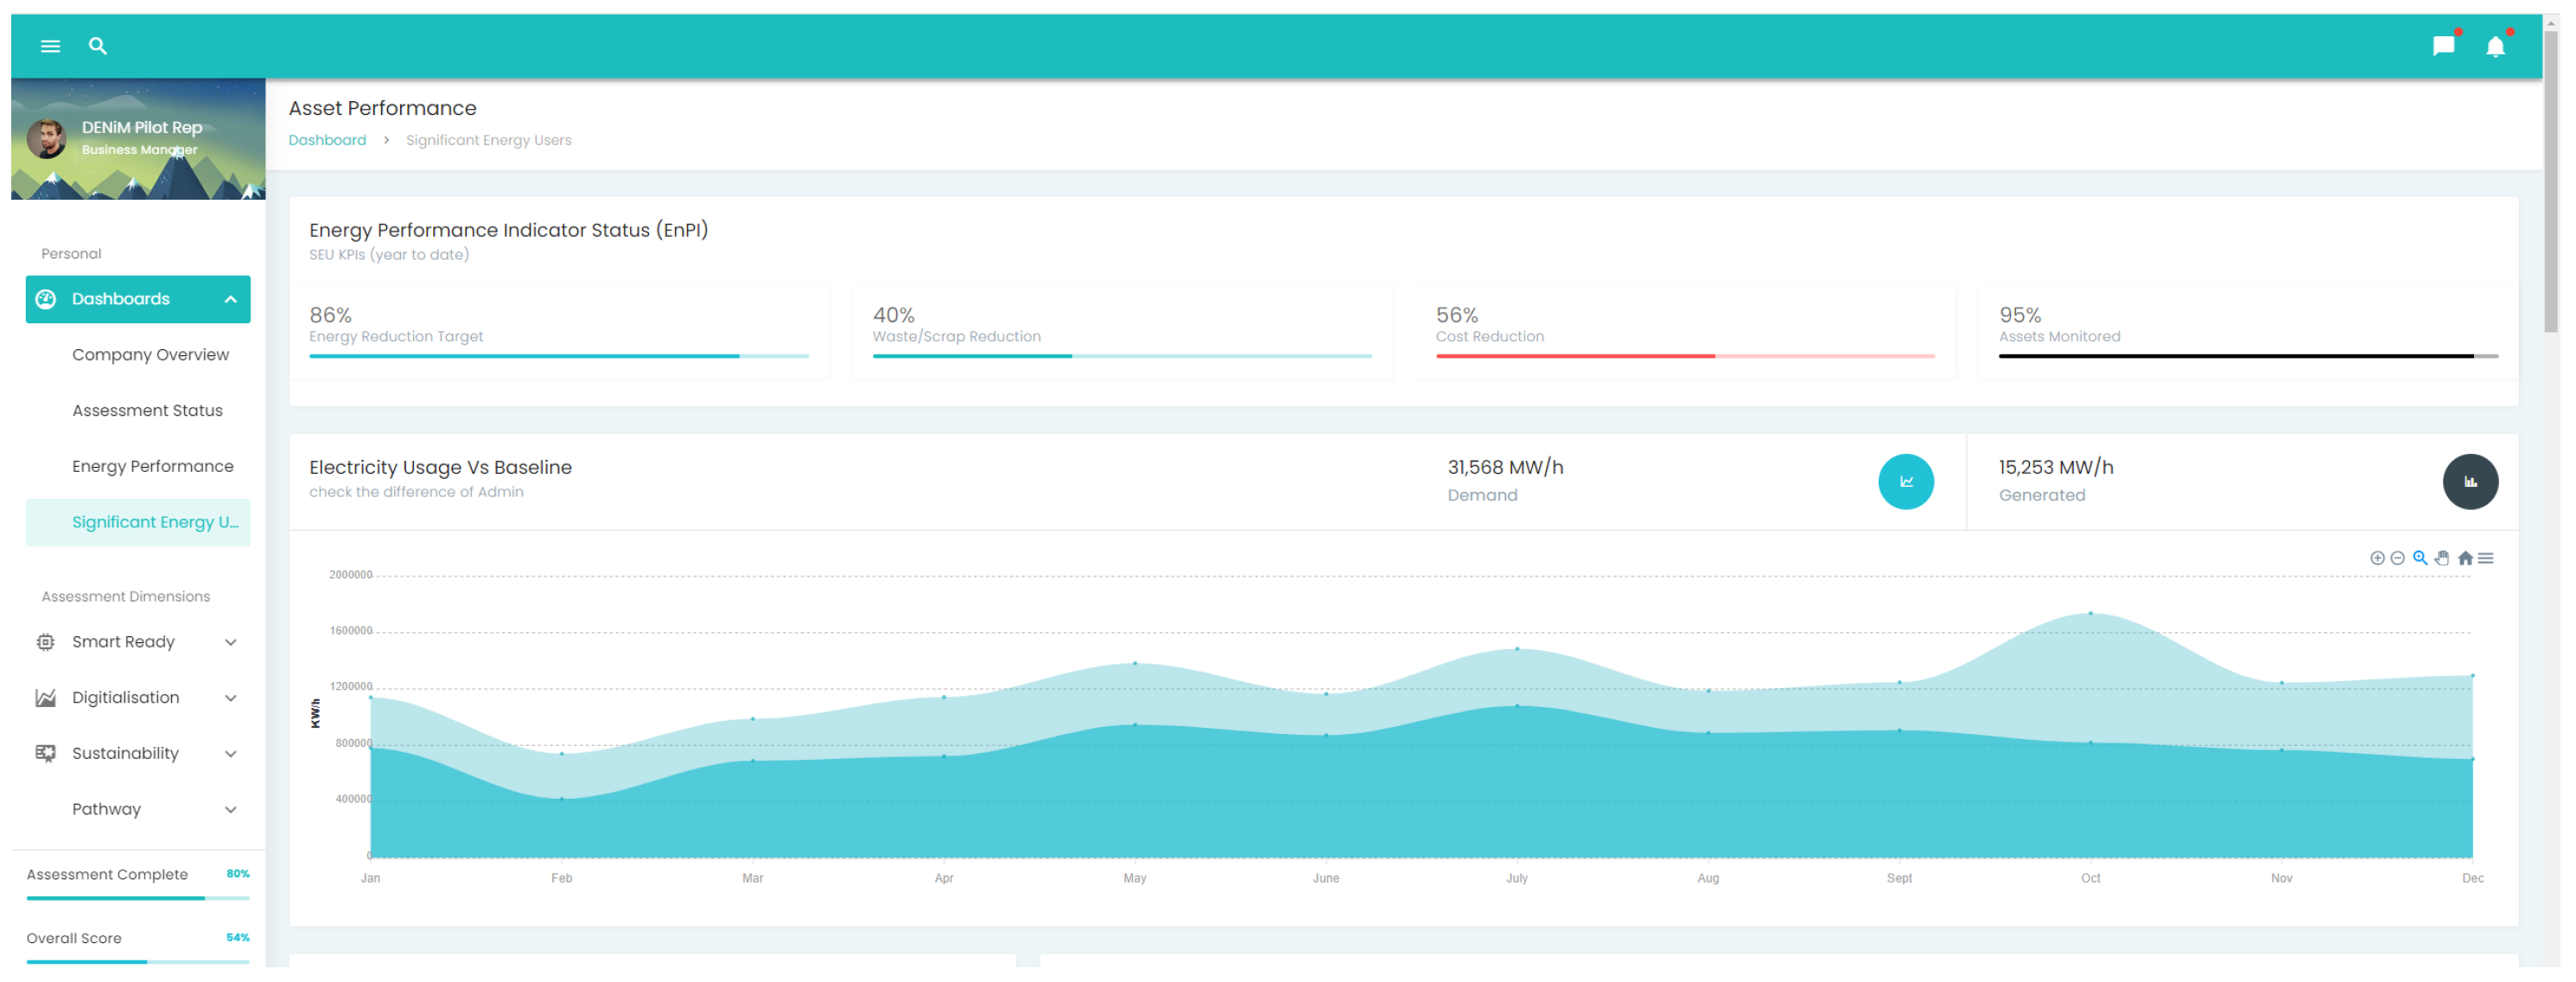
Figure 22.
Weather indicators and historical usage patterns
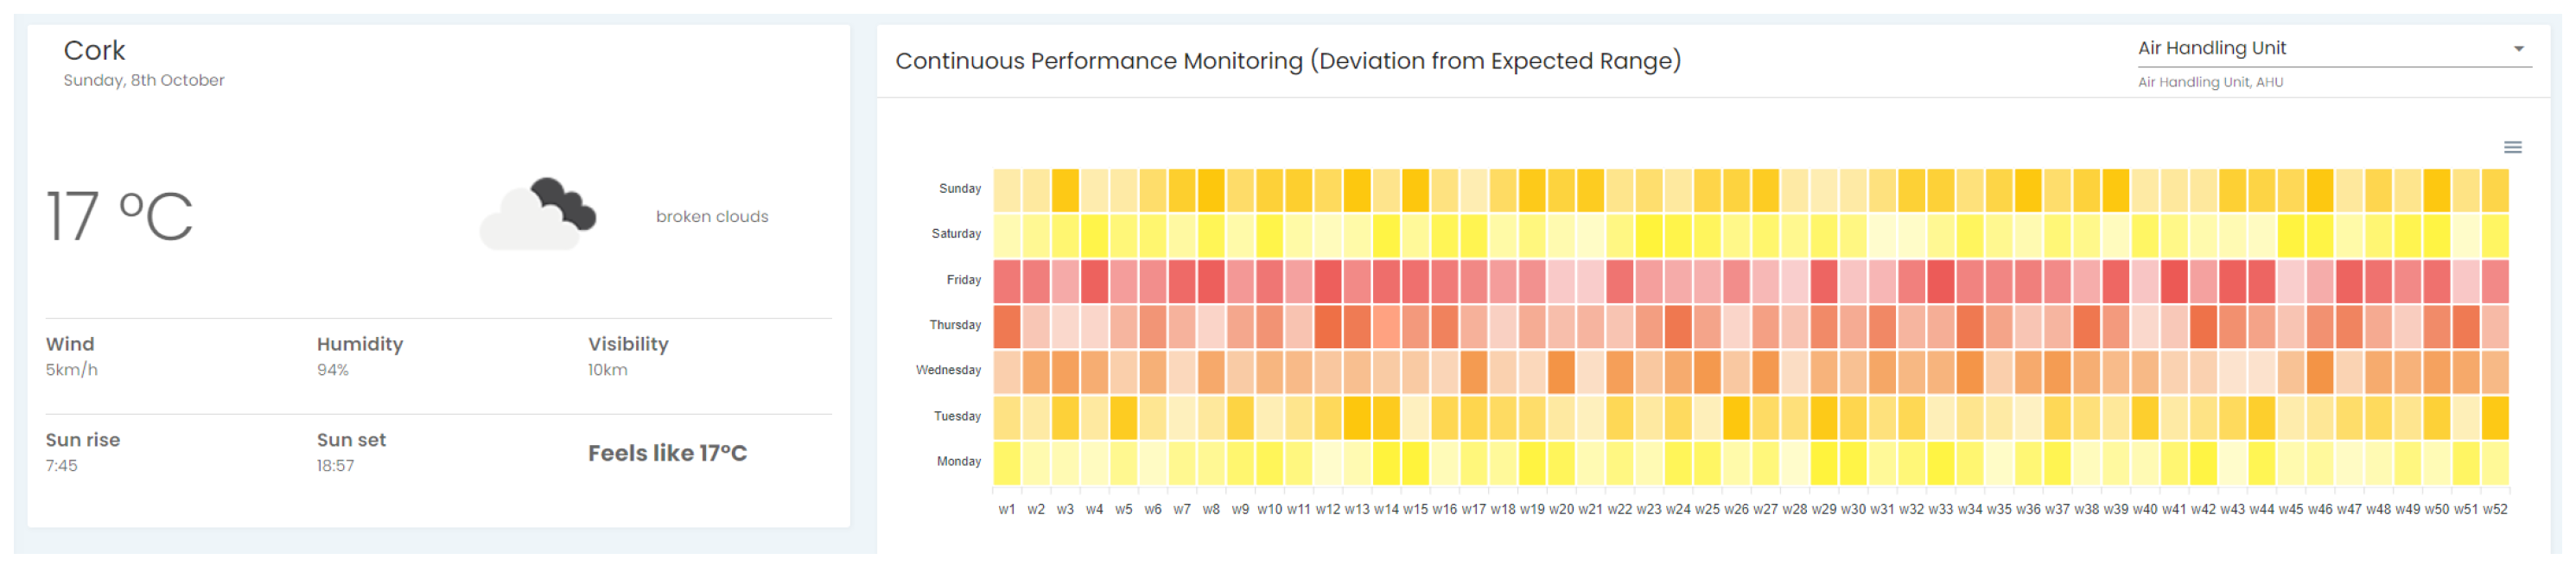
Figure 23.
Production Related Indicators

Figure 24.
Performance Tracking Graphs
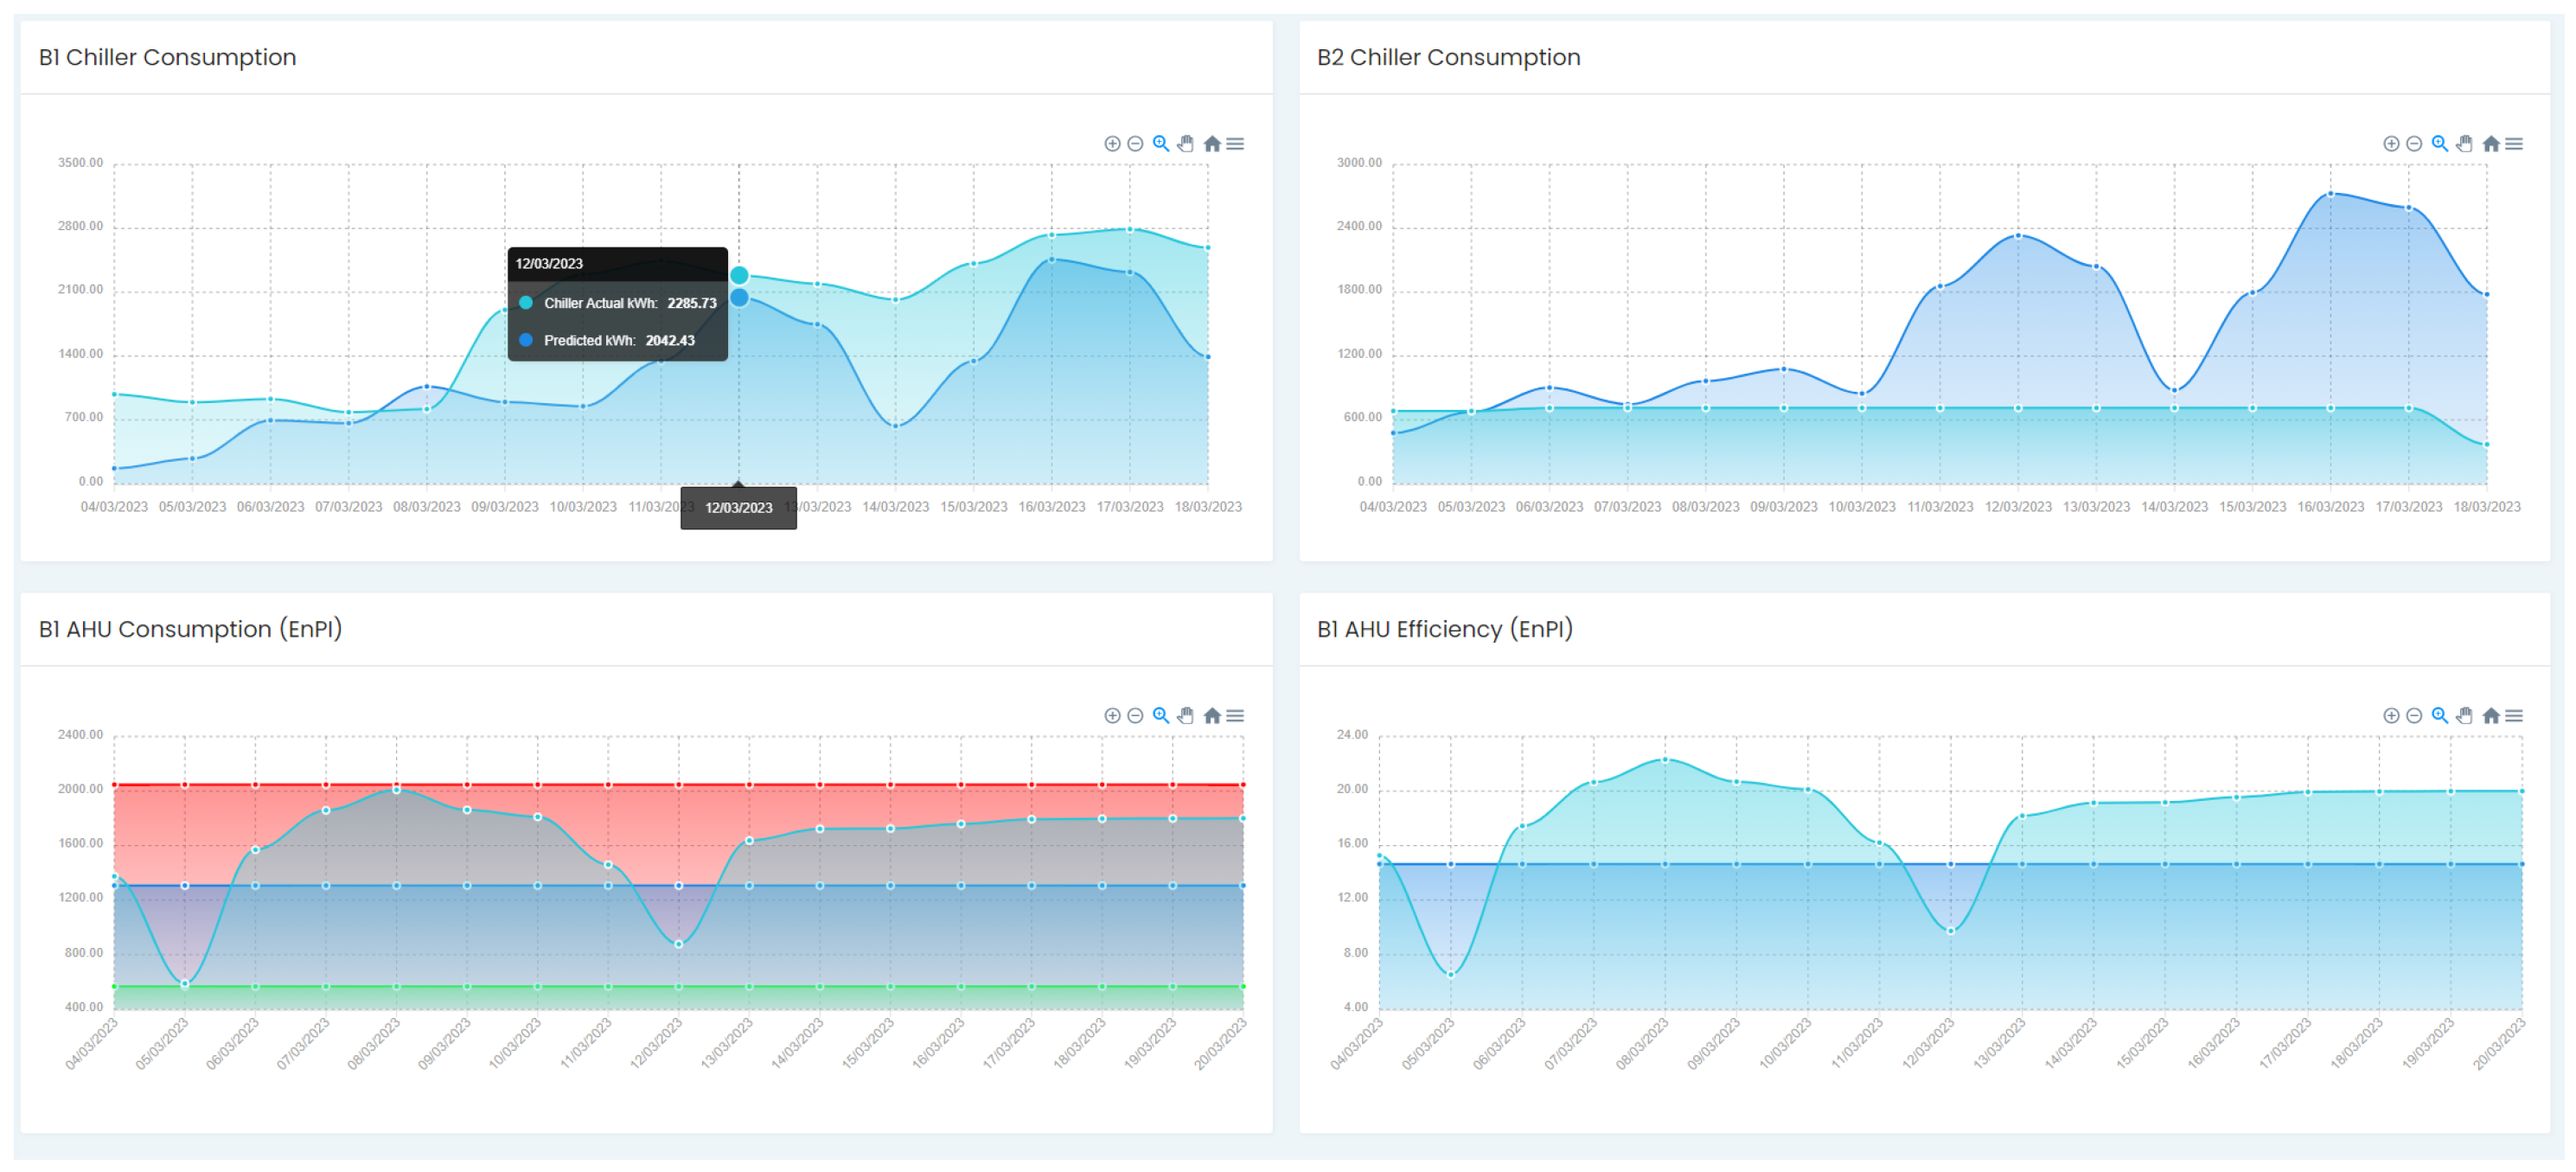
Figure 25.
Sankey Visualisation of Meter Hierarchy
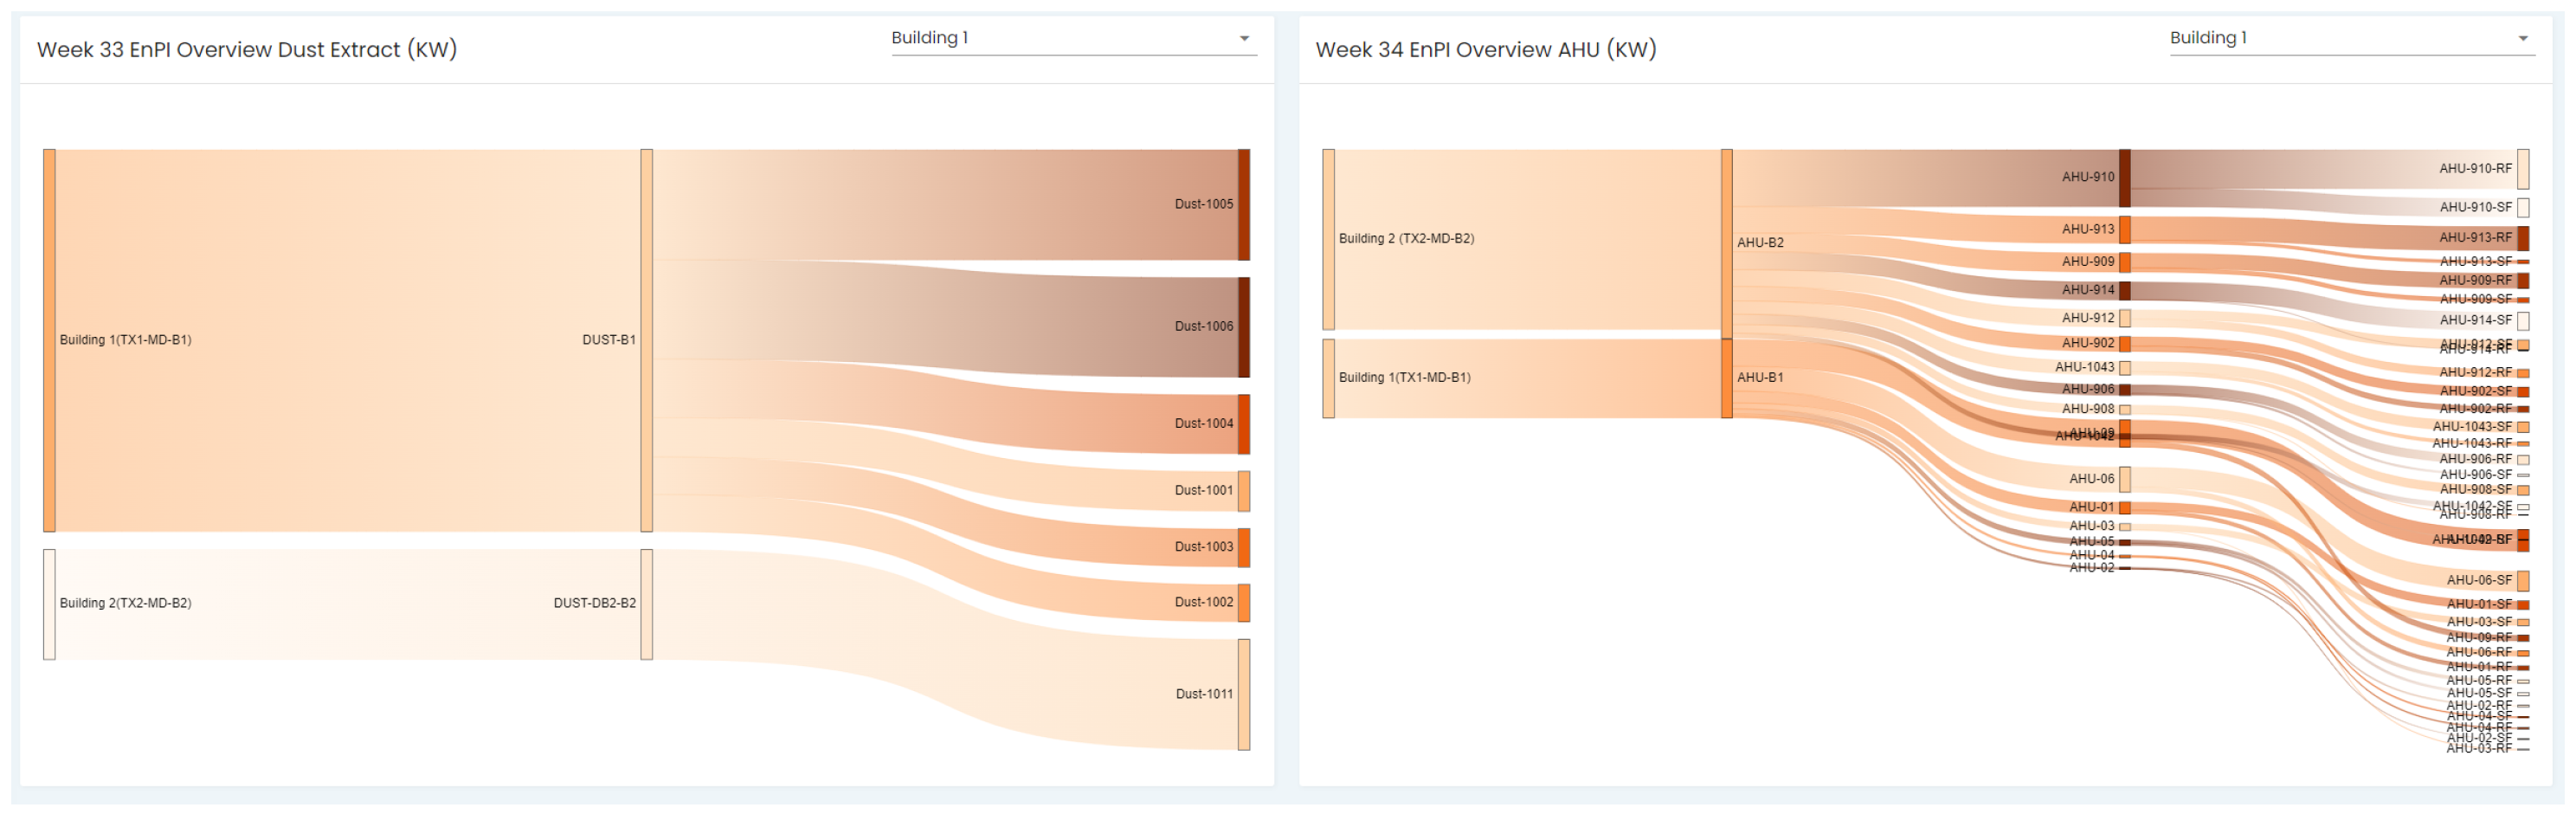
Figure 26.
Production Scheduling Output Visualisation
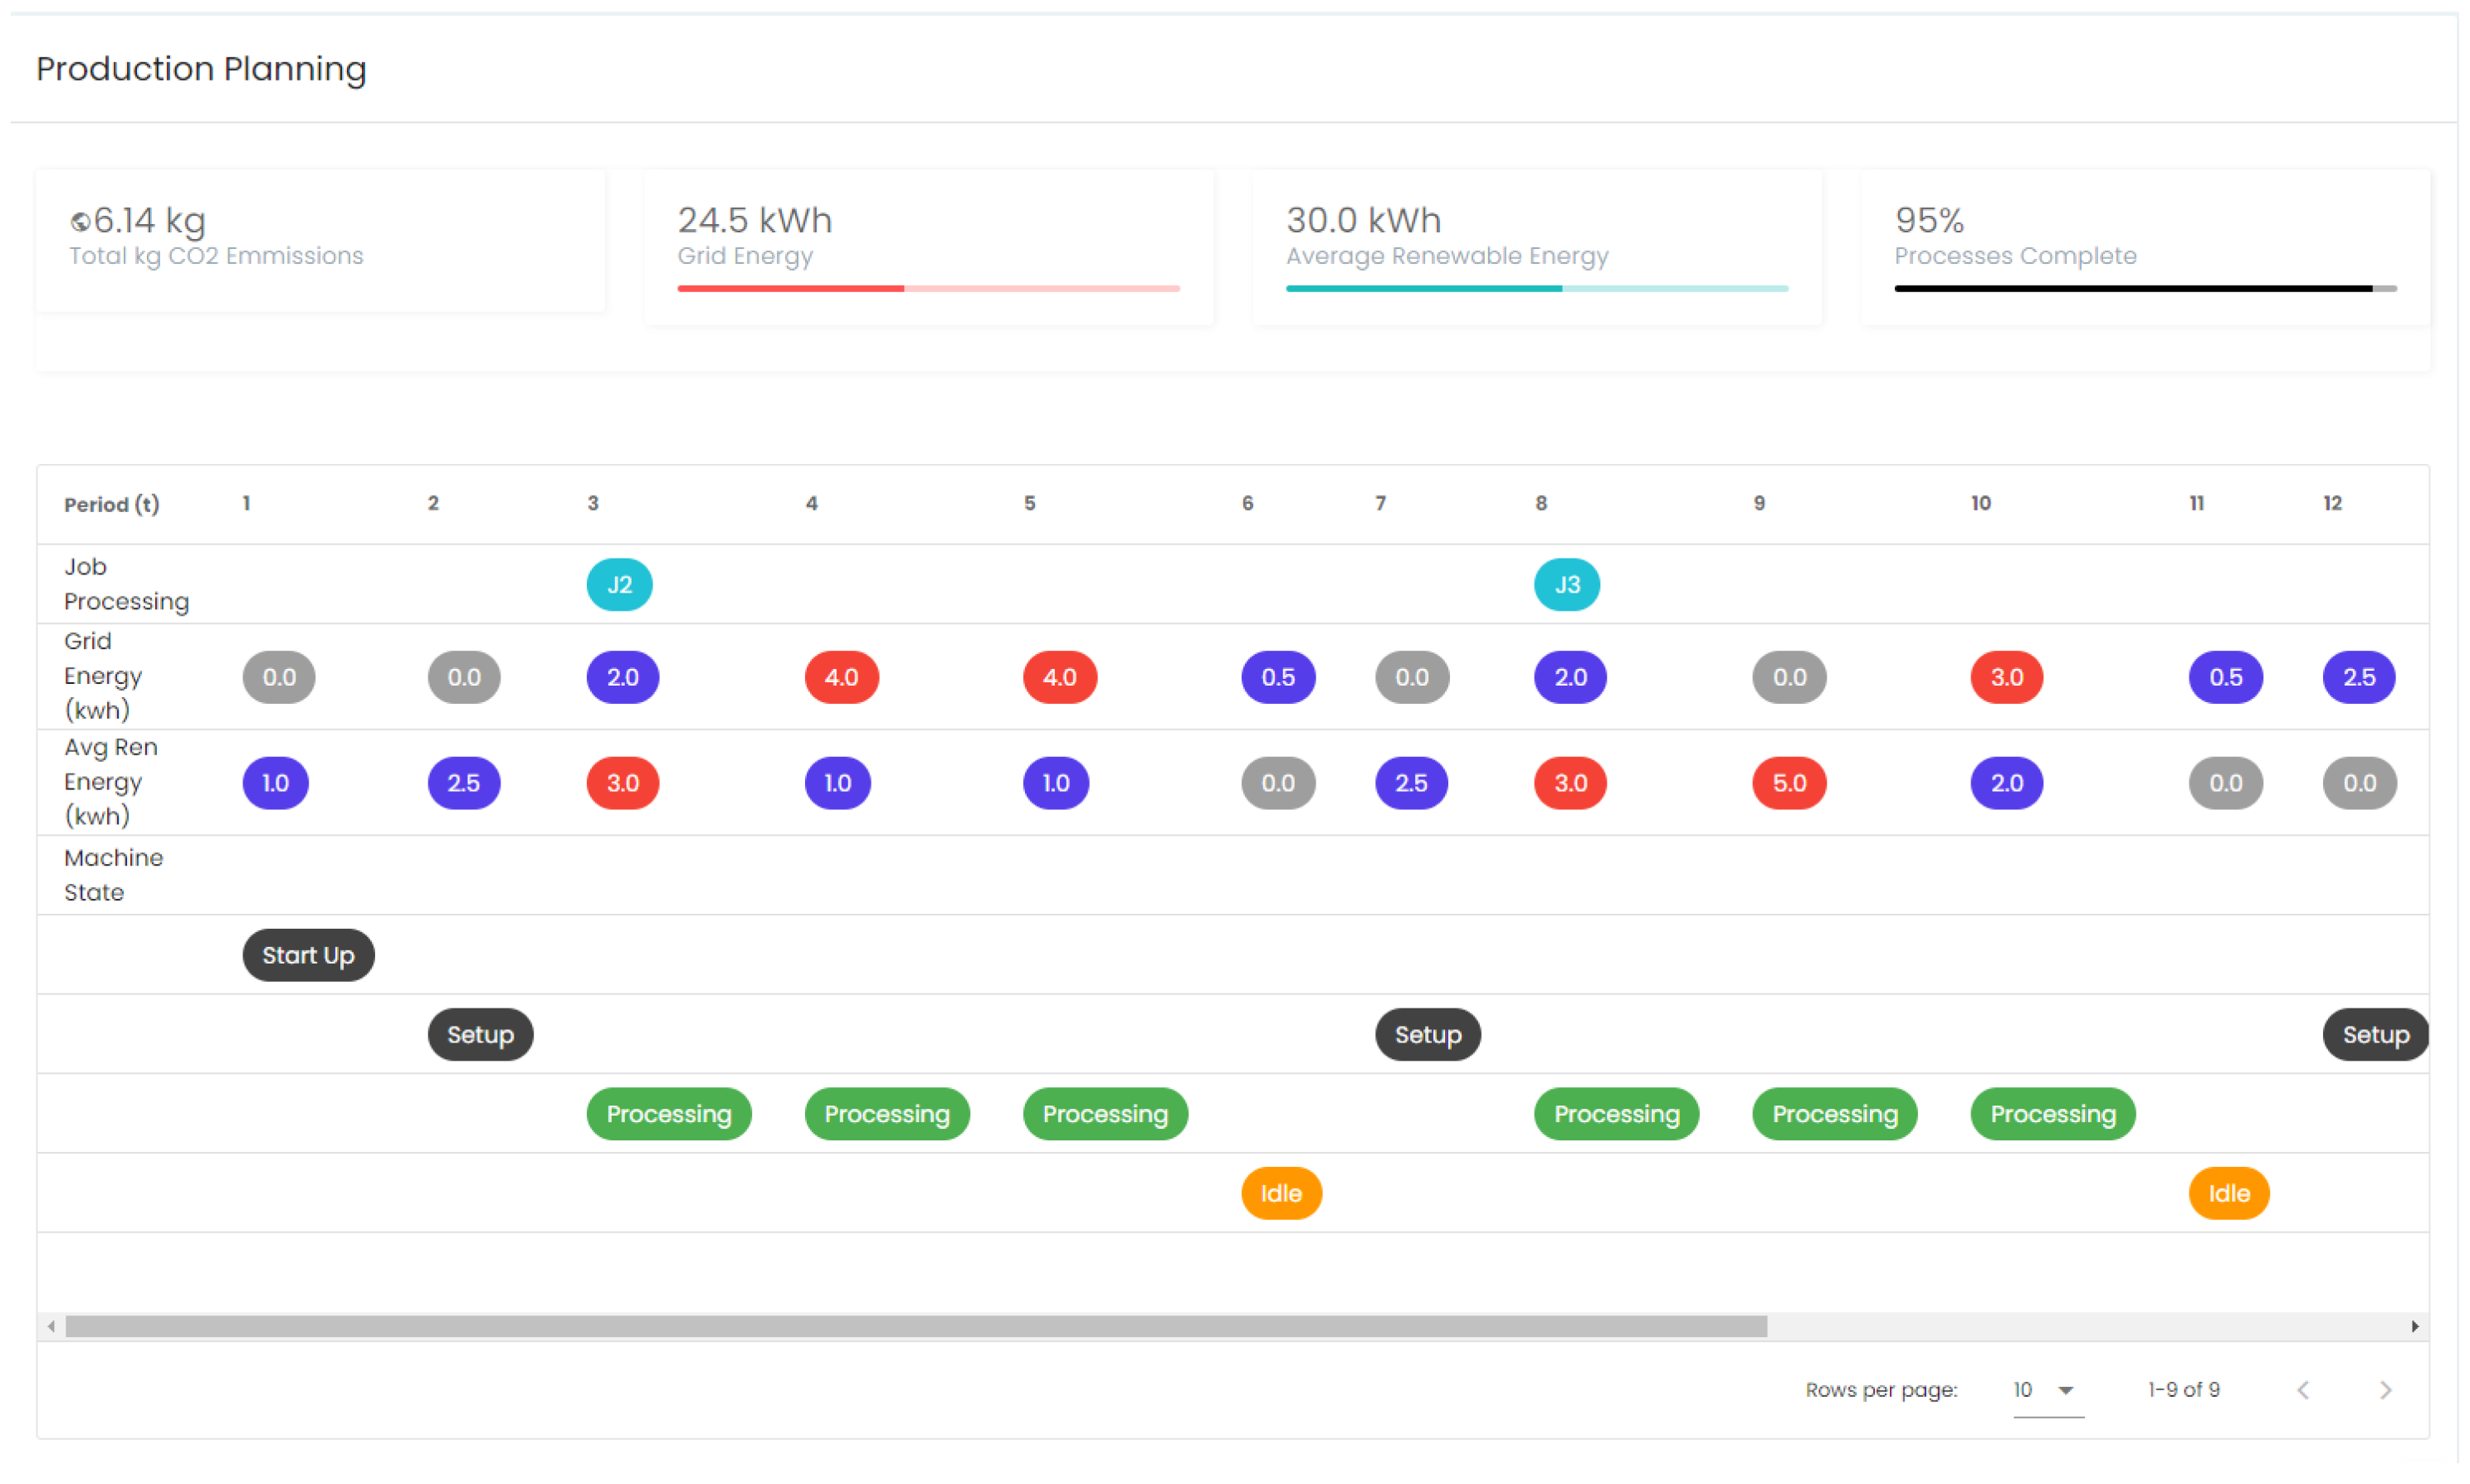
Figure 27.
GUI Log in screen, building view, asset view (lathe machine and air-handling unit) and faults detected.
Figure 27.
GUI Log in screen, building view, asset view (lathe machine and air-handling unit) and faults detected.
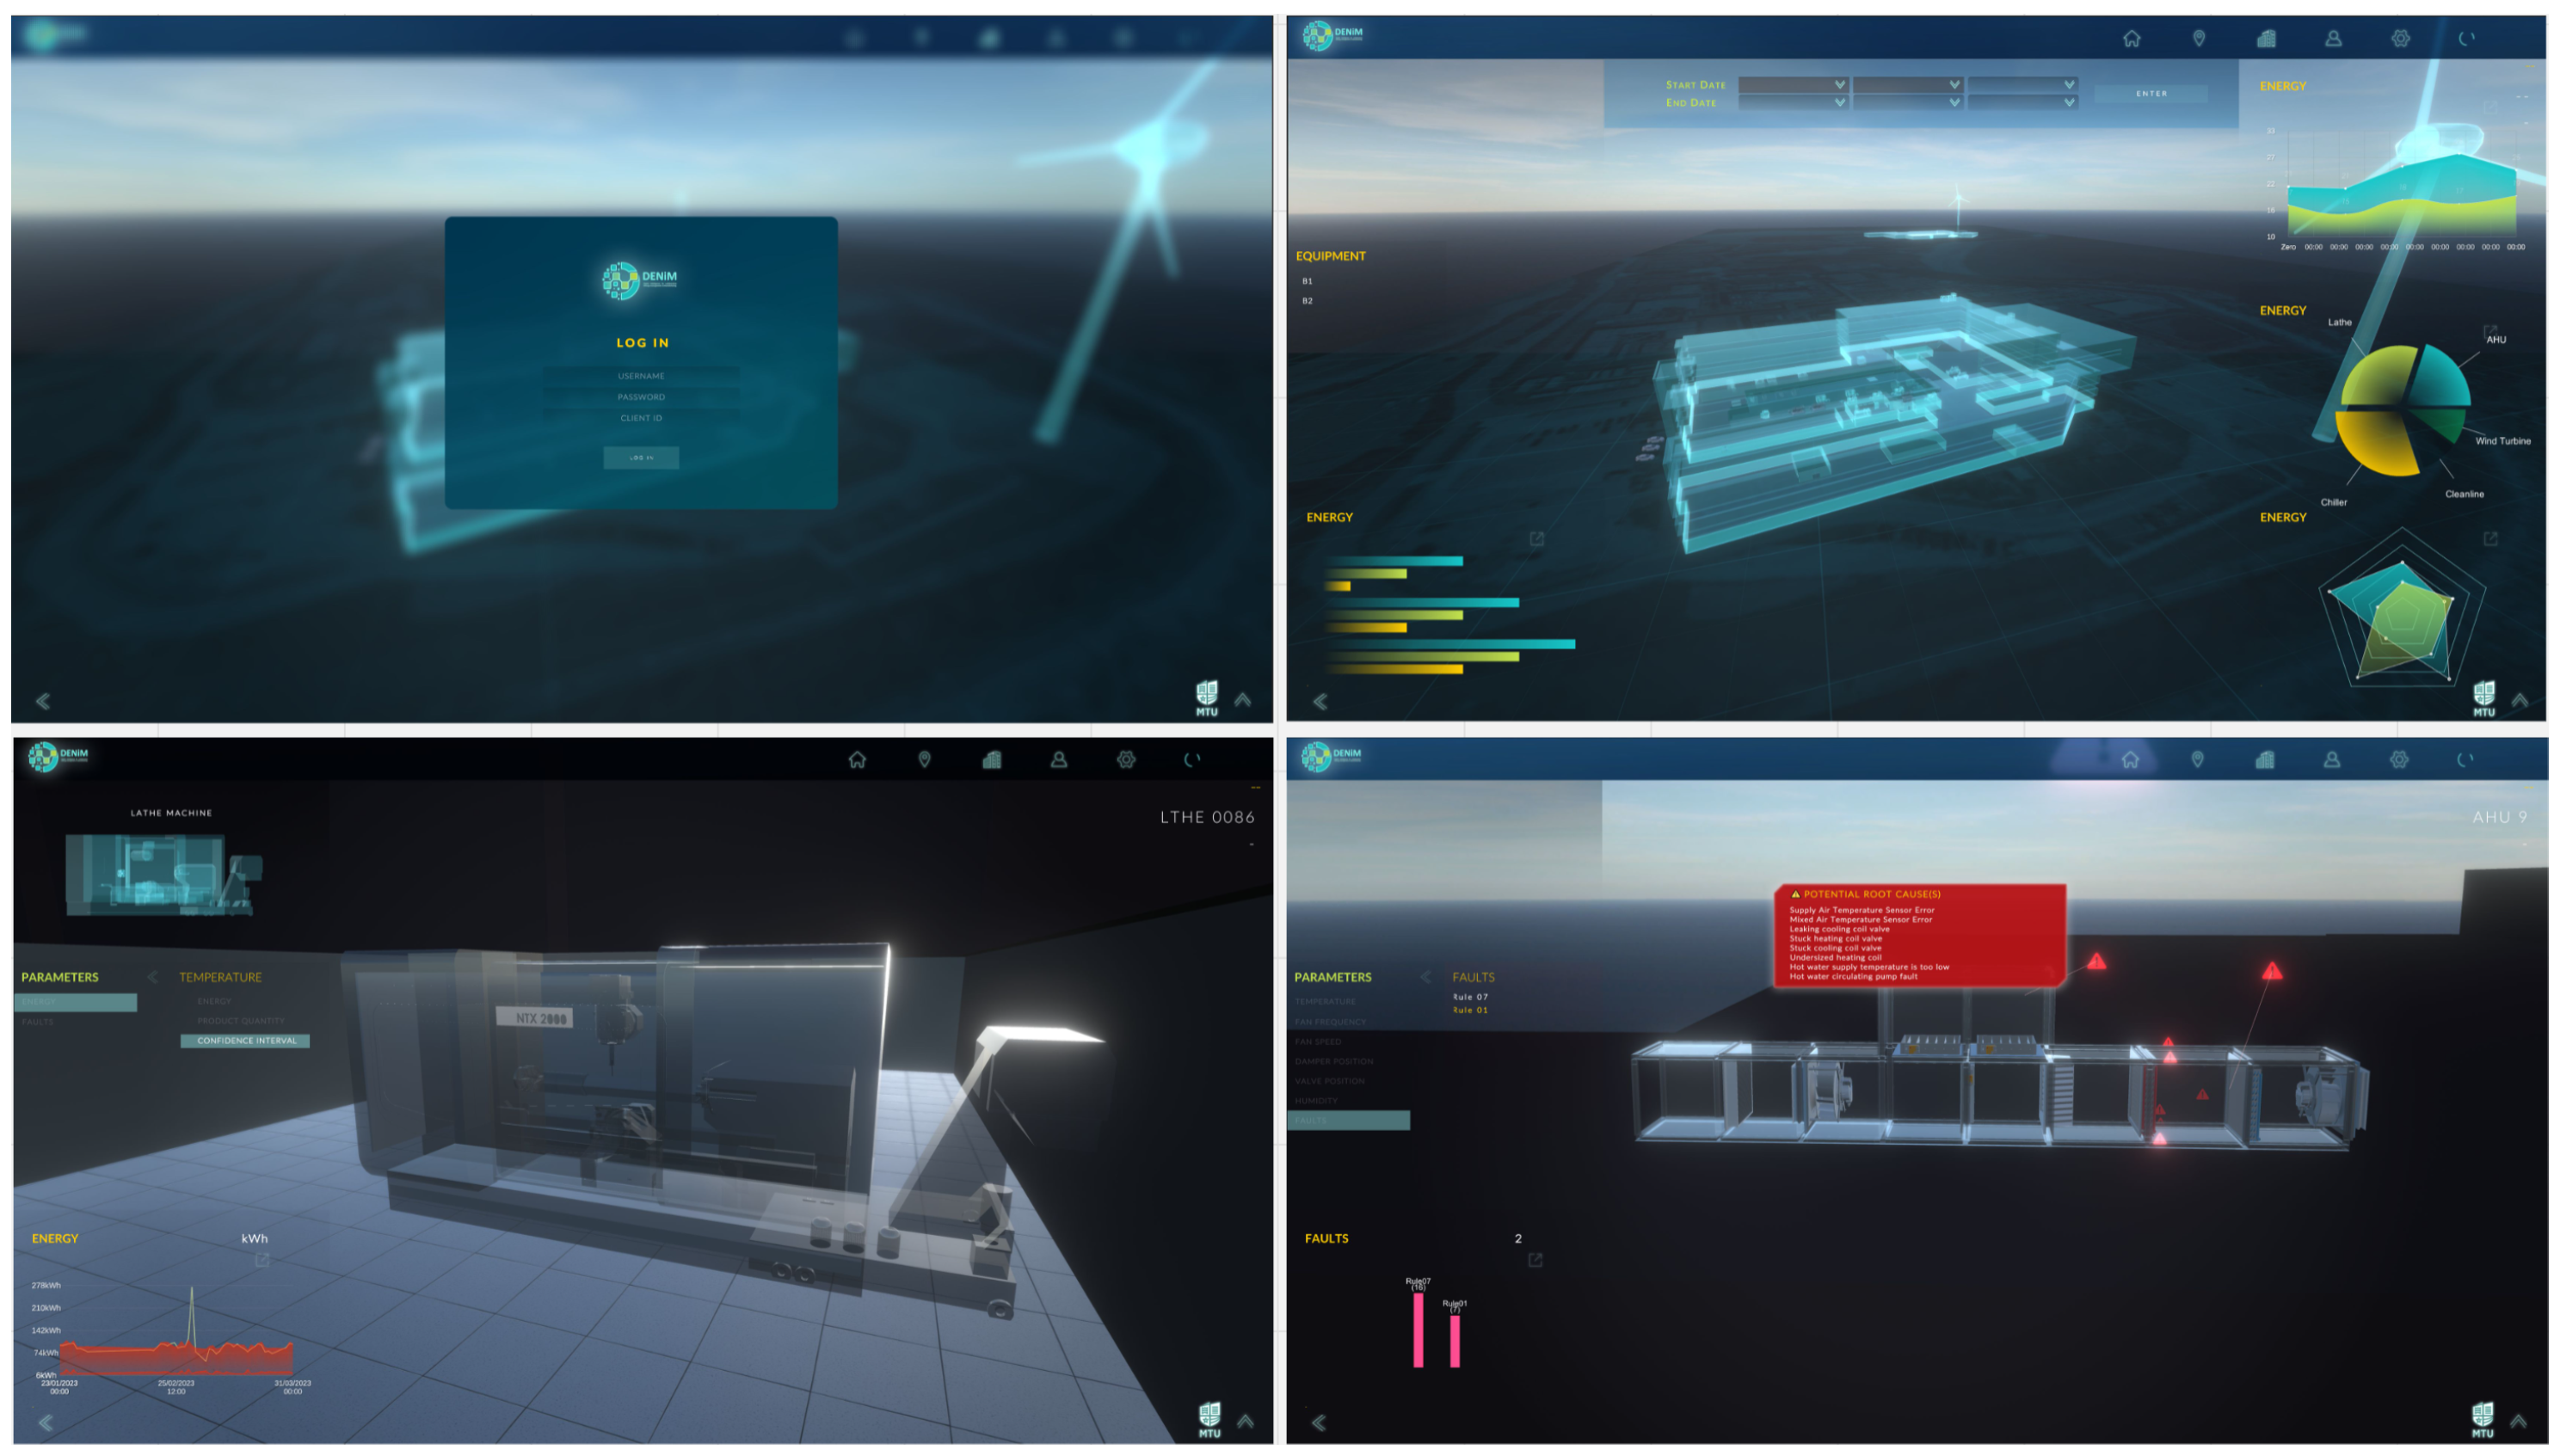

Table 1.
Power Consumption of Production Assets and Metering Information
| Process | Asset | Power (kW) | No. | Metered? |
|---|---|---|---|---|
| Issue Material | Printer | < 0.5 | N/A | No |
| Barcode Scanners | < 0.5 | N/A | No | |
| Saw | Electric Saw | 16 | 2 | No |
| Machine | CNC Mill | 29.2 | 5 | No |
| CNC Lathe | 19 | 8 | No | |
| Inspect | CMM 1 | 0.7 | 9 | No |
| Shadow Graph | < 0.5 | 3 | No | |
| Surface Tester | < 0.5 | 2 | No | |
| Laser | < 0.3 | 1 | No | |
| Clean | Multi-stage Cleanline | 90 | 2 | Yes |
| Label | Printer | < 0.5 | N/A | No |
| Barcode Scanners | < 0.5 | N/A | No | |
| Package | Sealer | < 0.25 | 12 | No |
1: Coordinate Measuring Machine
Table 2.
Potential Energy Savings by Idle Time Reduction and Schedule Optimisation.
| Asset Group | No. | Idle % | Idle 5% | Idle 10 % |
|---|---|---|---|---|
| All assets | 14 | 3.06 | 18.32 | 26.37 |
| Cleanlines | 2 | 0.61 | 0.77 | 51 |
| Saws | 2 | 0 | 0 | 0.4 |
| Lathes | 10 | 8.24 | 55 | 71.23 |
Table 3.
Sample rules of the APAR ruleset.
| Mode | Rule # | Rule Expression |
|---|---|---|
| Heating (Mode 1) | 1 | |
| 2 | For : | |
| 3 | & | |
| 4 | ||
| Cooling with outdoor air (Mode 2) | 5 | |
| 6 | ||
| 7 |
Table 4.
Validation Indices of the NeuroFuzzy Predicted Models.
| Error | ||
|---|---|---|
| indexes | model | model |
Disclaimer/Publisher’s Note: The statements, opinions and data contained in all publications are solely those of the individual author(s) and contributor(s) and not of MDPI and/or the editor(s). MDPI and/or the editor(s) disclaim responsibility for any injury to people or property resulting from any ideas, methods, instructions or products referred to in the content. |
© 2024 by the authors. Licensee MDPI, Basel, Switzerland. This article is an open access article distributed under the terms and conditions of the Creative Commons Attribution (CC BY) license (http://creativecommons.org/licenses/by/4.0/).
Copyright: This open access article is published under a Creative Commons CC BY 4.0 license, which permit the free download, distribution, and reuse, provided that the author and preprint are cited in any reuse.


