
Submitted:
26 February 2024
Posted:
27 February 2024
You are already at the latest version
Abstract
In order to achieve global climate goals, it is necessary to estimate greenhouse gases (GHG) fluxes from ecosystems. To obtain a comprehensive assessment of CO2, СН4, N2O natural fluxes for the Russian Federation we used the "bottom-up" method according to [1]. We updated estimates for forest ecosystems based on State Forest Inventory data and satellite monitoring of forest disturbances. For grassland ecosystems, it was based on the correct distribution of areas between steppe and non-steppe zones. The estimated net uptake of natural ecosystems of Russia was 1.1 ± 1.8 billion tons of CO2-eq./year. The study shows that if only CO2 is taken into account, the net absorption of terrestrial ecosystems in Russia corresponds to more than -2.5 billion tons of CO2 (35% of forests’ contribution). However, given the emissions of non-CO2 GHGs, total net absorption in Russia’s natural ecosystems is reduced to about -1 billion tons of CO2-eq (with the forests’ contribution increasing to 80%). With regard to anthropogenic fluxes, the overall balance of GHGs in Russia corresponds to net-emissions of 1 billion tons of CO2-eq/year into the atmosphere. To improve reporting under the Paris Agreement, countries should aim to include only anthropogenic ("manageable") GHG fluxes on managed land.
Keywords:
GHG fluxes
; carbon balance
; ecosystems
; managed land
; anthropogenic emissions and removals
; total net-emissions
; Russia
1. Introduction
In order to develop correct trajectories of countries’ efforts towards achieving global climate goals and to assess the degree of their fulfillment, including within the framework of the global stocktake under the Paris Agreement, it is necessary to conduct a comprehensive assessment of anthropogenic and natural fluxes of all major greenhouse gases (GHG) types of both anthropogenic and natural character [2].
In national reports under the United Nations Framework Convention on Climate Change (UNFCCC), countries provide data on anthropogenic GHG fluxes in the agriculture and land use, land use change and forestry (LULUCF) sectors [3]. For this purpose, the so-called managed lands are singled out. However, the magnitudes of natural GHG fluxes from natural ecosystems are insufficiently studied.
At both global and national levels, there is a gap in number of research on integrated assessment of anthropogenic and natural fluxes of all types of major GHGs (carbon dioxide (CO2), methane (CH4) and nitrous oxide (N2O)) from ecosystems using the "bottom-up" method. There are practically no such publications with regard to the territory of the Russian Federation.
Therefore, data on GHG fluxes from ecosystems of the Russian Federation can be found as part of large regional studies based on bottom-up model calculations [4,5,6,7], inverse modeling data [7], and as individual studies for a type of ecosystem [8,9,10,11,12], or for specific types of GHGs [13,14,15].
Russia also prepares annual national reporting (GHG Inventory) within the framework of the UNFCCC and the Paris Agreement commitments on anthropogenic emissions and removals of GHGs [16]. For reporting purposes, the Russian Federation distinguishes between managed lands where anthropogenic GHG fluxes are observed (operational and protective forests; protected areas; peat mining; drained peatlands; arable land; hayfields; pastures; settlement lands), and natural (unmanaged) ecosystems where there are no human activities and no anthropogenic GHG fluxes (forests where there is no obligation to extinguish fires (reserve forests); tundra; marshes; natural grasslands; steppes; rivers and lakes).
The only attempt to fully assess the role of all ecosystems in Russia (including tundra, forests, steppes, grasslands, marshes, and aquatic ecosystems) in terms of the balance of anthropogenic and natural GHG fluxes on the basis of a bottom-up study was performed by [1]. This article critically analyzes the results presented by [1], updates the data on forest and fallow ecosystems in Russia, and estimates the balance of anthropogenic and natural GHG fluxes in Russia as a whole. The feasibility of extending reporting under the UNFCCC and the Paris Agreement to unmanaged ecosystems was discussed.
2. Materials and Methods
2.1. Research Methods Are Described in the Study by [1]
The estimates presented by [1] are based on the analysis of direct measurement data published in the scientific literature. Methods of computational monitoring, mathematical and geoinformation modeling were used. The estimates were performed as of 2016.
Data from the Land Cadastre of the Russian Federation [17,18], as well as remote sensing data and ground surveys for individual ecosystems were used as input data for areas. Thus, wetlands areas by Russian territorial subjects were estimated based on the data of the "Wetlands of Russia" GIS of the Institute of Forest Science of the Russian Academy of Sciences [19,20]. The whole area of natural ecosystems in Russia considered in the study by [1] is 85% of the total area of the country. Forest lands (61% of the natural ecosystems considered in the study), tundra (18%) and wetlands (10%) make up the major share of the area, while grass ecosystems (6%) and freshwater ecosystems (5%) make up a smaller share. However, forests, wetlands and grasslands were not subdivided into managed and unmanaged.
To assess the balance of GHGs in tundra ecosystems, we used the results of field measurements of GHG fluxes using infrared gas analyzers, as well as eddy covarience method in combination with measurements of the main environmental parameters. To obtain regional estimates of GHG balance, a geoinformation approach was used to analyze digital maps of tundra landscapes, as well as a database of meteorological characteristics, and the use of models of aboveground phytomass dynamics and carbon fluxes [21,22,23].
The GHG balance of forest ecosystems was assessed using the ROBUL methodology [24,25,26], which assumes a balance approach based on accounting for carbon accumulation by different pools of forest ecosystems (phytomass, dead wood, litter, soil) and losses due to destructive disturbances (clearcuts, fires). Initial data for calculations are taken from the departmental statistics data of Rosleshoz State Forest Register [16].
Assessment of CO2 balance in steppe ecosystems is based on estimates of net primary productivity (NPP) and microbial respiration (MR). Regional estimates of CO2 balance on the territory of the Russian Federation were made using the approximation method or book-keeping models (BK-Apr). To implement this approach, the areas of steppe ecosystems and average specific (expressed per unit area) values of CO2 fluxes in the ecosystem (NEE, NPP and MR) were used [27,28].
The annual change in soil C stocks in grassland ecosystems was calculated on the basis of balance estimation of C compounds entering and leaving soils. The methodology for calculation of СН4 and N2O emissions is based on the use of initial statistical data on the number of grazing animals and application of conversion factors, and emission factors [29].
Estimation of GHG fluxes from wetland ecosystems is based on the use of area emission factors of carbon dioxide, methane and nitrous oxide, calculated for each territorial subject of the country differentiated by types of wetland ecosystems. Net ecosystem exchange values were based on data reported in peer-reviewed scientific publications as well as IPCC synthesis reports [30].
For freshwater ecosystems, CO2 and СН4 emissions were estimated separately for water bodies with standing water and for rivers and streams. The calculations took into account water body areas, CO2 and СН4 emission factors, including those recommended by the IPCC [31], and the duration of the ice-free period estimated from meteorological archive data [32].
2.2. Methods Used in This Study
Specifying of GHG fluxes through forest ecosystems performed in this study is based on the following:
- specification of initial data on forest carbon stocks according to the first cycle of state forest inventory [33];
- specification of initial data on forest disturbance and mortality based on satellite monitoring data [34,35,36].
- using initial data on logging volumes according to the Rosleshoz sectoral reporting data.
We obtained updated net absorption data for forest land based on the results of the first cycle of the State Forest Inventory (SFI), which ended in 2020. Quantitative forest characteristics of the regions and the country as a whole are obtained instrumentally from 69.1 thousand sample plots (SP) during 2007–2020. The first summarizing results of the SFI have been published [33]. International experience shows that data from National Forest Inventories (NFIs) can serve as a source of information on the state of forest resources and parameters of forest ecosystems. This allows estimating the absorptive capacity of forests for reporting under the UNFCCC and the Paris Agreement. Several countries (eg., China, USA, Federal Republic of Germany, Finland, Sweden, Japan, etc.) use NFI results to estimate carbon stock changes in managed forests. The longest time series of data are generated in the Nordic countries and the USA. The vast amount of data generated as a result of successive NFI cycles makes it possible to estimate directly the carbon stock difference in forest ecosystems according to the stock-difference method recommended by the IPCC [31].
For Russia, SFI is a new type of survey work, as a result of which an array of data on tree measurements and various ecosystem characteristics of forest communities was obtained at sample plots. As a result of processing the first SFI cycle, generalized characteristics of forest condition were obtained for the territorial subjects of the Russian Federation. This includes data on the distribution of forest areas, growing stock and volume of dead wood by species and 10-year age classes, litter and soil characteristics, and other indicators. Hence, the data obtained during the first SFI cycle allow specifying timber stocks, but not increments (changes in growing stock per year), which can be calculated from actual data only after the second SFI cycle.
The main task in interpreting the results of the first SFI cycle is to obtain calculated values of phytomass growth and dead wood stock changes for 1 year. This can serve as a basis for estimating forest carbon storage. SFI materials provide data on the distribution of forest areas and growing stock by species, stand quality (bonitet) and age classes. Such initial data allow calculating the current net growth using the normative reference base of growth and productivity of forests in Northern Eurasia, applying modal forest growth models [37]. These models make it possible to take into account regional characteristics, species composition, age and bonitet of stands. The models used allow estimation of wood stocks of a particular species, certain bonitet and age in 1-year increments. Similarly, models by [38] are used to estimate stocks of different fractions of dead wood (dead standing trees, dry branches, dead-fallen wood, stumps) in 1-year increments. Current growth is estimated as the difference in growing and dead wood stocks from growth models at a given age and one year ago. The obtained values of current net growth increment (in m3 ha-1 y-1) for each species of a certain bonitet and age make it possible to convert them into phytomass growth through updated models of conversion factors – Biomass Expansion Factors [39]. Given that 50% of dry phytomass is carbon [40], it is possible to estimate annual changes in carbon stocks in phytomass per 1 ha. Since the area of forest stands is known, the total value of phytomass and dead wood increments for the region as a whole is obtained.
Balance approach also requires estimation of carbon losses, which are calculated on the basis of actual data on stocks of cut wood and areas of dead stands due to fires and other causes. Carbon losses due to logging are calculated by considering losses of unlogged wood [41] and using conversion factors [39]. Carbon losses due to stand mortality are based on average values of carbon stock in forests of the region, derived from SFI calculations. Unfortunately, the litter and soil data obtained from SFI do not allow estimation of carbon stocks and carbon stock changes in these pools. Estimates of net uptake by litter and soil pools in this study are based on specific net uptake values (from the National Inventory Report) per forested area. According to the National GHG Inventory [16], the contribution of the litter and soil pool to total CO2 net uptake by forests does not exceed 15% (2017–2021 mean: litter is 2.7%, soil is 12.3%). The results of the net forest uptake estimates shown in Table 2 represent the mean value for the 2017–2021 period.
The areas of fallow ecosystems in the steppe zone of Russia were specified in this study based on the estimation of the difference between the total area of arable land according to Rosreestr data and the total area of crops, and fallow by territorial subjects of the Russian Federation according to the Federal State Statistics Service data [42]. In steppe subjects defined by [1], we identified the share of agricultural land attributable to the steppe zone based on data from [43,44] and Unified State Register of Soil Resources of Russia [45]. Accordingly, secondary steppe areas were recalculated.
Identified areas of fallow lands outside the steppe zone were considered separately. Estimation of net uptake on these lands was based on modeling of soil C stock dynamics using the calibrated RothC model for fallow lands in the context of the Russian Federation territorial subjects, different soil types and vegetation zones [44]. The obtained data were added to the total net absorption of grassland in Russia.
The areas of natural steppes attributable to forage lands (hayfields and pastures) and unmanaged grasslands were analyzed separately. For the distribution of natural steppe areas by these two categories, the general distribution of areas of managed and unmanaged grasslands according to Rosreestr data was applied (76.5% of grasslands in the country as a whole are fodder lands (70,789 ha) and 23.5% are unmanaged grasslands (21,720 ha). The net balance of GHGs for steppe lands is calculated according to [1]. The net balance for managed and unmanaged grasslands outside the steppe zone was calculated using the method proposed by [29]. Estimates of methane and nitrous oxide fluxes from forage lands were not recalculated and assumed equal to the estimates given by [1].
GHG flux estimates from agricultural land and land use change are entirely anthropogenic and were not considered by [1]. For a complete balance, data on net-emissions from these sources, as well as estimates of GHG emissions from other anthropogenic sources in the energy, industry, and waste sectors, were taken from the National Inventory Report [16].
3. Results
3.1. GHG Fluxes from Ecosystems of the Russian Federation
Natural ecosystems area included in the calculation by [1] do not always coincide with statistical data (Table 1). Thus, the recorded wetlands appear to partially overlap with forest land and tundra. At the same time, estimates of GHG fluxes from peatlands on forest lands according to the methodology used do not lead to double counting, but complement each other. Whereas in the case of tundra, there is a possible risk of double counting. This issue requires further study.
In the inventory, the category “managed grasslands” includes hayfields and pastures as well as overgrown cropland. However, in the study by [1], abandoned arable lands were fully accounted for in the secondary steppe category, which raises some doubts. Apparently, it is a consequence of overestimation of these areas in the steppe zone. As a result, overestimation of carbon accumulation in secondary steppe soils occurs. The sum of hayfields, pastures and steppes turned out to be higher than the total area of grasslands in the state statistics, which may also indicate overestimation of the areas of natural steppes outside forage lands. A recent paper by the authors of this assessment obtained roughly the same results [28]. In this study, the areas of grasslands and fodder lands are harmonized with the data of the Russian Land Cadastre [17]. Natural steppes are mostly used as pastures [46], which was taken into account during redistribution and in order to eliminate double counting of areas. In addition, clarification of the share of steppe fallow lands allowed to correctly identify fallow lands in other regions and natural zones of the country (almost 20 thousand hectares). Natural steppe areas were also redistributed between managed and unmanaged grasslands.
The analytics of the obtained results on GHG fluxes of natural ecosystems by gas type and by administrative division of Russia according to [1] is shown in Figure 1. Maximum net absorption of CO2 is a characteristic of the most forested regions, including those with extensive wetlands. They are in the Northern regions of the European part of the Russian Federation, Western and Eastern Siberia, and the Far East (Figure 1a). Methane emissions are also associated with wetlands and tundra ecosystems, and nitrous oxide emissions are associated with tundra ecosystems only. Accordingly, we see the distribution of methane and nitrous oxide emission intensity by regions of Russia (Figure 1b,c). Maximum fluxes of each GHG are typical for Krasnoyarsk Territory, characterized by natural ecosystems of all climatic zones, largely compensating each other. Net GHG flux of Krasnoyarsk Territory refers to a small net source (9 million tons of CO2-eq.).
Net absorbers in terms of the sum of all GHGs are forest regions in the North-Western Federal District of Russia, Central, Siberian and Far Eastern Federal Districts. At the same time, significant wetland areas in these counties determine relatively high methane emissions, which offset part of the carbon sequestration in forest biomass. Therefore, in the Asian part of the country, maximum net absorption is characteristic of regions rich in forests but with a relatively low percentage of wetlands (southern subjects of the Asian part of the Russian Federation). Southern regions in the European part of the country, the Southern, North Caucasus and Volga Federal Districts, with smaller areas of forests and larger areas of pasture lands and freshwater bodies are net sources. In general, the territory of natural ecosystems of our country has a negative balance for all types of GHGs and belongs to net absorbers.
The data for forest land obtained by [1] require updating for the value of net CO2 uptake (-804 million tons of CO2). These estimates were obtained based on initial data on timber reserves from the State Forest Register (SFR). SFR information, according to expert estimates, is 15–30 years old. In addition, due to the existing peculiarities of accounting, SFR include information only about the first tier of the stand having a marketable value, while SFI sample plots collect information on all trees, which is more correct in terms of estimating carbon balance. Therefore, it is likely that the resulting estimates of the forest carbon budget may be underestimated by 30–40% [47,48]. According to modeling estimates based on the comparison of 16 dynamic global vegetation models used in [6], net uptake in managed forests of the Russian Federation exceeds the national inventory data (-0.68 billion t CO2) and amounts to about -1.1 billion t CO2 per year [49]. However, it should be noted that the range of estimates of carbon sequestration by Russian forests available in the literature is quite wide and ranges from -220 to -2500 million tons of CO2 [50].
The results of the refined assessment for forest lands based on updated information on timber reserves within the SFI and updated estimates for fallow lands, fodder lands, natural and secondary steppes within this study are shown in Table 2 in comparison with the data of [1].

Table 2.
GHG net fluxes according to [1] and in the present work, mln t CO2-eq. (negative values are absorption, positive values are emissions).
Table 2.
GHG net fluxes according to [1] and in the present work, mln t CO2-eq. (negative values are absorption, positive values are emissions).
| Types of land | In the work by [1] | In this study |
|---|---|---|
| Forest lands | -775.2 | -895.6* |
| Grasslands | -370.8 | -330.7 |
| out of which: - natural steppes, total |
-107.0 |
-107.0 |
| - unmanaged grasslands outside the steppe zone | - | -62.1 |
| - fodder lands (hayfields and pastures) outside the steppe zone | 49.5 | -21.7 |
| - fallow lands, including: | - | -139.9 |
| - secondary steppes | -313.3 | -111.5 |
| Wetlands | 32.5 | 32.5 |
| out of which: - swamps |
-119.2 |
-119.2 |
| - areas under water | 151.7 | 151.7 |
| Tundra | 64.7 | 64.7 |
| Total | -1048.6 | -1129.1 |
* mean value for 2017–2021. Out of which CO2 is -937.5 million tons CO2-eq; СН4 is 25.5 million tons CO2-eq, and N2O is 16.4 million tons CO2-eq.
According to the data in Table 2, the recalculations made for forest lands (increase in net absorption by 120 million tons of CO2-eq.) and clarification of the distribution of grassland areas between steppe and non-steppe zones (decrease in net absorption by 50 million tons of CO2-eq.) did not lead to a significant difference in the aggregate estimate of the net balance of GHG from the country’s natural ecosystems. The difference amounted to 80.3 million tons of CO2-eq., which is within the area of uncertainty of the aggregate estimate.
Table 2 data for this study are summarized in Figure 2 by GHG and ecosystem types. Vertical lines show uncertainty ranges (95% confidence interval). Two almost equal but differently directed fluxes of CO2 and CH4 in wetland ecosystems determined a high uncertainty of the resulting value: ± 1580%. Thus, CO2 uptake was calculated with an uncertainty of ± 200% and CH4 was calculated with an uncertainty of ± 100%. Figure 2 shows that the key fluxes in Russia include carbon sequestration by forest, wetland and tundra ecosystems, and methane emissions by wetlands and tundra. Humid areas, where anaerobic conditions are often created in soils, although they store carbon, are characterized by relatively high methane emissions into the atmosphere and may be net emitters of GHGs, given that the global warming potential of methane is 25–30 times higher than that of CO2. High methane emissions from wetlands in the boreal zone, as well as their increase during 2007–2021 in relation to the level of 2000–2006 are noted by [51].
Obtained GHG fluxes estimates (Figure 2), according to the authors, require further study on clarification of the following directions:
- specification of data on carbon stock changes in litter and soil pools in forest ecosystems. It is reasonable to consider stock changes in the 0–100 cm soil layer, given that boreal forests are characterised by high soil carbon stocks. The change in these stocks in forests occurs, among other things, at depths below the first 30 cm. Apparently, the specification of data on these pools can cause an increase in total net carbon sequestration in forests by -30...-40 million tonnes of CO2.
- considering that estimates for forest lands are based on state statistics data, this study does not include forests on overgrown agricultural lands, which may lead to underestimation of up to -90 million tonnes of CO2 uptake in stand biomass alone (expert assessment by [52]). Carbon storage by soils of overgrown lands is accounted for in the inventory under the land-use change category;
- relatively high values of N2O emission in tundras. A much smaller estimate of N2O emission in this zone is found in the scientific literature. Hence, according to [53], on average for permafrost soils the specific global emission of N2O for 1993–2019 is 2 orders of magnitude lower. In terms of comparable units, it is about 0.57 g C-CO2 m-2 per year lower than the 21.7 g C-CO2 m-2 per year that was obtained by [1]. At the same time, the overall assessment of the tundra zone as a weak net source or territory with zero GHG balance corresponds to the IPCC assessment obtained later [54,55]. It seems then that carbon uptake [1] may also be somewhat overestimated for tundra ecosystems, which together with compensatory estimates of N2O emission shows consistent results with those of other authors;
- the areas of small and temporary freshwater bodies are likely to be underestimated on the basis of state statistics and, consequently, GHG emissions from them as well. Deeper thawing of permafrost soils during the warm period of the year may be accompanied by the formation of temporary shallow reservoirs, which are characterised by high methane emissions. It is necessary to conduct further studies to estimate the areas of small lakes, streams and ponds on the tundra territory using remote sensing data for more correct estimation of annual emission of methane and CO2 into the atmosphere.
It is advisable to continue working on clarifying the GHG balance in managed and unmanaged grassland ecosystems.
Figure 3 shows the GHG flux balance of natural ecosystems on the territory of Russia. It can be seen from Figure 3 that CO2 net flux is characterised by a negative value, i.e., the absorption of carbon dioxide prevails over its emissions and corresponds to -2.7 ± 1.7 billion tonnes of CO2 per year. This estimate corresponds to the data of other authors [4,5,14,56,57]. In accordance with the Biomass Carbon Monitor global service data on changes in aboveground biomass carbon stocks, Russia absorbed about -2.14 billion tonnes of CO2 in 2016, which also matches the obtained data on carbon dioxide in the study by [1]. In the study by [58], the mean value of CO2 net uptake by ecosystems in the Russian Federation according to inversion modelling data is estimated on average as a smaller value equal to -1.6 billion tonnes of CO2 with a range of estimates by different models from -3.0 to -0.7 billion tonnes of CO2.
Methane and nitrous oxide have net emissions to the atmosphere totalling 1.6 ± 0.8 billion tonnes of CO2-eq. per year, which offset more than 60% of CO2 uptake. There is not much data in the literature on emission estimates of non-CO2 gases, and their variation is relatively large. Therefore, according to [59], natural methane flux in the Russian Federation is estimated to be almost 5 times lower than according to [1]. Methane emissions to the atmosphere from wetlands obtained in our study are almost 1.4 times higher than the maximum estimate from GOSAT satellite monitoring data [60]. It should also be noted that information on methane emission from tundra is apparently absent in GOSAT and other satellite data.
Total GHG flux balance of all studied ecosystems in Russia corresponds to a net uptake of -1.1 ± 1.7 (±161%) billion tonnes of CO2-eq. High uncertainty is primarily determined by the uncertainty of flows in wetlands and tundra.
According to the data available in the publications, as a result of the expected increase in methane emissions from permafrost soils, the growth of methane emissions from the shelf, as well as the gradual decrease in the productivity of forest and other ecosystems as a result of further temperature changes and redistribution of precipitation, it is likely that GHG fluxes to the atmosphere from the territory of Russia will increase and the country’s natural ecosystems will become a net source of GHGs in the second half of the 21st century [59].
3.2. Balance of Anthropogenic and Natural GHG Fluxes in Russia
Considering the anthropogenic GHG fluxes already partially included in the above estimates, for a full assessment of the total net flux (anthropogenic and natural) from the ecosystems of Russia, it is necessary to add the contribution of agrocenoses, changes in land use and changes in the carbon balance in the forest products pool. These estimates are available in the inventory [16]. Therefore, total GHG net flux from the ecosystems of Russia is estimated to be equal to absorption of -1064 ± 1820 thousand tonnes of CO2-eq.
Figure 4 shows estimates of the total GHG balance taking into account anthropogenic emissions from fossil fuel combustion, industry, livestock, waste sector and net uptake of ecosystems in Russia according to this study and [16].
Obtained total balance of anthropogenic and natural GHG fluxes on the territory of Russia corresponds to the value of net emission of 910 million tonnes of CO2-eq. According to [16], the pooled uncertainty values excluding the contribution of the LULUCF sector in the base (1990) and reporting (2021) years were 4.4% and 5.5%, respectively [16, Volume 2]. Using the higher value for 2016, we obtain a total uncertainty in the resulting estimate of ± 171%. Thus, as of 2016, the overall GHG balance on the territory of Russia is likely to be positive, i.e. it is characterised by net-emissions of 0.91±1.8 billion tonnes of CO2-eq.
Total GHG balance taking into account net fluxes from ecosystems and anthropogenic emissions by types of major gases (excluding F-gases) is presented in Table 3. According to the data in Table 3, the Russian Federation can be considered a "donor" only for CO2, net absorption of which is approximately -1.05 billion tonnes of CO2. Thus, the Russian Federation already has the carbon neutrality that the IPCC [61] recommends achieving to meet the trajectory of keeping warming within 1.5 °C by 2050, when considering the sum of anthropogenic and natural fluxes. However, given the emissions of non-CO2 gases, Russia is likely to be a net emitter of GHGs to the atmosphere.
According to the data in Table 3, the Russian Federation can be considered a "donor" only for CO2, net absorption of which is approximately -1.05 billion tonnes of CO2. Thus, the Russian Federation already has the carbon neutrality that the IPCC [61] recommends achieving to meet the trajectory of keeping warming within 1.5 °C by 2050, when considering the sum of anthropogenic and natural fluxes. However, given the emissions of non-CO2 gases, Russia is likely to be a net emitter of GHGs to the atmosphere.
4. Discussion
Available bottom-up satellite estimates for the CO2 flux are in accordance with our results. Satellite information is an independent source of information for verification of bottom-up data derived from ground observation and modelling data. For instance, according to [7], the average of 5 datasets analysed by the Orbiting Carbon Observatory (OCO-2) inversion model comparison project, including in situ CO2 measurements and a combination of these data, showed net uptake between the land surface and the atmosphere within the Russian Federation to be just under 1 billion tonnes of CO2 on average over the period of 2015–2020. This value corresponds to the sum of ecosystem fluxes of carbon dioxide and anthropogenic CO2 emissions in Russia, which is estimated in our study as -1.05 billion tonnes of CO2 (see Table 3) for 2016. We estimate that natural ecosystems in the Russian Federation absorb approximately -2.7 billion tonnes of CO2-eq, which also correlates well with the ΔCloss value [7] corresponding to the mean of the 5 datasets. Although the ΔCloss variable also includes international trade in grain and timber, in the case of Russia, the resultant for these fluxes is practically zero and does not significantly affect the comparison between our results and those of [7].
Total methane fluxes in Russia obtained in our study are estimated about 2 times higher than in the study by [59] and 1.4 times higher than in [15]. According to the latest study, Russia’s contribution to natural global methane emissions does not exceed 10% and amounts to 13.3 million tonnes of СН4 per year for the bottom-up assessment and 11.7 million tonnes of СН4 per year for the top-down assessment. At the same time, the contribution of wetlands dominates the intensity of all-natural sources accounting for about one third of all СН4 emissions from the territory of Russia into the atmosphere. The intensity of anthropogenic sources of methane emissions is also not more than 10% (23.5 million tonnes of СН4 per year and 19.8 million tonnes of СН4 per year, respectively) [15]. It should be noted that, according to the inventory data, anthropogenic methane emission without taking into account the LULUCF sector was a lower value of 11.6 million tonnes in 2016, and with its inclusion it was 12.5 million tonnes of СН4 [16]. According to EDGAR (Emissions Database for Global Atmospheric Research), anthropogenic methane emissions in Russia were about 16 million tonnes of СН4 in 2016 (18 million tonnes of СН4 in 2021). Other data, such as the CEDS (A Community Emissions Data System) database shows about 25 million tonnes of СН4 in 2017. The spread of bottom-up data for anthropogenic emissions in Russia ranges from 16 to 28 million tonnes of СН4, while top-down data range from 11 to 26 million tonnes of СН4 [60].
According to the authors [15], the share of anthropogenic emissions in the total methane emission in Russia is close to 2/3. Approximately the same 2:1 ratio between anthropogenic methane emissions and natural emissions is given by [59]. International databases show a ratio close to 1:1 [60]. According to our data, natural methane emission from the territory of Russia exceeds anthropogenic emission in the ratio of 4:1. Despite the possibility of some overestimation of natural fluxes and/or underestimation of anthropogenic methane emission in our study and in [16], given the presence of significant sources in tundra and wetland ecosystems, the excess of total natural methane emission over anthropogenic emission looks more logical for the territory of the Russian Federation than vice versa.
Anthropogenic nitrous oxide emissions can be compared with EDGAR database data, which show a lower value of anthropogenic N2O emissions for 2016 than in the inventory, where it comprises 76 million tonnes CO2eq (85 million tonnes CO2eq for 2021). For natural N2O emission on a nationwide scale, only modelling data have been found in scientific publications. Accordingly, comparison of assessment results from 10 terrestrial ecosystem models, nine of which are DLEM, LM3V-N, ORCHIDEE, ORCHIDEE with nitrogen and phosphorus cycles (ORCHIDEE-CNP), O-CN, Lund-Potsdam-Jena General Ecosystem Simulator (LPJ-GUESS), LPX-Bern, TRIPLEX-GHG, and a model with a vegetation block for the estimation of small gas constituents (VISIT)) shows quite similar results of nitrous oxide emissions from natural ecosystems of Russia on average for the period from 2001–2015 amounting to about 0.26–0.28 Tg N-N2O [62,63]. This value corresponds to 126.4 million tonnes CO2-eq, which is 2 times lower than the 254.1 million tonnes CO2-eq in our study. Doubts about the estimates of N2O emission intensity from tundra and its possible overestimation by [1] are discussed above.
Managed and Unmanaged Lands in GHG Reporting
To structure the work of countries in combating anthropogenic climate change, only anthropogenic GHG fluxes of both emissions and removals need to be isolated and accounted for. The latter is not an easy task, but it is required. Accounting for large unmanaged fluxes in nationally determined contributions (NDCs) under the Paris Agreement would lead to inefficient allocation of country efforts and could completely eliminate incentives to reduce emissions and increase national uptake.
Historically, the negotiations of the Parties to the UNFCCC have produced 2 following concepts of anthropogenic takeover: "land management" and "managed lands". In the first case, the action-by-action approach allows to be considered only those fluxes that modified by the direct impact of human activities. For instance, ploughing land as part of cropland management results in losses of soil organic carbon. Direct impacts also include actions such as cutting and planting of forests, flooding and draining of lands, etc. The most controversial issue was the management of existing forest lands. It is practically impossible to identify the effect of anthropogenic activities on them, given that actions to protect and conserve forests prevent an unknown amount of GHG emissions into the atmosphere per year. In this case it was necessary to introduce the concept of "managed lands". For example, the IPCC Good Practice Guidance for LULUCF [64] established the following definition of two management approaches for forest land:
“Forest management is the process of planning and implementing practices for stewardship and use of the forest aimed at fulfilling relevant ecological, economic and social functions of the forest... A managed forest is a forest subject to forest management”.
The following 2006 IPCC Methodological Guide [40] defines managed lands as “lands where human intervention and practices have been applied to fulfil productive, environmental or social functions". All land definitions and classifications should be specified at the national level, described in a transparent manner, and be applied consistently over time". For unmanaged land, it is recommended to consider only its area in country reporting.
The IPCC also distinguishes the concept of "indirect anthropogenic effects" on GHG fluxes in ecosystems due to anthropogenic changes in the environment (eg., changes in atmospheric CO2 concentration, deposition of nitrogen compounds of anthropogenic origin, changes in temperature or precipitation regimes) that affect plant growth, mortality of individuals in populations, decomposition rates of dead organic matter, and natural disturbance regimes in ecosystems.
According to IPCC guidelines, all GHG emissions and removals within managed land boundaries are to be reported and accounted for, and taken as an approximation of anthropogenic fluxes (e.g., wildfires caused by natural causes within managed forests are counted as anthropogenic, but any fires within unmanaged land are not). Thus, the introduced concept of managed land is a kind of indirect indicator of anthropogenic effect on the territory of natural ecosystems.
The shortcomings of approximating anthropogenic effects on the climate system through the managed land approach were discussed in detail at a separate IPCC expert meeting in 2008 [65]. In particular, the complexity of applying the approach to wetlands and flooded lands, accounting for changes in forest age structure, and natural disturbances on managed lands, and indirect positive effects of increasing atmospheric CO2 concentration, etc. were pointed out. It is evident that estimating carbon stock changes across all pools of managed land according to IPCC guidance takes into account both management effects and natural processes together. However, no other approach was developed at the meeting to separate these factors, and the "managed land" approximation was confirmed as the most pragmatic approach for national reporting. It is still relevant today, within the framework of the Paris Agreement.
It should be noted that the "managed lands" approach will also not work in the case of scaling up activities to reduce (prevent) GHG emissions in previously unmanaged ecosystem. For example, when trying to scale up activities that prevent thawing of permafrost soils. However, fully accounting for all GHG fluxes on newly managed lands would result in an absolute increase in anthropogenic emissions in national reporting and remove incentives to increase such important climate change activities.
Given the difference in the approaches used in scenario modelling of the required levels of emission reductions in the Assessment Reports of IPCC and national reports under the UNFCCC [49,66], there are recommendations in the literature that GHG fluxes from all ecosystems of countries should be fully accounted for in their reporting [2]. However, it is impossible to accept this. As stated above, the inclusion of any large GHG flux (either positive or negative) in reporting could negate any efforts to reduce emissions or increase sequestration, as these efforts would "disappear" in the face of large unmanaged fluxes. For the Russian Federation, such an effect may be related to the inclusion in the reporting of total fluxes of unmanaged wetland and tundra ecosystems. The presence of large emissions that cannot be reduced may eliminate the sense in managing other, including forest ecosystems and, for example, in reducing the area of forest fires. Despite the cost of these measures, the total GHG net flux in the national reportings will not change much. It is also inappropriate to consider unmanaged uptake in forest and grassland ecosystems of the country, which can have a similar effect on the management decisions efficiency (presence of large uptake despite emissions from forest fires will not stimulate activity on their extinguishing). Unfortunately, approaches to separate natural and managed uptake in the remaining forests have not yet been developed. An attempt to isolate anthropogenic effects is present in the IPCC Wetland Supplement [41], where in carbon-rich coastal ecosystems it is suggested that only the management activities impact on the carbon stock of the ecosystem should be considered, rather than accounting for it completely. This approach should be developed accordingly.
Evidently, it is the clear delineation of anthropogenic fluxes on managed lands that is the most accurate approach for reporting GHGs and countries should aim for it, rather than extending their reporting entirely to all GHG fluxes within natural ecosystems, as suggested by [2].
5. Conclusions
Despite possible errors in GHG emission and uptake estimates in the study by [1], and in our study, they appear to largely offset each other. Relatively high uncertainty of the resulting estimate for natural ecosystems of Russia as a whole, determined as almost 200%, is due to the difference of two large values of differently directed emission and absorption fluxes. However, it can be assumed at the expert level that the accuracy of the resulting estimate is higher and ranges from about ±50%. This range corresponds to the average spread of modelling results from dynamic vegetation models and inversion modelling from remote sensing data. In such a case, there is no doubt about the GHG balance mark.
In our study we obtained the following 3 main conclusions of the GHG flux balance on the territory of the Russian Federation:
- net absorption of carbon dioxide on the territory of terrestrial ecosystems of Russia corresponds to the value of more than -2.5 billion tonnes of CO2. The contribution of forest ecosystems to the carbon balance is only about 35%. Taking into account the anthropogenic emission of carbon dioxide (1.6 billion tonnes of CO2), Russia's territory is likely to be a net absorber, i.e. a "donor" when assessed by CO2 alone. Therefore, the Russian Federation already has the carbon neutrality necessary to match the trajectory of keeping warming within 1.5 °C by 2050, when considering the sum of anthropogenic and natural fluxes;
- taking into account emissions of non-CO2 GHGs (methane and nitrous oxide), net absorption of GHGs in natural ecosystems of Russia is reduced by more than 2 times and amounts to about -1 billion tonnes of CO2-eq. At the same time, forests account for almost 80% of the total GHG balance on the territory of Russia. The greatest contribution to emissions of non-CO2 gases comes from the wetland and tundra ecosystems of Russia. For the latter the estimation uncertainty is extremely high, and data in the publications are fragmentary, while satellite information seems to be practically absent;
- GHG balance of natural and anthropogenic fluxes on the territory of Russia is most likely positive, i.e. corresponds to net-emissions into the atmosphere in the amount of 1 billion tonnes of CO2-eq. Estimated net balance for anthropogenic GHG fluxes in the National Inventory for 2016–2021 is 1.56 billion tonnes of CO2-eq emissions to the atmosphere [16]. Hence, it is most probably that the Russian Federation is not a "climate donor" when all GHGs are fully accounted for.
In terms of improving reporting under the Paris Agreement, countries should endeavour to include only anthropogenic (manageable) GHG fluxes on managed land, rather than extending their reporting entirely to all-natural ecosystems. Only such an approach will incentivise action by countries to reduce emissions and increase removals on their territory.
Further scientific research should be devoted to the collection of more complete information on changes in carbon stocks and non-CO2 GHG fluxes for the territory of Russia, and to the correct assessment of inter-annual variability of these fluxes. A significant lack of data, both ground-based experimental observational data and satellite and modelling estimates, is noted for the tundra ecosystem zone. High spatial variability, small number of experimental measurements, low coverage by satellite systems, and high cloudiness of the northern territories account for the high variability in the aggregate estimates of tundra's contribution to climate change obtained by different methods. While for carbon estimates are built on more reliable data (ecosystem carbon stocks) that are suitable for periodic observation, СН4 and N2O emissions require continuous measurements and cannot be reliably interpolated between point-in-time measurements, whether ground-based or remote. These features should be considered in future studies.
Author Contributions
Conceptualization, A. R. and V. K.; methodology, A. R. and V. K.; formal analysis, A. R. and V. K.; investigation, A. R. and V. K.; resources, A. R. and V. K.; data curation, A. R. and V. K.; writing—original draft preparation, A. R. and V. K.; writing—review and editing, A. R. and V. K.; visualization, A. R.; supervision, A. R.; project administration, A. R. All authors have read and agreed to the published version of the manuscript.
Funding
This research was funded by the Russian Hydrometeoservice, research theme number 3.3 in the Research and Technical Work Plan for 2020-2024.
Data Availability Statement
The data presented in this study are available on request from the corresponding author.
Acknowledgments
The authors are grateful to Dr. D.G. Schepaschenko and S.V. Fedorov for consultation and help with the results of the first cycle of the State Forest Inventory.
Conflicts of Interest
The authors declare no conflicts of interest. The funders had no role in the design of the study; in the collection, analyses, or interpretation of data; in the writing of the manuscript; or in the decision to publish the results.
References
- Korotkov, V.N.; Romanovskaya, A.A.; Karelin, D.V.; Kurganova, I.N.; Sirin, A.A.; Korzukhin, M.D.; Lopes de Gerenu, V.O.; Golubyatnikov, L.L.; Glagolev, M.V.; Popov, I.O.; Trunov, A.A.; Vertyankina, V.Y.; Polumieva, P.D.; Berdin, V.Kh.; Yulkin, G.M.; Posysaev, Yu.Yu.; Karimova, D. .B.; Skonechny, M.S. Assessment of greenhouse gas flows in ecosystems of regions of the Russian Federation. In Assessment of greenhouse gas flows in ecosystems of regions of the Russian Federation, A.A. Romanovskaya, Ed.; Yu.A. Izrael Institute of Global Climate and Ecology: Moscow, Russia, 2023; pp. 45–345. Available online: http://www.igce.ru/wp-content/uploads/2023/11/Monograph_corr_15112023_2.pdf (accessed on 19 February 2024).
- Nabuurs, GJ. , Ciais, P., Grassi, G. et al. Reporting carbon fluxes from unmanaged forest. Commun. Earth Environ. 2023, 4, 337. [Google Scholar] [CrossRef]
- National Inventory Submissions 2023. Available online: https://unfccc.int/ghg-inventories-annex-i-parties/2023 (accessed on 19 February 2024).
- Pan, Y.; Birdsey, R.A.; Fang, J.; Houghton, R.; Kauppi, P.E.; Kurz, W.A.; Phillips, O.L.; Shvidenko, A.; Lewis, S.L.; Canadell, J.G.; Ciais, P.; Jackson, R.B.; Pacala, S.; McGuire, A.D.; Piao, S.; Rautiainen, A.; Sitch, S.; Hayes, D.; Wayson, C.A. Large and Persistent Carbon Sink in the World’s Forests. Science 2011, 333, 988–993. [Google Scholar] [CrossRef] [PubMed]
- Sitch, S.; Friedlingstein, P.; Gruber, N.; Jones, S.D.; Murray-Tortarolo, G.; Ahlström, A.; Doney, S. C.; Graven, H.; Heinze, C.; Huntingford, C.; Levis, S.; Levy, P. E.; Lomas, M.; Poulter, B.; Viovy, N.; Zaehle, S.; Zeng, N.; Arneth, A.; Bonan, G.; Bopp, L.; Canadell, J. G.; Chevallier, F.; Ciais, P.; Ellis, R.; Gloor, M.; Peylin, P.; Piao, S. L.; Le Quéré, C.; Smith, B.; Zhu, Z.; Myneni, R. Recent trends and drivers of regional sources and sinks of carbon dioxide. Biogeosciences 2015, 12, 653–679. [Google Scholar] [CrossRef]
- Friedlingstein, P.; O'Sullivan, M.; Jones, M.W.; Andrew, R.M.; Gregor, L.; Hauck, J.; Le Quéré, C.; Luijkx, I. T.; Olsen, A.; Peters, G. P.; Peters, W.; Pongratz, J.; Schwingshackl, C.; Sitch, S.; Canadell, J. G.; Ciais, P.; Jackson, R. B.; Alin, S. R.; Alkama, R.; Arneth, A.; Arora, V. K.; Bates, N. R.; Becker, M.; Bellouin, N.; Bittig, H. C.; Bopp, L.; Chevallier, F.; Chini, L. P.; Cronin, M.; Evans, W.; Falk, S.; Feely, R. A.; Gasser, T.; Gehlen, M.; Gkritzalis, T.; Gloege, L.; Grassi, G.; Gruber, N.; Gürses, Ö.; Harris, I.; Hefner, M.; Houghton, R. A.; Hurtt, G. C.; Iida, Y.; Ilyina, T.; Jain, A. K.; Jersild, A.; Kadono, K.; Kato, E.; Kennedy, D.; Klein Goldewijk, K.; Knauer, J.; Korsbakken, J. I.; Landschützer, P.; Lefèvre, N.; Lindsay, K.; Liu, J.; Liu, Z.; Marland, G.; Mayot, N.; McGrath, M. J.; Metzl, N.; Monacci, N. M.; Munro, D. R.; Nakaoka, S.-I.; Niwa, Y.; O'Brien, K.; Ono, T.; Palmer, P. I.; Pan, N.; Pierrot, D.; Pocock, K.; Poulter, B.; Resplandy, L.; Robertson, E.; Rödenbeck, C.; Rodriguez, C.; Rosan, T. M.; Schwinger, J.; Séférian, R.; Shutler, J. D.; Skjelvan, I.; Steinhoff, T.; Sun, Q.; Sutton, A. J.; Sweeney, C.; Takao, S.; Tanhua, T.; Tans, P. P.; Tian, X.; Tian, H.; Tilbrook, B.; Tsujino, H.; Tubiello, F.; van der Werf, G. R.; Walker, A. P.; Wanninkhof, R.; Whitehead, C.; Willstrand Wranne, A.; Wright, R.; Yuan, W.; Yue, C.; Yue, X.; Zaehle, S.; Zeng, J.; Zheng, B. Global Carbon Budget 2022. Earth Syst. Sci. Data 2022, 14, 4811–4900. [Google Scholar] [CrossRef]
- Byrne, B.; Baker, D.F.; Basu, S.; Bertolacci, M.; Bowman, K.W.; et al. National CO2 budgets (2015–2020) inferred from atmospheric CO2 observations in support of the global stocktake. Earth Syst. Sci. Data 2023, 15, 963–1004. [Google Scholar] [CrossRef]
- Fedorov, Yu.A.; Tambieva, N.S.; Garkusha, D.N.; Khoroshevskaya, V.O. Methane in aquatic ecosystems. Rostizdat: Rostov-on-Don, Moscow, Russia, 2005.
- Shvidenko, A.Z.; Schepaschenko, D.G. Carbon budget of Russian forests (in Russian). Sib. Lesn. Zhurnal 2014, 1, 69–92. Available online: https://www.elibrary.ru/item.asp?id=21920294 (accessed on 19 February 2024).
- Zamolodchikov, D.G.; Grabowsky, V.I.; Chestnykh, O.V. Dynamic pattern of carbon balance in the forests of federal districts of the Russian Federation. For. Sci. Issues 2019, 2, S2–1. [Google Scholar] [CrossRef]
- Karelin, D.V.; Goriachkin, S.V.; Zamolodchikov, D.G.; Dolgikh, A.V.; Zazovskaya, E.P.; Shishkov, V.A.; Pochikalov, A.V.; Sirin, A.A.; Suvorov, G.G.; Kraev, G.N. The influence of local anthropogenic factors on soil emission of biogenic greenhouse gases in cryogenic ecosystems. Zhurnal Obs. Biol. 2016, 77, 3–167. [Google Scholar]
- Sirin, А.А.; Medvedeva, M.A.; Itkin, V.Y. Rewetting of Disused Drained Peatlands and Reduction of Greenhouse Gas Emissions. Izv. Ross. Akad. Nauk. Seriâ Geogr. 2023, 87, 597–618. [Google Scholar] [CrossRef]
- Kudeyarov, V.N.; Zavarzin, G.A.; Blagodatsky, S.A.; Borisov, A.V.; Voronin, P.Yu.; Demkin, V.A.; Demkina, T.S.; Evdokimov, I.V.; Zamolodchikov, D.G.; Karelin, D.V.; Komarov, A.S.; Kurganova, I.N.; Larionova, A.A.; Lopes de Gerenyu, V.O.; Utkin, A.I.; Chertov, O.G. Carbon flows and pools in terrestrial ecosystems of Russia (in Russian); G.A. Zavarzin, Ed.; Nauka: Moscow, Russia, 2007. [Google Scholar]
- Kudeyarov, V.N. Carbon balance of terrestrial ecosystems in Russia. For the 25th anniversary of the adoption of the UN Framework Convention on Climate Change [Uglerodnyy balans nazemnykh ekosistem na territorii Rossii. K 25-letiyu prinyatiya ramochnoy Konventsii OON ob izmenenii klimata]. Vestn. Ross. Akad. Nauk 2018, 88, 179–183. [Google Scholar] [CrossRef]
- Bondur, V.G.; Mokhov, I.I.; Macosko, A.A. (Eds.) Methane and climate change: scientific problems and technological aspects. Russian Academy of Sciences: Moscow, Russia, 2022; 388 p.
- Romanovskaya, A.A.; Nakhutin, A.I.; Ginzburg, V.A.; Grabar, V.A.; Imshennik, E.V.; Korotkov, V.N.; Bakurova, E.U.; Vertyankina, V.Yu.; Grigurina, T.V.; Govor, I.L.; Isaeva, A.V.; Litvinchuk, G.G.; Lytov, V.M.; Polumieva, P.D.; Popov, N.V.; Sorokina, D.D.; Trunov, A.A.; Prokhorova, L.A. National Report on the Cadastre of Anthropogenic Emissions from Sources and Absorptions by Sinks of Greenhouse Gases of Russian Federation Not Regulated by Montreal Protocol for 1990-2021 (in Russian); Yu.A. Izrael Institute of Global Climate and Ecology of the Federal Service for Hydrometeorology and Environmental Monitoring: Moscow, Russia, 2023; Available online: https://unfccc.int/documents/631719 (accessed on 19 February 2024).
- Information on the availability and distribution of land. Available online: https://rosreestr.gov.ru/activity/gosudarstvennoe-upravlenie-v-sfere-ispolzovaniya-i-okhrany-zemel/gosudarstvennyy-monitoring-zemel/sostoyanie-zemel-rossii/gosudarstvennyy-natsionalnyy-doklad-o-sostoyanii-i-ispolzovanii-zemel-v-rossiyskoy-federatsii/ (accessed on 19 February 2024).
- Romanovskaya, A.A.; Nakhutin, A.I.; Gitarskii, M.L.; Ginzburg, V.A.; Vertyankina, V.Yu.; Govor, I.L.; Grabar, V.A.; Imshennik, E.V.; Karaban’, R.T.; Korotkov, V.N.; Lytov, V.M.; Polumieva, P.D.; Trunov, A.A.; Uvarova, N.E.; Prokhorova, L.A. National Report on the Cadastre of Anthropogenic Emissions from Sources and Absorptions by Sinks of Greenhouse Gases of Russian Federation Not Regulated by Montreal Protocol for 1990–2016 (in Russian); Yu.A. Izrael Institute of Global Climate and Ecology of the Federal Service for Hydrometeorology and Environmental Monitoring: Moscow, Russia, 2018; p. 470. Available online: https://unfccc.int/documents/65719 (accessed on 19 February 2024).
- Vompersky, S.E.; Sirin, A. A.; Sal'nikov, A.A.; Tsyganova, O.P.; Valyaeva, N.A. Estimation of forest cover extent over peatlands and paludified shallow-peat lands in Russia. Contemp. Probl. Ecol. 2011, 4, 734–741. [Google Scholar] [CrossRef]
- Sirin, A.A. Types of swamps M 1:30,000,000 (a map). In Ecological atlas of Russia. Feoriya LLC: Moscow, Russia, 2017, p. 120.
- Zamolodchikov, D.G.; Karelin, D.V.; Ivaschenko, A.I.; Lopes de Gerenyu, V.O. Micrometeorological assessment of biogenic fluxes of carbon dioxide in typical tundra ecosystems of eastern Chukotka. Eurasian Soil Sci. 2005, 38, 759–763. [Google Scholar]
- Karelin, D.V.; Zamolodchikov, D.G. Carbon exchange in cryogenic ecosystems (in Russian); Nauka: Moscow, Russia, 2008; p. 344. [Google Scholar]
- Karelin, D.V.; Zamolodchikov, D.G.; Zukert, N.V.; Chestnykh, O.V.; Pochikalov, A.V.; Krayev, G.N. Interannual changes in par and soil moisture during the warm season may be more important for directing of annual carbon balance in tundra than temperature fluctuations (in Russian). Zhurnal Obs. Biol. 2013, 74, 1–3. [Google Scholar] [CrossRef]
- Zamolodchikov, D.G.; Grabovskii, V.I.; Kraev, G.N. A twenty-year retrospective on the forest carbon dynamics in Russia. Contemp. Probl. Ecol. 2011, 4, 706–715. [Google Scholar] [CrossRef]
- Zamolodchikov, D.G.; Grabovskii, V.I.; Gitarskii, M.L.; Blinov, V.G.; Dmitriev, V.V.; Kurz, W.A.; Korovin, G.N. Carbon budget of managed forests in the Russian Federation in 1990-2050: Post-evaluation and forecasting. Russ. Meteorol. Hydrol. 2013, 38, 701–714. [Google Scholar] [CrossRef]
- Zamolodchikov, D.G.; Chestnykh, O.V.; Grabovsky, V.I.; Shulyak, P.P. The impacts of fires and clear-cuts on the carbon balance of Russian forests. Contemp. Probl. Ecol. 2013, 6, 714–726. [Google Scholar] [CrossRef]
- Kurganova, I.; Lopes de Gerenyu, V.; Kuzyakov, Y. Large-scale carbon sequestration in post-agrogenic ecosystems in Russia and Kazakhstan. Catena 2015, 133, 461–466. [Google Scholar] [CrossRef]
- Golubyatnikov, L.L.; Kurganova, I.N.; Lopes de Gerenyu, V.O. Estimation of Carbon Balance in Steppe Ecosystems of Russia. Izv. Atmos. Ocean. Phys. 2023, 59, 63–77. [Google Scholar] [CrossRef]
- Romanovskaya, A.A.; Karaban’, R.T. Regional features of soil carbon balance on pastures and hayfields in Russia (in Russian). [Regional'nyye osobennosti balansa ugleroda pochv na kormovykh ugod'yakh Rossii]. Izv. Ross. Akad. Nauk. Seriya Geogr. 2008, 4, 96–104. [Google Scholar]
- The Intergovernmental Panel on Climate Change (IPCC). 2013 Supplement to the 2006 IPCC Guidelines for National Greenhouse Gas Inventories: Wetlands; IPCC, Switzerland. 2014. Available online: https://www.ipcc-nggip.iges.or.jp/public/wetlands/index.html (accessed on 19 February 2024).
- The Intergovernmental Panel on Climate Change (IPCC). 2019 Refinement to the 2006 IPCC Guidelines for National Greenhouse Gas Inventories. Volume 4 Agriculture, Forestry and Other Land Use. Chapter 7: Wetlands. 2019. Available online: https://www.ipcc-nggip.iges.or.jp/public/2019rf/index.html (accessed on 19 February 2024).
- Specialized arrays for climate research. Available online: http://aisori.meteo.ru/climater (accessed on 23 February 2024).
- Filipchuk, A.N.; Malysheva, N.V.; Zolina, T.A.; Fedorov, S.V.; Berdov, A.M.; Kositsyn, V.N.; Yugov, A.N.; Kinigopulo, P.S. Analytical review of the quantitative and qualitative characteristics of forests in the Russian Federation: results of the first cycle of the State Forest Inventory (in Russian). Lesokhozyaystvennaya informatsiya 2022, 1, 5–34. [Google Scholar] [CrossRef]
- Bartalev, S.A.; Stytsenko, F.V. An assessment of the forest stands destruction by fires based on the remote sensing data on a seasonal distribution of burnt areas. Lesovedenie 2021, 2, 115–122. [Google Scholar] [CrossRef]
- Bartalev, S.A.; Lukina, N.V. New methodology for space-based carbon monitoring in Russian forests. Zemlya I Vselennaya 2023, 5, 44–58. [Google Scholar] [CrossRef]
- Information and analytical system "Carbon-E". Available online: http://carbon.geosmis.ru/ (accessed on 19 February 2024).
- Shvidenko, A.Z.; Schepaschenko, D.G.; Nilsson, S.; Buluy, Y.I. Tables and Models of Growth and Productivity of Forests of Major Forest Forming Species of Northern Eurasia. Standard and Reference Materials, 2nd ed.; Federal Agency of Forest Management: Moscow, Russia, 2008. [Google Scholar]
- Shvidenko, A.; Mukhortova, L.; Kapitsa, E.; Kiaxner, F.; See, L.; Pyzhev, A.; Gordeev, R.; Fedorov, S.; Korotkov, V.; Bartalev, S.; et al. A Modelling System for Dead Wood Assessment in the Forests of Northern Eurasia. Forests 2023, 14, 45. [Google Scholar] [CrossRef]
- Schepaschenko, D.; Moltchanova, E.; Shvidenko, A.; Blyshchyk, V.; Dmitriev, E.; Martynenko, O.; See, L.; Kraxner, F. Improved Estimates of Biomass Expansion Factors for Russian Forests. Forests 2018, 9, 312–1. [Google Scholar] [CrossRef]
- The Intergovernmental Panel on Climate Change (IPCC). 2006 IPCC Guidelines for National Greenhouse Gas Inventories; IGES: Hayama, Japan, 2006; Available online: https://www.ipcc-nggip.iges.or.jp/public/2006gl/ (accessed on 23 February 2024).
- Anuchin, N.P. Sortimentnyye i tovarnyye tablitsy, 7-th ed. Lesnaya promyshlennost': Moscow, Russia, 1981. 536 p.
- Rosstat – official statistics. Available online: https://rosstat.gov.ru/folder/10705 (accessed on 23 February 2024).
- Distribution of the agricultural land fund of the RSFSR by soil groups, Ministry of Agriculture of the RSFSR, Russian Agricultural Chemistry, Main Directorate of Land Use and Land Management, All-Russian Scientific Research Institute and Design and Technological Institute of Agricultural Chemicalization: Moscow, Russia, 1980; 107.
- Romanovskaya, A.A. Fundamentals of monitoring anthropogenic emissions and sinks of greenhouse gases (CO2, N2O, СН4) in livestock farming, agricultural land use and land use change in. Russia. Dissertation, for the degree of Doctor of Biological Sciences. Moscow, Russia, 2008. Available online: https://www.dissercat.com/content/osnovy-monitoringa-antropogennykh-emissii-i-stokov-parnikovykh-gazov-co2-n2o-ch4-v-zhivotnov (accessed on 19 February 2024).
- The Unified State Register of Soil Resources of Russia has been developed in accordance with the "Concept for the development of state monitoring of agricultural lands and lands used for agriculture as part of lands of other categories, and the formation of state information resources on these lands for the period up to 2020", approved by Decree of the Government of the Russian Federation dated 30.07.2010 No. 1292-R. Available online: https://egrpr.esoil.ru/index.htm (accessed on 19 February 2024).
- Titlyanova, A.A.; Kyrgys, Ch.S.; Sambuu, A.D. The influence of pasture load and weather conditions on the productivity of dry steppes of Tuva. Pochvy I Okruz. Sreda 2020, 3, 2–113. [Google Scholar]
- Schepaschenko, D.; Moltchanova, E.; Fedorov, S.; Karminov, V.; Ontikov, P.; Santoro, M.; See, L.; Kositsyn, V.; Shvidenko, A.; Romanovskaya, A.; Korotkov, V.; Lesiv, M.; Bartalev, S.; Fritz, S.; Shchepashchenko, M.; Kraxner, F. Russian forest sequesters substantially more carbon than previously reported. Sci. Rep. 2021, 11, 12825. [Google Scholar] [CrossRef] [PubMed]
- Romanov, A.A.; Tamarovskaya, A.N.; Gloor, E.; Brienen, R.; Gusev, B.A.; Leonenko, E.V.; Vasiliev, A.S.; Krikunov, E.E. Reassessment of carbon emissions from fires and a new estimate of net carbon uptake in Russian forests in 2001–2021. Sci. Total Environ. 2022, 846, 157322. [Google Scholar] [CrossRef]
- Grassi, G.; Schwingshackl, C.; Gasser, T.; Houghton, R. A.; Sitch, S.; Canadell, J. G.; Cescatti, A.; Ciais, P.; Federici, S.; Friedlingstein, P.; Kurz, W.A.; Sanz Sanchez, M.J.; Abad Viñas, R.; Alkama, R.; Bultan, S.; Ceccherini, G.; Falk, S.; Kato, E.; Kennedy, D.; Knauer, J.; Korosuo, A.; Melo, J.; McGrath, M.J.; Nabel, J.E.M.S.; Poulter, B.; Romanovskaya, A.A.; Rossi, S.; Tian, H.; Walker, A.P.; Yuan, W.; Yue, X.; and Pongratz, J. Harmonising the land-use flux estimates of global models and national inventories for 2000–2020. Earth Syst. Sci. Data 2023, 15, 1093–1114. [Google Scholar] [CrossRef]
- Filipchuk, A.N.; Malysheva, N.V.; Zolina, T.A.; Yugov, A.N. The boreal forest of Russia: opportunities for the effects of climate change mitigation (in Russian). Lesokhozyaystvennaya Informatsiya 2020, 1, 92–113. Available online: http://lhi.vniilm.ru/PDF/2020/1/LHI_2020_01-10-Filipchuk.pdf (accessed on 19 February 2024).
- Zhang, Z.; Poulter, B.; Feldman, A.F.; Ying, Q.; Ciais, P.; Peng, S. Li, X. Recent intensification of wetland methane feedback. Nat. Clim. Change 2023, 13, 430–433. [Google Scholar] [CrossRef]
- Bartalev, S.A. (Space Research Institute of the Russian Academy of Sciences, Moscow, Russia). Personal communication, 2024.
- Voigt, C.; Marushchak, M.E.; Abbott, B.W.; Biasi, C.; Elberling, B.; Siciliano, S. D.; et al. Nitrous oxide emissions from permafrost-affected soils. Nat. Rev. Earth Environ. 2020, 1, 420–434. [Google Scholar] [CrossRef]
- The Intergovernmental Panel on Climate Change (IPCC). IPCC Special Report on the Ocean and Cryosphere in a Changing Climate; Pörtner, H.-O., Roberts, D.C., Masson-Delmotte, V., Zhai, P., Tignor, M., Poloczanska, E., Mintenbeck, K., Alegría, A., Nicolai, M., Okem, A., Petzold, J., Rama, B., Weyer, N.M., Eds.; Cambridge University Press: Cambridge, UK; Cambridge University Press: New York, NY, USA, 2019; pp. 447–587. [Google Scholar] [CrossRef]
- Liu, Z.; Kimball, J.S.; Ballantyne, A.P. Respiratory loss during late-growing season determines the net carbon dioxide sink in northern permafrost regions. Nat. Commun. 2022, 13, 5626. [Google Scholar] [CrossRef] [PubMed]
- Ciais, P.; Canadell, J.G.; Luyssaer, S.; еt, al. Can we reconcile atmospheric estimates of Northern terrestrial carbon sink with land-based accounting? Curr. Opin. Environ. Sustain. 2010, 2, 225–230. [Google Scholar] [CrossRef]
- Dolman, A.J.; Shvidenko, A.; Schepaschenko, D.; Ciais, P.; Tchebakova, N.; Chen, T.; van der Molen, M.K.; Belelli, M.L.; Maximov, T.C.; Maksyutov, S.; Schulze, E.-D. An estimate of the terrestrial carbon budget of Russia using inventory-based, eddy covariance and inversion method. Biogeosciences 2012, 9, 5323–5340. [Google Scholar] [CrossRef]
- Deng, Z.; Ciais, P.; Tzompa-Sosa, Z.A.; Saunois, M.; Chevallier, F.; Tan, C.; Sun, T.; Ke, P.; Cui, Y.; Liu, Z. Comparing national greenhouse gas budgets reported in UNFCCC inventories against atmospheric inversions. Earth Syst. Sci. Data 2022, 14, 1639–1675. [Google Scholar] [CrossRef]
- Denisov, S.N.; Eliseev, A.V.; Mokhov, I.I. Contribution of Natural and Anthropogenic Emissions of CO2 and CH4 to the Atmosphere from the Territory of Russia to Global Climate Changes in the Twenty-first Century. Dokl. Earth Sc. 2019, 488, 1066–1071. [Google Scholar] [CrossRef]
- Saunois, M.; Stavert, A.R.; Poulter, B.; Bousquet, P.; Canadell, J.G.; Jackson, R.B.; Raymond, P.A.; Dlugokencky, E.J.; Houweling, S.; Patra, P.K.; Ciais, P.; Arora, V.K.; Bastviken, D.; Bergamaschi, P.; Blake, D.R.; Brailsford, G.; Bruhwiler, L.; Carlson, K.M.; Carrol, M.; … Zhuang, Q. Supplemental data of the Global Carbon Project Methane Budget 2019 (Version 2.0) [Data set]. Glob. Carbon Proj. [CrossRef]
- The Intergovernmental Panel on Climate Change (IPCC). Summary for Policymakers. In: Climate Change 2023: Synthesis Report. Contribution of Working Groups I, II and III to the Sixth Assessment Report of the Intergovernmental Panel on Climate Change; Core Writing Team; Lee, H.; Romero, J., Eds.; IPCC: Geneva, Switzerland, pp. 1-34. [CrossRef]
- Tian, H.; Yang, J.; Lu, C.; Xu, R.; Canadell, J.G.; Jackson, R.B.; Arneth, A.; Chang, J.; Chen, G.; Ciais, P.; Gerber, S.; Ito, A.; Huang, Y.; Joos, F.; Lienert, S.; Messina, P.; Olin, S.; Pan, S.; Peng, C.; Saikawa, E.; Thompson, R.L.; Vuichard, N.; Winiwarter, W.; Zaehle, S.; Zhang, B.; Zhang, K.; Zhu, Q. The Global N2O Model Intercomparison Project. Bull. Am. Meteorol. Soc. 2018, 99, 6–1231. [Google Scholar] [CrossRef]
- Tian, H.; Xu, R.; Canadell, J. G.; Thompson, R. L.; Winiwarter, W.; Suntharalingam, P.; et al. A comprehensive quantification of global nitrous oxide sources and sinks. Nature 2020, 586, 248–256. [Google Scholar] [CrossRef]
- The Intergovernmental Panel on Climate Change (IPCC). Good Practice Guidance for Land Use, Land-Use Change and Forestry; Institute for Global Environmental Strategies: Kanagawa Prefecture, Japan, 2003; Available online: https://www.ipcc-nggip.iges.or.jp/public/gpglulucf/gpglulucf_contents.html (accessed on 19 February 2024).
- The Intergovernmental Panel on Climate Change (IPCC). Report of the IPCC expert meeting on IPCC Guidance on estimating emissions and removals from land uses such as agriculture and forestry, 13-15 May 2008; Helsinki, Finland. 13 pp. Available online: https://www.ipcc-nggip.iges.or.jp/meeting/pdfiles/0805_HelsinkiMeeting_report.pdf (accessed on 23 February 2024).
- Grassi, G.; Stehfest, E.; Rogelj, J.; Vuuren, D.; Cescatti, A.; House, J.; Nabuurs, G.-J.; Rossi, S.; et al. Critical adjustment of land mitigation pathways for assessing countries’ climate progress. Nat. Clim. Change 2021, 11, 425–434. [Google Scholar] [CrossRef]
Figure 1.
Net GHG fluxes from ecosystems by types of gases and by Russian territorial subjects, million tons of CO2-eq. per year (negative values are absorption, positive values are emissions) (according to [1]: (a) CO2; (b) СН4; (c) N2O; (d) all GHGs.
Figure 1.
Net GHG fluxes from ecosystems by types of gases and by Russian territorial subjects, million tons of CO2-eq. per year (negative values are absorption, positive values are emissions) (according to [1]: (a) CO2; (b) СН4; (c) N2O; (d) all GHGs.
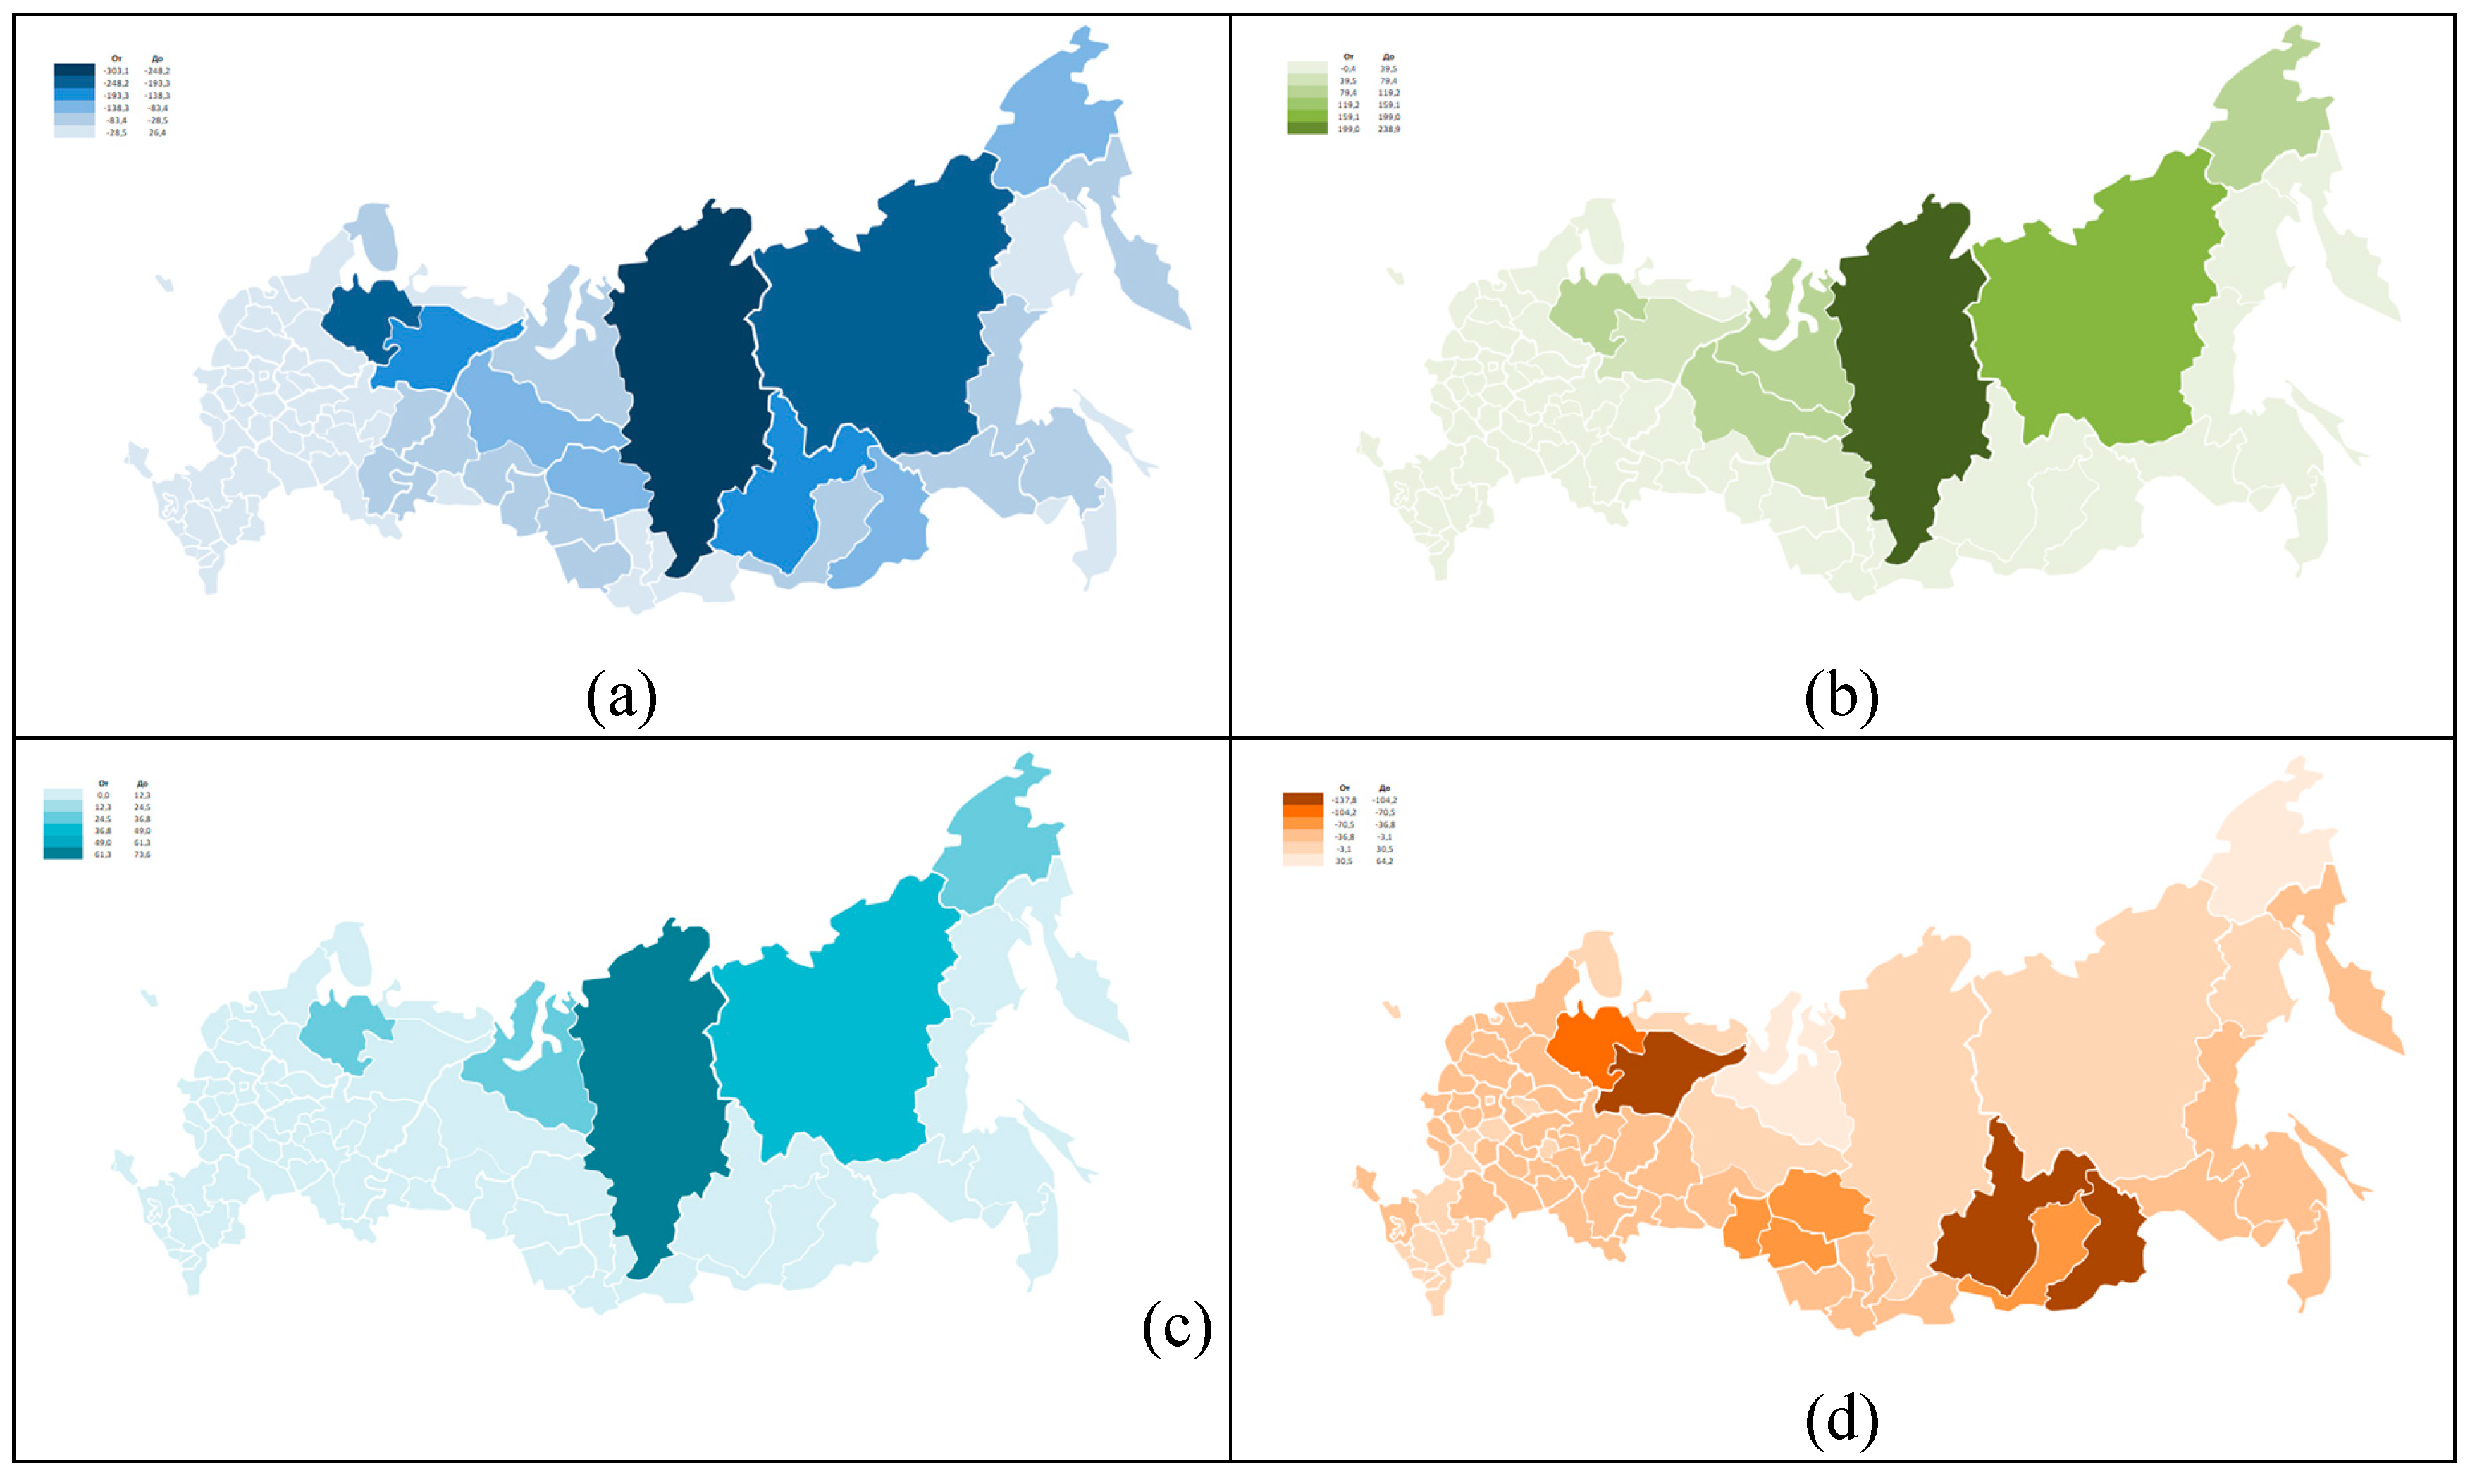
Figure 2.
GHG fluxes by types of gases and types of natural ecosystems in Russia, million tonnes of CO2-eq. per year (negative values are absorption, positive values are emissions) (tundra, wetlands and freshwater ecosystems are presented according to [1]; forests and grasslands are presented according to this study). The figure shows the error bars of GHG balance values for each ecosystem type.
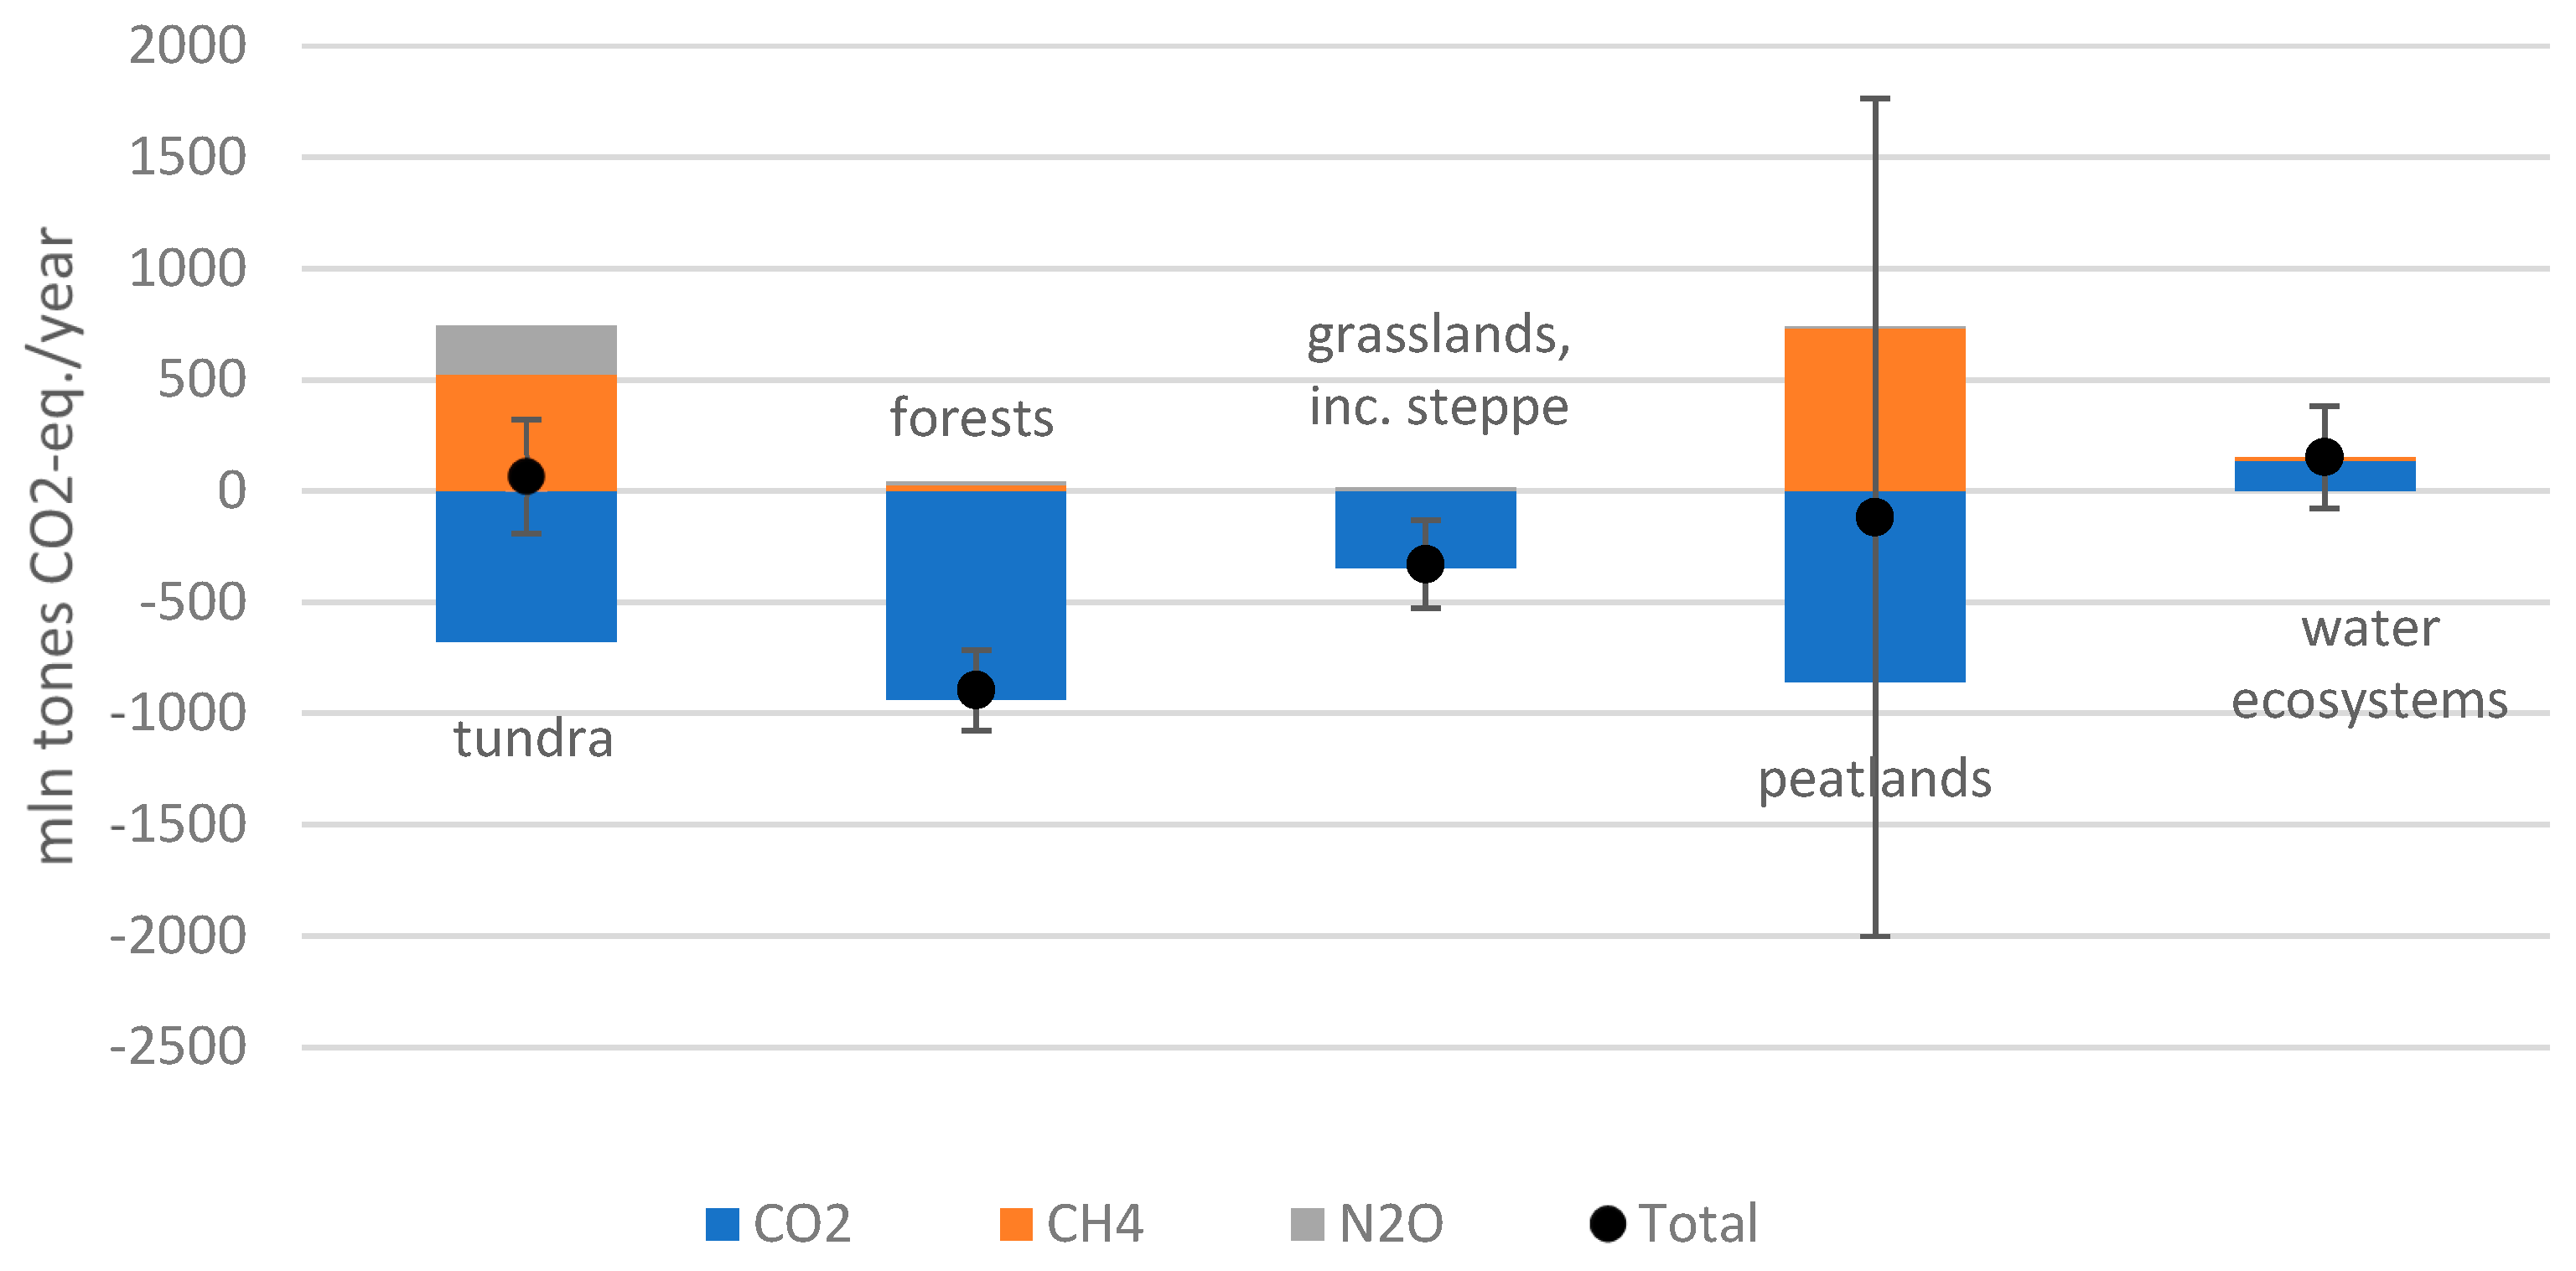
Figure 3.
Net GHG uptake on the territory of natural ecosystems of Russia, billion tonnes of CO2-eq. per year (negative values are absorption, positive values are emissions).
Figure 3.
Net GHG uptake on the territory of natural ecosystems of Russia, billion tonnes of CO2-eq. per year (negative values are absorption, positive values are emissions).
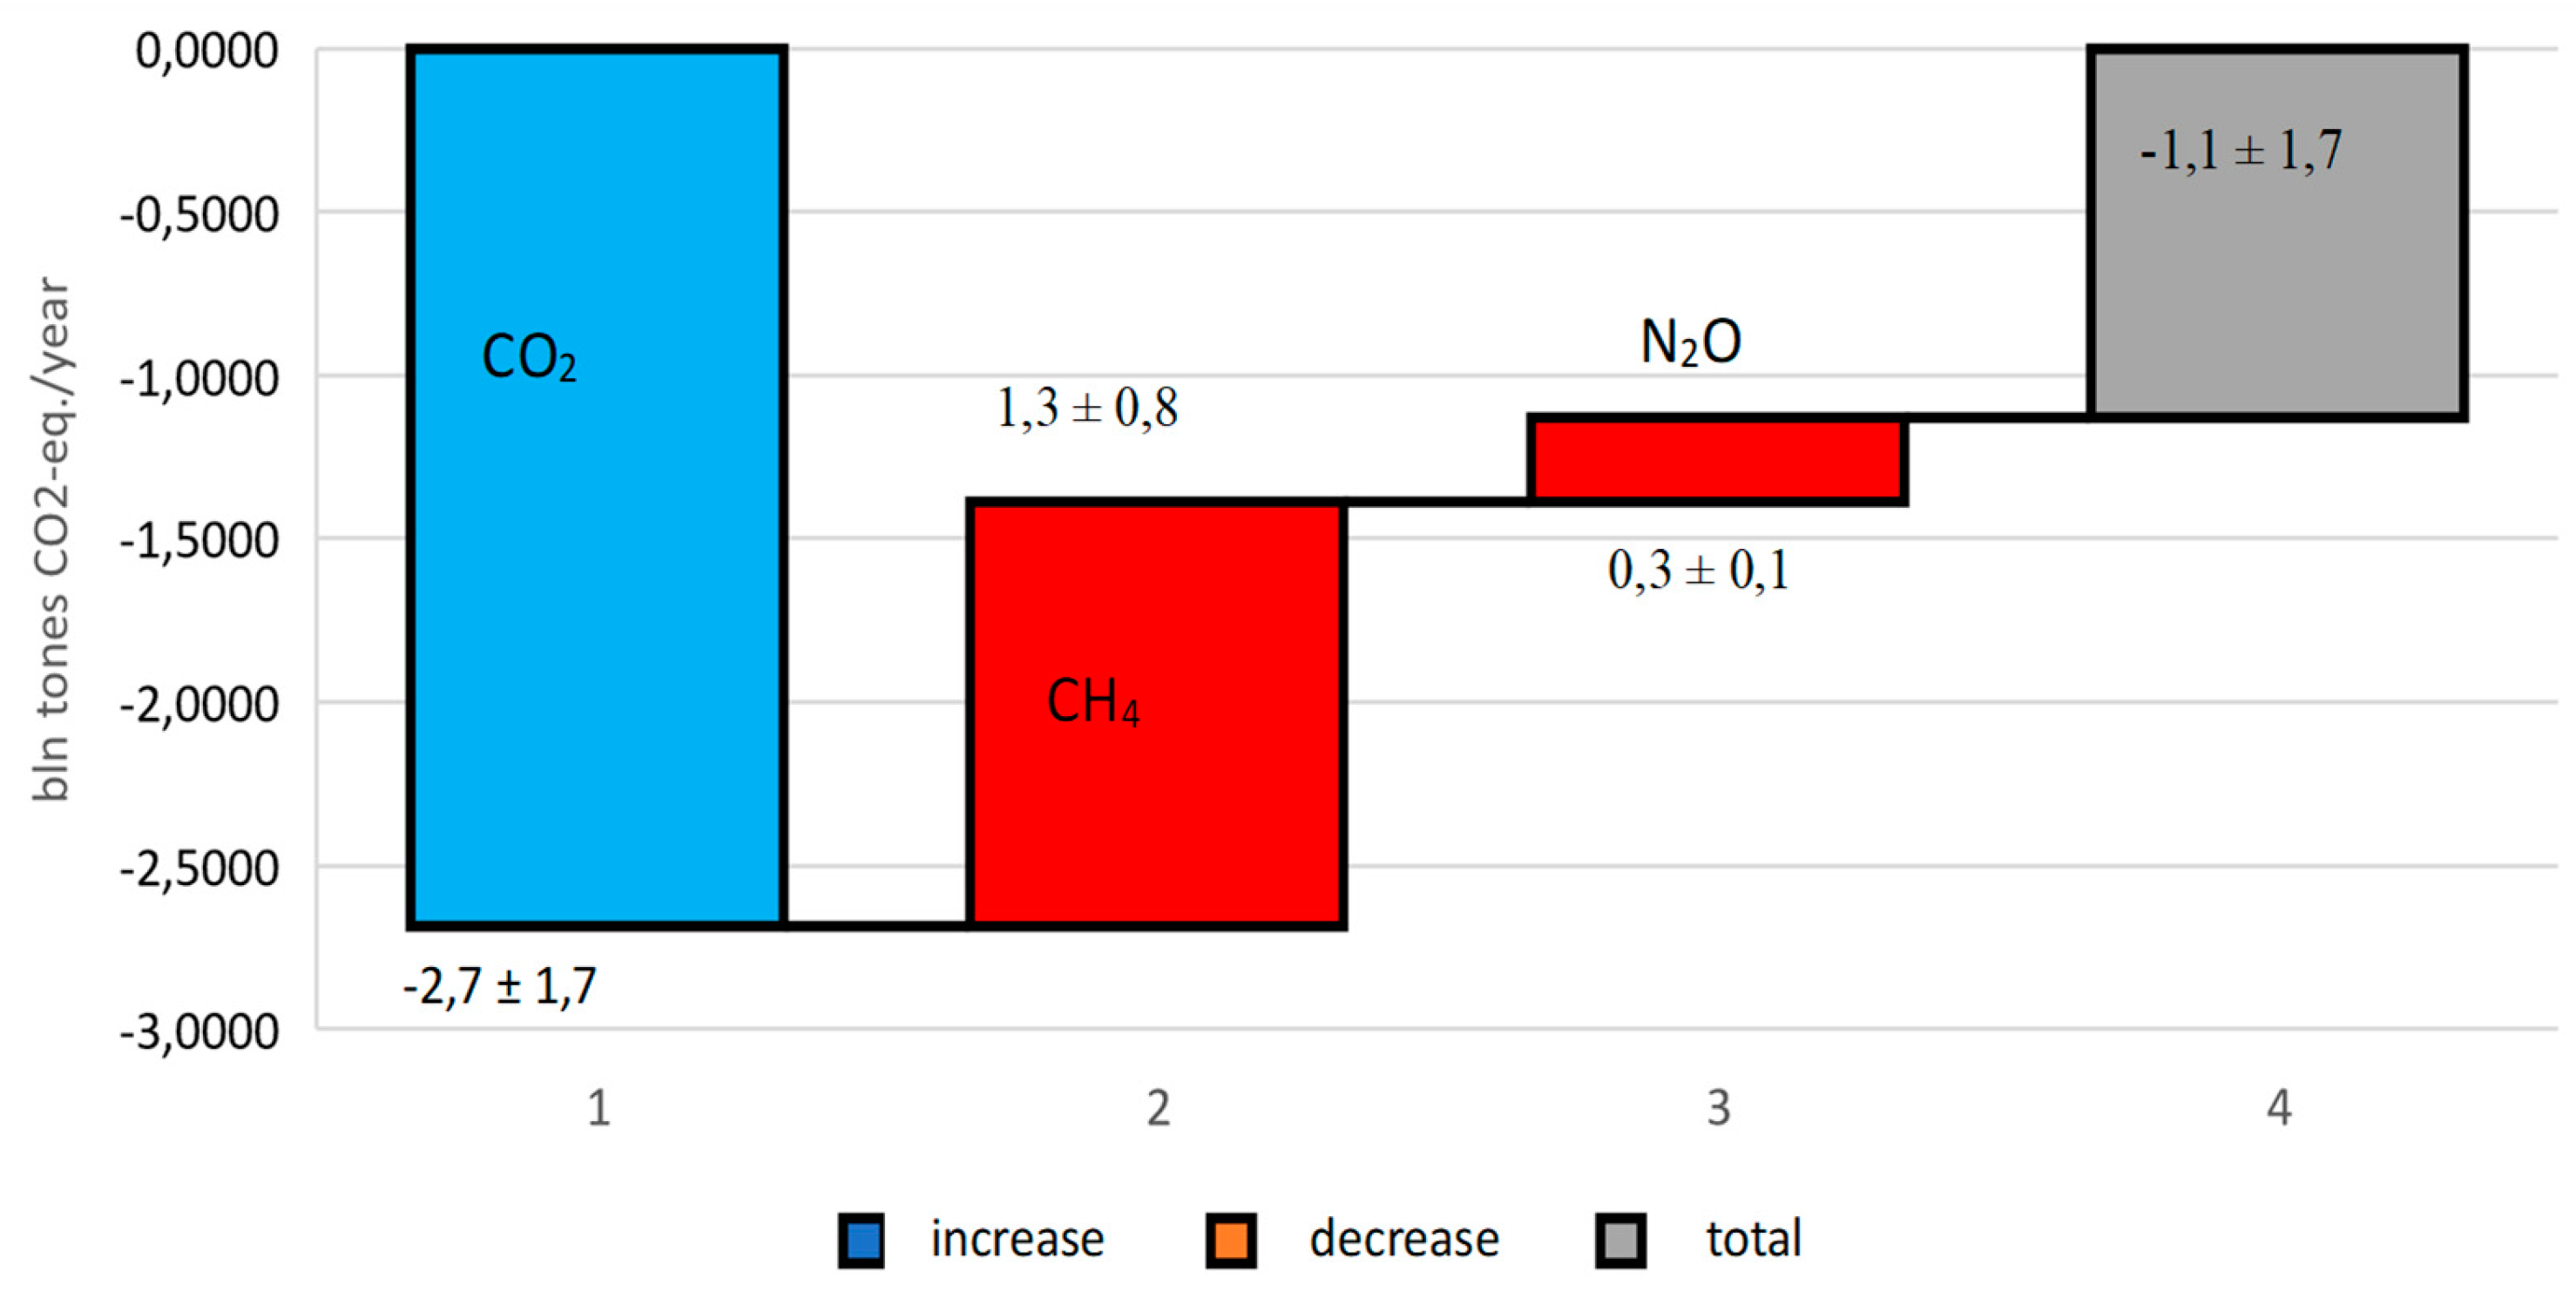
Figure 4.
GHG balance (including F-containing gases) on the territory of Russia for 2016, million tonnes of CO2-eq. per year: negative values (in blue) are net absorption; positive values (in red) are emissions; in green is the final GHG balance on the territory of Russia taking into account natural and anthropogenic fluxes.

Table 1.
Land area in 2016 according to national reporting data used by [1] and in this study, million hectares.
Table 1.
Land area in 2016 according to national reporting data used by [1] and in this study, million hectares.
| Types of land | Inventory [18] | In the study by [1] | In this study |
|---|---|---|---|
| Forest lands | 897.0 | 897.0 | 897.0 |
| out of which: - managed forests |
688.2 |
- |
- |
| - unmanaged forests | 208.8 | - | - |
| Croplands1 | 92.6 | 92.6 | 92.6 |
| Grasslands | 122.0 | 125.1 | 122.0 |
| out of which: - managed grasslands |
100.3 | - | - |
| including deposits | 29.5 (*including secondary steppes) |
- | 14.0 |
| including secondary steppes | * | 32.4 | 16.3 |
| including hayfields and pastures (fodder lands) | 70.8 | 70.8 |
70.8 (including natural steppes 16.8) 21.0 (including natural steppes 5.2) Including total natural steppes 22.0 |
| - unmanaged grasslands | 21.7 | - | |
| including natural steppes | - | 22.0 | |
| Wetlands | 226.8 | 322.8 | 322.8 |
| out of which: - swamps |
157.5 |
253.5 |
253.5 |
| - areas under water | 69.3 | 69.3 | 69.3 |
| Settlements | 14.2 | 14.2 | 14.2 |
| Other lands | 359.9 | 260.8 | 263.9 |
| out of which: - tundra |
- |
258.5 |
258.5 |
| - other lands | - | 2.4 | 5.4 |
| Total lands | 1,712.5 | 1,712.5 | 1,712.5 |
1 including fallow lands and perennial plantations.
Table 3.
GHG balance on the territory of Russia taking into account natural and anthropogenic fluxes by GHG types as of 2016, million tonnes of CO2-eq (emissions "+"/absorption "-")*.
Table 3.
GHG balance on the territory of Russia taking into account natural and anthropogenic fluxes by GHG types as of 2016, million tonnes of CO2-eq (emissions "+"/absorption "-")*.
| GHGs | Natural fluxes | Anthropogenic fluxes according to [16] | GHG balance in the Russian Federation |
|---|---|---|---|
| СО2 | -2,685.9 | 1,633.9 | -1,052.0 |
| СН4 | 1,299.5 | 293.1 | 1,592.6 |
| N2O | 257.3 | 81.4 | 338.7 |
* excluding F-containing GHGs.
Disclaimer/Publisher’s Note: The statements, opinions and data contained in all publications are solely those of the individual author(s) and contributor(s) and not of MDPI and/or the editor(s). MDPI and/or the editor(s) disclaim responsibility for any injury to people or property resulting from any ideas, methods, instructions or products referred to in the content. |
© 2024 by the authors. Licensee MDPI, Basel, Switzerland. This article is an open access article distributed under the terms and conditions of the Creative Commons Attribution (CC BY) license (http://creativecommons.org/licenses/by/4.0/).
Copyright: This open access article is published under a Creative Commons CC BY 4.0 license, which permit the free download, distribution, and reuse, provided that the author and preprint are cited in any reuse.


