Submitted:
24 February 2024
Posted:
27 February 2024
You are already at the latest version
Abstract
Agriculture is an industry that heavily relies on the environment. The increasing frequency of ex-treme disasters attributable to climate change has adversely affected agricultural land and dis-rupted the stability of the supply of agricultural products. Therefore, we implemented a research program focused on current strategies for adapting to agricultural meteorological disasters. The primary goal was to actively promote disaster prevention information and techniques through information platforms and applications and to provide refined forecasting and an early warning system to enhance preparedness for and recovery from agricultural disasters. This initiative can transform passive mitigation into dynamic action by disseminating crucial information to farmers. We integrated meteorological data and crop characteristics to develop disaster prevention strate-gies for the predisaster, during-disaster, and postdisaster stages to empower farmers to implement autonomous disaster prevention, ensuring their profitability and minimizing the impact of disas-ters. This paper presents an agricultural disaster prevention system involving cross-disciplinary collaboration to establish an early warning system for crop disasters. However, the effectiveness of the early warning system relies on the availability of complete meteorological and crop infor-mation, necessitating high-density agricultural meteorological stations, refined weather forecast services, historical crop damage data, and ongoing research and development on disaster preven-tion technology. In the system, a diversified social media interface is used to provide local farmers with weather forecast information. When impending disasters are identified, the platform acti-vates disaster prevention measures to reduce agricultural losses. This article paper introduces Taiwan’s agricultural disaster prevention system as a complete disaster prevention strategy.
Keywords:
weather forecast
; early warning system
; disaster prevention
; crop
; information and communication technology (ICT)
1. Introduction
Climate change notably raises the frequency of extreme weather events, imposing an immediate impact on agricultural production. Taiwan is an island with a subtropical marine climate, and experiences natural disasters in recent decades. Disaster occurrences have been on a steady rise, accompanied by an intensified severity of damage. This has resulted in the deterioration of both the natural environment and infrastructure, endangering agricultural production and indirectly increasing the vulnerability of food security. Considering the anticipated deterioration of agricultural farming in the future, it becomes an urgent and imperative task to establish a comprehensive disaster prevention system. However, the objective of agricultural disaster management is to diminish or avert the potential risk posed by disasters, offer farmers with instant and appropriate disaster prevention, and improve disaster prevention through message coordination and transfer. Agricultural disaster prevention is complex and emphasizes integrity. In particular, it is crucial to improve farmers' ability to autonomously prevent disasters. Therefore, meteorological data collection and analysis, along with weather forecasts, is converted into agricultural disaster information to assist farmers in carrying out disaster prevention. Disaster prevention is a series of information addition and actual disaster prevention operation, and therefore it is necessary to establish a complete agricultural disaster prevention system.
In fact, when a disaster strikes, a comprehensive disaster prevention and notification mechanism should be in place to help mitigate the disaster and reduce the damage. Therefore, the scope and degree of agricultural disasters should be classified according to severity levels, and a disaster early warning system should be established in response to the specific damage caused by agricultural disasters to different crops. Considering the types and intensities of disasters differ region by region and the vulnerabilities of crops to disasters are also different, the construction of the disaster prevention system must be able to respond to different conditions. For instance, Rozaki et al. [1] proposed disaster mitigation strategies for Indonesian farmers, indicating farmers must have their own adaptation methods to tackle disasters, but they also need help from the government or research institutions, such as information systems and educational opportunities, to make good use of various resources to enhance their disaster reduction management.
Disaster management involves pre-disaster risk reduction and post-disaster recovery [2,3]. The former can be accomplished through combining an early warning system with a standard operating procedure (SOP), where the early warning system serves as a cost-efficient strategy to avoid the loss of farmer income [4]. A complete early warning system for crop management should involve the following components: 1. continuous monitoring and real-time updates as farmers must be aware of the potential disaster threats; 2. highly accurate forecasts and information; 3. suitable information delivery approach to ensure prompt dissemination of information; and 4. effective and seamless coordination among information receivers to optimize the early warning system [5]. Accurate weather forecasts before the occurrence of disasters play a key role in the efficiency of disaster prevention efforts. In particular, the actual agricultural disaster prevention operations take longer, such as early harvesting or the construction of disaster prevention facilities. For example, in the case of typhoon invasion, whether it will land and the path of the invasion are related to the disaster-stricken area and the identification of vulnerable crops, but an earlier warning means higher uncertain risks. Therefore, the introduction of disaster probability is very important, which assists farmers in understanding various information to facilitate judgment and implementation of disaster prevention actions.
The core concepts of modern disaster research include hazards, risks, vulnerability and resilience [6], but disaster issues are closely related to the social level, especially farmers [7]. Experts’ scientific knowledge is the basis for improving disaster risk management [8]. Albris et al. [9] analyzed the EU disaster prevention plan and indicated three gaps in the overall promotion of disaster prevention. 1. The epistemological gap: the understanding of different scientific knowledge, especially the differences between the promoters and farmers. 2. The strategy gap: no consensus on the extent to which scientific or expert knowledge should be used in cropping plan. 3. The dissemination gap: expert knowledge needs to be clearly translated to end users. In the face of the continued deterioration of the global climate, disaster reduction strategies have encountered many problems. On the premise of ensuring stable food supply and farmers' income, the construction of disaster prevention and reduction information system is an important task for the agricultural sector to achieve climate resilience. This article mainly introduces the research progress of agricultural disaster prevention in Taiwan. Although disaster forecasting still has scientific limitations and disaster prevention can only aim at "disaster reduction", it is still possible to establish a comprehensive agricultural disaster prevention system through scientific and technological research and development efforts to achieve the goal of smart climate agriculture.
2. Current Situation of Agrometeorological Disasters in Taiwan
Meteorological disasters frequently impede agricultural production in Taiwan, resulting in annual losses ranging from 1 to 27 billion NTD. These setbacks lead to income losses for farmers, disrupting the stable supply of agricultural products, and prompting consumer complaints. Typical agrometeorological disasters in the region consist of drought, typhoons, heavy rain, and cold damage. Thus, Taiwan government launched a research program for agricultural meteorological disasters adaptation strategy to strongly promote disaster prevention information and technology as well as offer fine-scale weather forecasts and an early warning system in support of agricultural disaster preparedness and recovery. Moreover, the initiative could shift from passive mitigation to proactive measures by disseminating information to agricultural practitioners. This study presented an overview of the current state of agricultural disasters in Taiwan, focusing on three key aspects: crop losses caused by agricultural disasters, information and communication technology (ICT) for agricultural disaster prevention, and research and development in disaster prevention technology.
Taiwan, characterized by its rugged mountainous terrain, frequently experiences various meteorological disasters, notably typhoons and heavy rainfall. Figure 1 depicts the crop loss statistics spanning the past three decades (1992-2021). It is observed that typhoons pose the most significant risk to crop production, contributing to approximately 63.6% of the damage. Damage caused by rainfall, including the East Asian rainy season, spring rain, and convectional rain, constitutes 11.7%. Cold damage affects the first season of rice, fruit trees, and tea trees, making up around 8.2% of the damage. The remaining proportion of damage is attributed to hailstones, drought, high temperatures, and foehn wind. Furthermore, fruits are the most vulnerable crops to weather, accounting for 47.9 % of the losses, followed by vegetables (28.0 %) and rice (10.8 %). Crop damage severity is affected by several factors, including the stages of crop growth, the cultivation environment, and the crop's susceptibility to disasters. The crop loss statistics highlight that severe crop losses are greatly influenced by the farming period and region. On the other hand, it can be seen from Figure 1 that Taiwan's disaster damage pattern is changing gradually. In the past, typhoons and heavy rains were the main ones. In recent years, the frequency of droughts has increased significantly, mainly due to the decrease in the number of typhoons that invade Taiwan. Taiwan has an island-type landform, typhoon-induced rainwater accounts for 40% of the total water resources. In addition, when the moisture in the air decreases, different types of pests and diseases increase significantly. It can be seen that the types of disasters interact with each other.
Agricultural disaster prevention is the primary meteorological observation and forecasting service. Taiwan is small in area but has complex terrain. Although there are 700 weather stations distributed over 36,197 square kilometers of land, however, the density of agricultural areas is not high. The establishment of weather stations is the top priority. While meteorological data for forecasting services are available, the crucial challenge lies in establishing the link between meteorological data and crop cultivation management for effective agricultural disaster prevention. In addition, various adaptation strategies for disaster prevention must be accepted and implemented by farmers. This study first divides each disaster event into normal, pre-disaster, during-disaster and post-disaster stages according to the timeline, and next develops corresponding information systems and promotion tools (Figure 2) in consideration of farmers’ actual needs. Various research and development work is carried out to enhance farmers' ability to autonomously prevent disasters. The relevant research and development results are shown and discussed as follows.
Basic Meteorological Infrastructure and Information
Information on weather forecasts and disaster warnings comes from real-time observation data. Regarding the current situation of weather station installations over agricultural production areas in Taiwan, our Ministry of Agriculture and the Central Weather Administration have cooperated to establish the "Agricultural Meteorological Observation Network" in 1986. A total of 17 agricultural meteorological stations have been established. However, after 30 years, the Agricultural Meteorological Observation Network has experienced problems such as outdated instruments and poor quality of observation data. Therefore, the Ministry of Agriculture and the Central Weather Administration once again cooperated to upgrade existing agricultural meteorological stations and establish new meteorological stations in consideration of disaster hotspots or important agricultural production areas. Consequently, there are a total of 176 agricultural meteorological station by 2021, a total of agricultural meteorological station observation data are available for data download by personnel affiliated to the Ministry of Agriculture for agricultural information system development, disaster assessment, and provision of crop cultivation guidance to farmers. This is very helpful for meteorological information push services [10]. In addition to increasing the density of weather stations, the quality of observation data is also very important. We have established a meteorological data verification system. When the data is found unreasonable, the system will immediately notify the operator through communication software to eliminate obstacles or replace sensors. The assurance of data quality is contingent upon the establishment of a comprehensive maintenance mechanism.
There is a huge demand for weather forecasts services, particularly concerning disaster warning and agricultural operations. At present, the Central Weather Administration offers township forecasts with high spatial resolution, where forecasts are set at grid points based on the locations of township and district offices. However, agricultural production areas are often far away from urban areas, and therefore existing forecast points are of limited help to farmers in field management. To tackle this issue, we established fine-scale weather forecast services for important agricultural production areas. Currently, weather forecast services have been furnished for 392 agricultural production areas, with a forecast resolution of approximately 2.5 ×2.5 kilometers. The forecasts extend for a period of 7 days, and the data is updated every 3 hours. The authority has planned to add 30 new forecast points every year in the future. It is expected that every agricultural township and vulnerable crop production areas can access to weather forecast services.
Predisaster Prevention Strategies
The susceptibility to weather differs crop by crop. Beyond the genetic traits of crops, the way weather conditions are perceived in various growth stages plays a crucial role in determining the susceptibility of crops to climatic factors. For instance, rice exhibits remarkable tolerance to temperatures above 35°C in the growth stage; yet, high temperatures in the flowering or grain-filling stages may lead to rice’s sterility or quality degradation [11]. Moreover, elucidating the disaster probability in individual growth stage of crops, coupled with crucial thresholds identified by farmer interviews, simulation experiments, and literature reviews, can serve as a basis for developing disaster warning systems. At the same time, a complete "disaster prevention cultivation calendar" for economically important crops is established, including crop growth stages by "month", possible meteorological disasters, disaster-causing meteorological critical values, disaster prevention suggestions and measures, fertilizers, and pest and disease management. This calendar is more helpful for disaster prevention publicity. Figure 3 shows the established mango disaster prevention cultivation calendar, which includes mango growth stages from January to December of the year, cultivation management suggestions, possible disasters, and critical disaster-causing conditions. At present, the disaster prevention cultivation calendar of 76 economically important crops has been completed. The disaster cultivation calendar has been posted on the Internet for reference by all walks of life. However, some critical disaster conditions are difficult to determine, especially rainfall and wind speed. For crops that currently have no relevant data, heavy rain level (≧80 mm per day) and level 10 wind speed (Beaufort wind force scale) are used as default values, which will be updated with new information.
This program combined crucial thresholds for crops and fine-scale weather forecasts to establish the desired “crop disaster early warning system” (https://disaster.tari.gov.tw) (Figure 4). It can automatically determine the probability of agricultural meteorological disasters, with green, yellow and red lights representing normal, caution and warning levels, respectively. The display method is acceptable to farmers and is conducive to information promotion. Besides, the system provides access to the most recent activity information, instant observational data, weather forecasts tailored for farming sites, updates on disasters, and historical data such as Taiwan’s agricultural disaster rates, agricultural climate patterns, and maps indicating hotspots. It also includes a disaster prevention cultivation calendar, information on twenty-four solar terms, and the achievements of the agricultural disaster prevention program. The abundance of agrometeorological and disaster prevention information aims to assist farmers in reducing disaster-induced crop losses. In addition, we explored a smartphone application system to provide farmers with convenient access to crop disaster information (Figure 4).
During-Disaster Prevention Strategies
When a disaster is approaching, what information services can assist farmers? We explored an “agricultural information service platform for disaster” available at https://eocdss.ncdr.nat.gov.tw/web/MOA to furnish details on the prevailing crop growth status at disaster-prone areas, roadway conditions in agricultural production sites, and the disaster prevention SOP. Once the disaster probability hits a specific threshold, this information will be disseminated to agricultural extension stations, farmers’ associations, and crop cultivation and trade coalitions. Subsequently, the dissemination of disaster information and prevention measures will occur through messaging services, the Internet, and communication channels. Furthermore, during government disaster response meetings, decision-makers can promptly access agricultural disaster information presented by weather and hydrological monitoring maps. When the possibility of disasters increases and farmers need to be reminded to take precautions, the service platform will provide the latest disaster information, including typhoon paths, estimated rainfall, instantaneous maximum wind speed, areas prone to flooding and other information. On the other hand, the service platform will integrate the actual growth conditions of crops in each district, especially crops in the harvesting and flowering stages. Besides, it will provide various disaster prevention suggestions that are integrated into disasters early warning briefings and graphical presentations for reminding farmers to take disaster prevention actions, where suggestions are updated based on real-time disaster information.
Given the diverse impacts of typhoon tracks on different locations, the Central Weather Administration has selected nine typhoon tracks for Taiwan. Moreover, certain areas may not directly face typhoons but are susceptible to heavy rains and strong winds due to the complex terrain in Taiwan. Therefore, each typhoon event is classified based on historical agricultural damage and meteorological data while warning areas associated with each path are divided for early warning purposes. According to the crops in the harvesting or flowering period at warning areas, a database of "crop disaster prevention information map card" is established (Figure 5). Currently, map cards are produced biweekly, targeting disasters such as cold damage in April, heavy rain damage from May to July, southwest airflow from July to November, and nine historical typhoon paths from May to November. The information on map cards includes the estimated risk of agricultural crops being damaged, enabling farmers to quickly browse the crops that require attention during this disaster.
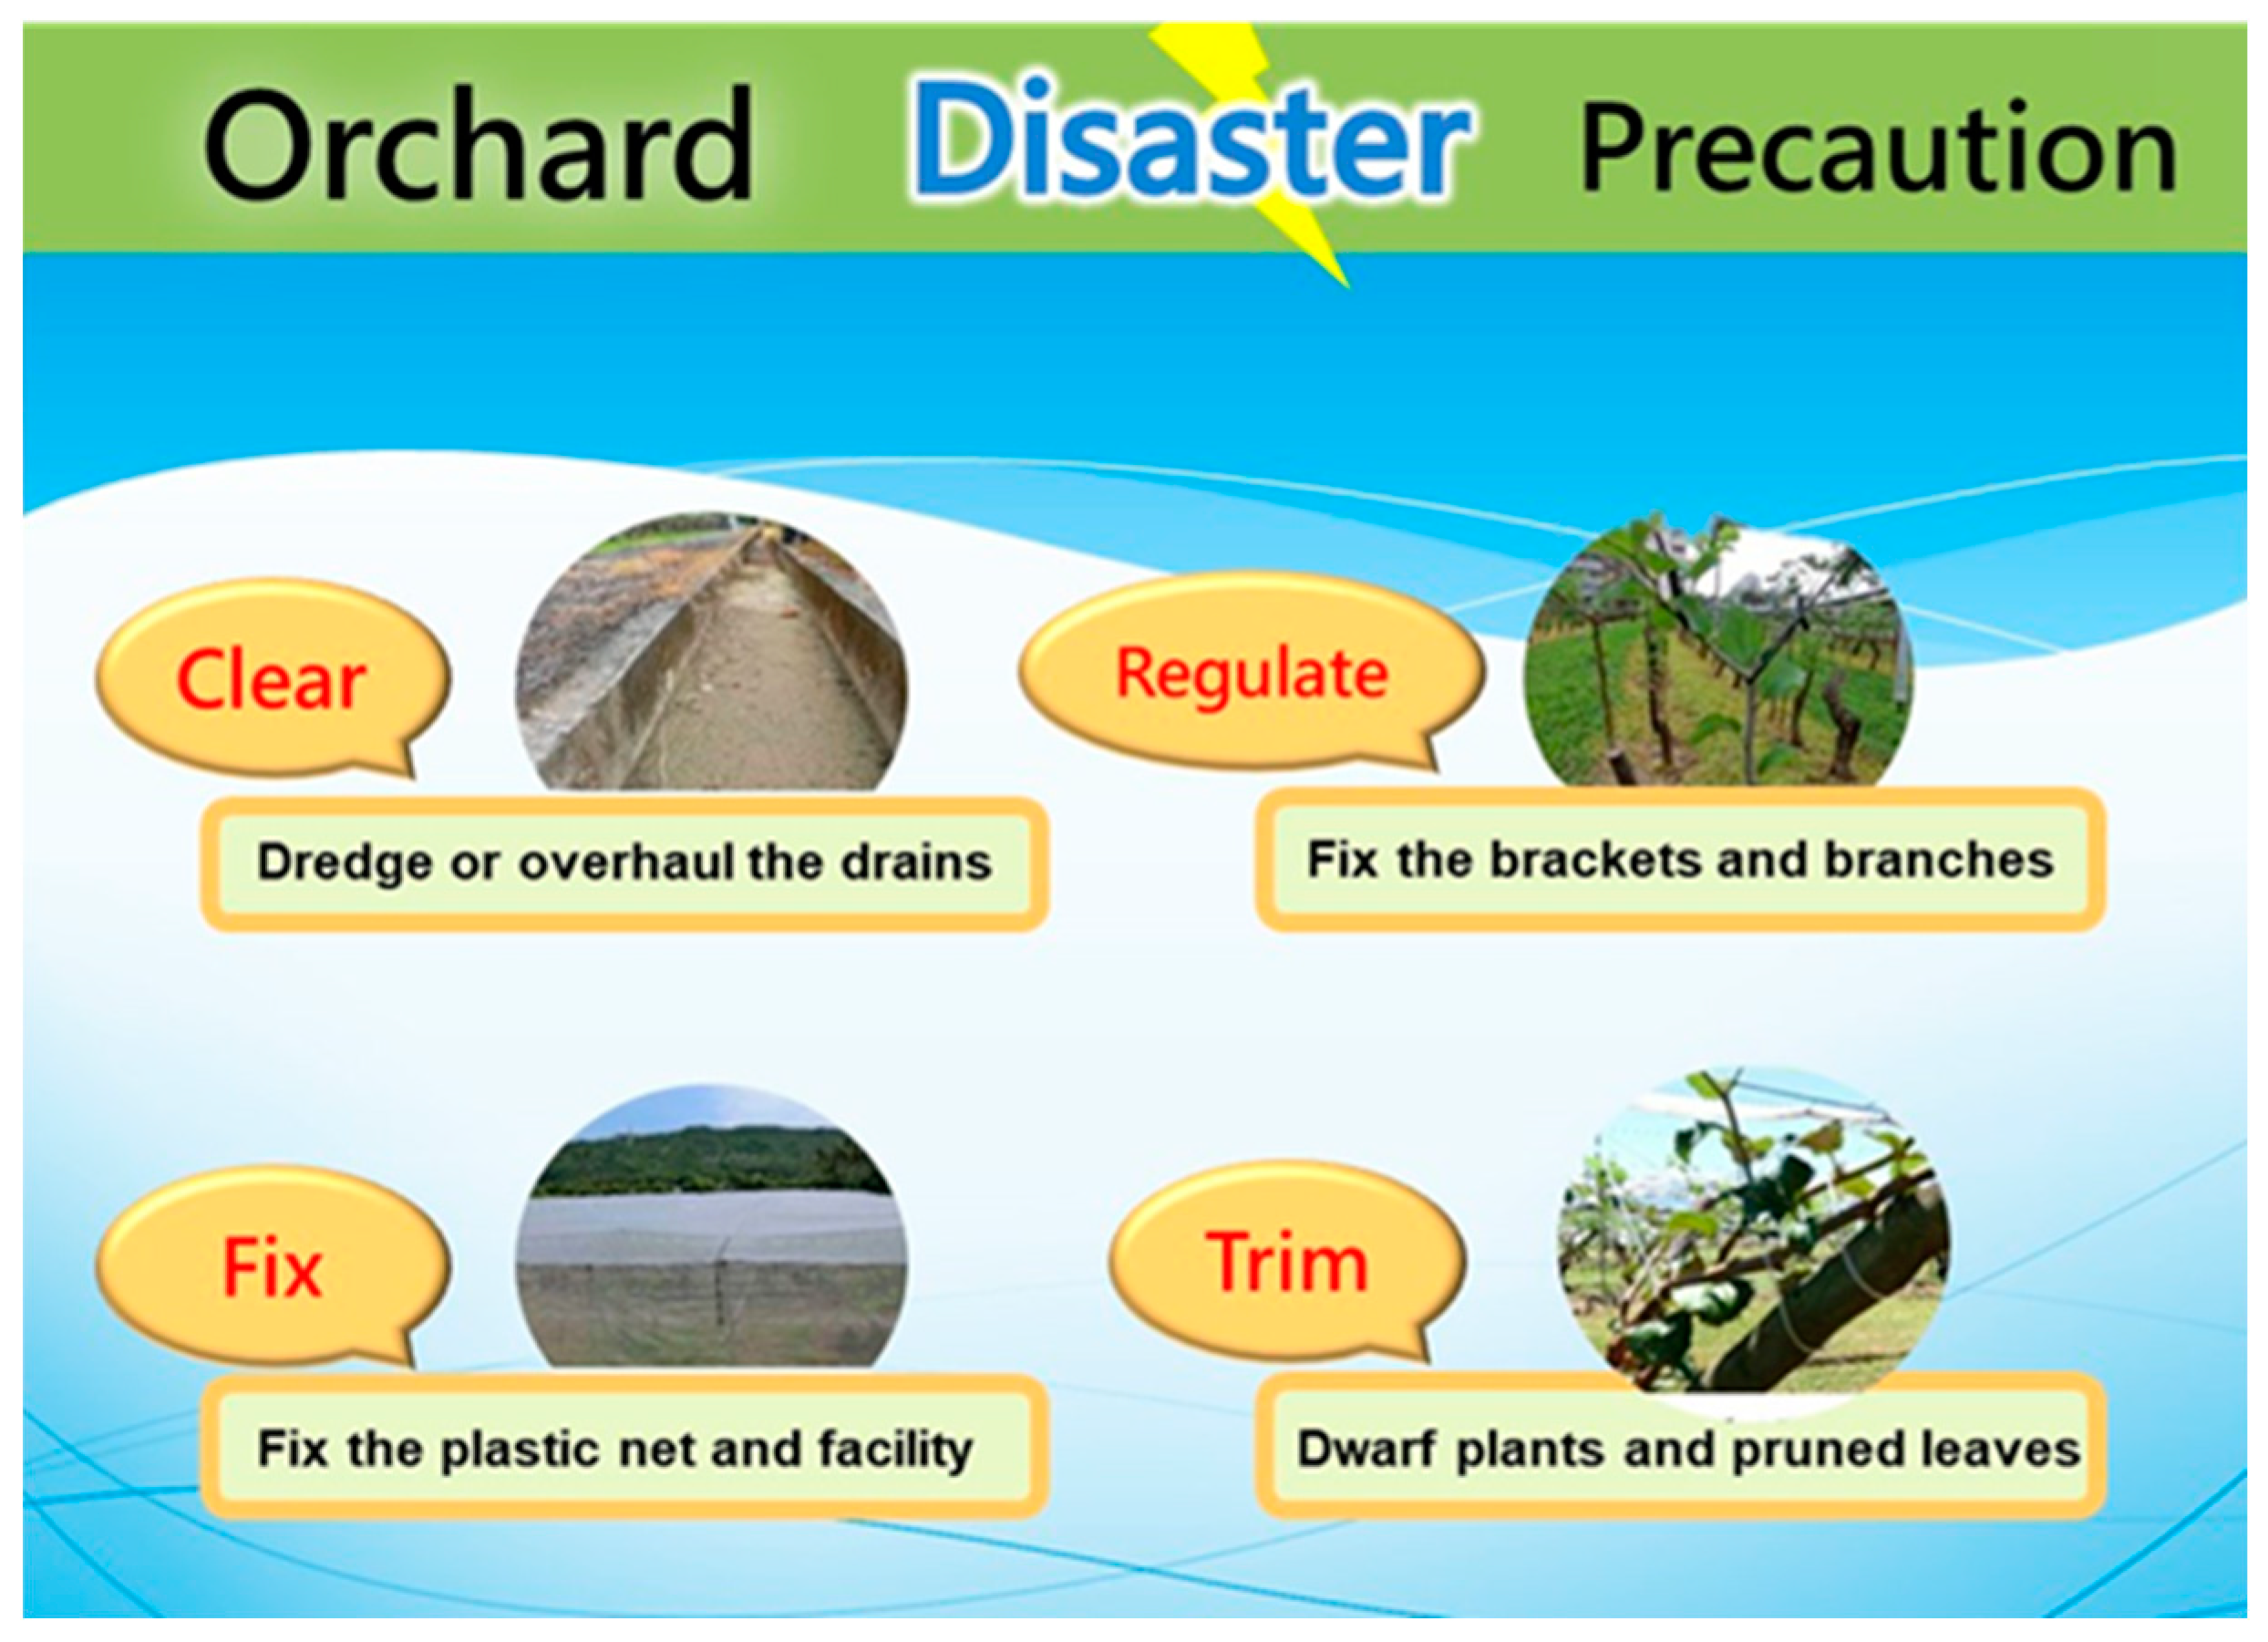
Agricultural information not only identifies crop production areas with a higher risk of disasters and the types of crops that may be affected but also offers disaster prevention (mitigation) suggestions. These suggestions focus on various crops such as rice, grains, fruits, vegetables, flowers and greenhouses while providing prevention and control measures with text and illustrations. The disaster awareness map card tool confirmed by agricultural disaster response procedures and crop experts in each field immediately releases disaster warning information to farmers for carrying out disaster reduction work in the field as soon as possible. For example, when a typhoon approaches, fruit farmers need to dredge or overhaul the drains, fix the brackets or branches, reinforce nets and facilities, manage the height of dwarf fruit plants, and prune leaves (Figure 6). Based on simple photos, farmers can carry out the prevention procedure for reducing losses. The map card is like a checklist for disaster prevention measures, and farmers can confirm and complete the disaster prevention and preparation works.
In response to approaching typhoons, the central disaster response is mostly initiated when a sea warning is issued. Various administrative departments engage in tasks such as inspecting drainage gates, coordinating highway traffic responses, regulating ship entry, and managing class suspension. However, the agricultural warning is initiated three days before the sea warning. The main reason is that agricultural preparedness requires longer time. For example, early harvesting of rice or fruits involves the deployment of harvesting machinery and manpower. However, the earlier the disaster warning, the higher the associated uncertainty. All agricultural operators should understand that it is still difficult to grasp the path of the typhoon invading Taiwan. The closer it is to Taiwan, the more accurate its path and landfall location will be. However, the time of a typhoon invading Taiwan is easier to predict than the path of invading Taiwan, disaster prevention measures can be implemented based on the invasion time. For example, Hualien County is one of the taros producing areas in Taiwan, but it is located in high typhoon prone areas. Farmers often trim taro leaves to prevent strong winds from lifting up the roots. However, trimming taro leaves will delay ripening. Therefore, it is recommended that farmers first evaluate the time required for trimming taro leaves. For example, if it takes one day, they will decide whether to trim leaves to prevent the typhoon based on the forecasted path provided before the Central Weather Administration the day before the predicted typhoon invasion. By familiarizing themselves with disaster uncertainties and response operations procedures, they can reduce the risk of typhoon damage.
Postdisaster Prevention Strategies
Following a disaster, the main responsibilities of the government involve providing emergency relief funds and engaging in rehabilitation efforts. Yet, the government provides relief funds to encourage farmers to resume farming based on the degree of crop damage, but the determination is frequently a subject of controversy. The use of unmanned aerial vehicles (UAVs) for efficiently assessing landscapes, disaster regions, and agricultural damage enhances the creation of an imagery database pre- and post- disasters. This not only helps address controversies but also allows for a more accurate estimation of crop losses. In this study, utilizing high-precision crop image recognition techniques, specifically developed for establishing an SOP and collecting essential information on cultivation and disaster areas, UAVs equipped with the global positioning system (GPS) can capture high-quality images pre- and post-disasters. Subsequently, these images are analyzed with cadastral data and geographic information system (GIS). The present program deployed UAVs to record real-time images, enhancing disaster investigation and rescue operations. For instance, paddy fields damaged by heavy rain during the monsoon season in June were monitored. The UAV images captured in this program offer high ground resolution (3.5 cm) with 3D point clouds. These resources are crucial for image discrimination, aiding in the creation of a digital surface model (DSM) to assess rice lodging [12]. Initially, the maximum likelihood method was applied to performing supervised classification on the images for obtaining rice lodging areas. Subsequently, the Pix4D Mapper Pro (Pix4D) was employed to generate 3D point clouds, facilitating the development of a DSM to classify rice lodging. We achieved an 85% accuracy in discriminating rice lodging through supervised image classification and an 87% accuracy in lodging level classification using the DSM. The results suggest that UAVs are capable of offering real-time images capturing crop damage caused by meteorological disasters, facilitating image recognition on rice lodging levels with satisfactory accuracy (>85%). Future research can employ both UAV and image recognition techniques in targeted crop fields. The outcomes of image classification were superimposed onto the administrative boundaries of rice paddies to create a GIS-based support system for discerning agricultural damage. As a result, the manpower and time needed for detecting and monitoring crop damage were significantly reduced.
3. Disaster Prevention and Avoidance Techniques
Agricultural disaster prevention strategies can be divided into two categories: one is the planning of suitable land and crops, especially crops planted in disaster-prone hotspots, which often encounter disasters but are difficult to prevent, such as areas prone to typhoons. During the harvest period, farmers should be coached to change the farming plan to achieve a disaster avoidance perspective for avoiding the recurrence of disaster losses. In addition, the research and development of disaster prevention and reduction technologies can reduce the risk of disasters through improvements in cultivation and management techniques, utilization of materials or facilities, and adjustment of production periods. Disaster prevention and reduction for crops with large areas but low yield per unit area can be achieved through the selection of suitable varieties and effective fertilizer management. In the case of horticultural crops, mulching can be used to avoid wind and rain damage, pillars can be used to fix the plants, and moderate pruning can be used to reduce damage.
Strategies for disaster prevention and mitigation involve targeting economically important crops, minimizing the risk of crop losses through facility use, adjusting planting times, and conducting suitability assessments. Taking southeastern Taiwan as an example, the region is susceptible to foehn winds, marked by low humidity and high temperatures. This situation may result in the scorching of flowers or immature fruits. Due to the sudden occurrence of this phenomenon, notifications to farmers are frequently dispatched belatedly. In fact, farmers typically employ inexpensive foehn wind sensing devices integrated into their orchard sprinkler systems, traditionally adopted for the purposes of watering and fertilizing. When foehn winds are detected, the sensing device automatically activates the sprinkler system to reduce temperature and increase humidity for preventing damage caused by foehn winds. Another strategy involves using a spoiler fan to mitigate frost damage to tea trees. In addition, farmers often use field irrigation to elevate soil temperature for reducing damage resulted from cold waves. These prevention techniques prioritize low costs, ease of operation, and effectiveness in damage reduction.
In Taiwan, meteorological disasters are predominantly attributed to typhoons. Typhoons bring strong winds and heavy rains, which are extremely destructive. How to reduce the losses caused by strong winds? Windproof nets are a common disaster reduction method used by farmers to prevent summer typhoons or northeast monsoons for reducing lodging or fruit drop caused by strong winds. There have been many studies on the design of windproof nets, selection of material characteristics, wind tunnel experiments, and on-site observation and verification [13,14]. However, in terms of the practical application of wind protection technology, it is imperative to provide farmers with real-time suggestions for erecting wind protection nets through model analysis based on local conditions and weather information. In this study, we set up an assessment procedure to identify the optimal status of windbreak nets using a computational fluid dynamics (CFD) model [15], which serves as a benchmark to protect crops. The findings indicated that CFD simulation can be verified using varying mesh sizes and heights of windbreak nets. Our experiments suggest that the optimal length (height) against wind is 6 (1.3) multiples of the windbreak net’s height. In the actual case of a typhoon, the maximum gust of 18 m/s can be reduced to 4 m/s using the windbreak net with a blocking rate of 70%. The case suggests that wind-proof effect is significant.
4. Conclusion
Although disasters have a considerable impact on crop production, the effectiveness of current strategies for disaster prediction is limited. Because the accuracy of disaster forecasting cannot be quickly improved, the relevant authorities should focus on disseminating disaster information and promoting prevention measures to minimize losses caused by damage. Although some disasters (e.g., hail) are difficult to forecast and prevent, others (e.g., typhoons) have a critical window for prevention, that is, the time from the release of a forecast to that of the typhoon’s landing. During this window, standard operating procedures for disaster prevention can be implemented. Predisaster prevention is the most efficient and cost-effective disaster adaptation strategy. The early warning systems and corresponding disaster prevention mechanisms established by the agricultural meteorological disasters adaptation strategy research program are crucial to effective disaster prevention. In addition, disaster prevention measures, in conjunction with education, training, and workshops for agricultural producers, should be implemented to enhance overall disaster preparedness. Recognizing the varying sensitivities of different crops to disasters, Taiwan has established a disaster prevention calendar for economically important crops. This calendar has served as a valuable reference for crop disaster warning systems, crop loss assessments, agricultural insurance management, and climate change impact assessments. In the future, this disaster prevention technique can be integrated into a system encompassing information on crops, soil, pests, diseases, and cultivation techniques. This will integrate Taiwan’s agricultural production and meteorological resources and enable accurate estimation of variations in climate at the spatial and temporal scales, and it will enable Taiwan to implement efficient cultivation management to reduce the impact of disasters on agricultural production.
Funding
This research was funded by Ministry of Agriculture, Republic of China.
References
- Rozaki, Z.; Wijaya, O.; Rahmawati, N.; Rahayu, L. Farmers’ Disaster Mitigation Strategies in Indonesia. Rev. Agric. Sci. 2021, 9, 178–194. [CrossRef]
- Seneviratne, K.; Baldry, D.; Pathirage, C. Disaster knowledge factors in managing disasters successfully. Int. J. Strateg. Prop. Manag. 2010, 14, 376-390. [CrossRef]
- FAO. The impact of disasters and crises on agriculture and food security: 2021; Food and Agriculture Organization of the United Nations: Rome, Italy, 2021. [CrossRef]
- Dhanya, P.; Geethalakshmi, V. Reviewing the Status of Droughts, Early Warning Systems and Climate Services in South India: Experiences Learned. Climate. 2023, 11, 60. [CrossRef]
- Tembo, G.; Chimai B.; Tembo, N.; Ndiyoi, M. Observations on Zambia’s Crop Monitoring and Early Warning Systems. J. Agric. Sci. 2014, 6, 99-107. [CrossRef]
- Kelman, I. Lost for words amongst disaster risk science vocabulary? Int. J. Disaster Risk Sci. 2018, 9: 281–291. [CrossRef]
- Gotham, K.F. The Social Roots of Risk: Producing Disasters, Promoting Resilience by Kathleen J. Tierney. Am. J. Sociol. 2015, 121, 646–648. [CrossRef]
- Shi, P.; Ye, T.; Wang, Y.; Zhou, T.; Xu, W.; Du, J.; Wang, J.; Li, N.; Huang, C.; Liu, L.; et al. Disaster Risk Science: A Geographical Perspective and a Research Framework. Int. J. Disaster Risk Sci. 2020, 11, 426–440. [CrossRef]
- Albris, K.; Lauta, K.C.; Raju, E. Disaster knowledge gaps: exploring the interface between science and policy for disaster risk reduction in Europe. Int. J. Disaster Risk Sci. 2020, 11, 1–12. [CrossRef]
- Yao, M.H.; Leou, T.M.; Hsu, Y.H.; Chen, C.L.; Lu C.T. 2018. Developing disaster early warning system and adaptation strategies for crop production in Taiwan. Workshop of Strengthening the Prevention Strategies and Early Warning Systems of Agricultural Disasters Through Information and Communication Technology (ICT), Taiwan Agricultural Research Institute, Taiwan, 22 Oct 2018.
- Krishnan, P.; Ramakrishnan, B.; Raja Reddy, K.; Reddy, V.R. High-temperature effects on rice growth, yield, and grain quality. Adv. Agron. 2011, 111, 87-206 . [CrossRef]
- Chou, C.Y.; Wu, S.Y.; Chen, C.L. Rice lodging detection using the photography from unmanned aerial vehicle (UAV). J. Taiwan Agric. 2020, 69, 25-45. [CrossRef]
- Pan, X.; Wang, Z.; Gao, Y.; Dang, X. Effects of row spaces on windproof effectiveness of simulated shrubs with different form configurations. Earth Space Sci. 2021, 8, e2021EA001775. [CrossRef]
- Fu, Z.; Li. Q. Study on Wind-Proof Effect and Stability of Windbreak Fence in Alpine Skiing Center. Sustainability 2023, 15, 3369. [CrossRef]
- Chen, J.L.; Yang, S.S.; Yao, M.H. Effectiveness analysis of windbreak using the CFD models. Crop, Crop, Environment & Bioinformatics 2017, 14, 31-39. [CrossRef]
Figure 1.
Crop losses resulting from various disasters in Taiwan (1992–2021).
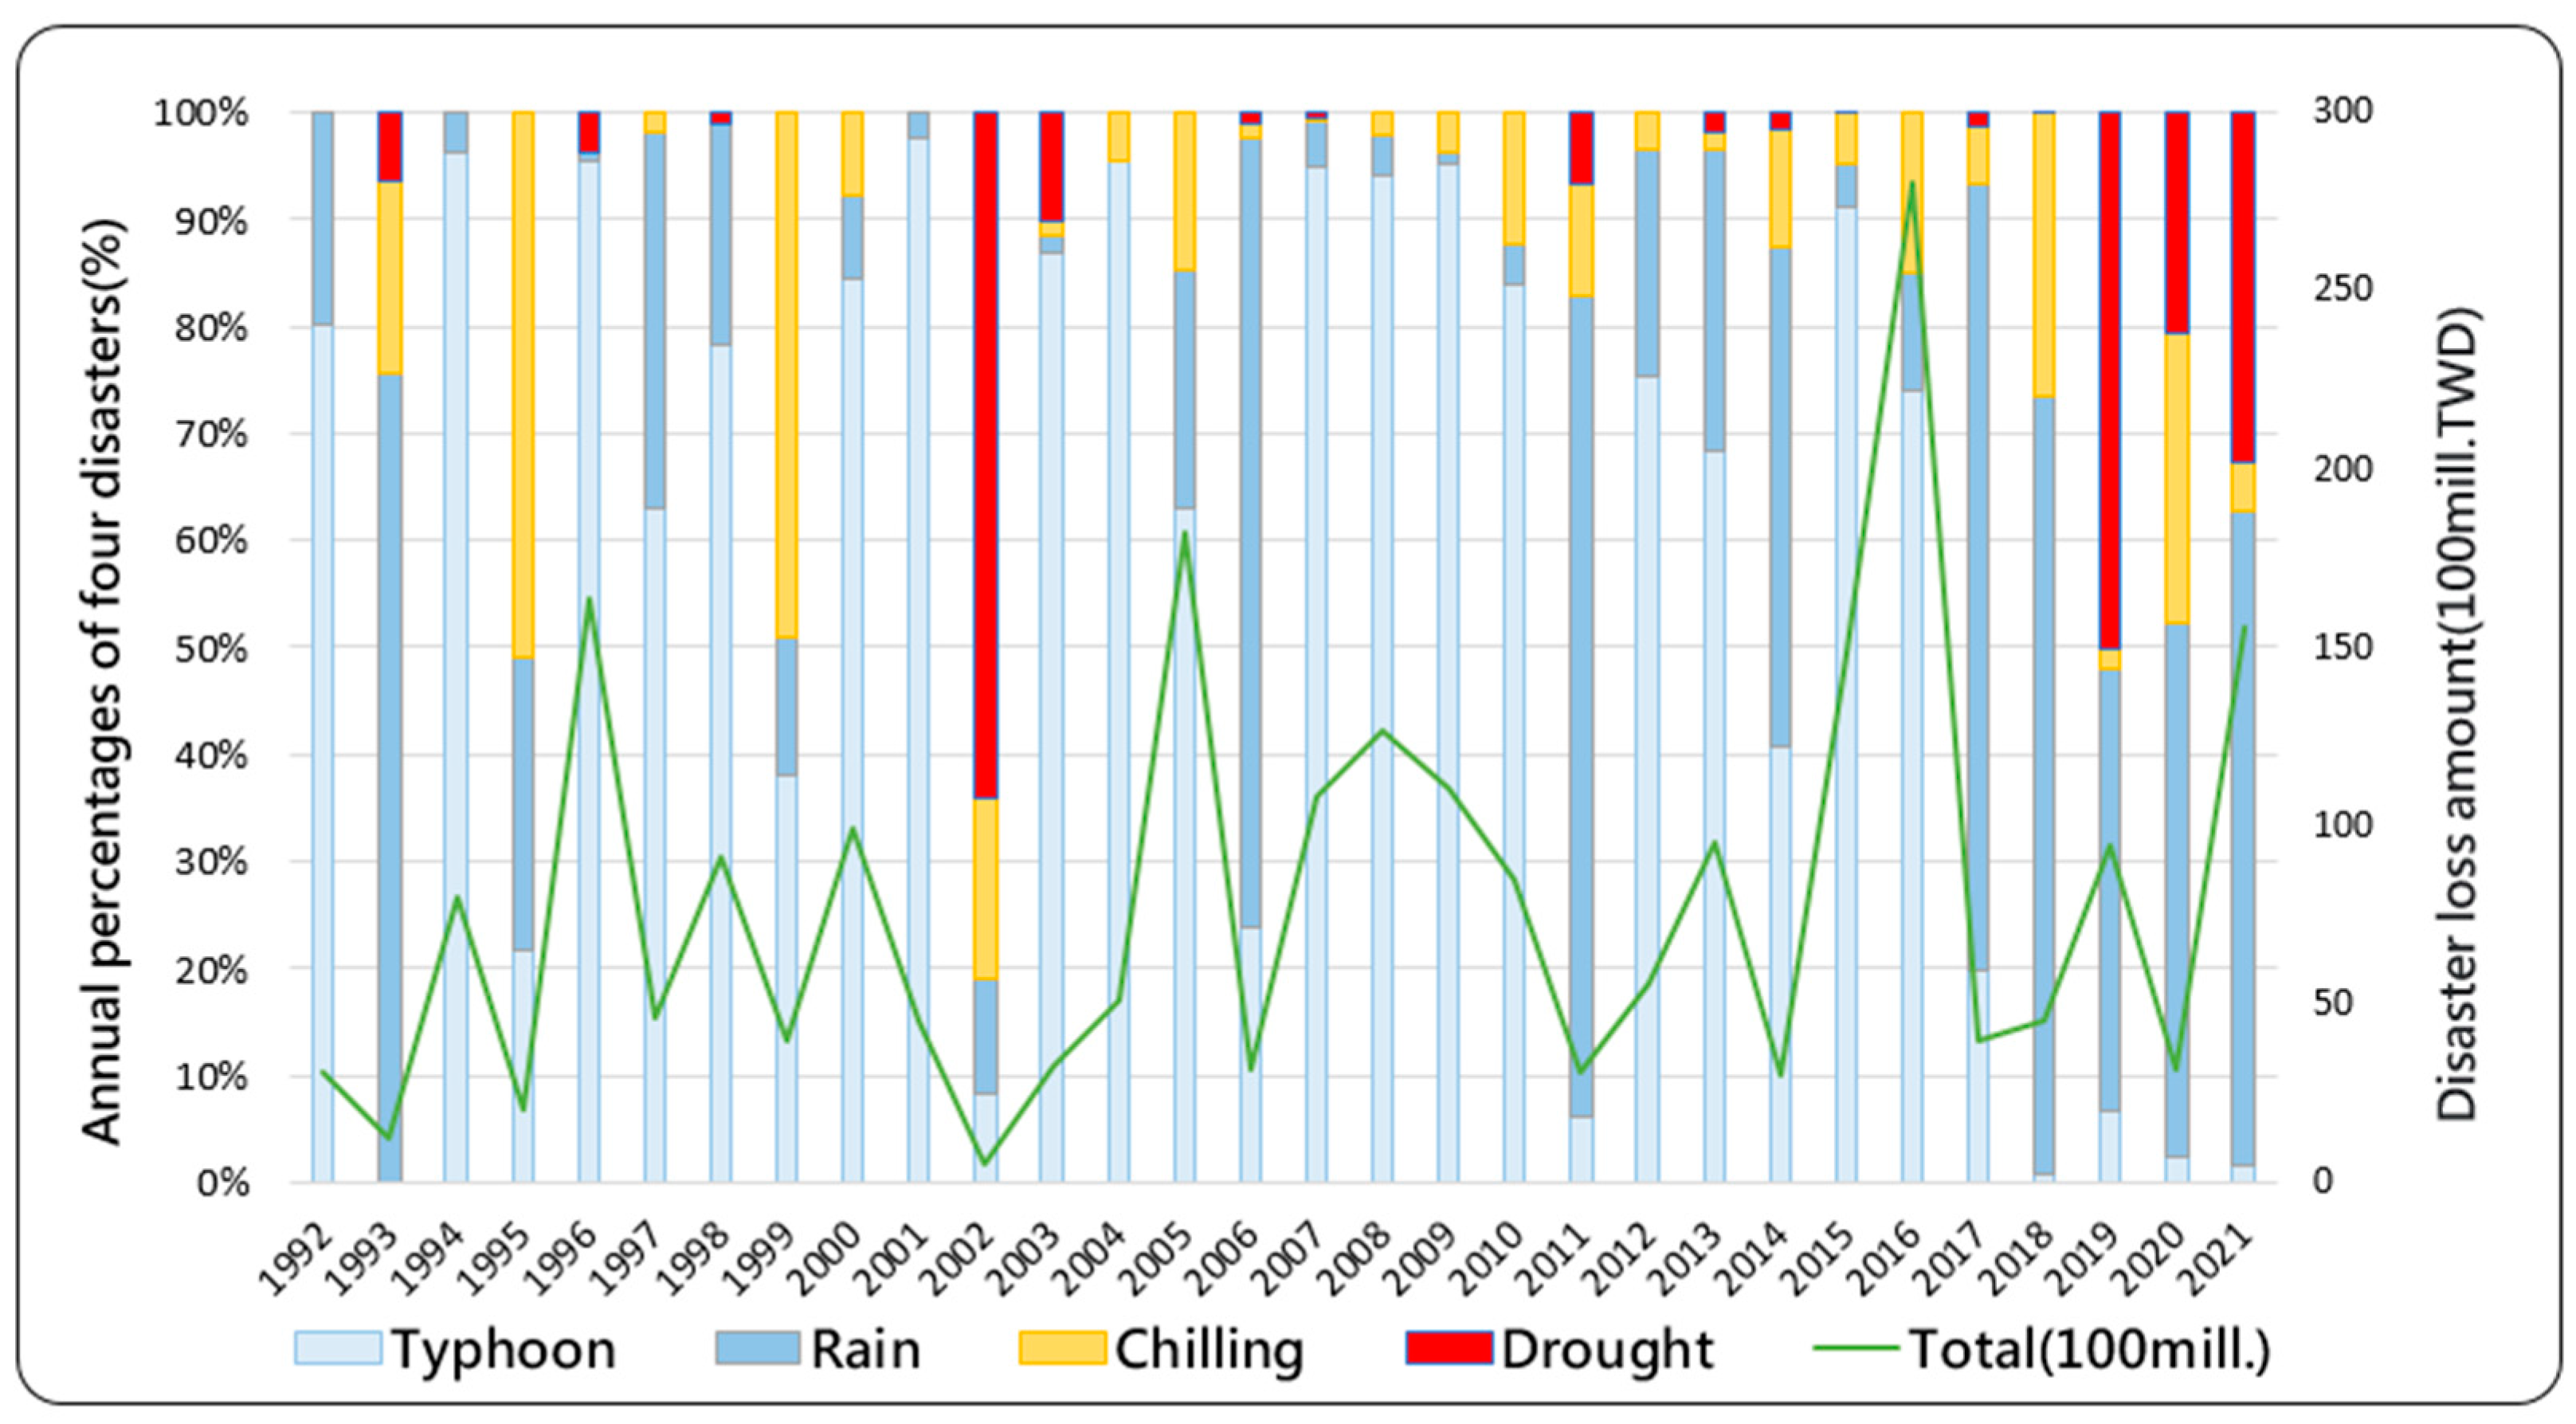
Figure 2.
Strategies for crop disaster prevention and tools for disseminating information.

Figure 3.
Crop disaster prevention calendar.

Figure 4.
Products of dissemination of different early disaster warning information; (1) information platform; (2) app; (3) LINE; and (4) crop disaster prevention cultivation calendar.
Figure 4.
Products of dissemination of different early disaster warning information; (1) information platform; (2) app; (3) LINE; and (4) crop disaster prevention cultivation calendar.
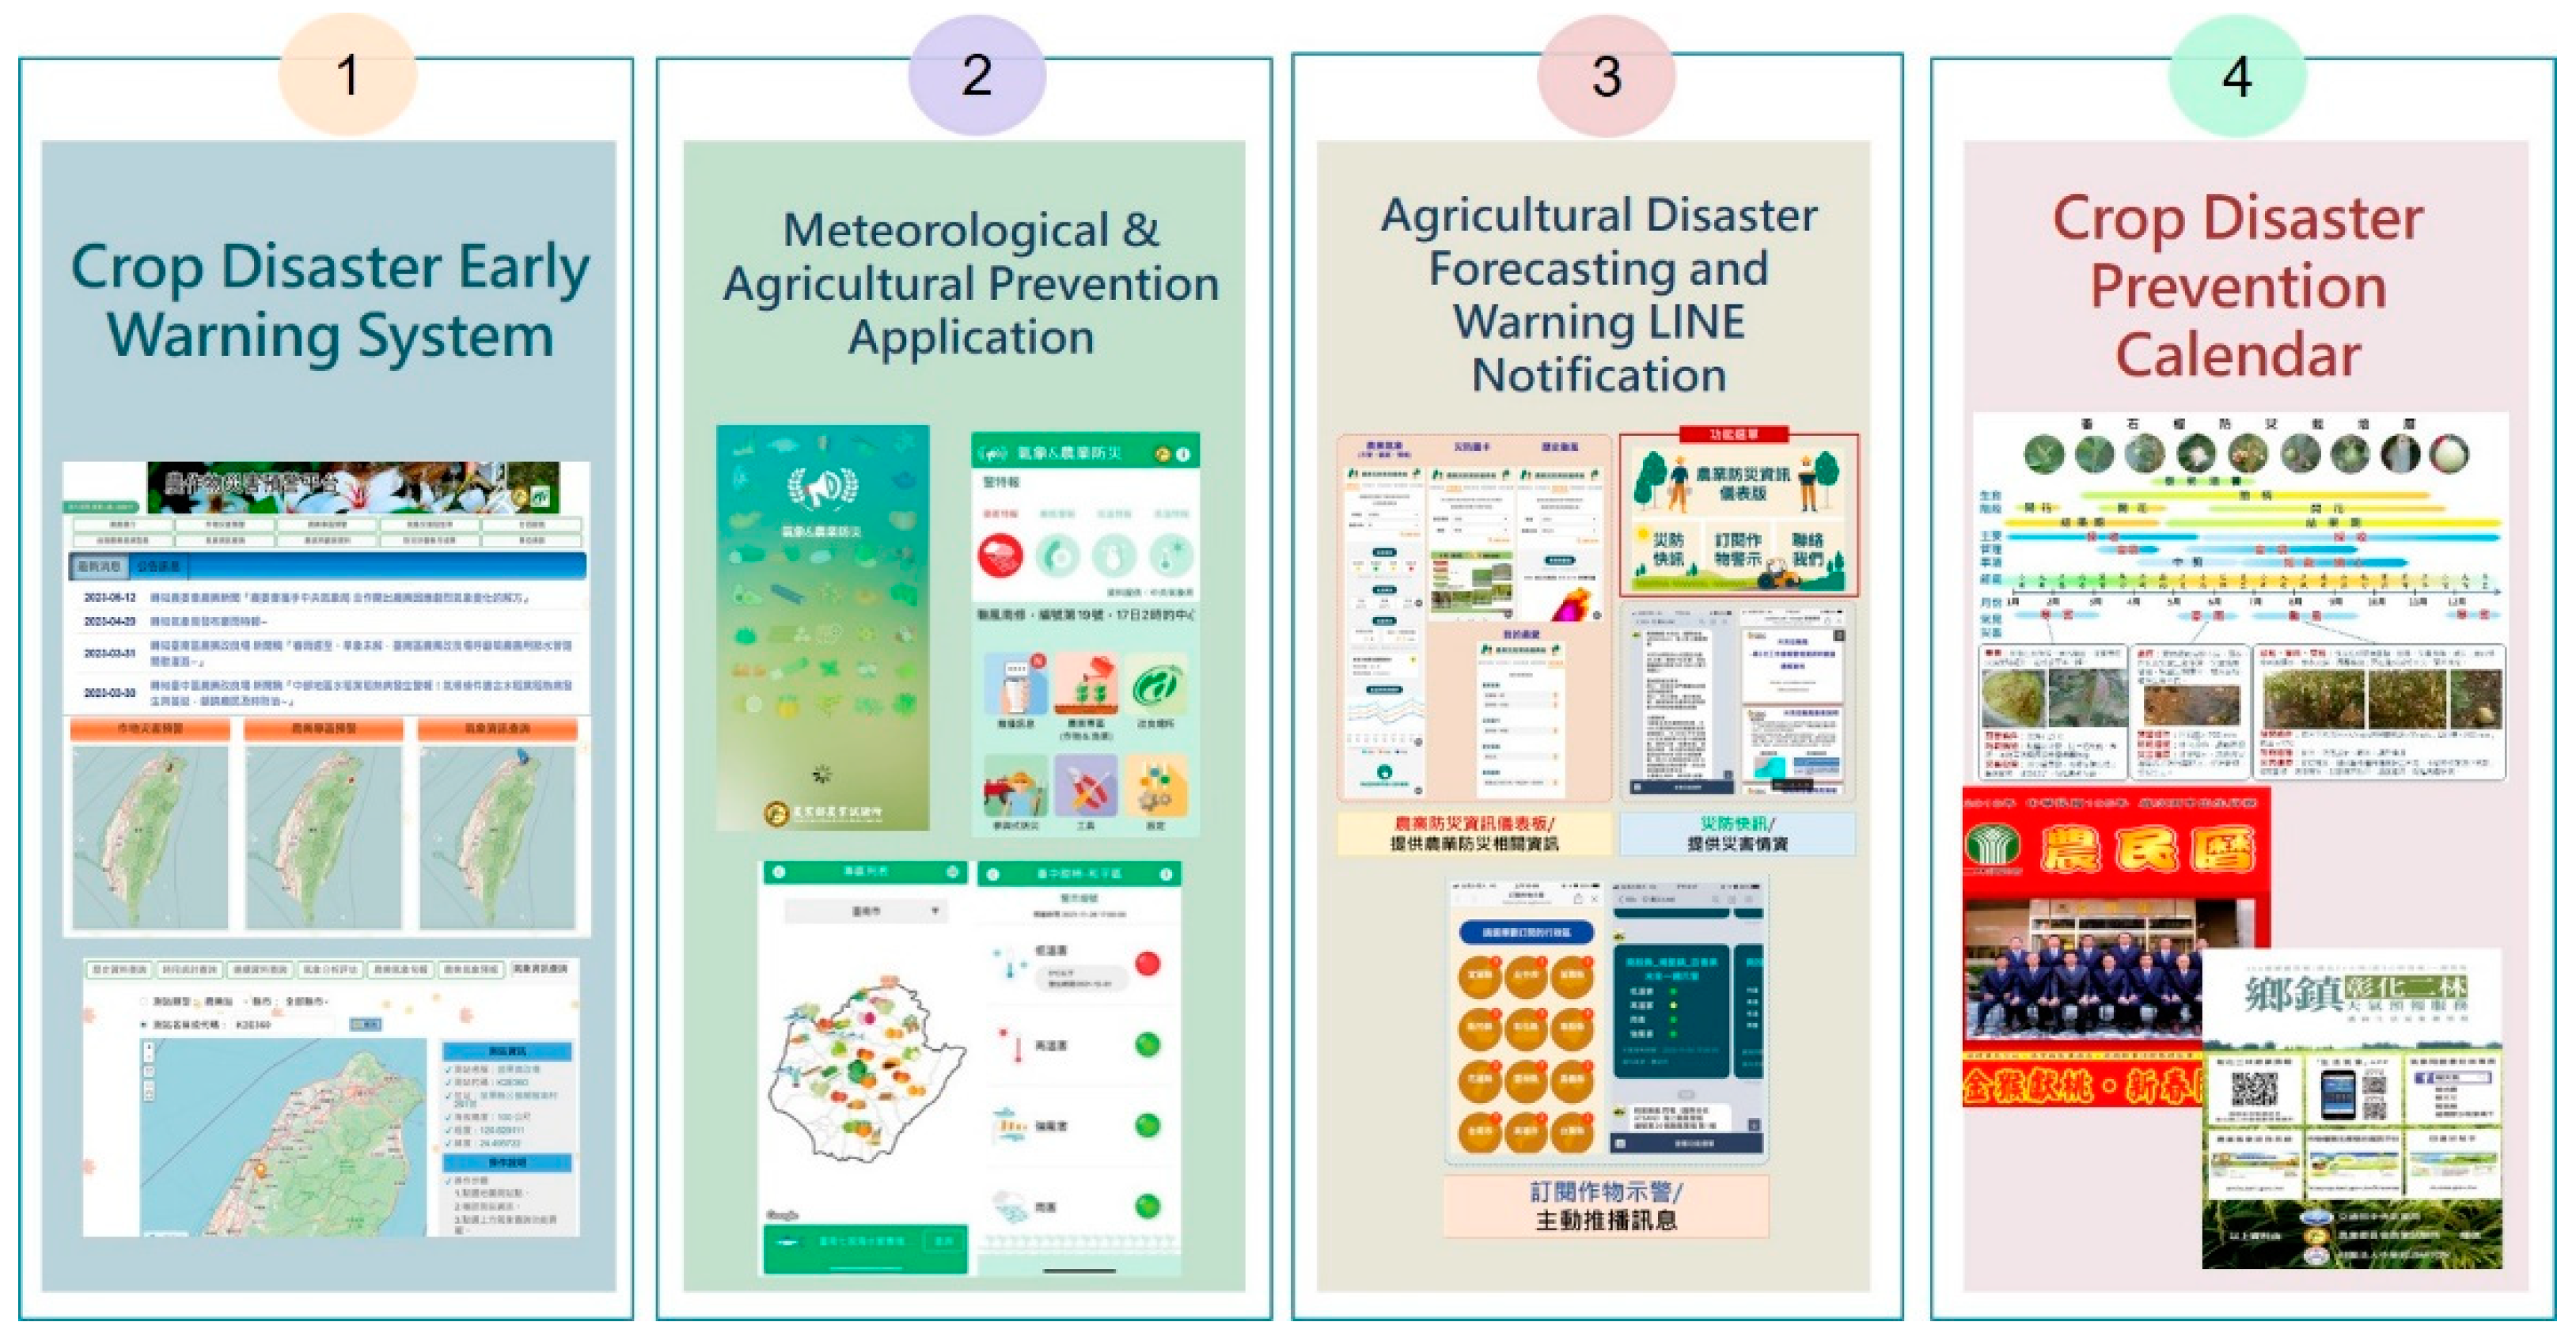
Figure 5.
Disaster information map card: the example of a typhoon. The map card includes the potential path of the typhoon, alert areas, historically damaged crops, and high-alert crops.
Figure 5.
Disaster information map card: the example of a typhoon. The map card includes the potential path of the typhoon, alert areas, historically damaged crops, and high-alert crops.
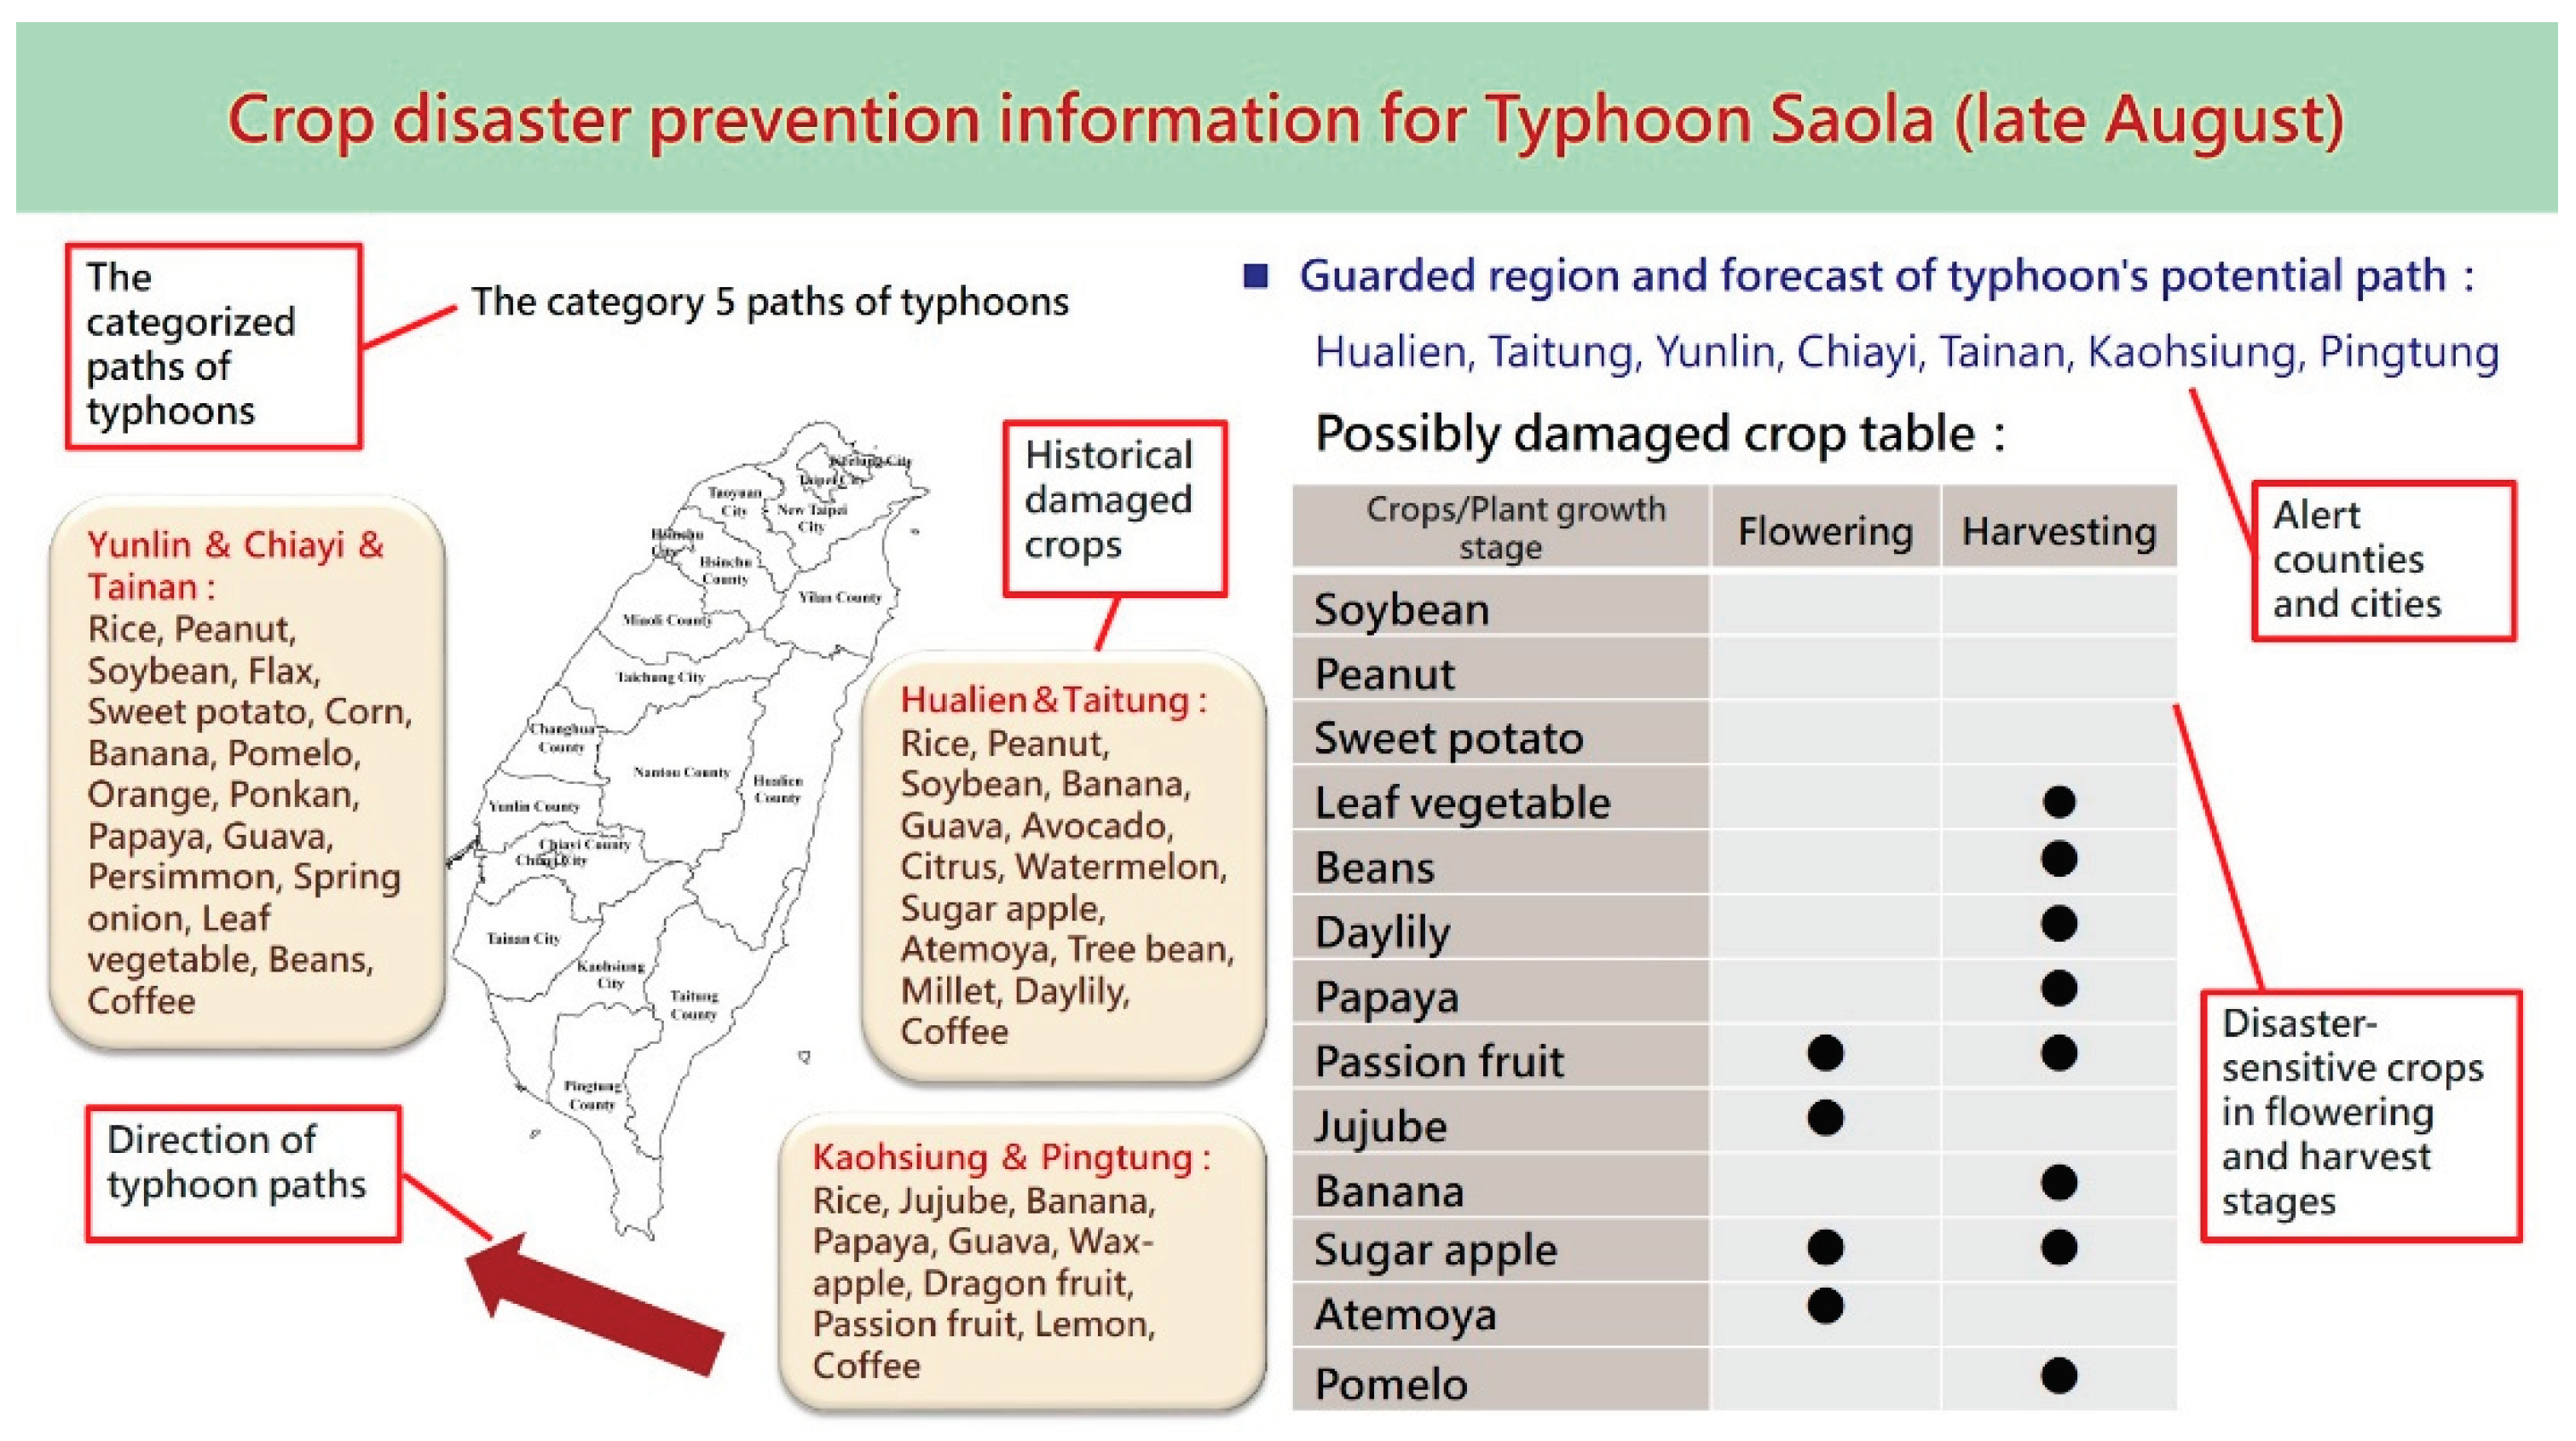
Figure 6.
Inspection chart for crop disaster prevention operations.
Disclaimer/Publisher’s Note: The statements, opinions and data contained in all publications are solely those of the individual author(s) and contributor(s) and not of MDPI and/or the editor(s). MDPI and/or the editor(s) disclaim responsibility for any injury to people or property resulting from any ideas, methods, instructions or products referred to in the content. |
© 2024 by the authors. Licensee MDPI, Basel, Switzerland. This article is an open access article distributed under the terms and conditions of the Creative Commons Attribution (CC BY) license (http://creativecommons.org/licenses/by/4.0/).
Copyright: This open access article is published under a Creative Commons CC BY 4.0 license, which permit the free download, distribution, and reuse, provided that the author and preprint are cited in any reuse.


