Submitted:
23 February 2024
Posted:
26 February 2024
You are already at the latest version
Abstract
Access to urban green and blue spaces (UGBS) has been associated with positive effects on health and wellbeing; however, the past decades have seen a decline in quality and user satisfaction with UGBS. This reflects the mounting challenges that many UK cities face in providing appropriate public facilities alongside issues such as health inequalities, an ageing population, climate change, and loss of biodiversity. At present, little is known about the preferences of different population subgroups and, specifically, the UGBS they visit and the spaces they avoid. Using a public participatory geographic information system (PPGIS), the overall aim of the research presented here was to investigate the preferences of different population subgroups in urban areas, and the UGBS they visit, using Edinburgh, Scotland as a case study. We created a baseline visitor demographic profile for UGBS use, and highlighted how visitors perceive, physically access, use, and engage with UGBS. The results revealed considerable variation in UGBS preference: one person’s favourite UGBS may be one that someone else dislikes and avoids. It is clear that adapting UGBS to suit local communities should not be a ‘one-size-fits-all’ approach. The conflicting views and preferences of different groups of respondents point to the importance of developing policies and park management plans that can accommodate a variety of uses and experiential qualities within individual parks. PPGIS offers an ideal tool for achieving this
Keywords:
urban green and blue space
; community engagement
; co-production
; public participation
; spatial analysis
; community health
; health & wellbeing
1. Introduction
Many cities in the United Kingdom have seen a significant decline, over the past decade, in the capital and revenue budgets for investment, management and maintenance of public urban green and blue spaces (UGBS). This has resulted in a decline both in their condition and in user satisfaction (Levelling Up the United Kingdom). Yet visiting green and blue spaces such as parks, woodlands, rivers, lakes and coastlines has long been associated with positive effects on health and wellbeing, particularly for those living in relative poverty, for whom high levels of stress and poor mental health are prevalent [1,2]. The importance of urban green and blue spaces for promoting or maintaining health and wellbeing became particularly evident during the Covid-19 pandemic, where the issues surrounding health inequality were also highlighted [3,4,5,6]. For example, Hubbard et al [7] investigated rurality, area deprivation, access to outside space and green space associated with mental health during the COVID-19 pandemic. They found that people living in urban areas had poorer mental health compared to those living in rural areas, while increased mental health distress was seen in deprived areas compared with more affluent ones. In addition, they showed that females and people presenting more severe COVID-19 symptoms, living in deprived areas, may suffer worse mental health distress during such a pandemic crisis [7]. These findings are supported in a study by Hubbard et al. [8], where an association between sociodemographic status and mental health was identified, and which was shown to be exacerbated by loneliness, lack of social support and thoughts about COVID-19 [8].
Evidence also shows that physical environments have the potential to elicit both pathogenic and salutogenic effects [9], highlighting the importance of the condition and quality of UGBS in relation to wellbeing. In addition, the literature shows a preference by people for viewing natural over urban scenes [10], and a beneficial effect on psychological wellbeing and cognition from walking in some natural environments [11,12,13,14]. Research has also shown that people who live within a five-minute walk of their local green space are 61% more likely to visit once a week or more, compared with those living 5 to 10 minutes (40%) or 11 to 20 minutes’ walk away (18%) [15].
Due to constraints on budgets, many UK cities are currently faced with mounting challenges, such as health inequalities, a growing and ageing population, climate change, and loss of biodiversity, which are increasingly difficult to address [16,17,18]. Thus, investment in any public facility or service, such as UGBS, needs to be carefully targeted, with confidence that the investment made will be effective in addressing the needs of the community and wider social challenges.
At present, little is known about the preferences of different population subgroups in urban areas and, in particular, what characterises their preferences for UGBS. Previous studies have shown that people with different socioeconomic backgrounds tend to visit places likely to be visited by others of similar socio-economic status (SES) to their own, but for some low SES populations, parks are also attractive if visited by users of higher SES [19,20]. In addition, people of different ages tend to visit different UGBS [21,22]. How can public authorities adapt UGBS to better suit the needs of diverse local communities? How can they collect and use public opinion to take action and inform practice at a detailed level? These are some of the important questions that the project ‘Thriving Green Spaces’ (TGS) set out to investigate.
TGS is a major project led by City of Edinburgh Council (CEC), with the aim of improving the city’s natural environment by producing a 30-year strategy and action plan for protecting and enhancing the UGBS to benefit people both today and in the longer term (Thriving Green Spaces). The TGS project was funded by a Future Parks (FP) Accelerator project grant, which was successfully bid for in 2019. FP is a joint venture between The Heritage Lottery Fund, the National Trust (NT) and the Department for Levelling Up, Housing and Communities (https://www.futureparks.org.uk/), to provide funding to preserve the future of the UK’s urban parks and green-blue spaces. The FP Accelerator programme was the first of its kind in the UK, and eight urban areas, covering a population of five million people, were chosen to join this initiative for their ambitious and creative plans to put green spaces at the heart of local communities (Birmingham, Bournemouth, Christchurch and Poole, Bristol, Cambridgeshire (county-wide, covering seven council areas), Edinburgh, Islington and Camden (in London), Nottingham and Plymouth). The green-blue spaces across these areas totals almost 20,000 hectares and include parks, woodlands and cemeteries, allotments, playing fields and nature reserves.
The TGS project in Edinburgh focuses on six change categories: Community (People, Spaces, and Operations), Ecology, Finance, Technology, Governance, and Sharing (https://www.thrivinggreenspaces.scot/project). The focus of this paper sits within the People and Spaces categories. From here on, the abbreviation ‘TGS’ refers to two sub-projects: investigating the preferences and visions of different population subgroups in the city, and the green- and blue-spaces they visit or avoid.
The study design and methods were chosen to elicit information related to the UGBS preferences and future visions, e.g., in relation to green space size, location, visitor numbers, management practices, type of vegetation, and biodiversity. The interest in investigating the links between biodiversity and health, in particular, has increased significantly over the past decades [23], and there is an increasing consensus that biodiverse landscapes are linked with various indicators of improved health and wellbeing [24]. On the other hand, there is also evidence suggesting that not all biodiversity-health pathways are positive [25]. Marselle et al. [25] propose four pathway domains by which biodiversity influences human health: reducing harm, restoring capacities, building capacities, and causing harm [25]. By contrast, the biodiversity in urban areas is often threatened by humans, through common management practices such as maintenance of lawns, pruning of trees and shrubs, use of pesticides and herbicides, and problems of invasive plant species [26].
The overall aim of the study was to investigate the preferences of residents of Edinburgh and their perceptions of the UGBS they visit. We hypothesized that people are more likely to visit UGBS if they are located within walking distance from their home; that different age groups visit different types of UGBS; and people with different socioeconomic backgrounds visit different UGBS.
Our study aimed to answer the following research questions:
- Who visits UGBS in the city, what UGBS do they visit and/or avoid, how do they get there, and what activities do they engage in?
- Are the UGBS visited and/or avoided distinguishable by the demographic character of the respondents?
- What are the characteristics of UGBS that attract or deter people?
2. Context, Materials and Methods
2.1. City of Edinburgh
In 2020, Edinburgh’s estimated population was 528 thousand people, and is projected to grow to around 586 thousand by 2043, with the main driver of population growth being in-migration (Edinburgh by Numbers, 2021). Edinburgh’s land area covers 264 km2, with a population density of 2,003 residents per square kilometre. It was identified as the greenest city in the UK in 2019, according to a report by First Mile https://www.thefirstmile.co.uk/the-big-picture/uks-greenest-hotspots, with more than 49% green space, more than 112 parks, and over 750,000 trees. As part of an initiative to support the city to reach its net zero emissions target, the city aims to plant around 250,000 trees over the next decade, to become a ‘One million tree city’ by 2030 (City of Edinburgh Council - One million tree city). See Appendix A for a map of Edinburgh’s green spaces and the specific sites included in this study.
The University of Edinburgh, as a partner organisation in the TGS project, was invited to contribute to the project in a number of ways, engaging staff and postgraduate students in research and analysis to support the TGS outcomes. One aspect of this was to undertake a study to answer the research questions outlined above.
2.2. Project design
To ensure public engagement and participation, the TGS project applied the approach of Public Participatory Geographic Information Systems (PPGIS), specifically the commercially available tool, called Maptionnaire® (https://www.maptionnaire.com/), which is a digital community engagement platform built on the principles of Participatory Action Research (PAR), offering a range of tools for public participation. Maptionnaire is based on the SoftGIS methodology developed at Aalto University, Finland (2005). SoftGIS was one of the earliest examples of an advanced online PPGIS approach. PPGIS tools are more widely used today, development has accelerated during the last decade and there is now a wide range of available PPGIS tools [27].
Maptionnaire produces both spatial and non-spatial data. Individual respondents map spatial attributes in the form of points, lines, or polygons (spatial data), in relation to which a series of questions are answered (non-spatial data) [28]. For analysis of the Maptionnaire data we employed the PPGIS data analysis framework proposed by Fagerholm and colleagues [28], consisting of three analytical phases i.e. Explore, Explain, and Predict/Model.
Briefly outlined, the explore phase focuses on exploring the spatial patterns and on the visual representation of spatial data, employing primarily descriptive and visual analysis [28]. For the explore phase we used the analytical tools built into the Maptionnaire system. The explain phase looks more closely at the observations than the explore phase, and it is within this phase that spatial and non-spatial data are combined and can be further amalgamated with other geospatial data, while various statistical tests can be conducted, either using the tools contained within Maptionnaire or exported to Quantum Geographic Information System (QGIS) [29,30]. The Predict/Model phase aims to generalize and make findings transferable across geographical locations and contexts, predicting system models to make inferences [28].
2.2.1. Survey design and collection of baseline data
The intention of the study was, inter alia, to undertake data collection to establish people’s visiting patterns and preferences for UGBS in 2020, as a baseline that would then allow monitoring of progress towards improving UGBS to better align with community needs and preferences over the next 30 years. The collection of such data was also used to develop indicators against which change over time could be measured. Maptionnaire was the principal tool used for collection and reviewing of baseline data and indicator data. As the methods needed to be robust and usable for future monitoring, a significant amount of time was allocated to streamlining the survey and adapting it for future use in ways that eliminated initial complications and would facilitate comparison between baseline data and future data collection.
The structure of the PPGIS questionnaire in Maptionnaire was developed for maximum user clarity and user-friendliness. Appendix B contains detailed information on the structure and content of the survey and some illustrations of the interface. The initial two web pages contained the title, the visual identity of the TGS project, a short project description and aim of the survey, details about who should participate, information regarding anonymity and confidentiality, and contact information for further details. Following the welcome pages, the next page asked if the respondent ever visits parks or open spaces. If the respondent answered ‘No’, a number of questions were asked to elicit information on the reasons for not visiting. Following this were a number of questions related to demographics and socioeconomic status, such as gender, age, ethnicity, disabilities, employment status, marital status, and household income. The survey then moved on to the map-based part of the questionnaire. The respondents were asked to mark a place close to their home to identify the area where they lived, while protecting their anonymity by avoiding identifying their particular residence. They were also asked to mark up to five locations of the UGBS they visit most often, and up to five locations of UGBS they avoid visiting. For each of the UGBS visited most often, participants were asked a selection of questions related to that individual place to elicit information regarding preferences and reasoning for visiting. We investigated further what aspects were regarded as satisfactory when visiting UGBS, and if certain aspects, or the lack thereof, detracted from the visitor experience (Appendix B – survey questions). To elicit this information, participants were asked to rate a number of statements, on a Likert scale, from 1 (bad) to 5 (good). For each of the UGBS the respondents avoided visiting, the participants were asked to note down the reason why, in their own words.
2.2.2. Respondent recruitment and sampling strategy
The data collection period ran from July to September, 2020, during the Covid period when an online tool was the only option available. The survey could be accessed through the TGS project website. Project partners and stakeholders were encouraged to share an invitation to respond to the survey, via their own media channels, and all the Edinburgh ‘Friends of Parks’ groups were contacted directly. ‘Friends of Parks’ groups are community level, independent voluntary groups, working to enhance, improve and promote parks, in partnership with their local authorities. The CEC’s Newsbeat channel was used to target Council staff, and CEC’s and their ‘Edinburgh Outdoors’ Facebook and Twitter profiles were used to reach a wider audience via social media. Information about the Maptionnaire survey was also circulated to employees at University of Edinburgh.
3. Results
To investigate RQ 1, we generated a visitor profile (Who visits UGBS in the city?) and visiting patterns (….what UGBS do they visit and/or avoid, how do they get there, and what activities do they engage in?).
3.1. Visitor Profile
In the survey, 531 individual respondents participated. Using Maptionnaire, they mapped 1629 points for UGBS areas they like to visit and 279 points for UGBS areas they avoid visiting. Of the survey respondents, 65% were female and 32% were male (Table 1), 24% were between 55 and 64 years of age, and they were predominantly white (93.44%). The majority were married, in a civil union, or cohabiting (69%), and did not consider themselves living with a disability (90%). Most were also in paid work (65%) or retired (24%) and living in a household with a total annual income of £37,000 or above (59%).
We compared respondents’ individual characteristics to those of the population of Edinburgh as a whole and found that the profile of respondents differed for a number of characteristics. Table 1 shows that the most significant differences between the survey population and the general population of Edinburgh were in relation to gender, age, marital status, employment, and social class.
The respondents were also classified on the basis of the degree of deprivation of their area of residence. The Scottish Index of Multiple Deprivation (SIMD) quantifies the extent to which an area is deprived across the following domains: income, employment, education, health, access to services, crime, and housing (Scottish Government. Interactive Mapping: SIMD Interactive Map (accessed November 2022)). For the maps generated from the data, we used SIMD quintiles, which means that all 6976 data zones (postcodes) were grouped into 5 bands (quintiles), each containing 20% of the data zones. Quintile 1 contained the 20% most deprived data zones in Scotland, and quintile 5 contained the 20% least deprived data zones in Scotland.
Figure 1 highlights a skewed distribution of respondents’ home location: 54% of the survey respondents lived in an area from the top quintile (5th quintile, the 20% most affluent areas) in Scotland according to SIMD, and only 4% lived in an area from the bottom quintile (1st quintile, the 20% most deprived areas).
3.2. Visiting patterns
Figure 2 shows the UGBS areas the survey population avoided and the areas they visited often. Fewer respondents have indicated UGBS areas they avoid (279 points selected), when compared to the number of specified favourite UGBS (1629 points selected).
A count was done of the number of times an UGBS was selected as a favourite area to visit, to show the overall preferences for UGBS areas visited and avoided among the survey population. The analysis represented in Figure 3 and Figure 4, revealed two main UGBS ‘hotspots’: Holyrood Park, a large natural park in central Edinburgh, with an array of hills, lochs, glens, ridges, basalt cliffs, and patches of gorse, providing a wild landscape within its 260ha area (Appendix A, green space No. 6); and the Hermitage of Braid and Blackford Hill, a local nature reserve covering an area of 60.3 ha towards the south-western edge of Edinburgh. It is divided into two distinct areas: Blackford Hill, consisting of mainly grass and scrub vegetation; and the Hermitage of Braid, consisting of a narrow woodland dell, with a burn (stream) running through it. The area adjoins a golf course, riding stables and a riding school (Appendix A No. 23). A number of slightly less-visited hotspots were identified (No. 3 The Braidhill, No. 8 Princes Street gardens, No. 7 Meadows, No. 9 Inverleith Park, No. 12 Corstorphine Hill, No. 21 Calton Hill, No. 10 Harrison Park, No. 11 Saughton Park, No. 22 Victoria Park. The two main hotspots are close to the centre of Edinburgh, with the slightly less visited hotspots circling the city centre.
The UGBS areas respondents avoid (Figure 4), were to a large extent in the same places as the areas people like to visit, but with smaller numbers of datapoints. The main UGBS areas respondents avoided were: Princes Street Gardens (Appendix A No. 8), which are over 15 Ha and divided into two parts by an artificial hill, The Mound, that connects Edinburgh’s New Town and Old Town and where the Scottish National Gallery is located; The Meadows (No. 7), a large public park to the south of the city centre, consisting of open grassland crossed by tree-lined paths, a children's playground, a croquet club, tennis courts and recreational sport pitches; Leith Links (No. 18), which is largely flat expanses of grass bordered by mature trees, containing a children's play area, football pitches and three public bowling greens and tennis and petanque courts; and Holyrood Park (No. 6).
The variation in visiting patterns between respondents and areas was large, and visitors engaged in an array of different activities of duration ranging from minutes to several hours, daily or monthly (Table 2). The majority of respondents visit UGBS a least once a week (59%), with 8% visiting every day. The most common duration of a visit is for 30 minutes to 1 hour (40%), followed by 1 to 2 hours (31%), less than 30 minutes (15%), and for 2 to 4 hours (11%). Only a small proportion of visits last between 3 to 5 hours (3%), and no respondents said that their visits last more than 5 hours. More than half of the respondents walk (64%) to visit UGBS, 19% cycle, 12% go by car, 5% take the bus, and less than 1% use the tram or other mode of transport (Table 2). The mode of transport chosen when visiting UGBS indicated that the majority of UGBS visitors live relatively close to the spaces they visit (discussed further in section 3.3). When visiting UGBS areas, the largest group of respondents chose to visit on their own (42%), 36% visit with their partner or a friend, 17% visit with their family, and 6% visit GS areas in a group (Table 2). As the baseline data collection took place in 2020, during different phases of lockdown due to the Covid-19 pandemic, we endeavoured to elicit information related to these new and challenging circumstances. We found that 78% of the respondents were able to continue visiting UGBS as part of their daily exercise routine during Covid-19 lockdown, with only 22% unable to continue visiting (Table 2). 67% of respondents were able to visit UGBS areas more often compared to pre-lockdown, 19% visited less, and 14% continued to visit as they did pre-lockdown. It is evident that people engage in a wide variety of activities when they visit UGBS, the main being walking with or without a dog (30%), followed by watching wildlife (12%), meeting friends and socialising (7%), quiet activities such as reading or meditating (7%), and cycling (6%); some people used the UGBS as a through route or for commuting (6%) (Table 2).
3.3. Demographic variability
To address RQ 2, we investigated the plausibility of distinguishing the type of UGBS visited and/or avoided by demographics. In Figure 5a the respondents’ home location is shown, colour-coded according to the corresponding data zone from the Scottish Index of Multiple Deprivation (SIMD). According to the maps in Figure 5a and Figure 5b it is clear that the majority of respondents live in more affluent areas (Figure 5a); furthermore, according to our data, residents from deprived areas are under-represented when it comes to visiting and using the UGBS available in the city. Figure 5b show the UGBS areas respondents liked to visit. Each participant could choose up to five spaces, all of which are coloured according to the SIMD level corresponding to the residence of the person visiting the space. Comparing Figure 5a and Figure 5b, it appears that individuals from areas of high deprivation tend to visit UGBS local to them.
These findings are supported by the results represented in Figure 6a (distance to UGBS visited) and b (distance to UGBS avoided), which shows respondents living in the 40% most affluent areas in Scotland (the top two SIMD quintiles) are more likely to travel further to visit what they perceive to be good quality UGBS (with an average distance between 2400 to 2700 metres from their home). People living in the 60% most deprived areas travel shorter distances (with an average distance between 1700 to 2000 metres from their home) when visiting UGBS (Figure 6a), and therefore rely more on their local area to provide them with potentially salutogenic environments. In terms of UGBS the respondents preferred not to visit, individuals living in the 60% most deprived areas explicitly avoided more local areas (with an average distance between 1500 to 2500 metres from their home), which could indicate that they do not even consider the possibility of visiting spaces away from their local neighbourhood and therefore do not ‘actively’ avoid them. In contrast, individuals living in the 40% most affluent areas also considered UGBS further afield (with an average distance between 3500 to 7500 metres from their home) as spaces they avoid visiting (Figure 6b). Combining these findings, it appears that individuals from areas of high deprivation tend to stay more locally than those from areas of lower deprivation.
Focusing on sociodemographic variables can point to places which are more popular among high income individuals versus low-income individuals (Figure 7), and younger versus older (Figure 8). Figure 7 show groupings based on higher, medium and lower income survey respondents and the UGBS they visit. Our data revealed no obvious clusters of usage related to income. The main difference between income groups was that higher income respondents are more likely to engage in UGBS activities than those on lower incomes.
Figure 8 shows the UGBS visited, divided into groups based on age of the respondent. Again, our data revealed no obvious clusters related to age. What is noteworthy is that the respondents aged 65+ are also venturing as far afield to visit UGBS as the younger respondents, away from the city centre, visiting more natural UGBS such as the Regional Park (Pentland Hills, Appendix A No. 20) and the beach/seafront (Appendix A: Nos. 14, 15, 17 and 19).
Figure 9 shows the UGBS avoided, divided by gender. It is apparent that women are more likely to avoid UGBS than men, particularly in South and West Edinburgh. The level of avoidance is not correlated with the level of deprivation of the area within which the UGBS is located. The areas typically avoided by both male and female respondents are located towards Leith harbour and the seafront, and near the two main railway stations in the city centre and the railway line. In addition, the areas avoided by females are more evenly spread across the city than for the males, indicating that more areas are perceived as potentially unsafe, or of poor quality, by women compared with men.
3.4. UGBS characteristics
We analysed the open-ended questions from the survey qualitatively, to elicit information regarding perceived barriers and facilitators to UGBS use, and to investigate what specific aspects of the environment limited visitor enjoyment, or made the experience more enjoyable (RQ 3).
3.4.1. Barriers to visiting UGBS
In terms of limiting the experience, the three aspects most often mentioned by respondents as barriers related to: ‘dogs/dog owners’, ‘littering’, and ‘toilet facilities’. The consensus was that there were too many dog walkers (particularly professional dog walkers) letting their dogs off the lead and not picking up faeces after the dogs (“Uncontrolled dogs”, “Dog owners not clearing dog faeces”, “Too many dog walkers, particularly the professional ones”, “Out of control dogs are a real issue”, “Professional dog walkers with dogs off leads”). In general, people thought that there was a problem with dog faeces or dog waste bags not being cleaned up (“The bin is often overflowing with waste, particularly dog waste bags” “Lots of dog poo”, “Dogs off lead jumping up, dog owners irresponsible, dog poo bags in prominent places, dogs chasing wildlife”). However, there were also barriers and limiting factors to dog walkers’ experience of enjoyment while visiting UGBS: “Also rangers have ruined it for dog walkers, saying to keep dogs on leads because of nesting birds”, “Cyclists way too fast and a danger to dog walking….”.
A second major barrier was ‘litter/waste/rubbish’, with respondents believing there was too much rubbish lying around, overflowing, and too few bins available, and the bins that were available were not emptied often enough: “People leaving rubbish ……more or bigger bins are also needed”, “People leaving litter”, “Overflowing bins”, “Trash removal - especially the last few weeks with huge crowds and overflowing litter bins”, “Not enough rubbish bins”, “Litter bins aren't collected often enough.
The third major barrier to people enjoying their UGBS experiences was the lack of toilet facilities: “No toilet facilities which is difficult with children”, “No toilet facilities limit how long we can spend there”, “Toilet facilities are too far away and it is difficult to park”.
3.4.2. Facilitators for visiting UGBS
There was broad agreement among the respondents on which characteristics and aspects of UGBS environments act as facilitators and encourage individuals to visit more often. There were two major facilitators: open space/open views (prospect) and defined areas (e.g. area for children, wild nature for walking, nature watching, little nature garden, formal garden, orchard, herb garden, dog free zone, designed for walking, sports facilities, etc.).
3.4.3. UGBS visitor satisfaction
The survey respondents were asked how much they agreed or disagreed with three statements relating to the UGBS areas they visited: “I was satisfied with the visit”, “I felt relaxed”, and “I felt energised”. For all three statements, the majority of respondents strongly agreed’ (68%, 63%, and 59%, respectively), or ‘slightly agreed’ (23%, 24%, and 22%, respectively). In summary, the participating UGBS visitors in Edinburgh are highly satisfied overall with the UGBS areas they visit. The respondents were also asked a series of questions related to the individual places they visited, to elicit information regarding preferences and reasons for visiting (Figure 10).
In general, visitors were mostly satisfied with the transport links to the UGBS they visited (Likert scale: 5+4=52%; 3=28%; 2+1=20%) (Figure 10). They also found the walking conditions to be very accessible, both to and within the site, in terms of quality of pavements, slopes, surfaces, street crossings etc. (Likert scale: 5+4=74%; 3=18.5%; 2+1=7.5%). In addition, respondents found the visual quality of the UGBS they visited to be excellent (Likert scale: 5+4=81%; 3=14%; 2+1=5%) and were generally happy with the quantity and quality of the trees, shrubs, and flowers (Likert scale: 5+4=70%; 3=18%; 2+1=12%); they also felt connected or very connected with nature when visiting these spaces (Likert scale: 5+4=76%; 3=14%; 2+1=5%). They were also largely satisfied with the maintenance of the site (litter collection, condition of equipment, mowing of grass etc.) (Likert scale: 5+4=59%; 3=24%; 2+1=16%); and the safety and security (sense of being threatened, poorly lit with dark places in winter evenings, signs of anti-social behaviour) (Likert scale: 5+4=59%; 3=24%; 2+1=17%) (Figure 10).
Lower satisfaction was seen for the information available online (Likert scale: 5+4=19%; 3=20%; 2+1=62%); the information/translation of information on site (Likert scale: 5+4=32%; 3=25%; 2+1=42%); and the facilities (e.g. seating, play equipment, exercise equipment, toilets) (Likert scale: 5+4=36%; 3=35%; 2+1=27%).
We investigated further what aspects were regarded as satisfactory when visiting UGBS, and if certain aspects, or the lack thereof, detracted from the visitor experience (Figure 11). The majority of respondents reported ‘No’ or ‘Don’t know’ when asked if special signs were provided for people with disabilities (30% and 68%, respectively) and if information boards were translated into different languages (38% and 68%, respectively). This indicates that the visibility of this type of information could be improved, or that individuals not needing this type of information will consequently not look for it. Of the respondents, 26% reported that there were toilets in or near the UGBS; 56% reported ‘No’ to that question, while 32% reported that the provision of toilets influenced their decision to visit a particular UGBS. When asked if any cafes were located in or near the visited space, 50% answered ‘Yes’ (No = 43%, Don’t know = 7%); 24% answered that the provision of cafes does influence their decision to visit an UGBS.
4. Discussion
The overall aim of the research presented here was to investigate the preferences of Edinburgh residents and the UGBS they visit. These data are of interest primarily because they provide a citywide baseline for the use of UGBS, underpinning the development of a profile for UGBS access, use, and engagement. The resulting visitor profile shows which respondent groups are visiting UGBS most frequently and highlights groups that currently do not appear to be fully benefitting from use of UGBS. From the visitor patterns showing how visitors physically access, use, and engage with UGBS in Edinburgh, it was clear that respondents have a range of different preferences for use of UGBS, and no UGBS area is likely to accommodate all these different preferences within a relatively small geographical area.
3.5. Visitor patterns of UGBS use & demographic variables
We found that the variation in UGBS visiting patterns between individuals and areas was large, and respondents engaged in an array of different activities for anything ranging from minutes to several hours, daily or monthly.
Although some population groups were underrepresented in the survey data, based on our survey we found that patterns of use are not clearly reflected in the demographic characteristics of respondents. Initially, we hypothesized that different age groups might visit different types of UGBS and people with different socioeconomic backgrounds might visit different UGBS. However, our data revealed no obvious clusters of usage related to age or to income. The main difference between income groups was that higher income individuals are more likely to engage in UGBS activities than lower income individuals. In addition, it is noteworthy that respondents aged 65+ are also venturing further afield than some younger age groups, away from the city centre, visiting more natural UGBS such as the Regional Park and the beach/seafront.
The lack of engagement with UGBS in lower income communities may be explained in part by lower numbers of respondents from deprived areas. However, it may also be partly explained by findings from previous research, which have indicated that provision and quality of UGBS varies across the socioeconomic scale, with deprived and/or black and minority ethnic groups having poorer access to good quality UGBS [31,32,33,34]. In addition, Floyd and colleagues’ work in the USA [35] found that specific physical park features were as important as income or ethnic group in relation to levels of physical activity in parks [35]. Poor provision and quality of UGBS in an area of high deprivation might therefore cause a cumulative negative effect, making it particularly difficult to engage these communities in UGBS activities.
3.6. UGBS characteristics – barriers and facilitators
The data demonstrate differences in respondents’ use of UGBSs and whether they see an area as good, or a place to avoid. In particular, the choices related to UGBS in deprived versus affluent areas are worth further exploration. Our findings suggest that in order to increase use of UGBS in more deprived areas, not only would the aesthetics and usability of the UGBS areas have to be considered in light of the needs and preferences of the local communities, but targeted action would also be necessary to engage local residents, encouraging them to actively participate in their local community, place making and development of local UGBS areas.
Our findings support the initial hypothesis that people are more likely to visit UGBS if they are located within walking distance from their home, as 83% of respondents in this study either walk or cycle to the UGBS they visit (Table 1). Of particular interest is the finding showing that people living in more disadvantaged areas visit greenspaces closer to their home, and they also tend to avoid spaces that are closer to their home, compared with people from more affluent areas. This indicates that the proximity and quality of UGBS is a bigger barrier in some areas than others. In addition, we found that women are more likely than men to avoid UGBS. It is evident that the UGBS avoided by females are evenly spread across the city, indicating that more areas are perceived as potentially unsafe, or of poor quality, by female UGBS users, compared to the perception of male UGBS users. There is therefore a need for gender-focused UGBS research to minimise gender-related barriers. Our findings highlight the importance of useable and safe UGBS accessible to everyone, but particularly for those living in disadvantaged areas, who visit, or avoid, UGBS closer to home and are therefore likely to benefit more from local community interventions.
The data clearly illustrate that one person’s favourite UGBS is not necessarily the same as someone else’s, and the same goes for UGBS people avoid. The three aspects most often mentioned by respondents as barriers, were related to: ‘dogs/dog owners’, ‘toilet facilities’, and ‘littering’. However, the first two barriers were also mentioned by some in relation to facilitators. E.g., for some, being able to take you dog off the lead was a facilitator, whereas for others dogs off the lead was seen as a barrier. Some people want access to toilet facilities and cafés, the provision of which influences their decision to visit the space. For others, this is not important, or might even be perceived as a barrier, as it would attract too many visitors, in particular families or groups with children.
There was broad agreement among the respondents regarding two major facilitators: open space/open views (prospect) and defined areas (e.g., area for children, wild nature for walking, nature watching, little nature garden, formal garden, orchard, herb garden, dog free zone, designed for walking, sports facilities, etc.). However, again, what for some was seen as a facilitator to visiting UGBS, was by others seen as a barrier (e.g., wild nature for some is inaccessible; prospect might limit the abundance of biodiversity and feeling of wild, undisturbed nature; loud children and dogs off the lead might scare away wildlife etc.).
There was broad agreement that the quality and quantity of greenery, the feeling of connection with nature, and a good overall visual quality, are all aspects that enhance the UGBS experience and act as facilitators for visiting (Figure 10). However, it is not possible from our data to ascertain what individual respondents mean by good or bad quality of greenery, how they define ‘a connection with nature’, or how they rate an overall good visual quality. Therefore, in accordance with previous research [36,37,38], we conclude that adapting UGBS to suit local communities should not be a ‘one-size-fits-all’ approach. A solution to accommodate the variation in individuals’ preferences for UGBS could be to section parks into smaller defined areas with different types of vegetation, an array of functions, and targeted towards diverse groups of visitors. Good examples of this are Saughton Park (Figure 12) and Inverleith Park (Figure 13), where there are areas targeted towards families with children, teenagers and young adults, individuals engaging in quiet activities, individuals exercising, and individuals socialising. Saughton Park (Figure 12) recently underwent major regeneration with the support of the Heritage Lottery Fund (HLF) ‘Parks for People’ and the council capital programme. Wide ranging public engagement and research was carried out, to inform the development of the Master Plan proposals (https://www.edinburgh.gov.uk/downloads/download/12938/saughton-park-restoration-project).
These parks also have a variety of vegetation: some areas with trees, hedges, shrubs and other tall vegetation; some areas with flower beds and lower planting; and some with mown grass better suited for play and exercise. Not all UGBS areas are large enough to accommodate this type of zoning, and it is therefore important to consult local communities and ascertain what elements and zoning is desired and likely to be utilised to its fullest, in each UGBS area.
3.7. Future vision for UGBS
Across the data presented here and reinforced by findings from the CEC Thriving Green Spaces visioning workshops with stakeholders (carried out as a separate study with a separate report produced for CEC, which is not reported here), there were five clear topics repeatedly mentioned as positive characteristics of UGBS, facilitators for visiting these spaces, and related to participants’ future vision for UGBS: ‘Wilding of our urban green spaces’, ‘Pocket/micro urban green spaces’, ‘Community gardening’, ‘More trees’, and ‘Green continuous networks’. Hence, we recommend that future research focuses on these five characteristics, and to what extent community interventions focusing on these topics can lead to improvements in community wellbeing.
However, to improve engagement with lower income populations and groups living in more deprived urban areas, and to identify what physical features are suitable for and desirable to each community, it is vital to include the local residents in the planning process before any changes happen. A process of co-production for future plans and visions will encourage the residents to take ownership of their local environment and form a stronger place attachment, rather than feeling they are not welcome and that any changes are for others to benefit from, not for them. The Local Government Association recently published a report on co-production with communities to improve social care, and mental health & wellbeing. The report highlights the success of co-production and the importance of focusing on place-based, community- and person-centred approaches, to establish successful engagement [39]. It appears, that without a connection to their local UGBS, regeneration and aesthetic improvements alone might not be enough to generate lasting use of, and commitment to, a community’s UGBS. This is supported by findings from ‘The countryside charity’ [40], who reported a significant increase of local green spaces in England between 2012 and 2022. However, they found that despite an increase in green space designations in deprived areas, a strong correlation persisted between deprivation and use of green spaces. They stated that engagement with community planning may not be a priority for people facing poor housing, low incomes and barriers to accessing healthcare and other essential services. Furthermore, they concluded that to address these pressures and create capacity, communities and organisations must work together [40].
Future research should therefore focus on evaluating co-development and community planning processes (i.e. a process where organisations providing public services, business, voluntary groups, and local communities, work together to improve community and individual health), creating the evidence needed to better communicate the benefits of incorporating UGBS and green features into urban planning, green infrastructure, and development of existing as well as new housing developments.
4.1. Limitations
There were major difficulties engaging with the wider public during this project due to the Covid-19 lockdowns and social distancing rules, meaning that online engagement was the only available method to collect most data. As a result, the Maptionnaire survey was not truly representative of the Edinburgh population in relation to a number of demographic characteristics and this limits the confidence with which generalisations can be made over the city as a whole. In addition, the scope of the survey was likely to attract specific sectors and groups already engaged in the issues related to UGBS use, meaning that these responses might be from a biased sample of people already interested in UGBS and what green and blue infrastructure can offer. The research presented here is therefore only the beginning of a wider process of ongoing engagement that will continue to be required with Edinburgh’s residents, workers and visitors as the details of new visions are worked out on the ground.
Some population groups were underrepresented in the survey data (individuals from households earning less than £37,000, people under 45 years of age, males of all ages, unemployed people, students, and permanently sick or disabled people). From previous research projects involving deprived areas, we know that some communities and individuals are more difficult to engage than others, and there are a number of challenges in getting a truly inclusive response from all different sectors and groups within a large city. When dividing the baseline dataset into subgroups, there were not always sufficient data to infer any conclusive estimates or hypotheses and larger response numbers would be needed to analyse the data at neighbourhood level. We recommend that future research should focus on how to engage underrepresented groups to understand better how they might use and benefit from UGBS.
It is possible that the groups identified as underrepresented via the Maptionnaire survey might not actually be underrepresented in terms of using and benefitting from UGBS; rather, they may represent a group more difficult to engage in an online survey and less willing to participate in research. Hence, we recommend that future research uses behaviour mapping of specific UGBSs, as well as surveys that directly question park users, to get a clearer idea of who visits and what activities they engage in. This would help investigate any true disparity between population subgroups (affluent/deprived, male/female, young/old, etc.) and their use of and engagement with UGBS.
5. Conclusions
The overall aim of the research presented here was to investigate the UGBS preferences of diverse populations living in urban areas such as Edinburgh, and the UGBS they visit. We set out to answer the following research questions:
- Who visits UGBS in the city, what UGBS do they visit and/or avoid, how do they get there, and what activities do they engage in?
- Are the UGBS visited and/or avoided distinguishable by demographics?
- What are the characteristics of UGBS that attracts people and that people dislike?
The overall aim was addressed principally by using Maptionnaire to gather data to inform practice at a detailed level for the improvement of UGBS. We combined data to generate a series of maps showing visitor patterns, illustrating how visitors physically access, use, and engage with UGBS in Edinburgh. We found a range of different preferences for use of UGBS, and that no UGBS area is likely to accommodate all these different preferences in a relatively small geographical area.
Investigating Research Question 1, our research revealed key findings about visitor profiles and visiting patterns of respondents’ UGBS use, thus also highlighting the groups that are currently not visiting UGBS very often and therefore unlikely to be fully benefitting from the positive health benefits associated with the use of UGBS. The typical user profile indicated a demographic skew towards females, aged between 55-64, predominantly white, married or cohabiting, without disabilities, in paid work or retired, and with an annual income of £37,000 or above. Visiting patterns exhibited diversity, with respondents often engaging in activities such as walking with or without a dog, watching wildlife of other quiet activities, or socialising. Participants primarily walked to the UGBS they visited, and visited at least once a week for 30 minutes to 1 hour.
In addressing Research Question 2, our investigation focused on discerning the types of UGBS visited or avoided, based on demographics. The majority of respondents reside in affluent areas, while residents from deprived areas are under-represented in UGBS visitation. Individuals in areas of high deprivation tend to rely on local UGBS for potential salutogenic benefits, yet they also explicitly avoid more local areas, suggesting a limited consideration of spaces beyond their neighborhood.
Analysis of usage clusters revealed no obvious income-related patterns, with the main distinction being that higher-income respondents are more likely to engage in UGBS activities than lower-income individuals. Age-related clusters were not evident, but notable was that respondents aged 65 and older also ventured away from the city center, visiting more natural UGBS.
Furthermore, our findings highlighted gender differences, with women more likely to avoid UGBS than men. Interestingly, the level of avoidance was not correlated with the deprivation level of the UGBS location. Areas avoided by females were evenly spread across the city, suggesting a perception of more areas as potentially unsafe or of poor quality, compared to males. These insights contribute to a nuanced understanding of demographic influences on UGBS utilisation and avoidance patterns.
Addressing Research Question 3, we examined perceived barriers and facilitators to UGBS use. Respondents commonly cited ‘dogs/dog owners’, ‘toilet facilities’, and ‘littering’ as barriers, yet some viewed the presence of off-lead dogs and the absence of toilets and changing facilities as facilitators. E.g., for some, being able to take you dog off the lead was a facilitator, whereas for others dogs off the lead was seen as a barrier. Also, for some, the lack of toilet facilities and cafés was a barrier, whereas for others it was the provision of such facilities that was seen as a barrier, as it would attract too many visitors, in particular families or groups with children.
Broad agreement emerged on two major facilitators: open space/open views (prospect) and defined areas catering to various activities. However, these were also seen as barriers by some, due to accessibility issues and concerns about biodiversity and wildlife disturbance (i.e., wild nature for some is inaccessible; prospect might limit the abundance of biodiversity and feeling of wild, undisturbed nature; loud children and dogs off the lead might scare away wildlife etc.).
Despite these nuances, overall satisfaction was high among respondents after visiting Edinburgh’s’ UGBS. The positive experiences were attributed to factors such as transport links, walking conditions, visual quality, and the quantity and quality of vegetation. Respondents reported feeling relaxed, energized, and connected with nature after their visits, highlighting the importance of diverse amenities and well-maintained environments in enhancing UGBS user engagement and experiences.
We found constraints to visiting UGBS at a distance from home to be stronger for those living in more deprived areas, compared with those whose homes are in les deprived areas. For those living in deprived areas, this may be exacerbated by a poorer quality of the UGBS close to their homes, meaning that some of these local UGBS are also places which these respondents avoid. Such barriers need to be addressed by including local communities in the decision-making process, and developing future research with a focus on how to engage underrepresented and hard to reach groups, ensuring equity in use and benefit from UGBS. Such actions constitute the next phase of CEC’'s work in taking the Thriving Green Spaces project forward.
CRediT Author Contributions
Conceptualization, Simon Bell and Catharine Thompson; Data curation, Charlotte Wendelboe-Nelson; Formal analysis, Charlotte Wendelboe-Nelson and Yiyun Wang; Funding acquisition, Catharine Thompson; Investigation, Charlotte Wendelboe-Nelson and Yiyun Wang; Methodology, Charlotte Wendelboe-Nelson, Yiyun Wang and Catharine Thompson; Project administration, Catharine Thompson; Supervision, Simon Bell and Catharine Thompson; Validation, Charlotte Wendelboe-Nelson; Visualization, Charlotte Wendelboe-Nelson and Craig McDougall; Writing – original draft, Charlotte Wendelboe-Nelson; Writing – review & editing, Simon Bell, Craig McDougall and Catharine Thompson. All authors have read and agreed to the published version of the manuscript.
Funding
Financial support for the project leading to this publication was provided by CEC, who secured funding as lead partner for the TGS project from the Future Parks (FP) Accelerator project grant, in partnership with Edinburgh and Lothians Greenspace Trust, Scottish Wildlife Trust, greenspace scotland, Edinburgh Green Spaces Forum, and the University of Edinburgh. FP is a joint venture between The Heritage Lottery Fund, the National Trust (NT) and the Department for Levelling Up, Housing and Communities (https://www.futureparks.org.uk/), to provide funding to preserve the future of the UK’s urban parks and green-blue spaces. NAME OF FUNDER, City of Edinburgh Council, contract no. C15112
Data Availability Statement
The data presented in this study are available on request from the corresponding author
Acknowledgments
A series of projects was undertaken in collaboration between the TGS project and students on the Landscape and Wellbeing Master programme at the University of Edinburgh, as part of their dissertation. Part of the research presented here was undertaken by one of these students, Yiyun Wang, supervised by SB and CWN. Content of the survey was developed by the student together with her supervisors and staff from CEC. The ‘vision’ data was collected by CEC, using a Maptionnaire approach, with support and advice from the authors of the paper.
Conflicts of Interest
The authors declare no conflict of interest
Appendix A. Map of Edinburgh’s green/blue spaces
Green/blue spaces Edinburgh: 1 Craigmillar Castle Park; 2 Inch Park; 3 The braid hills golf course; 4 Craiglockhart Hills; 5 Union Canal; 6 Holyrood Park; 7 The Meadows; 8 Princes Street Gardens; 9 Inverleith Park; 10 Harrison Park; 11 Saughton Park; 12 Corstorphine Hill; 13 Cammo Park; 14 Cramond Seafront; 15 Silverknowes Esplanade; 16 Granton Crescent Park; 17 Wardie Bay; 18 Leith Links; 19 Portobello beach; 20 Pentland Hills; 21 Calton Hills; 22 Victoria Park; 23 Hermitage of Braid and Blackford Hill
Appendix B. Maptionnaire Questionnaire
Figure B1.
Opening question of the TGS Maptionnaire survey; ‘Do you ever visit parks or open spaces?
Figure B1.
Opening question of the TGS Maptionnaire survey; ‘Do you ever visit parks or open spaces?
Figure B2.
For the map based part of the TGS Maptionnaire survey, the respondents were asked to mark the area where they live, UGBS they visit most often, and UGBS they avoid visiting.
Figure B2.
For the map based part of the TGS Maptionnaire survey, the respondents were asked to mark the area where they live, UGBS they visit most often, and UGBS they avoid visiting.
To investigate further what aspects were regarded as satisfactory when visiting UGBS, and if certain aspects, or the lack thereof, detracted from the visitor experience, a series of questions were asked relate to each UGBS visited: Q1. Are there toilet facilities in or near the green space? If any, are they usually open (before the lockdown)? Q2. Is the toilet equipped for changing babies or for those with disabilities or special needs? Q3. Does the provision of toilet facilities influence your decision to visit the green space? Q4. Are there cafes in or near the green space? Q5. Does the provision of cafes influence your decision to visit the green space? Q6. Are there shelters from the rain in the green space? Q7. Are there adequate information or sign boards in and near the green space? Q8.Are the information sign boards translated into different languages? Q9. Are there special signs provided for people with disabilities in and near the green space.

Table B1.
For each UGBS the respondents visited often, they were asked a selection of questions to elicit information regarding visiting patterns and habits.
Table B1.
For each UGBS the respondents visited often, they were asked a selection of questions to elicit information regarding visiting patterns and habits.
| Q1. In the last 6 months, how often, on average, did you visit? | Q2. Considering the impact of the recent lockdown. Where you able to keep visiting this place as part of your daily exercise allowance? | Q3. How do you travel there? | Q4. How do you visit? | Q5. How long does you visit usually last? | Q6. What do you usually do there? |
|---|---|---|---|---|---|
| Every day | No | Walk | On my own | <30 minutes | Walking with/without a dog |
| Several times a week | Yes | Cycle | Whit my partner and friend | 30 minute to 1 hour | Cycling/mountain biking |
| Once a week | If yes, did you visit more or less frequently than pre lockdown? | By car | With family | 1 to 2 hours | Running/Jogging |
| Once or twice a month | By bus | In a group | 2 to 3 hours | Playing with children | |
| A few times in the last 6 months | By tram | 3 to 4 hours | Informal games and sports (e.g. Frisbee, Football, volleyball etc.) | ||
| Not in the last 6 months | Other | 4 to 5 hours | Through route/commuting | ||
| If other, please specify | 5 to 8 hours | Eating or drinking | |||
| >8 hours | Picnic/barbecue | ||||
| Visiting an attraction or even (e.g. museum, market, art, concert etc.) | |||||
| Art, photography, or similar hobbies | |||||
| Sunbathing | |||||
| Quiet activities (e.g. reading, meditating) | |||||
| Watching wildlife | |||||
| Participating in voluntary activities e.g. Friends of Parks or other groups | |||||
| Others |
Table B2.
For each of the UGBS the respondents visited often, they were asked a selection of questions to elicit information regarding the UGBS facilities.
Table B2.
For each of the UGBS the respondents visited often, they were asked a selection of questions to elicit information regarding the UGBS facilities.
| Questions | Answer options | ||
|---|---|---|---|
| Q1. Are there toilet facilities in or near the green space? | Yes | No | Don’t know |
| If any, are they usually open (before the lockdown)? | Yes | No | - |
| Q2. If there are any toilets, are they equipped for changing babies or for those with disabilities or special needs? | Yes | No | Don’t know |
| Q3. Does the provision of toilet facilities influence your decision to visit the green space? | Yes | No | - |
| Q4. Are there cafes in or near the green space? | Yes | No | Don’t know |
| Q5. Does the provision of cafes influence your decision to visit the green space? | Yes | No | - |
| Q6. Are there shelters from the rain in the green space? | Yes | No | Don’t know |
| Q7. Are there adequate information or sign boards in and near the green space? | Yes | No | Don’t know |
| Q8. Are the information sign boards translated into different languages? | Yes | No | Don’t know |
| Q9. Are there special signs provided for people with disabilities in and near the green space? | Yes | No | Don’t know |
On a Likert scale, participants were asked to rate the following statements: Transport links to the site (1 Not well connected/bus stops or parking not very close - 5 Very convenient/bus stop and parking nearby); Walking to the site (quality of pavements, slopes, surfaces, street crossings) (1 Not very accessible - 5 Very easy to get to); Walking within the site (quality of pavements, slopes, surfaces) (1 Not very accessible - 5 Very easy to move around); Facilities (e.g. seating, play equipment, exercise equipment, toilets) (1 Poor or inadequate facilities - 5 Very good and very adequate facilities); Maintenance (litter collection, condition of equipment, mowing of grass etc.) (1 Not well maintained - 5 Very well maintained); Trees, shrubs and flowers – quantity and quality (1 Not enough trees, shrubs and flowers, poor condition - 5 Enough trees, shrubs and flowers, in good condition, attractive); Safety and security (sense of being threatened, poorly lit with dark places in winter evenings, signs of anti-social behaviour) (1 Feels rather unsafe - 5 Feels very safe); Visual quality (attractive overall appearance, views, plants, presence or absence of eyesores) (1 Poor visual quality - 5 Excellent visual quality); Connection with nature (1 Not connected - 5 Very connected); Interpretation or information provided at the place (1 Don’t know - 5 Very good); Information to help plan before you visit (e.g. website) (1 Don’t know - 5 Very good)
References
- World Health Organization. Regional Office for Europe. Urban green spaces and health. Copenhagen: World Health Organization. Regional Office for Europe; 2016. https://apps.who.int/iris/handle/10665/345751.
- Wittchen H-U, Jacobi F. Size and burden of mental disorders in Europe—a critical review and appraisal of 27 studies. European Neuropsychopharmacology. 2005;15(4):357–376. [CrossRef]
- Hubbard G, den Daas C, Johnston M, Dixon D. Sociodemographic and Psychological Risk Factors for Anxiety and Depression: Findings from the Covid-19 Health and Adherence Research in Scotland on Mental Health (CHARIS-MH) Cross-sectional Survey. International Journal of Behavioral Medicine. 2021;28(6):788–800. [CrossRef]
- Hardcastle K, Public Health Wales. How are we doing Wales? Public Engagement Survey on Health and Wellbeing during Coronavirus Measures. https://phw.nhs.wales/topics/latest-information-on-novel-coronavirus-covid-19/how-are-you-doing/how-are-we-doing-in-wales-reports/how-are-we-doing-by-demographics-report/.
- Hubbard G, Daas C den, Johnston M, Murchie P, Thompson CW, Dixon D. Are Rurality, Area Deprivation, Access to Outside Space, and Green Space Associated with Mental Health during the COVID-19 Pandemic? A Cross Sectional Study (CHARIS-E). International Journal of Environmental Research and Public Health. 2021;18(8):3869. [CrossRef]
- Burnett H, Olsen JR, Nicholls N, Mitchell R. Change in time spent visiting and experiences of green space following restrictions on movement during the COVID-19 pandemic: a nationally representative cross-sectional study of UK adults. BMJ Open. 2021;11(3):e044067. [CrossRef]
- Hubbard G, Daas C den, Johnston M, Murchie P, Thompson CW, Dixon D. Are Rurality, Area Deprivation, Access to Outside Space, and Green Space Associated with Mental Health during the COVID-19 Pandemic? A Cross Sectional Study (CHARIS-E). International Journal of Environmental Research and Public Health. 2021;18(8):3869. [CrossRef]
- Hubbard G, den Daas C, Johnston M, Dixon D. Sociodemographic and Psychological Risk Factors for Anxiety and Depression: Findings from the Covid-19 Health and Adherence Research in Scotland on Mental Health (CHARIS-MH) Cross-sectional Survey. International Journal of Behavioral Medicine. 2021;28(6):788–800. [CrossRef]
- Sallis JF, Cervero RB, Ascher W, Henderson KA, Kraft MK, Kerr J. An Ecological Approach to Creating Active Living Communities. Annual Review of Public Health. 2006;27(1):297–322. [CrossRef]
- Velarde MD, Fry G, Tveit M. Health effects of viewing landscapes – Landscape types in environmental psychology. Urban Forestry & Urban Greening. 2007;6(4):199–212. [CrossRef]
- Bratman GN, Hamilton JP, Hahn KS, Daily GC, Gross JJ. Nature experience reduces rumination and subgenual prefrontal cortex activation. Proceedings of the national academy of sciences. 2015;112(28):8567–8572. [CrossRef]
- Gidlow CJ, Jones MV, Hurst G, Masterson D, Clark-Carter D, Tarvainen MP, Smith G, Nieuwenhuijsen M. Where to put your best foot forward: Psycho-physiological responses to walking in natural and urban environments. Journal of Environmental Psychology. 2016;45:22–29. [CrossRef]
- Berman MG, Jonides J, Kaplan S. The Cognitive Benefits of Interacting With Nature. Psychological Science. 2008;19(12):1207–1212. [CrossRef]
- Berman MG, Kross E, Krpan KM, Askren MK, Burson A, Deldin PJ, Kaplan S, Sherdell L, Gotlib IH, Jonides J. Interacting with nature improves cognition and affect for individuals with depression. Journal of Affective Disorders. 2012;140(3):300–305. [CrossRef]
- Why Research, Ltd, Greenspace Scotland. Greenspace Use and Attitudes Survey 2017 Research findings. 2017. p. 1–68. https://www.greenflagaward.org/media/1209/greenspace-survey-2017-final-report_021017.pdf.
- Reid G. Managing budget cuts in Edinburgh’s sport and recreation services: progressive localism in a resilient local authority? International Journal of Sport Policy and Politics. 2018;10(1):113–129. [CrossRef]
- Lowndes V, Squires S. Cuts, collaboration and creativity. Public Money & Management. 2012;32(6):401–408. [CrossRef]
- Bramley G. Local Services Under Siege; attitudes to public services in a time of austerity. 2012 Apr 1 [accessed 2023 Feb 8].https://www.academia.edu/18196128/Local_Services_Under_Siege_attitudes_to_public_services_in_a_time_of_austerity.
- Picascia S, Mitchell R. Social integration as a determinant of inequalities in green space usage: Insights from a theoretical agent-based model. Health & Place. 2022;73:102729. [CrossRef]
- Mears M, Brindley P, Maheswaran R, Jorgensen A. Understanding the socioeconomic equity of publicly accessible greenspace distribution: The example of Sheffield, UK. Geoforum. 2019;103:126–137. [CrossRef]
- Ode Sang Å, Knez I, Gunnarsson B, Hedblom M. The effects of naturalness, gender, and age on how urban green space is perceived and used. Urban Forestry & Urban Greening. 2016;18. [CrossRef]
- Ode Sang Å, Sang N, Hedblom M, Sevelin G, Knez I, Gunnarsson B. Are path choices of people moving through urban green spaces explained by gender and age? Implications for planning and management. Urban Forestry & Urban Greening. 2020;49:126628. [CrossRef]
- Marselle, MR. Marselle MR. Theoretical Foundations of Biodiversity and Mental Well-being Relationships. In: Marselle MR, Stadler J, Korn H, Irvine KN, Bonn A, editors. Biodiversity and Health in the Face of Climate Change. Cham: Springer International Publishing; 2019. p. 133–158. [CrossRef]
- Lovell R, Wheeler BW, Higgins SL, Irvine KN, Depledge MH. A Systematic Review of the Health and Well-Being Benefits of Biodiverse Environments. Journal of Toxicology and Environmental Health, Part B. 2014;17(1):1–20. [CrossRef]
- Marselle MR, Hartig T, Cox DTC, de Bell S, Knapp S, Lindley S, Triguero-Mas M, Böhning-Gaese K, Braubach M, Cook PA, et al. Pathways linking biodiversity to human health: A conceptual framework. Environment International. 2021;150:106420. [CrossRef]
- Aronson MF, Lepczyk CA, Evans KL, Goddard MA, Lerman SB, MacIvor JS, Nilon CH, Vargo T. Biodiversity in the city: key challenges for urban green space management. Frontiers in Ecology and the Environment. 2017;15(4):189–196. [CrossRef]
- Brown G, Kyttä M. Key issues and priorities in participatory mapping: Toward integration or increased specialization? Applied Geography. 2018;95:1–8. [CrossRef]
- Fagerholm N, Raymond CM, Olafsson AS, Brown G, Rinne T, Hasanzadeh K, Broberg A, Kyttä M. A methodological framework for analysis of participatory mapping data in research, planning, and management. International Journal of Geographical Information Science. 2021;35(9):1848–1875. [CrossRef]
- Faunalia PC, Lami L. Free GIS desktop and analyses: QuantumGIS, the easy way. Geospatial World. 2010 [accessed 2023 Feb 8]. https://www.geospatialworld.net/article/free-gis-desktop-and-analyses-quantumgis-the-easy-way/.
- QGIS Development Team. Getting Started - QGIS User Guide. QGIS Geographic Information System. Open Source Geospatial Foundation Project. 2023 Feb 8 [accessed 2023 Feb 8]. https://docs.qgis.org/2.8/en/docs/user_manual/introduction/getting_started.html.
- Macintyre S, Macdonald L, Ellaway A. Do poorer people have poorer access to local resources and facilities? The distribution of local resources by area deprivation in Glasgow, Scotland. Social Science & Medicine (1982). 2008;67(6):900–914. [CrossRef]
- Comber A, Brunsdon C, Green E. Using a GIS-based network analysis to determine urban greenspace accessibility for different ethnic and religious groups. Landscape and Urban Planning. 2008;86(1):103–114. [CrossRef]
- Ward Thompson C. Activity, exercise and the planning and design of outdoor spaces. Journal of Environmental Psychology. 2013;34:79–96. [CrossRef]
- Floyd MF, Spengler JO, Maddock JE, Gobster PH, Suau LJ. Park-based physical activity in diverse communities of two U.S. cities. An observational study. American Journal of Preventive Medicine. 2008;34(4):299–305. [CrossRef]
- Floyd MF, Spengler JO, Maddock JE, Gobster PH, Suau LJ. Park-based physical activity in diverse communities of two U.S. cities. An observational study. American Journal of Preventive Medicine. 2008;34(4):299–305. [CrossRef]
- van Vliet E, Dane G, Weijs-Perrée M, van Leeuwen E, van Dinter M, van den Berg P, Borgers A, Chamilothori K. The Influence of Urban Park Attributes on User Preferences: Evaluation of Virtual Parks in an Online Stated-Choice Experiment. International Journal of Environmental Research and Public Health. 2021;18(1):212. [CrossRef]
- Andrews B, Ferrini S, Bateman I. Good parks – bad parks: the influence of perceptions of location on WTP and preference motives for urban parks. Journal of Environmental Economics and Policy. 2017;6(2):204–224. [CrossRef]
- Luo S, Xie J, Furuya K. Assessing the Preference and Restorative Potential of Urban Park Blue Space. Land. 2021;10(11):1233. [CrossRef]
- Local Government Association. Achieving integrated care through community and neighbourhood working. 2021. p. 1–21. https://www.local.gov.uk/sites/default/files/documents/25.184_High_Impact_Change_Model_guide_web%20accessible.pdf.
- CPRE, The countryside charity. Local Green Spaces 2023: Increasingly important for community well-being and nature recovery. 2023. p. 1–24. https://www.cpre.org.uk/wp-content/uploads/2023/10/Local-Green-Spaces-report.pdf.
Figure 1.
Survey respondents’ home location, divided according to Scottish Index of Multiple Deprivation (SIMD) quintile, from 1 (most deprived 20%) to 5 (least deprived 20%).
Figure 1.
Survey respondents’ home location, divided according to Scottish Index of Multiple Deprivation (SIMD) quintile, from 1 (most deprived 20%) to 5 (least deprived 20%).
Figure 2.
UGBS avoided (279) and visited (1629) by the 531 respondents taking part in the survey.
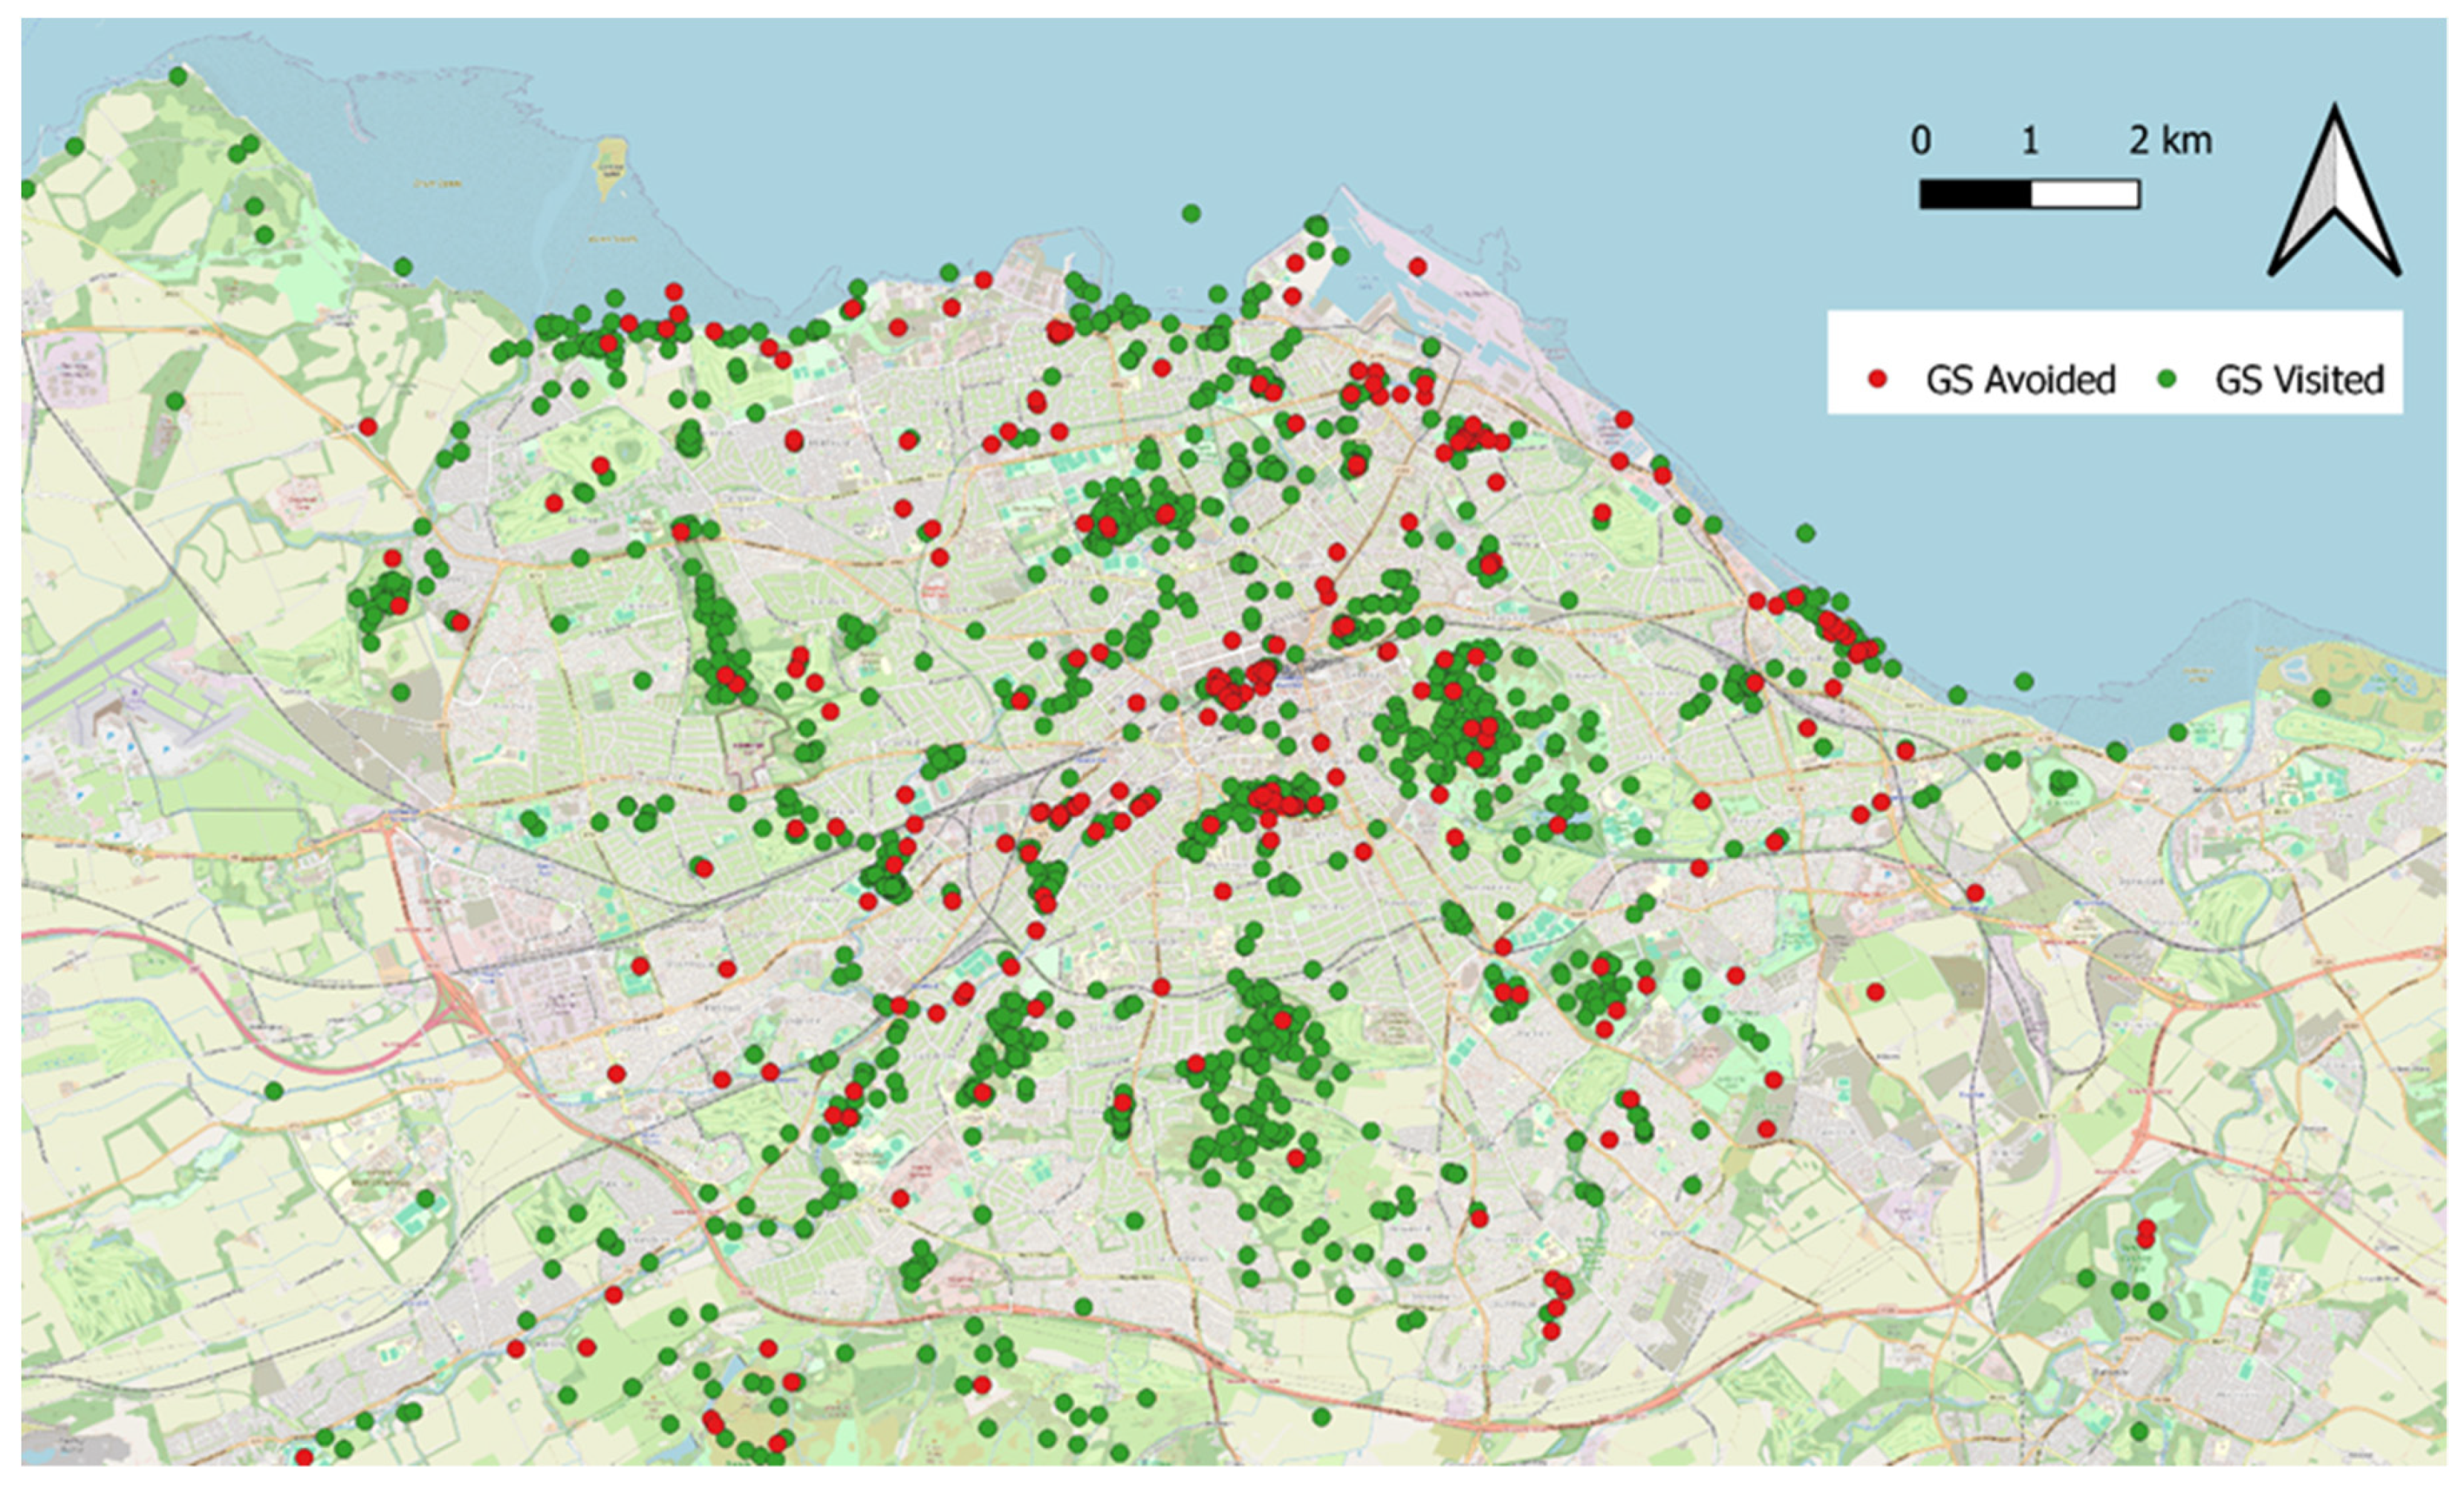
Figure 3.
The visit count of all the UGBS areas the survey respondents prefer to visit; the darker the blue colour, the more people have chosen the area as a place they like to visit. The map gives an overview of the extended Edinburgh area.
Figure 3.
The visit count of all the UGBS areas the survey respondents prefer to visit; the darker the blue colour, the more people have chosen the area as a place they like to visit. The map gives an overview of the extended Edinburgh area.
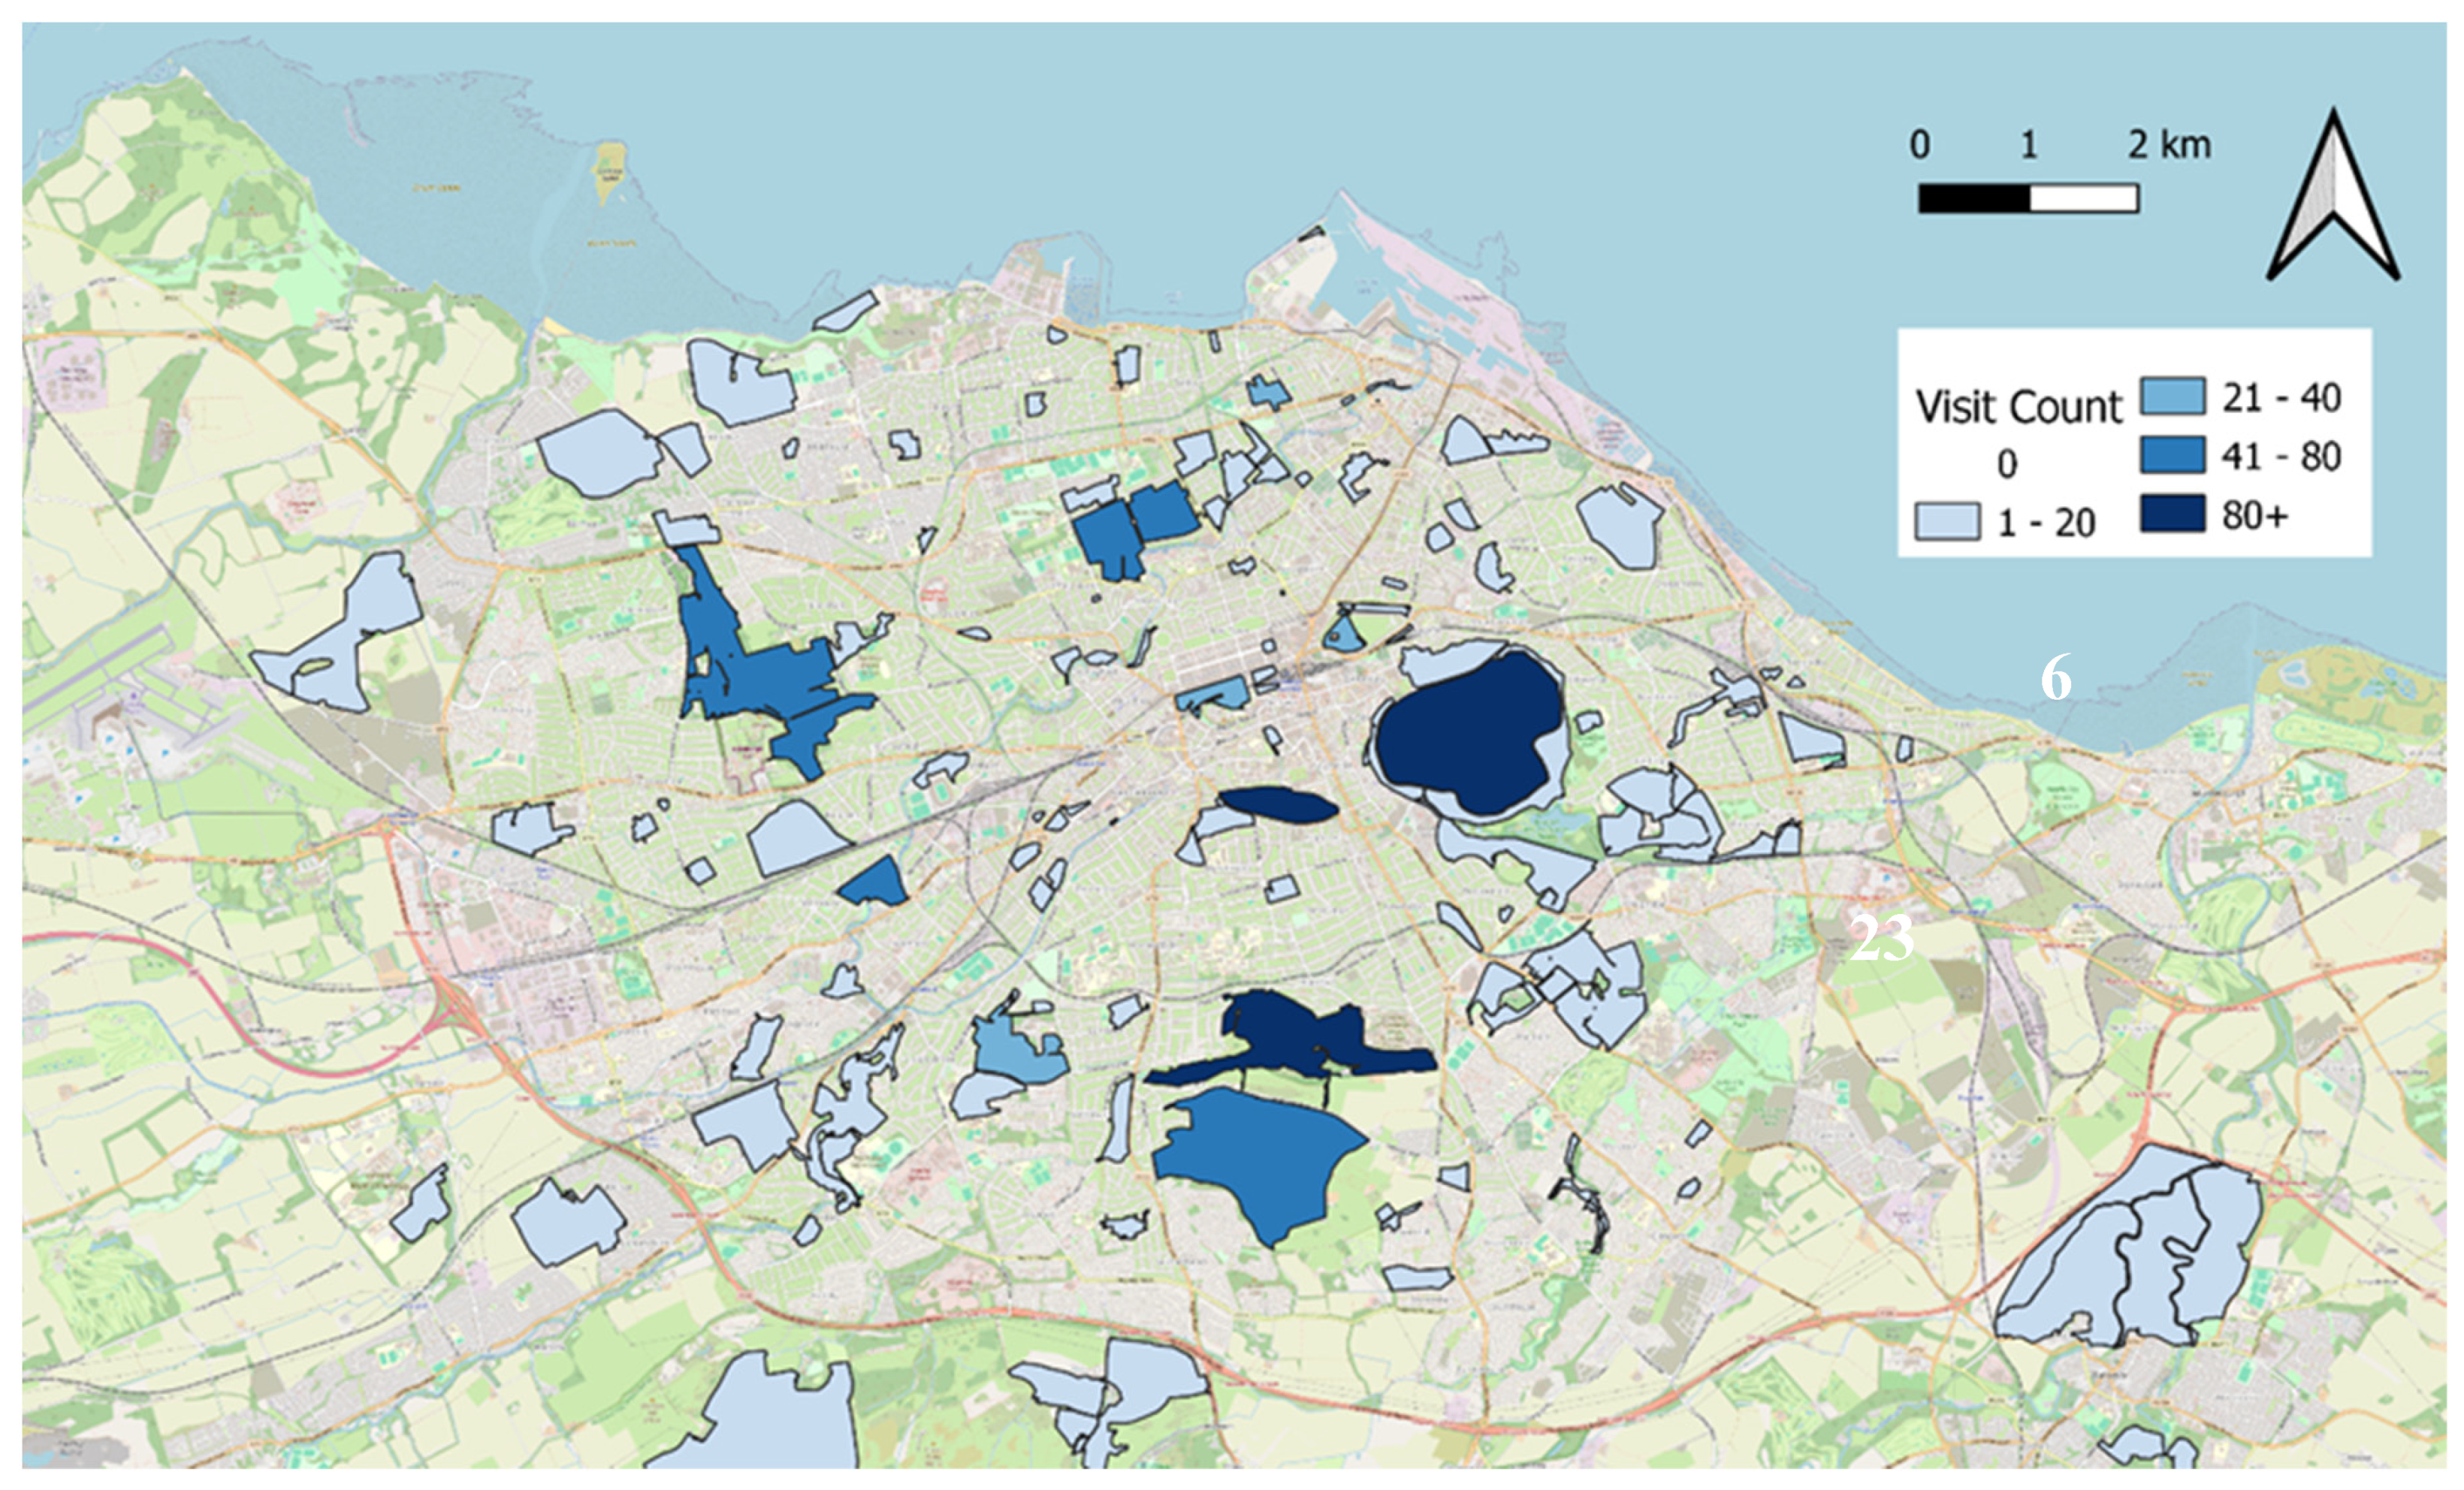
Figure 4.
The visit count of all the UGBS the survey respondents avoid visiting. The darker red colours reveal distinct areas that are avoided by the survey population.
Figure 4.
The visit count of all the UGBS the survey respondents avoid visiting. The darker red colours reveal distinct areas that are avoided by the survey population.
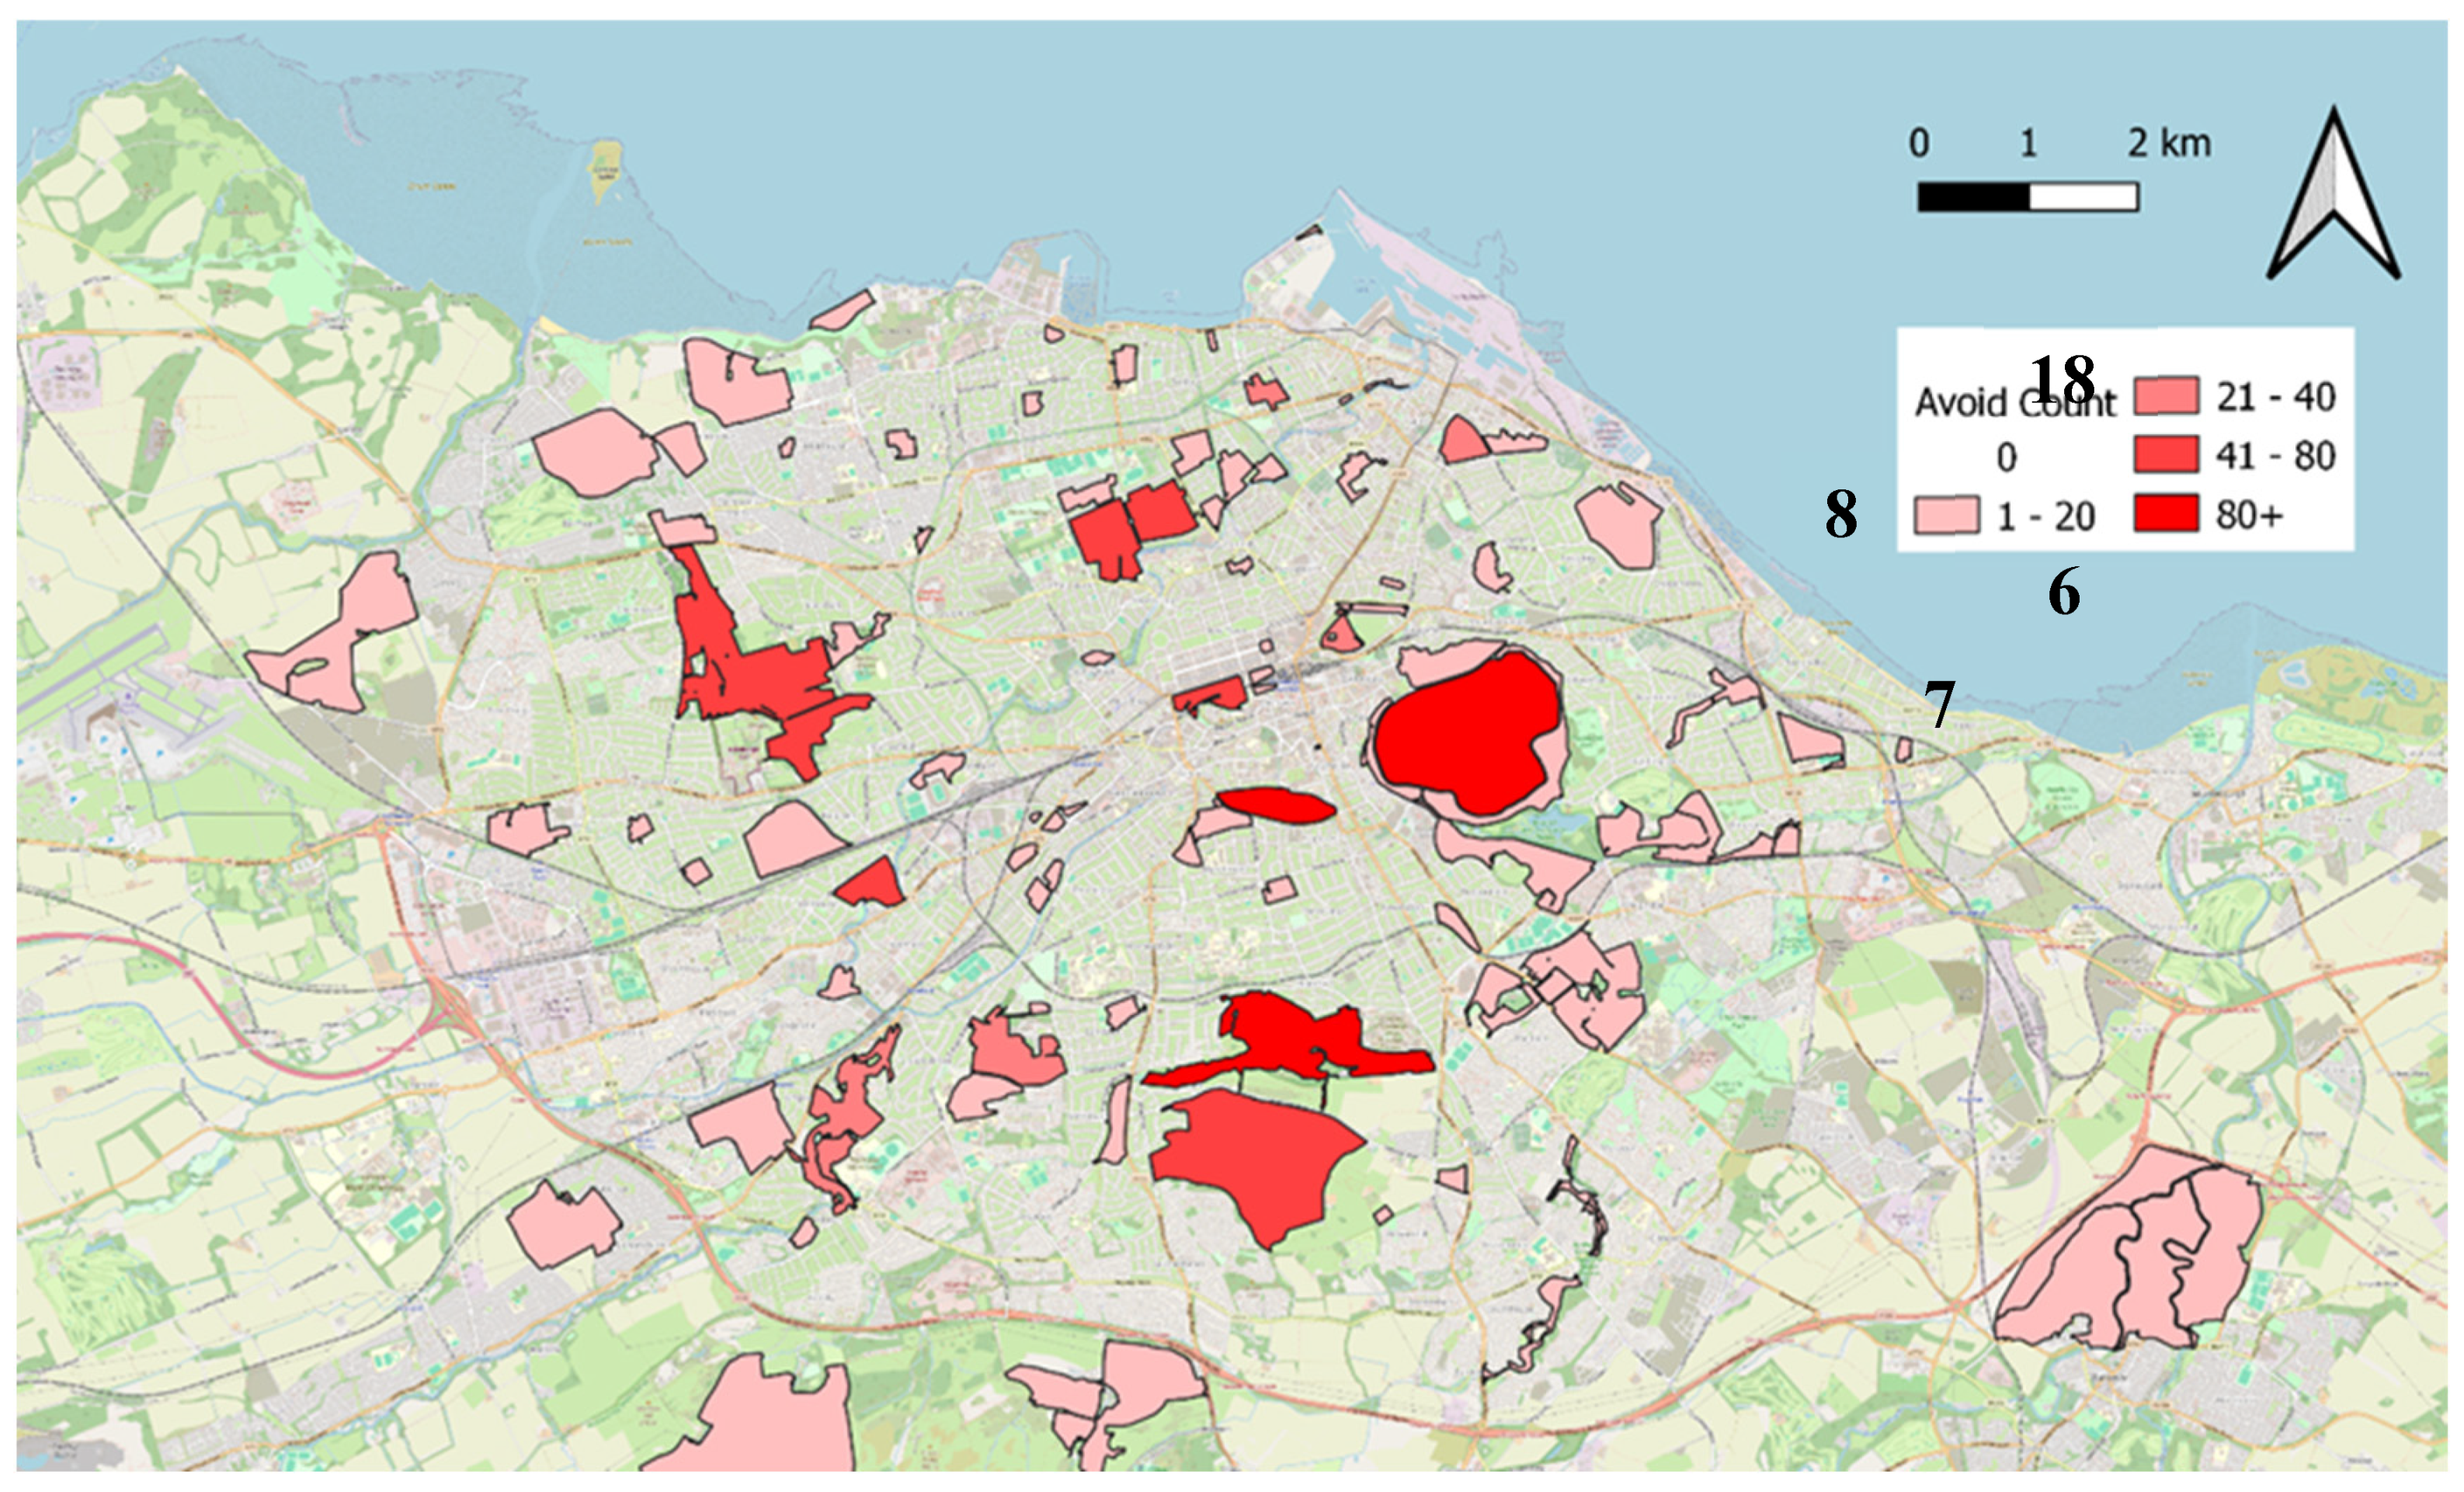
Figure 5.
a and b: Maps showing the SIMD level of the area where the respondents lived: Quintile 1 contains the 20% most deprived data zones in Scotland (pale yellow), and quintile 5 contains the 20% least deprived data zones (dark red). The four areas highlighted with circles/ovals are all contained within quintile 1. 5a: The respondents were asked to mark a place close to their home. 5b: The five UGBS respondents liked to visit. For each participant, their selected pins are coloured according to the SIMD level of their residence.
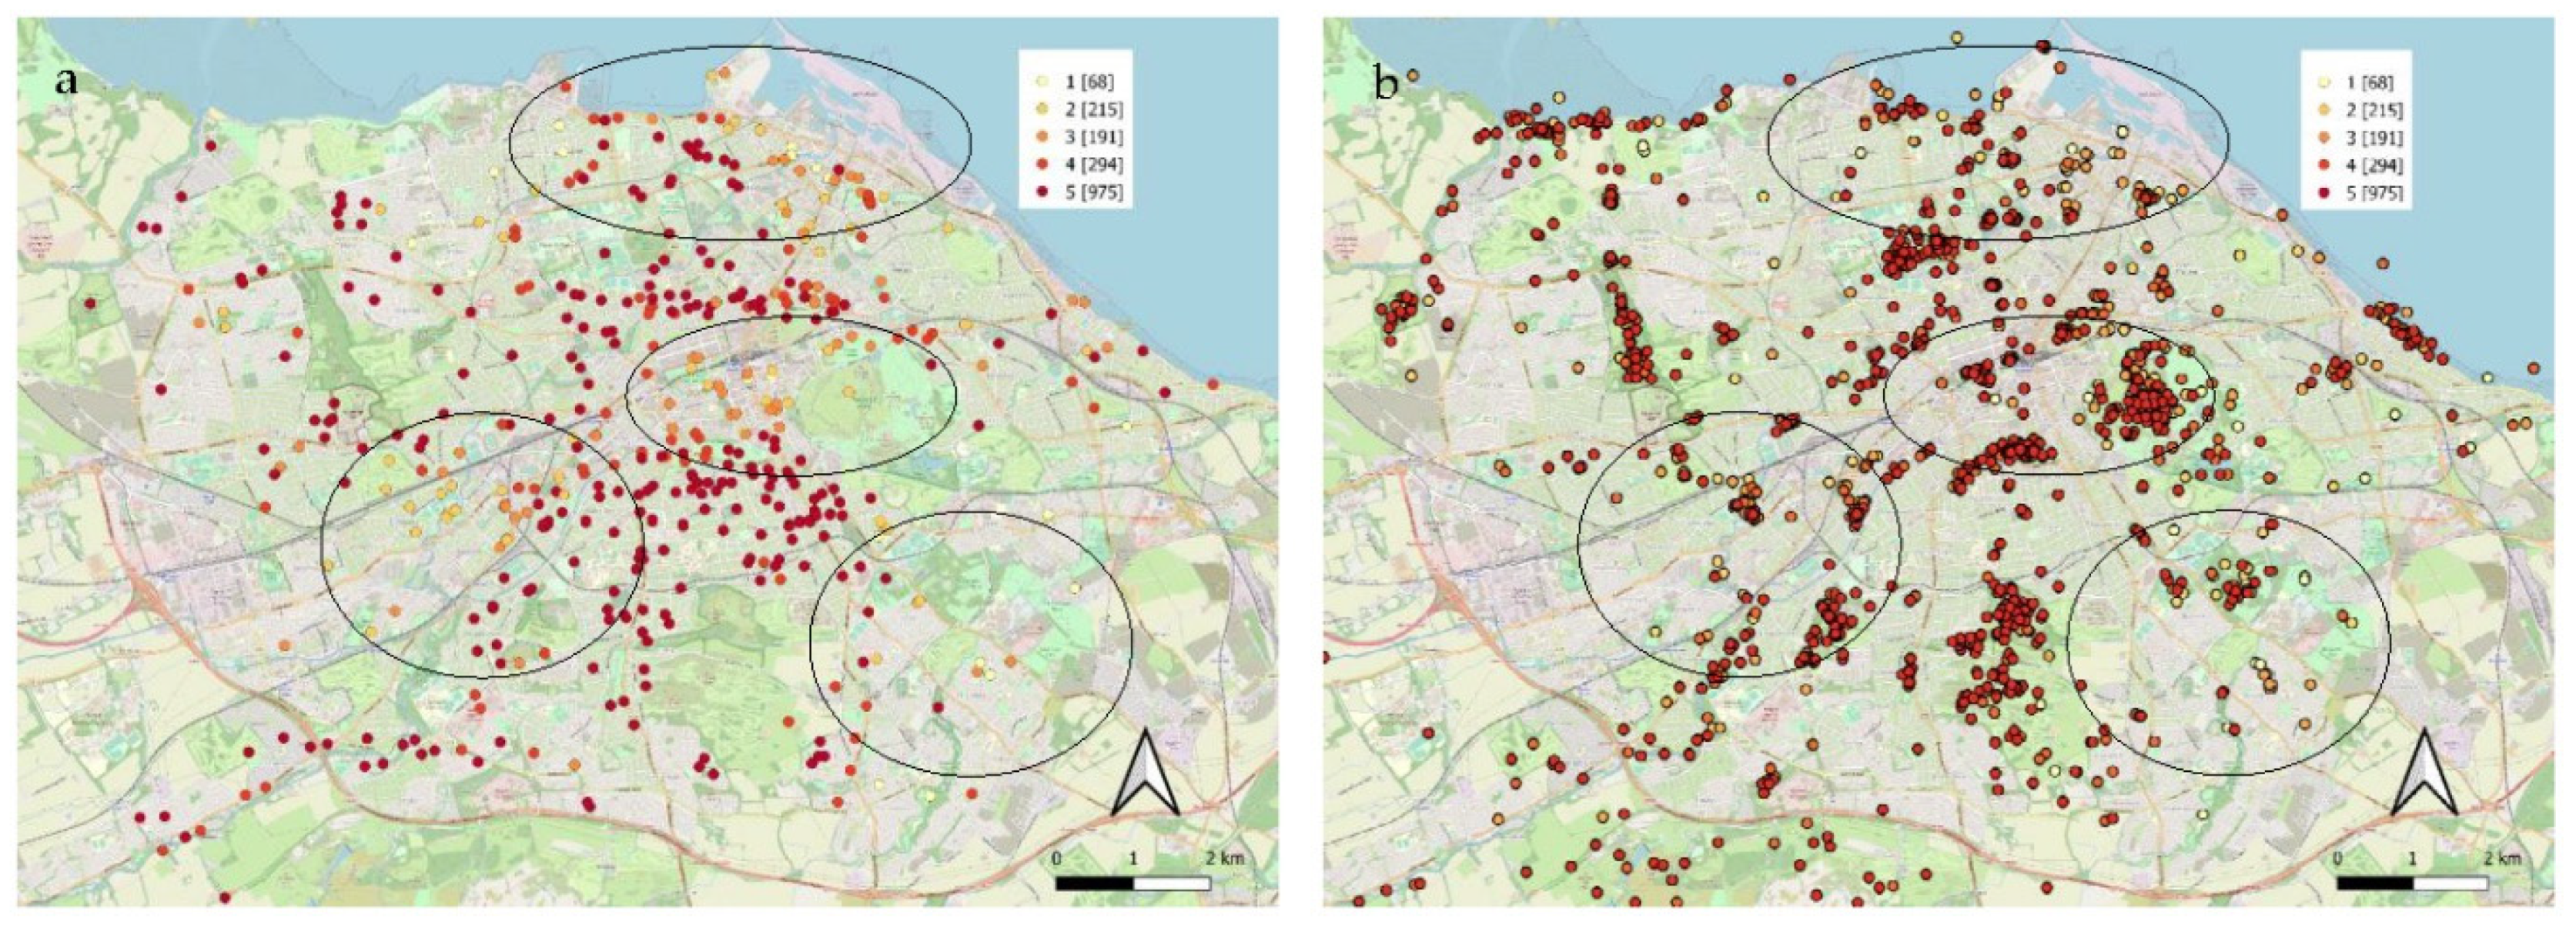
Figure 6.
a & b: a) shows distance from the respondents’ home to the UGBS they like visiting, with the visited spaces grouped according to SIMD category of their residence. b) shows distance from the respondents’ home to the UGBS they avoid visiting, with the avoided spaces grouped according to SIMD category of their residence.
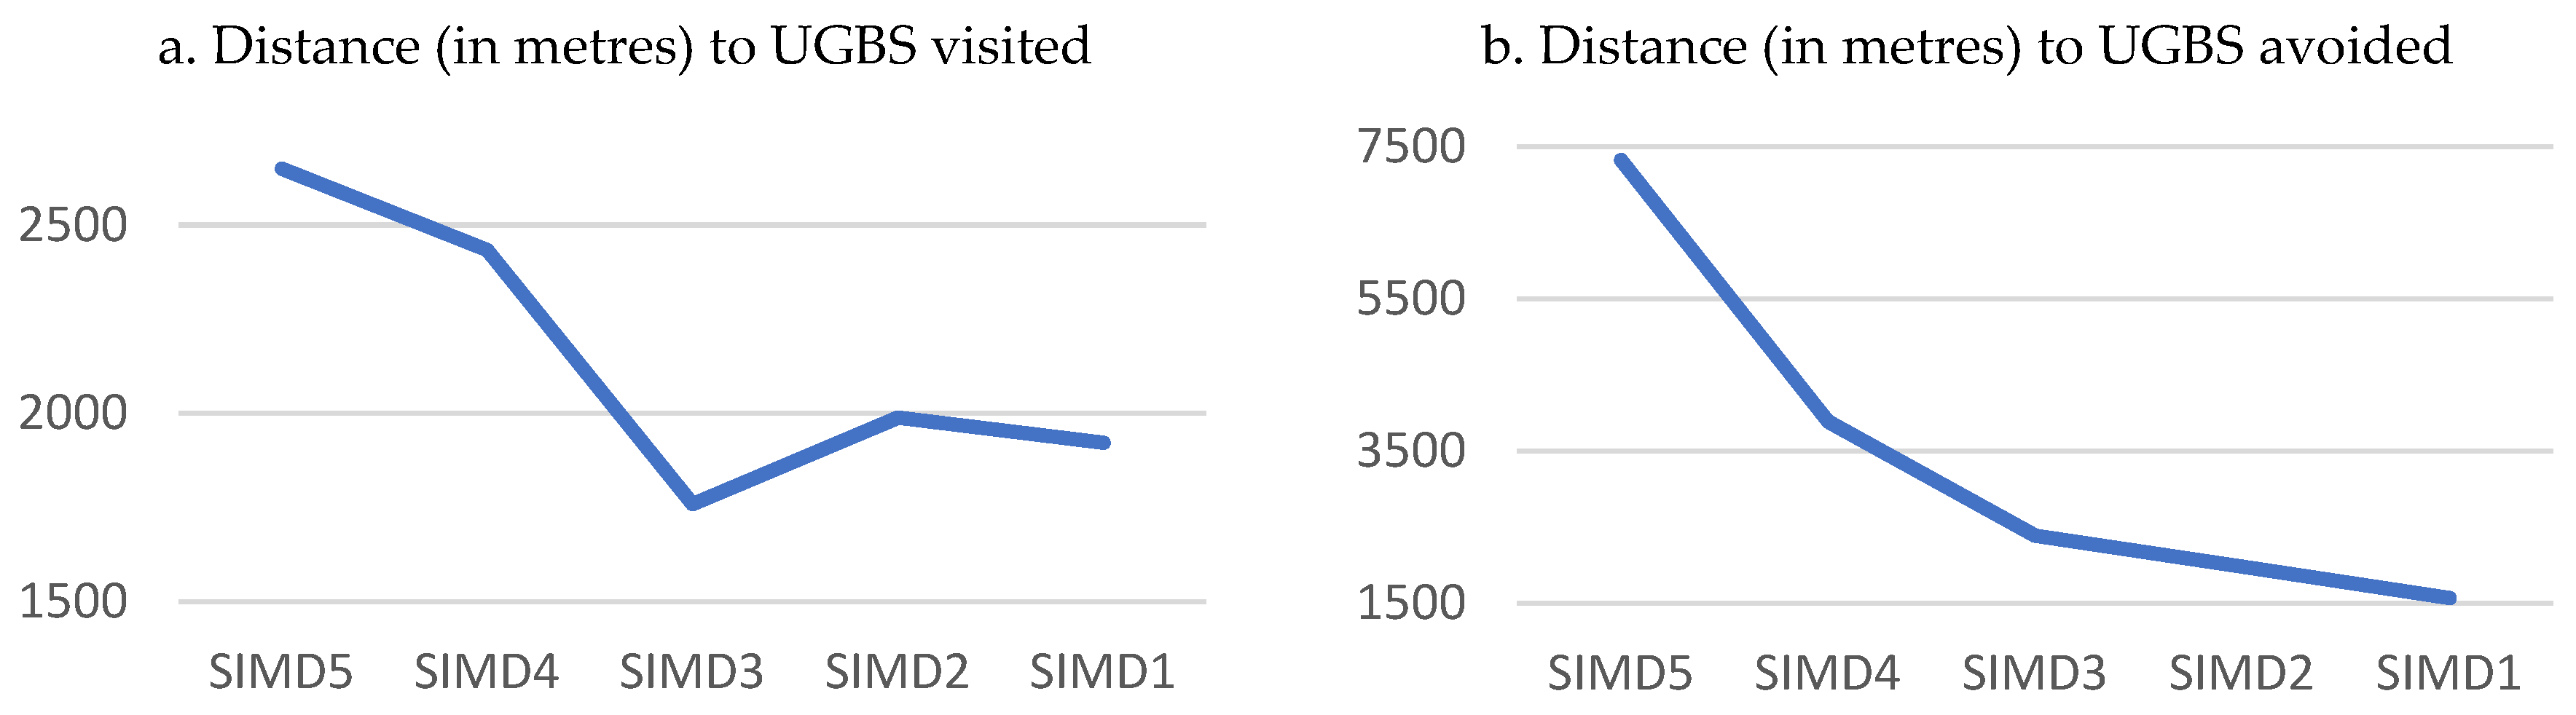
Figure 7.
The UGBS visited by respondents according to household income.
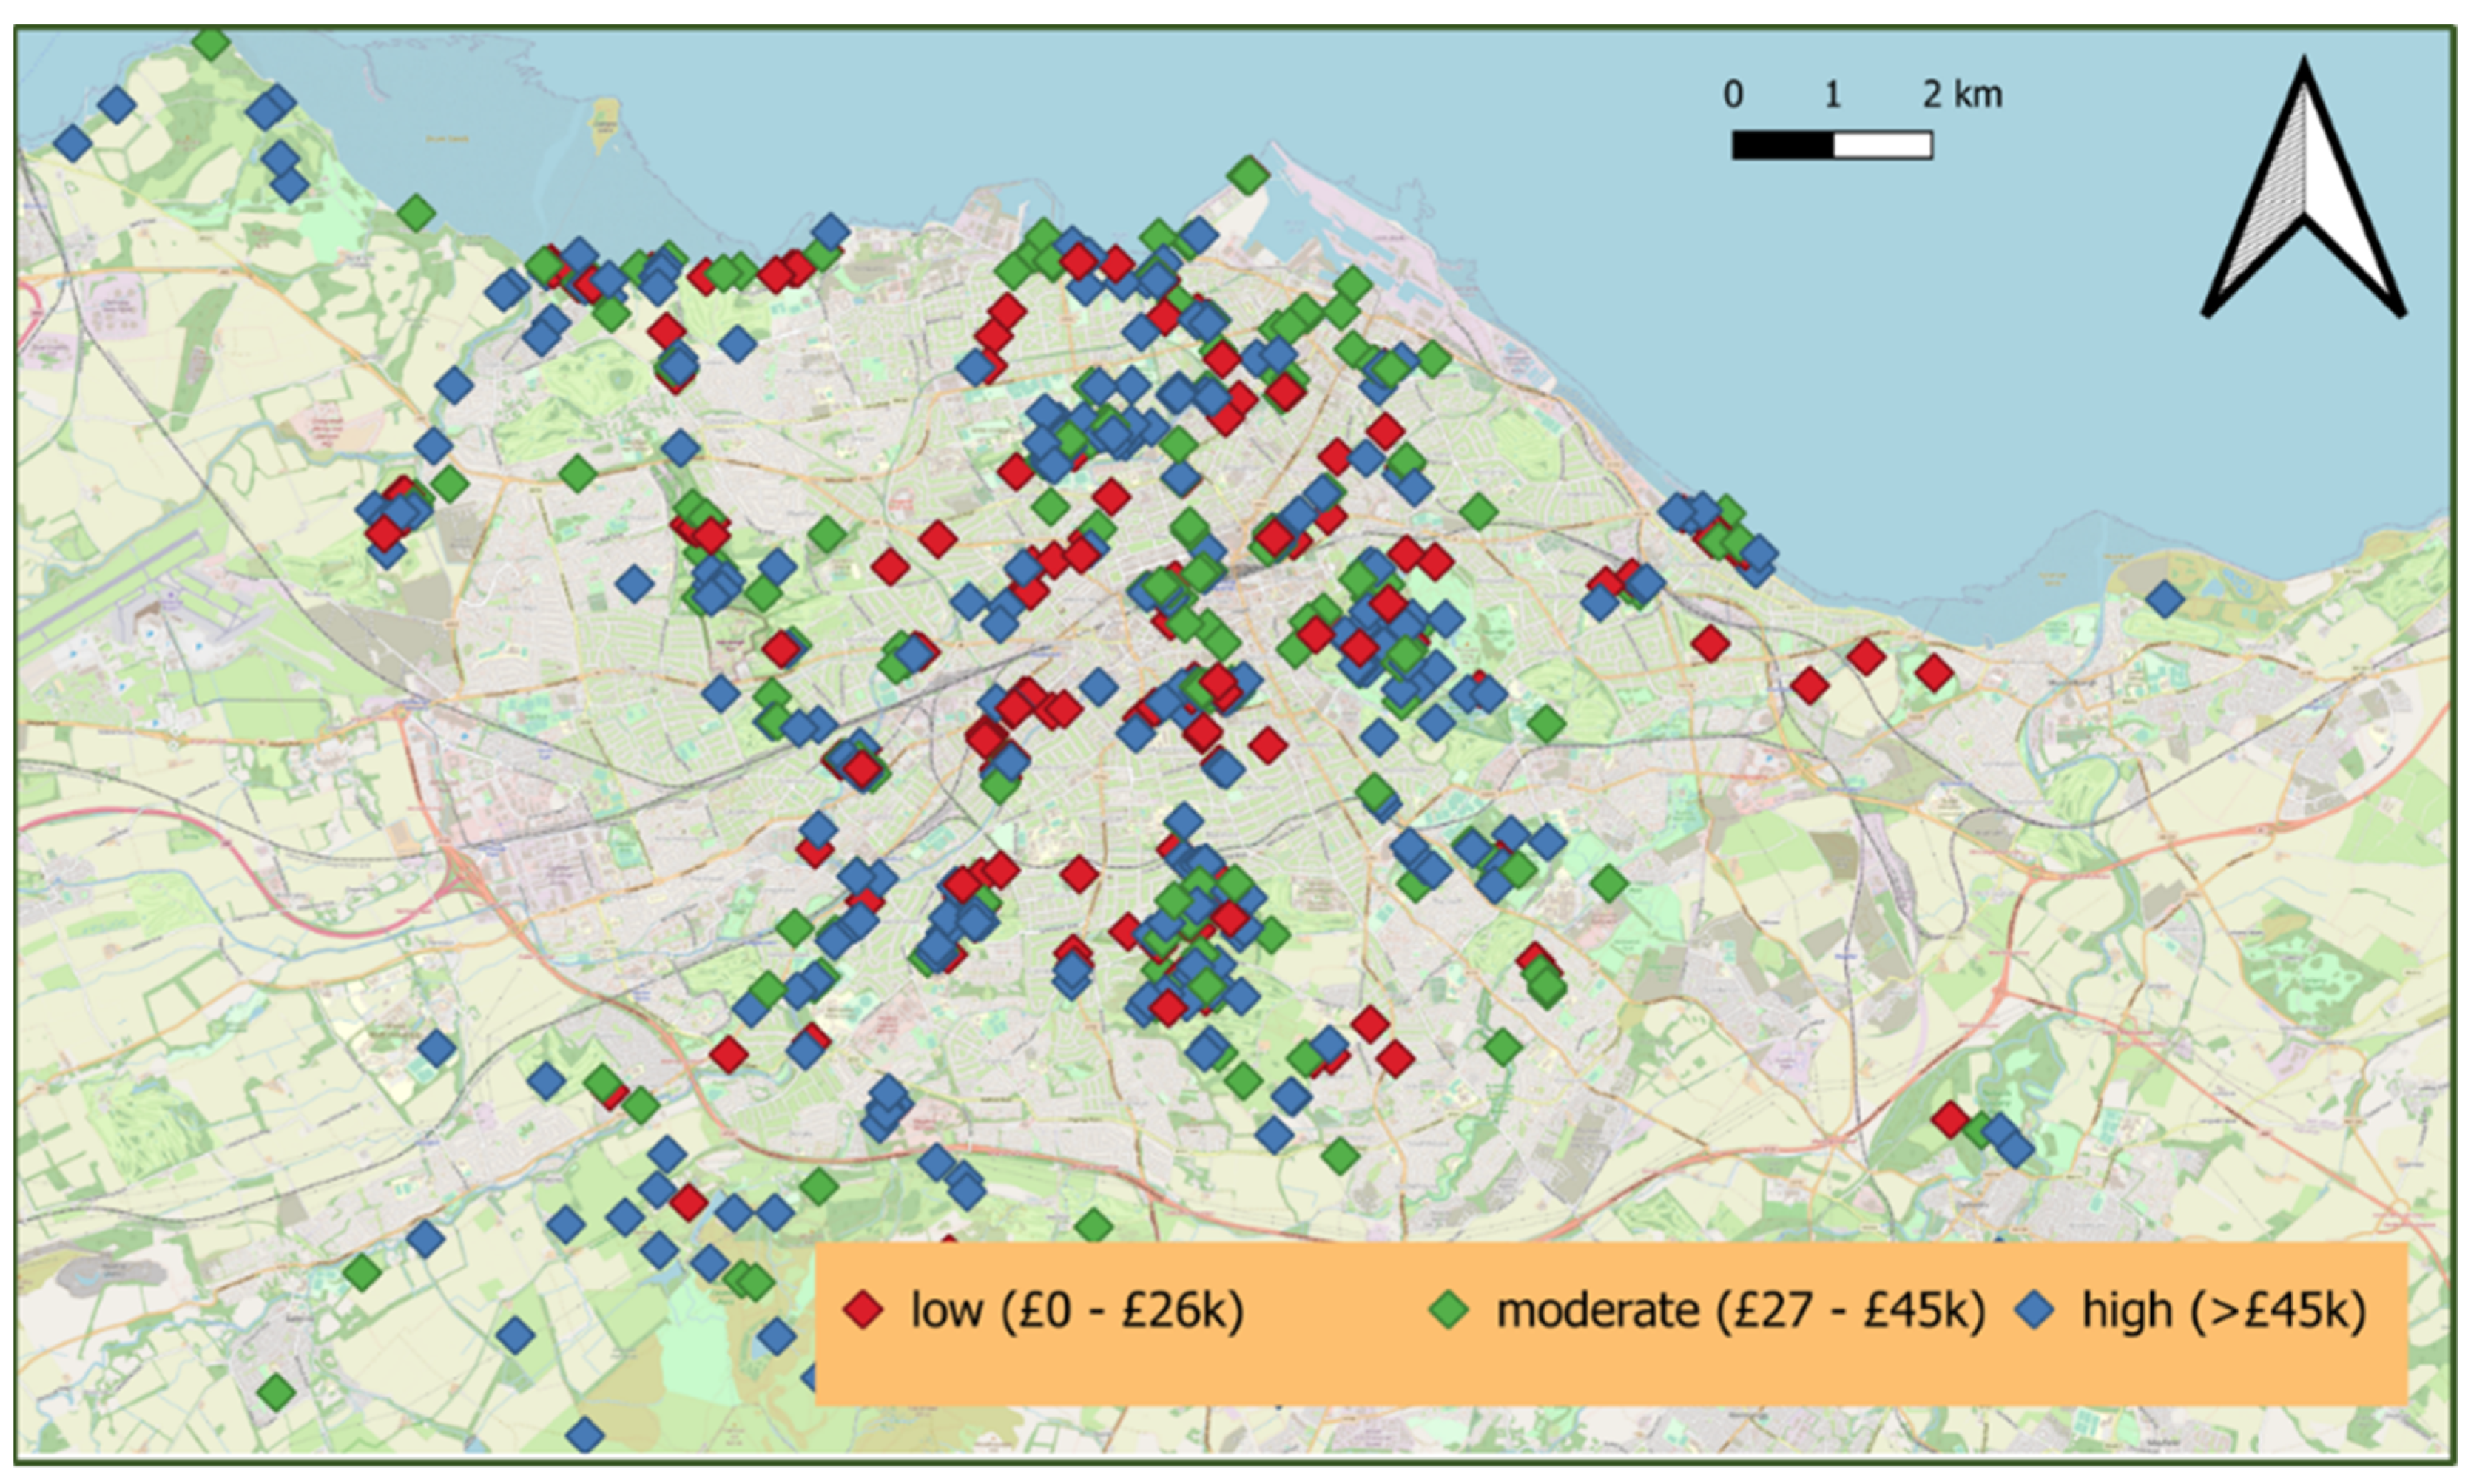
Figure 8.
The UGBS visited by respondents according to age.
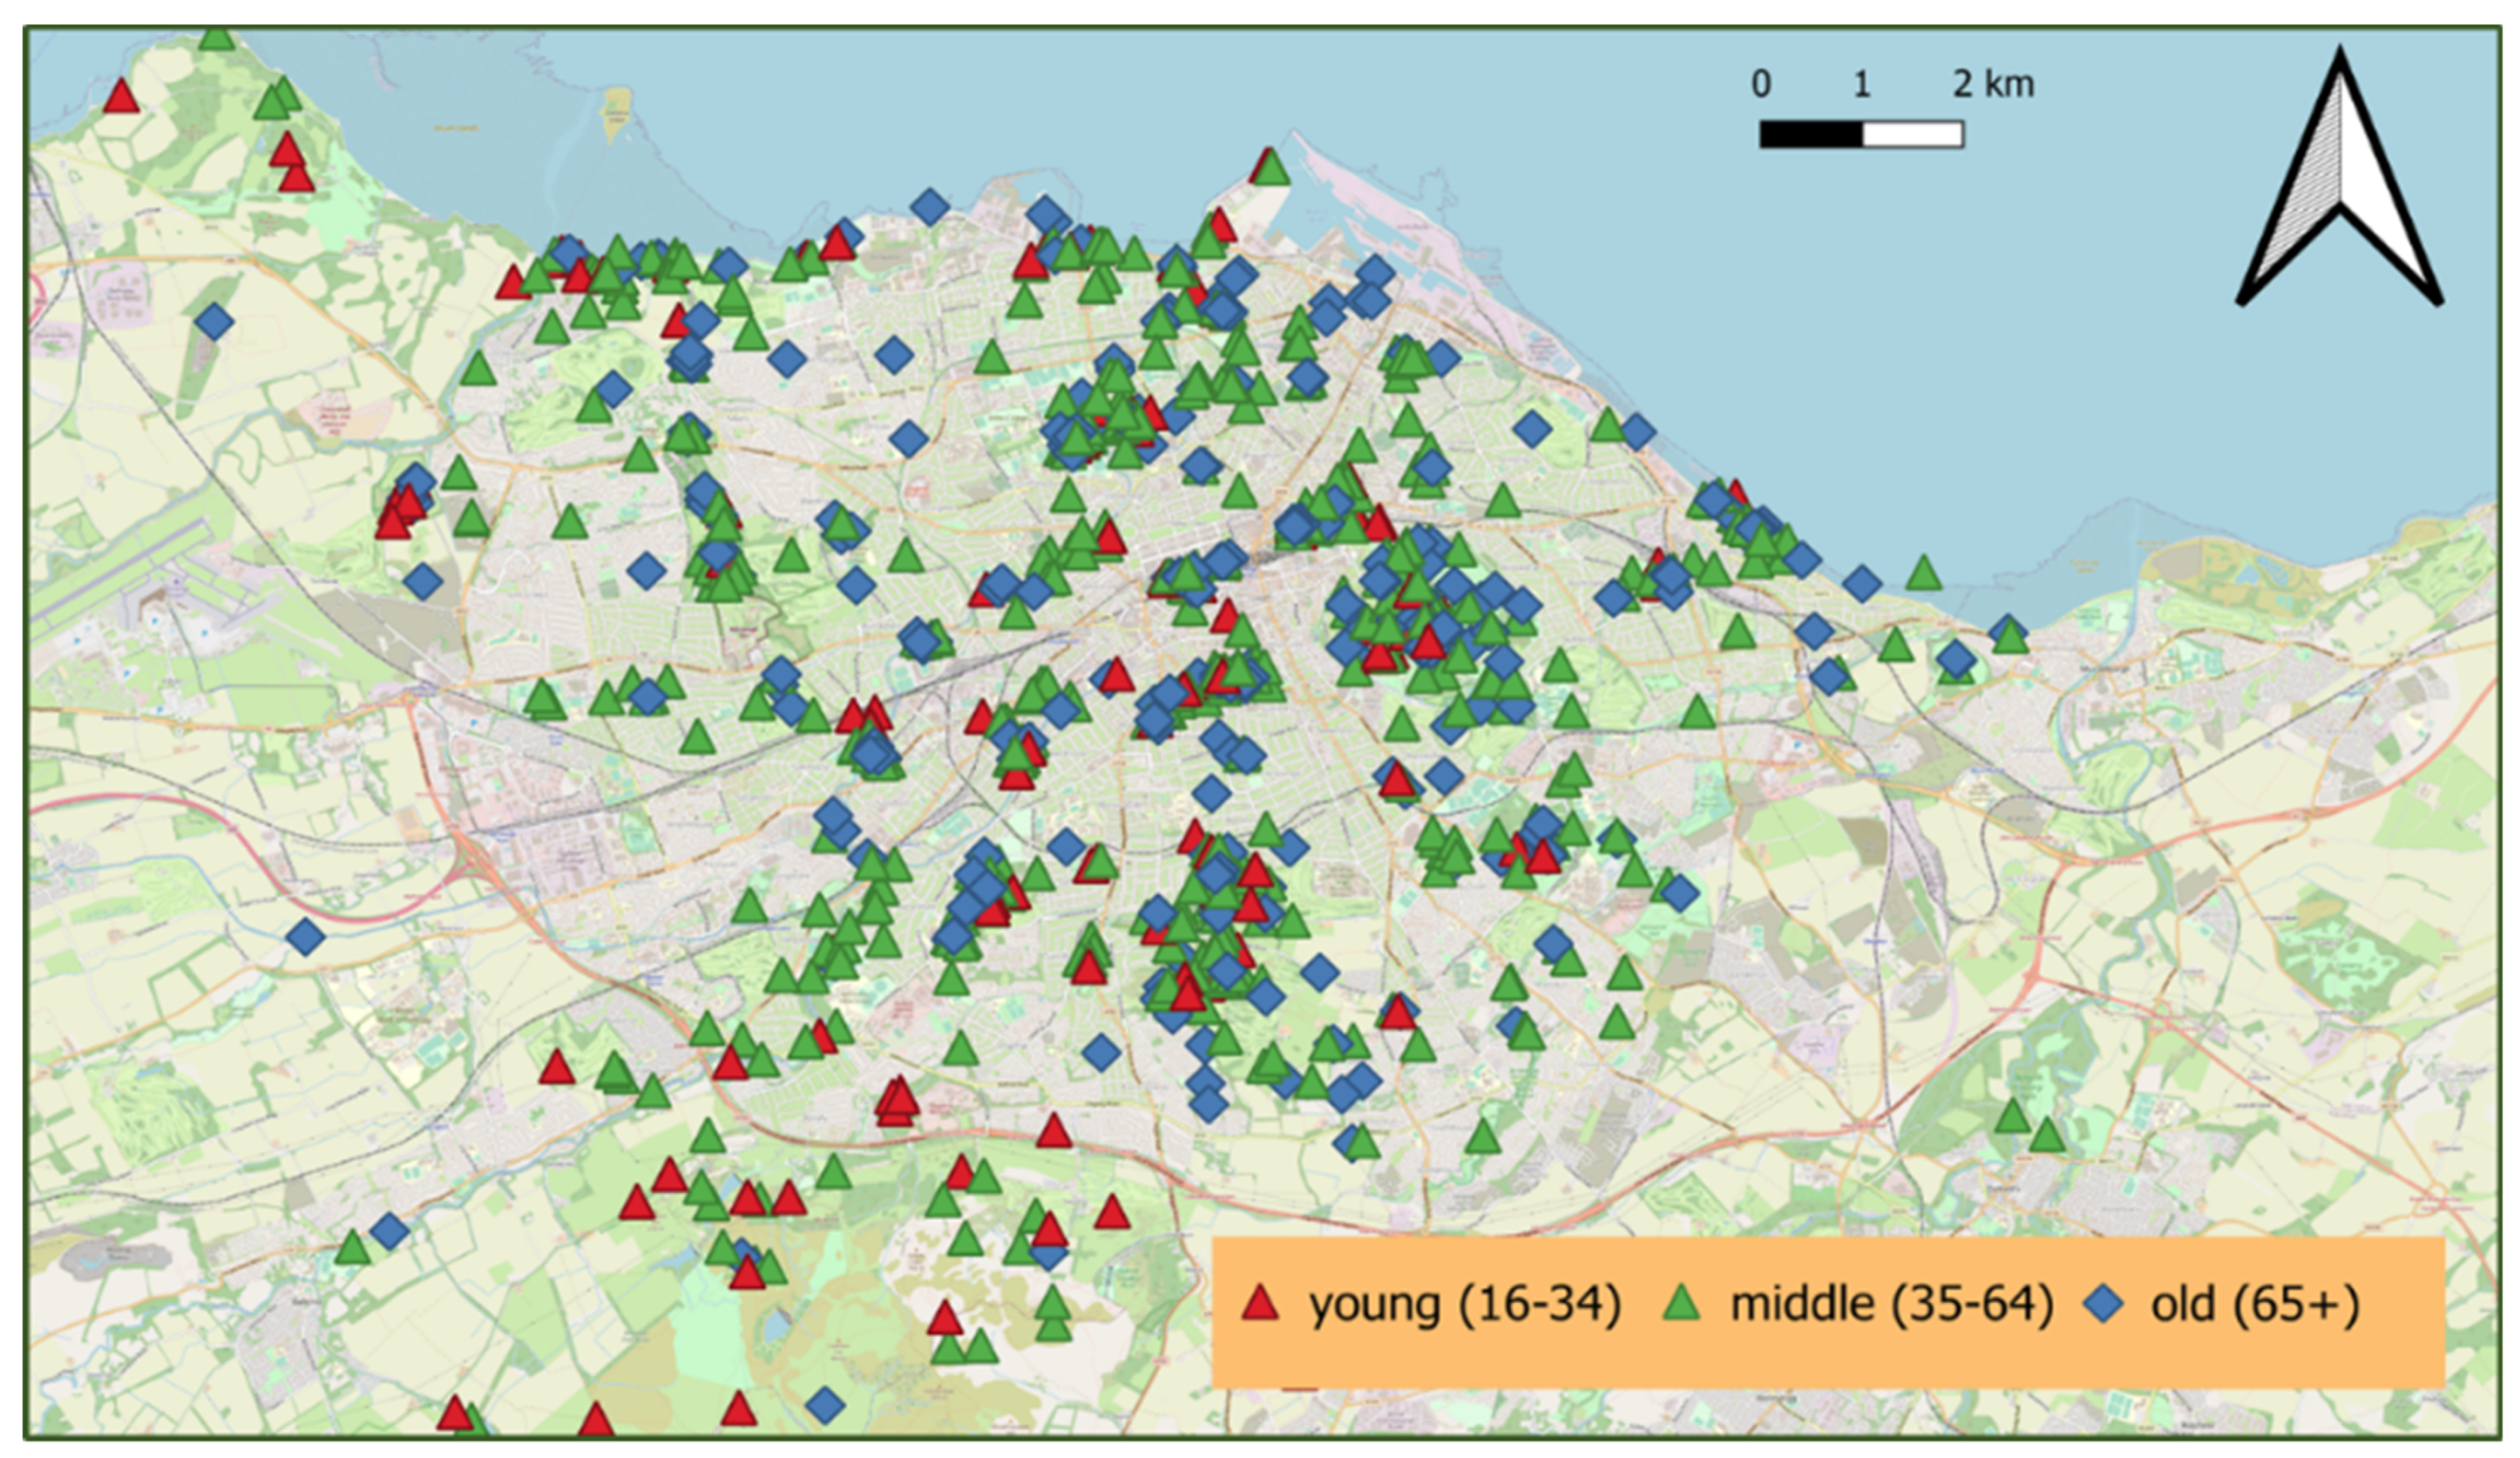
Figure 9.
The UGBS avoided, divided by gender.
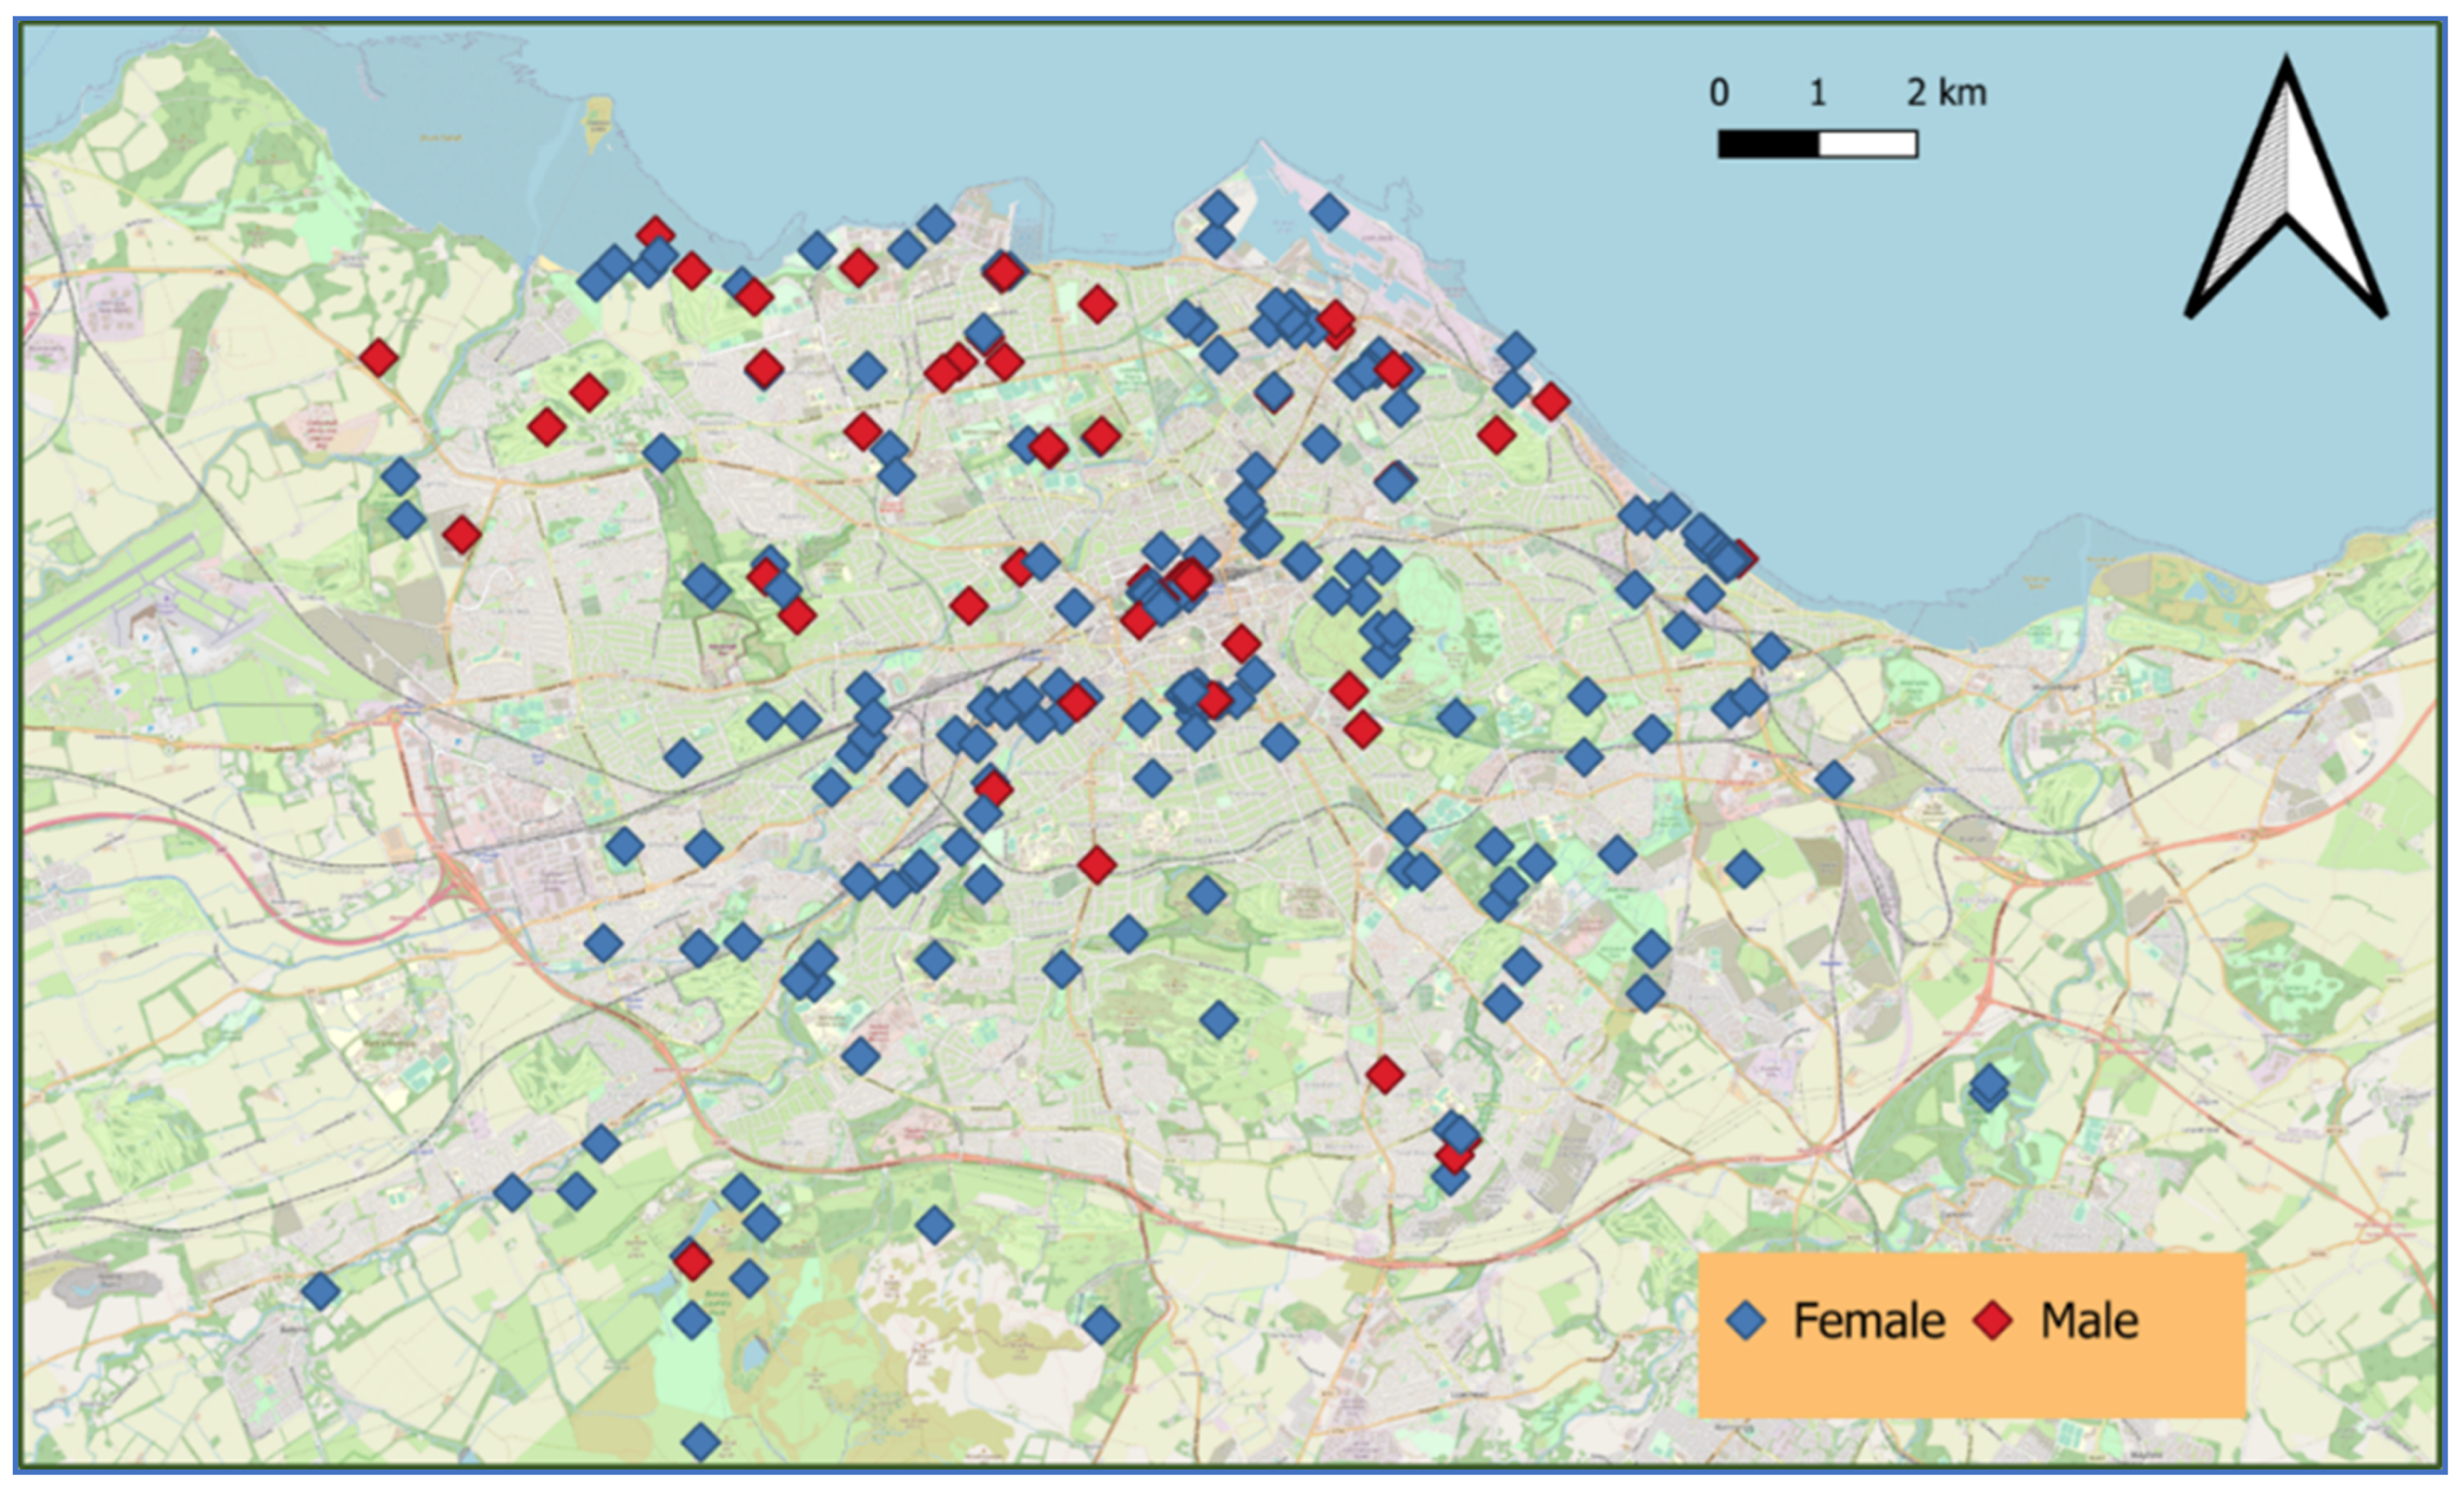
Figure 10.
Respondents’ preferences and reasons for visiting a green/blue space (Likert scale where 5 is most positive and 1 most negative).
Figure 10.
Respondents’ preferences and reasons for visiting a green/blue space (Likert scale where 5 is most positive and 1 most negative).
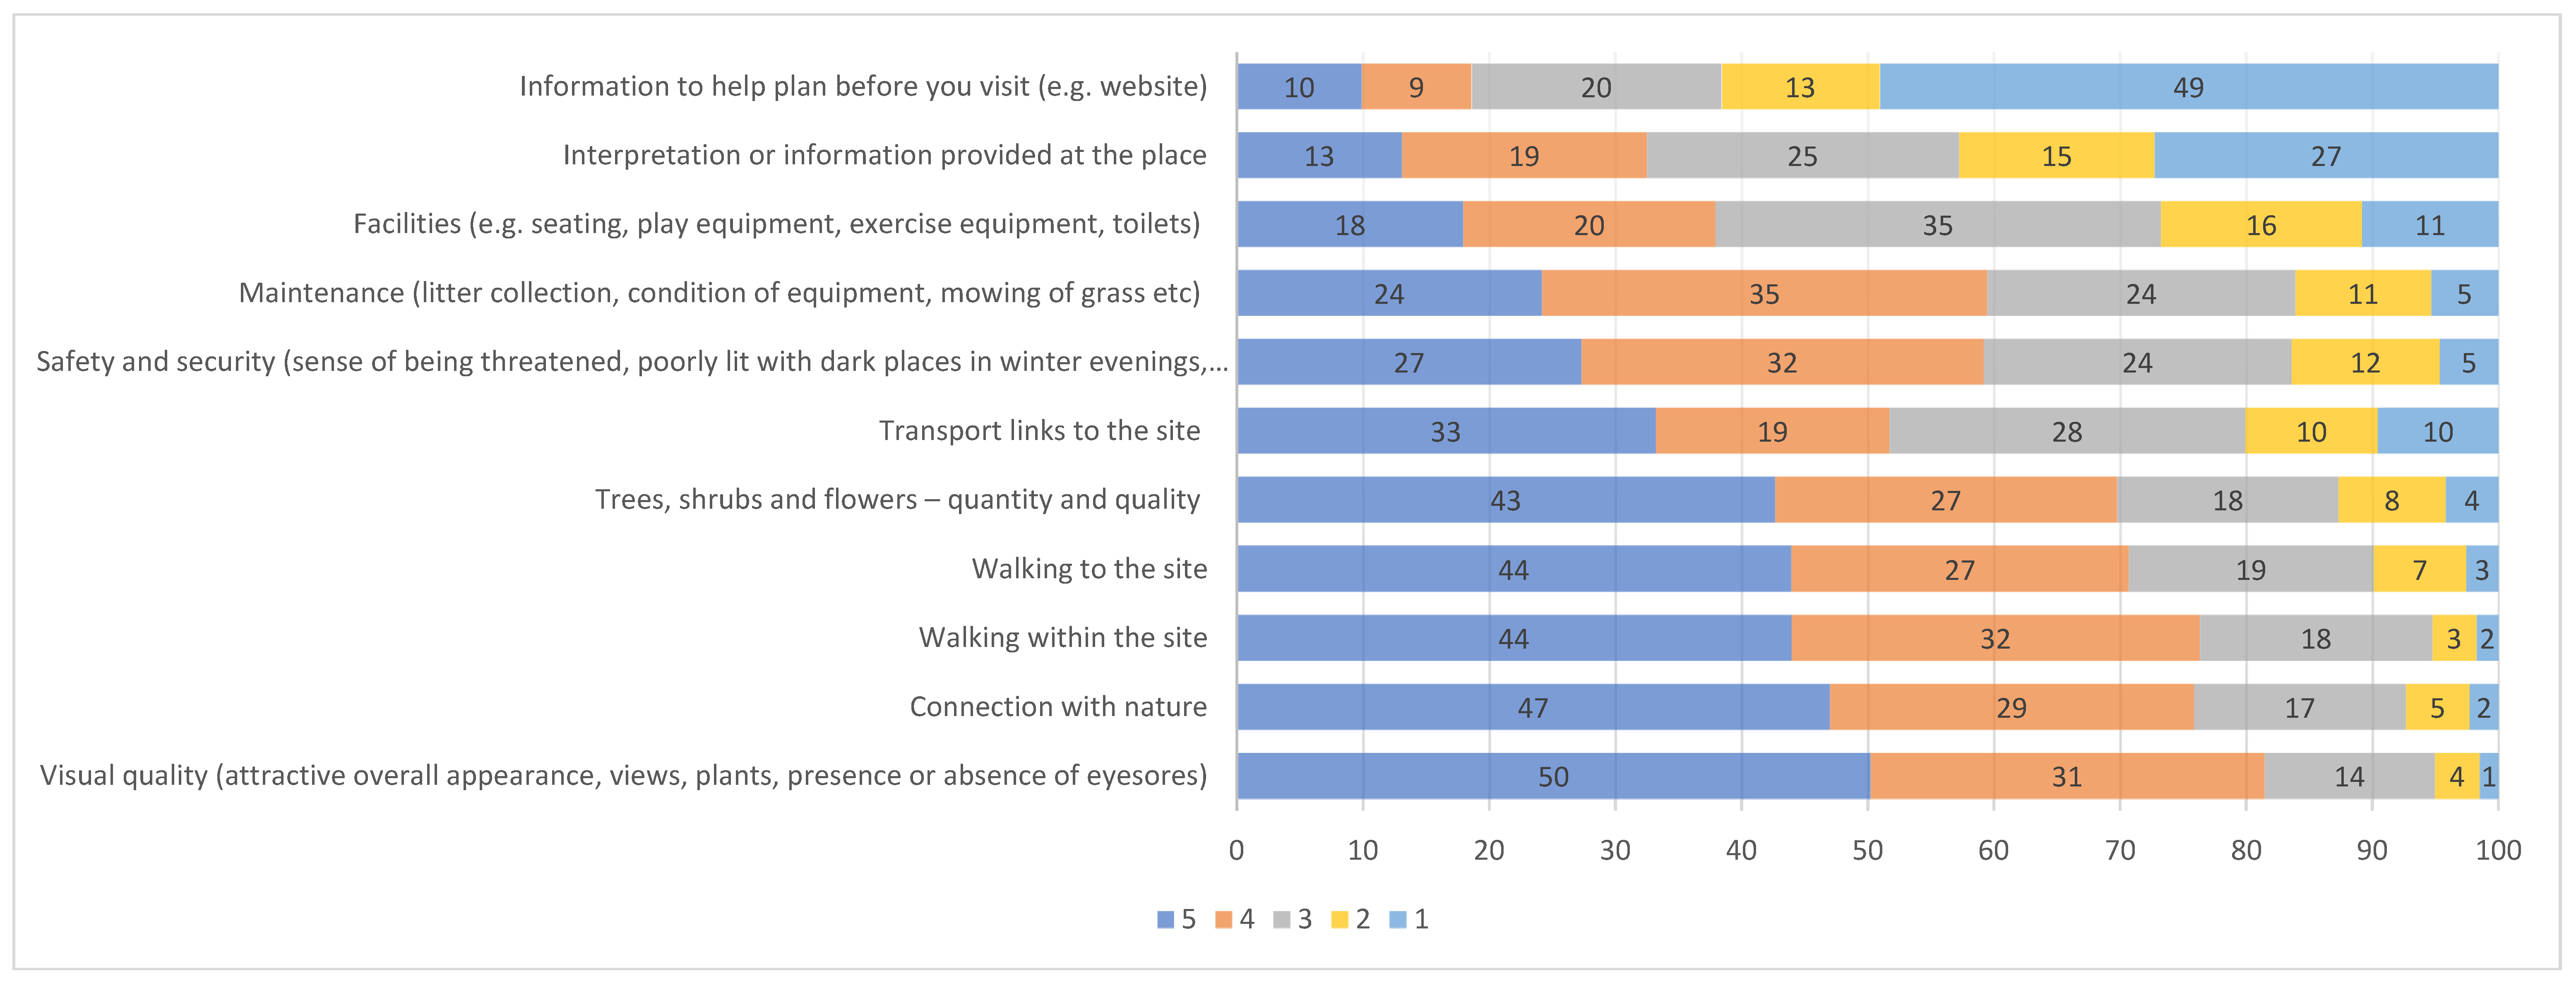
Figure 11.
Responses to questions about facilities and information provided in green/blue spaces visited.
Figure 11.
Responses to questions about facilities and information provided in green/blue spaces visited.
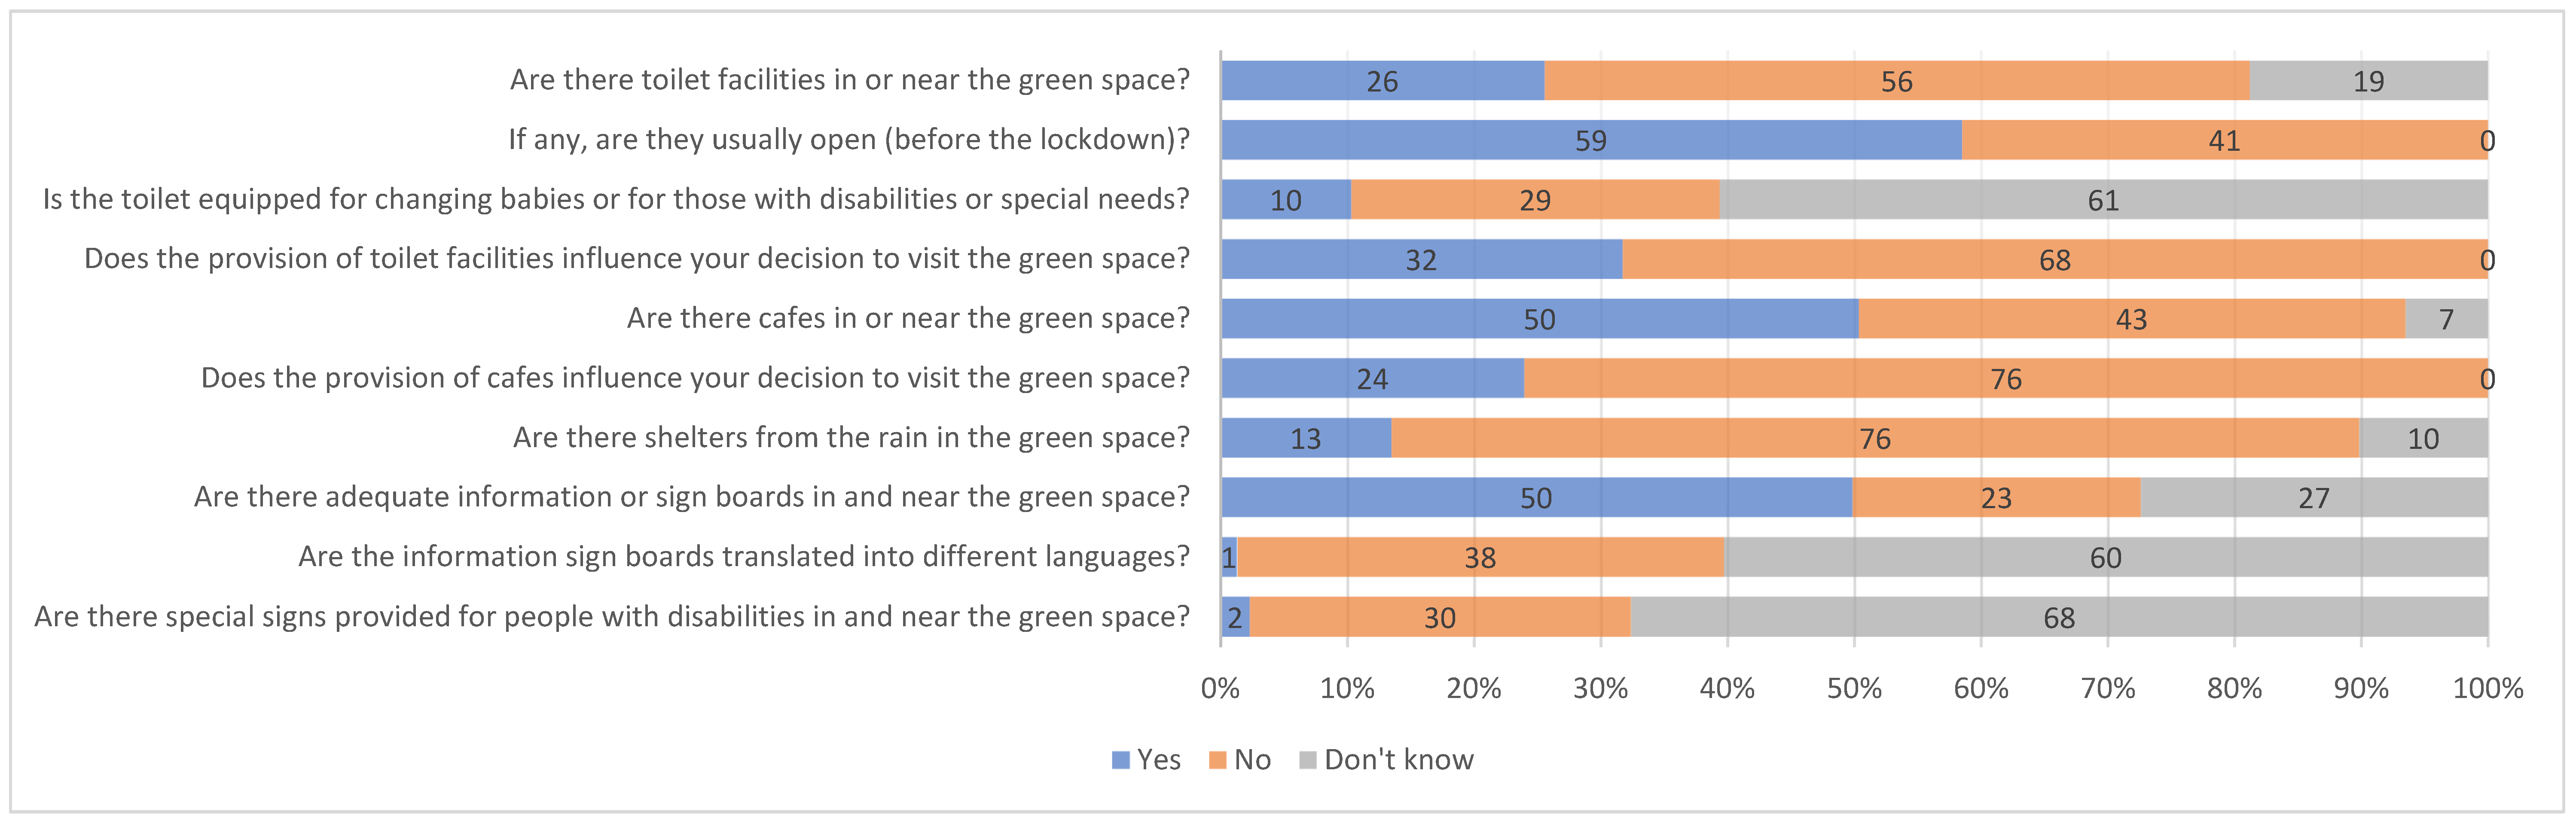
Figure 12.
Images of Saughton Park, illustrating the use of zoning to accommodate the variation in individuals’ preferences for UGBS (Source: the authors).
Figure 12.
Images of Saughton Park, illustrating the use of zoning to accommodate the variation in individuals’ preferences for UGBS (Source: the authors).
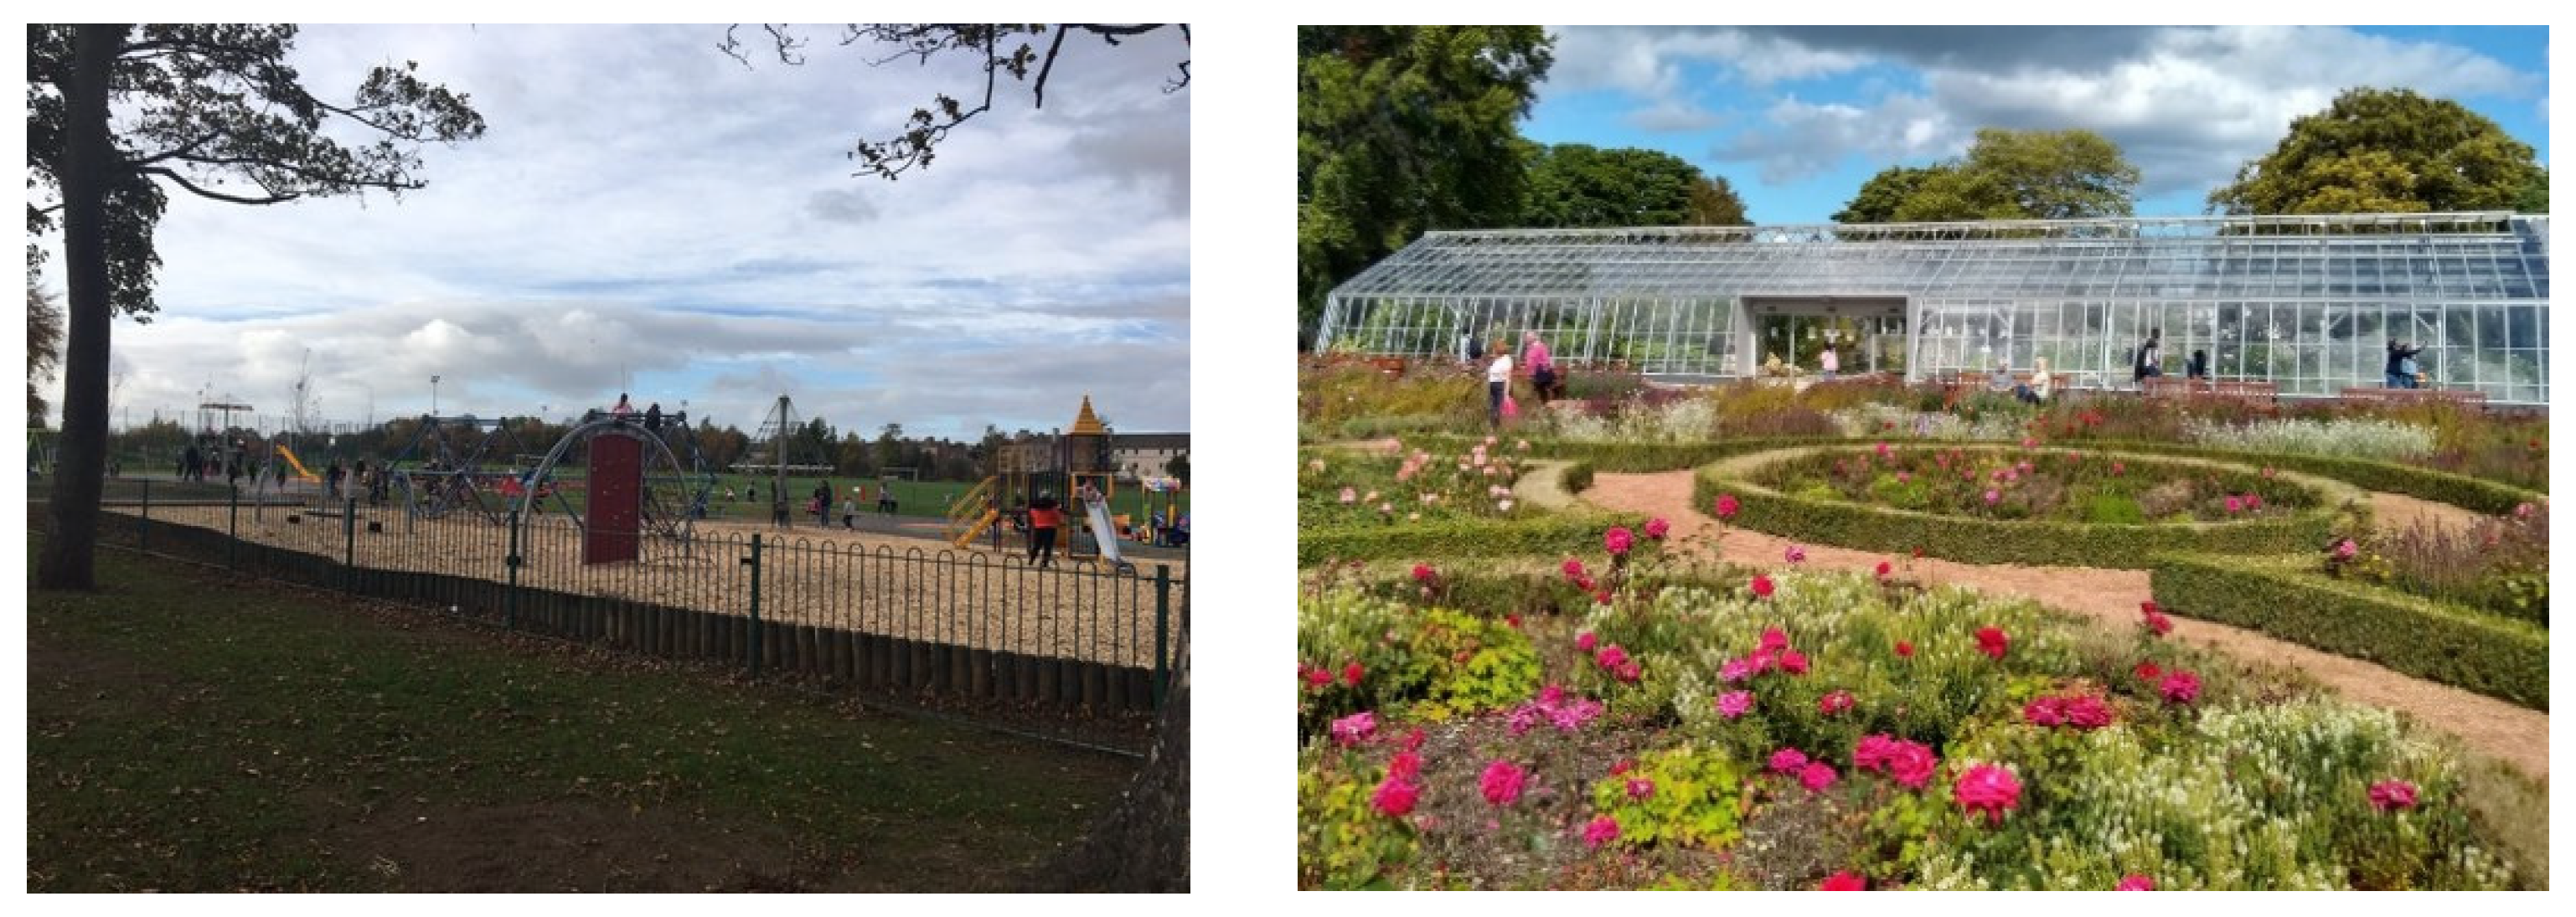
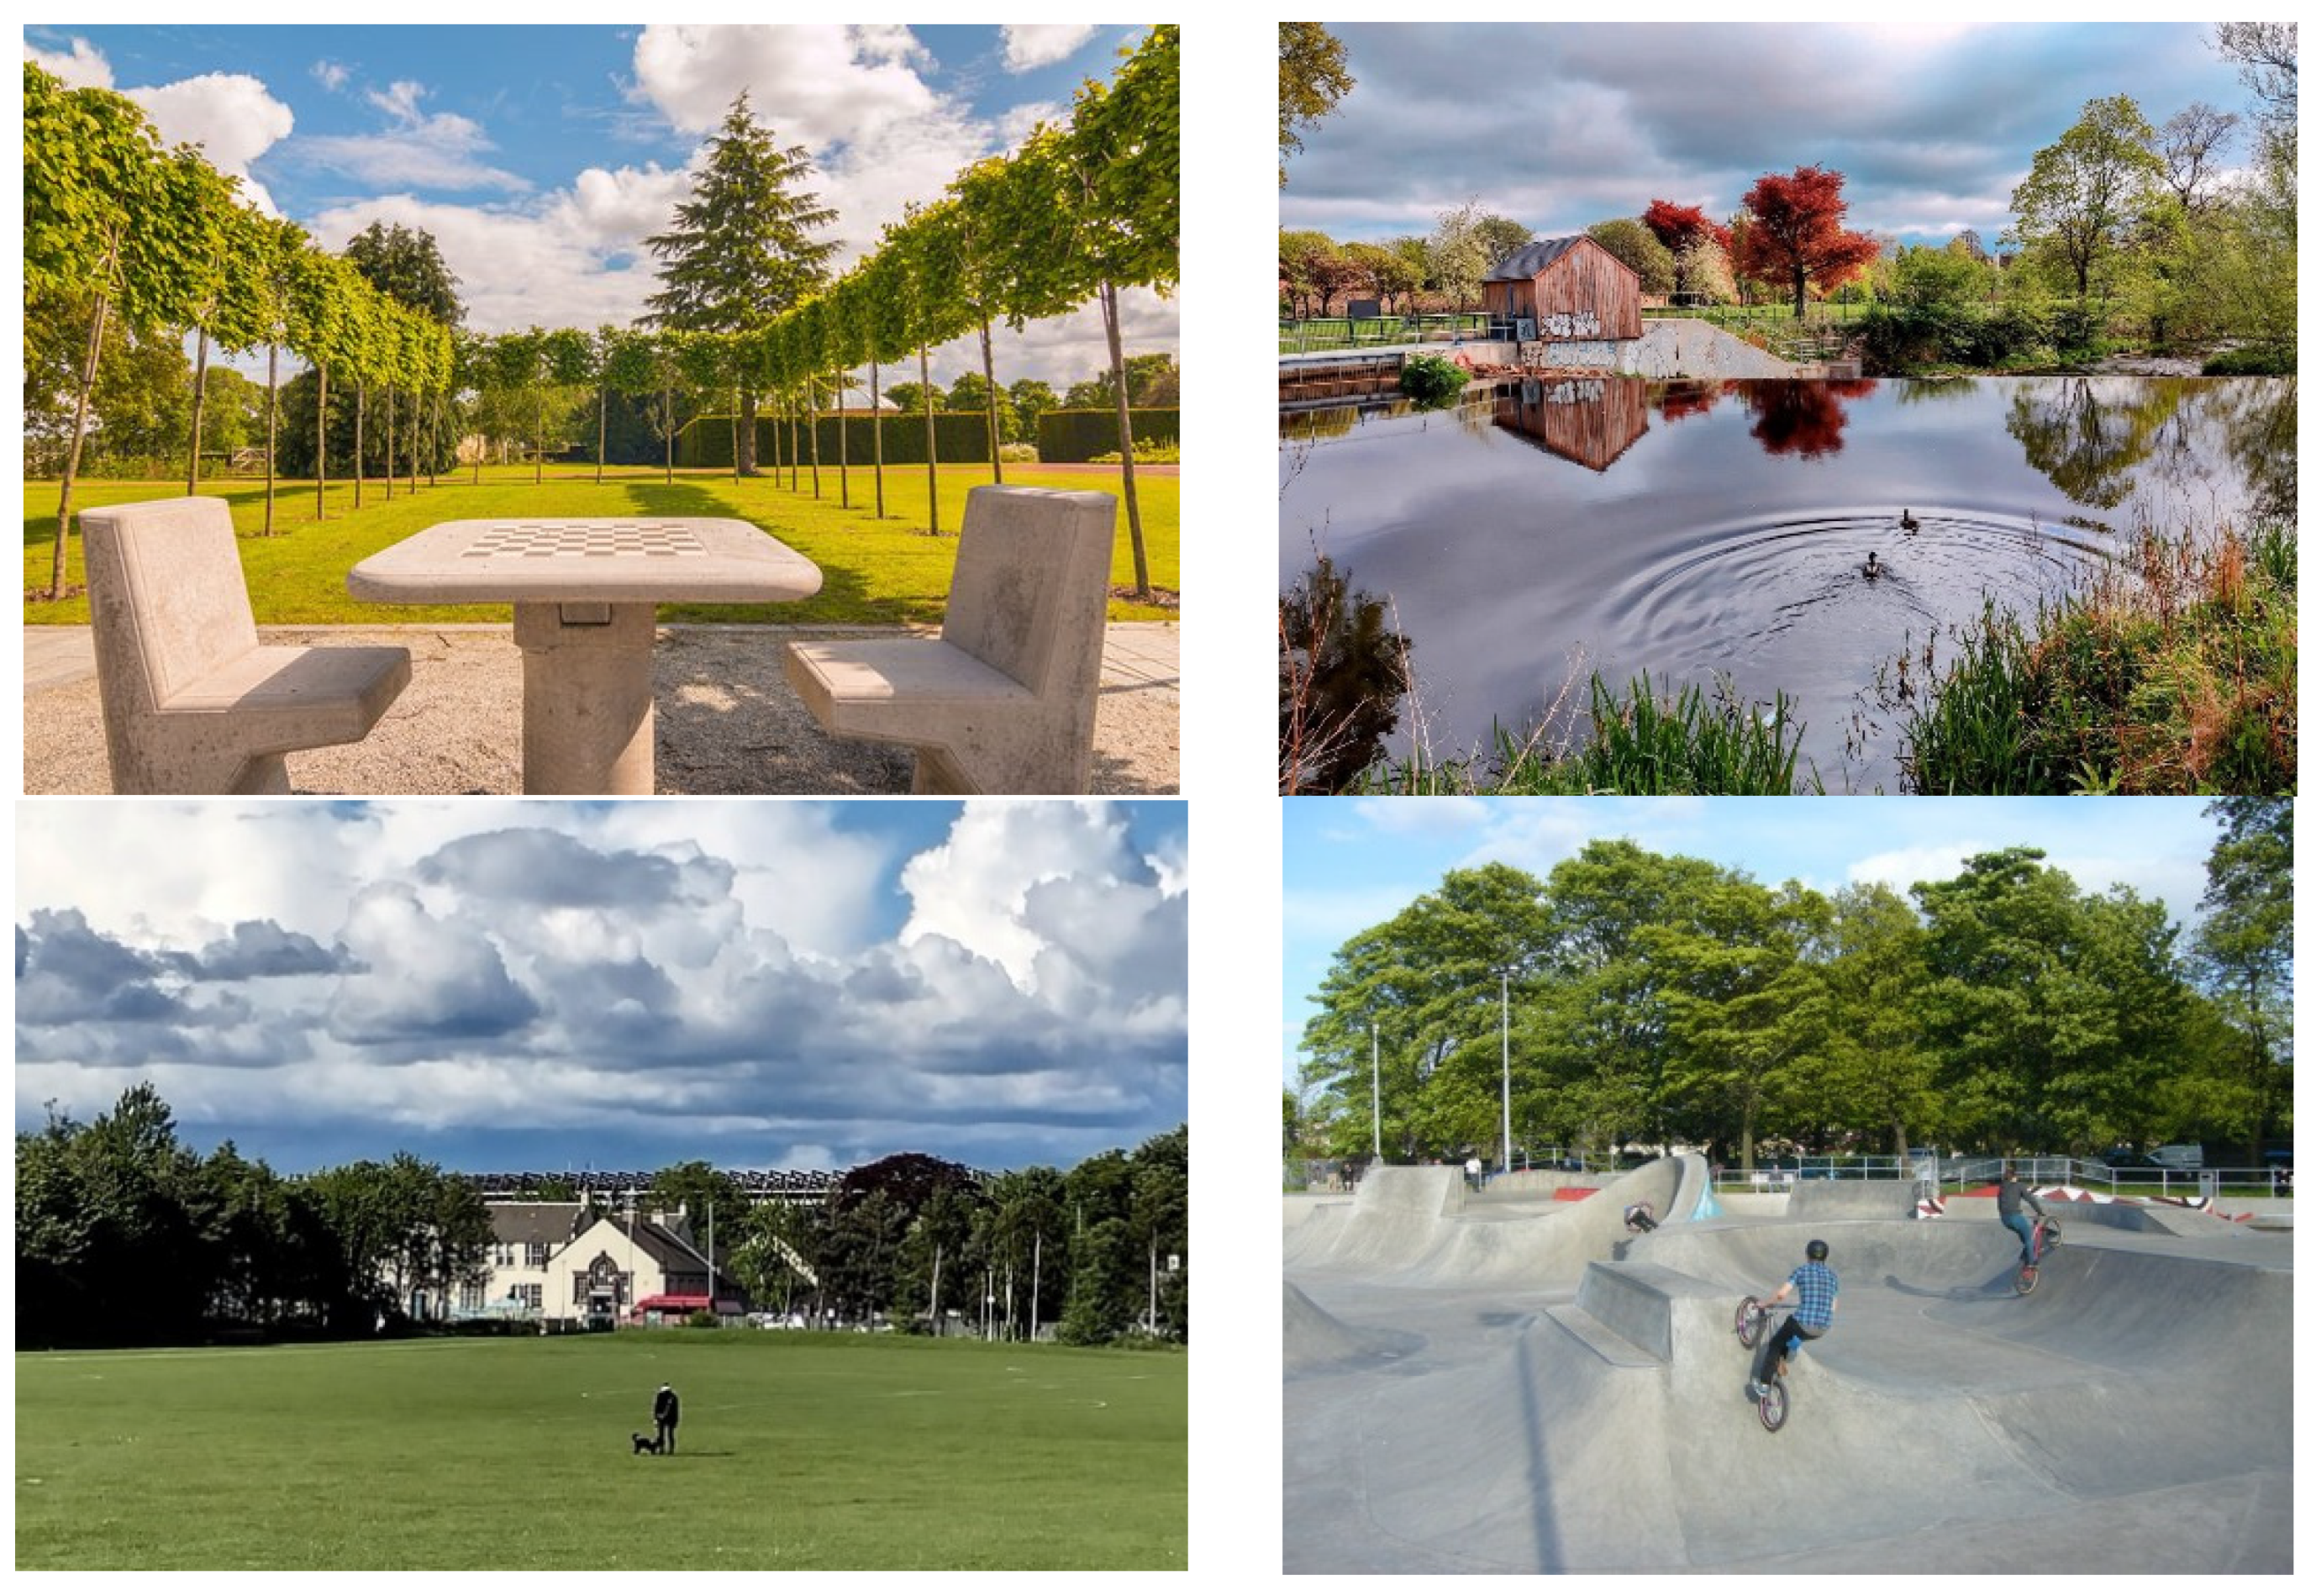
Figure 13.
Images of Inverleith Park, illustrating the use of zoning to accommodate the variation in individuals’ preferences for UGBS (Source: the authors.
Figure 13.
Images of Inverleith Park, illustrating the use of zoning to accommodate the variation in individuals’ preferences for UGBS (Source: the authors.
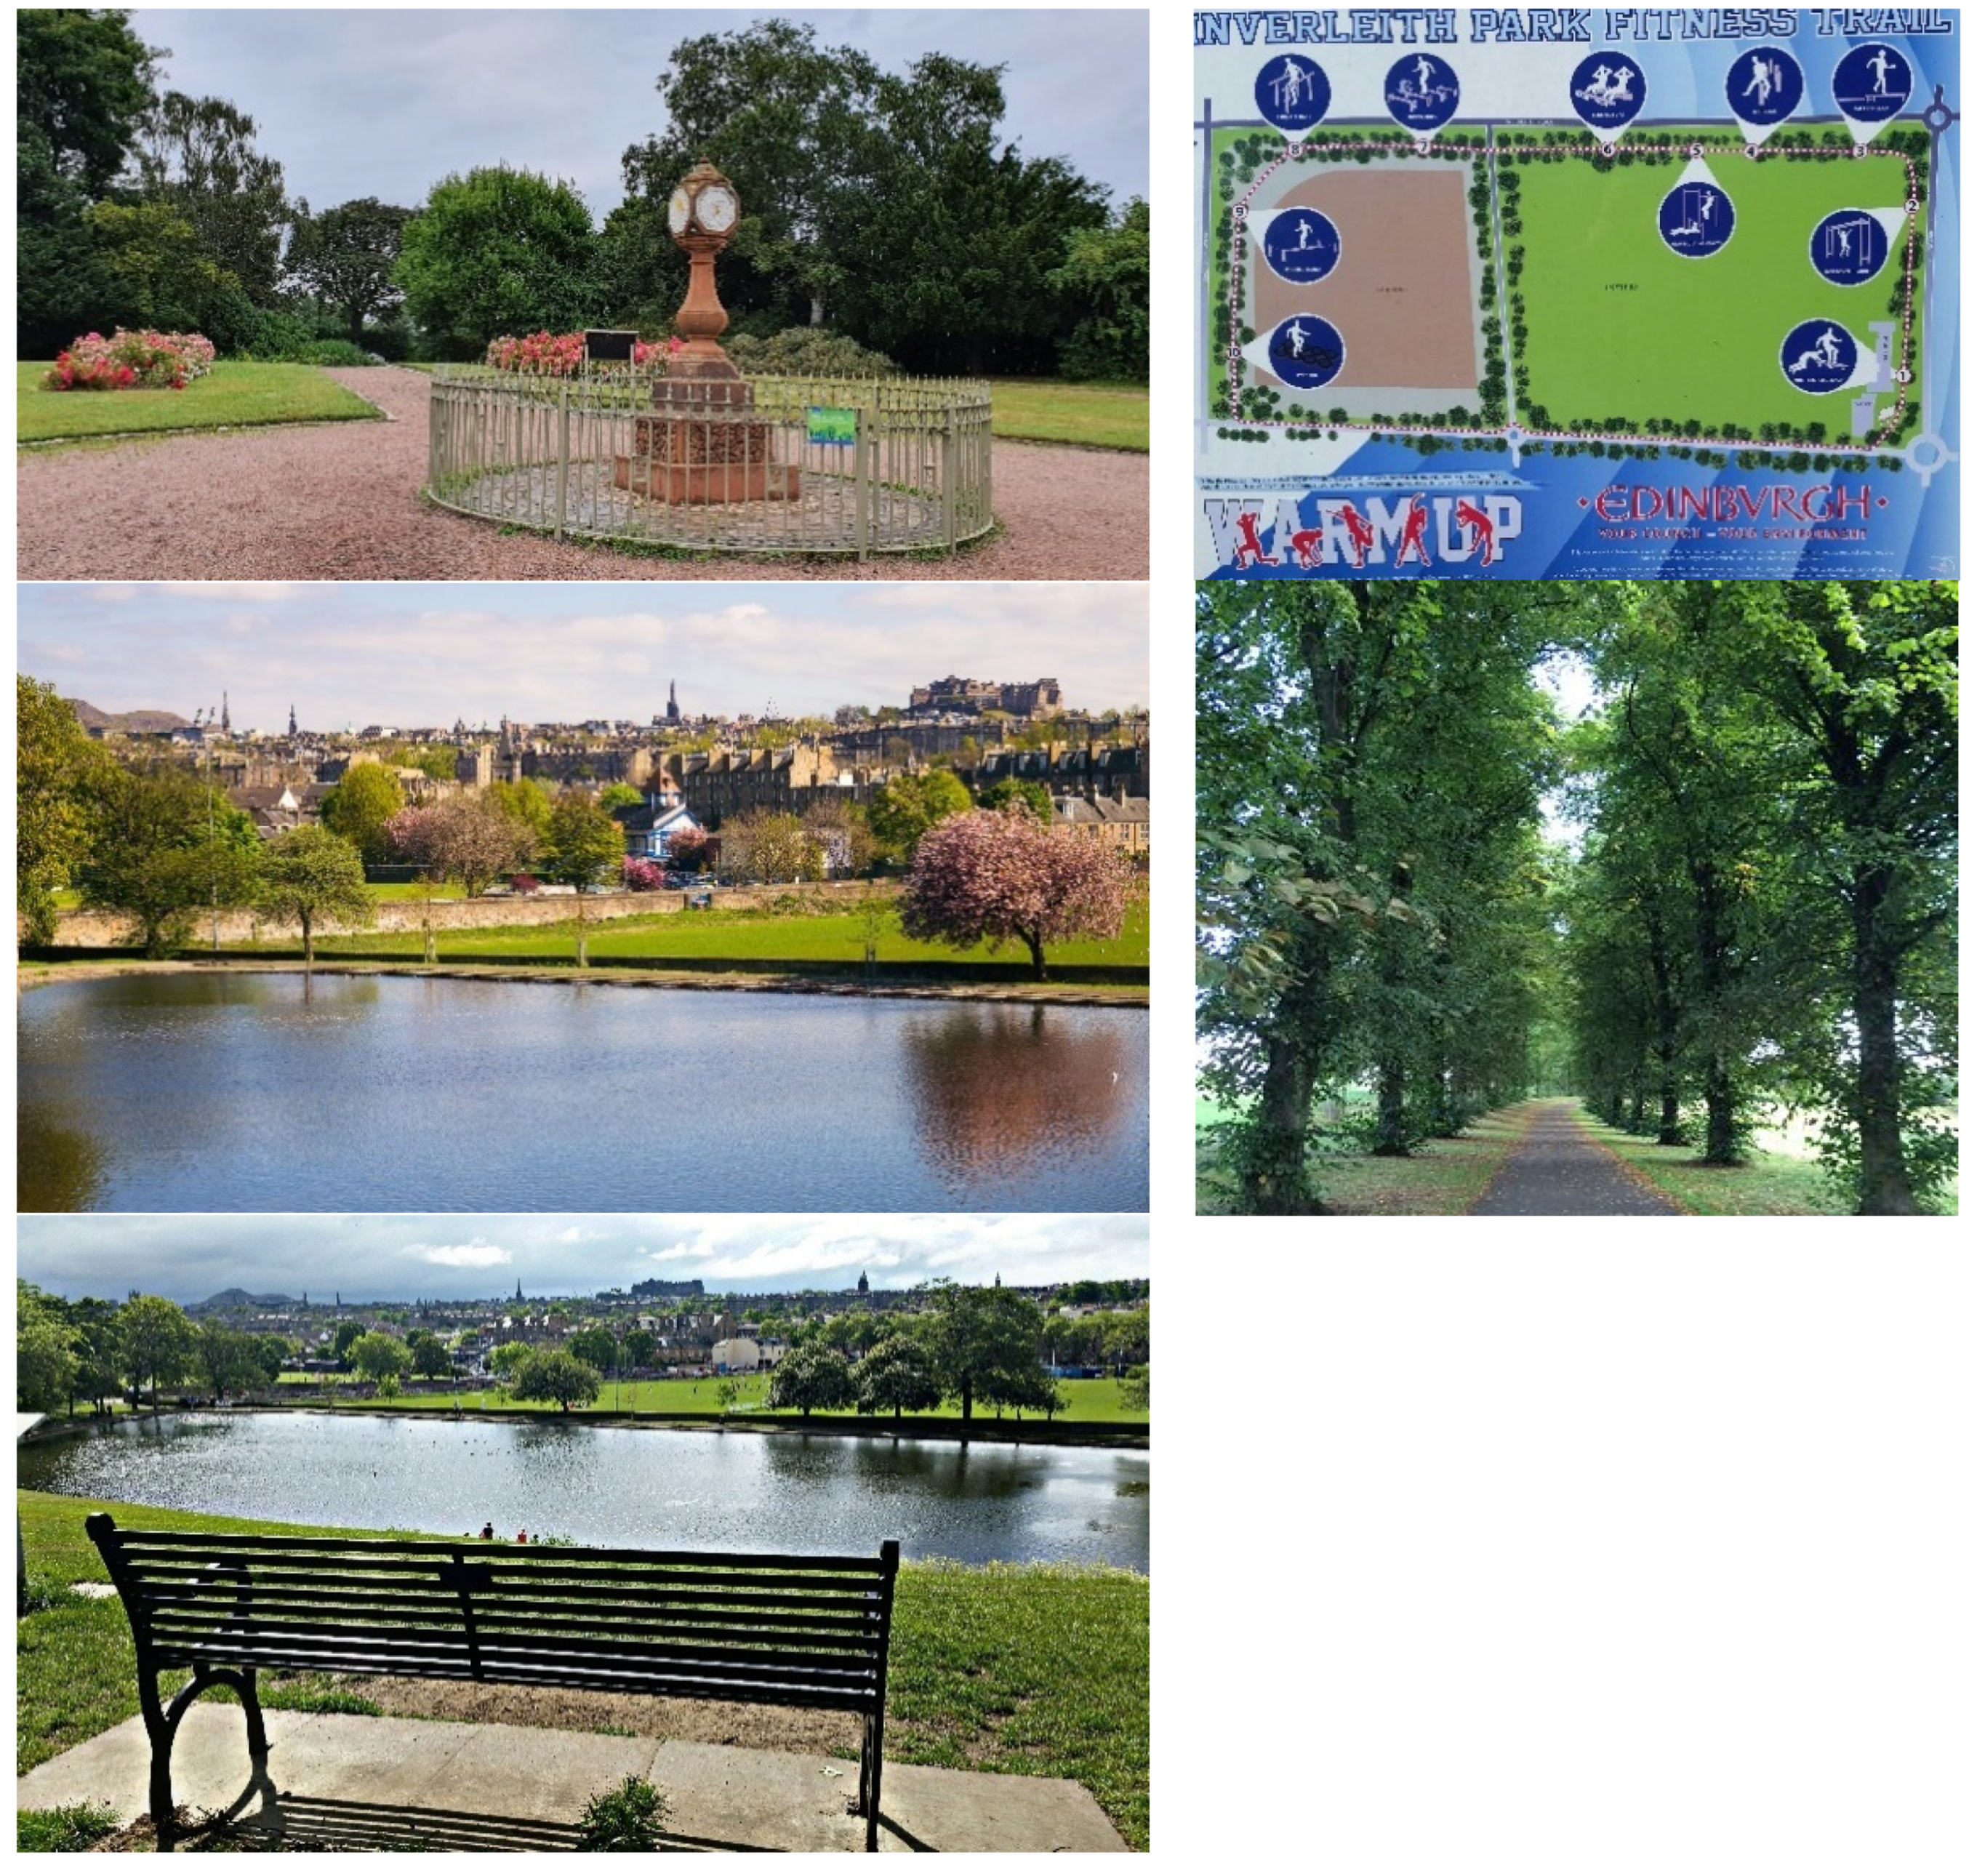
Table 1.
Baseline visitor profile for UGBS. Characteristics of survey respondents compared to sociodemographic data for Edinburgh, extracted from UK governmental data a.
Table 1.
Baseline visitor profile for UGBS. Characteristics of survey respondents compared to sociodemographic data for Edinburgh, extracted from UK governmental data a.
| Characteristics | Survey respondents | Edinburgh | Test of Difference, p-value b | |
|---|---|---|---|---|
|
Gender n=412 n=412 |
Female | 65.5 | 48.8 | 0.002 |
| Male | 31.5 | 51.2 | 0.002 | |
| Non-binary | 0.5 | - | - | |
| Prefer not to say | 2.5 | - | - | |
|
Age n=366 |
18 to 44 | 26.0 | 54.2 | 0.002 |
| 45 to 64 | 48.0 | 27.7 | 0.019 | |
| 65 to 74 | 19.0 | 9.8 | 0.000 | |
| Above 75 | 7.0 | 8.3 | 0.733 | |
|
Ethnicity n=320 |
White: Total | 94.0 | 91.7 | 0.682 |
| Mixed or multiple ethnic groups | 0.5 | 0.9 | 0.775 | |
| Asian, Asian Scottish or Asian British | 1.5 | 5.5 | 0.142 | |
| African | 0.0 | 1.2 | 0.291 | |
| Caribbean or Black | 0.5 | 0.8 | 0.835 | |
| Another ethnic group | 0.5 | - | - | |
| Prefer not to say | 3.5 | - | - | |
|
Marital status n=283 |
Married, civil union, partner | 69.0 | 38.4 | 0.001 |
| Single, separated, widowed | 24.0 | 61.6 | 0.000 | |
| Neither of these | 3.0 | - | - | |
| Prefer not to answer | 4.0 | - | - | |
|
Employment n=293 |
In paid work | 65.18 | 59.6 | 0.616 |
| In education | 3.07 | 15.8 | 0.003 | |
| Unemployed | 1.36 | 3.9 | 0.268 | |
| Permanently sick / disabled |
2.04 | 3.7 | 0.489 | |
| Retired | 24.91 | 11.6 | 0.028 | |
| House person / carer | 1.36 | 3.5 | 0.332 | |
| Other | 2.04 | 1.9 | 0.943 | |
|
Social classc n=292 |
1 | 4 | 11.6 | 0.054 |
| 2 | 12 | 14.1 | 0.681 | |
| 3 | 13 | 14.1 | 0.833 | |
| 4 | 17 | 16.7 | 0.959 | |
| 5 | 54 | 43.5 | 0.288 | |
| Social class | Survey respondents | Scotland | ||
| 1 | 4 | 19.5 | 0.001 | |
| 2 | 12 | 19.5 | 0.181 | |
| 3 | 13 | 19.8 | 0.235 | |
| 4 | 17 | 20.5 | 0.568 | |
| 5 | 54 | 20.7 | 0.000 |
Notes: a https://www.edinburghhsc.scot/the-ijb/jsna/populationanddemographics/ ; https://www.edinburgh.gov.uk/downloads/file/24244/city-comparisons. b p values for test of differences <0.05 indicated in bold. c Respondents’ home location divided according to Scottish quintiles (5th quintile, the 20% most affluent areas; 1st quintile, the 20% most deprived areas).
Table 2.
Baseline data highlighting how visitors physically access, use, and engage with UGBS in Edinburgh.
Table 2.
Baseline data highlighting how visitors physically access, use, and engage with UGBS in Edinburgh.
| Count | % | |
|---|---|---|
| How often do you visit? | N = 1423 | |
| Every day | 119 | 8.36 |
| Several times a week | 458 | 32.19 |
| Once a week | 261 | 18.34 |
| Once or twice a month | 350 | 24.60 |
| A few times in the last 6 months | 214 | 15.04 |
| Not in the last 6 months | 21 | 1.48 |
| Duration of green space visit? | N = 1019 | |
| Less than 30 minutes | 154 | 15.11 |
| 30 minutes to 1 hour | 410 | 40.24 |
| 1 up to 2 hours | 314 | 30.81 |
| 2 up to 3 hours | 111 | 10.89 |
| 3 up to 4 hours | 21 | 2.06 |
| 4 up to 5 hours | 9 | 0.88 |
| Mode of transport? | N = 1213 | |
| Walk | 771 | 63.58 |
| Cycle | 225 | 18.53 |
| By car | 145 | 11.93 |
| Bus | 60 | 4.95 |
| By tram | 3 | 0.25 |
| Other | 9 | 0.76 |
| Visiting alone or with others? | N = 1017 | |
| On my own | 424 | 41.68 |
| With my partner or friend | 359 | 35.30 |
| With my family | 174 | 17.13 |
| In a group | 60 | 5.89 |
| Ability to continue visiting UGBS as part of daily exercise routine during Covid-19 lockdown? | N = 1332 | |
| Yes | 1039 | 78.00 |
| No | 293 | 22.00 |
| Activities engaged in when visiting green spaces | N = 988 | |
| Walking without a dog | 230 | 23.30 |
| Watching wildlife | 117 | 11.80 |
| Meeting friends/socializing | 67 | 6.80 |
| Quiet activities (e.g. reading, meditating) | 65 | 6.60 |
| Walking with a dog | 62 | 6.30 |
| Cycling | 60 | 6.10 |
| Through route / commuting | 54 | 5.50 |
| Eating or drinking | 51 | 5.20 |
| Playing with children | 44 | 4.50 |
| Jogging | 41 | 4.20 |
| Art, photography, hobbies | 41 | 4.10 |
| Running | 38 | 3.80 |
| Picnic / barbecue | 28 | 2.80 |
| Sunbathing | 26 | 2.60 |
| Informal games and sports (e.g. Frisbee, football, volleyball etc.) | 12 | 1.20 |
| Visiting an attraction (e.g. a museum in a park or an art installation) | 11 | 1.10 |
| Participating in voluntary activities e.g. Friends of Parks or other groups | 10 | 1.00 |
| Others | 9 | 0.90 |
| Paddling | 8 | 0.80 |
| Swimming | 6 | 0.60 |
| Adventure sport (e.g. mountain biking, horse riding) | 3 | 0.30 |
| Attending an event (such as a concert or show) | 3 | 0.30 |
| Fishing (including angling, crabbing) | 1 | 0.10 |
| Boating (e.g. yachting, canoeing, kayaking, pedalo/paddle boat) | 1 | 0.10 |
Disclaimer/Publisher’s Note: The statements, opinions and data contained in all publications are solely those of the individual author(s) and contributor(s) and not of MDPI and/or the editor(s). MDPI and/or the editor(s) disclaim responsibility for any injury to people or property resulting from any ideas, methods, instructions or products referred to in the content. |
© 2024 by the authors. Licensee MDPI, Basel, Switzerland. This article is an open access article distributed under the terms and conditions of the Creative Commons Attribution (CC BY) license (http://creativecommons.org/licenses/by/4.0/).
Copyright: This open access article is published under a Creative Commons CC BY 4.0 license, which permit the free download, distribution, and reuse, provided that the author and preprint are cited in any reuse.


