Submitted:
21 February 2024
Posted:
23 February 2024
You are already at the latest version
Abstract
In order to achieve the elimination of the negative impacts of transport on road safety, the European Union is taking various measures resulting from its commitment to improve road safety. One of the instruments for achieving the objectives set is social legislation for the work of drivers in road freight and passenger transport. In line with the objective of improving the quality of working conditions for road transport drivers and road safety, the European Union applies Regulation (EC) No 561/2006 on the harmonisation of certain social legislation relating to road transport, which lays down rules on driving times, breaks and rest periods for drivers operating in road freight and passenger transport. The main objective of the paper is to assess the impact of social legislation on road transport safety by means of real research and to identify the factors influencing the violation of the legislation depending on the type of transports carried out in domestic or international road freight transport.
Keywords:
Road freight transportation
; Truck drivers
; Social Legislation Policymaking
1. Introduction
The logistics is the process of planning and organizing to make sure that resources are in the places where they are needed, so that an activity or process happens effectively [1]. As a part of the logistics, we must highlight the transport. Transport is one of the most important sectors of economics, has been developing gradually [2]. On the other hand, we must add, that the transport sector leads to detrimental effects on the economy, environment, and citizens quality of life [3]. There are several international agreements in road transport. Among the multilateral agreements include the Convention on the Contract of Carriage (CMR), the Customs Convention on the International Transport of Goods on the Basis of a Carnet (TIR), the European Agreement on the International Carriage of Dangerous Goods by Road (ADR) and also the European Agreement on the Work of Vehicle Crews in Road Transport (AETR). The AETR agreement primarily defines the maximum driving time, frequency and length of mandatory breaks and rest periods since 1976. This agreement applies between EU member states and non-EU member states (if both of these states are contracting states of the AETR Agreement for the entire transport route). This agreement can be applied only for the cars weighing more than 3.5 tones. This agreement sets out the permitted daily/weekly driving and rest periods. This is a significant problem, where the goal has been harmonization since 1985. The aim is the harmonization of certain social legislation relating to road transport sought to harmonize the conditions of competition between modes of inland transport, especially with regard to the road transport sector, and that improve working conditions and road safety [4]. Just this problem is solved in Regulation (EC) No 561/2006 of the European Parliament and of the Council of 15 March 2006 on the harmonization of certain social legislation relating to road transport. This regulation indicates that the daily driving time shall not exceed nine hours. However, the daily driving time may be extended to at most 10 hours not more than twice during the week. The weekly driving time shall not exceed 56 hours and shall not result in the maximum weekly working time laid down. The total accumulated driving time during any two consecutive weeks shall not exceed 90 hours. After a driving period of four and a half hours a driver shall take an uninterrupted break of not less than 45 minutes unless he takes a rest period. This break may be replaced by a break of at least 15 minutes followed by a break of at least 30 minutes each distributed over the period in such a way as to comply with the provisions of the first paragraph [4]. However, it is necessary to add that the driver must comply with the legislation of the country in which he is located. And it is precisely this time that differs within individual continents or countries.
Table 1 shows the maximum driving times and minimum rest period in the selected countries. As can be seen, there are two groups of the states. European Union, Australia and New Zealand have shorter time for continuous driving with compared to the USA and Canada. The time of the break is the longest by the states of the European Union. The shorter daily rest period (only 7 hours) have the drivers in the Australia. On the other hand, the longest bi-weekly driving time have the drivers in New Zealand.
Poliak et al. [5] constate, that legislation regulating the work of drivers, that in the EU are the most stringent working conditions of drivers, which are giving enough time to regenerate at a reasonable time of vehicle driving to the driver at first sight, on the other hand, those conditions motivate drivers to drive more quickly. Zalcmanis, Grislis and Kreicberg [6] states, that a large proportion of infringements committed by international haulage truck drivers involved in severe road transport accidents are in the field of compliance with the rules for drivers’ hours or overall working hours.
Due to urban growth and the progressive increase in transport vehicles on roads, the expansion of motorization on roads generally offers many benefits but also some drawbacks and risks [7,8]. About 1.35 million people worldwide die in road traffic accidents every year, while 20–50 million people suffer physical or economic losses [9]. This confirm Suthanaya and Sugiana [10], which state, that the number of accident fatalities has increased following the increase in population and motor vehicle ownership in Indonesia.
Jiang and Zhang added, that the traffic accidents involving heavy trucks occur frequently and the consequence is more serious. The accident is the result of the maladjustment of various factors in the “man-vehicle-environment” system [11]. In the area of the „man“, there are several factors, which could have the impact for the driving skills. Csiszar and Foldes [12] emphasize, that 95 percent of accidents are caused by human errors. At the neural level, notably in the context of driving, the integration of emotional elements in risk behavior processing has also been proven [13,14]. Several authors confirm in their publication, that high blood alcohol concentrations and the use of drug drastically increase the likehood of occurrence of road traffic accidents [15,16,17,18]. Another indicator that can affect the driver’s safe driving is high temperature which could have and impact to physiology [19].
However, there are exceptional circumstances, that could be allowed up to 30 days to transport operations carried out in exceptional circumstances. Fow example, drivers engaged in all transport of goods could increase of the maximum permissible daily driving limit up to 11 hours sicnce 12th August 2022 to 30th September 2022 in Poland. This is allowed based on the disturbances in freight transport caused by Russia´s invasion of Ukraine [20].
The aim of the paper is to analyse the work of drivers in the Czech Republic and Slovakia. The most frequent offenses and drivers with the greatest susceptibility to violating social regulations will be compared here.
2. Methodology
The aim is to identify selected groups of Czech and Slovak truck drivers with the same tendency to comply with or violate the rules of social legislation in road freight transport.
2.1. Sample
The initial sample includes 483 truck drivers, but 11 respondents are excluded due to missing data, for example, age, country, and type of road freight transport. Table 2 shows that the final sample consists of 472 truck drivers from the Czech and Slovak Republics, broken down into five age categories and three road freight transport types such as domestic road freight transport, international road freight transport, or both. As can be seen, the majority of respondents are Slovak truck drivers (more than 58% of all). We find that these truck drivers prefer international road freight transport (more than 40% of the final sample) compared to other types of road freight transport. However, the largest group consists of Slovak truckers driving for domestic and international road freight transport (108 respondents). On the other hand, Czech truck drivers driving domestic road freight transport represent the smallest group (46 respondents). According to the age structure and road freight type, truck drivers from 41 to 50 years old makeup almost one-third of all respondents, but the age category from 31-40 years old has a similar representation (four respondents less). Finally, respondents from 41 to 50 years of age for international road freight transport are most represented (almost 13% of the total sample). This group is equally represented by nationality (29 Slovak and 31 Czech truck drivers). All other sample data are shown in Table 2.
2.2. Input variables
We obtained data for analysis using an online questionnaire. The questionnaire serves as a tool to get primary data on the violation of social legislation by truck drivers from the Czech and Slovak Republics. The questionnaire consists of more than 20 questions. These questions had binary/multiple options with a single answer choice. However, we use only a part of the input variables such as driver type, the amount of the highest fine, reduction of daily or weekly rest time, reasons for violating social legislation, i.e. complications with meeting the loading or unloading deadline, poor traffic planning, traffic accidents (traffic jams), driving home, and lack of free parking spaces or areas from the presented questionnaire. As can be seen, all inputs are categorical variables (nominal or ordinal variables). This questionnaire was available online for Slovak truck drivers using Google Formular from February 2, 2021, to March 12, 2022, for a total of 429 days. On the other hand, Czech truck drivers participated in an online questionnaire via Survio from January 11, 2022, to February 17, 2022, for a total of 37 days. The success rate of completing the questionnaire for Czech respondents is almost 60% because this questionnaire was opened 356 times, but only 208 truck drivers completed the questionnaire. This research was created based on international cooperation with a partner university in the Czech Republic, Tomas Bata University in Zlin.
2.3. Methods
We determine the profile of Slovak and Czech truck drivers profile using the two-step cluster analysis. In other words, this tool generates homogeneous groups with similar traffic behavior. The two-step cluster method analyses continuous and categorical variables. Quantitative variables with different scale units and nominal scales may be simultaneously analyzed. The process assumes that all variables are independent, continuous variables have a normal distribution, and categorical variables have a multinominal distribution. Moreover, the extra benefit includes the automatic determination of the optimal number of clusters. This method is applied to larger samples with more than 500 respondents [21]. Cluster analysis is quite often used in scientific research [22,23,24]. The procedure contains several processes such as distance measure, optimal cluster number and cluster quality [25].
Long-likelihood distance. Log-likelihood measures object similarity using mixed categorical:
where:
- total number of continuous variables,
- total number of categorical variables,
- number of categories for the k-the categorical variable,
- the total number of data records in cluster s,
- number of records in cluster s whose categorical variable k takes l category,
- estimated variance of the k continuous variable k,
- the estimated variance of the k continuous variables k in cluster j,
- distance between the i and the j,
- the index representing cluster formed by combining clusters i and j [26]
Two-step cluster analysis is often used to identify market segmentation, product bundling, formal classification, and medical diagnosis [27].
Optimal cluster number. The optimal cluster is determined based on the lowest BIC score. Schwarz’s Bayesian Criterion (BIC) is calculated for each number of clusters within a specific range as:
with:
where:
- Bayesian information criterion,
- ratio in r-cluster developed during the hierarchical clustering stage,
- the number of groups in k categorical variables [28]
BIC with a lower value indicates the optimal number of clusters, and the "optimal" number of clusters has the lowest BIC value. In addition, we also monitor the large Ratio of BIC Changes and large Ratio of Distance Measures. However, the statistical-analytical program automatically determines the optimal number of clusters without the author’s decision [29] in statistical-analytical programme IBM SPSS 26.
Cluster quality. Silhouette’s value measures the similarity of an object to its cluster (cohesion) compared to other clusters (separation). Cluster cohesion demonstrates the average distance between a sample and all other data points within the same cluster. In contrast, cluster separation explains the average distance between a sample and all other data points in the nearest cluster [30]. This metric ranges from 1 to -1.
Silhouette’s value identifies:
- poor classification from -1.0 to 0.2,
- fair classification from 0.2 to 0.5,
- good classification from 0.5 to 1.0 [31].
- Silhouette coefficients for i-th object,
- average of the minimum distance between i-th object in a different cluster (average inter-cluster distance),
- average of the minimum distance between i-th object in the same cluster (average intra-cluster distance),
- average value for the silhouette coefficients,
- total number of observations [31].
3. Results
The paper aims to identify selected groups of Czech and Slovak truck drivers with the same tendency to observe/break the rules of social legislation and traffic regulations in an international sample of truck drivers from the Czech and Slovak Republics in domestic and international road freight transport for taking adequate measures. The results show that truck drivers are divided into four clusters based on nine input variables using the two-step cluster analysis. This tool was used because all inputs are categorical variables. Silhouette’s measure of cohesion and separation demonstrates that cluster analysis appropriately segments truckers based on input variables into clusters. In our case, this indicator reaches 0.3. Tkaczynski [21] claims that if Silhouette’s measure is higher than 0.2, this metric demonstrates an acceptable distance between clusters (fair zone).
Table 3 shows important statistical metrics determining the optimal number of clusters using two-step cluster analysis for 15 clusters. The optimal number of clusters is often determined based on the lowest BIC value or the largest ratio of distance measures. In general, a high number of clusters leads to a difficult model, the statistical-analytical program adopts an automatic solution based on a compromise between a reasonably large ratio of BIC changes and a large ratio of distance measures, the optimal number of clusters is four (ratio of BIC changes = 0.407, ratio of distance measures = 1.416).
Table 4 shows that the total sample consists of 483 truck drivers from the Czech and Slovak Republics. These truck drivers are divided into four clusters using the two-step cluster analysis. As can be seen, the 456 truck drivers form four clusters, as 27 observations are excluded due to missing data of input variables. The results show that the fourth cluster consists of the largest group compared to the other clusters (more than 32% of Combined). On the other hand, the third (smallest) cluster includes 88 truck drivers (less than 20% of Combined).
We find that the most important input is the lack of free parking spaces and parking areas (100%), compliance with unloading or loading deadlines (more than 70%), and traffic accidents or traffic jams (more than 50%) in contrast to other input variables (less than 20%). Figure 1 shows the optimal number of clusters based on input variables using the two-step cluster analysis. The input variables are differentiated according to the significance scale (see legend).
We find that the fourth cluster consists of almost 50% of truck drivers from domestic road freight transport. This group does not violate social legislation at all due to the lack of free parking spaces or parking areas. Moreover, the majority of truck drivers do not have a problem with violating social legislation for several reasons such as traffic accidents (almost 67%), complications with meeting the loading or unloading deadline (less than 88%), poorly planned transport routes (more than 90%) and driving home (almost 80%). These drivers do not reduce their daily or weekly rest time. Finally, less than 65% of truck drivers paid the highest fine for violating traffic regulations or social legislation up to 100 euros (if at all).
The first cluster consists mainly of truck drivers from international road freight transport (more than 50%). These truck drivers violate social legislation for several reasons such as traffic accidents or traffic jams (more than 92%) and lack of free parking spaces or parking areas (more than 95%). On the other hand, these drivers mostly do not have a problem with violating social legislation due to complications with meeting the loading or unloading deadline (100%), driving home (almost 60%), and poor planning of traffic routes (more than 95%). Moreover, these drivers rarely cut their daily or weekly rest time. Finally, these drivers pay fines of up to 100 euros (if at all) (54 respondents) or from 101 to 500 euros (49 respondents).
The second cluster consists mainly of truck drivers from domestic and international road freight transport. These drivers violate social legislation for several reasons, such as complications with meeting the loading or unloading deadline (more than 85%), driving home (almost 52%), lack of free parking spaces or parking areas (more than 88%), traffic accidents or traffic jams (almost 76%) compared to poor planning of traffic routes. The results show that almost 71% of drivers do not violate social legislation due to poor travel planning. Like the previous clusters, this cluster demonstrates that drivers do not reduce their daily or weekly rest time. Finally, these drivers pay fines mostly from 101 to 500 euros (more than 41%). This group represents the most dangerous group of truckers.
The third, like the second cluster, consists mainly of truck drivers from international road freight transport (almost 47%). These drivers violate the social legislation for free parking spaces or parking areas (100%). On the other hand, social legislation is not violated at all due to traffic accidents or traffic jams (100%), driving home (100%), complications with unloading or loading deadlines (100%), and poor planning of traffic routes (almost 100%). Moreover, these drivers do not reduce their daily or weekly rest time. Almost 60% of drivers paid the highest fine of up to 100 euros (if at all). This group consists of considerate drivers with no tendency to violate social legislation, except for the lack of free parking spaces.
Figure 2 compares all four clusters. The results show that the fourth (light blue) cluster is mainly composed of domestic road freight truck drivers compared to the first (red) and third (green) clusters, and the second (dark blue) cluster consists mostly of drivers working for both types of road transport. In all clusters, most drivers do not reduce their daily or weekly rest time at all. In addition, we find that most truckers do not violate social legislation due to poor traffic driving planning. On the other hand, other reasons for violating social legislation differ in clusters. First, the fourth cluster is typical compliance with social legislation, unlike the other clusters. Second, the second cluster violates social legislation for several reasons such as lack of free parking spaces in parking lots and parking areas, complications with the loading or unloading deadline, traffic accidents, and driving home compared to others. However, the third, even the second cluster, violate social legislation for traffic accidents compared to the other clusters. The majority of drivers paid the largest fine of up to 100 euros (if at all) in contrast to the second group. This group pays mostly higher fines from 101-500 euros.
4. Discussion
With the increasing demand for road freight transport and the rising demographic curve of drivers, it can be concluded that there will not be enough drivers to transport goods from A to B in the near future. The above statement is valid throughout the EU, not only in the Slovak Republic. According to the latest report by the International Road Transport Union (IRU), there will be a shortage of up to 7 million drivers worldwide by 2028. In the current situation of driver shortage in the Slovak Republic and the EU, it is very important to know the susceptibility of drivers of different nationalities to violate the currently applicable social legislation. The type of road freight transport plays an important role in the violation of the regulations. The majority of drivers from Slovakia and the Czech Republic involved in the research worked in national road freight transport. The most important reason for violating the current legislation was given by most drivers as lack of free parking spaces and parking areas, compliance with unloading or loading deadlines and traffic accidents or congestion that forced drivers to exceed the permitted performance or driving times. Drivers working in international road freight transport do not usually have a problem with violations of social legislation due to complications in meeting loading or unloading deadlines, implementing a return home, or simply poor planning of the transport route. In addition, these drivers rarely reduce their daily or weekly rest time. Finally, half of these drivers pay fines of up to €100, and the other half said they pay fines of between €101 and €500. When comparing the results of drivers from Slovakia and the Czech Republic, we found no significant differences in the propensity to violate the applicable regulations. In the near future, it would certainly be advisable to carry out a similar survey with drivers of different nationalities, who are now increasingly working for Slovak companies. This would help to better understand the drivers’ view of the current legislation and its breaches.
5. Conclusions
In the EU, there has been a recent tightening of driving conditions, which is putting pressure not only on more drivers, but also on more parking spaces for taking breaks and rest periods. The tightening of the conditions for drivers to take rest breaks is certainly important for improving road safety. Understandably, tightening up the conditions creates demands for more drivers, of which there is a huge shortage in the EU, even at the present time. One can point, for example, to the collapse of freight transport in the UK as a result of the shortage of drivers in autumn 2021. The main challenge facing the EU is to adapt the rules on driver work so that road safety is not reduced, but that the number of drivers on the road freight market increases.
Author Contributions
Conceptualization, K. Vichova and J.Benus; Methodology, J. Mazanec and M.Cerny; Data curation J.Benus, J. Mazanec and K Vichova; Investigation and resources, J. Mazanec, K Vichova; Writing – original draft preparation, J. Benus and M. Poliak; Writing – revied and editing, M. Cerny; Visualisation, M. Cerny; Supervision, M.Poliak; Funding acquisition, M.Poliak
Acknowledgments
This research was supported by UNIZA project no. and Tomas Bata University in Zlín project no. FSR FORD 5-6 /2022-23/FLKŘ/001.
Appendix A

Table A1.
Do you work as a driver?
| Domestic road freight transport | International road freight transport | Domestic and international road freight transport | |||||
|---|---|---|---|---|---|---|---|
| Frequency | % | Frequency | % | Frequency | % | ||
| Cluster | 1 | 13 | 11.60 | 64 | 35.20 | 49 | 30.20 |
| 2 | 11 | 9.80 | 36 | 19.80 | 48 | 29.60 | |
| 3 | 15 | 13.40 | 41 | 22.50 | 32 | 19.80 | |
| 4 | 73 | 65.20 | 41 | 22.50 | 33 | 20.40 | |
| Combined | 112 | 100.00 | 182 | 100.00 | 162 | 100.00 | |
Table A2.
Have you ever been fined? (if you have received several fines. only state the value of the highest fine)?
Table A2.
Have you ever been fined? (if you have received several fines. only state the value of the highest fine)?
| 0-100 euro | 101-500 euro | 501-1 000 euro | 1 001 and more euro | ||||||
|---|---|---|---|---|---|---|---|---|---|
| Frequency | % | Frequency | % | Frequency | % | Frequency | % | ||
| Cluster | 1 | 54 | 23.00 | 49 | 31.20 | 12 | 30.80 | 11 | 44.00 |
| 2 | 34 | 14.50 | 39 | 24.80 | 14 | 35.90 | 8 | 32.00 | |
| 3 | 52 | 22.10 | 24 | 15.30 | 9 | 23.10 | 3 | 12.00 | |
| 4 | 95 | 40.40 | 45 | 28.70 | 4 | 10.30 | 3 | 12.00 | |
| Combined | 235 | 100.00 | 157 | 100.00 | 39 | 100.00 | 25 | 100.00 | |
Table A3.
Compliance with the unloading/loading deadline as a factor for the violation of social legislation.
Table A3.
Compliance with the unloading/loading deadline as a factor for the violation of social legislation.
| No | Yes | ||||
|---|---|---|---|---|---|
| Frequency | % | Frequency | % | ||
| Cluster | 1 | 126 | 35.30 | 0 | 0.00 |
| 2 | 14 | 3.90 | 81 | 81.80 | |
| 3 | 88 | 24.60 | 0 | 0.00 | |
| 4 | 129 | 36.10 | 18 | 18.20 | |
| Combined | 357 | 100.00 | 99 | 100.00 | |
Table A4.
Traffic accidents or traffic jams as a factor for the violation of social legislation.
| No | Yes | ||||
|---|---|---|---|---|---|
| Frequency | % | Frequency | % | ||
| Cluster | 1 | 10 | 4.60 | 116 | 48.90 |
| 2 | 23 | 10.50 | 72 | 30.40 | |
| 3 | 88 | 40.20 | 0 | 0.00 | |
| 4 | 98 | 44.70 | 49 | 20.70 | |
| Combined | 219 | 100.00 | 237 | 100.00 | |
Table A5.
Poor transport route planning as a factor for the violation of social legislation.
| No | Yes | ||||
|---|---|---|---|---|---|
| Frequency | % | Frequency | % | ||
| Cluster | 1 | 120 | 29.50 | 6 | 12.20 |
| 2 | 67 | 16.50 | 28 | 57.10 | |
| 3 | 87 | 21.40 | 1 | 2.00 | |
| 4 | 133 | 32.70 | 14 | 28.60 | |
| Combined | 407 | 100.00 | 49 | 100.00 | |
Table A6.
Lack of free parking spaces in parking lots and parking areas as a factor for the violation of social legislation.
Table A6.
Lack of free parking spaces in parking lots and parking areas as a factor for the violation of social legislation.
| No | Yes | ||||
|---|---|---|---|---|---|
| Frequency | % | Frequency | % | ||
| Cluster | 1 | 6 | 3.70 | 120 | 41.10 |
| 2 | 11 | 6.70 | 84 | 28.80 | |
| 3 | 0 | 0.00 | 88 | 30.10 | |
| 4 | 147 | 89.60 | 0 | 0.00 | |
| Combined | 164 | 100.00 | 292 | 100.00 | |
Table A7.
Drive home (carrier’s seat or place of residence) as a factor for the violation of social legislation.
Table A7.
Drive home (carrier’s seat or place of residence) as a factor for the violation of social legislation.
| No | Yes | ||||
|---|---|---|---|---|---|
| Frequency | % | Frequency | % | ||
| Cluster | 1 | 75 | 23.00 | 51 | 39.20 |
| 2 | 46 | 14.10 | 49 | 37.70 | |
| 3 | 88 | 27.00 | 0 | 0.00 | |
| 4 | 117 | 35.90 | 30 | 23.10 | |
| Combined | 326 | 100.00 | 130 | 100.00 | |
Table A8.
Have you ever shortened the reduced weekly rest period of 24 hours or the regular weekly rest period of 45 hours?
Table A8.
Have you ever shortened the reduced weekly rest period of 24 hours or the regular weekly rest period of 45 hours?
| 0-2 hours | 2-4 hours | 4 hours and more | never | ||||||
|---|---|---|---|---|---|---|---|---|---|
| Frequency | % | Frequency | % | Frequency | % | Frequency | % | ||
| Cluster | 1 | 0 | 0.00 | 0 | 0.00 | 4 | 23.50 | 122 | 31.00 |
| 2 | 23 | 62.20 | 0 | 0.00 | 8 | 47.10 | 64 | 16.30 | |
| 3 | 6 | 16.20 | 2 | 22.20 | 2 | 11.80 | 78 | 19.80 | |
| 4 | 8 | 21.60 | 7 | 77.80 | 3 | 17.60 | 129 | 32.80 | |
| Combined | 37 | 100.00 | 9 | 100.00 | 17 | 100.00 | 393 | 100.00 | |
Table A9.
Have you ever shortened the daily rest period to 9 hours (at most 3 times) or the daily rest period of 11 hours?
Table A9.
Have you ever shortened the daily rest period to 9 hours (at most 3 times) or the daily rest period of 11 hours?
| 0-1 hour | 1-2 hours | 2 hours and more | never | ||||||
|---|---|---|---|---|---|---|---|---|---|
| Frequency | % | Frequency | % | Frequency | % | Frequency | % | ||
| Cluster | 1 | 4 | 7.70 | 1 | 11.10 | 0 | 0.00 | 121 | 31.80 |
| 2 | 20 | 38.50 | 5 | 55.60 | 8 | 57.10 | 62 | 16.30 | |
| 3 | 9 | 17.30 | 0 | 0.00 | 1 | 7.10 | 78 | 20.50 | |
| 4 | 19 | 36.50 | 3 | 33.30 | 5 | 35.70 | 120 | 31.50 | |
| Combined | 52 | 100.00 | 9 | 100.00 | 14 | 100.00 | 381 | 100.00 | |
References
- Cambridge Dictionary. Available online: https://dictionary.cambridge.org/dictionary/english/logistics (accessed on 2022).
- Dvorak, Z.; Rehak, D.; David, A.; Cekerevac, Z. Qualitative approach to environmental risk assessment in transport. International Journal of Environmental Research and Public Health 2020, 17(15), 5494. [Google Scholar] [CrossRef]
- Abdullahi, H.; Reyes-Rubiano, L.; Ouelhadj, D.; Faulin, J.; Juan, A. A. Modelling and multi-criteria analysis of the sustainability dimensions for the green vehicle routing problem. European Journal of Operational Research 2021, 292(1), 143–154. [Google Scholar] [CrossRef]
- EC 561/2006. Available online: https://eur-lex.europa.eu/legal-content/EN/TXT/?qid=1708372919692&uri=CELEX%3A32006R0561.
- Poliak, M.; Mrnikova, M.; Simurkova, P.; Medvid, P.; Poliakova, A.; Hernandez, S. Social law in road transport like tool safety road transport. In 2018 XI International Science-Technical Conference Automotive Safety 2018, (pp. 1-7). [CrossRef]
- Zalcmanis, G.; Grislis, A.; Kreicbergs, J. Infringements of requirements of social legislation for drivers of commercial vehicles involved in road traffic accidents. In 13th International Scientific Conference on Engineering for Rural Development 2014, pp 221- 227. ISSN 1691-3043. [CrossRef]
- Morochovič, R.; Mandelík, J.; Vémola, A.; Obrátilová, A. Forensic evaluation of pedestrian injuries by FORTIS system and its significance for technical analysis of traffic accidents performed using simulation programs. Egyptian Journal of Forensic Sciences 2022, 12(1), 1–15. [Google Scholar] [CrossRef]
- Mou, Z.; Jin, C.; Wang, H.; Chen, Y.; Li, M.; Chen, Y. Spatial influence of engineering construction on traffic accidents, a case study of Jinan. Accident Analysis & Prevention 2022, Volume 177, 106825. [CrossRef]
- WHO Global Status Report on Road Safety 2018. Available online: https://issuu.com/globalncap/docs/who-status-report-eng.
- Suthanaya, P. A.; Sugiana, M. O. Identification of Traffic Accident Hazardous Location and Cost of Accidents in Developing Country (Case Study of Tabanan Regency, Bali-Indonesia). In International Conference on Rehabilitation and Maintenance in Civil Engineering 2022, volume 225, pp. 705-716. Singapore: Springer Nature Singapore. [CrossRef]
- Jiang, R.; Niu, X.; Zhang, H. Correlation Analysis of Traffic Accident Severity of the Heavy Trucks Based on Logistic Model. In International Conference on Man-Machine-Environment System Engineering 2022, vol 941. pp. 567-573. Singapore: Springer Nature Singapore. [CrossRef]
- Csiszár, C.; Földes, D. System model for autonomous road freight transportation. Promet-Traffic&Transportation 2018, 30, 93–103. [Google Scholar]
- Megías, A.; Navas, J.F.; Petrova, D.; Candido, A.; Maldonado, A.; Garcia-Retamero, R.; Catena, A. Neural mechanisms underlying urgent and evaluative behaviors: An fMRI study on the interaction of automatic and controlled processes. Human brain mapping 2015, 36(8), 2853–2864. [Google Scholar] [CrossRef]
- Megías, A.; Cándido, A.; Maldonado, A.; Catena, A. Neural correlates of risk perception as a function of risk level: An approach to the study of risk through a daily life task. Neuropsychologia 2018, 119, 464–473. [Google Scholar] [CrossRef] [PubMed]
- Yao, J.; Voas, R. B.; Lacey, J. H. Drivers with alcohol use disorders and their risks of crash involvement. Drug and alcohol dependence 2018, vol. 183, 210 -216. [CrossRef]
- Evangelidis, I. The role of restraint omission in alcohol-related traffic fatalities. Drug and alcohol dependence 2017, vol. 180, 423–426. [Google Scholar] [CrossRef]
- Aktaş, A., Akgür, S. A. Drinking, drug use and road rage in Turkish drivers. Transportation research part F: traffic psychology and behaviour 2022, volume 89, 16-28. [CrossRef]
- Institóris, L.; Hidvégi, E.; Kovács, K.; Jámbor, Á.; Dobos, A.; Rárosi, F.; Kereszty, É. M. Drug consumption of suspected drug-influenced drivers in Hungary (2016–2018). Forensic science international 2022, 336, 111325. [Google Scholar] [CrossRef] [PubMed]
- Sun, X.; Dong, J. Stress response and safe driving time of bus drivers in hot weather. International journal of environmental research and public health 2022, 19(15), 9662. [Google Scholar] [CrossRef] [PubMed]
- Driving time and rest periods. European Commission. 2022. Available online: https://transport.ec.europa.eu/transport-modes/road/social-provisions/driving-time-and-rest-periods_en.
- Tkaczynski, A. Segmentation using two-step cluster analysis. Segmentation in social marketing: Process, methods and application 2017, 109-125. Springer. [CrossRef]
- Fraboni, F.; Prati, G.; Casu, G.; De Angelis, M.; Pietrantoni, L. A cluster analysis of cyclists in Europe: Common patterns, behaviours, and attitudes. Transportation 2022, 49(2), 591–620. [Google Scholar] [CrossRef]
- Asadi-Pooya, A. A.; Bazrafshan, M.; Farazdaghi, M. Cluster analysis of a large dataset of patients with Lennox-Gastaut syndrome. Seizure 2021, 92, 36–39. [Google Scholar] [CrossRef] [PubMed]
- Lee, C.; Chee, W.; Im, E. O.; Kim, S. TCTAP A-107 Socioeconomic Inequalities in Cardiovascular Risk Factors: A Two-step Cluster Analysis. Journal of the American College of Cardiology 2019, 73(15S), S55–S55. [Google Scholar] [CrossRef]
- Mohamed, N.; Awang, S. R. The multiple intelligence classification of management graduates using two step cluster analysis. Malaysian Journal of Fundamental and Applied Sciences 2015, 11, 48–51. [Google Scholar] [CrossRef]
- Şchiopu, D. Applying TwoStep cluster analysis for identifying bank customers’ profile. Buletinul 2010, 62(3), 66–75. [Google Scholar]
- TwoStep Cluster Analysis. IBM Docs. Available online: https://prod.ibmdocs-production-dal-6099123ce774e592a519d7c33db8265e-0000.us-south.containers.appdomain.cloud/docs/en/spss-statistics/28.0.0?topic=features-twostep-cluster-analysis.
- Budi Astuti, A.; Achmad Rinaldo Fernandes, A.; Amaliana, L.; Yanti, I.; Isaskar, R. Two Step Cluster Analysis for Tourist Segmentation Coastal Object for Green Marketing Strategy. IOP Conference Series: Earth and Environmental Science 2019, 239, 012019. [Google Scholar]
- Rađenović, Ž.; Boshkov, T. Economic effects of congress tourism: Two-step cluster approach. Challenges of Tourism and Business Logistics in the 21st Century 2022, 5(1), 185–192. [Google Scholar] [CrossRef]
- Silhouette Coefficient - An overview, ScienceDirect Topics. (n.d.). Available online: https://www.sciencedirect.com/topics/computer-science/silhouette-coefficient (accessed on 1.9.2022).
- Supandi, A.; Saefuddin, A.; Sulvianti, I. D. Two step cluster application to classify villages in Kabupaten Madiun based on village potential data. Journal of Statistics 2021, 10(1), Article 1. [CrossRef]
Figure 1.
Clusters (sort inputs by overall importance).
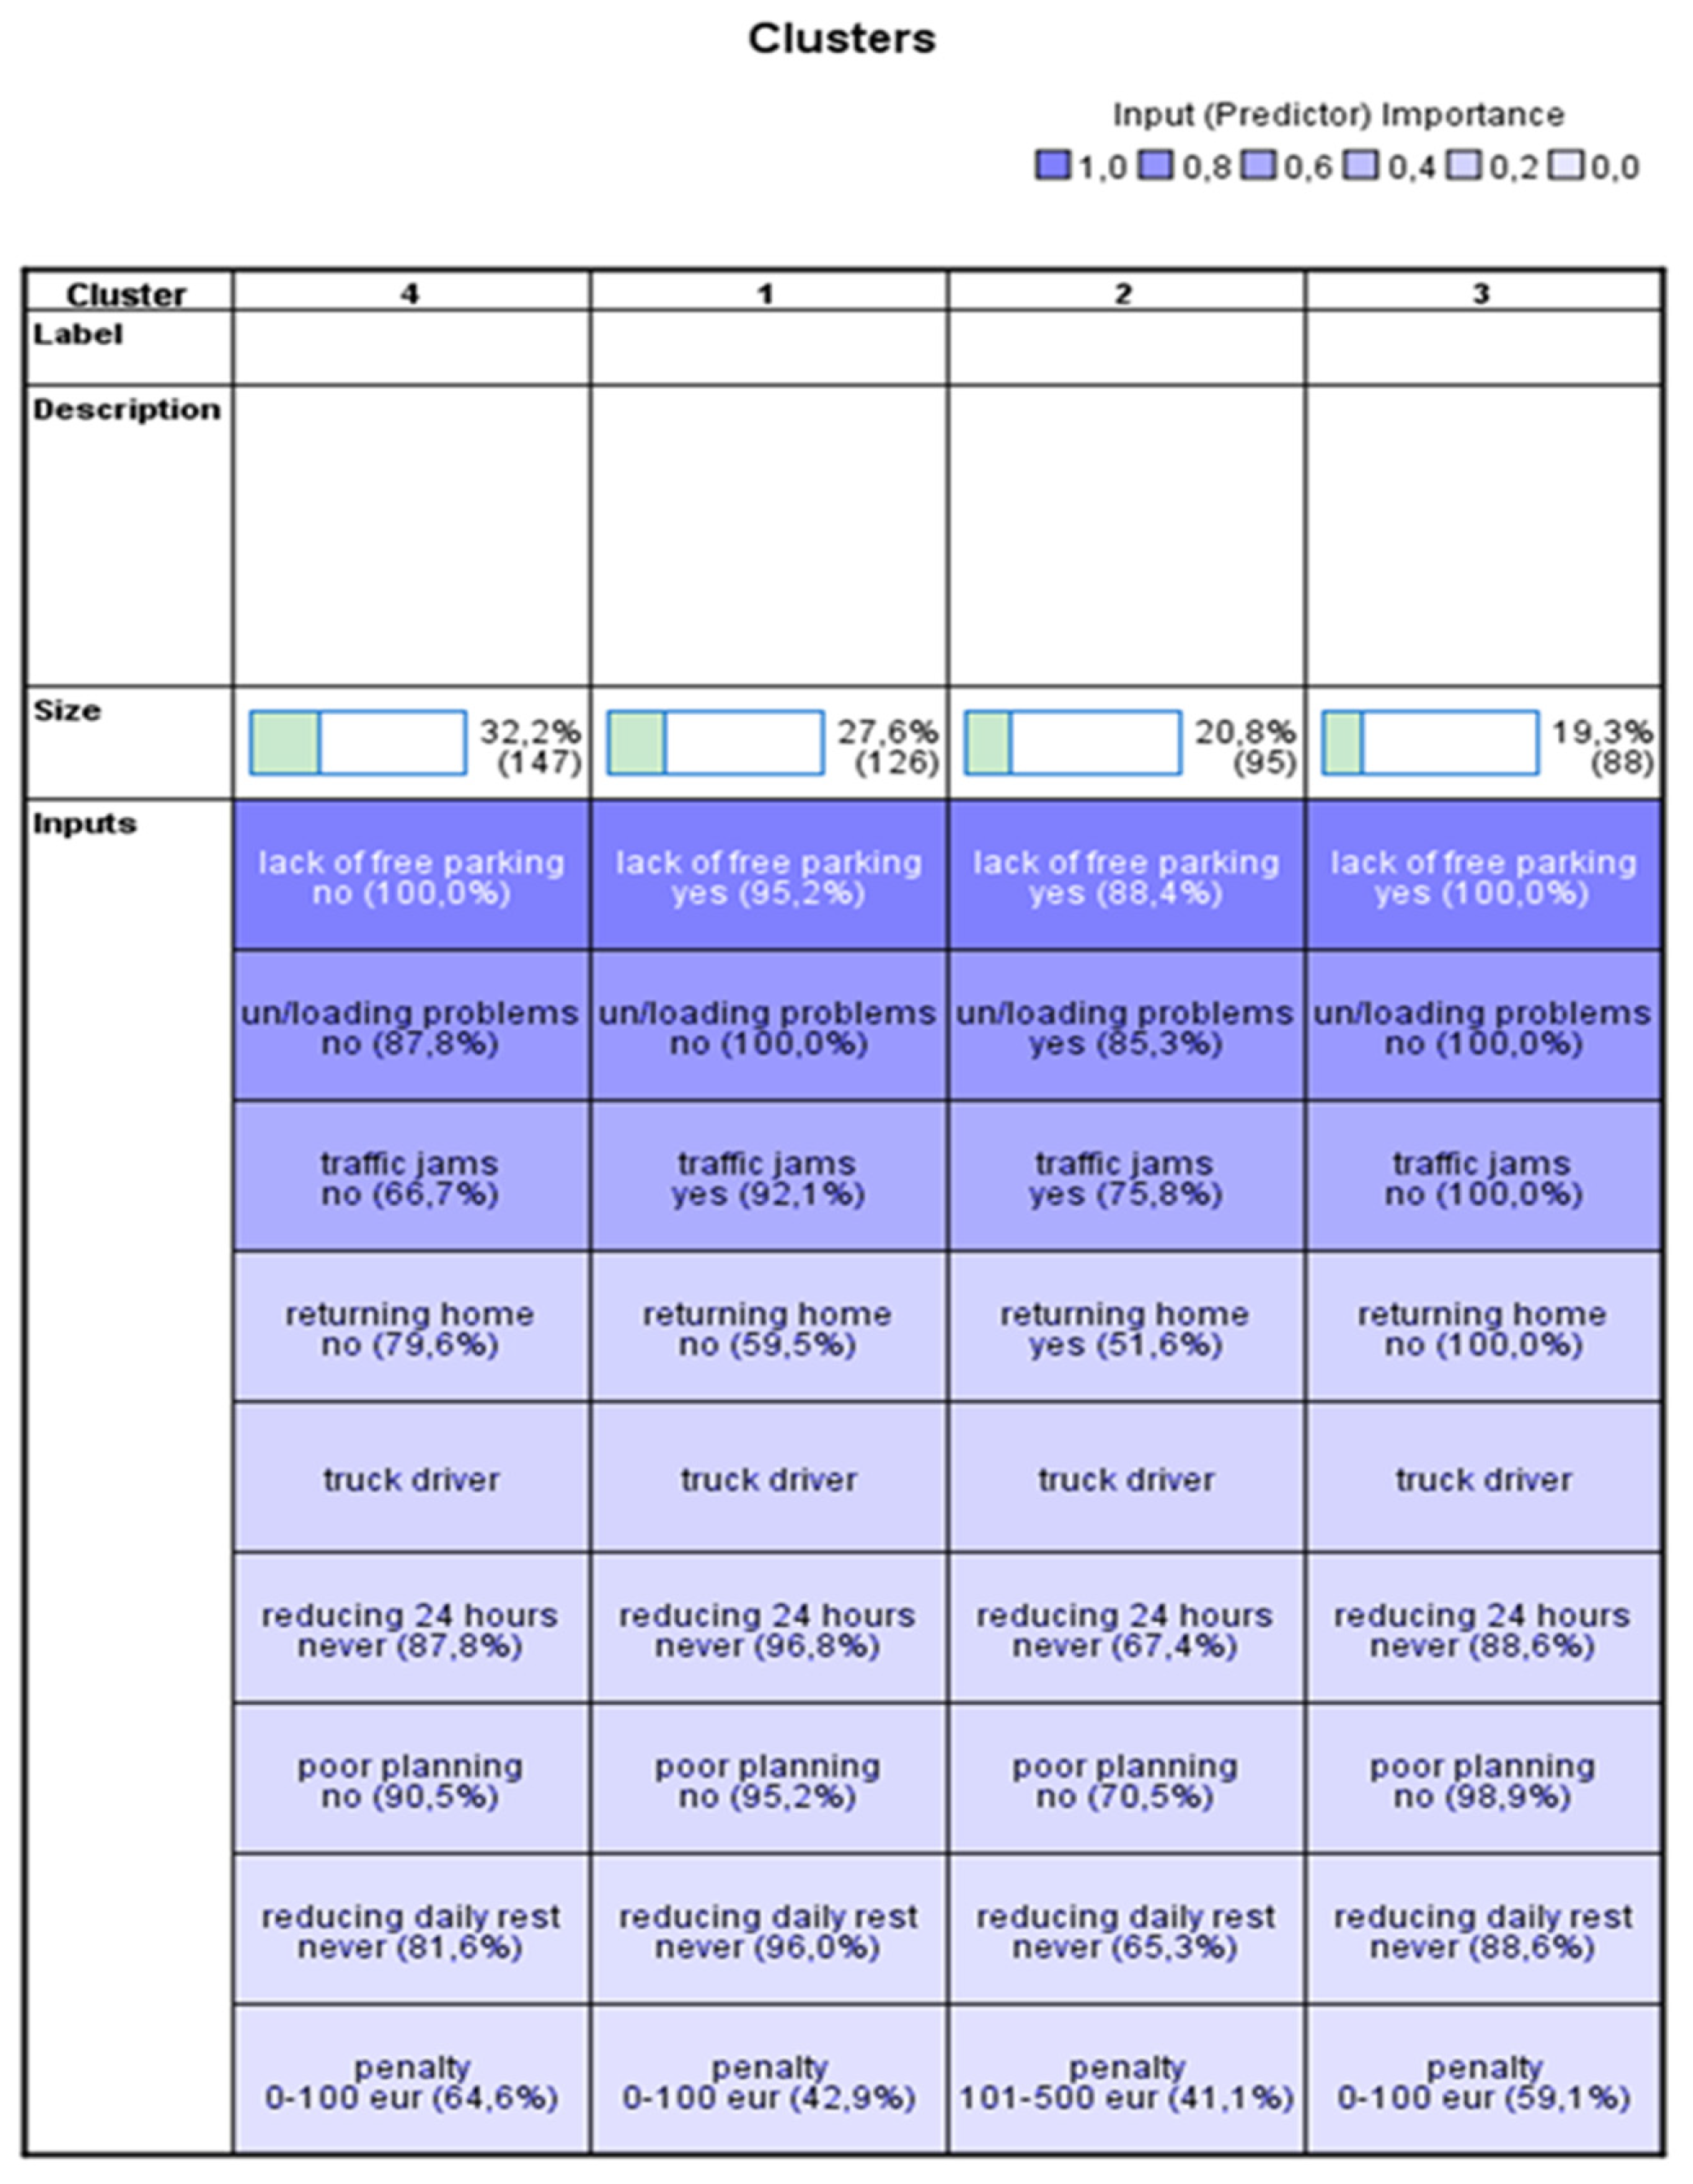
Figure 2.
Cluster comparison.
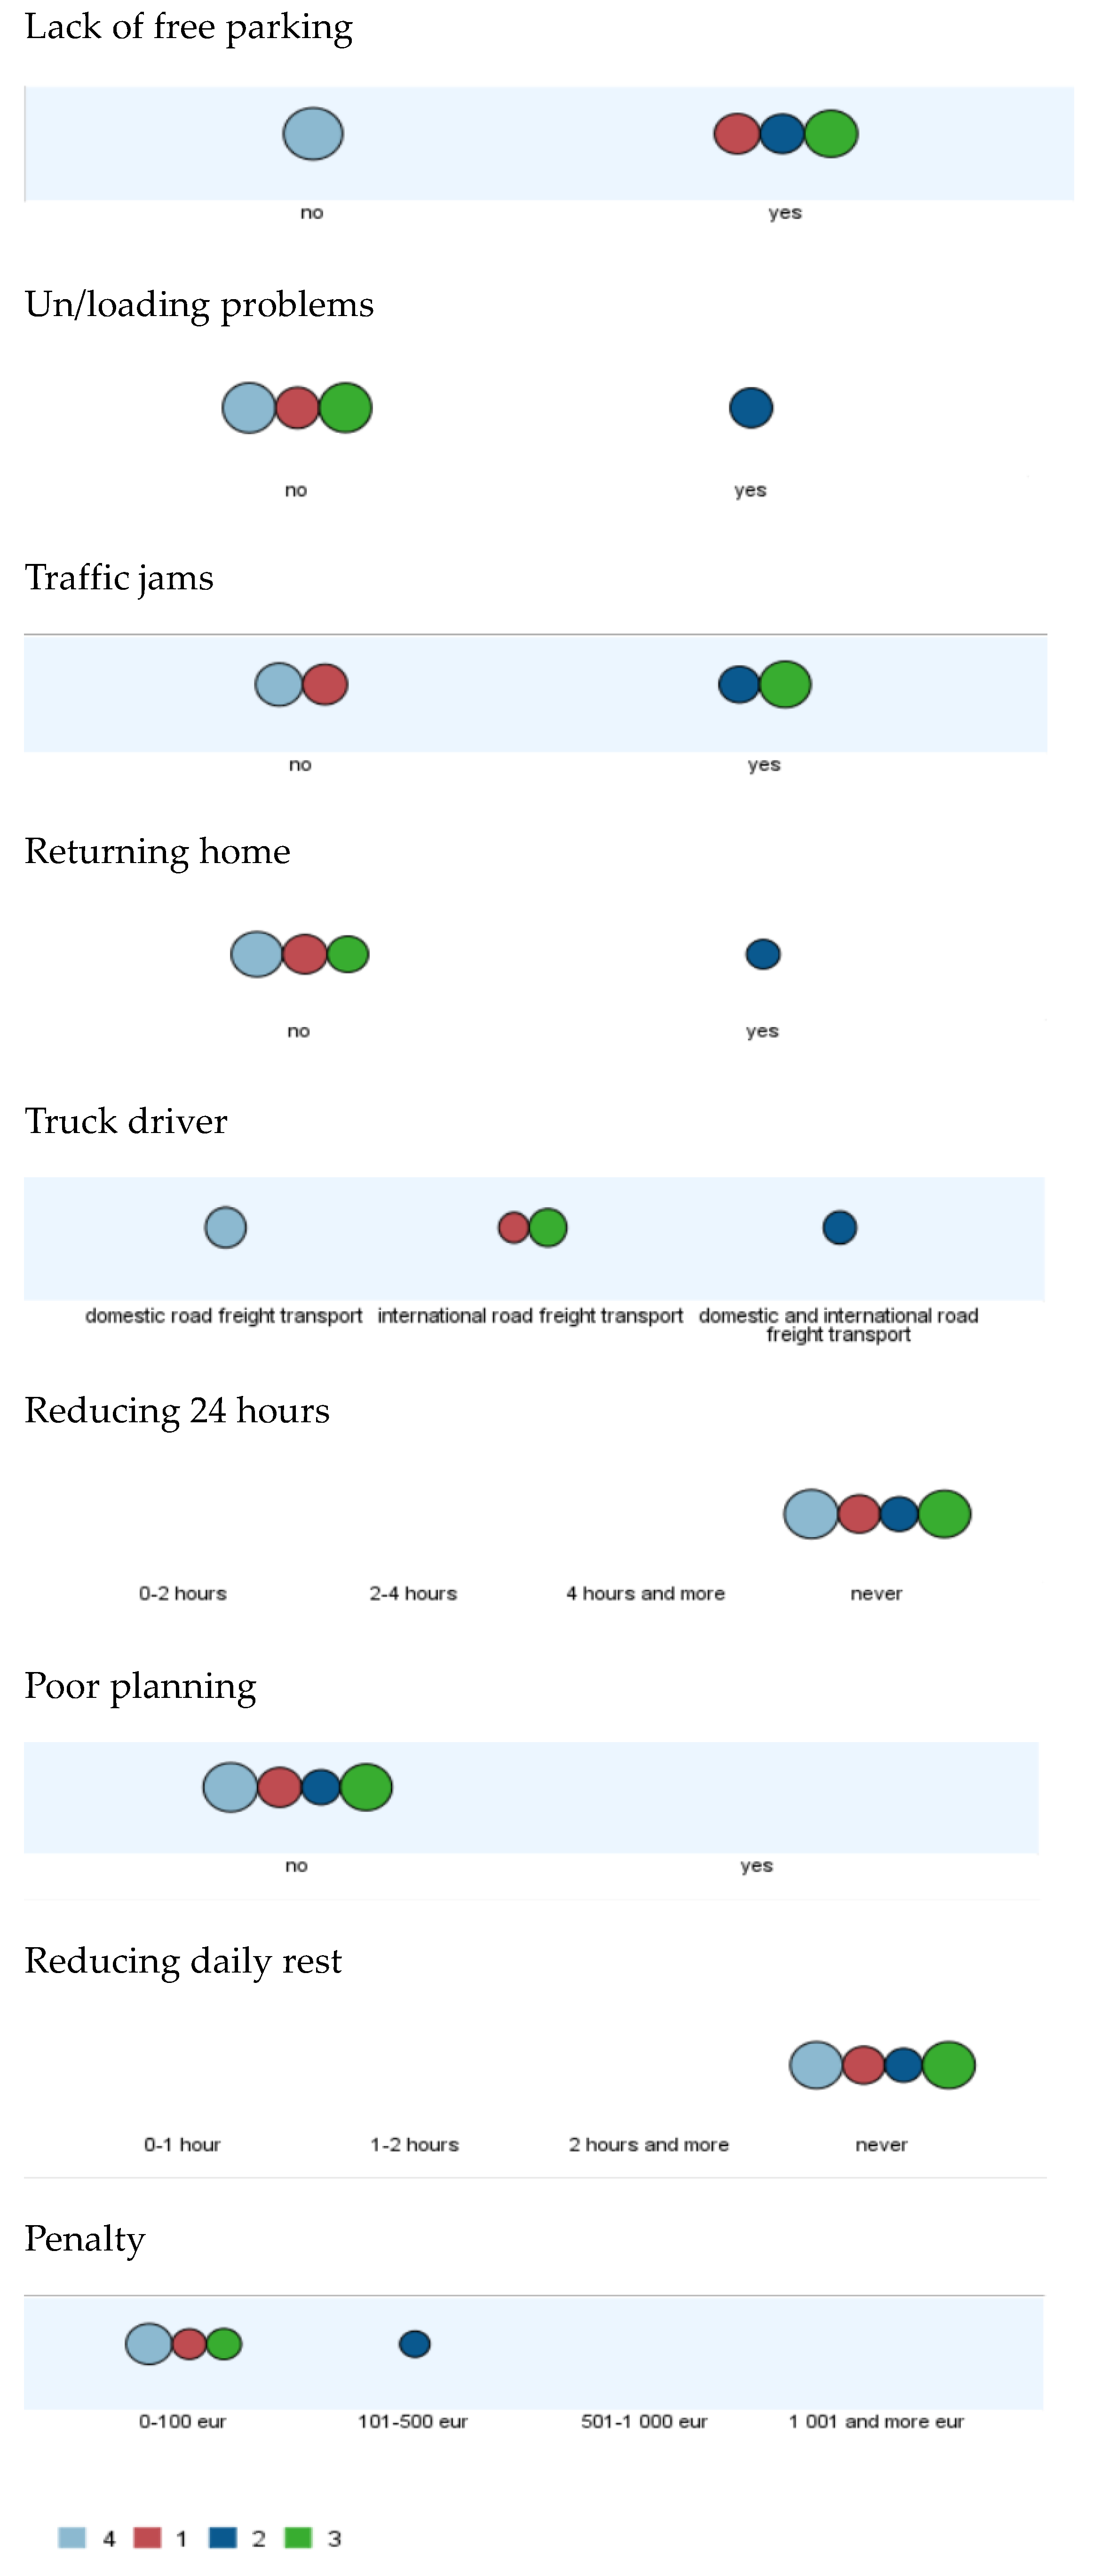
Table 1.
Maximum driving times and minimum rest period [5].
Table 1.
Maximum driving times and minimum rest period [5].
| Requirement | EU | USA | Canada | Australia | New Zealand |
|---|---|---|---|---|---|
| Continuous driving | 4.5 h | 8 h | 13/15 h | 5.25 h | 5.5 h |
| Break | 45 min | 30 min | - | 15 min | 30 min |
| Daily driving time | 9 h | 11 h | 13/15 h | 12 h | 13h |
| Daily rest period | 9 h | 11 h | 10/8 h | 7 h | 10 h |
| Weekly driving time | 56 h | 60/70 h | 70/80 h | 72 h | 70 h |
| Weekly rest period | 45 h | 34 h | 36 h | 24 h | 24 h |
| Bi-weekly driving time | 90 h | 120/148 h | 147 h | 144 h | 166 h |
Table 2.
The initial sample.
| Trucker driver for | |||||||
|---|---|---|---|---|---|---|---|
| Country | Domestic road freight transport | International road freight transport | Domestic and international road freight transport | Total | |||
| SK | Age | 20 – 30 years | 14 | 18 | 27 | 59 | |
| 31 – 40 years | 27 | 30 | 35 | 92 | |||
| 41 – 50 years | 18 | 29 | 29 | 76 | |||
| 51 – 60 years | 4 | 18 | 14 | 36 | |||
| 61 – 70 years | 3 | 6 | 3 | 12 | |||
| Total | 66 | 101 | 108 | 275 | |||
| CZ | Age | 20 – 30 years | 4 | 5 | 7 | 16 | |
| 31 – 40 years | 12 | 23 | 16 | 51 | |||
| 41 – 50 years | 18 | 31 | 22 | 71 | |||
| 51 – 60 years | 12 | 28 | 16 | 56 | |||
| 61 – 70 years | 0 | 1 | 2 | 3 | |||
| Total | 46 | 88 | 63 | 197 | |||
| Total | Age | 20 – 30 years | 18 | 23 | 34 | 75 | |
| 31 – 40 years | 39 | 53 | 51 | 143 | |||
| 41 – 50 years | 36 | 60 | 51 | 147 | |||
| 51 – 60 years | 16 | 46 | 30 | 92 | |||
| 61 – 70 years | 3 | 7 | 5 | 15 | |||
| Total | 112 | 189 | 171 | 472 | |||
Table 3.
Auto-Clustering.
| Number of Clusters | Schwarz’s Bayesian Criterion (BIC) | BIC Changea | Ratio of BIC Changesb | Ratio of Distance Measuresc |
|---|---|---|---|---|
| 1 | 5,642.162 | |||
| 2 | 5,163.329 | -478.833 | 1.000 | 1.350 |
| 3 | 4,833.969 | -329.361 | 0.688 | 1.459 |
| 4 | 4,639.009 | -194.960 | 0.407 | 1.416 |
| 5 | 4,530.111 | -108.898 | 0.227 | 1.223 |
| 6 | 4,458.978 | -71.132 | 0.149 | 1.060 |
| 7 | 4,397.483 | -61.495 | 0.128 | 1.107 |
| 8 | 4,351.461 | -46.022 | 0.096 | 1.054 |
| 9 | 4,312.812 | -38.649 | 0.081 | 1.156 |
| 10 | 4,292.555 | -20.257 | 0.042 | 1.112 |
| 11 | 4,284.162 | -8.393 | 0.018 | 1.036 |
| 12 | 4,279.504 | -4.657 | 0.010 | 1.030 |
| 13 | 4,277.818 | -1.686 | 0.004 | 1.038 |
| 14 | 4,279.822 | 2.004 | -0.004 | 1.113 |
| 15 | 4,291.600 | 11.778 | -0.025 | 1.044 |
a the changes are from the previous number of clusters in the table. b the ratios of changes are relative to the change for the two-cluster solution. c the ratios of distance measures are based on the current number of clusters against the previous number of clusters.
Table 4.
Four clusters.
| N | % of Combined | % of Total | ||
|---|---|---|---|---|
| Cluster | 1 | 126 | 27.60 | 26.10 |
| 2 | 95 | 20.80 | 19.70 | |
| 3 | 88 | 19.30 | 18.20 | |
| 4 | 147 | 32.20 | 30.40 | |
| Combined | 456 | 100.00 | 94.40 | |
| Excluded Cases | 27 | 5.60 | ||
| Total | 483 | 100.00 | ||
Disclaimer/Publisher’s Note: The statements, opinions and data contained in all publications are solely those of the individual author(s) and contributor(s) and not of MDPI and/or the editor(s). MDPI and/or the editor(s) disclaim responsibility for any injury to people or property resulting from any ideas, methods, instructions or products referred to in the content. |
© 2024 by the authors. Licensee MDPI, Basel, Switzerland. This article is an open access article distributed under the terms and conditions of the Creative Commons Attribution (CC BY) license (http://creativecommons.org/licenses/by/4.0/).
Copyright: This open access article is published under a Creative Commons CC BY 4.0 license, which permit the free download, distribution, and reuse, provided that the author and preprint are cited in any reuse.


