
Submitted:
21 February 2024
Posted:
22 February 2024
You are already at the latest version
Abstract
The hyper-arid environment is characterized by high inter-annual climatic fluctuations. The yearly average rainfall can change substantially for several years, forming wet or dry sub-periods. Observing rainfall trends over a sub-period can lead to a false perception of a change in the trend but may in fact represent a periodic cycle when examined on a larger time scale. We aimed to better characterize the rainfall regime prevailing in the hyper-arid Arava Valley (Israel/Jordan), and to examine the response of vegetation to annual rainfall. We hypothesized that annual and perennial vegetation would respond differently to wet and dry sub-periods, and that grazing activities will impact vegetation growth. We used a time series of monthly rainfall, from which we calculated Standard Precipitation Index (SPI), and calculated proxies of perennial and annual vegetation over the last four decades using Landsat-derived Normalized Difference Vegetation Index (NDVI). We found no clear trend in rainfall amounts during this period, however we did identify wet and dry sub-periods which were statistically distinct in rain and in vegetation patterns from each other. The highest levels of correlation between rainfall and the NDVI derived proxies were found when examining average rainfall over a period of two- three years for the annual vegetation and over four years for perennial vegetation. Using the Mann-Kendall test, we identified a time lag of two to four years, with the proxies of annual vegetation responding faster than the proxies of perennial vegetation, to shifts between wet and dry sub-period. In addition, we found a consistent difference between natural vegetation cover in Jordan (grazed) and Israel (non-grazed), favoring the development of natural vegetation on the Israeli side. We conclude that integrating between long-term remote sensing satellite imagery and climatic records revealed the greater resilience of perennial vegetation in the hyper-arid region to climatic fluctuation, and enabled us to identify the vegetation’s sensitivity to anthropogenic impact.
Keywords:
Hyper arid environment
; rainfall trend
; vegetation dynamics
; time lag
; land management
1. Introduction
Drylands constitute about 40% of the world’s land area, of which about a quarter are considered to be hyper-arid environments (HAE) with harsh climatic conditions [1]. Drylands are characterized by high inter-annual variability in rainfall [2,3], however, the variability and the uncertainty of rainfall events are much greater in the hyper-arid climate zone, and prolonged droughts occur more regularly [4,5,6,7]. To survive the high inter-annual climatic fluctuations, vegetation in arid environments has developed various mechanisms to survive, including flowering strategies, seed dormancy, germination when suitable environmental conditions occur, and many others [8]. Statistically, the re-occurrence of extreme events under the arid lands hardens the identification of rainfall trends [8], often leading to contradicting results with limited statistical significance, that can also vary based on the temporal window over which observations are available [9]. Therefore, we propose that by identifying dry and wet sub-periods, we can better understand the climate and vegetation relations in areas with high interannual variability in rainfall amounts.
The response of vegetation entering or exiting a drought period often reflects not only the current climatic conditions but also prior conditions. Water surpluses from rainy years may enable plants to survive the first years of drought through local underground water reservoirs, whereas post-drought vegetation recovery may be delayed as the plant rehabilitates its root system that deteriorated during the dry period [9,10]. The time between the change in the climatic conditions to the response of the vegetation is termed vegetation recovery/decline time lag. Wu et al. [11], who studied the recovery period following drought periods in temperate regions, revealed that grass recovers the year after the drought ends, shrubs recover after two years, and trees recover fully only after four years. Siegal et al. [12] showed similar results for the recovery period of perennial desert dune vegetation in an arid region. Zhao et al. [10] demonstrated the decline of shrub vegetation following a three-month drought period, claiming that the major factor limiting vegetation growth was soil moisture. None of these studies were executed in the hyper-arid environment and they did not examine the full process of vegetation recovery and decline over a long time scale.
As vegetation cover is not only influenced by climatic conditions but also by direct anthropogenic impact, attributing the extent of the human impact is a challenging task. Grazing by domesticated animals, such as goats, sheep, and camels, is widely recognized for its broad spatial effects on vegetation cover [12,13,14,15,16,17]. These effects encompass changes in foliage density, variations in the composition of vegetation types, disruption of topsoil layers, impacts on water penetration, and many more. The nature of these effects can vary based on numerous parameters, including local geographical factors such as climate, soil characteristics, and topography, or by specific grazing practices such as species, grazing intensity, duration, and various other factors. While grazing has been extensively studied, the effect of grazing in a hyper-arid environment has received much less attention in the scientific literature, A Web of Science search we conducted using the keywords “grazing” and “arid environment” in the last 50 years retrieved 1855 papers, compared with only 17 papers using “grazing” and “hyper-arid environment”, a mere 1% of studies compared with its neighboring arid environment. This substantial difference emphasizes the importance of evaluating the effects of grazing on the hyper-arid environment.
Climatic rainfall conditions can be evaluated by normalizing monthly rainfall measurements into local adjusted drought indices such as the Standard Precipitation Index (SPI), [18]. The use of SPI to identify droughts and determine their temporal variability and severity in the hyper-arid environment was evaluated and confirmed by Ejaz and Bahrawi [19]. Khosravi et al. [20] evaluated the correlation between SPI and several vegetation classes indicating that pasture vegetation is highly sensitive to changes in the level of SPI, while farming lands showed less sensitivity in the short term when deep wells are used for irrigation. Previous studies [8,12,21,22] have indicated that the cumulative effect of changes in vegetation cover due to successive drought years or anthropogenic interference must be observed at a multiyear time scale, as perennial plant mortality can be delayed by several years.
Remote Sensing (RS) imagery has been proven to be a useful and objective method for monitoring changes in vegetation cover over large areas throughout relatively long periods (multiple years) [20]. The Normalized Difference Vegetation Index (NDVI) [23] is a well-known RS method used to asses temporal vegetation cover and identify the trend in which changes occur over time, under a variety of climatic conditions, including the scarce vegetation cover of dry lands [7,12,14,24,25,26,27].
Between 1994 and 2009, 15 consecutive years of drought prevailed in the Arava Valley, a desert valley shared between Israel and Jordan [28]. The significantly lower yearly rainfall and fewer flash floods during those years caused a decline in the natural vegetation cover in the open lands and near the natural springs of the area [28,29]. Several papers documenting this period claimed that southern Israel was undergoing a drying process [28,30,31]. However, in recent years a different trend has been observed, with a significant increase in precipitation and in the number of flash floods per year [32]. Such fluctuations in rainfall demonstrate the importance of observing long-term climatic records and conducting valid statistical analyses [3,33,34,35,36].
Integrating long-term climate records with RS monitoring of vegetation cover can improve our understanding of the resilience of desert vegetation experiencing dramatic climatic changes. The Arava Valley, with its unique ability to provide comprehensive long-term data, serves as an ideal study area for assessing the response of natural vegetation to climatic fluctuations.
In this study, we focused on the open areas of the Arava Valley, (Figure 1) and assessed the rainfall amounts according to their trend and by clusters of wet and dry sub periods. We studied the relations between natural vegetation and observed climatic variability, assessed vegetation's response to climatic changes, and compared areas that have been directly affected by anthropogenic stressors to ones which haven’t. Our study evaluated the temporal and spatial patterns in the response of vegetation to climatic variability separately for the two common forms of vascular vegetation in the desert: annual and perennial vegetation [37,38].
The study addressed these topics through the following research objectives:
- Assessing the long-term trends in rainfall patterns in the Arava Valley over the past four decades and investigating the potential subdivision into climatic periods based on clusters of distinct "wet" and "dry" sub-periods;
- Evaluating the correlation between the yearly and the multi yearly accumulated rainfall and NDVI proxies for perennial and annual vegetation in a hyper-arid environment;
- Comparing the temporal dynamics of vegetation recovery and decline in response to climatic changes within the Arava Valley, specifically examining whether these dynamics differ between annual and perennial vegetation types;
- Identifying differences in vegetation growth between grazed and non-grazed areas within a hyper-arid environment.
We hypothesized that we would be able to detect short-term cycles of climatic variability in annual rainfall, i.e., distinct wet and dry sub-periods. Given that rainfall is the main limiting factor for vegetation in hot deserts [39,40], we assumed that the proxies for vegetation cover of annual and of perennial plants will be highly correlated to rainfall amounts in the hyper-arid region. We expected that the proxies for vegetation cover of the annuals and the perennials will respond differently to dry or wet periods, because of their different adaptations to this extreme environment. As for the impact of human activity, we hypothesized that vegetation cover in the non-grazed areas would be higher than in the grazed areas.
2. Methodology
2.1. Study Area
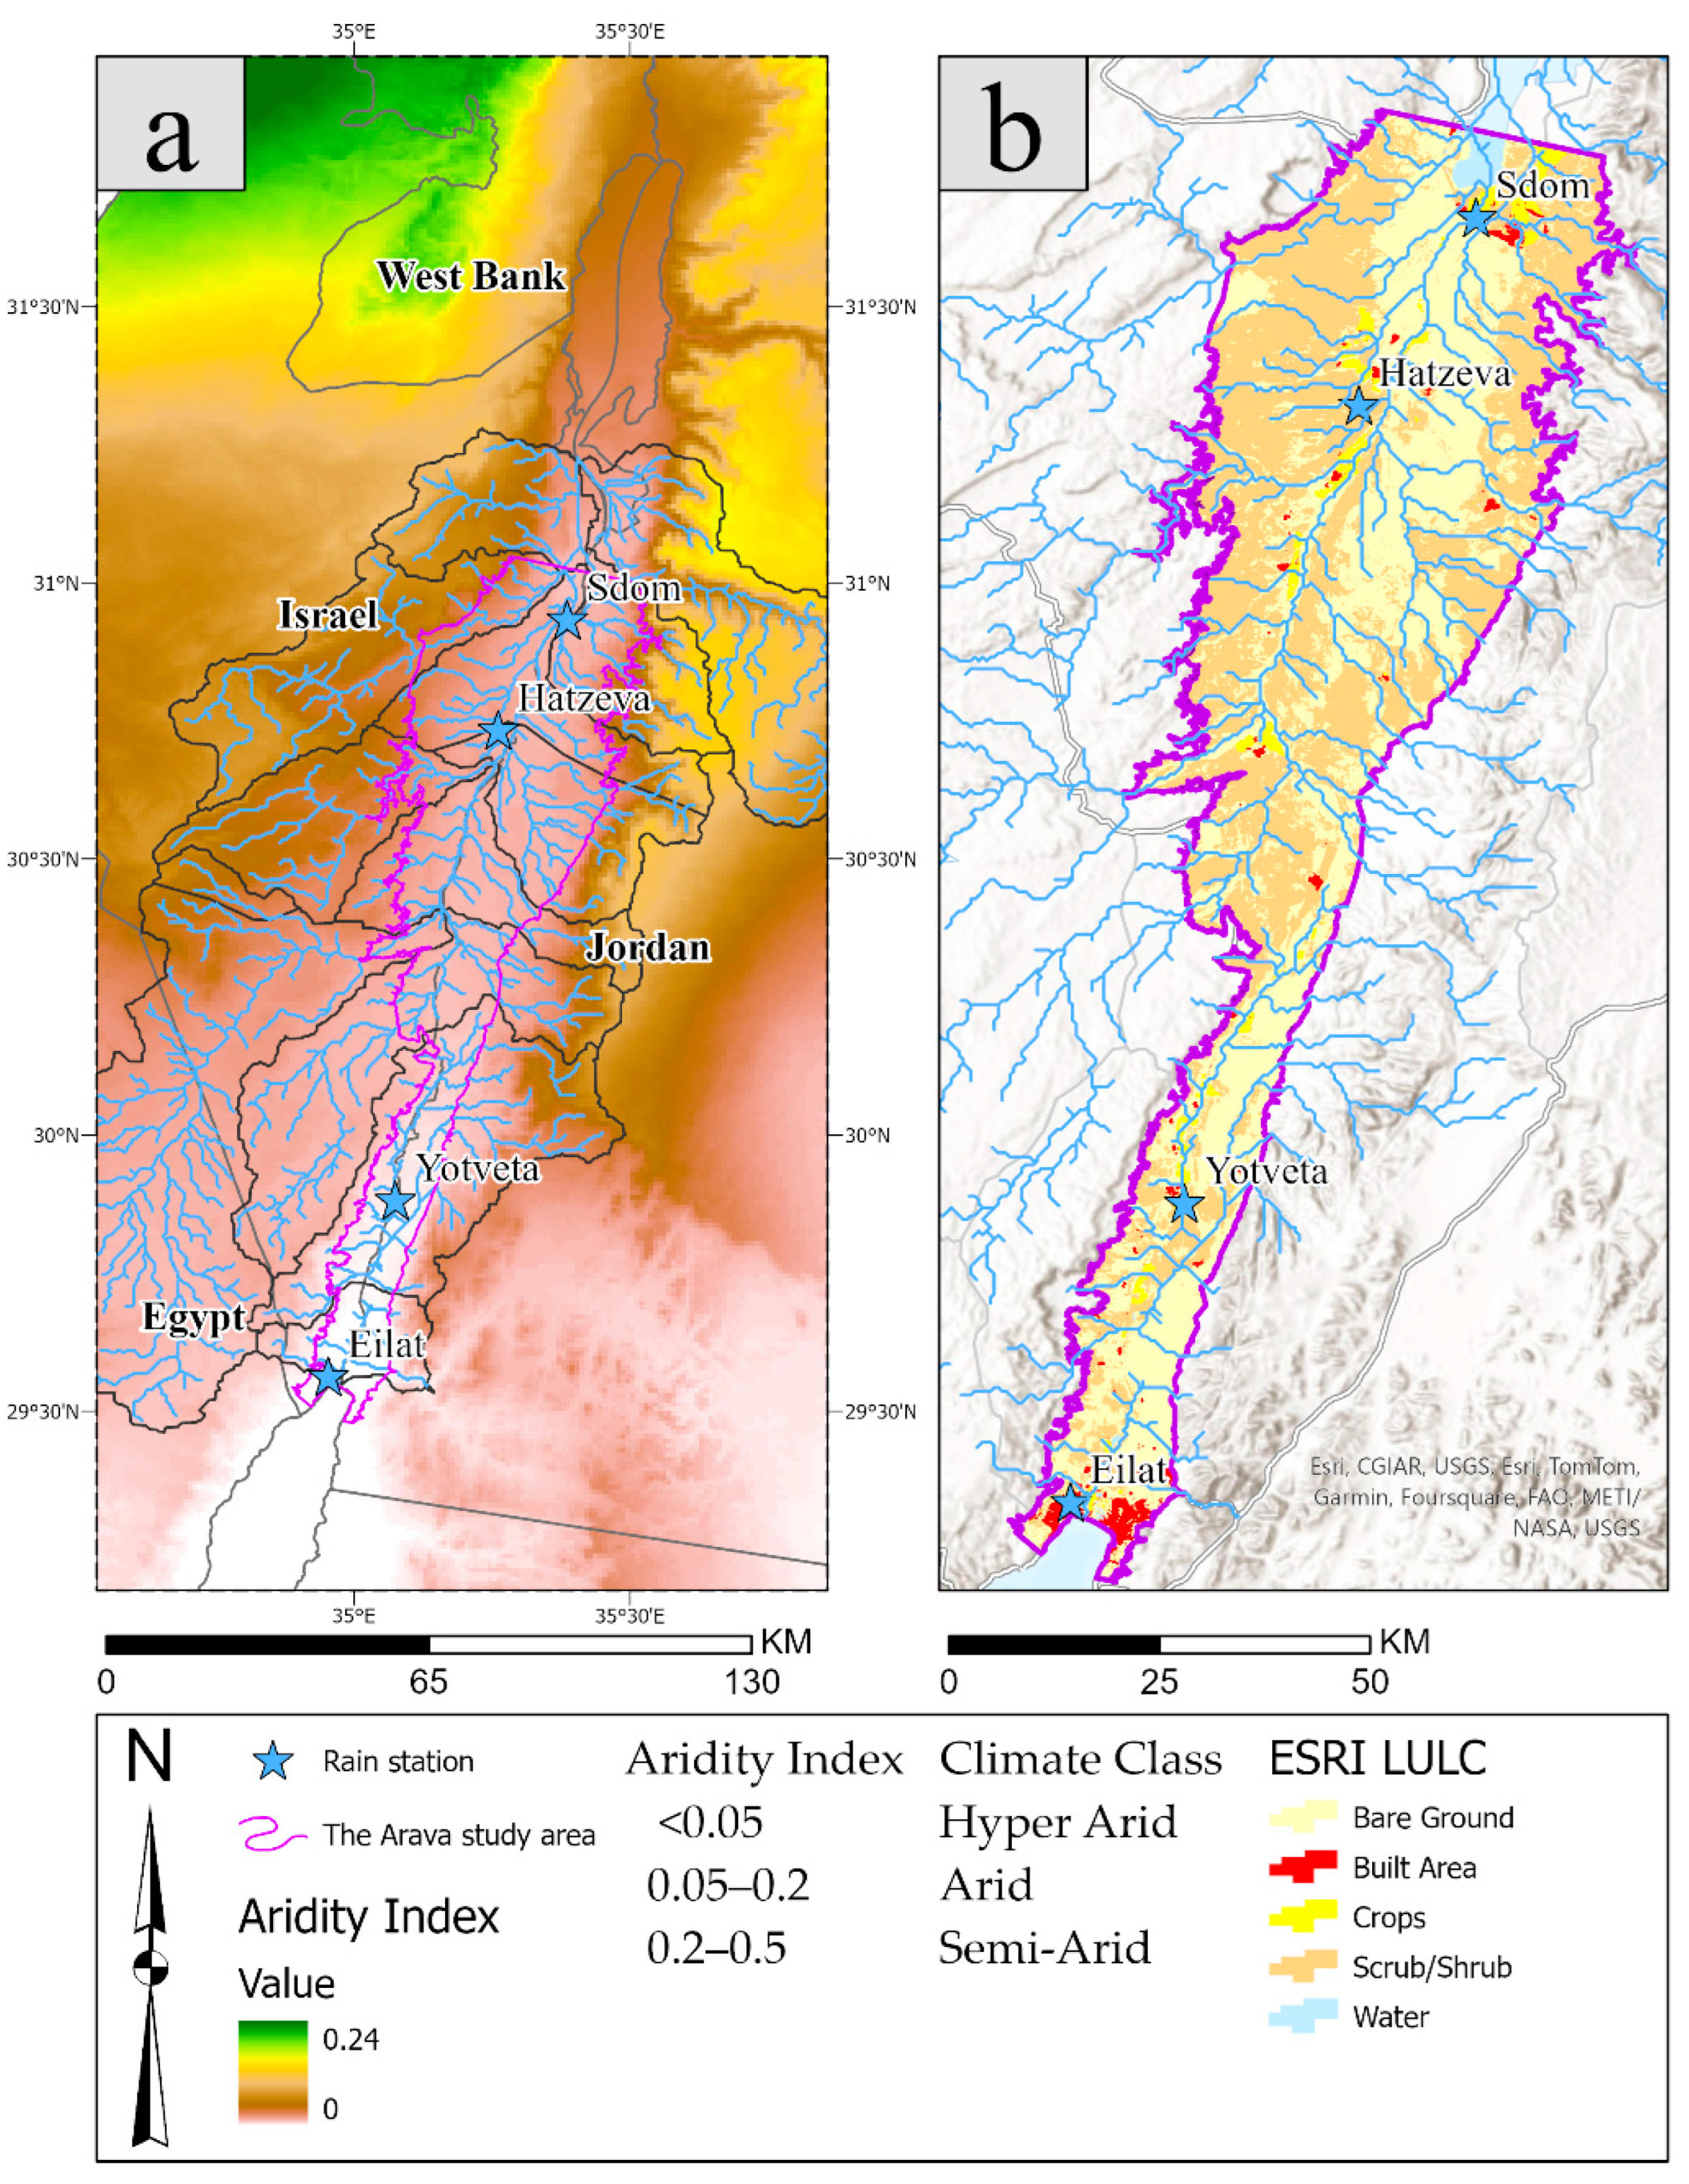
The Arava desert is a long and narrow geographical zone (180 km long and 5-15 km wide) bounded by the Dead Sea and the Gulf of Aqaba in the north and south, and the Negev Hills (Israel) and the Edom Mountains (Jordan) in the west and east. The Arava varies in elevation between -380m and 210m above sea level. The Arava Valley is the southern segment of the Dead Sea transform fault. Geomorphologically, it acts as a sedimentary basin filled with many fluvial and alluvial materials. The young geological sedimentary surface of the Arava is comprised of active and non-active alluvial fans, sand dunes, and salt marsh sediments (mostly clays and gypsum). The young sediment layers range in depth between several meters and up to 10 km near the Dead Sea [45,46].
Rain in the Arava is mainly associated with the Red Sea Trough synoptic system, which is mostly active during autumn (October-November), and spring (March-April) [47,48]. The northern Arava can also be affected by the Cyprus Lows, which bring moisture from the Mediterranean Sea [49]. The annual rainfall in the Arava Valley ranges between 25-50mm. Spatial and temporal variability in rainfall and in evaporation are high in this region [50]. According to the aridity index [42], the area is defined as hyper-arid (aridity index values range between 1-2; Figure 1). In the hyper-arid region, as opposed to the arid or more humid environments, the vegetation grows only within the active ephemeral streams, and not under any morphological structure, to increase water availability [5,37] as can be seen in Figure 2.
The Arava Valley desert is a highly important ecological habitat and transition zone that bridges between Africa, Asia, and Europe. The Arava geographical topographical structure, a bottleneck plateau, facilitates the movement of plants and animals and a home for many endemic species [51]. A well-known example is the bird migration route [52], in which about 500 million birds cross the Arava Valley in spring and autumn. The birds rely on the warm thermocline of the Valley and the presence of dense vegetation islands for resting and refueling for their journey [53]. The Arava is considered a phytogeographic part of the Saharo-Arabian region but due to its warm winters, some of the vegetation is classified as Sudanic vegetation. The dominant canopy trees are Acacia Tortilis and Acacia Raddiana [37], which grow within the wadis.
2.2. Database, Processing and Analysis
The rainfall and vegetation dynamics at the Arava Valley were assessed using the following methodological approach (Figure 3).
2.2.1. Meteorological Rainfall Data
The rainfall database was obtained from the Israeli Meteorological Survey (IMS). Rainfall data was collected from meteorological rain stations in the Arava Valley with a minimum of 30 years of records. The selected rain stations include Eilat (1950-2022), Yotveta (1954-1968, 1974-2022), Hatzeva (1973-1975, 1988-2022), and Sdom (1959-2022) (Figure 1).
To answer the first research question, we evaluated climatic rainfall in two stages. (1). We used the Mann-Kendall Tau test to evaluate possible trends in rainfall, and (2). We identified the rainfall sub-periods using the Standardized Precipitation Index and differentiated extreme sub-periods.
These two steps were performed as follows:
Assessing the Rainfall Trend
We have used the Mann-Kendall Tau test (M-K) to assess temporal trends in rainfall. the M-K method is a widely-used non-parametric trend test that ranks the magnitude and direction of the trend of a variable over time [54,55]. It is commonly used in spatial and climatic geographical studies [22,56]. The daily rainfall measurements were summed into a yearly cumulative rainfall amounts, according to rain years (a time period of 12 months which starts on the 1st of October and ends on 30th September) and the trend was assessed at a significance level of p≤0.05.
Computing the Standardized Precipitation Index (SPI)
The SPI computation was based on the calculation developed by Kumar et al. and the World Meteorological Organization [18,57]. The data of the long-term monthly rainfall time series from each station was fitted to a gamma distribution function which was thus transformed into a normal distribution. The SPI values can be interpreted as the number of standard deviations by which the observed anomaly deviates from the long-term mean. The definition of the SPI values is seen in Table 1. The SPI was calculated for 12, 24, 36, and 48 months, and we adopted the 36-month window to capture localized temporal trends. The 36 month calculation is in accordance with the WMO recommendations for SPIs for long accumulation periods. The calculations were done using the Python script given in a GitHub page [58].
Evaluating Climatic Sub-Periods
Based on the SPI results, we clustered the years in which the maximum (> 1) or minimum (< -1) value in a moving window of 19 months was defined as wet or drought. The cluster is based on a 19-month running window as it is half (+1 to evenly account for periods before and after each assessed year) of the 36-month period used for the SPI calculation.
Additionally, we examined the correspondence between the rainfall at the four meteorological stations to better characterize the rainfall over the Arava. We have done so with the use of the Spearman correlation test over the 36-month SPI results and the monthly rainfall measurements at each station (n=432) for the period 1987-2022 (the period over which the data is continuous in all the stations).
2.2.2. Remote Sensing Imagery
To evaluate vegetation cover we used the NDVI remote sensing index. We opted the NDVI over other indices such as SAVI or MSAVI [61], because they require additional adjustments according to soil type and vegetation density. Given our extensive time frame, spatial coverage, and diverse soil compositions, applying such adjustments would have been impractical [62].
We derived NDVI from Landsat 5, 7, and 8 satellites, using the Landsat L2, C2, Tier 1 collection, 1984-2021, revisit time of 16 days, the data is atmospherically and radiometrically corrected [63,64]. We processed and downloaded at a spatial resolution of 30 meters using the Google Earth Engine (GEE) Platform. We used the ESRI 2020 land use mapping [65] to exclude any land use which is not natural, (i.e., built-up or agricultural areas, see Figure 1) from the images.
We used the time series of NDVI to differentiate vegetation cover into a proxy of the two common types of vascular vegetation in the desert: annual and perennial vegetation. The vegetation proxies were constructed based on the typical local vegetation phenological cycle of each.
Proxies of Vegetation Cover
-
Annual vegetation cover reaches its highest NDVI values following a few intensive rainfall events and diminishes quickly as temperatures rise and water becomes unavailable at the end of the winter season [66,67,68].
- Thus, for every image in the Landsat collection, we calculated per-pixel the yearly maximum NDVI values within the rainfall season, (a 12-month period beginning October 1) and constructed them as a yearly mosaic of the maximum NDVI values. Together they form the time series of the annual vegetation for the years 1984-2021. The proxy is referred, annualprox. The annualprox cover was done similarly to [14,69]
-
Perennial vegetation can be photosynthetically active throughout the year but shows its highest spectral response towards the late spring (May-June), while at this time the annual vegetation is mostly absent [12,68].
- Thus, for every set of annual images in the Landsat collection, we calculated per-pixel the yearly maximum NDVI values found in May and June (i.e., late spring) and constructed them as a yearly mosaic of the values. Together they form the time series of the proxy for perennial vegetation for the years 1984-2021 The proxy is referred, perennialprox.
Data Sampling
Vegetation at the HAE, grows naturally only within active ephemeral cannels [5,37]. The data of the vegetation cover for both proxies was extracted only there. We used a polyline GIS rivers layer which was obtained from the HydroSHEDS database [70], seen in Figure 1. To equally sample the vegetation cover over the Arava and to reduce possible spatial autocorrelation, we generated 10,000 random vector points which were distributed over the natural streams of Arava. The points were equally divided along the river's stream orders at a minimum distance between each two points of 100m. Each point was linked to the nearest rain station (numerous points were linked to each station: Eilat n=1305, Yotveta n=2707, Hatzeva n=3991, and Sdom n=1990). The value of the raster data from both datasets (the NDVI and the M-K) was sampled according to the described vector points using the ESRI, ArcPro-software.
We evaluated the correspondence between the average NDVI values for each of the proxies along the time series between the different stations (N=39). We have done so with the use of the Spearman correlation, at significance of p ≤ 0.05.
To answer the second research question, the relationships between rainfall and the vegetation proxies we used a Spearman correlation rest. To take into consideration possible lag responses of vegetation, we examined the correlation between the vegetation proxies and rainfall over 1, 2, 3, 4 and 5 years, as done by Siegal et al. [12]. The correlation was done separately for the values of the points related to each rain station, and its rainfall amounts.
2.2.3. Trend Analysis of Vegetation Cover
To answer the third research question, we estimated temporal trends of the vegetation proxies for the entire Landsat time series (YEARS X-X) and also over shorter periods of 10-year window to capture the effect of the wet or dry sub-period. We compared the difference in response of recovery and decline (i.e., time lag response) of the annual and the perennial vegetation. We chose a 10-year window to assess the effect of the wet and dry sub-periods, as we initially identified that these periods lasted between 3-9 consecutive years.
Similarly, to the rainfall trend assessment we used the M-K method. But as each imagery is composed of a large quantity of pixels, we used high levels of significance p ≤ 0.01 to increase the certainty that a trend occurred in the NDVI values and was not an artifact due to the extensive number of pixels used.
The medium (10 years) time scale was applied as follows:
- Each time series of the NDVI proxies (annual and perennial) dataset was divided into 29 short 10-year periods of consecutive years.
- We executed the M-K Tau test for each short period (e.g., 1990-1999, 1991-2000, 1992-2001, etc.).
- The M-K calculation provided a new, pixel-based imagery dataset composed of a pair of images: a 10-year trend image (ranging between -1 to +1, for negative and positive trends), and a significant level image.
- We used the significant level imagery at p ≤ 0.01, pixels whose significance level were lower than sig0.01 received a new value of 0, and the two images were multiplied.
- Each of the two newly constructed datasets contains 29 images expressing a 10-year NDVI trend at a high significance level. Hereafter, the new datasets will be referred to as M-K time series.
- In the M-K time series, each image refers to the middle of the measured period; for example, M-K annual/perennial 1990 refers to the M-K test based on NDVI time series for the years 1985 – 1994 for annual or perennial vegetation.
The time-lag of the annual and perennial vegetation's response to changes in the rainfall trend was evaluated based on the difference in response of the vegetation proxies of the M-K time series. The recovery period starts when M-K values are above zero, and the decline period starts when M-K values are below zero.
2.2.4. Effect of Land Use
To answer the fourth research question regarding the impact of anthropogenic activity on vegetation cover, we examined the difference in land management regulation between the state of Israel (non-grazed) and Jordan (grazed). On the Israeli side of the Arava Valley, grazing is prohibited, while on the Jordanian side, grazing is not restricted [14,71,72]. As the geological-pedological setting of the two countries is different in many areas [73], we choose to assess the difference in vegetation cover only at alluvial areas which are similar in size and climate on both sides of the border. We compared the NDVI values of both proxies for each year, with the to the Mann Whitney test at a significance level of p < 0.05.
3. Results
3.1. Rainfall Correlation and Climatic Periods
The correlations between the four Arava Valley meteorological stations (between 1987 and 2022) for the monthly rainfall totals and the 36-months SPI calculation is presented in Table 2. The table illustrates a moderate fit between each pair of stations, except for the northern Sdom station which was only correlated with the Hatzeva station (for SPI, but not for rainfall). The correlation strength increased as stations become geographically closer to each other.
According to the M-K Tau test, results seen within Figure 4, none of the rain station exhibited a positive or negative statistically validated trend since the start of the rainfall measurements at each station. But several of statistically significant rainfall sub periods could be identified with relevance to the start of the measurements at each stations Figure 4 and Table 3. In accordance with the availability Landsat time series, we will focus on the rainfall sub periods which occurred since the 1980’s. The Eilat, Yotveta, and Hatzeva stations collectively experienced a relatively wet period from the mid-1980s to the early 1990s, followed by a prolonged dry period (which was documented in all 4 station), which started in 1995/7 until 2013/14. The drought documented at the Sdom station was shorter, extending between 1997 and 2004. Since 2014, all stations recorded a comparatively wet period that lasted until 2021/23. These similarities led us to define three main climatic sub-periods exhibiting discernible fluctuations between wet followed by dry and another wet period in the Arava Valley over the past four decades.
3.2. Yearly Vegetation Cover
The NDVI and M-K time series, expressing the relation between the vegetation proxies and the yearly and accumulated yearly rainfall, are presented in Figure 5. The NDVI values demonstrated a clear pattern of increasing vegetation from south to north, corresponding with increasing annual rainfall from south to north: Eilat (23mm), Yotveta (30 mm), Hatzeva (42.0 mm), Sdom (51.0 mm).
3.2.1. Correlations between the Yearly Vegetation Proxies along the Arava Valley
A strong correlation between both vegetation proxies related to each station was evident, as seen in Table 4. The perennialprox correlations were slightly higher than the annualprox. Notably, the correlation for both proxies declined as the distance between stations increased. Such as the correlations between close stations, (Hatzeva- Yotveta) annualprox and perennialprox were corr(r) ≅ 0.97 and 0.98; while between the farthest station (Eilat and Sdom) annualprox and perennialprox the corr(r) ≅ 0.52 and 0.89.
3.2.2. Correlations between Rainfall and Vegetation Proxies
The correlations between yearly and multi-year average rainfall and NDVI proxies for both the annualprox and perennialprox can be seen in Table 5. The annualprox around Eilat and Sdom stations correlated moderately after 3 years of average rainfall (corr(r) ≅ 0.45), while the annualprox around Yotveta and Hatzeva stations and the rainfall was highly correlated for 2-3 consecutive years (corr(r) ≅ 0.63). The perennialprox reached the highest levels after three to four years of average rainfall. The highest levels of correlation were related to the Hatzeva station (corr(r) ≅ 0.79), while the other stations showed moderate levels (corr(r) ≅ 0.53).
3.3. The Medium- and Long-Term Trends of the Vegetation
Figure 5 illustrates the spatial pattern of the M-K results at a significance level of 0.01. Figure 5a displays the M-K test outcomes for the entire examined period (1984-2021); no discernible trend was evident. In contrast, the subsequent maps depict a 10-year running window of the same analysis. The maps exhibit a fluctuating process that the vegetation has gone through: the vegetation has experienced a positive trend (recovery) followed by a negative trend (decline) followed again by a positive trend (recovery), all taking place in the last four decades.
The first recovery was relatively minor (compared later with the second recovery) occurred while comparing the vegetation cover in the years 1986-7 with 1995-6 (Figure 5, maps of 1991-2). This recovery in vegetation coincides with the wet period which started in 1985/7 (Table 3). A major decline in vegetation cover throughout the entire Arava can be observed while comparing the vegetation cover of the years 1993-5 with 2005-7 (Figure 5, maps 1998-2000). The negative trend continued in the central - south of the Arava until 2010 (Figure 5, maps 2001-2004). The decline coincided with the dry period over the Arava in the years 1997-2014 (ended in Sdom in 2005). Lastly, a major vegetation recovery period occurred while comparing the vegetation cover of 2005-2013 with 2014-2021 (Figure 5, maps 2009-2017) coincides with the wet period which starts in 2015.
3.3.1. Time Lags in the Recovery and Decline of NDVI Proxies
Due to the high correspondence between the vegetation proxies in the four stations (Table 4), and the low variance between the stations value of the M-K results (ANOVAtest, p ≥ 0.05), we calculated the mean M-K value taken from the 4 stations to inspect the recovery and the decline between the NDVI proxies (Figure 6 and Table 3). We identified a time lag difference between the response of the two proxies which was captured twice during the recovery, and once during the decline. In all cases the annualprox has responded prior the perennialprox, while shifting between the sub- periods. The first vegetation recovery while shifting into the wet period revealed a two-year time lag between the positive trend of the two proxies. The negative trend in vegetation while shifting to a dry period has also shown a lag of two years between the proxies. The second recovery which was followed after a relatively long dry period revealed a time lag of three years.

Table 6.
The positive and negative trend of the vegetation proxies based on the 10-year M-K calculation (psig. ≤ 0.01), each mentioned year is the middle year within the time span of 10 years.
Table 6.
The positive and negative trend of the vegetation proxies based on the 10-year M-K calculation (psig. ≤ 0.01), each mentioned year is the middle year within the time span of 10 years.
| Trend | M-K annualprox | M-K perennialprox |
|---|---|---|
| Positive | 1989- 1995 | 1991- 1995 |
| Negative | 1996-2005 | 1997-2003 |
| Positive | 2008-2017 | 2011-2018 |
3.4. Differences in Vegetation Cover Affected by Land Management
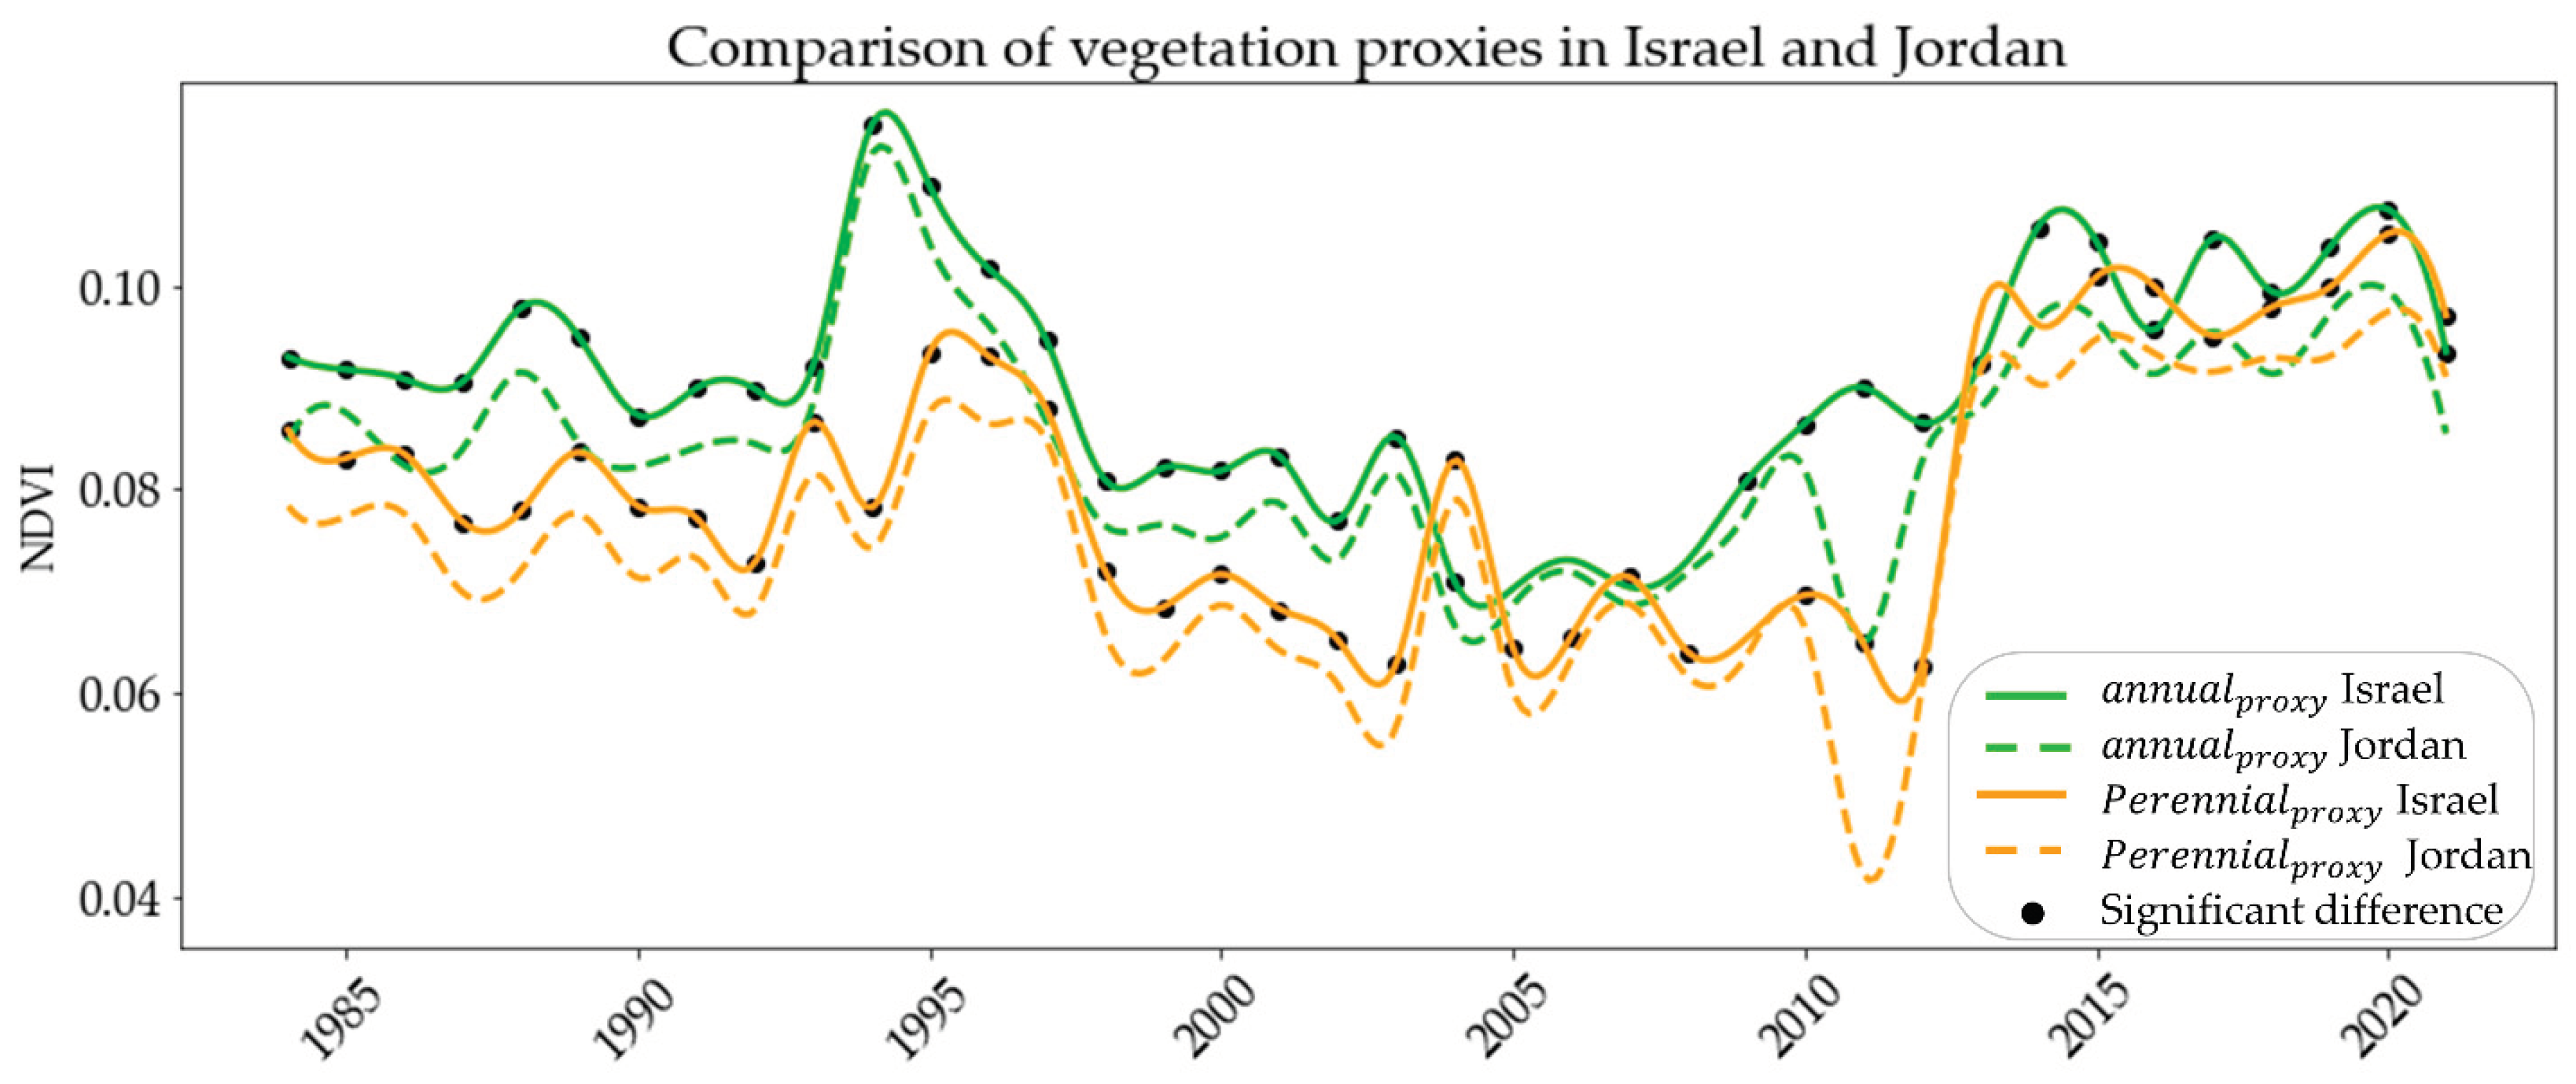
The time series comparing NDVI proxies between Israel and Jordan are presented in Figure 7. On the Israeli side, where no grazing occurs, the average values were consistently higher than those on the grazed Jordanian side, for both proxies. Based on the Mann-Whitney statistical test (with a significance level of p<0.01), significant differences were observed in the annualprox throughout the entire time series, except between 2005 and 2008. Regarding perennialprox, a consistent and statistically significant difference between Israel and Jordan was evident across all years.
4. Discussion
4.1. Climatic Trend and Sub-Periods in the Arava Valley
While studies focusing on the rainfall trends of central and northern Israel have received much interest in the scientific literature [31,49,74,75,76,77], very few studies have researched southern Israel and Jordan. This may be due to the natural variability of rainfall in the hyper-arid environment and the scarcity of meteorological stations, which makes it difficult to reach conclusive results [3,5]. Several studies have identified a decline in the amount of yearly rainfall in the Arava region in the last decades [28,30,78]. In the present study, we did not identify a clear positive or negative trend, but rather identified three statistically significant wet and dry sub-periods in the last four decades. A previous study on droughts in the hyper-arid environment of Saudia Arabia observed similar fluctuations in SPI [19]. The results from our study and the latter may reflect the climatic nature of the hyper-arid environment.
4.2. The Spatial Correlation between Rainfall and Vegetation Proxies
To correctly evaluate the correlation between the rainfall and the vegetation proxies we first separated each of the parameters and spatially evaluated them to identify any discrepancies. The monthly rainfall and the SPI calculation were moderately correlated between the four stations, with slightly higher correlations for SPI. The Sdom station showed a very low correlation by both parameters, we attributed this difference to its northern geographical location. The northern Arava Valley (where the Sdom station is located) is influenced by two weather systems - the Cyprus Lows which originates in the Mediterranean Sea, and the Red Sea Trough which originates in the south. Conversely, the other three stations receive their rainfall only via the Rea Sea Trough weather system [47,48,79]. Additionally, the similarity in between the rainfall station was expected due to the natural spatial autocorrelation which characterizes rainfall events [80,81].
Despite the low correlations between the stations’ rainfall, the vegetation proxies yielded very high levels of correlations, while the perennialprox was slightly strongly correlated then the annualprox. Similarly, to the rainfall, the correlation strengthened with proximity between the stations. The vegetation proxies even exhibited a high correlation for the vegetation around Sdom station. Based on the difference between the two levels of correlation, we infer that the Sdom rain station might not effectively represent the Arava study but rather areas north of the Arava, as it is located at the northern tip of the Arava Valley, and it is also impacted by rain systems whose origin is from the Mediterranean Sea.
The difference in the two evaluated correlations may be explained by the characteristics of rain events in the HAE. Due to the significant spatial-temporal variability of rainfall events [82,83], a rain event may or may not be captured by rain station, but the vegetation around the rain station will certainly be affected by it, because of runoff and floods from upstream areas where the rain fell. This discrepancy between the correlation of the rainfall at each station compared with the spatial consistency of vegetation proxies strengthens the option of using the last as an indicator of the yearly and multi-yearly water availability for the natural vegetation in arid environments.
4.2.1. The Correlation between Rainfall and Vegetation Proxies
A correlation difference between the NDVI for both proxies and the rainfall was found between the different rainfall stations. We assume that the disparity in correlation levels is attributed to the difference in the hydrological pedological settings of these regions. Both Hatzeva and Yotveta receive water from watersheds originating in the arid and hyper-arid environments, with similar geological compositions primarily comprising alluvium from carbonate rocks [73]. Eilat's rainfall is contributed by local watersheds, with a thin growing bed, primarily composed of alluvium from granite sources, whereas Sdom’s rainfall station as was claimed (section 5.2), might represent northern areas, and does not represent the potential water input around it.
The correlation between rainfall and NDVI reached its peak when averaging the cumulative data of several years. This finding reinforces our perspective that observing vegetation cover requires a multi-year time frame, strengthening our approach of observing the vegetation dynamics through the M-K approach for several consecutive years. The multi-year approach is further supported by additional studies [2,8,11,27].
In relative proximity with the Arava study site, lies the arid Nitzana dune field on the border between Israel and Egypt. The area is influenced by similar synoptic systems such as the Arava [47,48]). Siegal et al., 2013 found a higher correlation (~0.88) between the NDVI and annual average rainfall (after seven years) than were found in our study results. The difference between the levels of correlation between the two studies may be caused by the geo-morphological differences between the two study areas. The Nitzana study site is a relatively homogenous sandy dune area at the Israel-Egypt border. The high porosity of the sand particles creates high water infiltration and low runoff compared to the heterogeneous sedimentary basin of the Arava Valley, where vegetation is highly dependent on flash floods [14,84,85,86].
Two parameters that were not included in our study, as it was not the scope of this study, which may have enhanced the correlation between rainfall and vegetation are the timing distribution of rainfall throughout the year and the amount of rainfall in each event. These factors are crucial in understanding vegetation growth in arid environments. The timing of rain throughout the year determines the water availability for different types of vegetation [37,67,87]. For example, rain events in the late spring are unlikely to contribute to annual vegetation growth, thus lowering the correlation between the two parameters. Secondly, as the vegetation in the HAE, grows only in the ephemeral channels, it is dependent on the occurrence of flash flood events, while sparse rain events that do not create water flow over the surface hardly contribute to vegetation growth [37]. Flash flood generation is dependent on the intensity of the rainfall, thus several millimeters of rainfall that do not cause a flash flood may be ineffective for the plant's growth [47]. Unfortunately, continuous data on the occurrence of flash floods was unavailable for the Arava Valley, so we could not include them in our analysis.
4.3. Vegetation Dynamics in Response to Rainfall Fluctuations
4.3.1. The Mann-Kendall Time Series Approach
Figure 6 demonstrates the strength of creating medium-term M-K time series compared to long-term time series. The 10-year M-K time series enabled us to observe the multi-year climatic variability, which would have otherwise been obscured. In accordance with the long-term rainfall trend, for which we haven’t found a clear trend, we did not find a clear monotonic trend in vegetation cover in over last four decades. Observing the vegetation trend in segments of several years is particularly important in an area where the annual rainfall highly fluctuates, such as the Arava Valley. We chose to calculate M-K trends with a 10-year window as we aimed to observe the effect of wet and dry sub-periods, which as shown in Table 3 can vary from 3 years to about a decade. Noy et al. [22] used a moving window of 5 years, to observe changes in the vegetation cover due to changes in land uses which would affect the vegetation cover at a much shorter time scale.
4.3.2. Differences in the Recovery and Decline between the Vegetation Proxies
The M-K time series has enabled us to evaluate the recovery time lag between the vegetation proxies. In the three documented occurrences of rainfall sub-periods, the annualprox responded more quickly than the perennialprox. During the first recovery, the difference between the proxies was two years, while in the second recovery, it occurred after three years. It seems that the time lag between the recovery depends on the length of the preceding dry period. Moreover, the recovery intensity of the second phase was significantly higher than the first as seen in Figure 6. This difference can likely be attributed to the extreme contrast between the severe drought conditions that persisted from the mid-1990s until about 2010, in comparison to the subsequent very wet period from 2013/14 onwards. The change between wet to dry has shown a time lag where the annualprox, preceded the perennialprox in two - three years. The results coincide with previous studies conducted in arid environments that concluded that perennial vegetation declines 2-3 years after annual vegetation in arid areas facing drought [10,12]. But more surprising is that the same results are achieved in much more humid areas, such as the study of [11], who evaluated the recovery of grass, shrubs, and trees (equivalent to our proxies of annuals and perennials) following droughts in the vast temperate regions and found similar results; Grass recovers most rapidly, shrubs after two years, and trees recover fully only four years after the drought ends. The similarity in the recovery or decline time lag of vegetation growing under extremely different climatic conditions is attributed to the vegetation’s incredible ability to fully adapt to the local climatic conditions, independent of the biome.
As conducting fieldwork measurements was beyond the scope of our study, our findings can be supported by studies that have done field sampling in the Arava in recent years [28,29]. Bruins et al., 2012 concluded that the vegetation around natural springs located in the Arava has significantly decreased during the drought prevailing in the Arava from 1995 until the publication of his study in 2012. Armoza-Zvuloni et al. 2021 executed long-term monitoring of the Acacia trees at two wadis in southern Arava. They observed a substantial increase in Acacia tree mortality (A. raddiana Savi and A. tortilis) during the severe drought spanning the Eilat – Yotveta area between 1995 and 2014. Later, extensive Acacia germination was documented in 2017, which is attributed to the post-drought wet period. Both examples are evident in our results, where the latter demonstrates the 3 years lag of the perennial recovery which was seen in our study.
4.4. The Impact of Land Use
The results of the comparison between Israel and Jordan presented consistently higher vegetation cover values in the Israeli side. For the annualprox, we did not find a significant differences between Israel and Jordan for the years 2005-2008. Presumably, after a sequence of continuous drought years, the annual vegetation was at minimum levels due to the lack of rainfall. Thus, in years when both sides of the border experience a drought period, differences in vegetation cover are negligible. However, the perennialprox consistently shown higher values on the Israeli side. These results coincide with other works [12,14,16,88,89]. A study by [90] showed that following prolonged human disturbances, such as grazing in the Sonoran desert, it took over 50 years for the perennial vegetation to fully recover. Israel prohibited grazing at the Arava since the 1950’s [14,91], thus we can assume that the perennial vegetation of the two sides will maintain its difference over a relatively long period, as seen during the second dry period.
5. Conclusions
In the last decades, the Arava Valley has experienced substantial changes in its rainfall regime. Within these changes, the typical average annual rainfall was low, but the multi-year standard deviation was very high. Although we haven't recognized any clear trend in the rainfall amounts over the years, we were able to distinguish wet and dry sub-periods using SPI calculation. Similarly, to the rainfall, vegetation proxies have not shown a clear trend over the entire time series but responded significantly to each sub-period either through recovery or decline. The highly consistent correlations among vegetation proxies along the Arava, compared with the moderate correlation of rainfall measurements among the stations, demonstrates the potential of using vegetation cover as an indicator for the water availability for plants in the HAE. We have demonstrated that annualprox exhibits a more immediate response than perennialprox when transitioning between wet and dry periods with a time lag of two to four years depending on the length of the previous sub period. We have shown that the non-grazed Israeli side exhibits higher values of both vegetation proxies compared to the grazed Jordanian side. The differences were significant throughout most of the study period, excluding several years of drought when the vegetation on both sides was at its lowest. This paper focused on the dynamic relationship between the fluctuating rainfall and the response of the vegetation cover under the harsh hyper-arid environment. In this study, we developed a comprehensive approach that integrates satellite imagery remote sensing together with climatic records. This work improves the understanding of ecological dynamics in hyper-arid areas.
Author Contributions
Ariel Meroz: Conceptualization, Data Curation, Methodology, Validation, Formal analysis, Investigation, Resources, Writing original draft, Writing - Review & Editing. Noam Levin: Conceptualization, Methodology, Writing - Review & Editing, Supervision, Project administration, Funding acquisition. He Yin: Software (implementation of the computer code and supporting algorithms), Writing - Review & Editing.
Acknowledgments
This research was supported by the Israel Nature and Parks Authority, the Hebrew University of Jerusalem Atid Scholarship, and the Department of Geography Gunther Scholarship, the Hebrew University of Jerusalem. We wish to thank Michelle Finzi for her editing assistance, Dr. Elli Groner and Dr. Avshalom Babad for contributing meaningful insights on the unique Hyper arid environment.
Conflicts of Interest
The authors declare no conflicts of interest.
References
- Kimura, R.; Moriyama, M. Recent Trends of Annual Aridity Indices and Classification of Arid Regions with Satellite-Based Aridity Indices. Remote Sensing in Earth Systems Sciences 2019, 2, 88–95. [Google Scholar] [CrossRef]
- Jiao, T.; Williams, C.A.; De Kauwe, M.G.; Schwalm, C.R.; Medlyn, B.E. Patterns of Post-Drought Recovery Are Strongly Influenced by Drought Duration, Frequency, Post-Drought Wetness, and Bioclimatic Setting. Global Change Biology 2021, 27, 4630–4643. [Google Scholar] [CrossRef] [PubMed]
- Morin, E. To Know What We Cannot Know: Global Mapping of Minimal Detectable Absolute Trends in Annual Precipitation: MINIMAL DETECTABLE PRECIPITATION TRENDS. Water Resour. Res. 2011, 47. [Google Scholar] [CrossRef]
- Barlow, M.; Zaitchik, B.; Paz, S.; Black, E.; Evans, J.; Hoell, A. A Review of Drought in the Middle East and Southwest Asia. Journal of Climate 2016, 29, 8547–8574. [Google Scholar] [CrossRef]
- Groner, E.; Babad, A.; Berda Swiderski, N.; Shachak, M. Toward an Extreme World: The Hyper-Arid Ecosystem as a Natural Model. Ecosphere 2023, 14, e4586. [Google Scholar] [CrossRef]
- Tabari, H.; Willems, P. More Prolonged Droughts by the End of the Century in the Middle East. Environ. Res. Lett. 2018, 13, 104005. [Google Scholar] [CrossRef]
- Alamdarloo, E.H.; Manesh, M.B.; Khosravi, H. Probability Assessment of Vegetation Vulnerability to Drought Based on Remote Sensing Data. Environ Monit Assess 2018, 190, 702. [Google Scholar] [CrossRef]
- Gutterman, Y. Survival Strategies of Annual Desert Plants; Springer Science & Business Media, 2002; ISBN 978-3-540-43172-5.
- Peng, J.; Wu, C.; Zhang, X.; Wang, X.; Gonsamo, A. Satellite Detection of Cumulative and Lagged Effects of Drought on Autumn Leaf Senescence over the Northern Hemisphere. Global Change Biology 2019, 25, 2174–2188. [Google Scholar] [CrossRef]
- Zhao, A.; Yu, Q.; Feng, L.; Zhang, A.; Pei, T. Evaluating the Cumulative and Time-Lag Effects of Drought on Grassland Vegetation: A Case Study in the Chinese Loess Plateau. Journal of environmental management 2020, 261, 110214. [Google Scholar] [CrossRef]
- Wu, X.; Liu, H.; Li, X.; Ciais, P.; Babst, F.; Guo, W.; Zhang, C.; Magliulo, V.; Pavelka, M.; Liu, S.; et al. Differentiating Drought Legacy Effects on Vegetation Growth over the Temperate Northern Hemisphere. Global Change Biology 2018, 24, 504–516. [Google Scholar] [CrossRef]
- Siegal, Z.; Tsoar, H.; Karnieli, A. Effects of Prolonged Drought on the Vegetation Cover of Sand Dunes in the NW Negev Desert: Field Survey, Remote Sensing and Conceptual Modeling. Aeolian Research 2013, 9, 161–173. [Google Scholar] [CrossRef]
- Asner, G.P.; Elmore, A.J.; Olander, L.P.; Martin, R.E.; Harris, A.T. Grazing Systems, Ecosystem Responses, and Global Change. Annual Review of Environment and Resources 2004, 29, 261–299. [Google Scholar] [CrossRef]
- Meroz, A.M.; Yin, H.; Levin, N. Unveiling the Impact of Traditional Land Practices on Natural Vegetation Using Large-Scale Exclosures: National Borders and Military Bases. Journal of Arid Environments 2023, 211, 104930. [Google Scholar] [CrossRef]
- Noy-Meir, I. Desert Ecosystems: Environment and Producers. Annual Review of Ecology and Systematics 1973, 4, 25–51. [Google Scholar] [CrossRef]
- Otterman, J. Baring High-Albedo Soils by Overgrazing: A Hypothesized Desertification Mechanism. Science 1974, 186, 531–533. [Google Scholar] [CrossRef] [PubMed]
- Seifan, M. Long-Term Effects of Anthropogenic Activities on Semi-Arid Sand Dunes. Journal of Arid Environments 2009, 73, 332–337. [Google Scholar] [CrossRef]
- WMO SPI: Standardized Precipitation Index; european commission, 2013.
- Ejaz, N.; Bahrawi, J. Assessment of Drought Severity and Their Spatio-Temporal Variations in the Hyper Arid Regions of Kingdom of Saudi Arabia: A Case Study from Al-Lith and Khafji Watersheds. Atmosphere 2022, 13, 1264. [Google Scholar] [CrossRef]
- Khosravi, H.; Haydari, E.; Shekoohizadegan, S.; Zareie, S. Assessment the Effect of Drought on Vegetation in Desert Area Using Landsat Data. The Egyptian Journal of Remote Sensing and Space Science 2017, 20, S3–S12. [Google Scholar] [CrossRef]
- McAuliffe, J.R.; Hamerlynck, E.P. Perennial Plant Mortality in the Sonoran and Mojave Deserts in Response to Severe, Multi-Year Drought. Journal of Arid Environments 2010, 74, 885–896. [Google Scholar] [CrossRef]
- Noy, K.; Ohana-Levi, N.; Panov, N.; Silver, M.; Karnieli, A. A Long-Term Spatiotemporal Analysis of Biocrusts across a Diverse Arid Environment: The Case of the Israeli-Egyptian Sandfield. Science of The Total Environment 2021, 774, 145154. [Google Scholar] [CrossRef]
- Tucker, C.J. Red and Photographic Infrared Linear Combinations for Monitoring Vegetation. Remote Sensing of Environment 1979, 8, 127–150. [Google Scholar] [CrossRef]
- Isaacson, S.; Ephrath, J.E.; Rachmilevitch, S.; Maman, S.; Ginat, H.; Blumberg, D.G. Long and Short Term Population Dynamics of Acacia Trees via Remote Sensing and Spatial Analysis: Case Study in the Southern Negev Desert. Remote Sensing of Environment 2017, 198, 95–104. [Google Scholar] [CrossRef]
- Karnieli, A.; Gilad, U.; Ponzet, M.; Svoray, T.; Mirzadinov, R.; Fedorina, O. Assessing Land-Cover Change and Degradation in the Central Asian Deserts Using Satellite Image Processing and Geostatistical Methods. Journal of Arid Environments 2008, 72, 2093–2105. [Google Scholar] [CrossRef]
- Lewińska, K.E.; Ives, A.R.; Morrow, C.J.; Rogova, N.; Yin, H.; Elsen, P.R.; de Beurs, K.; Hostert, P.; Radeloff, V.C. Beyond “Greening” and “Browning”: Trends in Grassland Ground Cover Fractions across Eurasia That Account for Spatial and Temporal Autocorrelation. Global Change Biology 2023, n/a. [Google Scholar] [CrossRef]
- Chávez, R.O.; Moreira-Muñoz, A.; Galleguillos, M.; Olea, M.; Aguayo, J.; Latín, A.; Aguilera-Betti, I.; Muñoz, A.A.; Manríquez, H. GIMMS NDVI Time Series Reveal the Extent, Duration, and Intensity of “Blooming Desert” Events in the Hyper-Arid Atacama Desert, Northern Chile. International Journal of Applied Earth Observation and Geoinformation 2019, 76, 193–203. [Google Scholar] [CrossRef]
- Bruins, H.J.; Sherzer, Z.; Ginat, H.; Batarseh, S. Degradation of Springs in the Arava Valley: Anthropogenic and Climatic Factors. Land Degradation & Development 2012, 23, 365–383. [Google Scholar] [CrossRef]
- Armoza-Zvuloni, R.; Shlomi, Y.; Shem-Tov, R.; Stavi, I.; Abadi, I. Drought and Anthropogenic Effects on Acacia Populations: A Case Study from the Hyper-Arid Southern Israel. Soil Systems 2021, 5, 23. [Google Scholar] [CrossRef]
- Ginat, H.; Shlomi, Y.; Batarseh, S.; Vogel, J. REDUCTION IN PRECIPITATION LEVELS IN THE ARAVA VALLEY (SOUTHERN ISRAEL AND JORDAN), 1949-2009. Journal of Dead-Sea and Arava Research 2011, 3, 1–7. [Google Scholar]
- Saaroni, H.; Ziv, B.; fregmant, R.; Halfon, N. Fluctuations in the Negev rains in the last fifty years - Is there evidence of climate change? Ecology & Environment 2012, 3, 62–72. [Google Scholar]
- Babad, A.; Silver, M. Is there a trend of change in the amount of precipitation in the high Negev? Dead Sea and science center 2020. [Google Scholar]
- Franklin, J.F. Importance and Justification of Long-Term Studies in Ecology. In Long-Term Studies in Ecology: Approaches and Alternatives; Likens, G.E., Ed.; Springer: New York, NY, 1989; pp. 3–19. ISBN 978-1-4615-7358-6. [Google Scholar]
- Tielbörger, K.; Bilton, M.C.; Metz, J.; Kigel, J.; Holzapfel, C.; Lebrija-Trejos, E.; Konsens, I.; Parag, H.A.; Sternberg, M. Middle-Eastern Plant Communities Tolerate 9 Years of Drought in a Multi-Site Climate Manipulation Experiment. Nat Commun 2014, 5, 5102. [Google Scholar] [CrossRef] [PubMed]
- Xu, Z.; Cao, L.; Zhong, S.; Liu, G.; Yang, Y.; Zhu, S.; Luo, X.; Di, L. Trends in Global Vegetative Drought From Long-Term Satellite Remote Sensing Data. IEEE Journal of Selected Topics in Applied Earth Observations and Remote Sensing 2020, 13, 815–826. [Google Scholar] [CrossRef]
- Ziv, B.; Saaroni, H.; Pargament, R.; Harpaz, T.; Alpert, P. Trends in Rainfall Regime over Israel, 1975–2010, and Their Relationship to Large-Scale Variability. Reg Environ Change 2014, 14, 1751–1764. [Google Scholar] [CrossRef]
- Danin, A. Flora and Vegetation of Israel and Adjacent Areas. herbmedit 1988, 25. [Google Scholar]
- Raunkiær, C. The Life Forms of Plants and Statistical Plant Geography Being the Collected Papers of C. Raunkiaer; Oxford at the Clarendon Press, 1934.
- Brown, J.H.; Ernest, S.K.M. Rain and Rodents: Complex Dynamics of Desert Consumers. BioScience 2002. [Google Scholar] [CrossRef]
- Smith, M.O.; Ustin, S.L.; Adams, J.B.; Gillespie, A.R. Vegetation in Deserts: II. Environmental Influences on Regional Abundance. Remote Sensing of Environment 1990, 31, 27–52. [Google Scholar] [CrossRef]
- AQUASTAT (FAO) Map of Aridity (Global - ~19km) 2023.
- Spinoni, J.; Micale, F.; Carrao, H.; Naumann, G.; Barbosa, P.; Vogt, J. Global and Continental Changes of Arid Areas Using the FAO Aridity Index over the Periods 1951-1980 and 1981-2010. 2013, EGU2013-9262.
- Lehner, B.; Grill, G. Global River Hydrography and Network Routing: Baseline Data and New Approaches to Study the World’s Large River Systems. Hydrological Processes 2013, 27, 2171–2186. [Google Scholar] [CrossRef]
- ESRI ESRI Land Use Land Cover 2020.
- Avni, Y.; Bartov, Y.; Garfunkel, Z.; Ginat, H. The Arava Formation-A Pliocene Sequence in the Arava Valley and Its Western Margin, Southern Israel. Israel Journal of Earth Sciences 2001, 50, 101–120. [Google Scholar] [CrossRef]
- Porat, N.; Amit, R.; Zilberman, E.; Enzel, Y. Luminescence Dating of Fault-Related Alluvial Fan Sediments in the Southern Arava Valley, Israel. Quaternary Science Reviews 1997, 16, 397–402. [Google Scholar] [CrossRef]
- Kahana, R.; Ziv, B.; Enzel, Y.; Dayan, U. Synoptic Climatology of Major Floods in the Negev Desert, Israel. International Journal of Climatology 2002, 22, 867–882. [Google Scholar] [CrossRef]
- Krichak, S.O.; Alpert, P.; Krishnamurti, T.N. Red Sea Trough/Cyclone Development — Numerical Investigation. Meteorl. Atmos. Phys. 1997, 63, 159–169. [Google Scholar] [CrossRef]
- Drori, R.; Ziv, B.; Saaroni, H.; Etkin, A.; Sheffer, E. Recent Changes in the Rain Regime over the Mediterranean Climate Region of Israel. Climatic Change 2021, 167, 15. [Google Scholar] [CrossRef]
- Goldreich, Y.; Karni, O. Climate and Precipitation Regime in the Arava Valley, Israel. Israel Journal of Earth Sciences 2001, 50, 53–59. [Google Scholar] [CrossRef]
- Seifan, M.; Zohar, Y.; Werner, Y.L. Reptile Distribution May Identify Terrestrial Islands for Conservation: The Levant’s ‘Arava Valley as a Model. Journal of Natural History 2016, 50, 2783–2801. [Google Scholar] [CrossRef]
- Frumkin, R.; Pinshow, B.; Kleinhaus, S. A Review of Bird Migration over Israel. J Ornithol 1995, 136, 127–147. [Google Scholar] [CrossRef]
- Gordo, O.; Sanz, J.J. The Relative Importance of Conditions in Wintering and Passage Areas on Spring Arrival Dates: The Case of Long-Distance Iberian Migrants. J Ornithol 2008, 149, 199–210. [Google Scholar] [CrossRef]
- Kendall, M.G. Rank Correlation Methods; Rank correlation methods; Griffin: Oxford, England, 1948. [Google Scholar]
- Mann, H.B. Nonparametric Tests Against Trend. Econometrica 1945, 13, 245–259. [Google Scholar] [CrossRef]
- Neeti, N.; Eastman, J.R. A Contextual Mann-Kendall Approach for the Assessment of Trend Significance in Image Time Series. Transactions in GIS 2011, 15, 599–611. [Google Scholar] [CrossRef]
- Kumar, M.N.; Murthy, C.S.; Sai, M.V.R.S.; Roy, P.S. On the Use of Standardized Precipitation Index (SPI) for Drought Intensity Assessment. Meteorological Applications 2009, 16, 381–389. [Google Scholar] [CrossRef]
- Aryee, J.N.A. Climate Indices/ SPI Calculation. Available online: https://github.com/jeffjay88/Climate_Indices/blob/main/1D_spi_pandas.ipynb (accessed on 3 September 2023).
- McKee, T.B.; Doesken, N.J.; Kleist, J. THE RELATIONSHIP OF DROUGHT FREQUENCY AND DURATION TO TIME SCALES. 1993, 6.
- Svoboda, M.; Hayes, M.; Wood, D. Standardized Precipitation Index User Guide; 2012; p. 25.
- Huete, A.R. A Soil-Adjusted Vegetation Index (SAVI). Remote Sensing of Environment 1988, 25, 295–309. [Google Scholar] [CrossRef]
- Farooq Ahmad Spectral Vegetation Indices Performance Evaluated for Cholistan Desert. J. Geogr. Reg. Plann. 2012, 5. [CrossRef]
- Masek, J.G.; Vermote, E.F.; Saleous, N.E.; Wolfe, R.; Hall, F.G.; Huemmrich, K.F.; Gao, F.; Kutler, J.; Lim, T.-K. A Landsat Surface Reflectance Dataset for North America, 1990-2000. IEEE Geoscience and Remote Sensing Letters 2006, 3, 68–72. [Google Scholar] [CrossRef]
- Vermote, E.; Justice, C.; Claverie, M.; Franch, B. Preliminary Analysis of the Performance of the Landsat 8/OLI Land Surface Reflectance Product. Remote Sensing of Environment 2016, 185, 46–56. [Google Scholar] [CrossRef]
- Venter, Z.S.; Barton, D.N.; Chakraborty, T.; Simensen, T.; Singh, G. Global 10 m Land Use Land Cover Datasets: A Comparison of Dynamic World, World Cover and Esri Land Cover. Remote Sensing 2022, 14, 4101. [Google Scholar] [CrossRef]
- Danin, A. The vegetation of the Negev (North of Nahal Paran). Poaliim 1977.
- Danin, A.; Orshan, G. The Distribution of Raunkiaer Life Forms in Israel in Relation to the Environment. Journal of Vegetation Science 1990, 1, 41–48. [Google Scholar] [CrossRef]
- Schmidt, H.; Karnieli, A. Remote Sensing of the Seasonal Variability of Vegetation in a Semi-Arid Environment. Journal of Arid Environments 2000, 45, 43–59. [Google Scholar] [CrossRef]
- Levin, N. Human Factors Explain the Majority of MODIS-Derived Trends in Vegetation Cover in Israel: A Densely Populated Country in the Eastern Mediterranean. Reg Environ Change 2016, 16, 1197–1211. [Google Scholar] [CrossRef]
- Lehner, B.; Verdin, K.; Jarvis, A. New Global Hydrography Derived From Spaceborne Elevation Data. Eos, Transactions American Geophysical Union 2008, 89, 93–94. [Google Scholar] [CrossRef]
- Albalawneh, A.; Al-Assaf, A.; Sweity, A.; Hammour, W.A.; Kloub, K.; Hjazin, A.; Kabariti, R.; Abu Nowar, L.; Tadros, M.J.; Aljaafreh, S.; et al. Mapping Cultural Ecosystem Services in the Hyper Arid Environment of South of Jordan. Frontiers in Environmental Science 2022, 10. [Google Scholar] [CrossRef]
- Albalawneh, A.; Nawash, O.; Al-Assaf, A.; Hjazin, A.; Tadros, M.; Kabariti, R.; Nowar, L.A.; Albashbsheh, G.; Diab, M.; Aljaafreh, S.; et al. Traditional Knowledge of Wild Plant Species Used by Local People Inhabiting the Southern Part of Wadi Araba Desert in South-West Jordan; In Review, 2022. [CrossRef]
- Sneh, A.; Bartov, Y.; Weissbrod, T; Rosensaft, M Geological Map of Israel, 1:200,000 1998.
- Ben-Gai, T.; Bitan, A.; Manes, A.; Alpert, P. Long-Term Changes in Annual Rainfall Patterns in Southern Israel. Theor Appl Climatol 1994, 49, 59–67. [Google Scholar] [CrossRef]
- Levin, Z.; Halfon, N.; Alpert, P. Reassessment of Rain Enhancement Experiments and Operations in Israel Including Synoptic Considerations. Atmospheric Research 2010, 97, 513–525. [Google Scholar] [CrossRef]
- Saaroni, H.; Halfon, N.; Ziv, B.; Alpert, P.; Kutiel, H. Links between the rainfall regime in Israel and location and intensity of Cyprus lows. International Journal of Climatology 2010, 30, 1014–1025. [Google Scholar] [CrossRef]
- Yosef, Y.; Saaroni, H.; Alpert, P. Trends in Daily Rainfall Intensity Over Israel 1950/1-2003/4. The Open Atmospheric Science Journal 2009, 3. [Google Scholar] [CrossRef]
- Yosef, Y.; Aguilar, E.; Alpert, P. Changes in Extreme Temperature and Precipitation Indices: Using an Innovative Daily Homogenized Database in Israel. Int J Climatol 2019, 39, 5022–5045. [Google Scholar] [CrossRef]
- Hochman, A.; Harpaz, T.; Saaroni, H.; Alpert, P. The Seasons’ Length in 21st Century CMIP5 Projections over the Eastern Mediterranean. International Journal of Climatology 2018, 38, 2627–2637. [Google Scholar] [CrossRef]
- Luković, J.; Bajat, B.; Blagojević, D.; Kilibarda, M. Spatial Pattern of Recent Rainfall Trends in Serbia (1961–2009). Reg Environ Change 2014, 14, 1789–1799. [Google Scholar] [CrossRef]
- Sun, F.; Roderick, M.L.; Farquhar, G.D. Rainfall Statistics, Stationarity, and Climate Change. Proceedings of the National Academy of Sciences 2018, 115, 2305–2310. [Google Scholar] [CrossRef] [PubMed]
- Crawford, C.S.; Gosz, J.R. Desert Ecosystems: Their Resources in Space and Time. Environmental Conservation 1982, 9, 181–195. [Google Scholar] [CrossRef]
- Jafari, M.; Tavili, A.; Panahi, F.; Zandi Esfahan, E.; Ghorbani, M. Characteristics of Arid and Desert Ecosystems. In Reclamation of Arid Lands; Jafari, M., Tavili, A., Panahi, F., Zandi Esfahan, E., Ghorbani, M., Eds.; Environmental Science and Engineering; Springer International Publishing: Cham, 2018; pp. 21–91. ISBN 978-3-319-54828-9. [Google Scholar]
- Casenave, A.; Valentin, C. A Runoff Capability Classification System Based on Surface Features Criteria in Semi-Arid Areas of West Africa. Journal of Hydrology 1992, 130, 231–249. [Google Scholar] [CrossRef]
- E. Zilberman,; Y. Avni; A. Sneh The Nizzana Sheet 2014.
- Wieler, N. Geological and Microbiological Features of Rock Weathering in Arid Environments, Ben-Gurion University of the Negev: Beer-Sheva, 2018.
- Schmiedel, U.; Jacke, V.; Hachfeld, B.; Oldeland, J. Response of Kalahari Vegetation to Seasonal Climate and Herbivory: Results of 15 Years of Vegetation Monitoring. Journal of Vegetation Science 2021, 32, e12927. [Google Scholar] [CrossRef]
- Rozenstein, O.; Agam, N.; Serio, C.; Masiello, G.; Venafra, S.; Achal, S.; Puckrin, E.; Karnieli, A. Diurnal Emissivity Dynamics in Bare versus Biocrusted Sand Dunes. Science of The Total Environment 2015, 506–507, 422–429. [Google Scholar] [CrossRef] [PubMed]
- Saltz, D.; Schmidt, H.; Rowen, M.; Karnieli, A.; Ward, D.; Schmidt, I. Assessing Grazing Impacts by Remote Sensing in Hyper-Arid Environments. Journal of Range Management 1999, 52, 500. [Google Scholar] [CrossRef]
- Guo, Q. Slow Recovery in Desert Perennial Vegetation Following Prolonged Human Disturbance. Journal of Vegetation Science 2004, 15, 757–762. [Google Scholar] [CrossRef]
- Levin, N.; Ben dor, E.; Kidron, G. The influence of human factors on the temporal changes in the stabilization rate of the Ashdod-Nizzanim sand dune. Tel Aviv 2003. [Google Scholar]
Figure 2.
a. Aerial imagery from Menuha Ridge, Arava Valley. b. A wadi near Wadi Paran, Arava Valley. In both images, the vegetation cover is concentrated within the ephemeral channels. Both images were taken in March 2020.
Figure 2.
a. Aerial imagery from Menuha Ridge, Arava Valley. b. A wadi near Wadi Paran, Arava Valley. In both images, the vegetation cover is concentrated within the ephemeral channels. Both images were taken in March 2020.
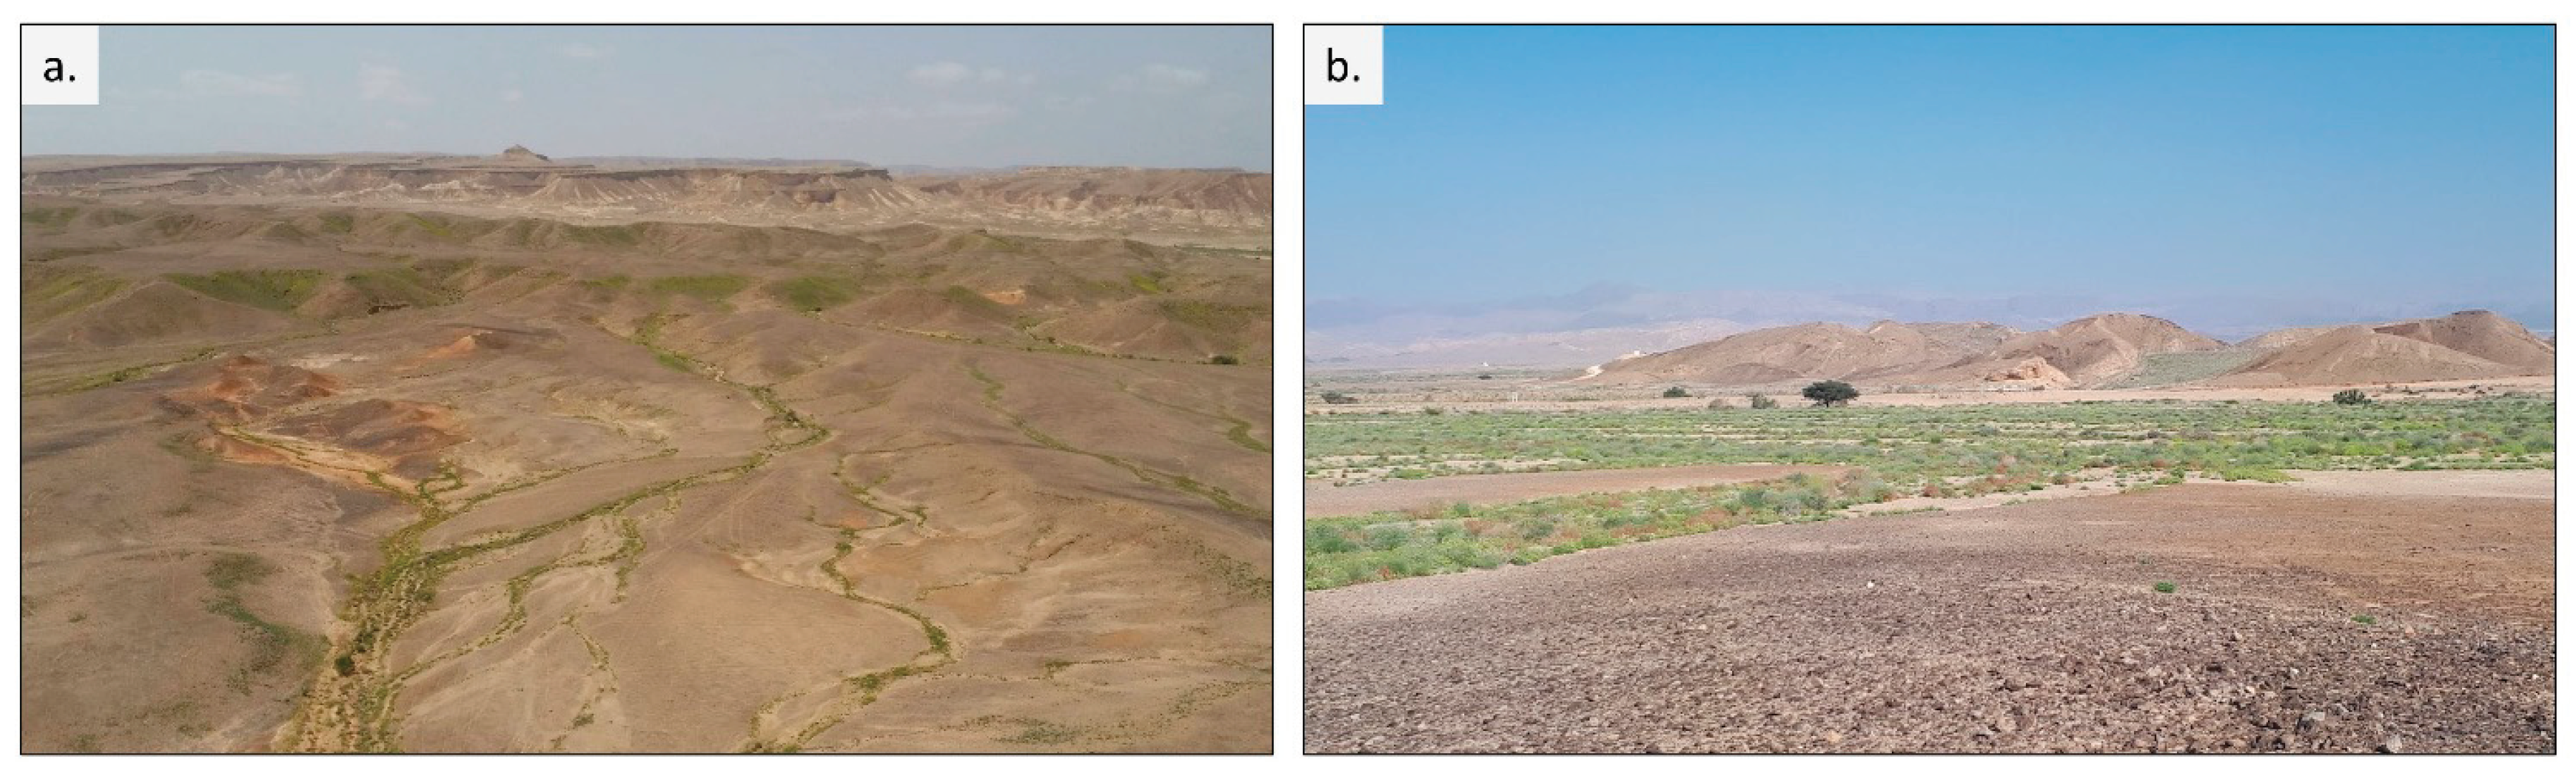
Figure 3.
The figure gives a general overview of the methodological approach which was used in this research.
Figure 3.
The figure gives a general overview of the methodological approach which was used in this research.
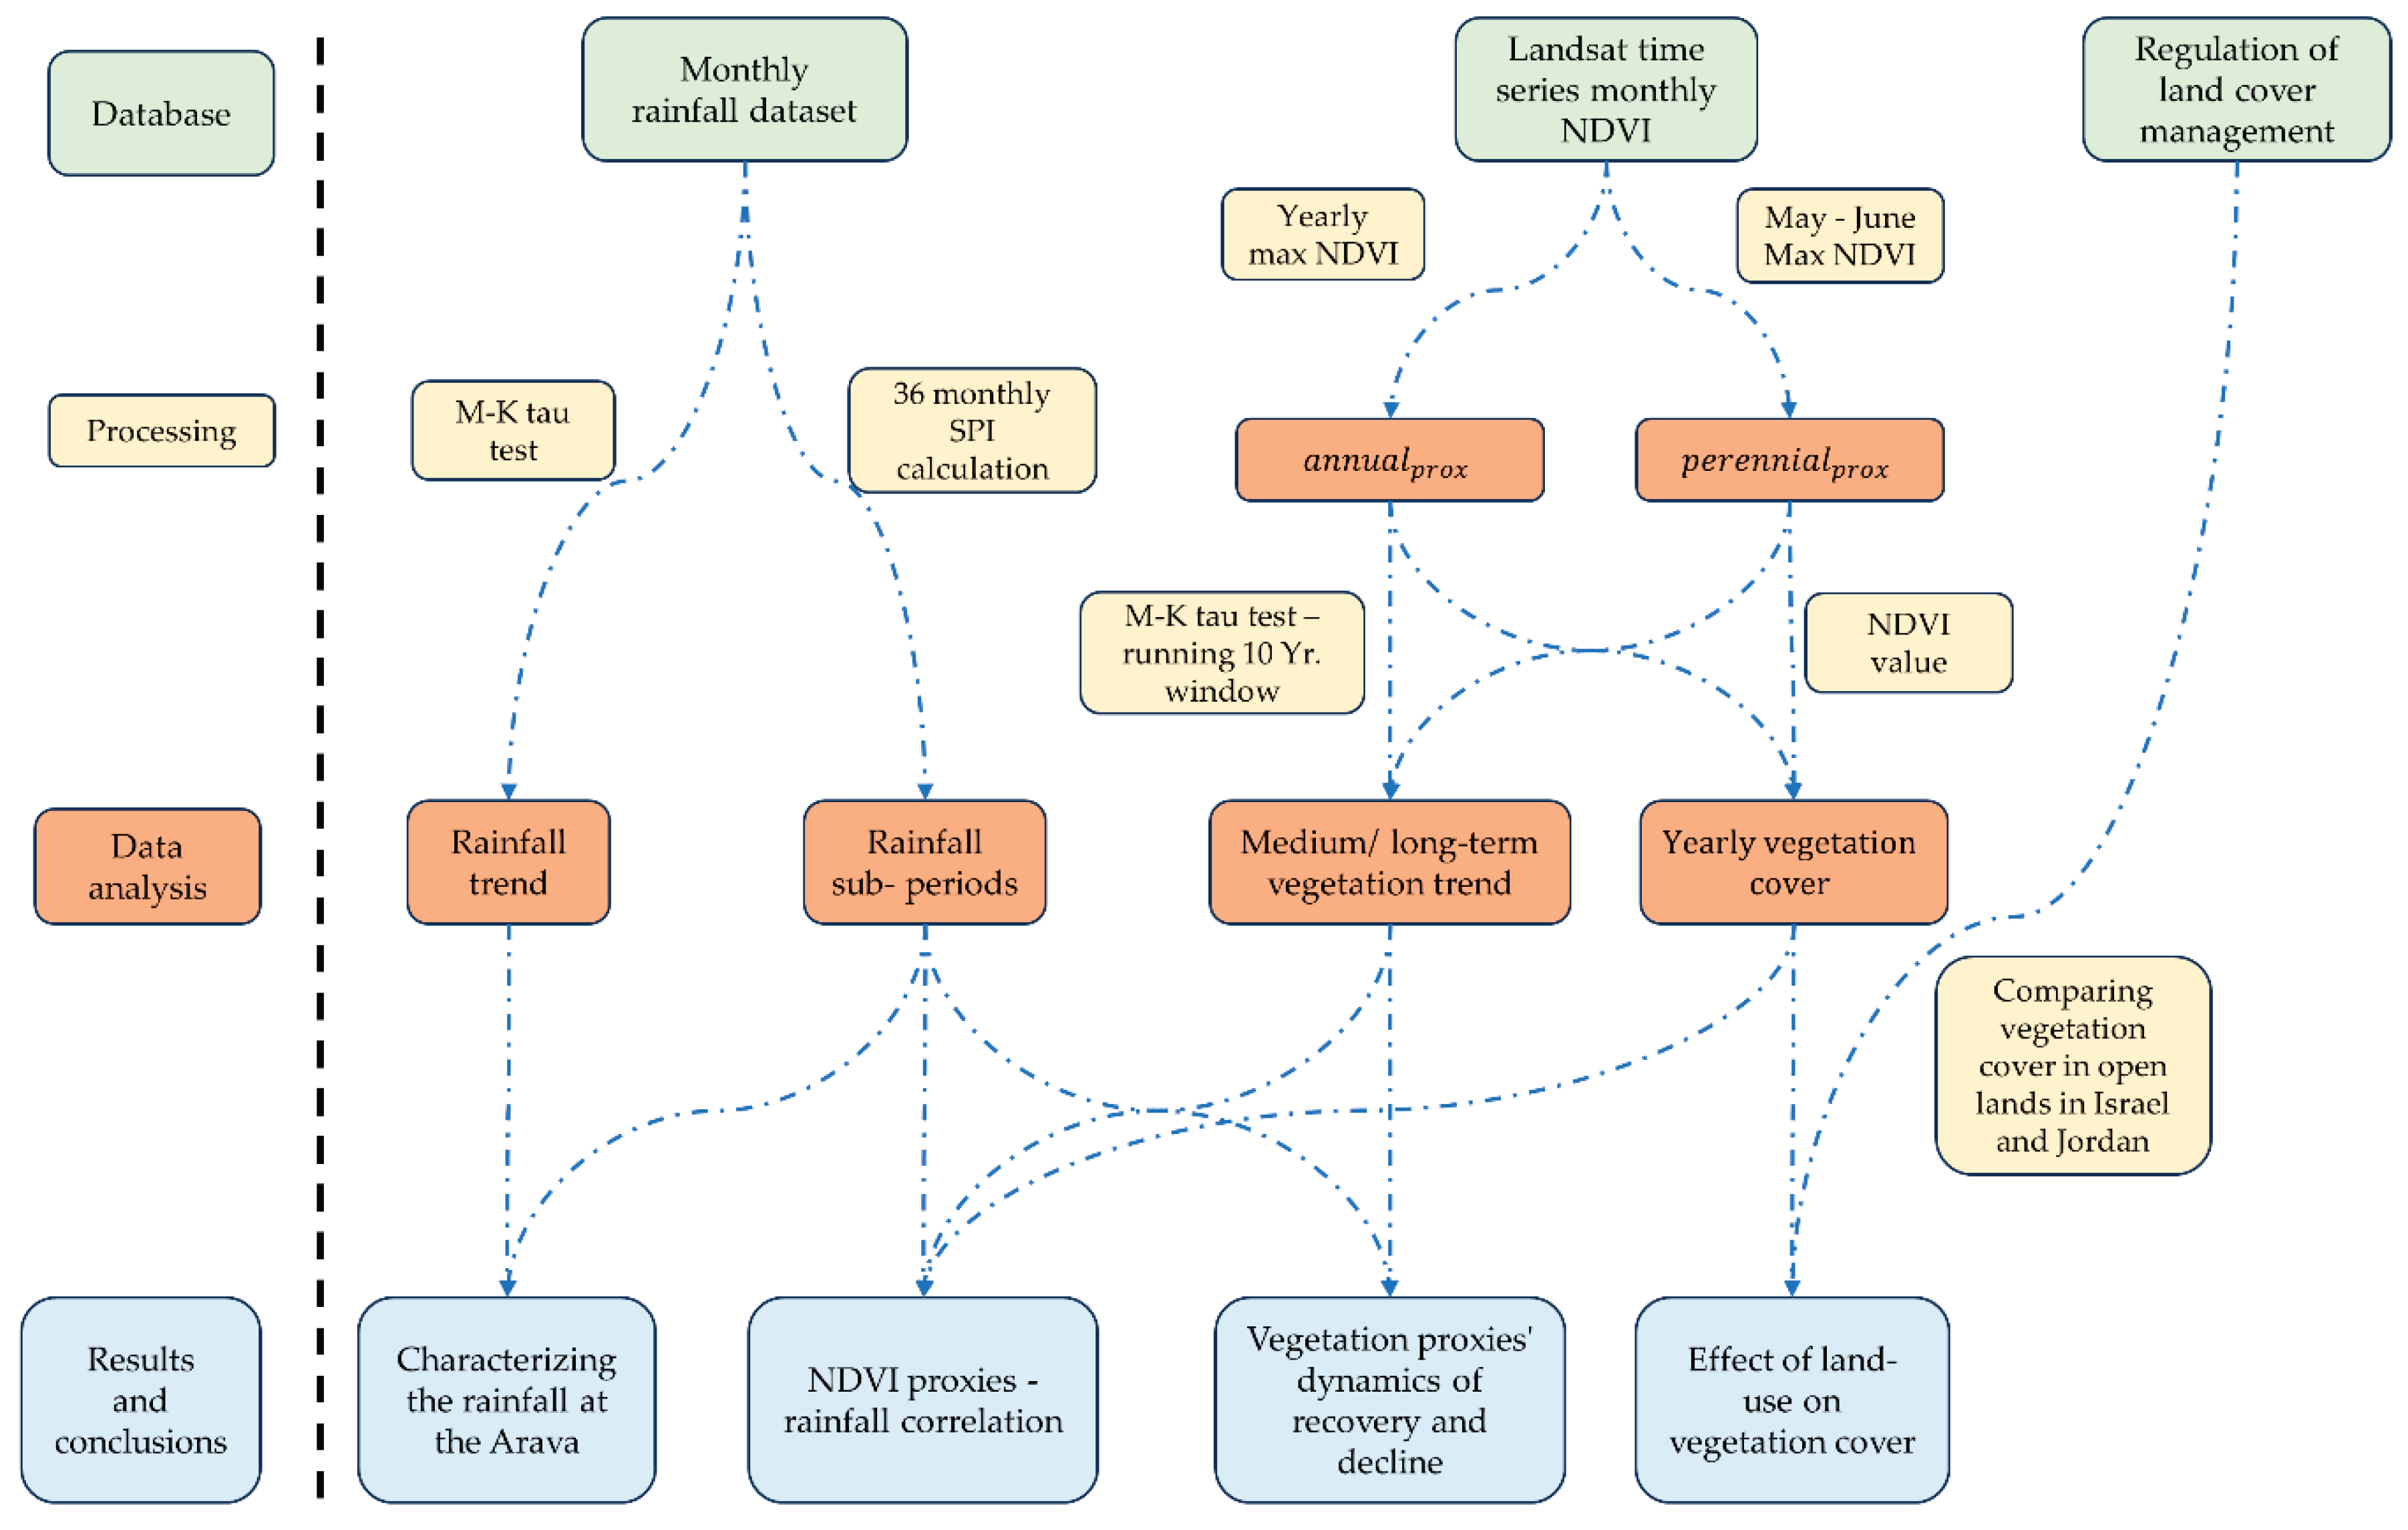
Figure 4.
The monthly rainfall at each station in blue line, the 36-month SPI calculation for each station and the wet and dry periods in horizontal green lines. The wet and dry sub periods represent a cluster of months in which the maximum SPI value was > 1 (wet) or the minimum SPI value was < -1 (dry) in a moving window of 19 months. The table below, depicts the trend of the rainfall at each station accroding to the M-K test.

Figure 5.
The temporal profiles of rainfall, and NDVI and M-K for both proxies surrounding each station along the Arava. The NDVI results were normalized between 0-1, to facilitate a direct comparison to the M-K values on the same graph.
Figure 5.
The temporal profiles of rainfall, and NDVI and M-K for both proxies surrounding each station along the Arava. The NDVI results were normalized between 0-1, to facilitate a direct comparison to the M-K values on the same graph.
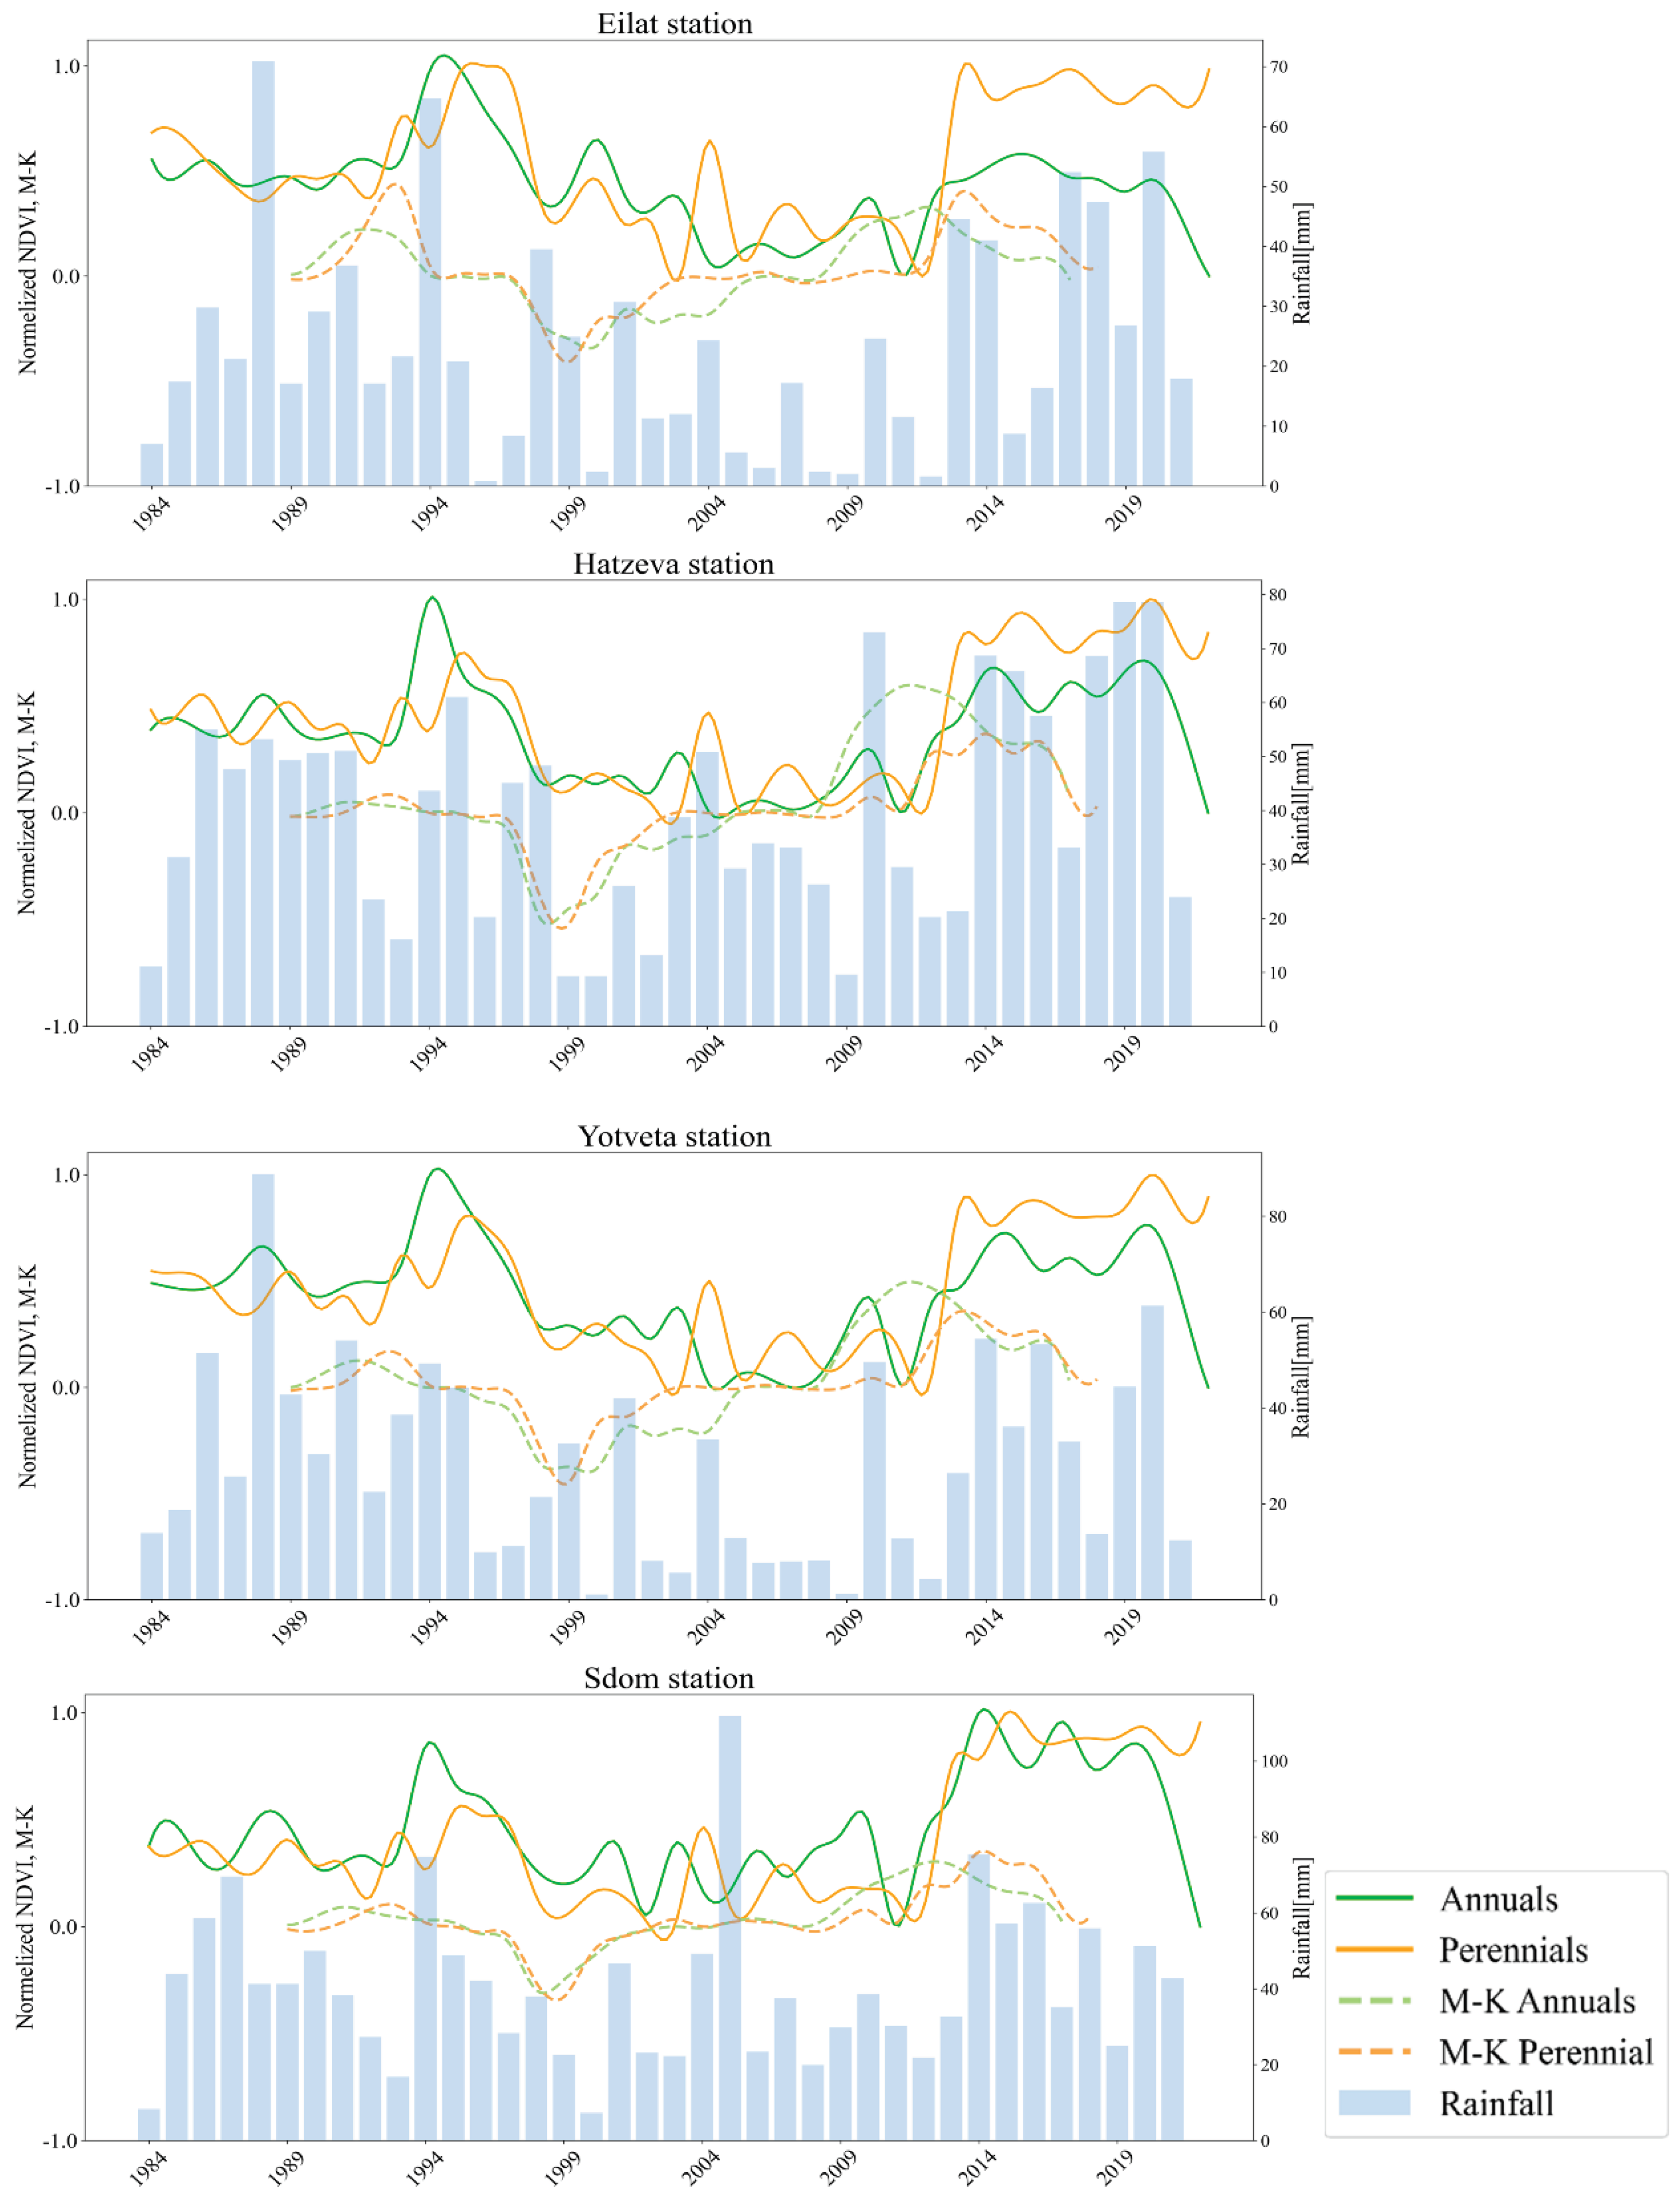
Figure 6.
The large map shows the Landsat max M – K1984–2021 which serves as a proxy for the annual vegetation trend for the entire inspected period. The small maps show a 10-year running window of Mann Kendall results The year shown represents the middle of the inspected 10-year period.
Figure 6.
The large map shows the Landsat max M – K1984–2021 which serves as a proxy for the annual vegetation trend for the entire inspected period. The small maps show a 10-year running window of Mann Kendall results The year shown represents the middle of the inspected 10-year period.
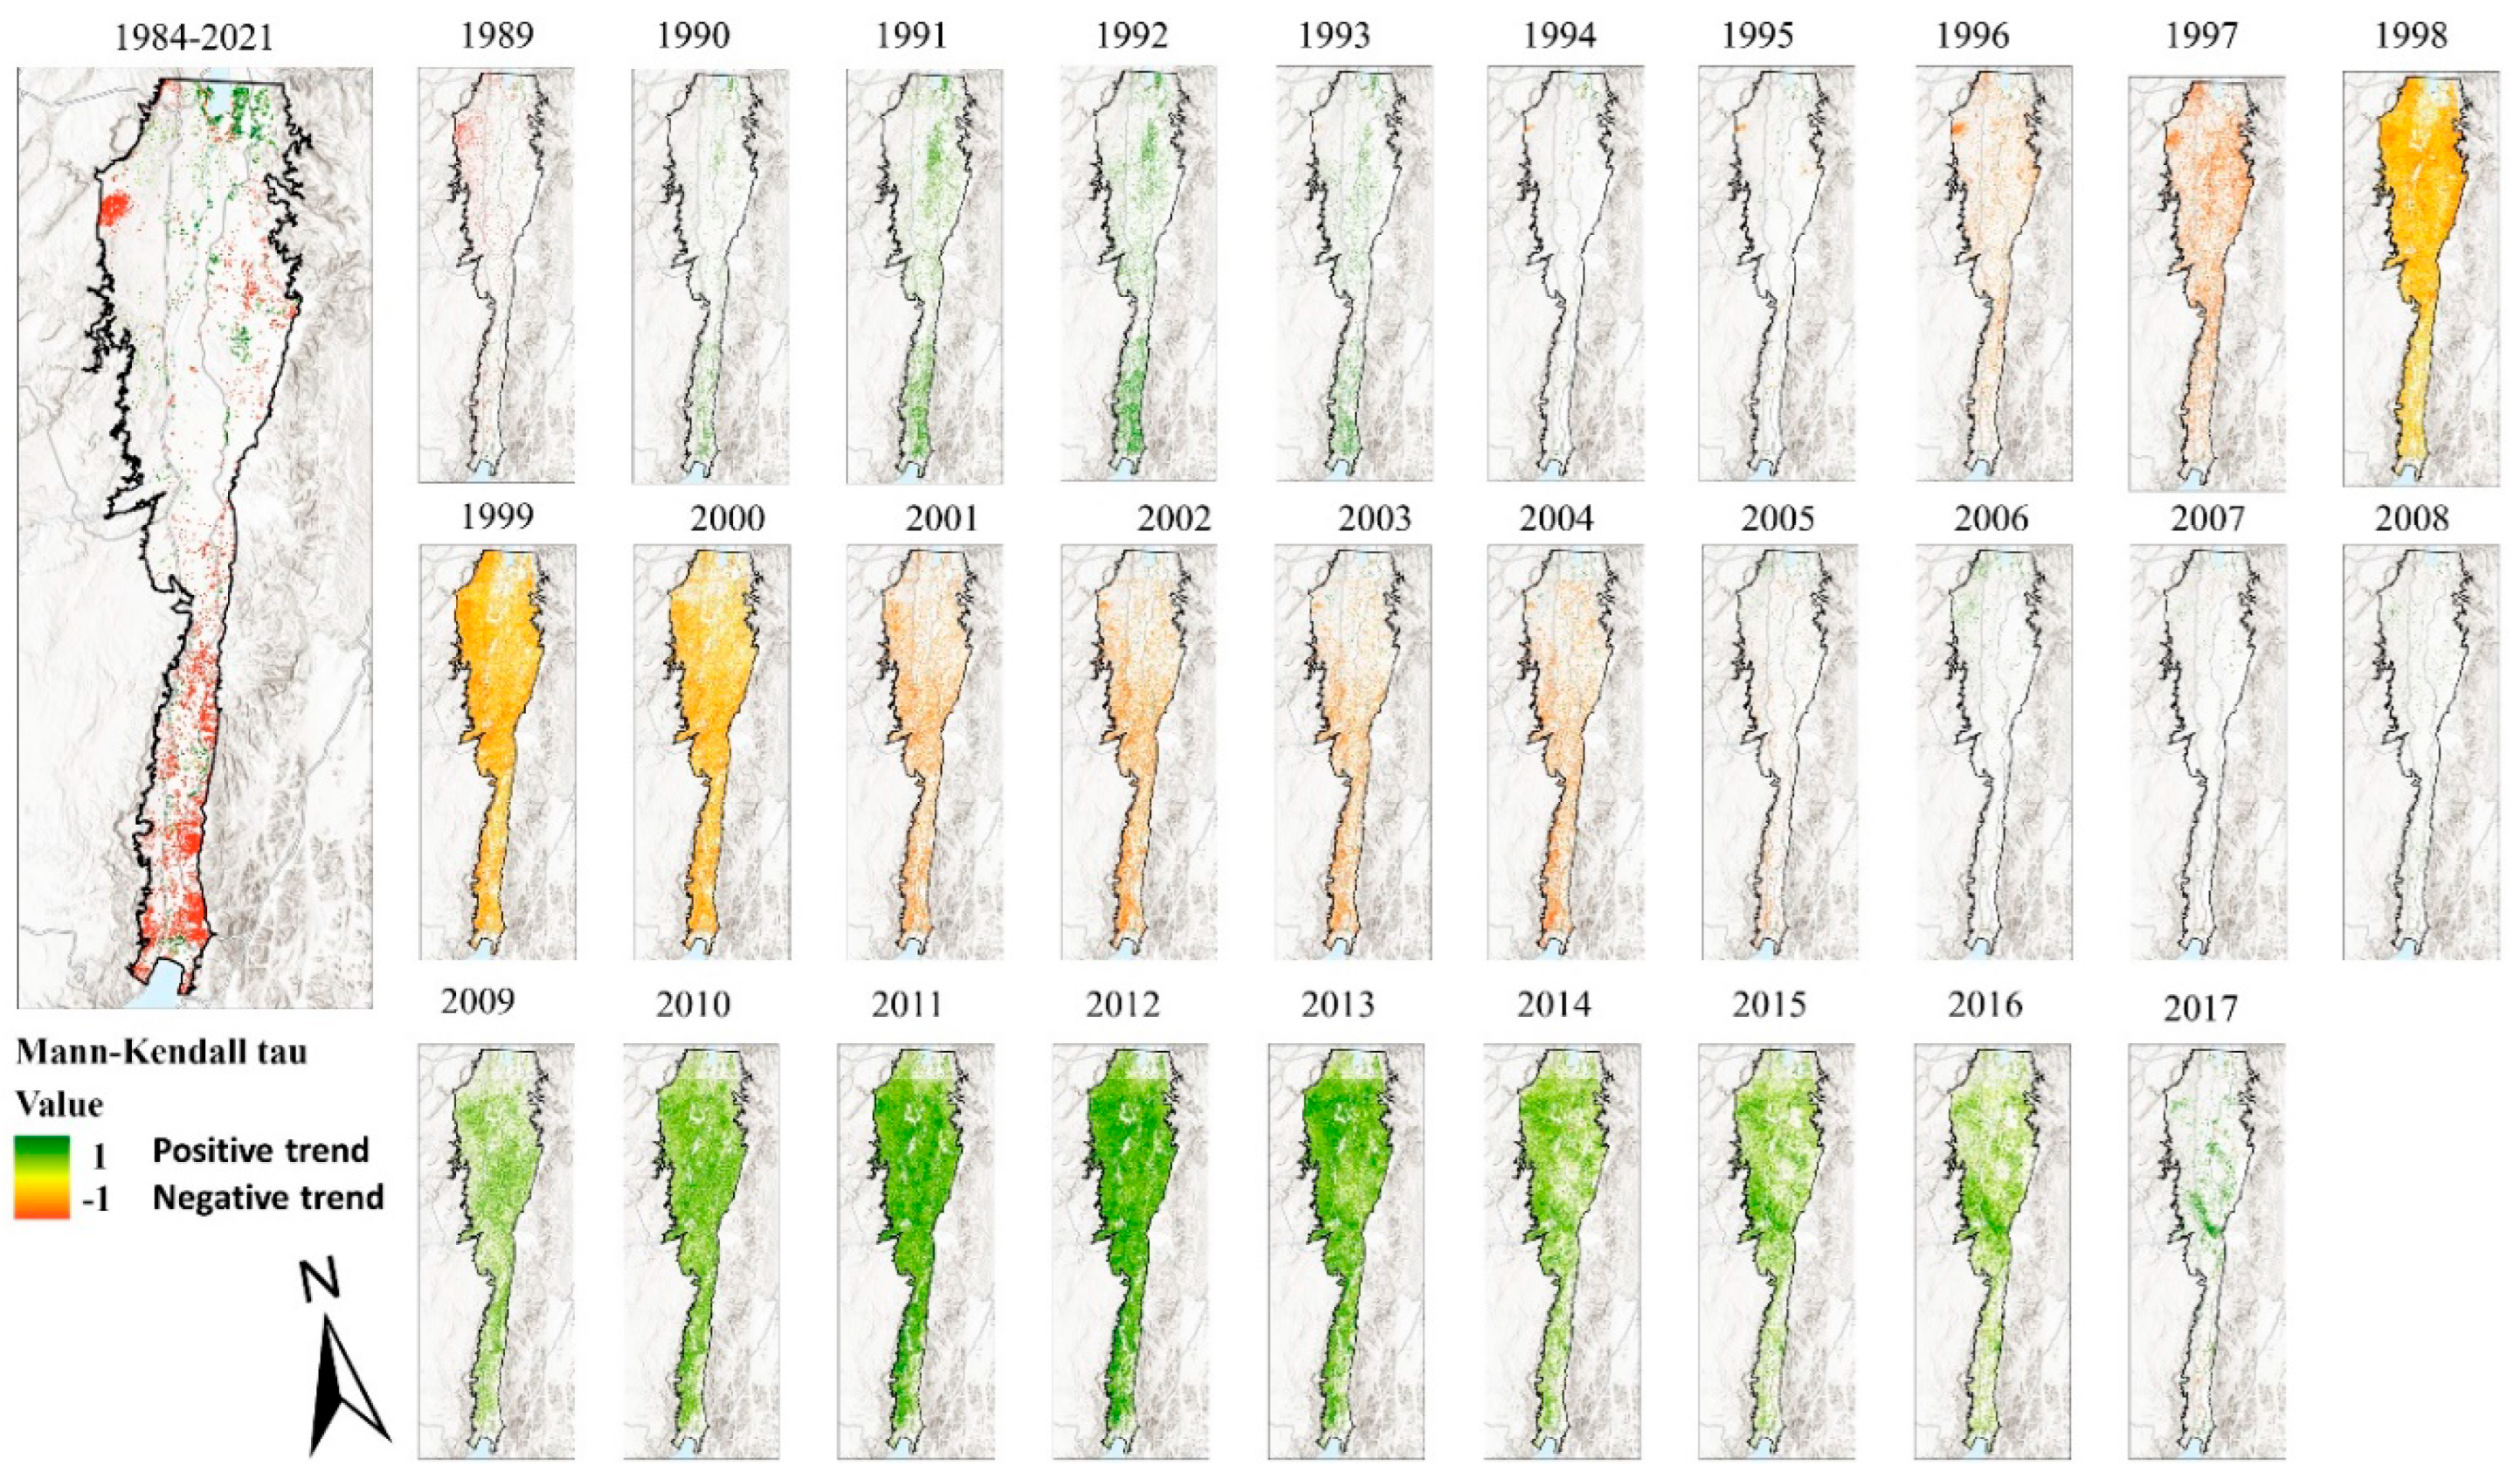
Figure 7.
The graphs is based on the M-K results of both proxies over the entire sampling points in the Arava Valley. The light green arrows express recovery lags, the brown arrow expresses the decline lag between the responses of each proxy.
Figure 7.
The graphs is based on the M-K results of both proxies over the entire sampling points in the Arava Valley. The light green arrows express recovery lags, the brown arrow expresses the decline lag between the responses of each proxy.
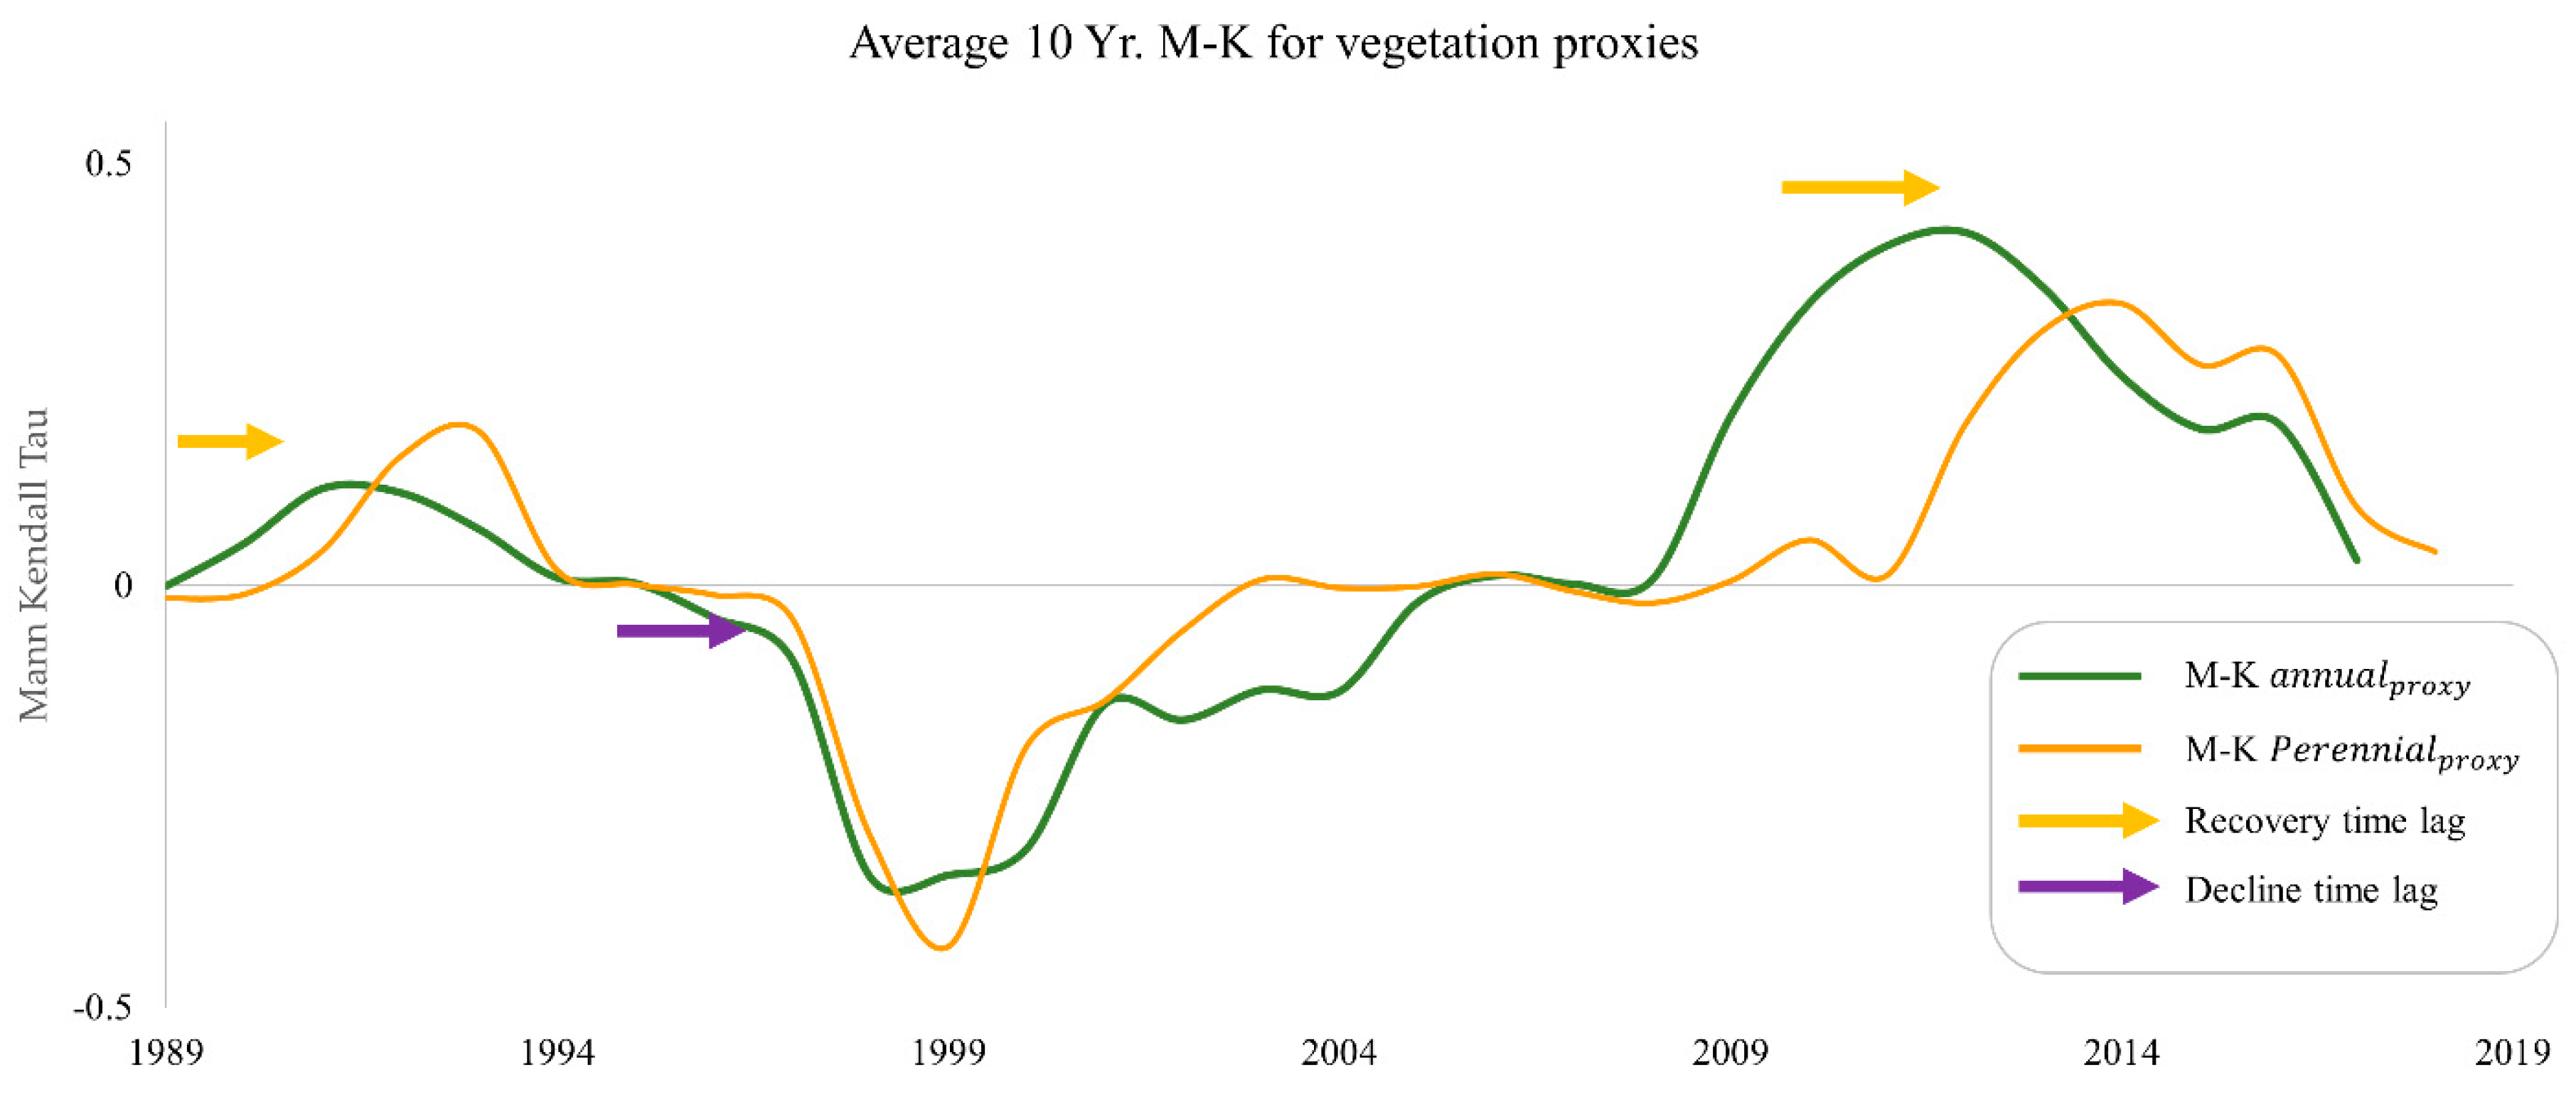
Figure 8.
A comparison between the vegetation proxies in Israel and Jordan. The black dots placed over the time series indicate a statistically significant difference between Israel and Jordan, as determined by the Mann-Whitney test (p < 0.01).
Figure 8.
A comparison between the vegetation proxies in Israel and Jordan. The black dots placed over the time series indicate a statistically significant difference between Israel and Jordan, as determined by the Mann-Whitney test (p < 0.01).
| SPI values | Drought and humid category |
|---|---|
| ≥ (+) 2 | Extreme wet |
| (+) 1.5 to (+) 1.99 | Very wet |
| (+) 1 to (+) 1.49 | Moderate wet |
| 0 to (+) 0.99 | Mild wet |
| 0 to (-) 0.99 | Mild drought |
| (-) 1 to (-) 1.49 | Moderate drought |
| (-) 1.5 to (-) 1.99 | Severe drought |
| ≤ (-) 2 | Extreme drought |
Table 2.
Spearman rank correlation coefficients matrix between the rainfall station for the period 1987-2023. The correlation above the diagonal represents the fit according to the 36 monthly SPI calculations, and the correlation below the diagonal represents the fit based on the monthly rainfall measurements (n=432). The asterisk indicates a statistically significant test result (p ≤ 0.05).
| Correlations for monthly rainfall | Correlations for SPI | ||||
| Eilat | Yotveta | Hatzeva | Sdom | ||
| Eilat | 0.77* | 0.55* | -0.07 | ||
| Yotveta | 0.64* | 0.61* | 0.03 | ||
| Hatzeva | 0.58* | 0.53* | 0.48* | ||
| Sdom | 0.28 | 0.30 | 0.37 | ||
Table 3.
A detailed description of the wet and dry sub periods of each rain station, based on Figure 3, and its relevance with the Landsat time series.
Table 3.
A detailed description of the wet and dry sub periods of each rain station, based on Figure 3, and its relevance with the Landsat time series.
| Rain stations | Prior to the Landsat time series | During the Landsat time series | ||||
|---|---|---|---|---|---|---|
| Eilat | Wet 1952-1957 |
Dry 1958-1964 |
Wet 1965-1971, 1973-1978 |
Wet 1987-1990 |
Dry 1996-2014 |
Wet 2017-2023 |
| Yotveta | Dry 1958-1965 |
Dry 1978-1980 |
Wet 1985-1997 |
Dry 2003-2014 |
Wet 2015-2023 |
|
| Hatzeva | Wet 1987-1993 |
Dry 1998-2005, 2008-2014 |
Wet 2015-2022 |
|||
| Sdom | Wet 1968-1971 1972-1977 |
Dry 1978-1986 |
Dry 1997-2004 |
Wet 2005-2013, 2015-2021 |
||
Table 4.
Spearman year to year correlation between the types of proxies for annual and perennial vegetation between the different stations. The correlations above the diagonal represent the correlations of the proxy for perennial vegetation between the different regions (named by the representative meteorological station to which the points are the closest). The correlations below the diagonal represent the year to year correlations of the proxy for annual vegetation between the different regions (named by the representative meteorological station to which they are closest). The asterisk indicates a statistically significant test result (p ≤ 0.05).
| perennialprox | |||||
| annualprox | Stations | Eilat | Yotveta | Hatzeva | Sdom |
| Eilat | 0.97* | 0.94* | 0.89* | ||
| Yotveta | 0.86* | 0.98* | 0.95* | ||
| Hatzeva | 0.78* | 0.97* | 0.97* | ||
| Sdom | 0.53* | 0.76* | 0.85* | ||
Table 5.
The Spearman correlation table between the rainfall and the proxies of the annual and the perennial vegetation in the Arava from 1984- 2021. The asterisk indicates a statistically significant test result (p<0.05).
Table 5.
The Spearman correlation table between the rainfall and the proxies of the annual and the perennial vegetation in the Arava from 1984- 2021. The asterisk indicates a statistically significant test result (p<0.05).
| Rainfall | Vegetation proxy | Eilat | Yotveta | Hatzeva | Sdom |
|---|---|---|---|---|---|
| Yearly rainfall | annualprox | 0.26 | 0.56* | 0.48* | 0.27 |
| 2 Yr. average rainfall | 0.36* | 0.65* | 0.64* | 0.33 | |
| 3 Yr. average rainfall | 0.44* | 0.62* | 0.65* | 0.46* | |
| 4 Yr. average rainfall | 0.17 | 0.55* | 0.52* | 0.26 | |
| Yearly rainfall | perennialprox | 0.31 | 0.43* | 0.55** | 0.25* |
| 2 Yr. average rainfall | 0.45* | 0.50* | 0.73* | 0.38* | |
| 3 Yr. average rainfall | 0.49* | 0.53* | 0.79* | 0.44* | |
| 4 Yr. average rainfall | 0.52* | 0.54* | 0.73* | 0.53* | |
| 5 Yr. average rainfall | 0.57* | 0.54* | 0.70* | 0.35 |
Disclaimer/Publisher’s Note: The statements, opinions and data contained in all publications are solely those of the individual author(s) and contributor(s) and not of MDPI and/or the editor(s). MDPI and/or the editor(s) disclaim responsibility for any injury to people or property resulting from any ideas, methods, instructions or products referred to in the content. |
© 2024 by the authors. Licensee MDPI, Basel, Switzerland. This article is an open access article distributed under the terms and conditions of the Creative Commons Attribution (CC BY) license (http://creativecommons.org/licenses/by/4.0/).
Copyright: This open access article is published under a Creative Commons CC BY 4.0 license, which permit the free download, distribution, and reuse, provided that the author and preprint are cited in any reuse.


