Submitted:
21 February 2024
Posted:
22 February 2024
You are already at the latest version
Abstract
E-scooters are a micromobility transportation option for completing short trips. In recent years, many cities welcomed shared e-scooters in an effort to offer more mode choices, increase travelers' convenience, and reduce automobile use in their service areas. However, a knowledge gap still remains regarding the acceptability of shared e-scooters as a transportation option, which motivates additional research on user and non-user preferences and attitudes toward e-scooter use. This study investigates latent variables impacting the adoption of shared e-scooters in urban areas, focusing on mode choice factors and attitudes towards e-scooter use and car use. The study utilizes machine learning (ML) techniques and SHAP analysis to analyze survey data (N=1196) collected from travelers in Washington, D.C., Miami, FL, and Los Angeles, CA, in 2021 and 2022. A comparative analysis is performed to develop comprehensive demographic profiles of e-scooter users. The analysis reveals gender (male), age (25-39 years age group), higher income, and educational background as the most relevant factors toward e-scooter use. Attitudinal variations among e-scooter users and non-users underscore the complexity of perceptions toward e-scooter use, with significant differences in mode choice factors and attitudes toward the use of e-scooters and private vehicles. Notably, educational background ranked as a significant factor in Washington, D.C., and Miami, while Factor 3, derived from factor analysis and encompassing car use attitudes and the utilization of technology, emerged as influential in Los Angeles. This research contributes fresh insights into factors shaping e-scooter adoption, offering a foundation for informed urban transportation planning and policymaking. The holistic approach showcased in this study enhances understanding of shared micromobility and its implications for urban mobility.
Keywords:
E-scooter
; micromobility
; latent factors
; attitudes
; machine learning
; SHAP analysis
; mode choice
; survey
; urban setting
1. Introduction
The overreliance on automobiles to meet mobility needs has led to heightened congestion and increased pollutant levels, while public transportation struggles to cope with the growing demand for urban mobility (Zarif et al., 2019). In response to these challenges, various new mobility concepts have emerged, with shared mobility standing out as a rapidly expanding sector within the transportation-sharing economy. Shared mobility encompasses diverse services like car-sharing and bike-sharing, addressing the evolving needs of urban travelers (Shaheen et al., 2017). Within the realm of shared mobility, the concept of shared micromobility has gained prominence. This involves temporarily renting small, low-speed vehicles designed for individual transportation, encompassing both station-based bike-sharing and dockless alternatives (Murphy et al., 2021). A notable addition to this sector is the shared electric scooter (e-scooter), a service that has witnessed substantial global growth in recent years (Lee et al., 2021; Shaheen et al., 2020; Tuncer et al., 2020). Since their introduction in 2017 in the U.S., shared e-scooters have grown in popularity in urban settings. In the U.S. alone, 136 million shared micromobility trips were recorded in 2019, marking a substantial 60% increase from 2018. Notably, e-scooter trips accounted for 86 million of these journeys (NACTO, 2022).
Given the exponential growth and increasing popularity of these emerging services, it becomes important to document users’ preferences and how they impact their travel mode choices at locations where e-scooter services are available. Understanding the dynamics of these evolving mobility solutions is paramount for crafting effective strategies that cater to the diverse needs of urban travelers.
The examination of travel mode choice stands as a well-explored and captivating domain within travel behavior research. The existing literature highlights the multifaceted nature of factors influencing the selection of travel modes, encompassing sociodemographic characteristics of travelers (Bhat & Srinivasan, 2005; Cheng et al., 2016; De Vos et al., 2016; Ryley, 2006), their attitudes towards modes (De Vos et al., 2016; Paulssen et al., 2014; Scheiner & Holz-Rau, 2007; Tyrinopoulos & Antoniou, 2019), and external factors like comfort, convenience, safety, and overall travel satisfaction (Eriksson et al., 2013; Scheiner & Holz-Rau, 2007; Schneider, 2013; Zhou et al., 2015).
Most e-scooter studies traditionally rely on constructing user profiles of e-scooter users based solely on explanatory variables, such as demographic characteristics. Despite the rapidly growing research in this field, a knowledge gap exists regarding user and non-user preferences and attitudes toward e-scooter use while taking under consideration latent variables in different cities. This study aims to fill this research gap by posing the following four research questions:
- Research Question 1.
- Are there any differences in the profiles of e-scooter users and non-users among different cities?
- Research Question 2.
- Are there any differences concerning mode choice factors and attitudes toward e-scooter and private vehicle use among different cities?
- Research Question 3.
- Can latent variables influence the prediction of mode choice of e-scooter users and non-users?
- Research Question 4.
- Do the influential factors on e-scooter mode selection vary across different cities?
At the core of this research lies the primary aim of investigating the potential effects of latent variables in predicting the utilization of e-scooters as a mode of transportation in urban environments. The study focuses on mode choice factors and attitudinal and perceptual measures related to both e-scooters and private vehicle users. The geographical context provides depth to this exploration, encompassing three diverse cities—Washington, D.C., Miami, FL, and Los Angeles, CA. This deliberate selection enables a comprehensive comparative analysis designed to unveil city-specific dynamics that may influence the adoption of e-scooters. Machine learning (ML) techniques serve as a valuable tool to support the objectives of this study through the utilization of prediction models and SHAP analysis.
2. Literature Review
Shared micromobility is recognized as a practical and sustainable transportation option for short-range trips that offers potential benefits, including alleviating local traffic congestion, enhancing air quality, and contributing to the decarbonization of the transportation fleet (DuPuis et al., 2019; Gubman et al., 2019). A swiftly expanding shared micromobility service is the e-scooter, which has been introduced in numerous cities and countries over the past five years (Flores & Jansson, 2021).
Compared to other forms of mobility, relatively little is known about the mode choice factors, travel patterns, perceptions and attitudes, and the potential modal shift associated with shared micromobility use. To comprehend the potential impact of this emerging service, it is essential to explore the varied usage patterns across different cities through user surveys and field data collection (Hong et al., 2023; Torabi K et al., 2022). Collecting survey data involves distributing a questionnaire within a designated service area. Surveys are instrumental in gathering user demographics and preferences information, which are typically not captured through ridership data collection. Questions about user preferences include considerations related to the use of micromobility modes for first/last mile transport (Torabi et al., 2022) and the intentions of survey participants to use the micromobility services (Mouratidis, 2022). For example, in their analysis, Degele et al. (2018) examined the utilization patterns of e-scooter sharing programs and contended that e-scooters are especially effective for short-distance travel. This assertion was supported by their examination of data obtained from a German e-scooter provider. Surveys of e-scooter users also indicated that riders are driven using e-scooters due to their fun nature, offering a quicker and more convenient alternative, affordability, and function as a connector to transit options (NACTO, 2021).
Research findings propose that individuals utilizing shared micromobility services tend to have similar demographic characteristics. Previous research has examined the profiles of e-scooter users using survey analyses, uncovering a consistent pattern where the majority of e-scooter riders tend to be young, of White (Caucasian) ethnicity, and male, with higher household income levels and possessing a college degree (NABSA, 2019; PBOT, 2018; Reck et al., 2021; SFMTA, 2019). The majority of e-scooter users are younger adults, and studies report that age is a significant factor influencing e-scooter usage (Christoforou et al., 2023; Wang et al., 2023). Usage, in general, tends to decrease with age (Zuniga-Garcia et al., 2022); however, elderly individuals who begin e-scooter riding frequently evolve into consistent users (Nikiforiadis et al., 2021). Additionally, numerous studies indicate that e-scooters are perceived as attractive and receive positive evaluations from a significant portion of the population from diverse racial backgrounds and lower-income groups as a mode of transportation (Dill & McNeil, 2021; PBOT, 2018). Murphy et al. (2021) examined surveys encompassing 18 cities in the U.S. and discovered a higher representation of people of color among e-scooter users. Additionally, there are minimal differences and variations in income levels among e-scooter riders and the broader population (Murphy et al., 2021).
Apart from demographic and socioeconomic traits, research has highlighted that attitudinal factors significantly influence the likelihood of adopting and using e-scooters (Blazanin et al., 2022; Javadinasr et al., 2022). Earlier reports also noted that travelers’ attitudes toward shared e-scooters were crucial predictors of e-scooter users (ATLDOT, 2019; SFMTA, 2019). Certain authors explored the diversity of preferences in e-scooter usage through advanced modeling techniques, including structural equation modeling and latent class models (Guo & Zhang, 2021; Javadinasr et al., 2022; Lee et al., 2021). interest exists in identifying latent variables affecting the acceptance or reluctance of shared micromobility mode use and documenting the attitudes of respondents that significantly impact the adoption process. Reportedly, people with positive attitudes toward technology, including trust and interest in technologies (Dirsehan & Can, 2020; Haboucha et al., 2017; Lavieri et al., 2017), are more likely to adopt and embrace new emerging forms of transportation, such as shared e-scooters.
It is well recognized that modal choice factors such as safety, cost, comfort, reliability, and environmental impacts serve as underlying variables for adapting to new forms of transportation. Therefore, comprehending the factors that influence modal choice is essential in identifying the barriers that new users may face when considering the use of shared micromobility services (Oeschger et al., 2020). A survey conducted in Greece has confirmed that safety concerns are a primary reason why non-users refrain from using e-scooters (Nikiforiadis et al., 2021). Sanders et al. (2020) emphasized that survey participants cited convenience and speed as benefits of e-scooter use and identified safety and reliability as their main concerns. Other studies have noted that younger adults are motivated to use micromobility options primarily for their environmental advantages (Aguilera-García et al., 2020; Eccarius & Lu, 2020), while older adults are drawn to micromobility modes because of the potential health benefits they offer (Bourne et al., 2020). Results from other surveys underscored that factors such as convenience, ease of use, and the enjoyment of riding were the most significant positive aspects, whereas a lack of infrastructure, safety concerns, and regulatory issues emerged as the main barriers to embracing this mode of transportation (Leger et al., 2019).
This study expands on the current body of literature on e-scooter use by evaluating preferences, perceptions, and attitudes toward shared e-scooter use of both users and non-users. The study further examines intentional and attitudinal variables in addition to the commonly used demographic and socioeconomic factors. Additionally, this study considers variations due to geographical context by comparing users’ and non-users’ perspectives and identifying the observed and unobserved factors associated with e-scooter usage at different study locations.
3. Data
3.1. Study Context and Data Collection
This study used information collected through an online questionnaire survey involving both e-scooter users and non-users across three cities: Washington, D.C., Miami, FL, and Los Angeles, CA. Study participants were enlisted in April 2021 and May 2022 in Washington, D.C., from September to November 2021, in Miami, and in May 2022 in Los Angeles Participants had to meet residency and age (18 years of age or above) eligibility criteria and provide their consent for participation in the study. The survey was developed in Qualtrics, and Qualtrics managed the recruitment and compensation of participants in accordance with their standard business practices. The required approvals were secured from the Institutional Review Board offices in collaboration with the University of Florida and Florida International University.
Prior to the dissemination of the survey, pilot testing was conducted among a select group knowledgeable about transportation systems in Washington, D.C. and Los Angeles Feedback from this phase was integrated into the final survey instrument. The survey was meticulously designed and structured to solicit information regarding respondents’ mobility attitudes, their travel behaviors and choices, and their demographic profiles. First, participants were first asked about the frequency of using various travel modes in the preceding 30 days. Subsequent inquiries delved into attitudinal and perceptual measures concerning mobility, travel preferences, and trip purpose using Likert scale questions. Additionally, details about demographic and socioeconomic characteristics of participants were gathered. The dataset containing the study participants’ responses was made available through the STRIDE University Transportation Center, and additional details regarding the data collection effort are available in (Zhao et al., 2023).
3.2. Research Sample
The study sample consisted of a total of 1196 complete responses. Some additional entries were excluded because of unanswered questions or responses to specific travel attitude questions considered unreasonable. Respondents from Washington, D.C., contributed 414 responses (35% of total), those from Miami provided 408 responses (34%), and respondents from Los Angeles contributed 375 responses (31%).
To address the first research question as stated in the introduction, the study investigated the overall characteristics of the study sample, distinguishing between e-scooter users and non-users (Table 1). Participants who had never used shared e-scooters were categorized as “non-users”, whereas those who reported using a shared e-scooter at least once were categorized as “users”. Table 1 highlights intriguing differences between the proportions of e-scooter users and non-users across the three cities studied. The numbers of users and non-users in Washington, D.C., and Los Angeles were relatively balanced. Conversely, Miami reported a lower percentage of e-scooter users (8% of total survey respondents) and a notably higher percentage of non-users (26% of total).
The demographic profile of e-scooter users across Washington, D.C., Miami, and Los Angeles reveals interesting trends (Table 2). The majority of e-scooter users reported being male, comprising 58% in Washington, D.C., 61% in Miami, and 65% in Los Angeles Age distribution showed a higher concentration of e-scooter users within the 25-39 age group. In terms of income, a diverse representation was observed, with a notable proportion of users falling into the higher income brackets in each city. Most e-scooter users reported owning one vehicle, while one-third of respondents in Washington, D.C. (37%) and 22% in Los Angeles. who identified as e-scooter users did not own an automobile. The responses related to household sizes predominantly fell into the 2-person category. A high percentage of e-scooter users (over 92%) possessed a valid driver’s license across all study sites. Student status was reported by 28% of e-scooter users in Miami but only 13% in Washington, D.C., while employment rates varied across cities. Educational backgrounds were diverse, with a substantial number holding at least a Bachelor’s degree ranging from 86% in Washington, D.C., to 55% in Miami. The racial composition of e-scooter users was also diverse, with the majority being white but with significant multicultural representation.
The profiles of e-scooter users in the three cities studied aligned with findings from previous study surveys, Indicating that individuals who use e-scooters are typically more likely to be of a younger age and male, with higher household income, and possessing a higher level of education and of White ethnicity. (NABSA, 2019; Reck & Axhausen, 2021; SFMTA, 2019).This comprehensive overview provides insights into the varied factors shaping the e-scooter user pool in each city.

Table 2.
E-scooter user’s profile by city.
| Variable | Category | Washington, D.C. | Miami | Los Angeles | |||||
| n | % | n | % | n | % | ||||
| Gender: | Male | 111 | 58% | 62 | 61% | 112 | 65% | ||
| Female | 79 | 41% | 39 | 39% | 56 | 33% | |||
| Age: | 18–24 | 33 | 17% | 12 | 12% | 31 | 18% | ||
| 25–29 | 51 | 26% | 19 | 19% | 44 | 26% | |||
| 30–39 | 64 | 33% | 44 | 44% | 56 | 33% | |||
| 40–49 | 28 | 15% | 17 | 17% | 28 | 16% | |||
| 50–59 | 11 | 6% | 8 | 8% | 11 | 6% | |||
| 60 or over | 6 | 3% | 1 | 1% | 1 | 1% | |||
| Income: | Less than $25,000 | 10 | 5% | 5 | 5% | 27 | 16% | ||
| $25,000–$49,999 | 29 | 15% | 26 | 26% | 28 | 16% | |||
| $50,000–$74,999 | 30 | 16% | 14 | 14% | 22 | 13% | |||
| $75,000–$99,999 | 30 | 16% | 21 | 21% | 23 | 13% | |||
| $100,000–$124,999 | 22 | 11% | 9 | 9% | 15 | 9% | |||
| $125,000–$149,999 | 16 | 8% | 13 | 13% | 6 | 4% | |||
| $150,000 or more | 35 | 18% | 13 | 13% | 32 | 19% | |||
| Vehicles: | 0 | 72 | 37% | 8 | 8% | 37 | 22% | ||
| 1 | 75 | 39% | 31 | 31% | 63 | 37% | |||
| 2 | 35 | 18% | 29 | 29% | 50 | 29% | |||
| 3 | 3 | 2% | 25 | 25% | 10 | 6% | |||
| 4 | 7 | 4% | 4 | 4% | 9 | 5% | |||
| 5 | 0 | 0% | 3 | 3% | 1 | 1% | |||
| 6 or more | 1 | 1% | 1 | 1% | 1 | 1% | |||
| HousePop: | 1 | 71 | 37% | 14 | 14% | 44 | 26% | ||
| 2 | 76 | 39% | 20 | 20% | 67 | 39% | |||
| 3 | 17 | 9% | 24 | 24% | 27 | 16% | |||
| 4 | 16 | 8% | 25 | 25% | 18 | 11% | |||
| 5 | 9 | 5% | 14 | 14% | 11 | 6% | |||
| 6 or more | 4 | 2% | 4 | 4% | 4 | 2% | |||
| License: | Yes | 178 | 92% | 100 | 99% | 153 | 89% | ||
| Student: | Yes | 26 | 13% | 28 | 28% | 35 | 20% | ||
| Employment: | Employed | 8 | 4% | 81 | 80% | 18 | 11% | ||
| Other or no answer | 185 | 96% | 20 | 20% | 153 | 89% | |||
| Education: | High school or less | 11 | 6% | 17 | 17% | 29 | 17% | ||
| Associate’s degree | 15 | 8% | 30 | 30% | 33 | 19% | |||
| Bachelor’s degree | 95 | 49% | 42 | 42% | 78 | 46% | |||
| Post-graduate degree | 72 | 37% | 13 | 13% | 31 | 18% | |||
| Race: | White | 127 | 66% | 68 | 67% | 87 | 51% | ||
| Black | 17 | 9% | 27 | 27% | 11 | 6% | |||
| Asian | 17 | 9% | 1 | 1% | 19 | 11% | |||
| Other (Multicultural) | 32 | 17% | 5 | 5% | 54 | 32% | |||
In addition to examining the shared e-scooter user profile, it was determined important to also explore the distinctive characteristics of non-users across the three cities and draw comparisons between users and non-users. The findings are summarized in Table 3. Gender distribution among non-users indicated a relatively balanced representation, with males constituting 50% of non-users in Washington, D.C., 56% in Miami, and 55% in Los Angeles. Age demographics revealed a higher concentration of non-users in the 30-39 age group.
Income disparities were observed, especially in Miami, where 31% of non-users reported earning between $25,000 and $49,999, compared to e-scooter users, who had higher proportions in the higher income brackets. The proportion of non-users who had zero vehicles in Washington, D.C. (20%) and Los Angeles (10%) was notably lower compared to e-scooter users (37% and 22%, respectively), indicating differences between e-scooter users and non-users. Household sizes varied across categories, emphasizing distinctions in family structures. License ownership was found to be consistently high among the non-users, as was also the case with e-scooter users. Employment status and student enrollment presented differences, with a higher portion of non-users reported being employed compared to e-scooter users. Educational backgrounds showed variability, as expected, with a notable percentage holding at least a Bachelor’s degree, similar to users. Racial composition indicated diversity, reflecting a predominantly white population and significant representation from other racial and multicultural groups.
The insights obtained for the examination of both shared e-scooter users and non-users contribute to a comprehensive understanding of both user groups, paving the way for the development of strategies and targeted interventions with the potential to enhance e-scooter adoption and cater to the diverse mobility needs of the urban population.
4. Methods and Procedure
In this study, Likert scale visualization was employed to explore potential differences among study cities in terms of mode choice factors and travelers’ attitudes towards e-scooter and private vehicle use. Furthermore, the Kruskal-Wallis test was utilized to assess variations across cities statistically, enhancing the robustness of the analysis. Another key objective of this study was to investigate the influence of latent variables as determinants of mode choice, particularly in distinguishing between e-scooter users and non-users. This objective necessitated the application of factor analysis to identify latent variables. Subsequently, prediction models were employed to evaluate the impact of these latent variables on accurately predicting e-scooter usage patterns using machine learning techniques. Moreover, the study aimed to determine if factors that influenced the use of e-scooters exhibited variability across the study cities. For this purpose, SHAP analysis was utilized to interpret the output of the prediction models. Overall, the analysis provided valuable insights into the distinct contributions of influential factors within each urban setting, contributing to an improved understanding of e-scooter usage patterns across diverse city contexts.
4.1. Kruskal-Wallis Test
To compare the observed variables, the study utilized a visual representation of each Likert scale question, followed by the application of the Kruskal-Wallis test to identify any significant differences among participants’ attitudes in the study cities. Transportation researchers often employ this method to assess whether there is a statistically significant difference in diverse urban transport systems (McNally & Kulkarni, 1997; Özdemir & Tasan-Kok, 2017). Introduced by Kruskal and Wallis in 1952, the Kruskal-Wallis test is specifically designed to examine differences among three or more independently sampled groups regarding a single continuous variable that does not follow a normal distribution. (Kruskal & Wallis, 1952). This test is particularly suitable for non-normally distributed data, such as ordinal or rank data. Subsequently, significant findings are further examined using posthoc tests to identify categories that exhibited statistically significant differences. To address possible type-I errors, a Bonferroni correction is applied by adjusting the alpha level, reducing it from the standard 0.05.
4.2. Factor Analysis
In the context of factor analysis, the data were analyzed using IBM SPSS Statistics 26 (IBM SPSS, 2018). Initially, principal component analysis with varimax rotation was employed for exploratory factor analysis. This method aimed to decrease the dimensionality of attributes, consolidating them into a set of factors that effectively delineate the original construct of the analysis. To achieve more comprehensible clusters of factors, Varimax rotation was chosen for its ability to load a significantly reduced number of features on each factor (Field, 2013). The relevance of factors was determined by considering them significant only if their eigenvalue equaled or exceeded one. Following Stevens’s (2002) recommendation, factor loadings were deemed interpretable when their absolute value surpassed 0.4. There are two types of variables: observed variables (indicators) and latent variables (factors). Observed variables are directly measured or observed, such as individual survey questions about e-scooter attitudes, car use attitudes, or mode choice factors. On the other hand, latent variables are not directly measured but inferred from the observed variables. They represent unobservable constructs that may be influencing the observed variables. The goal of factor analysis in this study was to identify latent factors that can explain the correlations among the observed variables.
4.3. Prediction Model
The decision to consider machine learning models for prediction purposes in this study was influenced by their widespread use in the literature for classification (Breiman, 2001; Webb, Fürnkranz, et al., 2011; Webb, Sammut, et al., 2011). Binary logistic regression was chosen for its popularity as the predominant statistical model in binary analysis. The decision tree, known for its simplicity and interpretability, was also selected as it is widely employed in machine learning. Finally, Random Forest, an ensemble model recognized for its robustness and effectiveness with structured data, was included in the model selection.
4.4. SHAP Analysis
Model interpretability is a critical factor for users, as it enhances trust in the model and deepens understanding of the significance of features that improve overall model performance. Addressing this need, Lundberg and Lee (2017) introduced SHAP (SHapley Additive exPlanation), a tool designed to enhance the interpretability of machine learning models (Lundberg & Lee, 2017). SHAP analysis, a potent method employed to interpret and comprehend the output of machine learning models, allows for the attribution of a model’s predictions to individual features and the determination of the contribution of each feature to the overall prediction. This analysis is grounded in cooperative game theory’s Shapley values, ensuring a fair distribution of each feature’s contribution across all possible combinations. Such interpretability is particularly valuable for complex models, including ensemble methods and deep neural networks, where understanding the relationship between input features and predictions can be challenging. SHAP analysis was deemed useful in this study, as it enhances the transparency and understanding of machine learning models.
4.5. Model Performance Evaluation
Various performance metrics can be employed to assess the effectiveness of machine learning models. The ones most commonly used are accuracy, recall, precision, F1-score, and average precision. Accuracy, as a fundamental metric, evaluates the ratio of correctly predicted outcomes to the total number of cases. Recall evaluates a model’s proficiency in capturing all relevant cases by calculating the proportion of correctly predicted occurrences of a specific class among the total actual occurrences of that class. Precision assesses the accuracy of positive predictions by evaluating the ratio of correctly predicted occurrences of a class to the total occurrences predicted as that class. F1-score strikes a balance between precision and recall, offering a comprehensive evaluation of a model’s performance. Each metric contributes unique perspectives, ensuring a thorough assessment of a model’s capabilities, spanning from 0 to 1, where higher values indicate better performance (Jiao & Du, 2016).
5. Results
5.1. Descriptive Analysis
5.1.1. City-Wide Variation in Mode Choices
Figure 1 presents the transportation mode choices of survey participants across Washington, D.C., Miami, and Los Angeles. The bar chart, designed to illustrate the percentage of participants utilizing each mode over a 30-day period, facilitated a clear comparison between the study cities. The respondents were allowed to select more than one transportation mode. Walking emerges as a mode of choice for completing trips for the majority of survey participants across all cities, notably soaring to 92% in Washington, D.C. Personal vehicle use was most prevalent in Miami, with 84% of respondents reporting use and less common in Washington, D.C. (65% use). The trends were reversed with respect to the use of taxis or other ridesharing services, public transit, and biking, with Washington, D.C., showing higher utilization rates than Miami. E-scooters showcased considerable popularity, particularly in Washington, D.C., and Los Angeles, a trend that is indicative of a burgeoning trend in urban mobility. As Figure 1 shows, approximately 46% of users reported riding e-scooters during the 30-day reference period in Washington, D.C., and Los Angeles and 25% in Miami. The lower prevalence of car-sharing services, exemplified by Zipcar, suggests that such services are a less common choice among respondents across the three cities studied.
5.1.2. Likert Scale Questions (Observed Variables)
This section summarizes responses related to mode choice factors, as well as e-scooter and car user attitudes. The goal is to illustrate respondents’ perspectives on these three types of considerations. Firstly, concerning mode choice factors, participants were asked to rate the importance of six factors in their transportation mode selection. The factors considered were 1. cost, 2. time, 3. reliability, 4. comfort, 5. safety, and 6. environmental impacts. Specifically, the survey posed the question, “How important is each of the following factors in selecting your mode of travel?” and responses were measured on a Likert scale ranging from “not at all important” to “extremely important.” Figure 2 illustrates the participants’ responses by user group (e-scooter users versus non-users) and by location (Washington, D.C., Miami, and Los Angeles).
In the subsequent section, participants were queried about their perspectives on e-scooters and their correlation with public transit use through a set of six questions. Respondents were asked to express their agreement level using a Likert scale ranging from “strongly disagree” to “strongly agree” with the following statements:
- Riding e-scooters is a safe way to get around
- My city has enough bike lanes to accommodate e-scooter use
- My city has enough space for proper e-scooter parking
- The arrival of shared e-scooters is a good thing for the city
- Shared e-scooters can strengthen the operations of public transit (e.g., e-scooters can facilitate last-mile transit connection)
- Shared e-scooters will make people use transit less
Figure 3 illustrates the spectrum of responses for each question, categorized by user group (e-scooter users and non-users), across the three study cities.
In the final section, respondents were asked to express their attitudes toward car use and technology, utilizing the same Likert scale ranging from “strongly disagree” to “strongly agree.” This segment consisted of seven questions that solicited reflections on their interest in living without a car, their desire to own a car, preferences related to the use of public transit and non-motorized modes, confidence in using new technologies, perceived difficulty in learning new technologies, and general willingness to use shared modes of transportation. The statement used in the survey was as follows:
How much do you agree with the following statements:
- I hope to live without car
- I definitely want to own a car
- I try to use public transit whenever I can
- I try to travel with non-motorized modes (biking and walking) as much as I can
- I am confident in my ability to use new technologies (e.g., a smartphone app)
- Learning how to use new technologies is often frustrating for me
- As a general principle, I would rather own things than rent them.
Figure 4 provides an insightful visualization of the attitudes held by respondents in relation to car use and technology, shedding light on preferences and sentiments across different user groups (e-scooter users and non-users) across the three study cities.
In addition to the visual depiction of mode choice factors and e-scooter and car user attitudes of study participants by city illustrated in Figure 3 and Figure 4, it is important to conduct an in-depth comparison to discern significant differences in these responses. This involves employing statistical tests to analyze and quantify these distinctions in a systematic manner. Conducting statistical tests to compare the responses about each attitude across the three cities can provide a more in-depth understanding of these differences.
5.2. Kruskal-Wallis Test Results
Following the Likert scale visualization presented in the previous section, the Kruskal-Wallis test aimed to assess the significance of differences among mode choice factors and attitudes in Washington, Washington, D.C., Miami, and Los Angeles. The null hypothesis posits that Likert scale responses are similar across the cities, while a rejection of this hypothesis would suggest that variations exist in specific factors or attitudes among the cities. Subsequently, the significant findings were analyzed using posthoc tests to determine which of the categories were statistically different. The significance values were further adjusted by the Bonferroni correction for multiple tests, thereby reducing the normal alpha level to minimize the risk of type-I errors.
5.2.1. Mode Choice Factor
The Kruskal–Wallis test showed significant differences in participant evaluations according to mode choice factors, at least in two cities for both e-scooter users and non-users (Table 4). The Kruskal-Wallis test results for e-scooter users (N=464) revealed some interesting patterns in the perceptions of mode choice factors across Washington, D.C., Miami, and Los Angeles For reliability, comfort, safety, and environmental impacts representing certain aspects of mode choice considerations, Washington, D.C. and Los Angeles exhibit similar responses, suggesting a consistent viewpoint among e-scooter users in these cities, whereas Miami respondents reported different viewpoints on factors’ importance for choosing a mode compared to these two cities. Cost followed a similar pattern among cities but with a lower significance of differences. Time was a factor that differed from others, with only Los Angeles and Miami showing a difference in this viewpoint, while the other two combinations were found to be similar.
The Kruskal-Wallis test also unveiled notable distinctions in how non-e-scooter users assessed mode choice factors. Another outcome from the Kruskal-Wallis test was the confirmation of the existence of varying perspectives among non-users across the three cities regarding the importance of mode choice factors when compared to e-scooter users. In contrast to e-scooter users, non-users demonstrated divergent views on factors like cost, comfort, and safety in three pairwise comparisons, thus indicating differing attitudes across all three cities. Furthermore, only respondents from Washington, D.C., and Los Angeles shared similar viewpoints among non-users when considering time, reliability, and environmental impacts.
5.2.2. E-scooter Use Attitudes
As shown in Table 5, the results of the Kruskal-Wallis test revealed interesting variations in e-scooter users’ attitudes across Washington, D.C., Miami, and L.A. Interestingly, e-scooter users’ attitudes 1 and 3 do not show significant differences among e-scooter users in all three cities, indicating shared perspectives on the safety of e-scooters and the availability of sufficient e-scooter parking, with mean ratings of 3.8 and 3.5, respectively. These findings suggest a consensus among e-scooter users in expressing agreement with the mentioned aspects. For other attitudes, specifically attitudes 2, 4, and 5, it is interesting to see that respondents from Washington, D.C. and Los Angeles exhibit similar perspectives regarding the adequacy of bike lanes, the positive impact of shared e-scooters on the city, and the potential strengthening of public transit jn the presence of micromobility services. In contrast, Miami study participants diverged in their viewpoint on these attitudes, showcasing distinct perspectives compared to Washington, D.C. and Los Angeles among e-scooter users. Attitude 6, which pertains to the notion of e-scooters reducing people’s use of public transit, yielded differing results among cities in the Kruskal-Wallis test. The findings indicated a significant difference between Washington, D.C. and Miami, suggesting that e-scooter users in these two cities hold distinct perspectives on this particular attitude. Conversely, the remaining pairwise comparisons between Washington, D.C. and Los Angeles, as well as Los Angeles and Miami, showed similar viewpoints among e-scooter users.
The Kruskal-Wallis test results for non-users (N=732) exhibited notable differences by location. As shown in Table 5, all e-scooter attitude questions demonstrated variations among non-users across the three cities. Specifically, respondents from Los Angeles and Miami differed in their perspectives on safety and the availability of sufficient parking for e-scooters, whereas these attitudes were found to be similar across all three cities among e-scooter users. Additionally, respondents from Los Angeles and Washington, D.C. shared similarities only in views relating to adequate bike lane availability and the potential of e-scooters to reduce public transit usage, while Miami and Washington, D.C. aligned in the perception that the arrival of e-scooters is a good thing. Notably, the attitude related to strengthening public transit with e-scooters stands out as the only one where all pairwise comparisons are different among non-users in the three cities.
5.2.3. Car Use Attitudes
The Kruskal-Wallis test results on car users’ attitudes toward shared e-scooter users and non-users revealed significant differences between these two user groups and across Washington, D.C., Miami, and Los Angeles (Table 6). Specifically, for car use attitude 3, which concerns the use of public transit, the initial test results indicated the rejection of the hypothesis. However, in posthoc tests employing the Bonferroni correction, no significant differences were found among the three cities, leading to the retention of the null hypothesis. Examining similarities and differences among the cities, e-scooter users in Washington, D.C. and Los Angeles shared similarities in car use attitudes 1, 4, and 5, pertaining to living without a car, attempting to use non-motorized modes, and being able to use technology, respectively. Miami differed from Washington, D.C. and Los Angeles in these attitudes. Additionally, Miami and Washington, D.C. differed in car use attitude 7, which focused on the use of new technologies, with a low level of significance. From the perspective of non-users, the three cities exhibited significant differences in all car use attitudes except attitudes 1 and 3. For attitude 1, only Washington, D.C., and Los Angeles displayed differing perspectives, while for attitude 3, Los Angeles and Miami shared similar viewpoints, and the other pairwise comparisons differed in these attitudes.
5.3. Travel Behavior Characteristics of E-Scooter Users
Figure 5 presents the frequency distribution of e-scooter usage across Washington, D.C., Miami, and Los Angeles, offering insights into shared trends and distinctive patterns. In earlier work, Yang et al. (2023) conducted an analysis of the frequency of shared e-scooter usage; however, their study did not consider both trip purpose and the frequency of e-scooter usage together (Yang et al., 2023). The present study, on the other hand, included a comprehensive comparison among the three cities studied by considering both trip purpose and frequency of e-scooter use. It was found that in Washington, D.C., e-scooters were notably favored for occasional use in recreational activities, shopping, and social events, with a heightened frequency for commuting and for attending social events (23%), recreation (19%), and running errands (19%). Miami residents demonstrated varied e-scooter usage, emphasizing social activities and commuting as primary trip purposes. Notably, e-scooter use was particularly popular for recreation purposes (20% of respondents using them 1-2 times) and commuting (29%, 3-4 times) in Miami. Residents also utilized e-scooters for shopping, errands, and social activities. Los Angeles exhibited diverse e-scooter use, driven by recreational activities (17%, occasionally, and 14%, 1-2 times) and frequent use for shopping or errands (15%, 1-2 times). E-scooters in Los Angeles were also employed for commuting and social activities. These findings underscore the varied roles of e-scooters across the three cities, serving both leisure and practical needs. Such distinctions highlight the unique preferences and diverse applications of e-scooters among residents in each city, underscoring the significance of tailoring urban mobility solutions to local needs.
5.4. Factor Analysis Results (Dimensionality and Reliability of Latent Variables)
Conducting factor analysis served two primary purposes: (a) to evaluate a predetermined theoretical model or hypothesis regarding the connections between observed variables and latent constructs, and (b) to reduce the number of observed variables by identifying and validating underlying latent factors, i.e., aggregated factors suitable for describing the original construct of the analysis.
Principal Component Analysis was employed as the extraction method, followed by Varimax rotation and Kaiser Normalization. The results are summarized in Table 7. Exceeding the recommended α-level of 0.5, the statistical analysis demonstrated reliability and internal consistency for the factors (Hair, 2009; Nunnally, 1978). These coefficients also surpassed 0.5, aligning with acceptable standards for reliability (Nunnally, 1978). The Kaiser-Meyer-Olkin (KMO) Measure of Sampling Adequacy produced a value of 0.755, signifying satisfactory sampling adequacy. Additionally, Bartlett’s Test of Sphericity underscored the suitability of the data for factor analysis.
The factor analysis successfully reduced dimensionality, revealing latent constructs related to mode choice factors, e-scooter use attitudes, and car use attitudes. The results of the factor analysis offer valuable insights into the connections between observed variables and the latent constructs they signify. For e-scooter attitudes, all variables exhibit substantial factor loadings, ranging from 0.625 to 0.774 on Factor 1, indicating a robust association with this latent construct.
Similarly, observed variables representing mode choice factors display noteworthy factor loadings on Factor 2, ranging from 0.534 to 0.789, emphasizing their shared connection to this latent construct. Mode choice factor 6 had a loading less than 0.5, leading to the removal of the “environmental impacts” variable. Car use attitudes presented a more intricate pattern, with Factor 3 represented by car use attitudes 2, 3, 5, and 6, and Factor 4 represented by car use attitudes 1 and 4. Car use attitude 7, explaining the preference for owning rather than renting, was excluded due to a factor loading less than 0.5. The presence of negative factor loadings for car use attitudes 6 (“learning new technology is frustrating”) and car use attitude 1 (“living without a car”) implies an inverse relationship with their respective factors. Overall, this output underscores the grouping of variables into distinct latent constructs (Factors 1 to 4), providing an understanding of the underlying factors influencing the observed variables. It is important to highlight that these four factors capture a substantial portion of the overall variability in the data, explaining a total of 56.6% of the original variability. Therefore, the subsequent sections have employed these four factors as latent variables instead of using observed variables in the prediction models.
5.5. Model results
5.5.1. Comparison and Evaluation of Different Models
Table 8 presents the performance metrics of three Machine Learning predictive models, namely Binary Logistic Regression, Decision Tree, and Random Forest, in the classification of e-scooter users (Class 1) and non-users (Class 0) across all datasets encompassing the three study cities. Binary variables were generated, assigning a value of 1 for individuals who were male, white, possessed a driver’s license, and were employed or students. Correspondingly, a value of 0 was assigned for the opposite scenarios. Additionally, ordinal scales were employed to capture information on age, level of educational, income, as well as the frequency of taxi/Uber and transit usage. The objective was to predict shared e-scooter users and assess the importance of their features. The evaluation revealed that Binary Logistic Regression exhibited the lowest performance (overall accuracy=0.74), while Random Forest demonstrated the highest overall accuracy (0.82). Precision values were superior for non-users and lower for users across all methods. Similarly, recall performance mirrored precision for all methods. Notably, the F1-score was highest for Random Forest and lowest for Decision Tree across all methods.
5.5.2. Evaluating Feature Impact on E-Scooter Usage
After identifying the optimal prediction model, it is crucial to evaluate the impact of each feature on the model’s performance. Logit models, commonly used for prediction and classification due to their simple structure (Molnar, 2020), may not perform as effectively as more complex machine learning and deep learning models, as Du et al. (2019) suggested. In contrast, ensemble models are complex, making it challenging to interpret their behavior (Du et al., 2019). To overcome this challenge, the study employed SHAP analysis with Violin plots. Figure 6 depicts the distribution of SHAP values computed for each variable in the Random Forest model. The violin plots visually depict the relationship between feature values and their effects on e-scooter usage predictions. The color spectrum transitions from blue (indicating low feature values) to red (indicating high feature values). SHAP values signify the impact of each data point on e-scooter usage. In the violin plot, wider sections indicate a higher concentration of SHAP values for a specific feature. Positive SHAP values suggest features that positively contribute to the model’s predictions, while negative values indicate features with a negative impact. For instance, the employment feature has the widest plot and the most significant negative impact, similar to findings in earlier research (Yang et al., 2023). In contrast, Factor 1, reflecting participants’ positive attitudes toward e-scooters, and Factor 4, referring to individuals’ perceptions about living without a car and using non-motorized modes, exhibit opposing trends. Factors 1 and 4 extend the plot on the positive side, demonstrating a positive impact on e-scooter usage. Another notable observation is the influence of age on e-scooter utilization, revealing a decline in usage as age increases. The frequency of Uber usage and Factor 2, representing the importance of the mode choice factor, show a reverse impact on predictions. The red color of Uber’s frequency on the right side indicates its positive impact, signifying high feature values. In contrast, the red color of Factor 2 on the left side indicates high feature values in a negative manner. Another significant finding from the SHAP values is that individuals with higher education, higher income, and males have a positive impact on e-scooter usage predictions.
5.5.3. Uncovering Key Predictors through SHAP Analysis across Study Cities
For further details, a SHAP analysis was conducted to evaluate the important features of e-scooter users in each city separately, offering a clearer understanding of the partial influences of explanatory variables and improving the interpretability of the prediction model. Figure 7 presents the mean SHAP values for features derived from the SHAP analysis for Washington, D.C., Miami, and Los Angeles separately. According to Figure 7, employment status stands out as the most crucial feature for e-scooter users in Miami and Washington, D.C., aligning with the results obtained from analyzing all data combined. However, it is noteworthy that Factor 3, which is the most important predictor for Los Angeles users, did not emerge as a significant factor for e-scooter users in the aggregate data analysis. The second most important feature is Factor 4, which holds the highest importance for predicting Miami e-scooter users. The education feature, ranking as the second-highest in importance for predicting Washington, D.C. users after employment, stands out as an influential factor in the model. Factor 2 and the number of vehicles in the household also influence predictions, while other features have a comparatively lower impact on the predictive outcomes.
6. Discussion and Conclusions
This study aimed to unveil the potential impacts of latent variables in predicting e-scooter usage as a mode of transportation in urban settings. It specifically focused on exploring mode choice factors, along with attitudinal and perceptual measures related to e-scooters and private vehicles. By leveraging data from three cities (Washington, D.C., Miami, and Los Angeles), the study allowed for a comparative analysis between locations. The study analyzed and compared survey responses from shared e-scooter users (N = 465) and non-users (N = 732) and employed state-of-the-art methods and models to address research questions. Likert scale visualization and the Kruskal-Wallis test were employed to compare observed variables, while factor analysis was utilized to extract latent constructs. Utilizing machine learning models and SHAP analysis, the research delved into prediction and influential factors.
To address research question 1, the study initially investigated variations in profiles between e-scooter users and non-users across three cities. The main finding was a comprehensive demographic profile of e-scooter users in Washington, D.C., Miami, and Los Angeles, revealing trends such as male dominance, a concentration in the 25-39 age group, higher income representation, and varied educational backgrounds, with a substantial number holding at least a Bachelor’s degree. The profile aligns with previous studies at other locations (SFMTA, 2019; NABSA, 2020; Reck & Axhausen, 2021; Huang et al., 2024). On the other hand, gender variation was balanced among non-users, with a concentration of non-users in the 30-39 age group. The ownership of vehicles among non-users was notably lower, with a higher portion of non-users being employed compared to e-scooter users and having at least a Bachelor’s degree similar to e-scooter users (Yang et al., 2023).
In addressing research question 2, the study conducted a comparative analysis of attitudes and perceptions among e-scooter users and non-users across Washington, D.C., Miami, and Los Angeles. By employing Likert scale visualizations, the research emphasized distinctions in responses to three specific attitudinal questions. The Kruskal-Wallis test was crucial for in-depth comparisons, revealing significant disparities in mode choice factors, e-scooter attitudes, and car use attitudes. Significantly, in terms of mode choice factors, e-scooter users in Washington, D.C. and Los Angeles consistently expressed similar views, whereas non-users exhibited divergent attitudes, particularly in areas such as cost, comfort, and safety.
Furthermore, variations in e-scooter attitudes were identified among shared e-scooter users in Washington, D.C., Miami, and Los Angeles While shared perspectives were observed related to the safety of e-scooters and the availability of e-scooter parking, distinct viewpoints emerged on issues such as the adequacy of bike lanes, the impact of e-scooters on the city, and their potential influences on public transit usage. Interestingly, non-users displayed significant differences in attitudes across all three cities, reflecting diverse perspectives on the mentioned e-scooter attitudes.
Moreover, the study uncovered significant differences in car use attitudes between e-scooter users and non-users across the three cities, with variations in specific attitudes. Washington, D.C., and Los Angeles users exhibited similarities, while Miami differed, and significant distinctions among non-users were observed in all attitudes except attitudes 1 (living without a private car) and 3 (using public transit).
In the realm of travel behavior, the study unveiled diverse utilization patterns of e-scooters across Washington, D.C., Miami, and Los Angeles. In Washington, D.C., e-scooters were predominantly employed for sporadic recreational activities, shopping, and social events, with an increased frequency observed for commuting and attending social events. Miami residents showcased varied e-scooter usage, with a focus on social activities and commuting. Notably, e-scooters were favored for commuting, with 29% utilizing them 3-4 times in Miami. In Los Angeles, e-scooters serve a range of purposes, including recreational activities, shopping, errands, commuting, and social events, with the majority of usage occurring occasionally.
The factor analysis effectively reduced dimensionality, exposing latent constructs associated with mode choice factors, e-scooter attitudes, and car use attitudes. The findings revealed the extraction of four factors, each with Eigenvalues exceeding one, emphasizing the categorization of variables into clear latent constructs. This outcome enhanced our comprehension of the underlying factors that impact the observed variables.
Research question 3 focused on whether these latent factors could impact prediction models. Three predictive models were considered, namely Binary Logistic Regression, Decision Tree, and Random Forest, for two classes of users, i.e., e-scooter users (Class 1) and non-users (Class 0) across datasets from three cities. The evaluation revealed that Binary Logistic Regression exhibited the least effective performance, while Random Forest showcased the highest overall accuracy. SHAP analysis results indicated that following implementation, Latent Factors 4 and 1 from the factor analysis emerged as the most important variables, emphasizing the influential role of latent variables in impacting prediction models after employment status. Additionally, age and the frequency of Uber usage were identified as influential variables across all datasets.
To compare important variables affecting mode choice across three cities for e-scooter users and address research question 4, the study utilized mean SHAP values. The results revealed that employment was the most crucial factor for e-scooter users in Miami and Washington, D.C., which is consistent with the model for all datasets, and Factor 3 was the most important variable for e-scooter users in Los Angeles. This indicates that influential variables differ across the three cities. Additionally, the study found that the second most important feature was latent Factor 4, which holds significant importance for predicting Miami e-scooter users but has a less pronounced effect on predicting Washington, D.C. users. Surprisingly, the education feature ranked as the second-highest in importance for predicting Washington, D.C. users after employment, and it emerged as the seventh most influential factor in the model for differentiating e-scooter users and non-users. This finding underscores that each city has its own influential factors in predicting e-scooter users, influenced by participants’ demographics, perceptions, attitudes, and other contextual factors.
To sum up, this study successfully addressed its overarching objective by delving into the potential impacts of latent variables on predicting the use of e-scooters as a mode of transportation in urban environments. The study honed in on mode choice factors and attitudinal and perceptual measures related to e-scooters and private vehicles, fostering a comparative analysis across three diverse cities—Washington, D.C., Miami, and Los Angeles. Guided by the formulated research questions, the findings not only illuminated distinctions in profiles between e-scooter users and non-users in these major cities but also uncovered variations in mode choice factors and attitudes toward e-scooters and private vehicles. The study demonstrated that the latent variables hold the potential to influence the prediction model, distinguishing between e-scooter users and non-users. Additionally, the investigation revealed variations in the influential factors driving e-scooter usage across the selected cities. These outcomes collectively contribute valuable insights to urban transportation planning and policymaking, providing a foundation for informed decision-making and targeted interventions in the dynamic landscape of shared micromobility.
7. Limitations and Future Work
Future research should explore the challenges associated with predicting shared micromobility usage using survey data. While this study successfully identified influential factors among e-scooter users, it did not comprehensively examine all variables that could potentially impact predictions. Addressing these limitations is crucial for advancing research in this field. Subsequent studies could investigate broader datasets on e-scooter travel mode choices, incorporating additional inputs or explanatory variables such as last trip distance, duration, and public transit satisfaction, which significantly influence mode choice. Examining how these variables shape shared micromobility usage patterns would be a valuable avenue for future research. The scope of this research was limited to consideration of survey responses from three U.S. cities. Expansion of the dataset to include additional study locations is expected to refine the study findings and further increase the reliability of estimates on certain factors. Furthermore, including additional psychological and social factors in surveys is necessary to evaluate people’s perceptions of using e-scooters.
Author Contributions
The authors confirm their contribution to the paper as follows: study conception and design: Mostafa Jafarzadehfadaki, Virginia Sisiopiku; data analysis and interpretation of results: Mostafa Jafarzadehfadaki; draft manuscript preparation: Mostafa Jafarzadehfadaki, Virginia Sisiopiku. All authors reviewed the results and approved the final version of the manuscript.
Funding and Acknowledgments
This work was sponsored by the United States Department of Transportation Office of the Assistant Secretary for Research and Technology (OST-R) through the Southeastern Transportation Research, Innovation, Development, and Education Center- STRIDE (Project D4). The authors would like to thank STRIDE for this support and Drs. X. Zhao, X. Yan, X. Jin, and W. Yang for facilitating the data sharing.
Declaration of Competing Interest
The authors affirm no conflicts of interest in the publication of this paper and confirm its originality, with no prior publication elsewhere or consideration by other journals.
References
- Aguilera-García, Á.; Gomez, J.; Sobrino, N. Exploring the adoption of moped scooter-sharing systems in Spanish urban areas. Cities 2020, 96, 102424. [Google Scholar] [CrossRef]
- ATLDOT. Atlanta E-Scooter Survey Results. 2019. Available online: https://www.atlantaga.gov/home/showdocument?id=45981.
- Bhat, C. R.; Srinivasan, S. A multidimensional mixed ordered-response model for analyzing weekend activity participation. Transportation Research Part B: Methodological 2005, 39, 255–278. [Google Scholar] [CrossRef]
- Blazanin, G.; Mondal, A.; Asmussen, K. E.; Bhat, C. R. E-scooter sharing and bikesharing systems: An individual-level analysis of factors affecting first-use and use frequency. Transportation Research Part C: Emerging Technologies 2022, 135, 103515. [Google Scholar] [CrossRef]
- Bourne, J. E.; Cooper, A. R.; Kelly, P.; Kinnear, F. J.; England, C.; Leary, S.; Page, A. The impact of e-cycling on travel behaviour: A scoping review. Journal of Transport & Health 2020, 19, 100910. [Google Scholar] [CrossRef]
- Breiman, L. Random forests. Machine Learning 2001, 45, 5–32. [Google Scholar] [CrossRef]
- By, P.; Mohammadian, A.; Rahimi, E.; Javadinasr, M.; Shamshiripour, A.; Davatgari, A.; Allahyari, A.; Brown, T. Analyzing the Impacts of a Successful Diffusion of Shared E-Scooters and Other Micromobility Devices and Efficient Management Strategies for Successful Operations in Illinois. In Fhwa-Ict-22-006 (Issue 22). 2022. Available online: https://hdl.handle.net/2142/114146%0Ahttp://hdl.handle. [CrossRef]
- Cheng, L.; Chen, X.; Yang, S. An exploration of the relationships between socioeconomics, land use and daily trip chain pattern among low-income residents. Transportation Planning and Technology 2016, 39, 358–369. [Google Scholar] [CrossRef]
- Christoforou, Z.; Psarrou Kalakoni, A. M.; Farhi, N. Neighborhood characteristics encouraging micromobility: An observational study for tourists and local users. Travel Behaviour and Society 2023, 32, 100564. [Google Scholar] [CrossRef]
- De Vos, J.; Mokhtarian, P. L.; Schwanen, T.; Van Acker, V.; Witlox, F. Travel mode choice and travel satisfaction: bridging the gap between decision utility and experienced utility. Transportation 2016, 43, 771–796. [Google Scholar] [CrossRef]
- Degele, J.; Gorr, A.; Haas, K.; Kormann, D.; Krauss, S.; Lipinski, P.; Tenbih, M.; Koppenhoefer, C.; Fauser, J.; Hertweck, D. Identifying E-Scooter Sharing Customer Segments Using Clustering. 2018 IEEE International Conference on Engineering 2018, Technology and Innovation (ICE/ITMC), 1–8. [CrossRef]
- Dill, J.; McNeil, N. Are Shared Vehicles Shared by All? A Review of Equity and Vehicle Sharing. Journal of Planning Literature 2021, 36, 5–30. [Google Scholar] [CrossRef]
- Dirsehan, T.; Can, C. Examination of trust and sustainability concerns in autonomous vehicle adoption. Technology in Society 2020, 63, 101361. [Google Scholar] [CrossRef]
- Du, M.; Liu, N.; Hu, X. Techniques for interpretable machine learning. Communications of the ACM 2019, 63, 68–77. [Google Scholar] [CrossRef]
- DuPuis, N.; Griess, J.; Klein, C. Micromobility in Cities. A HISTORY AND POLICY OVERVIEW; 2019; Available online: https://www.nlc.org/wp-content/uploads/2019/04/CSAR_MicromobilityReport_FINAL.
- Eccarius, T.; Lu, C. C. Powered two-wheelers for sustainable mobility: A review of consumer adoption of electric motorcycles. International Journal of Sustainable Transportation 2020, 14, 215–231. [Google Scholar] [CrossRef]
- Eriksson, L.; Friman, M.; Gärling, T. Perceived attributes of bus and car mediating satisfaction with the work commute. Transportation Research Part A: Policy and Practice 2013, 47, 87–96. [Google Scholar] [CrossRef]
- Field, A. Discovering statistics using IBM SPSS statistics. sage 2013. [Google Scholar]
- Flores, P. J.; Jansson, J. The role of consumer innovativeness and green perceptions on green innovation use: The case of shared e-bikes and e-scooters. Journal of Consumer Behaviour 2021, 20, 1466–1479. [Google Scholar] [CrossRef]
- Gubman, J.; Jung, A.; Kiel, T.; Strehmann, J. Shared E-Scooters: Paving the Road Ahead Policy Recommendations for Local Government; 2019; Available online: www.agora-verkehrswende.de.
- Guo, Y.; Zhang, Y. Understanding factors influencing shared e-scooter usage and its impact on auto mode substitution. Transportation Research Part D: Transport and Environment 2021, 99, 102991. [Google Scholar] [CrossRef]
- Haboucha, C. J.; Ishaq, R.; Shiftan, Y. User preferences regarding autonomous vehicles. Transportation Research Part C: Emerging Technologies 2017, 78, 37–49. [Google Scholar] [CrossRef]
- Hair, J.F. Multivariate data analysis. 2009.
- Hong, D.; Jang, S.; Lee, C. Investigation of shared micromobility preference for last-mile travel on shared parking lots in city center. Travel Behaviour and Society 2023, 30, 163–177. [Google Scholar] [CrossRef]
- Huang, E.; Yin, Z.; Broaddus, A.; Yan, X. Shared e-scooters as a last-mile transit solution? Travel behavior insights from Los Angeles and Washington D.C. Travel Behaviour and Society 2024, 34, 100663. [Google Scholar] [CrossRef]
- IBM SPSS. IBM SPSS STATISTICS. /: https, 2018. Available online: https://daisource.com/spss-statistics/.
- Javadinasr, M.; Asgharpour, S.; Rahimi, E.; Choobchian, P.; Mohammadian, A. K.; Auld, J. Eliciting attitudinal factors affecting the continuance use of E-scooters: An empirical study in Chicago. Transportation Research Part F: Traffic Psychology and Behaviour 2022, 87, 87–101. [Google Scholar] [CrossRef]
- Javadinasr, M.; Asgharpour, S.; Rahimi, E.; Choobchian, P.; Mohammadian, A. K.; Auld, J. Eliciting attitudinal factors affecting the continuance use of E-scooters: An empirical study in Chicago. Transportation Research Part F: Traffic Psychology and Behaviour 2022, 87, 87–101. [Google Scholar] [CrossRef]
- Jiao, Y.; Du, P. Performance measures in evaluating machine learning based bioinformatics predictors for classifications. Quantitative Biology 2016, 4, 320–330. [Google Scholar] [CrossRef]
- Kruskal, W. H.; Wallis, W. A. Use of Ranks in One-Criterion Variance Analysis. Journal of the American Statistical Association 1952, 47, 583–621. [Google Scholar] [CrossRef]
- Lavieri, P. S.; Garikapati, V. M.; Bhat, C. R.; Pendyala, R. M.; Astroza, S.; Dias, F. F. Modeling Individual Preferences for Ownership and Sharing of Autonomous Vehicle Technologies. Transportation Research Record 2017, 2665, 1–10. [Google Scholar] [CrossRef]
- Lee, H.; Baek, K.; Chung, J. H.; Kim, J. Factors affecting heterogeneity in willingness to use e-scooter sharing services. Transportation Research Part D: Transport and Environment 2021, 92, 102751. [Google Scholar] [CrossRef]
- Lee, M.; Chow, J. Y. J.; Yoon, G.; He, B. Y. Forecasting e-scooter substitution of direct and access trips by mode and distance. Transportation Research Part D: Transport and Environment 2021, 96, 102892. [Google Scholar] [CrossRef]
- Leger, S. J.; Dean, J. L.; Edge, S.; Casello, J. M. “If I had a regular bicycle, I wouldn’t be out riding anymore”: Perspectives on the potential of e-bikes to support active living and independent mobility among older adults in Waterloo, Canada. Transportation Research Part A: Policy and Practice 2019, 123, 240–254. [Google Scholar] [CrossRef]
- Lundberg, S. M.; Lee, S.-I. A unified approach to interpreting model predictions. Advances in Neural Information Processing Systems 2017, 30. [Google Scholar] [CrossRef]
- McNally, M. G.; Kulkarni, A. Assessment of Influence of Land Use–Transportation System on Travel Behavior. Transportation Research Record 1997, 1607, 105–115. [Google Scholar] [CrossRef]
- Molnar, C. Interpretable machine learning, Lulu. com. 2020.
- Mouratidis, K. Bike-sharing, car-sharing, e-scooters, and Uber: Who are the shared mobility users and where do they live? Sustainable Cities and Society 2022, 86, 104161. [Google Scholar] [CrossRef]
- Murphy, C.; Curtis, T.; Costagliola, E.; Clewlow, R.; Seki, S.; Xu, R. Transit and Micromobility. In Transit and Micromobility. 2021. [CrossRef]
- NABSA. Shared Micromobility State of the Industry Report. 2019. Available online: https://nabsa.net/wp-content/uploads/2020/12/NABSA-2020-State-of-the-Industry-Report.pdf.
- NACTO. Shared Micromobility Ridership in the U.S. from 2010-2021. 2021.
- NACTO. National Association of City Transportation Officials. 2022. Available online: https://nacto.org/wp-content/uploads/2022/12/2020-2021_shared_micro_snapshot_Dec7_2022.pdf.
- Nikiforiadis, A.; Paschalidis, E.; Stamatiadis, N.; Raptopoulou, A.; Kostareli, A.; Basbas, S. Analysis of attitudes and engagement of shared e-scooter users. Transportation Research Part D: Transport and Environment 2021, 94, 102790. [Google Scholar] [CrossRef]
- Nunnally, J. Fundamentals of factor analysis. Psychometric Theory 1978, 327–404. [Google Scholar]
- Oeschger, G.; Carroll, P.; Caulfield, B. Micromobility and public transport integration: The current state of knowledge. Transportation Research Part D: Transport and Environment 2020, 89, 102628. [Google Scholar] [CrossRef]
- Özdemir, E.; Tasan-Kok, T. Planners’ role in accommodating citizen disagreement: The case of Dutch urban planning. Urban Studies 2017, 56, 741–759. [Google Scholar] [CrossRef]
- Paulssen, M.; Temme, D.; Vij, A.; Walker, J. L. Values, attitudes and travel behavior: a hierarchical latent variable mixed logit model of travel mode choice. Transportation 2014, 41, 873–888. [Google Scholar] [CrossRef]
- PBOT. E-Scooter Findings Report. 2018. Available online: https://www.portland.gov/sites/default/files/2020-04/pbot_e-scooter_01152019.pdf.
- Reck, D. J.; Axhausen, K. W. Who uses shared micro-mobility services? Empirical evidence from Zurich, Switzerland. Transportation Research Part D: Transport and Environment 2021, 94, 102803. [Google Scholar] [CrossRef]
- Reck, D. J.; Haitao, H.; Guidon, S.; Axhausen, K. W. Explaining shared micromobility usage, competition and mode choice by modelling empirical data from Zurich, Switzerland. Transportation Research Part C: Emerging Technologies 2021, 124, 102947. [Google Scholar] [CrossRef]
- Ryley, T. Use of non-motorised modes and life stage in Edinburgh. Journal of Transport Geography 2006, 14, 367–375. [Google Scholar] [CrossRef]
- Sanders, R. L.; Branion-Calles, M.; Nelson, T. A. To scoot or not to scoot: Findings from a recent survey about the benefits and barriers of using E-scooters for riders and non-riders. Transportation Research Part A: Policy and Practice 2020, 139, 217–227. [Google Scholar] [CrossRef]
- Scheiner, J.; Holz-Rau, C. Travel mode choice: affected by objective or subjective determinants? Transportation 2007, 34, 487–511. [Google Scholar] [CrossRef]
- Schneider, R. J. Theory of routine mode choice decisions: An operational framework to increase sustainable transportation. Transport Policy 2013, 25, 128–137. [Google Scholar] [CrossRef]
- SFMTA. San Francisco Municipal Transportation Agency. Powered Scooter Share Mid-Pilot Evaluation. 2019. Available online: https://www.sfmta.com/sites/default/files/reports-and-documents/2019/08/powered_scooter_share_mid-pilot_evaluation_final.pdf.
- Shaheen, S. A.; Bansal, A.; Chan, N.; Cohen, A. Mobility and the sharing economy: industry developments and early understanding of impacts. In Low Carbon Mobility for Future Cities: Principles and applications; Institution of Engineering and Technology, 2017; pp. 213–240. [Google Scholar] [CrossRef]
- Shaheen, S.; Cohen, A.; Chan, N.; Bansal, A. Sharing strategies: carsharing, shared micromobility (bikesharing and scooter sharing), transportation network companies, microtransit, and other innovative mobility modes. In Transportation, Land Use, and Environmental Planning; (Issue 2010, pp. 237–262); Elsevier, 2020. [Google Scholar] [CrossRef]
- Stevens, J. P. Applied multivariate statistics for the social sciences (Chapter 3). Multiple Regression 2002, 76–78. [Google Scholar]
- Torabi K, F.; Araghi, Y.; van Oort, N.; Hoogendoorn, S. Passengers preferences for using emerging modes as first/last mile transport to and from a multimodal hub case study Delft Campus railway station. Case Studies on Transport Policy 2022, 10, 300–314. [Google Scholar] [CrossRef]
- Tuncer, S.; Laurier, E.; Brown, B.; Licoppe, C. Notes on the practices and appearances of e-scooter users in public space. Journal of Transport Geography 2020, 85, 102702. [Google Scholar] [CrossRef]
- Tyrinopoulos, Y.; Antoniou, C. Review of factors affecting transportation systems adoption and satisfaction. In Demand for Emerging Transportation Systems: Modeling Adoption, Satisfaction, and Mobility Patterns; Elsevier Inc., 2019. [Google Scholar] [CrossRef]
- Wang, K.; Qian, X.; Fitch, D. T.; Lee, Y.; Malik, J.; Circella, G. What travel modes do shared e-scooters displace? A review of recent research findings. Transport Reviews 2023, 43, 5–31. [Google Scholar] [CrossRef]
- Webb, G. I.; Fürnkranz, J.; Fürnkranz, J.; Fürnkranz, J.; Hinton, G.; Sammut, C.; Sander, J.; Vlachos, M.; Teh, Y. W.; Yang, Y.; Mladeni, D.; Brank, J.; Grobelnik, M.; Zhao, Y.; Karypis, G.; Craw, S.; Puterman, M. L.; Patrick, J. Decision Tree. In Encyclopedia of Machine Learning; Sammut, C., Webb, G.I., Eds.; Springer US, 2011; pp. 263–267. [Google Scholar] [CrossRef]
- Webb, G. I.; Sammut, C.; Perlich, C.; Horváth, T.; Wrobel, S.; Korb, K. B.; Noble, W. S.; Leslie, C.; Lagoudakis, M. G.; Quadrianto, N.; Buntine, W. L.; Quadrianto, N.; Buntine, W. L.; Getoor, L.; Namata, G.; Getoor, L.; Han, Xin Jin, J.; Ting, J.-A.; Vijayakumar, S.; … Raedt, L. De. Logistic Regression. In Encyclopedia of Machine Learning (pp. 631–631). Springer US. 2011. [CrossRef]
- Yang, W.; Jafarzadehfadaki, M.; Yan, X.; Zhao, X.; Jin, X.; Frolich, D.; Sisiopiku, V. P. (2023). Shared E-Scooter User Characteristics and Usage Patterns across Four U.S. Cities. Transportation Research Record: Journal of the Transportation Research Board, December. [CrossRef]
- Zarif, R.; Pankratz, D.; Kelman, B. Small is beautiful. Making micromobility work for citizens, cities, and service providers. 2019. Available online: https://www2.deloitte.com/us/en/insights/focus/future-of-mobility/micro-mobility-is-the-future-of-urban-transportation.html?id=us:2ps:3gl:confidence:eng:cons:42319:nonem:na:nhRV7UOl:1149484916:344865936403:b:Future_of_Mobility:Micromobility_BMM:nb.
- Zhao, X.; Yan, X. J.; Sisiopiku, V.; Kaza, N.; Kitner, N.; McDonald, N.; Jin, X.; LaMondia, J.; Broaddus, A. Mobility-on-Demand Transit for Smart and Sustainable Cities. Project D4, Final Report to the Southeastern Transportation Research, Innovation, Development and Education, June 2023.
- Zhou, X.; Jia, X.; Du, H. Travel Mode Choice Based on Perceived Quality of Bus Service. CICTP 2015, 2015, 1534–1545. [Google Scholar] [CrossRef]
- Zuniga-Garcia, N.; Tec, M.; Scott, J. G.; Machemehl, R. B. Evaluation of e-scooters as transit last-mile solution. Transportation Research Part C: Emerging Technologies 2022, 139, 103660. [Google Scholar] [CrossRef]
Figure 1.
Mode choice over the past 30 days across Washington, D.C., Miami, and Los Angeles.
Figure 2.
Likert scale visualization of mode choice factors for e-scooter users and non-users across Washington, D.C., Miami, and Los Angeles.
Figure 2.
Likert scale visualization of mode choice factors for e-scooter users and non-users across Washington, D.C., Miami, and Los Angeles.
Figure 3.
Likert scale visualization of e-scooter attitudes for e-scooter users and non-users across Washington, D.C., Miami, and Los Angeles.
Figure 3.
Likert scale visualization of e-scooter attitudes for e-scooter users and non-users across Washington, D.C., Miami, and Los Angeles.
Figure 4.
Likert scale visualization of car use attitudes for e-scooter users and non-users across Washington, D.C., Miami, and Los Angeles.
Figure 4.
Likert scale visualization of car use attitudes for e-scooter users and non-users across Washington, D.C., Miami, and Los Angeles.
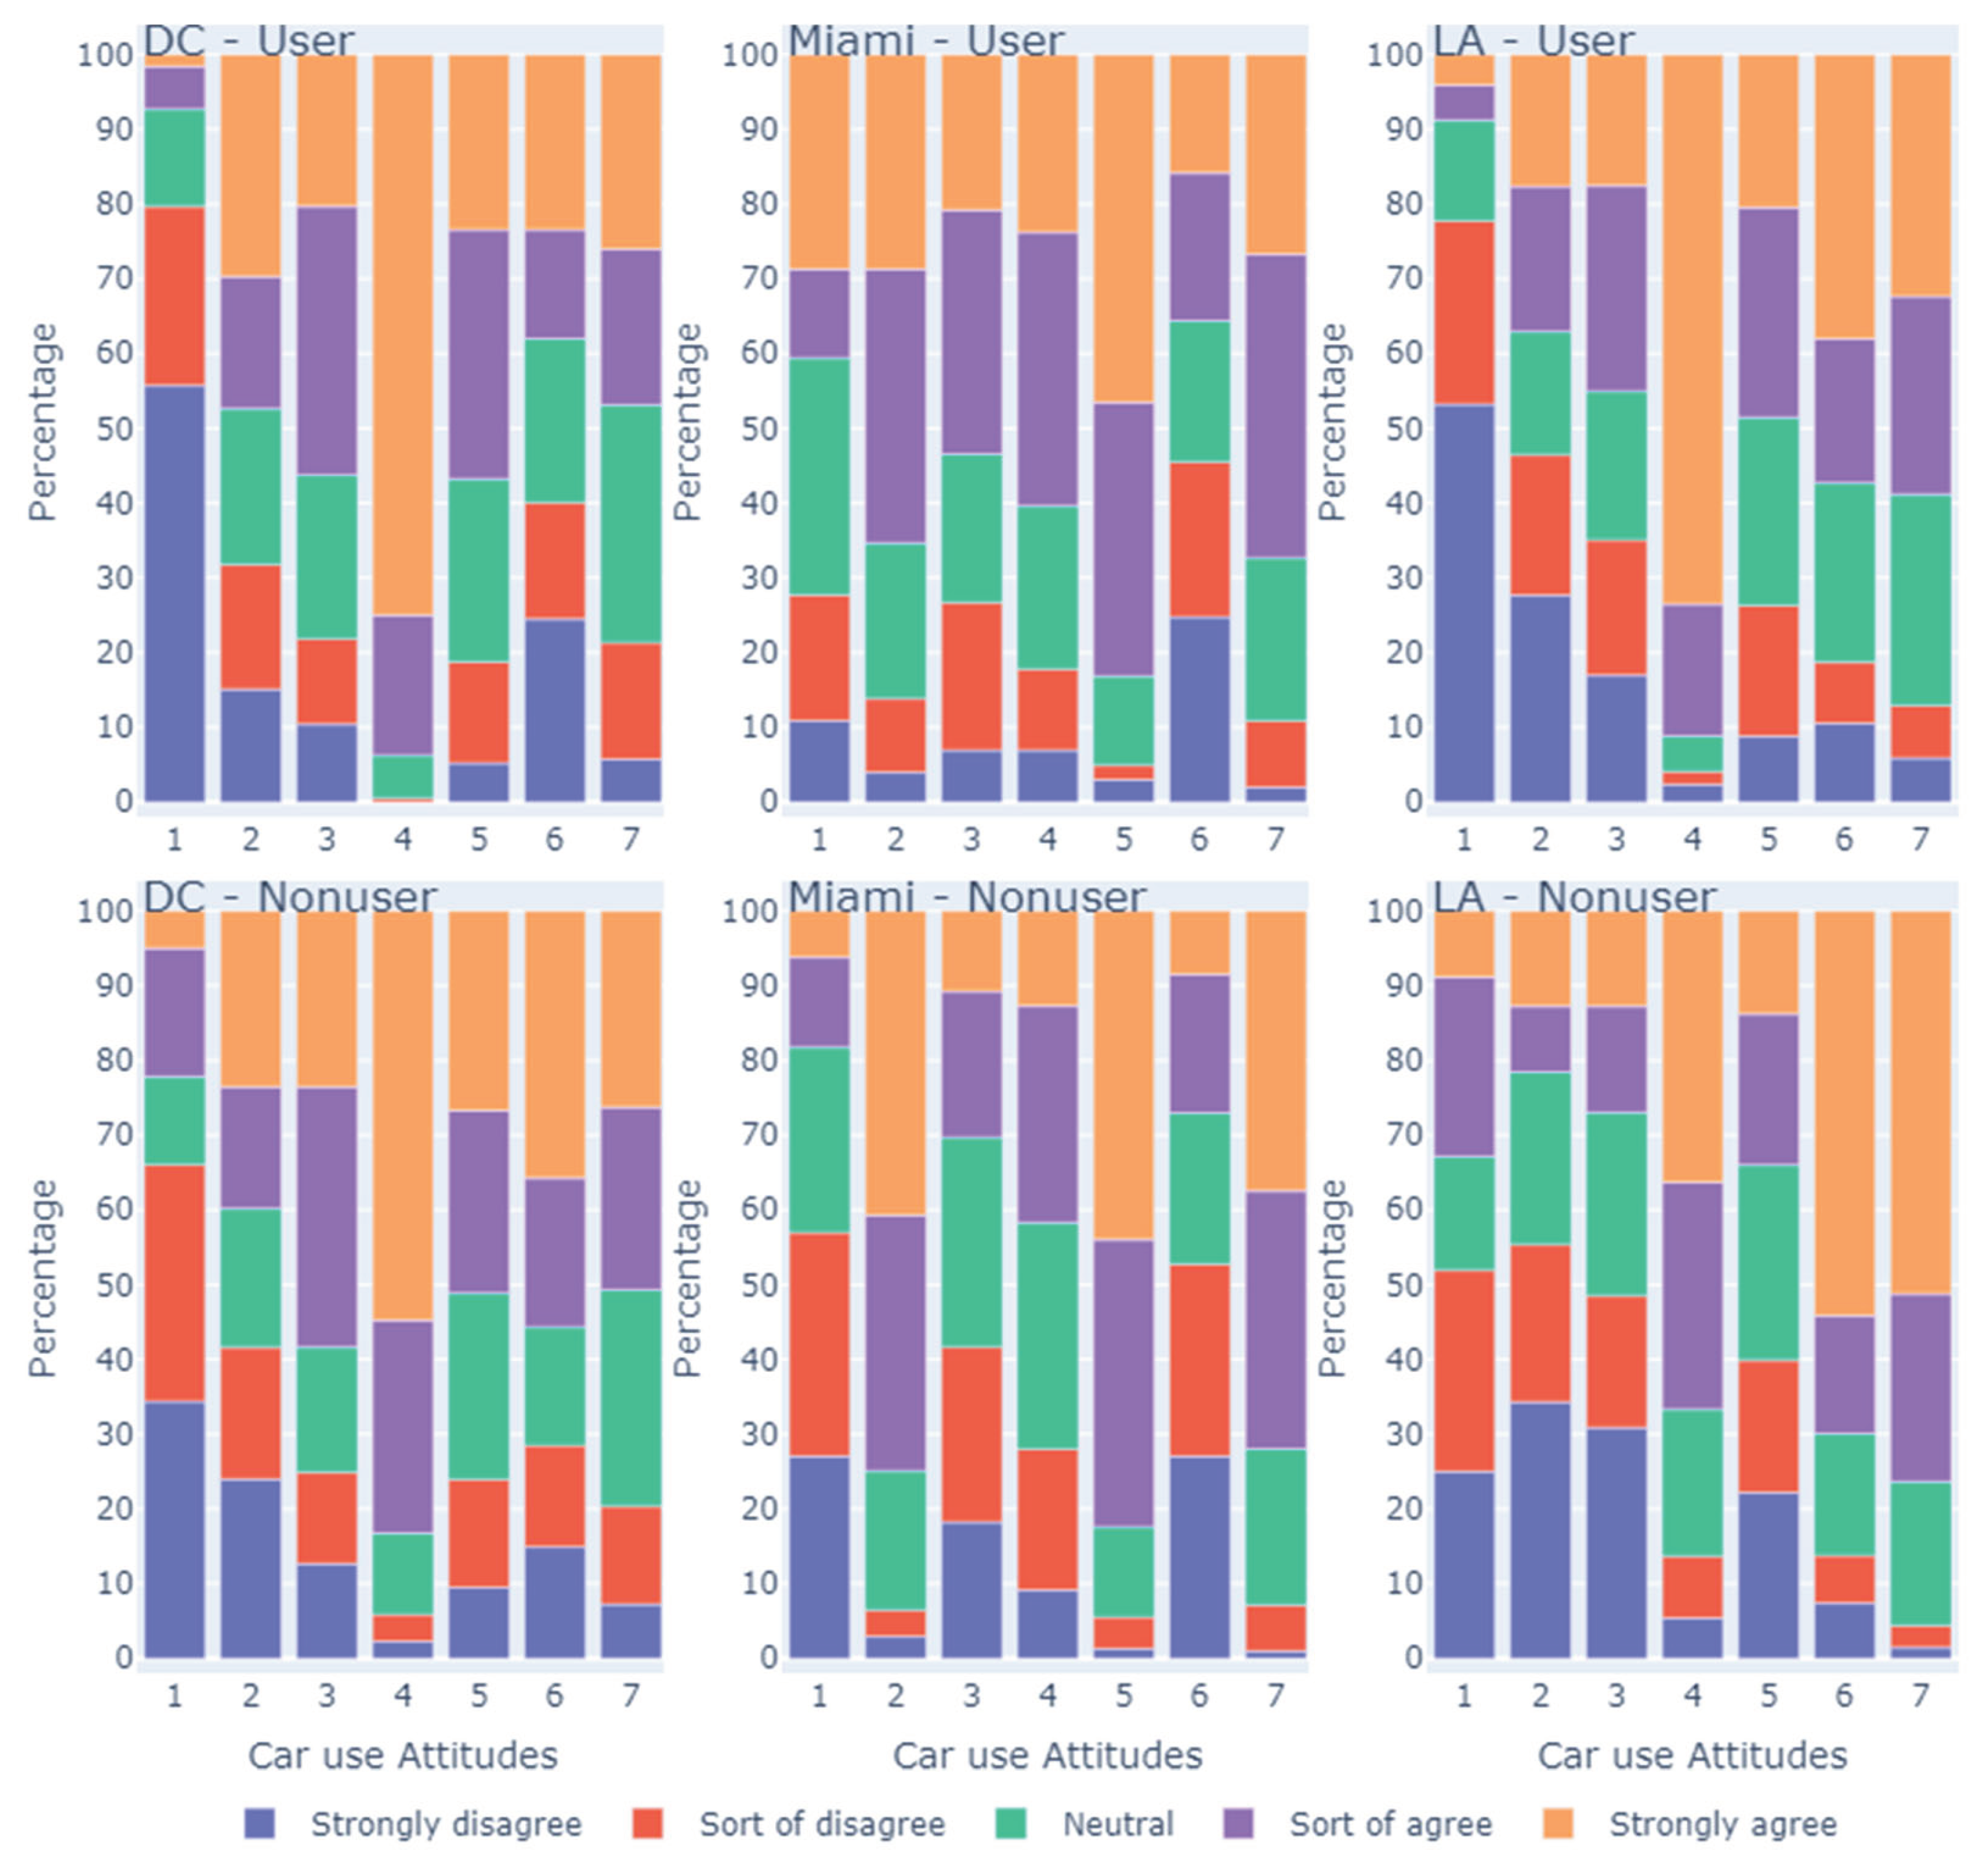
Figure 5.
Comparative frequency distribution of e-scooter usage and trip purpose across Washington, D.C., Miami, and Los Angeles.
Figure 5.
Comparative frequency distribution of e-scooter usage and trip purpose across Washington, D.C., Miami, and Los Angeles.
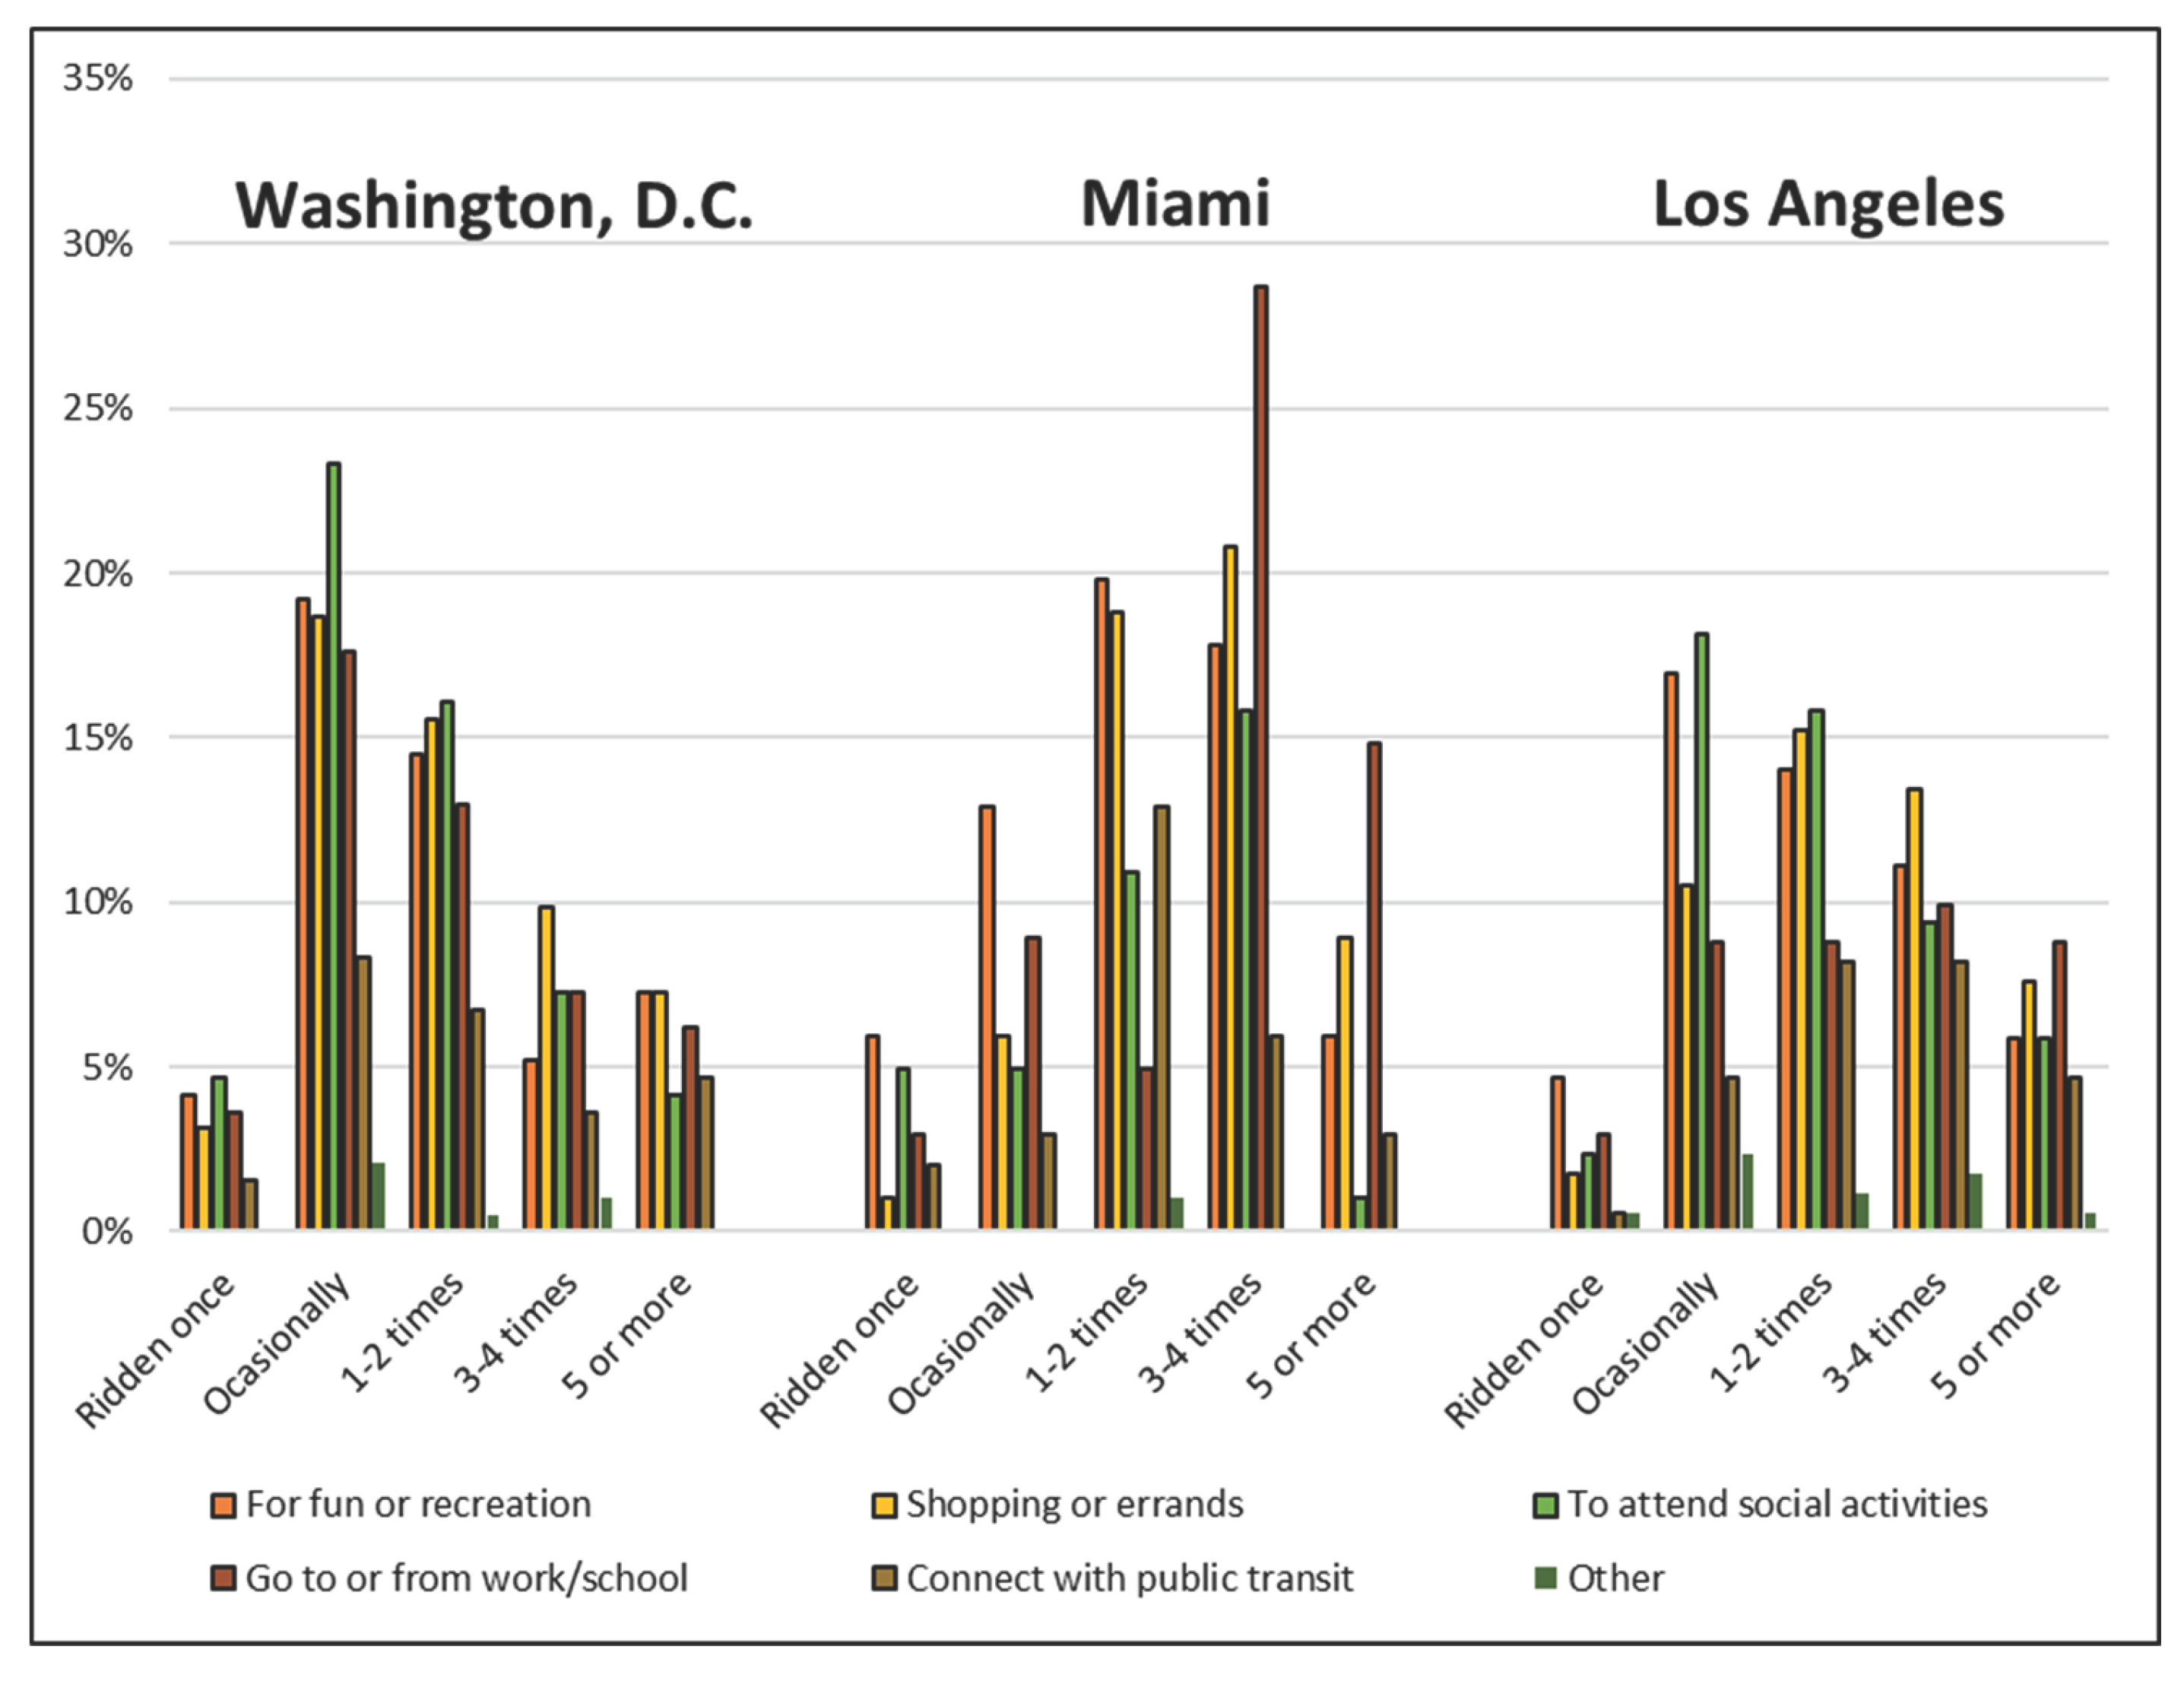
Figure 6.
Distribution of SHAP values computed for each variable for all study datasets.
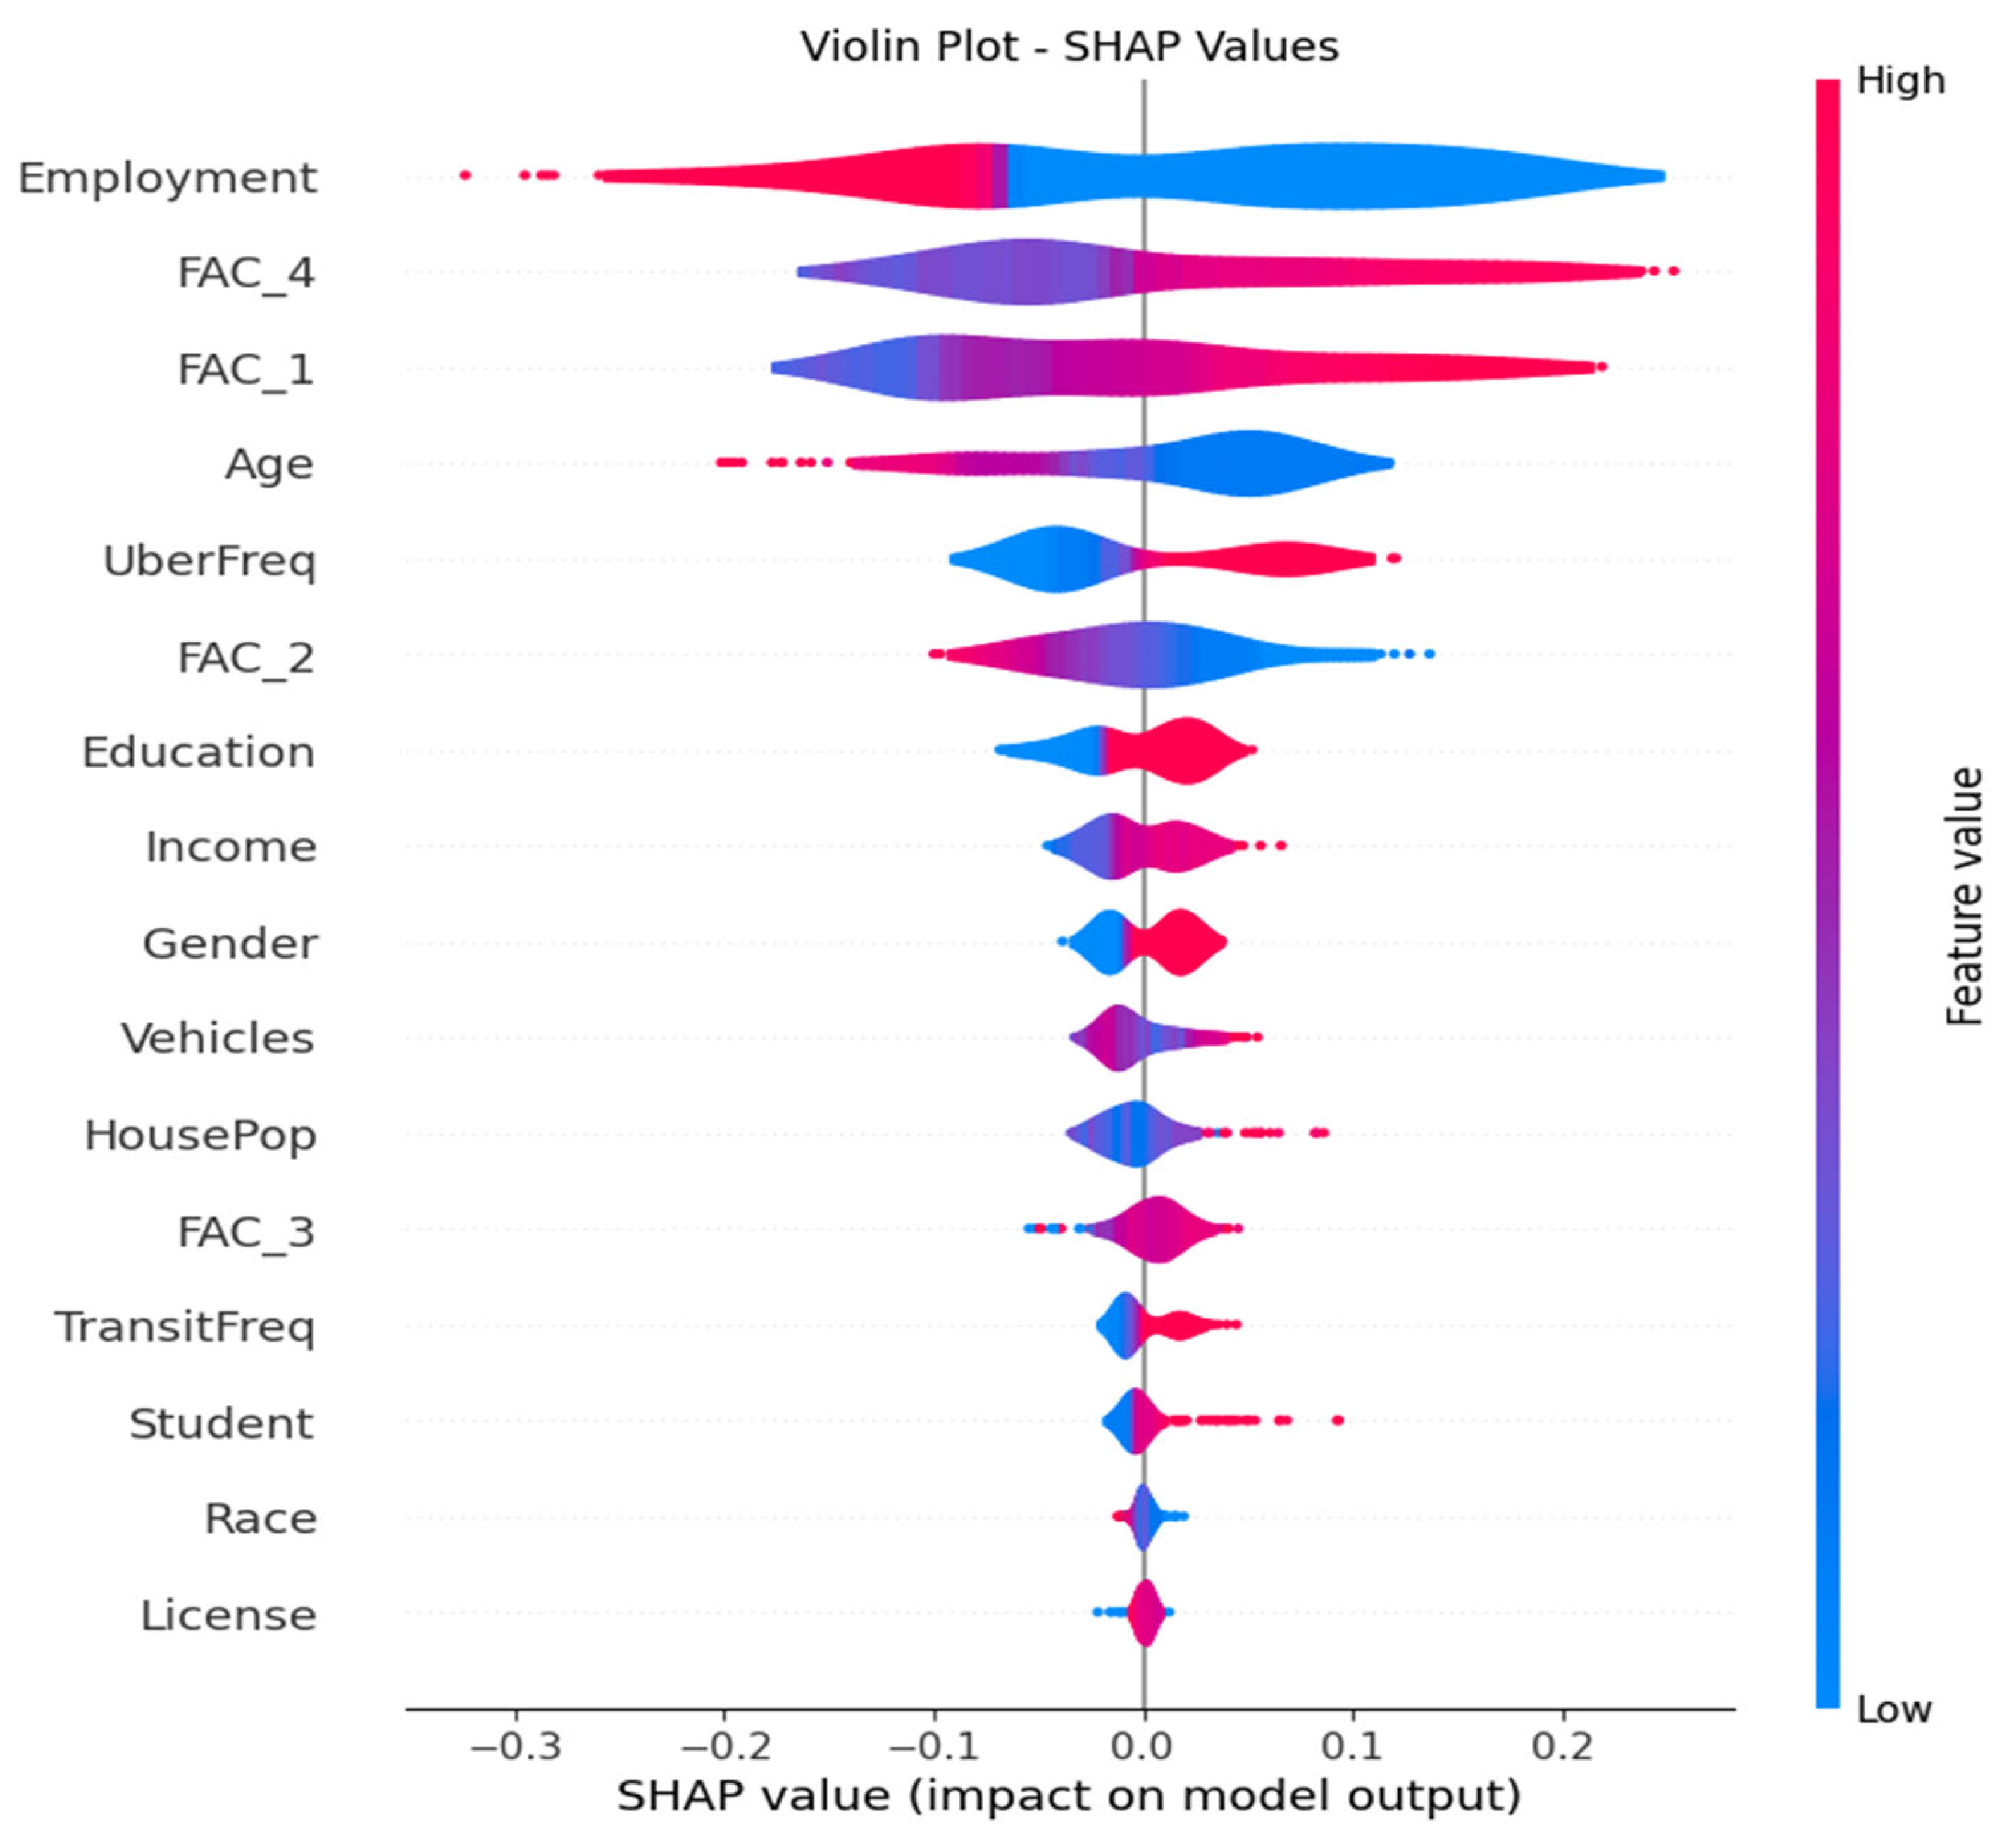
Figure 7.
Mean SHAP values of features from SHAP analysis across Washington, D.C., Miami, and Los Angeles.
Figure 7.
Mean SHAP values of features from SHAP analysis across Washington, D.C., Miami, and Los Angeles.
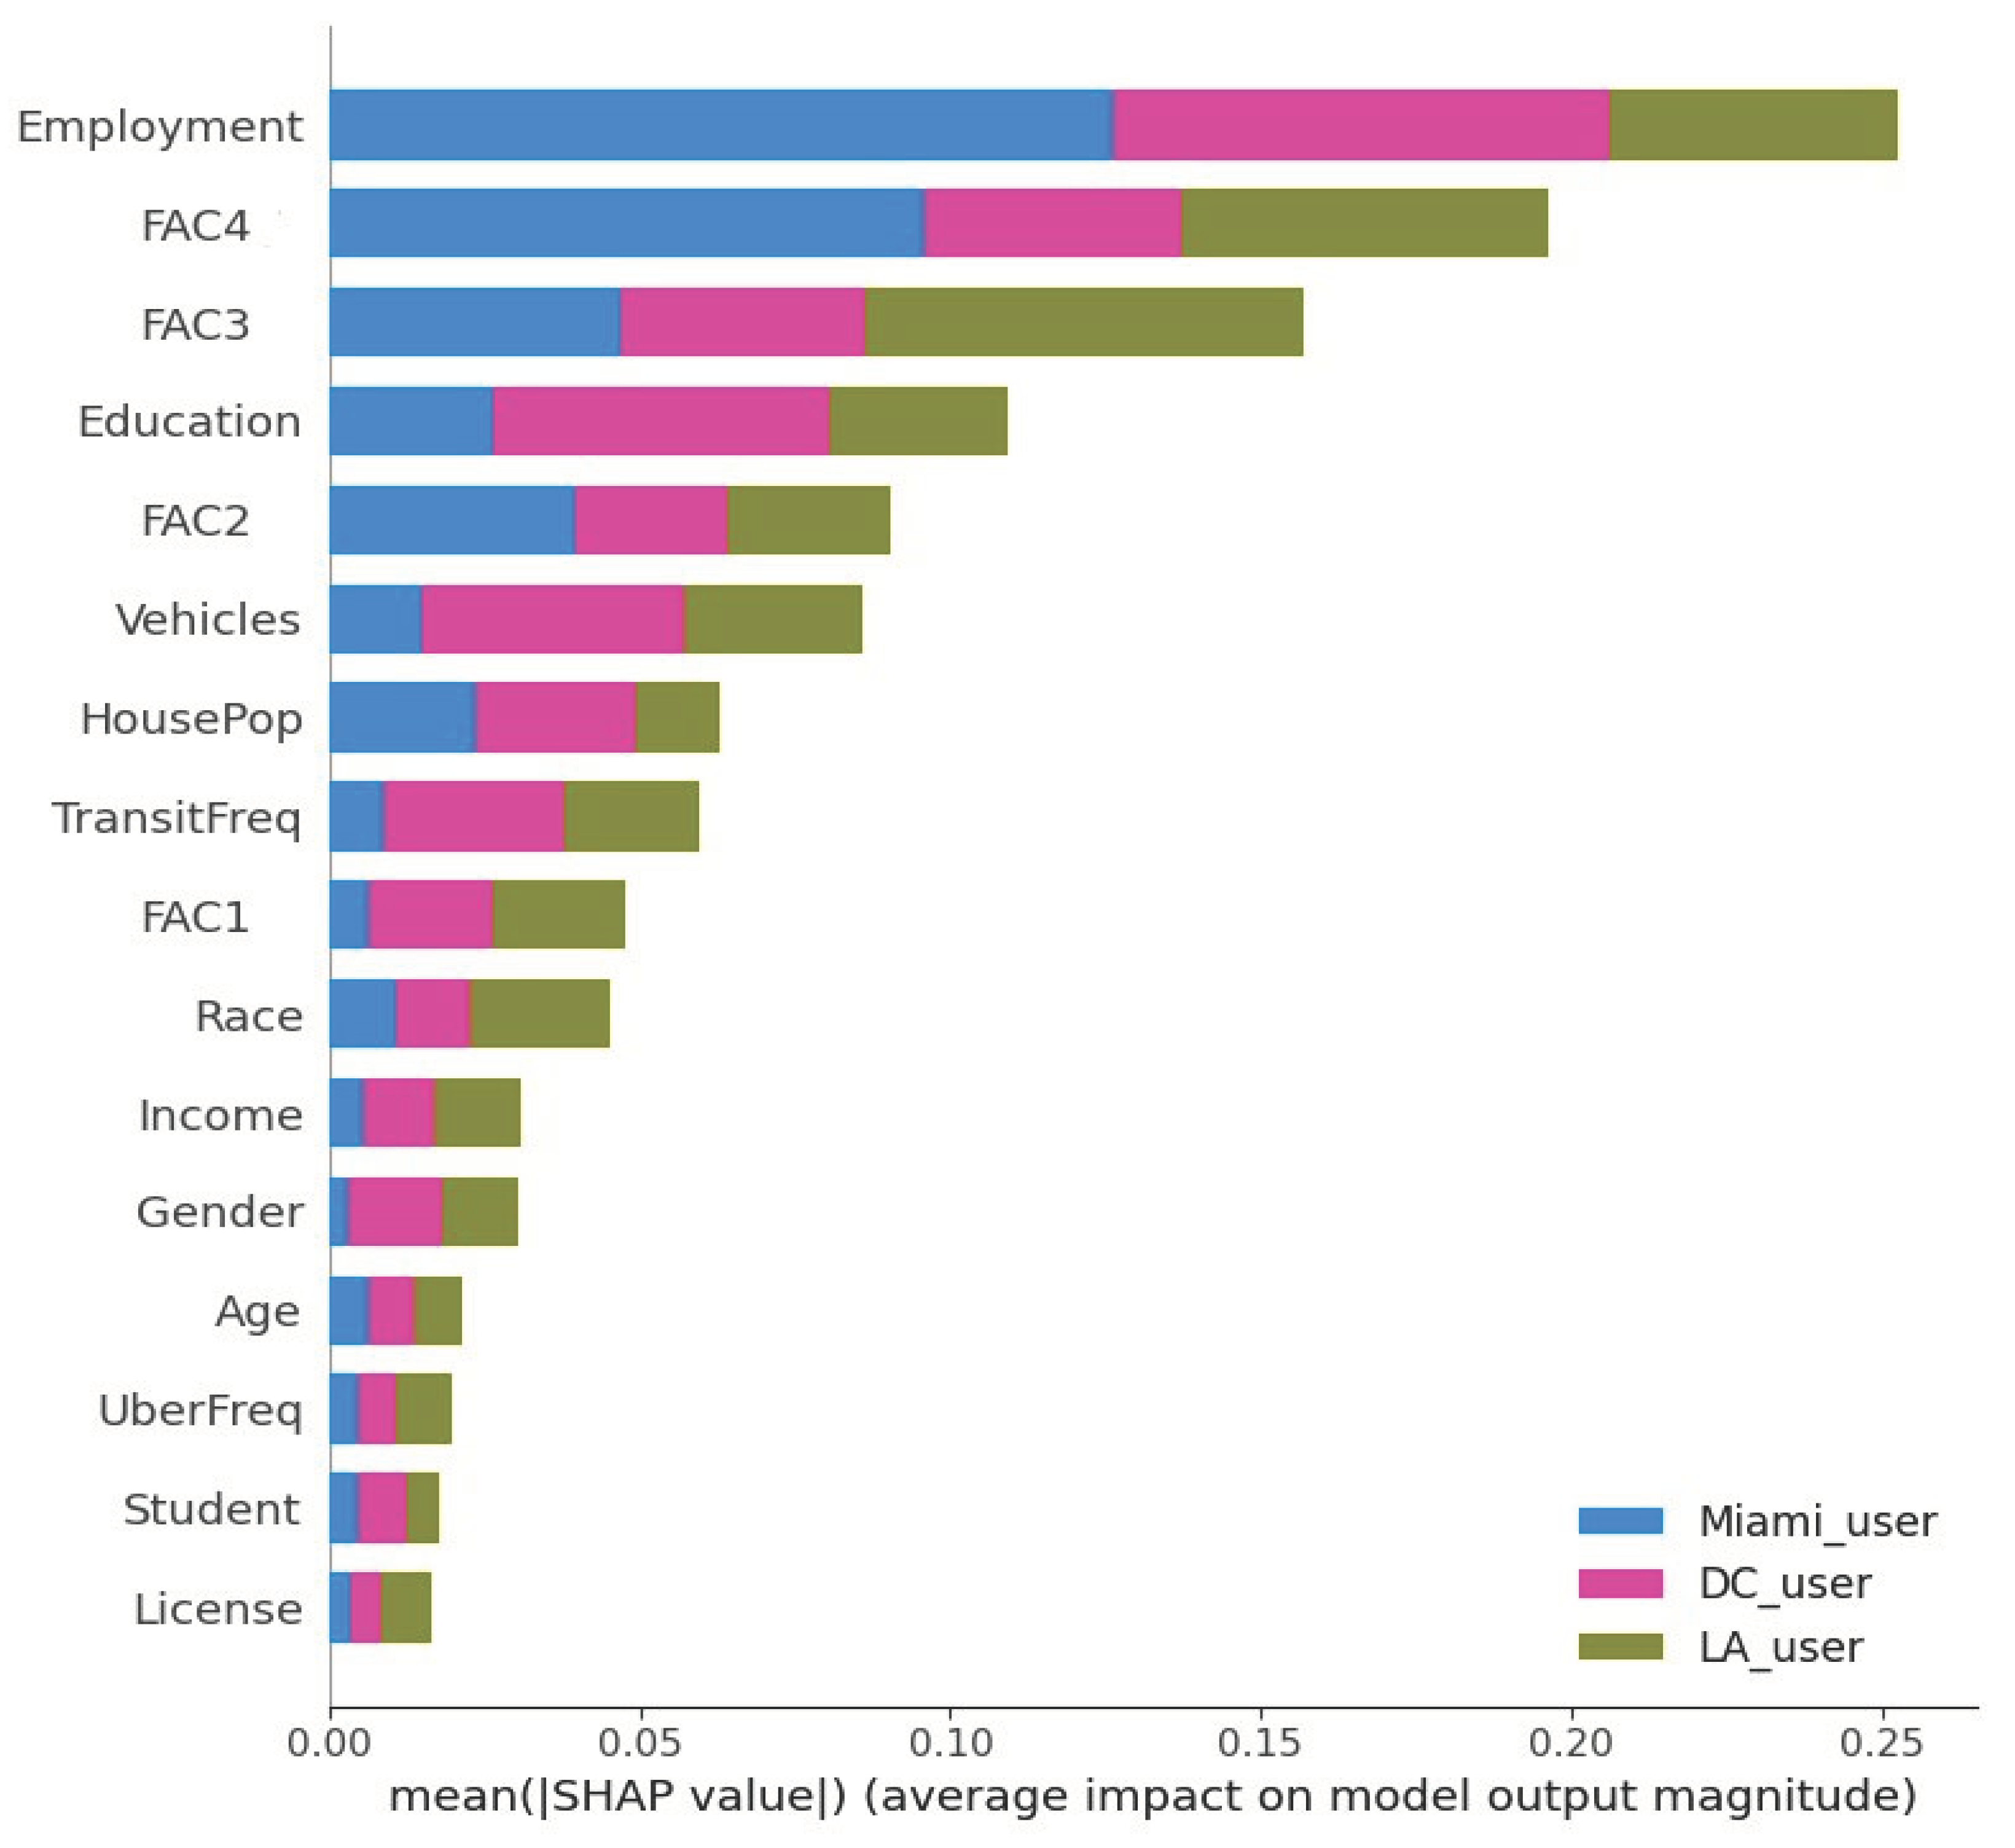
Table 1.
Sample size by city.
| Washington, D.C. | Miami | Los Angeles | TOTAL | ||||||||
| n | % of total | n | % of total | n | % of total | n | % of total | ||||
| E-scooter users | 193 | 16% | 101 | 8% | 171 | 14% | 465 | 39% | |||
| Non-users | 221 | 18% | 307 | 26% | 204 | 17% | 732 | 61% | |||
Table 3.
Non-users profile by city.
| Variable | Category | Washington, D.C. | Miami | Los Angeles | |||||
| n | % | n | % | n | % | ||||
| Gender: | Male | 111 | 50% | 172 | 56% | 112 | 55% | ||
| Female | 104 | 47% | 135 | 44% | 88 | 43% | |||
| Age: | 18–24 | 31 | 14% | 28 | 9% | 22 | 11% | ||
| 25–29 | 35 | 16% | 20 | 7% | 22 | 11% | |||
| 30–39 | 55 | 25% | 102 | 33% | 44 | 22% | |||
| 40–49 | 30 | 14% | 72 | 23% | 31 | 15% | |||
| 50–59 | 30 | 14% | 54 | 18% | 34 | 17% | |||
| 60 or over | 40 | 18% | 31 | 10% | 51 | 25% | |||
| Income: | Less than $25,000 | 18 | 8% | 53 | 17% | 49 | 24% | ||
| $25,000–$49,999 | 37 | 17% | 95 | 31% | 36 | 18% | |||
| $50,000–$74,999 | 29 | 13% | 57 | 19% | 42 | 21% | |||
| $75,000–$99,999 | 33 | 15% | 34 | 11% | 29 | 14% | |||
| $100,000–$124,999 | 21 | 10% | 29 | 9% | 13 | 6% | |||
| $125,000–$149,999 | 19 | 9% | 26 | 8% | 10 | 5% | |||
| $150,000 or more | 59 | 27% | 13 | 4% | 25 | 12% | |||
| Vehicles: | 0 | 45 | 20% | 30 | 10% | 20 | 10% | ||
| 1 | 91 | 41% | 126 | 41% | 95 | 47% | |||
| 2 | 64 | 29% | 112 | 36% | 57 | 28% | |||
| 3 | 19 | 9% | 30 | 10% | 22 | 11% | |||
| 4 | 2 | 1% | 6 | 2% | 8 | 4% | |||
| 5 | 0 | 0% | 3 | 1% | 2 | 1% | |||
| 6 or more | 0 | 0% | 0 | 0% | 0 | 0% | |||
| HousePop: | 1 | 59 | 27% | 44 | 14% | 44 | 22% | ||
| 2 | 86 | 39% | 93 | 30% | 69 | 34% | |||
| 3 | 35 | 16% | 85 | 28% | 45 | 22% | |||
| 4 | 28 | 13% | 61 | 20% | 28 | 14% | |||
| 5 | 6 | 3% | 18 | 6% | 10 | 5% | |||
| 6 or more | 7 | 3% | 6 | 2% | 8 | 4% | |||
| License: | Yes | 207 | 94% | 283 | 92% | 178 | 87% | ||
| Student: | Yes | 30 | 14% | 47 | 15% | 32 | 16% | ||
| Employment: | Employed | 154 | 70% | 186 | 61% | 106 | 52% | ||
| Other | 67 | 30% | 121 | 39% | 98 | 48% | |||
| Education: | High school or less | 18 | 8% | 62 | 20% | 49 | 24% | ||
| Associate’s degree | 39 | 18% | 112 | 36% | 63 | 31% | |||
| Bachelor’s degree | 69 | 31% | 101 | 33% | 60 | 29% | |||
| Post-graduate degree | 95 | 43% | 32 | 10% | 32 | 16% | |||
| Race: | White | 143 | 65% | 214 | 70% | 101 | 50% | ||
| Black | 33 | 15% | 67 | 22% | 17 | 8% | |||
| Asian | 24 | 11% | 4 | 1% | 33 | 16% | |||
| Other (Multicultural) | 21 | 10% | 22 | 7% | 53 | 26% | |||
Notes:.
Table 4.
Kruskal-Wallis test results for mode choice factors.
| E-scooter users N= 464 | Non-users N= 732 | ||||||||||||
|---|---|---|---|---|---|---|---|---|---|---|---|---|---|
| Factors | Sig | Decision | Pairwise Comparisons of City | Sig | Decision | Pairwise Comparisons of City | |||||||
| S1–S2 | Adj. Sig.a | S1–S2 | Adj. Sig.a | ||||||||||
| Cost | 0.005 | Reject | D.C.-LA | 1.000 | 0.000 | Reject | D.C.-LA | 0.027 | * | ||||
| D.C.-Mi | 0.005 | ** | D.C.-Mi | 0.000 | *** | ||||||||
| LA-Mi | 0.024 | * | LA-Mi | 0.000 | *** | ||||||||
| Time | 0.003 | Reject | LA-D.C. | 0.445 | 0.000 | Reject | D.C.-LA | 1.000 | |||||
| LA-Mi | 0.002 | ** | D.C.-Mi | 0.000 | *** | ||||||||
| D.C.-Mi | 0.074 | LA-Mi | 0.000 | *** | |||||||||
| Reliability | 0.000 | Reject | LA-D.C. | 1.000 | 0.000 | Reject | D.C.-LA | 1.000 | |||||
| LA-Mi | 0.000 | *** | D.C.-Mi | 0.000 | *** | ||||||||
| D.C.-Mi | 0.000 | *** | LA-Mi | 0.000 | *** | ||||||||
| Comfort | 0.000 | Reject | D.C.-LA | 0.440 | 0.000 | Reject | D.C.-LA | 0.002 | ** | ||||
| D.C.-Mi | 0.000 | *** | D.C.-Mi | 0.000 | *** | ||||||||
| LA-Mi | 0.000 | *** | LA-Mi | 0.000 | *** | ||||||||
| Safety | 0.000 | Reject | LA-D.C. | 1.000 | 0.000 | Reject | D.C.-LA | 0.001 | ** | ||||
| LA-Mi | 0.000 | *** | D.C.-Mi | 0.000 | *** | ||||||||
| D.C.-Mi | 0.000 | *** | LA-Mi | 0.001 | ** | ||||||||
| Environmental Impacts | 0.000 | Reject | D.C.-LA | 1.000 | 0.000 | Reject | LA-D.C. | 1.000 | |||||
| D.C.-Mi | 0.000 | *** | LA-Mi | 0.000 | *** | ||||||||
| LA-Mi | 0.000 | *** | D.C.-Mi | 0.005 | ** | ||||||||
Notes: Significance levels for reference: * (p < 0.05), ** (p < 0.01), *** (p < 0.001).
Table 5.
Kruskal-Wallis test results for e-scooter attitudes.
| E-scooter users N= 464 | Non-users N= 732 | ||||||||||||
|---|---|---|---|---|---|---|---|---|---|---|---|---|---|
| Factors E-scooter User |
Sig | Decision | Pairwise Comparisons of City | Sig | Decision | Pairwise Comparisons of City | |||||||
| S1–S2 | Adj. Sig.a | S1–S2 | Adj. Sig.a | ||||||||||
| Attitude 1. | 0.125 | Retain | 0.006 | Reject | LA-D.C. | 0.337 | |||||||
| LA-Mi | 0.004 | ** | |||||||||||
| D.C.-Mi | 0.372 | ||||||||||||
| Attitude 2. | 0.000 | Reject | LA-D.C. | 1.000 | 0.000 | Reject | LA-D.C. | 1.000 | |||||
| LA-Mi | 0.000 | *** | LA-Mi | 0.000 | *** | ||||||||
| D.C.-Mi | 0.000 | *** | D.C.-Mi | 0.000 | *** | ||||||||
| Attitude 3. | 0.284 | Retain | 0.030 | Reject | LA-D.C. | 0.954 | |||||||
| LA-Mi | 0.029 | * | |||||||||||
| D.C.-Mi | 0.362 | ||||||||||||
| Attitude 4. | 0.001 | Reject | Mi-LA | 0.011 | * | 0.000 | Reject | LA-Mi | 0.000 | *** | |||
| Mi-D.C. | 0.001 | ** | LA-D.C. | 0.000 | *** | ||||||||
| LA-D.C. | 1.000 | Mi-D.C. | 0.178 | ||||||||||
| Attitude 5. | 0.000 | Reject | Mi-LA | 0.004 | ** | 0.000 | Reject | LA-Mi | 0.020 | ** | |||
| Mi-D.C. | 0.000 | *** | LA-D.C. | 0.000 | *** | ||||||||
| LA-D.C. | 1.000 | Mi-D.C. | 0.020 | ** | |||||||||
| Attitude 6. | 0.007 | Reject | D.C.-LA | 1.000 | 0.000 | Reject | D.C.-LA | 1.000 | |||||
| D.C.-Mi | 0.006 | ** | D.C.-Mi | 0.000 | *** | ||||||||
| LA-Mi | 0.072 | LA-Mi | 0.001 | ** | |||||||||
Notes: Significance levels for reference: * (p < 0.05), ** (p < 0.01), *** (p < 0.001). Attitude 1. Riding e-scooters is a safe way to get around. Attitude 2. My city has enough bike lanes to accommodate e-scooter use. Attitude 3. My city has enough space for proper e-scooter parking. Attitude 4. The arrival of shared e-scooters is a good thing for the city. Attitude 5. Shared e-scooters can strengthen the operations of public transit. Attitude 6. Shared e-scooters will make people use transit less.
Table 6.
Kruskal-Wallis test results for car use attitudes.
| E-scooter users N= 464 | Non-users N= 732 | ||||||||||||
|---|---|---|---|---|---|---|---|---|---|---|---|---|---|
| Factors | Sig | Decision | Pairwise Comparisons of City | Sig | Decision | Pairwise Comparisons of City | |||||||
| S1–S2 | Adj. Sig.a | S1–S2 | Adj. Sig.a | ||||||||||
| Car use attitude 1 | 0.000 | Reject | D.C.-LA | 1.000 | 0.008 | Reject | D.C.-Mi | 0.383 | |||||
| D.C.-Mi | 0.000 | *** | D.C.-LA | 0.006 | ** | ||||||||
| LA-Mi | 0.000 | *** | Mi-LA | 0.194 | |||||||||
| Car use attitude 2 | 0.000 | Reject | LA-D.C. | 0.004 | ** | 0.000 | Reject | LA-D.C. | 0.001 | ** | |||
| LA-Mi | 0.000 | *** | LA-Mi | 0.000 | *** | ||||||||
| D.C.-Mi | 0.042 | * | D.C.-Mi | 0.000 | *** | ||||||||
| Car use attitude 3 | 0.047 | Reject | LA-Mi | 0.270 | 0.000 | Reject | LA-Mi | 0.284 | |||||
| LA-D.C. | 0.054 | LA-D.C. | 0.000 | *** | |||||||||
| Mi-D.C. | 1.000 | Mi-D.C. | 0.000 | *** | |||||||||
| Car use attitude 4 | 0.000 | Reject | Mi-LA | 0.000 | *** | 0.000 | Reject | Mi-LA | 0.000 | *** | |||
| Mi-D.C. | 0.000 | *** | Mi-D.C. | 0.000 | *** | ||||||||
| LA-D.C. | 1.000 | LA-D.C. | 0.000 | *** | |||||||||
| Car use attitude 5 | 0.000 | Reject | LA-D.C. | 0.318 | 0.000 | Reject | LA-D.C. | 0.000 | *** | ||||
| LA-Mi | 0.000 | *** | LA-Mi | 0.000 | *** | ||||||||
| D.C.-Mi | 0.000 | *** | D.C.-Mi | 0.000 | *** | ||||||||
| Car use attitude 6 | 0.000 | Reject | Mi-D.C. | 1.000 | 0.000 | Reject | Mi-D.C. | 0.000 | *** | ||||
| Mi-LA | 0.000 | *** | Mi-LA | 0.000 | *** | ||||||||
| D.C.-LA | 0.000 | *** | D.C.-LA | 0.000 | *** | ||||||||
| Car use attitude 7 | 0.020 | Reject | D.C.-LA | 0.069 | 0.000 | Reject | D.C.-Mi | 0.000 | *** | ||||
| D.C.-Mi | 0.049 | * | D.C.-LA | 0.000 | *** | ||||||||
| LA-Mi | 1.000 | Mi-LA | 0.048 | * | |||||||||
Notes: Significance levels for reference: * (p < 0.05), ** (p < 0.01), *** (p < 0.001). Attitude 1. I hope to live without car. Attitude 2. I definitely want to own a car. Attitude 3. I try to use public transit whenever I can. Attitude 4. I try to travel with non-motorized modes (biking and walking) as much as I can. Attitude 5. I am confident in my ability to use new technologies (e.g., a smartphone app). Attitude 6. Learning how to use new technologies is often frustrating for me. Attitude 7. As a general principle, I’d rather own things than rent them.
Table 7.
Factor analysis results: Rotated Component Matrix (KMO and Bartlett’s test).
| Observed variables | Mean | Factor (Latent constructs) | |||
| 1 | 2 | 3 | 4 | ||
| Escooter Attitudes_1 | 3.350 | 0.727 | |||
| Escooter Attitudes_2 | 2.944 | 0.712 | |||
| Escooter Attitudes_3 | 3.150 | 0.774 | |||
| Escooter Attitudes_4 | 3.835 | 0.705 | |||
| Escooter Attitudes_5 | 3.848 | 0.664 | |||
| Escooter Attitudes_6 | 3.185 | 0.625 | |||
| Mode Choice Factors_1 | 3.921 | 0.534 | |||
| Mode Choice Factors_2 | 4.085 | 0.699 | |||
| Mode Choice Factors_3 | 4.269 | 0.789 | |||
| Mode Choice Factors_4 | 3.654 | 0.720 | |||
| Mode Choice Factors_5 | 4.127 | 0.732 | |||
| Car use Attitudes_2 | 3.259 | 0.826 | |||
| Car use Attitudes_3 | 3.086 | 0.553 | |||
| Car use Attitudes_5 | 3.607 | 0.710 | |||
| Car use Attitudes_6 | 3.223 | -0.767 | |||
| Car use Attitudes_1 | 2.305 | -0.721 | |||
| Car use Attitudes_4 | 3.973 | 0.642 | |||
| Eigenvalues | 3.6 | 2.7 | 2.0 | 1.4 | |
| % of variance explained | 21% | 16% | 12% | 8% | |
| Kaiser-Meyer-Olkin Measure of Sampling Adequacy. | 0.755 | ||||
| Bartlett’s Test of Sphericity | Approx. Chi-Square | 6120.813 | |||
| df | 136 | ||||
| Sig. | 0.000 | ||||
Notes: Extraction method: Principal Component Analysis. Rotation method: Varimax with Kaiser normalization.
Table 8.
Models performance.
| Model | Class | Precision | Recall | F1- score | Overall Accuracy |
| Binary Logistic Regression | 0 | 0.81 | 0.87 | 0.84 | 0.74 |
| 1 | 0.74 | 0.65 | 0.69 | ||
| Decision Tree | 0 | 0.82 | 0.76 | 0.79 | 0.79 |
| 1 | 0.63 | 0.71 | 0.67 | ||
| Random Forest | 0 | 0.83 | 0.90 | 0.86 | 0.82 |
| 1 | 0.79 | 0.70 | 0.74 |
Notes: Class 0: non-users; Class 1: Shared e-scooter users.
Disclaimer/Publisher’s Note: The statements, opinions and data contained in all publications are solely those of the individual author(s) and contributor(s) and not of MDPI and/or the editor(s). MDPI and/or the editor(s) disclaim responsibility for any injury to people or property resulting from any ideas, methods, instructions or products referred to in the content. |
© 2024 by the authors. Licensee MDPI, Basel, Switzerland. This article is an open access article distributed under the terms and conditions of the Creative Commons Attribution (CC BY) license (http://creativecommons.org/licenses/by/4.0/).
Copyright: This open access article is published under a Creative Commons CC BY 4.0 license, which permit the free download, distribution, and reuse, provided that the author and preprint are cited in any reuse.


