
Submitted:
20 February 2024
Posted:
20 February 2024
You are already at the latest version
Abstract
Acoustic focusing of particle flow in microfluidics has been shown to be an efficient tool for particle separation for various chemical and biomedical applications. The mechanism behind the method is the selective effect of the acoustic radiation force on distinct particles. In this way, they can be selectively focused and separated. The technique can also be applied under stationary conditions, i.e., in the absence of fluid flows. In this study, the manipulation of self-propelled particles, such as Janus particles, in an acoustofluidic setup is investigated. In experiments with self-propelled Janus particles and passive beads, we explore the interplay between self-propulsion and the acoustic radiation force. Our results demonstrate unusual and potentially useful effects such as selective trapping, escape and assisted escape in binary mixtures of active and passive particles. We also analyze various aspects related to the behavior of Janus particles in acoustic traps in the presence and absence of flows.
Keywords:
Acoustofluidics
; Janus particles
; Particle focusing
; Acoustic streaming
; separation
1. Introduction
Microfluidics enables precise operation of fluids in microchannels. The ability to control small volumes of fluids has revolutionized various fields, offering advantages such as smaller sample sizes, faster reaction times and higher sensitivity [1]. Despite these advantages, it is still a challenge to precisely control fluidic processes, especially when it comes to the manipulation of the complex samples containing particles, cells, or biological entities. Acoustofluidics has emerged as a promising solution to the limitations of traditional microfluidics [2]. This is a rapidly growing branch of microfluidics that combines acoustic waves with fluid dynamics to achieve precise manipulation of particles and cells and is employed in various fields, ranging from biomedicine [3], biomedical diagnostics [4], lab-on-a-chip devices [2] to analytical chemistry [5]. Innovative methods have been developed for the precise control and manipulation of fluids, particles, and cells [6] in microfluidic devices. Acoustofluidic devices utilize various mechanisms to manipulate fluids and particles, including acoustic radiation [7], acoustic streaming [8], acoustic dielectrophoresis [9] and acoustothermal effect [10].
Particles or cells in a microfluidic channel are affected by the standing pressure wave, which results in a radiation force and a Stokes drag force. For a spherical particle with radius a, density ρp and compressibility κp suspended in a liquid with density ρ0, compressibility κ0, and the dynamic viscosity η (the kinematic viscosity being: υ = η/ρ0), the radiation force is given by
where a is the radius of a sphere, k0 is the angular wavenumber for the first harmonic, Eac is the time averaged acoustic energy, y is the channel normal coordinate, and ϕ is the acoustic contrast factor. The acoustic contrast factor determines in the direction in which the particles move; this number varies between -1 and 1. A particle that is “hard” compared to the surrounding liquid (ϕ > 0), moves in the direction of the pressure node of the standing wave and will be focused (Figure 1 (a)). The particles also experience Stokes drag force, given by:
with η the dynamic viscosity of the liquid, υstr the acoustic streaming velocity and υp the initial particle velocity from the radiation force (Figure 1 (b)) [11].
Frad = 4 π a3 ϕ k0 Eac sin(2 k0 y)
Fdrag = 6 π η a (υstr – υp)
As illustrated in Figure 1, the effect of the acoustic radiation force is opposite to that of the streaming: the former tends to focus particles near the centerline (Figure 1 (a)) while the latter forces them to move away from the center (Figure 1 (b)).
In this study, we apply the acoustofluidic technique to manipulate self-propelled Janus particles to investigate the interplay between self-propulsion and the acoustic radiation force in an acoustofluidic setup. Due to their self-propulsion, Janus particles can escape the radiation force, while passive polystyrene beads remain focused.
These Janus particles serve as a model system for living sperm cells or other motile biological cells or organisms. The Janus particles, of which one side of the polystyrene particle is coated with a platinum layer, generate propulsion based on a chemical gradient. The motion of the sphere is caused by self-diffusiophoresis. The platinum side of the beads catalyzes the reduction of hydrogen peroxide to oxygen and water [12,13].
2. Materials and Methods
2.1. Chip Design
The microfluidic chip features a main channel with dimensions of 350 µm in height and 375 µm in width, with a theoretical resonance frequency (in pure water) of 2.00 MHz. The length of this main channel is 53 mm. The microfluidic chip was fabricated in the MESA+ cleanroom (UTwente, The Netherlands) using a positive photoresist (Olin 907-12) and mid-UV lithography. Afterwards, the channel was etched into a silicon wafer with a thickness of 525 µm using Bosch-type Deep Reactive-Ion Etching (DRIE) (Adixen AMS100SE, Pfeiffer Vacuum SAS, France), followed by resist removal with nitric acid and oxygen plasma. To complete the assembly, the microfluidic channel is finally sealed with a 500 µm thick Pyrex wafer by anodic bonding. The device has three inlets and one outlet. Three programmable pressure-controlled pumps (Flow-EZ, Fluigent, France) were used to introduce the liquids in the channel via the three inlets. A compressor was used to generate the pressure (FLGplus, Fluigent, France) to pump the fluid through the microfluidic chip. Glass capillaries, made from fused silica, with inner and outer diameters of 200 µm and 350 µm, respectively (TSP200350, CM Scientific Ltd, United Kingdom) ensured the connection from the chip to the pumps. The capillaries were glued to the chip with UV glue (Ormocore from Microresist Technology GmbH, Germany).
2.2. Experimental setup
The acoustofluidic setup utilizes an inverted light microscope (Leica DMi8, Leica, Germany) enhanced with a CCD fluorescent camera (C13440-20C, Hamamatsu Photonics, Japan). A piezoceramic transducer (PZT) measuring 15 mm x 20 mm x 1 mm (APC International Ltd., USA), with a resonance frequency at 2.0 MHz, was coupled to the microfluidic chip through a thin glycerol layer. Positioned above the center of the main channel, the PZT generates bulk acoustic waves. The PZT was driven by a frequency generator (Keysight 33500B series, USA), around 2.0 MHz, applying a sine wave. The N-DP 90 Prana amplifier with a power output of 90 watts has been used to increase the applied voltage. A customized PMMA holder ensured a good connection between the PZT and the microfluidic chip. In Figure 2, the microfluidic chip is schematized (a), and the top view of the assembled chip is shown (b).
2.3. Janus Particles
The behavior of self-propelled Janus particles was investigated in a microfluidic device described above. The Janus microparticles used for the experiments are 4 µm polystyrene beads, with one hemisphere coated with a 25 nm thick platinum layer. The details of particle fabrication can be found in Refs. [14,15]. A layer of polystyrene particles was attached to a glass slide (76 mm x 26 mm x 1.2 mm) with the upper hemisphere coated with a platinum thin film. To suspend the Janus particles, a few drops of deionized water were added to the glass plate. The particles were then removed from the glass plate with a small brush. The suspension was then transferred to an Eppendorf tube and diluted to 1 mL with deionized water.
The polystyrene beads used as a control are green, fluorescent polystyrene microparticles (PS-FluoGreen-5.0, microparticle GmbH, Berlin, Germany). These particles are referred to as passive beads that have a size of 5.19 ± 0.14 µm.
2.4. Experimental Procedure
In the experiments, a mixture of passive polystyrene beads and self-propelled Janus particles was used, with a relative concentration close to 1:1. The sample was then introduced via the center inlet of the microfluidic chip, while a diluted hydrogen peroxide solution (normally, 10%, although concentrations up to 35% were analyzed) was introduced via the two side inlets. This prevented Janus particles from contacting hydrogen peroxide outside the channel that could lead to the formation of oxygen bubbles. Then, the piezoelectric transducer was activated, and the effect of the acoustic radiation on both types of the particles was analyzed for different voltages, at a resonance frequency of 1.97 MHz (the resonant frequency change is due to the change in the density of the fluid, i.e., water and hydrogen peroxide). Videos were recorded with HCImage, Hamamatsu’s image acquisition software and analyzed with the ImageJ software and the GDPTlab program in Matlab.
3. Results
3.1. Self-Propelled Motion of Janus Particles and Motility
Let us first characterize self-propelled motion of Janus particles exposed to hydrogen peroxide in the microfluidic channel, in the absence of acoustic waves. The highest concentration of hydrogen peroxide we tested was 35%, which however was reduced to avoid bubble formation when many particles were injected simultaneously (we typically used 10% hydrogen peroxide, as stated in the Methods section). In the single-particle limit, when Janus particles were far away from each other (typically, over distances more than 10 particle diameters), they moved in hydrogen peroxide without bubbles and reached the highest self-propulsion velocity. For example, the average velocity of Janus particles in a 35% hydrogen peroxide solution (the highest tested concentration) was found to be 4.8 µm/s (with the standard deviation (SD) equal to 0.9 µm/s).
The key characteristic of self-propelled motion is the persistence length that is quantified as the coupling of rotational diffusion with directed active motion lθ = υ0 · τθ = υ0 · 1/Dθ , where υ0 is the self-propulsion velocity, Dθ is the rotational diffusion coefficient and τθ is the persistence time during which the particle is more likely to move in a direction close to its original orientation [16,17,18]. To measure the persistence length, the trajectories of Janus particles were recorded and divided into (nearly) straight line segments, and the lengths of these segments were measured. From the shape of the recorded trajectories (a typical trajectory is shown in Figure 3), we defined a “critical angle” that characterizes “straight” lines: if αi – α0 > 36°, where α0 is the initial angle at the beginning of a new line segment and αi is the current angle, then the line considered as “broken” (and a new line segment begins); otherwise the line considered as “straight”.
According to this definition, the trajectory in Figure 3 is divided into four different linear segments, with a linear regression analysis being performed for each segment. The coefficient of determination, R2, of the linear regression is shown for each segment. This value is a statistical measure between 0 and 1 that indicates how well the observed results are replicated by the model. It is based on the proportion of total variation of outcomes. Segments characterized by a high R2 value, approaching 1, such as the first, second and fourth segments, indicate a strong linear relationship. The third segment has a comparatively lower R2 value. This deviation can be attributed to the fact that the trajectory of the Janus particle deviates from a linear path and instead follows a circular motion.
The average persistence length of three different Janus particles was found to be 11.48 µm (SD = 4.98 µm), 11.44 µm (SD = 4.59 µm) and 6.18 µm (SD = 1.80 µm). The calculated values are close to the values reported in the literature (see, e.g., Refs. [15,19]).
The persistence length is a measure of motility of a self-propelled particle. The longer the persistence length of the Janus particles, the higher the motility. Note that passive Brownian particles, that execute random walk, are characterized by zero persistence length. The motility of self-propelled particles is the measure of their ability to escape from an acoustic trap, same as natural swimmers like sperm cells [20].
3.2. Escape of Motile Janus Particles from Acoustic Trap
Next, we consider escape of motile Janus particles from the acoustic trap. As described above, motile Janus particles and passive (immotile) polystyrene beads in nearly equal proportion, 1:1, were infused in the microfluidic channel, and the acoustic power was applied to focus the particles along the center line of the channel. The particle sample was introduced into the chip via the center inlet, while a 10 % hydrogen peroxide solution was introduced via the two outer inlets. The acoustic voltage (i.e., the pre-amplified signal) was set to 50 mV and reduced to 10 mV in steps of ten via the frequency generator.
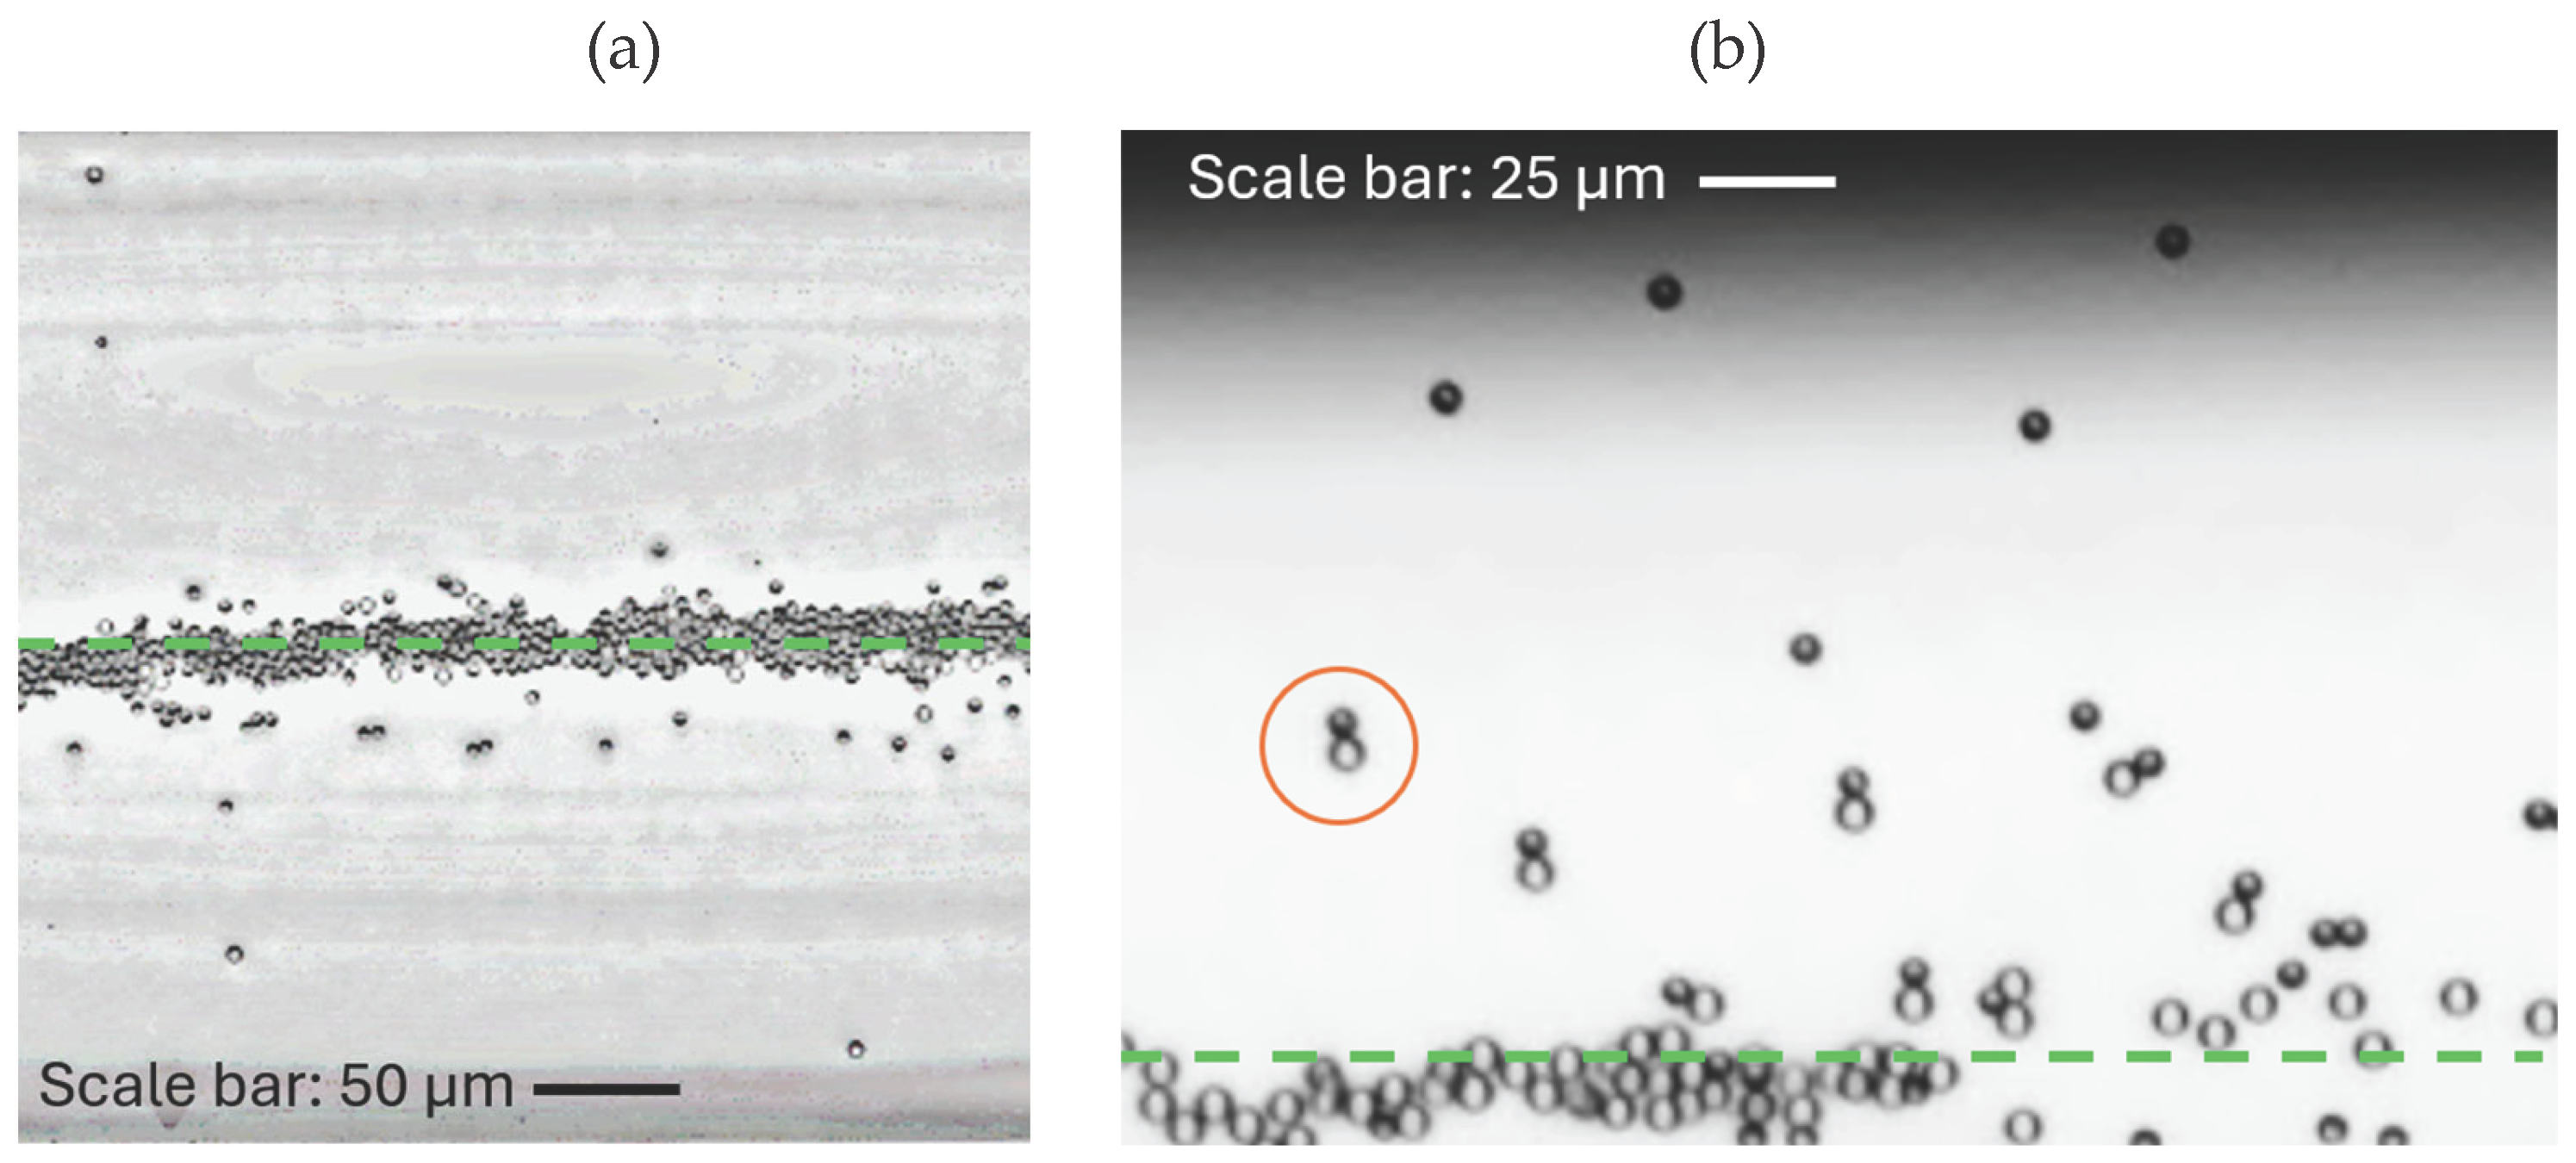
This escape of the Janus particles from the acoustic trap is shown in Figure 4 for the voltage of 20 mV. In the image, the Janus particles can be seen as darker circles (with one side, covered with Pt, even darker than the other one) while the polystyrene beads are brighter circles. It is clear from the image that all the polystyrene beads remain focused, i.e., are confined within a lane near the center of the channel. On the contrary, the motile Janus particles can escape from the trap (see also SI Movie 1).
This result shows that self-propelled Janus particles can resist and overcome the acoustic radiation force in the presence of their fuel, hydrogen peroxide. The same experiment was conducted where the 10% hydrogen peroxide was replaced with deionized water. There was no fuel anymore, thus no escape from the acoustic trap could be observed (see also [20]).
To analyze the distributions of the particles as a function of the applied voltage, the main channel was divided into zones of 20 µm wide, and the number of polystyrene beads and Janus particles in each zone was counted. The spatial distributions of the position (across the channel direction) of the relative number of passive polystyrene beads (Figure 5 (a, b)) and Janus particles (Figure 5 (c, d)) in the main channel of the microfluidic chip were calculated.
The distribution of the radial position of the Janus particles in the main channel widen when the acoustic voltage is reduced from 50 mV to 10 mV, while the distribution of the radial position of the polystyrene beads in the main channel remain unchanged. The difference in the behavior is related to the motility of the self-propelled Janus particles which move across and escape the acoustic potential (see Figure 4 and SI Movie 1). As a result, the Janus particle distribution broadens. This is in contrast with the behavior of passive polystyrene beads, which are immotile and remain focused in the main channel under the influence of the radiation force. Correspondingly, their distribution remains narrow.
Furthermore, in the presence of flow through the pumps in combination with acoustics, self-propelled Janus particles can escape from the acoustic trap (Figure 6(a)). This was observed near the level of half height of the main channel.
This property can be potentially used to select self-propelled Janus particles and separate them from passive polystyrene beads.
3.3. Janus Particle-Aided Escape of Passive Beads from Acoustic Trap
In addition to the selective escape of motile Janus particles from the acoustic trap (versus passive beads that do not escape and remain trapped), we observed an interesting behavior related to the ability of particles, both active and passive, to form dimers or clusters [14,15].
We found that in case when dimers of Janus particles and passive beads are formed, not only individual Janus particles are able to escape from the trap, but also some of the dimers: Janus particle and passive bead. In particular, such a behavior was observed at a lower acoustic voltage of 10 mV (see Figure 6 (b); the escape of dimers and clusters containing Janus particles can also be seen in SI Movie 1). As it was shown in the previous sections, passive beads cannot escape the acoustic trap themselves (provided the acoustic power is sufficient to trap them), but in this case they can be “evacuated” from the trapping potential by the motile Janus particles. This unusual behavior can be potentially useful for various applications and is further discussed in the next section.
4. Discussion
We analyzed the interplay between the effect of acoustic trapping in a microfluidic channel, exerted on particles from the acoustic radiation force in the presence of acoustic standing waves that tend to focus the particles on the nodes of the standing waves, and motility of self-propelled Janus particles that facilitates the escape of the motile particles from the acoustic trap. Using the acoustofluidic setup including a microfluidic channel and acoustic actuator, we experimentally demonstrated the selective escape of active Janus particles from the trap, in contrast to the passive beads that remain trapped. It was shown that the effect of escape is observed in both stationary conditions, i.e., in the absence of external flows as well as when an externally driven fluid flow along the channel is applied. This selective escape can be useful for various applications where one needs to select active species from passive, for example, motile sperm cells from immotile, as was recently demonstrated elsewhere [20]. In this work, we focused on the escape of Janus particles and analyzed the distributions of active versus passive particles across the channel width. We showed that when initially focused under the action of a strong acoustic signal that is able to trap both species, active and passive, active particles start to escape when gradually releasing the strength of the acoustic power while passive particles remain trapped. This leads to broadening of the particle distribution for active particles while that for the passive particles remains sharp.
We revealed a phenomenon of the “evacuation” of passive beads from the acoustic trap by means of active Janus motors, i.e., a Janus particle-aided escape of passive beads from the trap. This has been observed when particles of both sorts, active and passive, form dimers or clusters thanks to the attractive short-range interactions among the species. As known from the literature, in this case active particles can serve as “locomotives” to transport passive beads [14] or even large clusters of passive particles [15] in microchannels. In the case of acoustic trapping of such dimers or clusters containing active swimmer, in principle three various scenarios are possible: (i) dimers of clusters can remain trapped when the activity of the active motors inside the aggregate is insufficient to escape the trap; (ii) dimers and clusters can escape when the motor has enough power to overcome the action of the acoustic radiation force despite the additional “cargo”, and, finally, (iii) the competing action of the acoustic radiation force and the activity of the motors can break up the dimers or clusters apart. We observed in this work the first and second scenarios, when active motors either remain trapped or effectively “evacuate” the cargo from the trap, demonstrating in this way the Janus particle-aided escape of passive particles (that otherwise cannot escape the trap, without an external action). As a prospective, it would be interesting to realize also the third scenario, as hypothesized above. Another potential interest is related to the selective evacuation of passive beads that have distinctive properties and distinctive interaction with the active motors. For example, if one needs to evacuate only one destinated sort of passive beads from a mixture of passive particles of various sorts. These tasks could be potentially interesting for biomedical applications and will require further study.
5. Conclusions
We analyzed the interplay between the acoustic radiation force exerted on a mixture of active Janus particles and passive beads and the activity of the active species, in an acoustofluidic setup. It was shown that the particle distribution of active species essentially broadens when the initially strong trapping potential is gradually released while the distribution of passive beads remains unchanged. This effect, which is due to the activity of Janus particles and their escape from the acoustic focusing trap, was demonstrated under stationary conditions, i.e., in the absence of external transport flows, as well as in the presence of a flow. It was also demonstrated that active Janus motors can “evacuate” passive beads from the acoustic trap (these cannot escape the trap themselves) which can be of interest for potential biomedical applications. We predicted possible scenarios of the behavior of dimers and clusters containing active and passive particles in the acoustic trap that can be of interest for future related research.
Supplementary Materials
The following supporting information can be downloaded at the website of this paper posted on Preprints.org, Video S1: Escape of self-propelled Janus particles from acoustic trap in the presence of hydrogen peroxide (10%), for the acoustic voltage of 20 mV.
Author Contributions
Conceptualization, V.R.M. and W.D.M.; methodology, V.R.M.; L.B.; D.M.; A.M. and W.D.M.; software, L.M.B.; validation, L.M.B. and V.R.M.; formal analysis, L.M.B.; V.R.M. and D.M.; investigation, L.M.B. and V.R.M.; resources, L.B.; D.M.; and W.D.M.; data curation, L.M.B.; writing—original draft preparation, V.R.M. and L.M.B.; writing—review and editing, V.R.M.; L.B.; D.M.; and W.D.M.; visualization, L.M.B.; supervision, W.D.M. and V.R.M.; project administration, W.D.M.; funding acquisition, D.M. and W.D.M. All authors have read and agreed to the published version of the manuscript.
Funding
V.R.M., D.M. and W.D.M. acknowledge the support of Research Foundation‐Flanders (FWO‐Vl), Grant No. G029322N. D.M. acknowledges the support of the European Commission HORIZON RIA (project REGO; ID: 101070066).
Data Availability Statement
Data are contained within the article.
Acknowledgments
The authors thank Dr. Tao Huang for assistance in manufacturing and testing Janus particles and Dr. ir. Pierre Gelin for providing the acoustic setup.
Conflicts of Interest
The authors declare no conflicts of interest.
References
- Beebe, D.J.; Mnesing, G.; Walker, G.B. Physics and Applications of Microfluidics in Biology. Annu. Rev. Biomed. Eng. 2002, 4, 261–286. [Google Scholar] [CrossRef] [PubMed]
- Ding, X.; Li, P.; Lin, S.C.S.; Stratton, Z.S.; Nama, N.; Guo, F.; Slotcavage, D.J.; Mao, X.; Shi, J.; Costanzo, F.; et al. Surface acoustic wave microfluidics. Lab A Chip 2013, 13, 3626. [Google Scholar] [CrossRef] [PubMed]
- Rufo, J.; Cai, F.; Friend, J.; Wiklund, M.; Huang, T.J. Acoustofluidics for biomedical applications. Nat. Rev. Methods Primers 2022, 2. [Google Scholar] [CrossRef]
- Lam, K.H.; Liu, Y.; Li, Y.; Lim, H.G.; Zhou, Q.; Shung, K.K. Multifunctional single beam acoustic tweezer for non-invasive cell/organism manipulation and tissue imaging. Sci. Rep. 2016, 6. [Google Scholar] [CrossRef] [PubMed]
- Zhang, P.; Bachman, H.; Özçelik, A.; Huang, T.J. Acoustic microfluidics. Annu. Rev. Anal. Chem. 2020, 13, 17–43. [Google Scholar] [CrossRef] [PubMed]
- Li, P.; Mao, Z.; Peng, Z.; Zhou, L.; Chen, Y.; Huang, P.; Truica, C.I.; Drabick, J.J.; El-Deiry, W.S.; Dao, M.; et al. Acoustic separation of circulating tumor cells. Proc. Natl. Acad. Sci. USA 2015, 112, 4970–4975. [Google Scholar] [CrossRef] [PubMed]
- Collins, D.; Devendran, C.; Ma, Z.; Ng, J.W.; Neild, A.; Ai, Y. Acoustic tweezers via sub-time-of-flight regime surface acoustic waves. Sci. Adv. 2016, 2. [Google Scholar] [CrossRef] [PubMed]
- Ahmed, D.; Özçelik, A.; Bojanala, N.; Nama, N.; Upadhyay, A.; Chen, Y.; Hanna-Rose, W.; Huang, T.J. Rotational manipulation of single cells and organisms using acoustic waves. Nat. Commun. 2016, 7. [Google Scholar] [CrossRef] [PubMed]
- Yunus, D.E.; Sohrabi, S.; He, R.; Shi, W.; Liu, Y. Acoustic patterning for 3D embedded electrically conductive wire in stereolithography. J. Micromechanics Microengineering 2017, 27, 045016. [Google Scholar] [CrossRef]
- Park, J.; Jung, J.H.; Destgeer, G.; Ahmed, H.; Park, K.; Sung, H.J. Acoustothermal tweezer for droplet sorting in a disposable microfluidic chip. Lab A Chip 2017, 17, 1031–1040. [Google Scholar] [CrossRef]
- Gelin, P.; Sukas, Ö.S.; Hellemans, K.; Maes, D.; De Malsche, W. Study on the mixing and migration behavior of micro-size particles in acoustofluidics. Chem. Eng. J. 2019, 369, 370–375. [Google Scholar] [CrossRef]
- Howse, J.R.; Jones, R.; Ryan, A.J.; Gough, T.; Vafabakhsh, R.; Golestanian, R. Self-Motile colloidal particles: From directed propulsion to random walk. Phys. Rev. Lett. 2007, 99. [Google Scholar] [CrossRef] [PubMed]
- Baraban, L.; Makarov, D.; Schmidt, O.G.; Cuniberti, G.; Leiderer, P.; Erbe, A. Control over Janus micromotors by the strength of a magnetic field. Nanoscale 2013, 5, 1332–1336. [Google Scholar] [CrossRef]
- Baraban, L.; Tasinkevych, M.; Popescu, M.N.; Sánchez, S.; Dietrich, S.; Schmidt, O.G. Transport of cargo by Catalytic Janus Micro-motors. Soft Matter 2012, 8, 48–52. [Google Scholar] [CrossRef]
- Yu, H.; Kopach, A.; Misko, V.R.; Vasylenko, A.A.; Marchesoni, F.; Nori, F.; Makarov, D.; Baraban, L.; Cuniberti, G. Confined catalytic Janus swimmers: Geometry-driven rectification transients and directional locking, Small 2016, 12, 5882–5890. [CrossRef]
- Ghosh, P.K.; Misko, V.R.; Marchesoni, F.; Nori, F. Self-Propelled Janus Particles in a Ratchet: Numerical Simulations, Phys. Rev. Lett. 2013, 110, 268301. [Google Scholar] [CrossRef] [PubMed]
- Lisin, E.A.; Vaulina, O.S.; Lisina, I.I. & Petrov, O.F. Active Brownian particle in homogeneous media of different viscosities: Numerical simulations. Phys. Chem. Chem. Phys. 2021, 23, 16248–16257. [Google Scholar] [CrossRef] [PubMed]
- Zhang, W.; Li, Y.; Marchesoni, F.; Misko, V.R.; Ghosh, P.K. Narrow pore crossing of active particles under stochastic resetting. Entropy 2023, 25, 271. [Google Scholar] [CrossRef] [PubMed]
- Palacci, J.; Sacanna, S.; Steinberg, A.P.; Pine, D.J.; Chaikin, P.M. Living crystals of Light-Activated colloidal surfers. Science 2013, 339, 936–940. [Google Scholar] [CrossRef] [PubMed]
- Misko, V.R.; Baraban, L.; Makarov, D.; Huang, T.; Gelin, P.; Mateizel, I.; Wouters, K.; De Munck, N.; Nori, F.; De Malsche, W. Selecting active matter according to motility in an acoustofluidic setup: Self-propelled particles and sperm cells. Soft Matter 2023, 19, 8635. [Google Scholar] [CrossRef] [PubMed]
Figure 1.
Illustration of the behavior of particles due to the presence of a standing acoustic pressure wave (the oscillation of the lateral walls due to the acoustic excitation is schematically shown by the black arrows). (a) “Hard” particles compared to the surrounding liquid (ϕ > 0) focus in the pressure node of the standing acoustic pressure wave, as they are affected by the acoustic radiation force Frad. (b) Particles are also affected by the Stokes drag force Fdrag due to the acoustic streaming induced by the rotating fluid (vortices), as shown by orange ellipses with arrows.
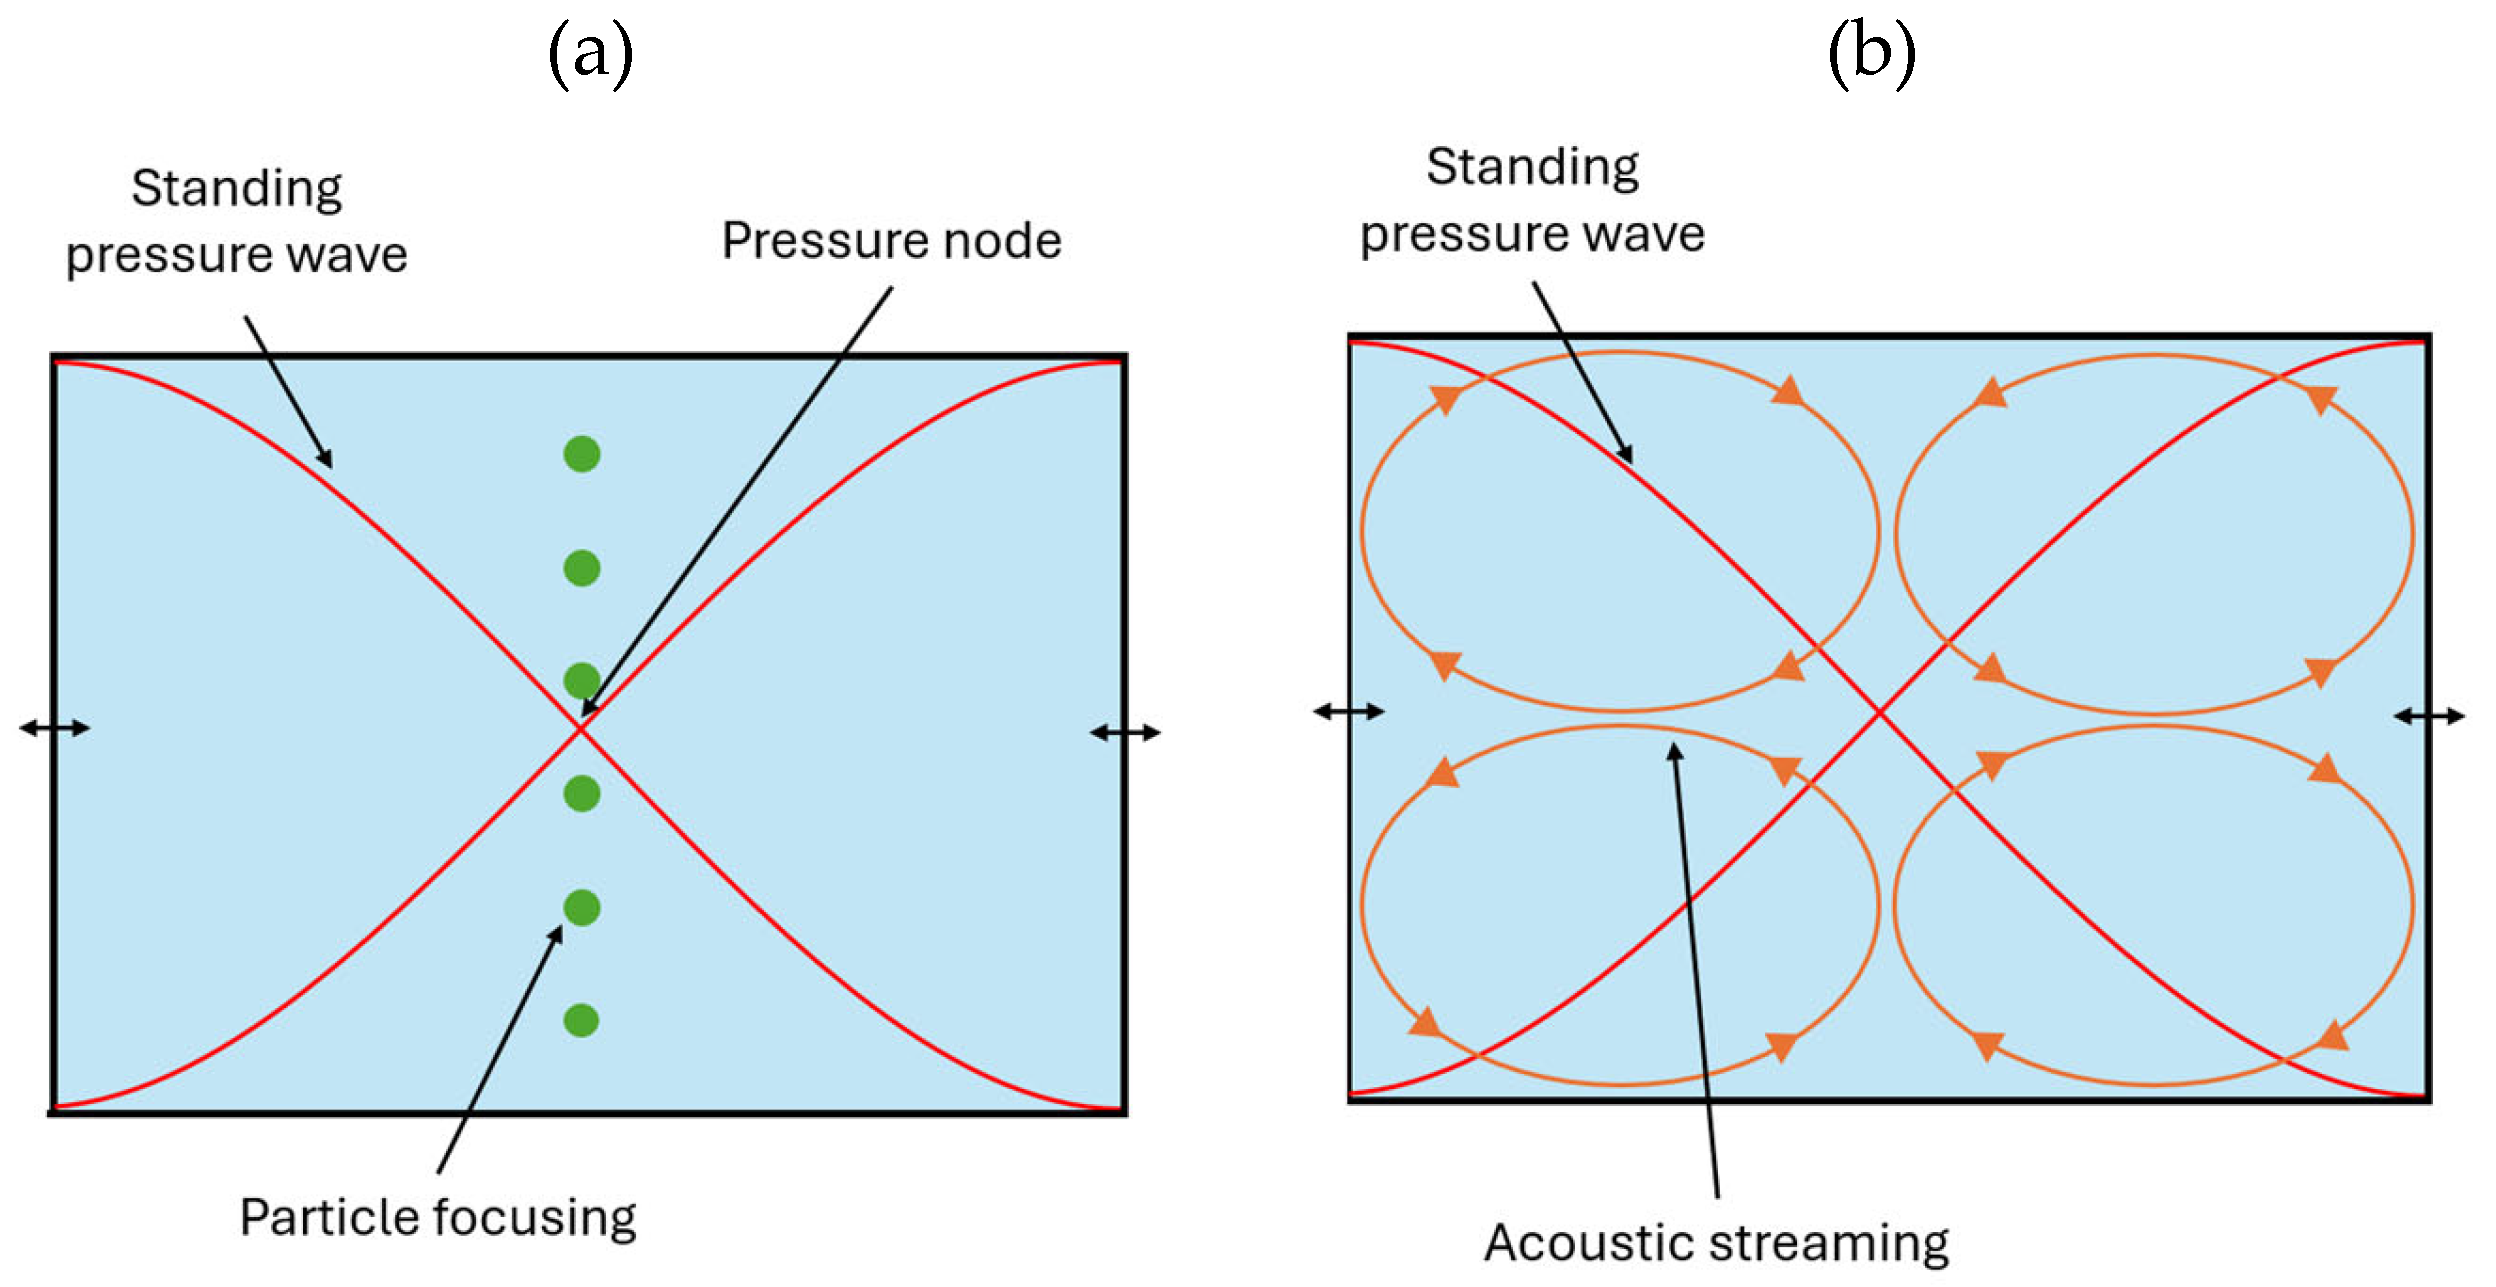
Figure 2.
(a) A schematic representation of the microfluidic channel used in the experiments. The main channel has a height, width, and length of 350 µm, 375 µm, and 53 mm, respectively. The device has three inlets and one outlet and is coupled with a PZT, with a resonance frequency of 2.0 MHz. The region affected by the bulk acoustic waves generated by the PZT is indicated. (b) An image of the microfluidic chip coupled with the PZT, held together by an in-house built PMMA holder. Glass capillaries, made from fused silica, with inner and outer diameters of 200 µm and 350 µm, respectively, were attached to the microfluidic chip.
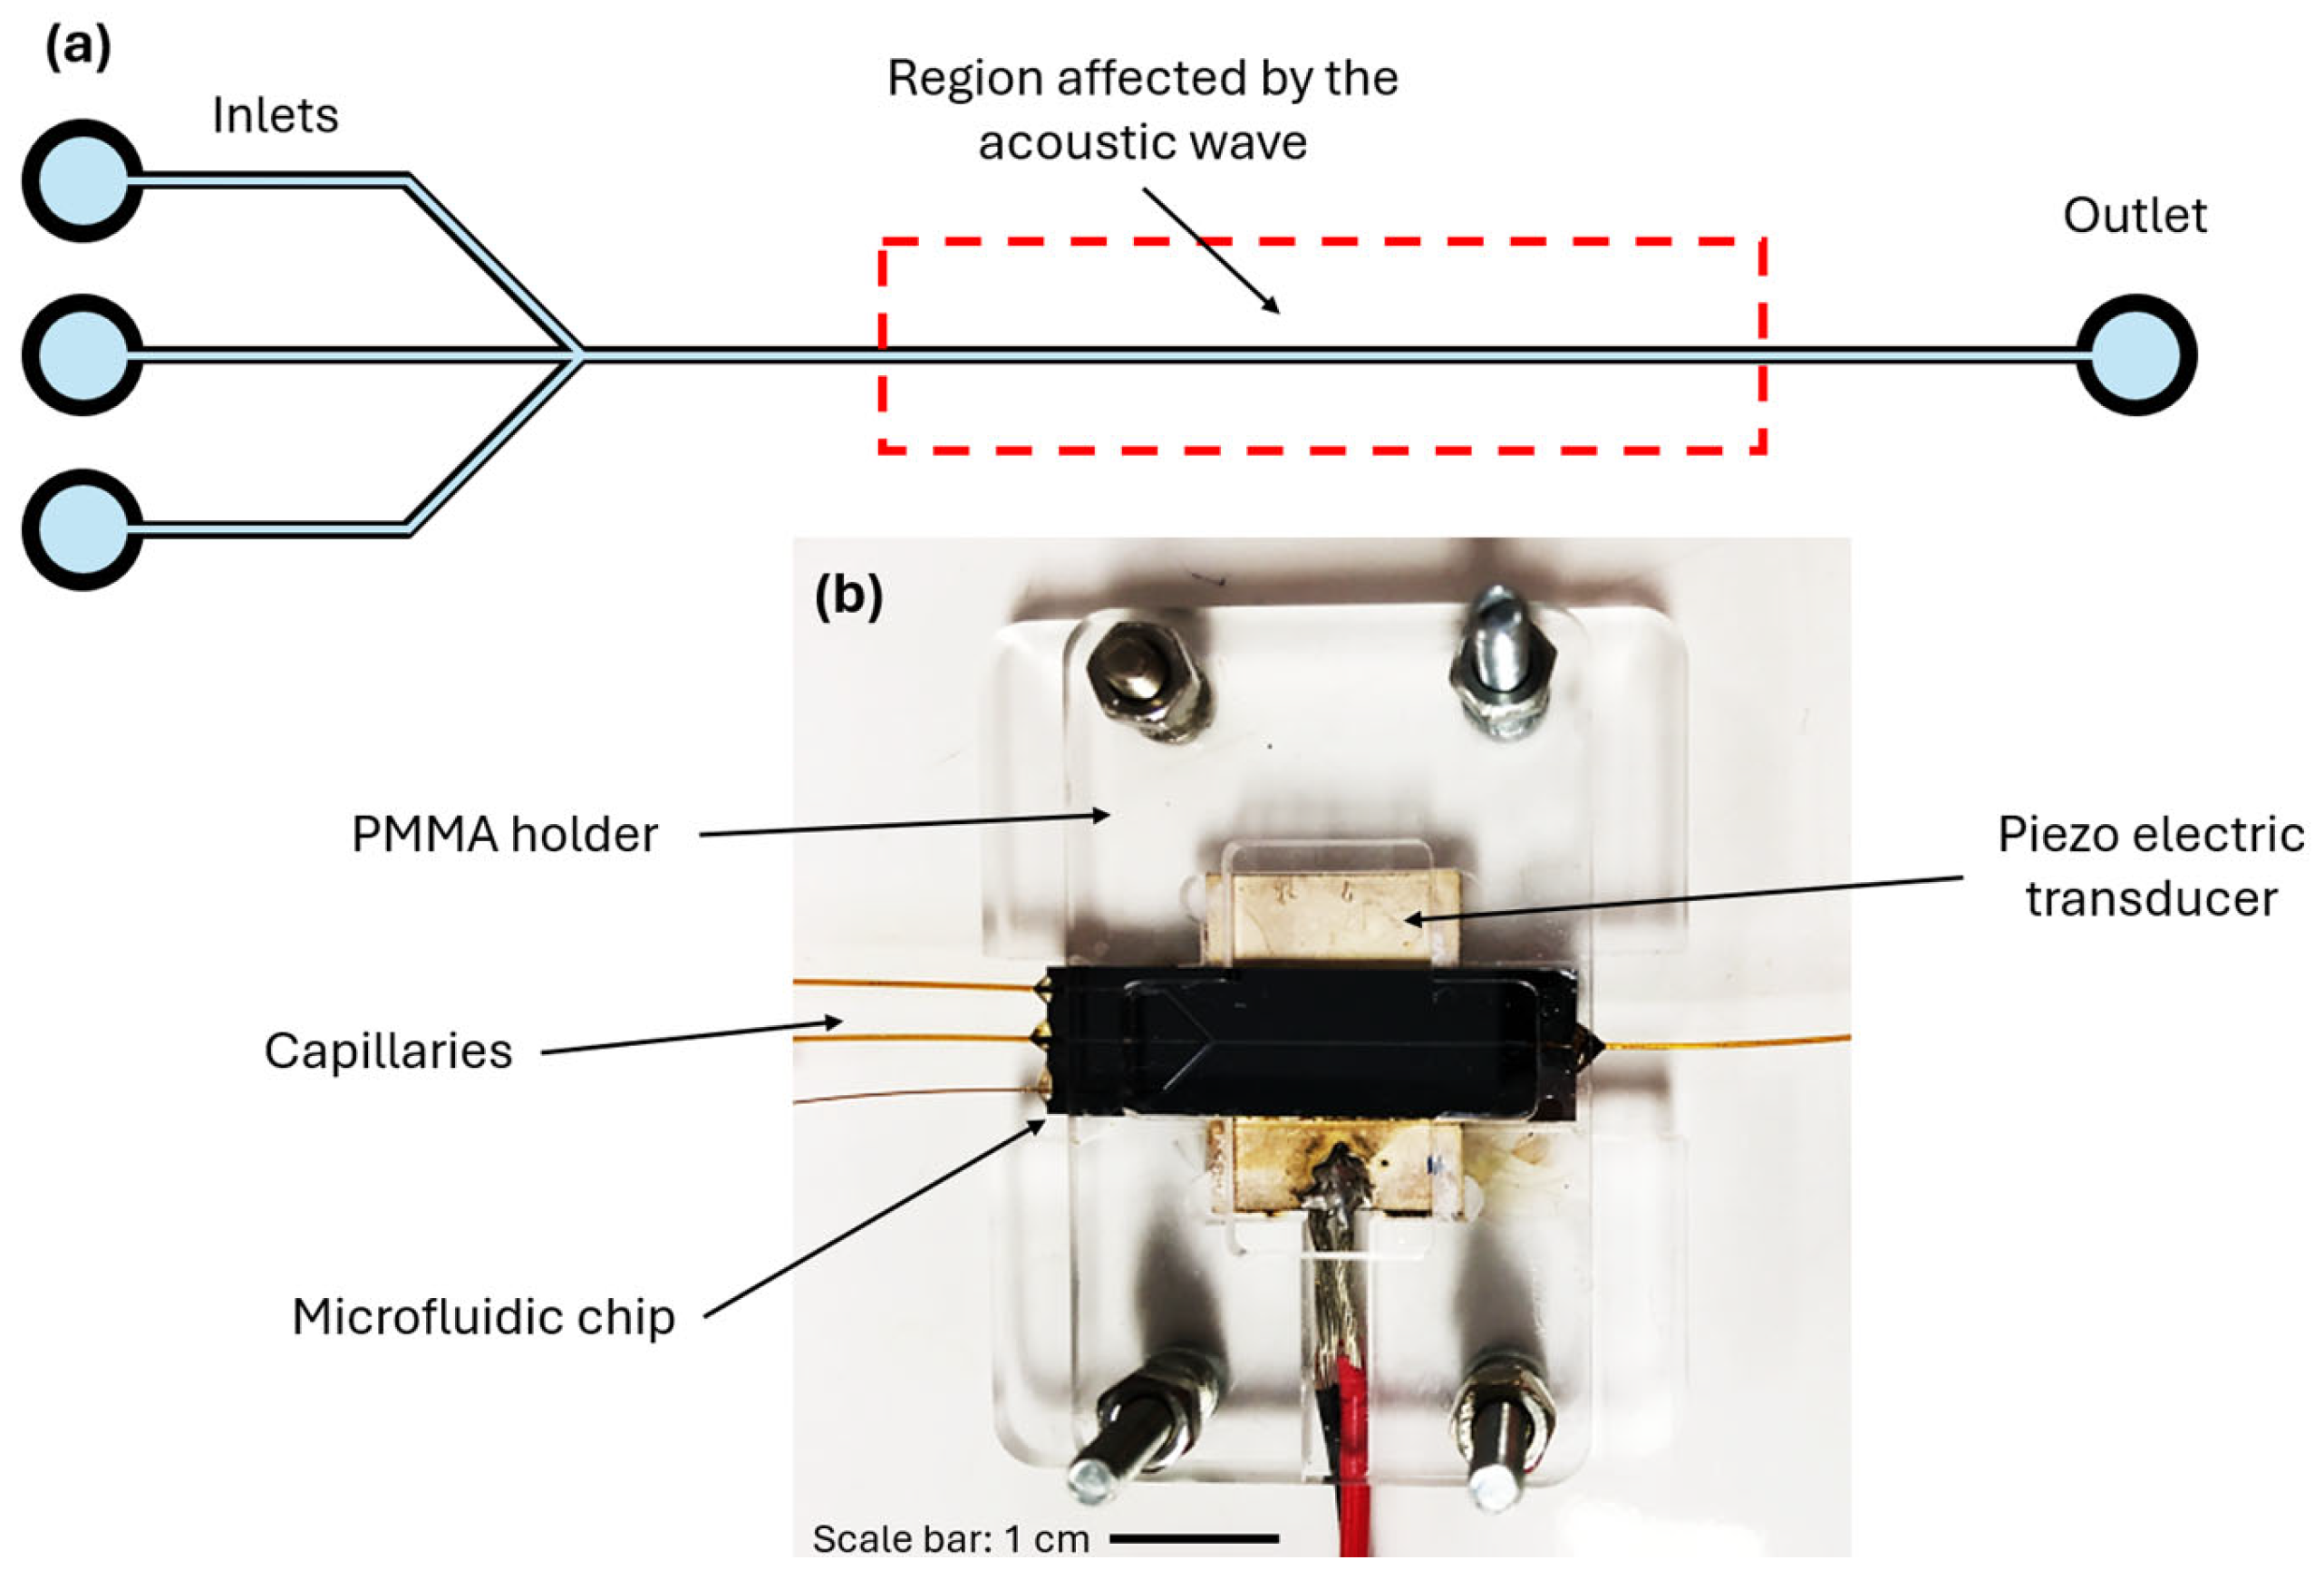
Figure 3.
A typical trajectory of a self-propelled Janus particle (shown by dark blue circles) in an 35% hydrogen peroxide solution in the absence of acoustic waves. To characterize the self-propelled motion of Janus particles, the persistence length has been calculated. The trajectory shown in the figure can be divided into four line segments (indicated by orange thin solid lines). The lengths of these segments represent persistence length of the self-propelled motion.
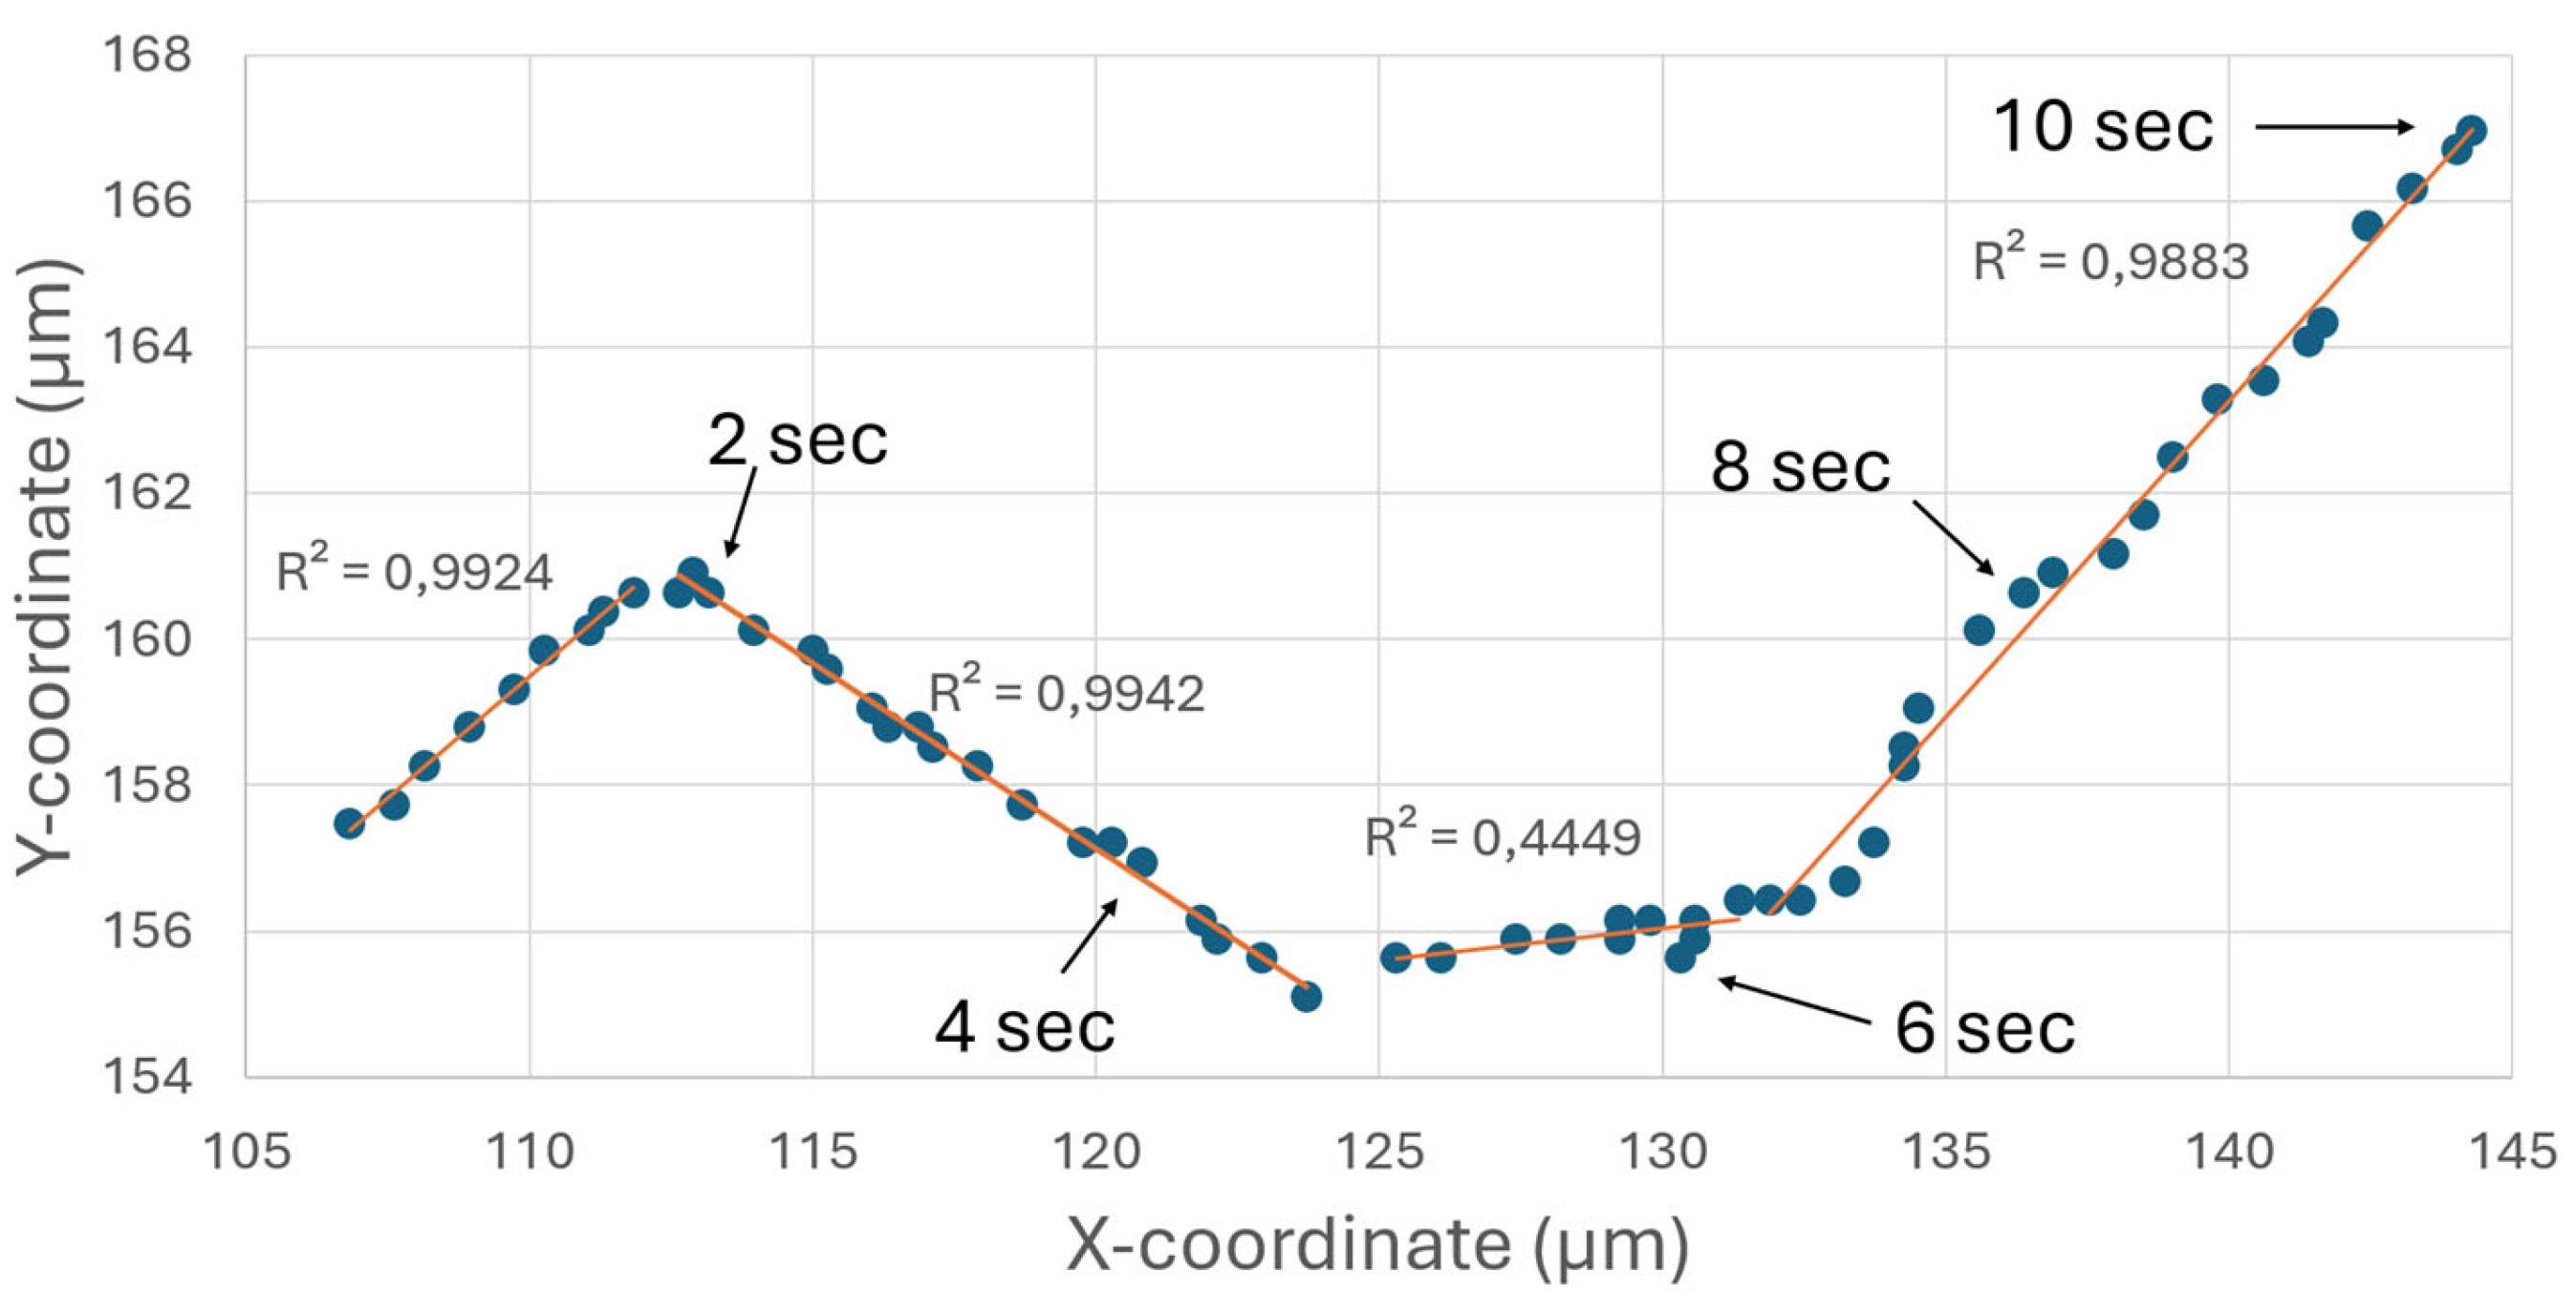
Figure 4.
Escape of self-propelled Janus particles from acoustic trap in the presence of hydrogen peroxide (10%). The acoustic voltage is set to 20 mV. (a) The Janus particles (half-filled circles, some marked by the red circles) move away from the focus line; polystyrene beads (empty circles, some marked by the dark blue circles) remain focused. The image is recorded near the bottom of the main channel of the microfluidic chip. (b) Brightness-inverted image (same particle distribution as in (a)) showing the tracked trajectories of the Janus particles (i.e., three Janus particles moving upwards from the focus line) and passive beads (executing small displacements but remaining focused). The center line of the microchannel is indicated by the green dashed line.
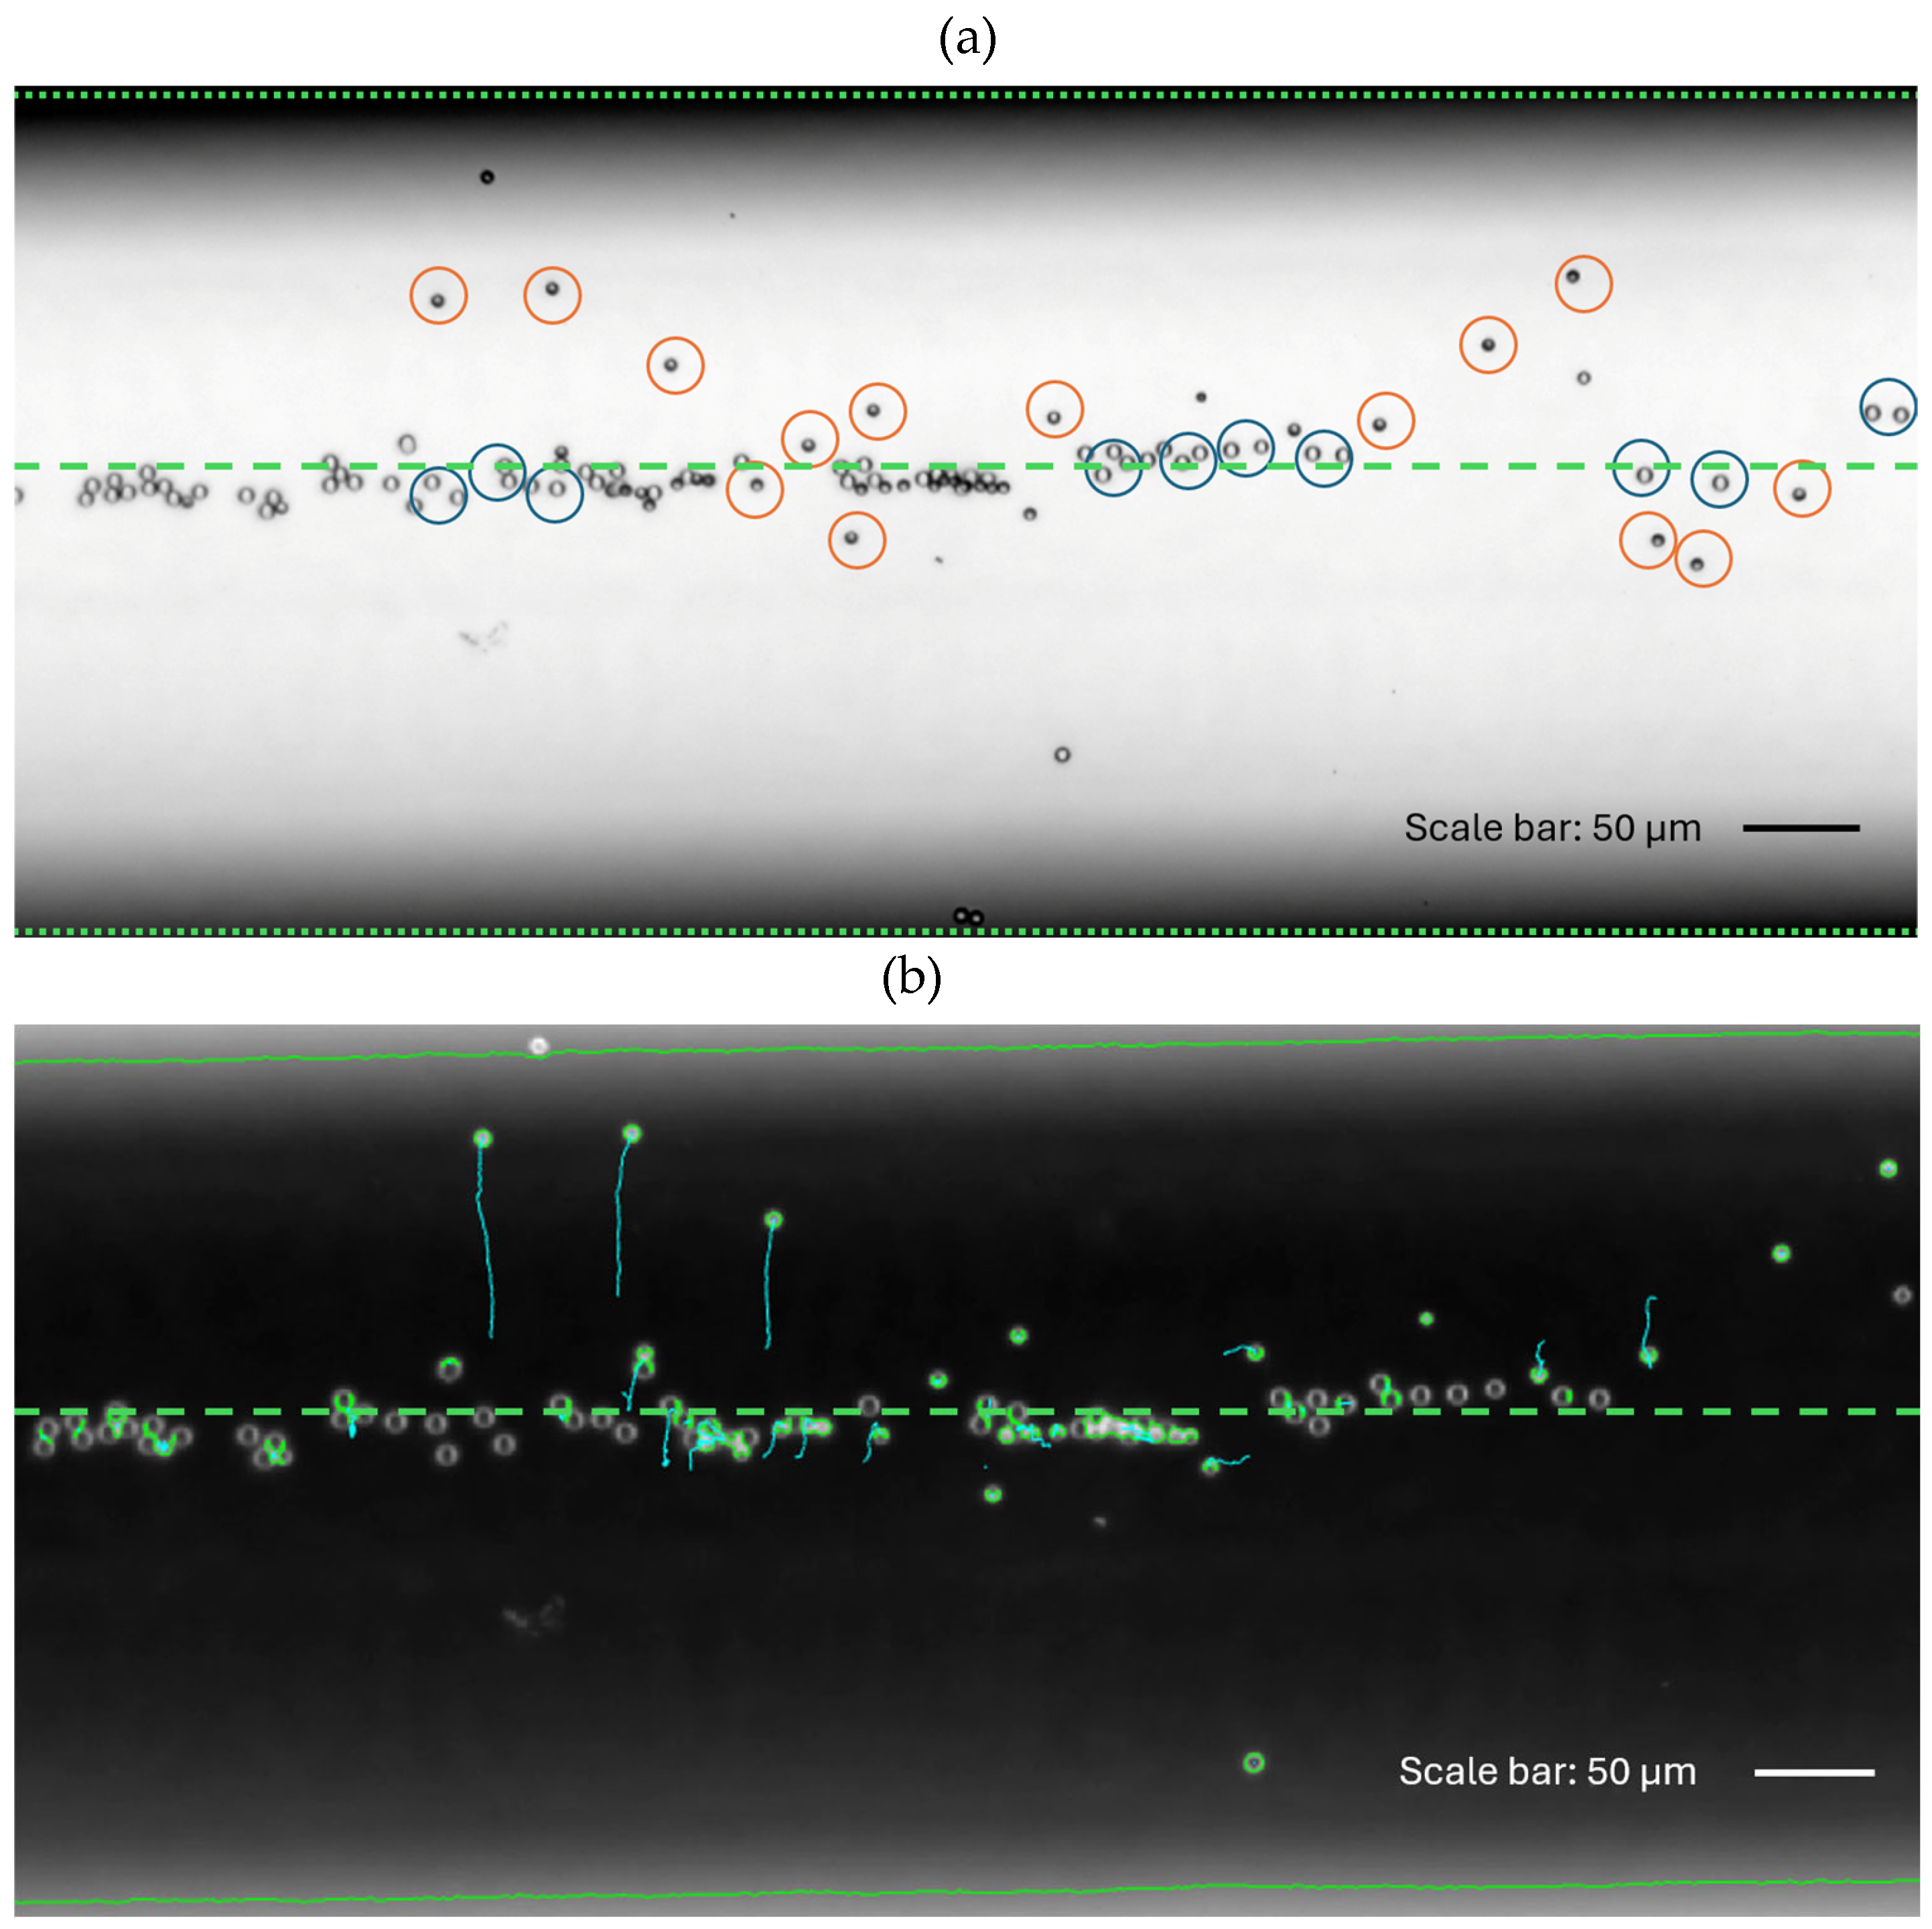
Figure 5.
Distributions of the position of the relative number of polystyrene beads (a) and Janus particles (c) as a function of the radial position in the main channel of the microfluidic chip, for different acoustic voltages. The solid lines in panels (a, c) are single Gaussian fits to the experimental data. Panels (b, d) show absolute values of the difference between the experimental data and Gaussian fit shown in panels (a, c), correspondingly.
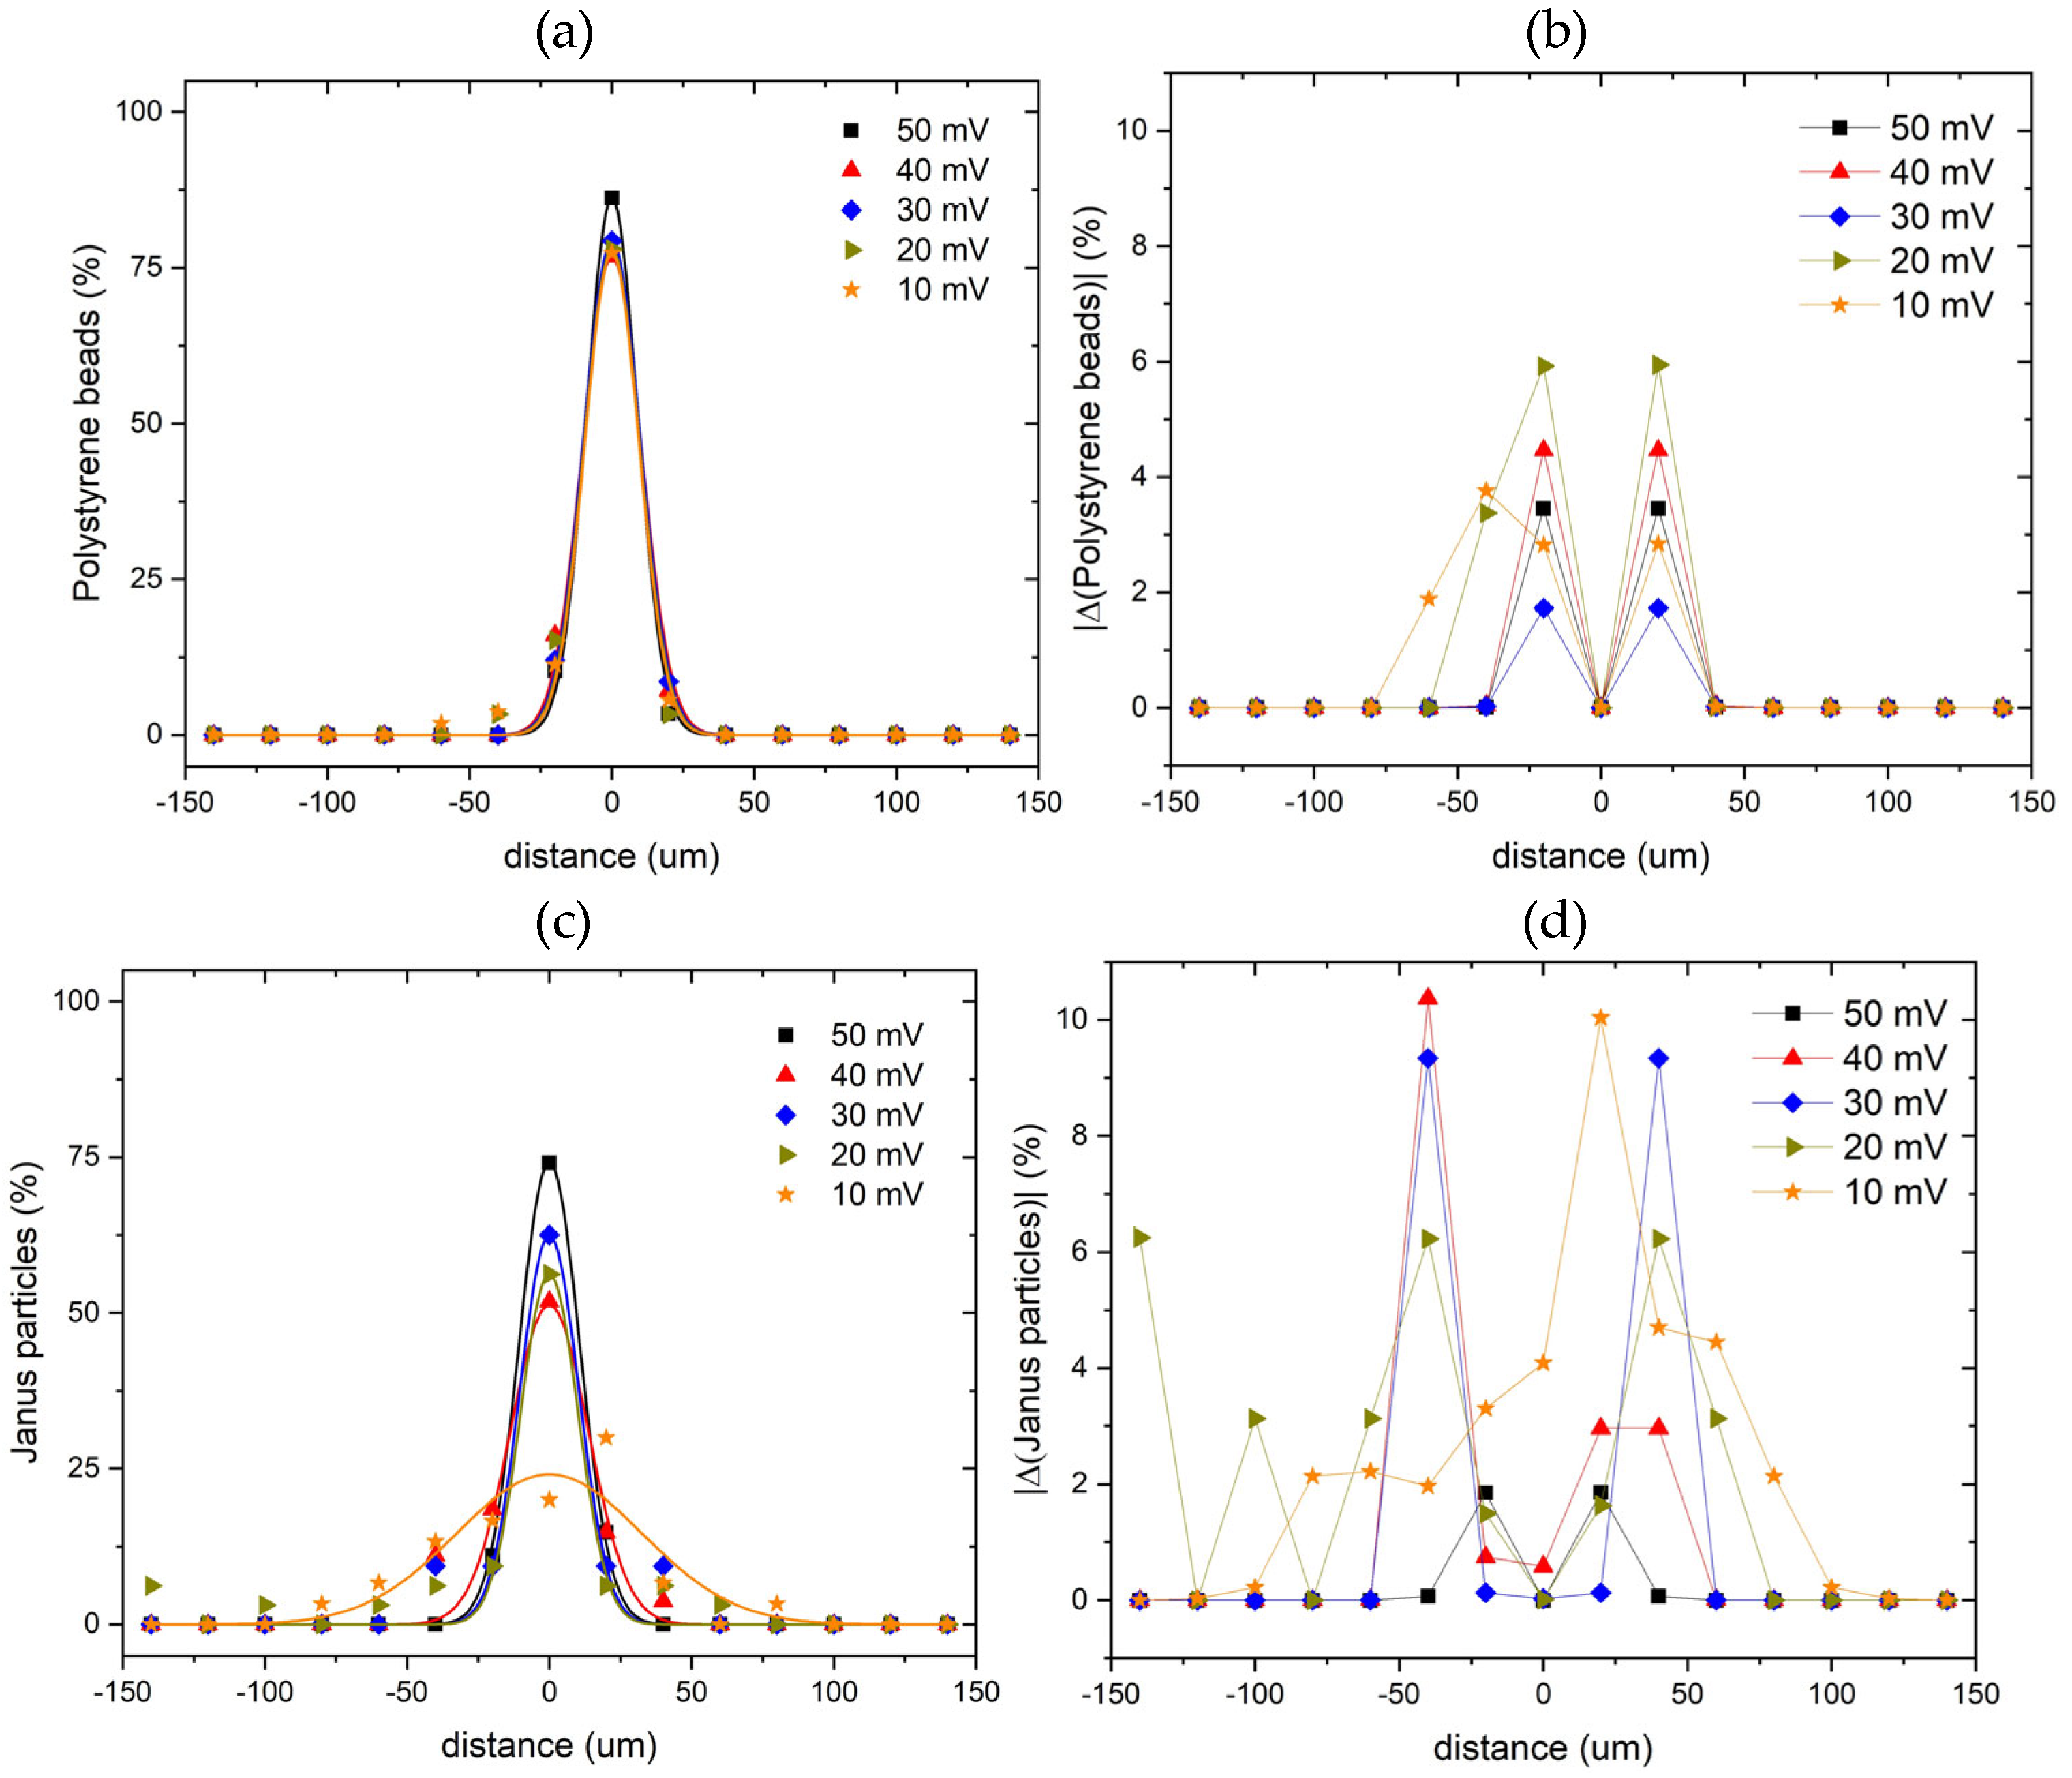
Figure 6.
(a) Escape of self-propelled Janus particles from the acoustic trap in the presence of hydrogen peroxide (10%) and an externally driven fluid flow (volumetric flow rate Q = 4.23 ∙ 10-3 μL/s) along the channel. The acoustic voltage is set to 30 mV. Janus particles move away from the focus line. This is observed in the middle of the main channel of the microfluidic chip. (b) Escape of self-propelled Janus particles from the acoustic trap in the presence of hydrogen peroxide (10%), as well as Janus particles carrying passive polystyrene beads as a cargo (an example of a Janus particle-passive bead dimer is marked by the red circle). The acoustic voltage is set to 10 mV. Janus particles move away from the focus line in the absence of an external flow. The center line of the microchannel is indicated by the green dashed line.
Disclaimer/Publisher’s Note: The statements, opinions and data contained in all publications are solely those of the individual author(s) and contributor(s) and not of MDPI and/or the editor(s). MDPI and/or the editor(s) disclaim responsibility for any injury to people or property resulting from any ideas, methods, instructions or products referred to in the content. |
© 2024 by the authors. Licensee MDPI, Basel, Switzerland. This article is an open access article distributed under the terms and conditions of the Creative Commons Attribution (CC BY) license (http://creativecommons.org/licenses/by/4.0/).
Copyright: This open access article is published under a Creative Commons CC BY 4.0 license, which permit the free download, distribution, and reuse, provided that the author and preprint are cited in any reuse.


