Submitted:
19 February 2024
Posted:
20 February 2024
You are already at the latest version
Abstract
Managing Water, Energy, and Food (WEF) resources within socio-environmental systems demands innovative strategies that provide decision-makers with actionable insights. This article explores the challenges and potential solutions of employing Focus Maps and choremes as a novel approach for assessing anthropogenic impacts and enhancing the visualization of the WEF Nexus in specific geographic areas. By integrating geospatial data, multi-criteria analysis, and involving stakeholders, our research aims to develop Choreomatic Focus Maps (CFMs) that offer a comprehensive spatial representation of the WEF Nexus, facilitating better-informed decision-making at the community level.
Our current work outlines visualization of WEF Nexus, as an initial stages of creating CFMs through a detailed step-by-step process. This includes identifying the main drivers for WEF nexus, such as anthropogenic activities and their distribution, evaluating environmental factors, linking anthropogenic impact with environmental indicators over time, and conducting on-site validation. Our focus is on advancing through these crucial steps, particularly emphasizing field validation within the Local Decision-Makers Tools, visualized here by using Focus Maps. This phase is vital for ensuring our approach is grounded in reality and meets the needs of the communities within the Danube Delta region. By doing so, we aim to provide a visual summary of the WEF Nexus that not only captures the complexity of this fragile ecosystem but also incorporates local insights and priorities, identifying key areas where human activities have significant impacts.
Keywords:
decision makers visualization tools
; WEF nexus visualization
; Choremes
; Focus maps
1. Introduction
In this study we aim to present Focus Maps. They are designed to draw user's attention to the part of the map that is of interest. The user's interpretation process is directed to the region of interest, which facilitates the process of reading the map as the amount of information that needs to be processed is reduced. The focusing effect is achieved by using two techniques: varying degrees of generalization and color fading. Cartographic elements in the geographic area of interest are displayed with precision; the generalization of these elements is kept to a minimum. As the distance from this area increases, so does the degree of generalization of cartographic elements, meaning the cartographic elements that are away from the area of interest are simplified to a high degree [1]
Danube Delta represents a complex study case where environment, economic activities, traditions and culture form the identity of the place. Economic activities are determined by seasonal dynamics, directly influencing the daily life of the inhabitants in the area. Demographic decline of local communities, disparities between the administrative territorial units, acute isolation and harsh conditions of living represent pressing issues for local decision makers [2]. In1991 the Danube Delta was assigned as Bio-sphere Reserve and several restoration measures were implemented [3].
Water Energy Food (WEF) Nexus represents a concept to describe and address, to better understand and systematically analyses the interactions between the natural environment and human activities [4]. This conceptual approach is complex, and its greatest challenge lies in enabling appropriate action. Harwood (2018) calls for a ‘’systems thinking’’ approach that can help effectively evaluating and implementing actions in regard to the area pertaining WEF Nexus [5]. Adopting this kind of ‘’systems thinking” approach in the Danube Delta is essential due to its fast development and increasing urban pressure in recent decades. These facts challenge the delicate balance within the WEF Nexus, making it crucial to consider the interconnectedness of water, energy, and food systems holistically.
The integration of Focus Maps into environmental management, particularly within the context of the WEF Nexus, is a pivotal advancement in understanding and addressing the complex interdependencies between natural and human systems. The concept of the WEF Nexus, which underscores the intricate connections between water, energy, and food systems, is crucial for sustainable development and requires a comprehensive and integrated management approach [6,7]. By converting complex data into an accessible format, these maps enable informed decision-making and facilitate a deeper understanding of the Nexus [8,9]. Wetlands play critical roles in water purification, flood control, and as sources of food and energy, yet they are vulnerable to anthropogenic impacts. Through these maps, the multifaceted impacts on wetlands, and by extension on the WEF Nexus, are vividly portrayed, highlighting areas that require urgent attention and sustainable management [10,11].
2. Materials and Methods
In a first stage preparing Focus Maps, the anthropogenic activities which have the most impact on natural habitats and the environment in the Danube Delta were extracted. In this data driven context we thus have analyzed a set of basic background data providing essential components for sustainable management of this biosphere reserve ecosystems [12]. Further, the use of satellite imagery and spatial analysis technologies provides an effective approach to monitoring and evaluating changes that may affect this region. The proposed methodology represents therefore an integrated approach, using satellite images and space analysis technologies, to assess the impact of anthropogenic activities in the Danube Delta. This approach is validated by the work of several researchers as Medinets et al. (2023),Oteman et al(2021) Kuenzer et al. (2019),Tziavos et al(2016), who utilized satellite imagery to monitor changes in coastal ecosystems, demonstrating its effectiveness in environmental monitoring and management, particularly in sensitive areas like the Danube Delta [13,14,15,16].
Careful selection of images, analysis of changes in vegetation and use of advanced techniques allowed an identification and quantification of specific changes caused by deforestation, intensive agriculture and other human activities. Drawing upon the methodologies presented by Schlemm et al. (2023), our research integrates considerations of water quality into the WEF Nexus visualization, recognizing the interlinked effects of human activities on water, energy, and food systems [17]. Field validation ensured the accuracy of resulting maps, highlighting high-risk areas, providing essential information for the sustainable management of this unique ecosystem.
To enhance the effectiveness of Focus Maps as a valuable visualization tool for decision-makers within the WEF nexus framework, we applied a multi-criteria methodology involving the following aspects.:
- 1.
- Identification of anthropogenic activities:
In the preliminary stage, identifying anthropogenic activities proved pivotal. In our prior study concerning the Danube Delta, this was accomplished by evaluating long-term trends of diverse indicators of human pressure. Based on these indicators, we refined our methodology to emphasize shifts in land use, infrastructure expansion, and time-series analysis. This adaptation allowed us to underscore the influence of human activities linked to tourism, industry, transportation, and agriculture within the Water-Energy-Food (WEF) nexus [12].
- 2.
- Distribution of anthropogenic activities in the deltaic space with the help of satellite images:
By using satellite images, the spatial distribution of anthropogenic activities in the Danube Delta was identified and mapped. We focused here on the distribution of activities to highlight the impact of tourism, industry, transport and agriculture by subsequently correlating with existing data and those identified within the project. The detailed imaging analysis aimed to create a comprehensive spatial understanding of human influences in the Delta. This procedure is crucial for forming connections with both existing and new data within the project, laying the foundation for deeper understanding of the complex dynamics between human activities and the WEF nexus.
- 3.
- Water quality analysis:
Water quality analysis is a focal point in developing our visualization tool, aligning information presented by maps with the WEF nexus pivotal principle of sustainable resource management. Hydrological and physicochemical indices were utilized to provide information about ecosystem conditions at the time of sampling. Such data were critical for assessing water quality and pinpointing areas undergoing significant environmental changes. Such analysis is key to understanding the element “water” of the WEF Nexus, providing vital information that are further integrated to ensure a comprehensive representation of the interdependencies within the Danube Delta's ecological system.
- 4.
- Air quality monitoring:
Air quality monitoring using the online anthropogenic impact assessment system on inland lakes and canals were developed during this project. The data obtained were subsequently correlated with information related to the distribution of anthropogenic activities. Air quality represents an important factor when taking in consideration WEF nexus in a fragile ecosystem like Danube Delta.
- 5.
- Soil quality assessment:
Existing data related to soil quality and organic carbon was used to assess changes in soil according to different anthropogenic activities [18].
In order to identify the areas affected by erosion or degradation, mapping was carried out following drone flights in pilot areas designated for testing and optimizing the system based on multiparameter sensors for real-time monitoring of anthropogenic impact on indoor channels. These data were then integrated into our visualization tool.
- 6.
- Analysis of temporal changes:
Images from different periods were compared to identify trends and temporal changes associated with anthropogenic activities. Change detection techniques were used to highlight areas of significant change. Drone mapping was carried out and the collected data were analyzed by GIS experts.
- 7.
- Land validation:
Field expeditions were conducted to validate and correlate interpretations from satellite images with real terrain conditions. Additional data were collected to calibrate and validate the results obtained from image analysis. In this step also the citizen science was involved, local knowledge being assessed through informative interviews.
- 9.
- Creating Chorematic Focus Maps:
The present study aims at creating Focus Maps, which are the pre-stage of Choreomatic Focus Maps (CFM). CFM, rooted in Brunet's chorematic principles and enriched with modern cartographic techniques, provide a vital tool for visualizing complex interactions [19]. These maps are not mere geographical representations but schematized visualization of territories interlinked with diverse topics of human activity, such as political, economic and demographic background ([20]). This way, CFM are seen as dynamic illustrations of the relationships and interdependencies within the WEF Nexus, making them invaluable for decision-makers. By converting complex data into an accessible format, these maps would enable informed decision-making and facilitate a deeper understanding of the Nexus [8,9]. Choreomatic Focus Maps will be generated to highlight areas at high risk of habitat degradation and soil, air and water contamination, based on data driven extraction and presentation of Focus Maps shown in this study. Similar to Focus Maps, color coding will be used in CFMs to represent different levels of anthropogenic impact. These maps will be aimed at highlighting areas with maximum vulnerability to anthropogenic impact. Doing this, the integration of CFMs as Local Decision-Makers Tools for WEF Nexus Assessment is showcased.
- 10.
- Presentation and interpretation of created Local Decision-Makers Tool:
In the application phase, Local Decision-Makers Tool conceptualized based on the steps described for creating Focus Maps above, stand as the primary visualization tool for local decision-makers to synthesize and showcase the nuanced interactions within the WEF Nexus. Based on Focus Maps enriched by extensive field-verified data it visually articulates the intricate dynamics of the Nexus, offering a powerful means for presenting comprehensive insights. Such approach underscores the importance of integrated resource management in the Danube Delta, ensuring that policy and community discussions are informed by a holistic understanding of environmental, social, and economic interdependencies.
The main sources included satellite images for detailed insight into the delta's territory and identification of the spatial distribution of human activities. Corine Land Cover (CLC) data also provided key information about land use, and public data on population density, infrastructure and accessibility complemented our analysis [21]. The Google Earth Engine platform was used for efficient analysis and processing of satellite data, facilitating the extraction of relevant information [22]. Data available at the National Institute of Statistics (INSSE) were also integrated to obtain information on population and economic activities in the area [23]. The following specific sources were further used to present/create seven themes utilized for visualization in focus maps in this study:
1: Focus landscape Map
Applying mapping of the Danube Delta Biosphere Reserve (DDBR) data from Corine Land Cover (CLC) used and analyzed within the project MANAGEMENT PLAN of the Danube Delta Biosphere Reserve (DDBR), ROSPA0031 the Danube Delta and the Razim – Sinoie Complex, ROSCI0065 the Danube Delta, ROSCI0066 the Danube Delta – marine area [24].
2: Focus Map of the human footprint source:
Extracting human footprint data available through Wildlife Conservation Society platform [25].
3: Focus Map of tourist and recreational areas:
Applying recreational landscape use at DDBR level, data developed through within the project MANAGEMENT PLAN of the Danube Delta Biosphere Reserve (DDBR), ROSPA0031 the Danube Delta and the Razim – Sinoie Complex, ROSCI0065 the Danube Delta, ROSCI0066 the Danube Delta – marine area [24].
4: Focus Map of tourist attractions and viewpoints
Creating this aspect of recreational use by tourism attraction, we used data developed through within the project MANAGEMENT PLAN of the Danube Delta Biosphere Reserve (DDBR), ROSPA0031 the Danube Delta and the Razim – Sinoie Complex, ROSCI0065 the Danube Delta, ROSCI0066 the Danube Delta – marine area [24].
5: Focus Maps of the total number of tourism overnight stays:
Maps of the total number of overnight stays in tourist accommodation structures within the administrative limits of Tulcea County developed using statistical data available on INSSE portal [23].
6: Focus Map of areas of pressure caused by intensive agriculture
We used data developed through within the project MANAGEMENT PLAN of the Danube Delta Biosphere Reserve (DDBR), ROSPA0031 the Danube Delta and the Razim – Sinoie Complex, ROSCI0065 the Danube Delta, ROSCI0066 the Danube Delta – marine area [24].
7: Focus Map of navigation
Applying to Delta Danube Biosphere reserve, we used data developed through within the project MANAGEMENT PLAN of the Danube Delta Biosphere Reserve (DDBR), ROSPA0031 the Danube Delta and the Razim – Sinoie Complex, ROSCI0065 the Danube Delta, ROSCI0066 the Danube Delta – marine area [24].
3. Results
In the following the results of a suite of Focus Maps is provided which indicate a comprehensive exploration of the dynamic interplay between human activities and the delicate ecosystems within the Danube Delta Biosphere Reserve (DDBR). Each Focus Map served as a unique lens, offering distinct insights into various facets of the region's landscape and anthropogenic impact. From understanding land utilization patterns to assessing the human footprint, mapping recreational areas, and overnight stays in tourist accommodations, these visual representations show a nuanced picture of the challenges and opportunities present in this biosphere reserve.
3.1. Land Use Focus Map
The Focus Map about land use, as an anthropogenic activity, has a significant impact on the morphology and biodiversity of the territory. This complex interaction is reflected in the evolution of the local landscape, where variations in land use are influenced by a number of factors such as natural conditions, property rights and the activities of local communities.
Land use in DDBR is divided into five distinct categories: agricultural land, forest land, permanent land under water, land located within municipalities and land for special purposes. This classification is an essential tool for properly regulating and managing the way land is farmed, taking into account its diversity and environmental impact.
This Focus Map not only provides a detailed picture of the distribution of human activities in these ecosystems, but also forms the basis for developing strategies for the conservation and sustainable management of natural resources in a highly sensitive and valuable environment. Following the analysis of the shares and areas occupied by land use categories, the area of non-irrigated arable land represents the 2nd use as distribution of the present ones (Figure 1).
3.2. Focus Map of the Human Footprint
The human footprint is the total sum of the ecological footprints of the human population. It expresses this sum not as a single number, but as a continuous form of human influence spread across the earth's surface, revealing, through its variation, the main patterns of human influence on nature [26].
The human footprint Focus Map is the most common measure of how human activities affect the planet, but the concept applied here is quite simple. The human footprint is a weighted combination of where people live (population density), build infrastructure (roads, railways, factories and others), can circulate (accessibility) and use electricity, an indicator of access to industrial energy sources measured by night lights. These impacts are illustrated on maps at a resolution of about 300 meters. The human footprint Focus Map for the Danube Delta thus, provides a detailed look at the anthropogenic impact in the different regions, highlighting urban, agricultural, forestry, open water and tourist route areas and access routes (Figure 2).
3.3. Focus Map of Tourist Attractions and Viewpoints
On the territory of DDBR there are tourist attractions belonging to the natural environment and the anthropic environment, most of them being represented by: monasteries, natural monuments, wooden churches, fortified churches, castles, fortresses, archaeological vestiges, museums, reservations, viewpoints, etc. The Focus Map of tourist attractions and viewpoints highlights a number of 99 tourist attractions, of which 42 tourist attractions are represented by cultural heritage elements such as tumuli, and another 8 objectives are places of worship and monasteries. In terms of distribution on Administrative Territorial Units (ATU), most tourist attractions are present in: Isaccea (25), Chilia Veche (16), Valea Nucarilor (14) and Sulina (13). At the other end, 1 tourist attraction can be found in 10 ATUs (Figure 3). Linked to the element “water”, tourism refers to the seaside and Danube Delta areas [27].
3.4. Focus Map of Tourist and Recreational Areas at DDBR Level
The Focus Map of tourist and recreational areas within DDBR is an essential resource for understanding the FEW Nexus at territorial level. It summarizes areas of major anthropogenic activities, highlights areas with tourism and recreational potential. The map plays a crucial role in identifying areas of anthropogenic impact caused by intensive tourism. The impact further confirmed through on-site water quality measurements and subsequently highlighted on the CFMs. Therefore, this focus map represents a vital tool for promoting sustainable tourism in DDBR, maintaining a harmonious balance between socio-economic development and environmental conservation (Figure 4).
3.5. Focus Maps of the Total Number of Overnight Stays in Tourist Accommodation Structures within the Administrative Limits of Tulcea County
The Focus Map of the total number of overnight stays in tourist accommodation structures in Tulcea County is an essential resource for understanding the WEF nexus within the context of tourism. By identifying areas with high tourist activity, this map contributes to a holistic view of how tourism intersects with local resource utilization. It provides insights into water and energy consumption trends in areas with dense tourist concentrations, which is crucial for sustainable WEF management. The delimitation of areas with intense tourist activity provides a clear perspective on the places with the largest flow of tourists and related activities. The map is also becoming a vital tool for monitoring tourism trends over time. Changes in the number of overnight stays provide valuable information about the evolution of tourism activities and allow continuous adjustment of development strategies according to these changes. Using the statistical data available in the INSSE database, maps of the total number of overnight stays in tourist accommodation structures within the administrative limits of Tulcea County for 2020 were made (Figure 5), 2021 (Figure 6) and 2022 (Figure 7). These maps are essential in Local Decision-Makers Tool development. They correlate the information highlighted with the help of the Focus Map of Tourist Attractions and Viewpoints (Figure 3) and the Focus Map of Tourist and Leisure Areas at DDBR level (Figure 4).
3.6. Focus Map of Areas of Pressure Caused by Intensive Agriculture
The Focus Map illustrating areas under pressure from intensive agriculture plays a vital role in elucidating the element “food” of the WEF Nexus, beside water quality. This map pinpoints regions where intensive agricultural practices exert significant pressure on resources, particularly water and energy, which are essential for understanding the complex dynamics within the WEF Nexus. It facilitates a comprehensive assessment of the environmental impacts of intensive agriculture, such as resource depletion and pollution, which are critical for developing sustainable food production strategies (Figure 8).
These maps visualize the intricate interconnections within the WEF Nexus, linked to the agriculture pressure. Such map provides specific insights into the element “food”, thereby enhancing the accuracy and relevance of the Local Decision-Makers Tool. Additionally, this map could be used as a valuable asset for policymakers and stakeholders, aiding in informed decision-making and fostering effective communication about sustainable resource management.
Above all, such kind of Focus Map can serve as a foundation for modeling future scenarios, including changes in agricultural practices or the impacts of climate change. This aspect is particularly important for planning and adaptive management within the WEF Nexus framework. By integrating this map into the study, it offers a comprehensive view of how intensive agriculture influences the food element and interacts with other elements within the WEF Nexus, ultimately contributing to a more sustainable and holistic approach to resource management.
3.7. Focus Map of Navigation in DDBR
Integrating the Focus Map of navigation routes into the study impacts our understanding of the energy and water dynamics within the WEF Nexus. This map, compared to the one used for intensive agriculture, does more than just trace paths; it brings to light the often-overlooked interplay between transportation networks and resource utilization (Figure 9).
By mapping navigation routes, pinpoint areas are visualized where waterways are heavily used and thus subject to potential environmental stress. This is vital for understanding the element “energy” of the WEF Nexus, considering that shipping and transportation are significant energy consumers. The map can serve as a critical tool in assessing the balance between transportation efficiency and its ecological footprint, particularly in water resource management.
In the context of creating a Local Decision-Makers Tool, this navigation data enriches an ability to visualize the WEF Nexus. It offers nuanced insights, especially in how transport networks interface with water and energy use, potentially impacting food distribution channels.
For decision-makers this map can be an essential asset. It aims at interpreting the complexities of energy and water management in relation to transportation. The visual clarity can drive more informed, sustainable policy-making, particularly in areas where waterway navigation is a key economic and environmental factor.
Furthermore, this map can act as a predictive model for future scenarios, such as shifts in trade routes or the introduction of new, more sustainable transportation technologies. This foresight is crucial for proactive planning within the WEF Nexus, ensuring that future developments are in harmony with sustainable resource use.
These Focus Maps, developed from a blend of satellite insights, Corine Land Cover data, and comprehensive demographic and infrastructural information, serve as a cornerstone for the second phase of Local Decision-Makers Tool development. Each map presents the complex relationship between human activities and the environment also enriching our understanding and aids in sculpting informed, sustainable strategies for the Danube Delta's future.
The seven thematic Focus Maps not only showcase the spatial distribution of human activities but also underscore the potential of such detailed visual tools in fostering sustainable development. Here, the element water of the Nexus is omnipotent (Table 1). By highlighting specific areas of interest associated with “water” — ranging from the landscape and human footprint to tourism, agriculture, and navigation — these maps offer important insights into the dynamics of land use, resource exploitation, and environmental conservation. This approach not only facilitates informed decision-making but also paves the way for applying these methods in similar ecological contexts, thereby broadening the scope of their impact (Table 1). Concerning the cartographic design, the background always displays the geographic background. In case the tourism Focus Map icons and symbols are used. The degree of color coding is multiple in the Focus map about protected natural areas DDBR (Figure 1), along a six-range scale for showing the numbers of overnight stays in tourist accommodation. (Figure 5), reduced to three color categories showing recreational areas relevant for tourism, agriculture and navigation (Figure 4, Figure 8, Figure 9). The color coding as color gradient from white to dark pink and green was applied for illustrating the human footprint (Figure 2).
4. Discussion
According to a literature review by Torres et al. (2019), which covers the years from 2011 to 2019, the nexus approach primarily focused on the interconnectedness of water, energy, and food systems. These three elements emerged as the central focus of "nexus thinking" [28]. Alternative perspectives, such as reducing the nexus to just two elements (Shang et al., 2018) or expanding it to include additional factors like ecosystem health and climate dynamics, were less frequently explored. These findings underscore, that our WEF study is of coherent interest with other studies in this field [29].
Although the number of elements integrated in WEF Nexus approach varied, the element “water” was always present according to Torres et al (2019) [28]. The element “water” is also omnipresent in our WEF Nexus study aimed at creating our Focus Maps, as identified in the table providing an overview about these maps. The many aspects of the element “water” are concerned in view of land use and agriculture (areas of irrigation and permanent land under water), of human footprint (water surface areas are indicated by low footprint scores), of tourist attractions, recreational areas, and tourisms accommodation locations (seaside and Danube Delta tourisms hotspots; e.g., [27]) and of navigation (use of water way in Danube Delta). In this view, “water” is central in our WEF Nexus approach.
The prominent role of “water”, however, goes even far beyond what is seen at first glance at these Focus Maps. Within WEF Nexus, the sustainable use of water resources involves managing water in a way that meets present needs without compromising the ability of future generations to meet their own needs. Sustainable water management practices include understanding water as habitat, reducing water pollution inputs, managing land use to minimize water runoff or prevent flooding by open wetland areas, and thus also implementing effective watershed management strategies. The key understanding of water within WEF nexus, refers to interconnected water quality and ecosystem health, which are critical for sustaining water, energy, and food systems. Maintaining high water quality in lakes and tributaries in the DDBR is known to support aquatic biodiversity, favoring fish species important for food production. Water quality is also of importance when using water for drinking and agricultural irrigation, builds up the scenery for sustainable ecotourism. This multifaceted importance of water is deeply embedded as foundational knowledge within our WEF Nexus Focus Maps, even if not explicitly depicted. By integrating water into our map visualization, we ensure a comprehensive understanding of the intricate relationships and dependencies of water within this complex WEF framework.
The increasing interest in WEF Nexus over the last 20 years is accompanied by the increasing awareness that we are currently living in a period of rapid environmental degradation due to human activities, the Anthropocene. Haidvogl (2018) described the increasing human pressure on freshwater lakes and rivers in the twentieth century, in particular mentioning pollution, changes in water hydrology, invasion of alien species, decrease of fish yield and loss of biodiversity among others [30]. Despina et al. (2020) provides an overview of anthropogenic pressures within the Danube Delta Biosphere Reserve, focusing particularly on the degradation observed in floodplains and Danube River ecosystems spanning a period of 25 years [31]. In the historical context, the stated resume “growing awareness of the limits to growth” (Du Pisani, 2006) strengthened the thinking about sustainable use of nature, a close key concept also for WEF Nexus later [32]. With this globally growing awareness about sustainable use of resources, concepts about WEF Nexus were applied worldwide (e.g., [33,34,35,36]), and so also for the Danube River. A more detailed picture towards an integrative perspective of Danube River systems in the 21st century linked to water-energy-food nexus concept, the degradation of Danube River along up to 70 years, was elaborated in various studies in the context of ecosystem services, agriculture, and urban life ([3,37,38,39,40,41]).
The Tulcea WEF Nexus, a case study of a mid-size city in the Danube Delta (Tulcea; population size: 65.624, population density: 571 inhabitants per km², census, 2021) was explored in two prior studies ([42,43]). The key finding pertinent to this study was that the WEF Nexus showed less awareness among local residents in Tulcea than it could be expected from rural development, analyzed by scientists (degradation of environment see, e.g. [44]). Through the survey on the WEF Nexus (interviews and workshops) concerning the vegetable supply in Tulcea, which encompassed various commodity flows including a local vegetable market in the city, at least a larger number of respondents was interested appreciating nexus knowledge, to learn more about the interconnection of the three elements: water, energy, and food [42]. Accordingly, these residents utilized "the Tulcea tool”, developed as a user-friendly interactive data collection tool within the framework of the WEF Nexus. When asked about the appeal of the information offered by this tool, 46% of respondents expressed a preference for the interactive map to be the primary feature. This leads to two conclusions drawn from Balaican et al. (2023): A, that the interest in WEF Nexus context is expanding beyond scientists and local authorities and includes a growing interest from the general population, and B, that there is a demand for a graphical representation of the complex relationships within the WEF Nexus. This outcome resonates with contemporary concerns by other studies including citizen science activities in the DDBR [45], i.e., indicating a growing public awareness of sustainability of resources, all aimed at enhancing human well-being. Thus, the communication of complex relationships, such as those of WEF Nexus, is demanded, needs to be visually presented [46].
An effective mapping of complex WEF Nexus meets two sides: (1) data driven selection of most important aspects of elements, which are (2) introduced the specific geographical references through map representations. Focus Maps are thus a hybridization of scientific metrics or indicator parameters and cartographic design.
Concerning the parameter driven impact on the elements within WEF Nexus, a suit of ecological and social background parameters has been empirically captured. Extracting key parameters is utilized to reflect the complex circumstances effectively. Key parameters thus essentially serve as indicators, designated to trace climate and other environmental changes in sentinel environments, such as lakes and rivers, in the long-term. Consequently, the biocenosis structure is often evaluated today, as it is assumed that organisms integrate well over long periods of time with their occurrences during their life span—unlike current measurements of environmental conditions. The well-known application of biocenotic metric measures, as also utilized for DDRB, or being in general the basic assessment tool for European Water Framework Directive is mentioned here (metric measures derived from the proportions of the many species living together in an aquatic community and are compare with those biocenotic descriptions from natural reference habitats, see e.g., [44]). Even more aggregation of information is possible when using single key indicators. Such an aggregation of information is given by the parameter “water clarity”. This socio-ecological indicator is going far beyond its original meaning used for determining the depth in ocean water for safe navigation or monitoring water quality in aquatic sciences [47]. Water clarity is nowadays seen bridging the gap of information flow from sustainable ecosystems health to ecosystem service supply, from scientific assessment documenting an overall success of sustained urban-lake restoration or urban-ecosystem health in the lab to human perception enhancing human well-being in urban life [48]. These two examples, the application of metric parameters and of key indicators, demonstrate that simplification of an issue scientifically grounded (empirically data-driven outcome) and targeted can help to understand better complex relationships applicable for a broader audience, including local residents. Such simplification of the complexity concerning like the WEF Nexus in DDRB, was also achieved by correlation analysis identifying the biggest anthropogenic pressures for WEF Nexus in the DDBR prior creating Focus Maps. The main impact of human impact on WEF Nexus extracted were tourism, population density, industry, transport, and agriculture [12]. Utilizing the human footprint (Sanderson et al., 2002) for creating a Focus Map in the WEF context, this parameter again is a reliable and robust key parameter, as it amplifies the overall human impact, is encompassing not only population density but integrates various human activities such as traffic, industry, tourism, and other components, weighted in an index [26]. In this view, the simplification, i.e., reducing to a few extracted key indicators on geographical reference maps, can be seen as highly focused information processing in visualizing that still meets the complexity of the WEF Nexus. It thus can be helpful for decision makers and can enhance attractivity getting informed for local people demanding greater awareness in daily life understanding WEF Nexus in future perspective [49].The simplification, to present a lower number of reliable indicators but to keep the information level depicted, goes also along with limits of human perception when utilizing maps. It is a backbone, that spontaneous and fast recognition of items by adults are limited up to five items ([50,51,52]). In this view, simplification is demanded on both sides when creating effective Focus Maps: reduction to few reliable and robust key descriptors as discussed before and a well-structured simple cartographic design, as e.g., the abstraction to lower number of color codes and icons used as an overlay on a simplified geographic reference map ([53,54]). This way, Focus Maps are seen as powerful tools assessing the WEF Nexus.
The next level of abstraction displaying the complex interdependencies between natural and human systems of WEF Nexus are seen in CFMs ([20,55,56]). Discussing CFMs, collaboration and constructive criticism about essential features for advancing CFMs as a decision-support tool are seem to become important in next perspective. In this view, our study aimed to stimulate further visual representation and innovation in this field, acknowledging the current approach's limitations while recognizing its vast potential for future research. An iterative method creating CFMs will ensure that each phase deepens the under-standing of the WEF Nexus and, in turn, also redefines CFMs as a tool. Future studies, including more diverse case studies, expanded datasets, and various geographical applications, are expected to provide an even more comprehensive toolkit for local decision-makers, making information accessible and understandable for policy makers and the local community.
5. Conclusions
In this exploration of the WEF Nexus, focus maps are introduced as a pivotal tool for enhancing understanding and management within this complex framework. These maps serve not only as educational instruments but also as crucial catalysts in comprehending the intricate interdependencies within the Nexus. By visually representing these relationships, they provide stakeholders with a holistic perspective on how individual actions impact the entire system, thereby advocating for sustainable resource management practices. This approach is essential for fostering an integrated environmental management strategy. Moreover, the role of focus maps extends beyond simple data representation; they are instrumental in offering clear, visual insights into the dynamic environmental systems. Their application is critical in informing policy decisions, promoting sustainable practices, and enhancing overall understanding of key environmental interactions, thus playing a vital role in effectively navigating and managing the complexities of the WEF Nexus.
The effective management of Water, Energy, and Food (WEF) resources in socio-environmental systems demands innovative strategies that empower decision-makers with practicable knowledge. The introduction of Local Decision-Makers Tools based on methodology that combines existing data with visualization maps and on-filed validation will offer a comprehensive approach for evaluating anthropic impacts and visualizing the WEF Nexus in specific geographical areas of DDBR. By integrating geospatial information, multi-criteria analysis, and stakeholder involvement, this will provide nuanced spatial depictions of the WEF Nexus, facilitating better-informed decision-making at the community level. By involving various stages in this DDBR study, such as identifying anthropic activities, evaluating environmental factors, correlating impacts with indicators over time, and on-site validation, will ensure a holistic understanding of the Nexus through a combination of water availability, energy production, and food production datasets.
Author Contributions
Conceptualization, Dragos Balaican. and Katrin Teubner.; methodology, Dragos Balaican, Adrian Burada, Iulian Nichersu and Katrin Teubner.; validation, Catalina Iticescu, Luminita Moraru and Puiu-Lucian Georgescu.; formal analysis, Mihaela Tudor, Iulian Nichersu and Adrian Burada; investigation, Marian Tudor; resources, Cristian Trifanov.; data curation, Cristian Trifanov.; writing— Dragos Balaican; preparation, Dragos Balaican. and Katrin Teubner.; writing—review and editing, Dragos Balaican, Puiu-Lucian Georgescu, Catalina Iticescu and Katrin Teubner.; visualization, Catalina Iticescu, Luminita Moraru and Puiu-Lucian Georgescu.; supervision, Marian Tudor.; project administration, Mihaela Tudor.; funding acquisition, Catalina Iticescu. All authors have read and agreed to the published version of the manuscript
Data Availability Statement
We encourage all authors of articles published in MDPI journals to share their research data. In this section, please provide details regarding where data supporting reported results can be found, including links to publicly archived datasets analyzed or generated during the study. Where no new data were created, or where data is unavailable due to privacy or ethical restrictions, a statement is still required. Suggested Data Availability Statements are available in section “MDPI Research Data Policies” at https://www.mdpi.com/ethics.
Acknowledgments
In this section, you can acknowledge any support given which is not covered by the author contribution or funding sections. This may include administrative and technical support, or donations in kind (e.g., materials used for experiments).
Conflicts of Interest
The authors declare no conflicts of interest. The funders had no role in the design of the study; in the collection, analyses, or interpretation of data; in the writing of the manuscript; or in the decision to publish the results.
References
- A. Zipf and K. F. Richter, "Using FocusMaps to ease map reading – Developing smart applications for mobile devices.," KI 4/02 Special Issue Spatial Cognition, pp. 35-37, 2002.
- D. Balaican, I. Nichersu, I. Nichersu, M. Simionov and M. Tudor, "Economic Disparities for the Territorial Administrative Units Bordering the Sulina Branch Based on the Analysis of Endogenous Economic Factors," Scientific Annals of the Danube Delta Institute, vol. 26, no., 2021. [CrossRef]
- A.M. Negm and D. C. Diaconu, The Danube River Delta, ISBN-13: 9783031039829, 2022. [CrossRef]
- Food and Agriculture Organization of the United Nations(FAO), "The Water-Energy-Food Nexus A new approach in support of food security and sustainable agriculture," FAO, Rome; https://www.fao.org/3/bl496e/bl496e.pdf, 2014.
- S. A. Harwood, "In search of a (WEF) nexus approach," Environmental Science & Policy, vol. 83, no. ISSN 1462-9011, 2018. [CrossRef]
- J. L. Jones-Crank, J. LU and B. Orlove, "Bridging the gap between the water-energy-food nexus and compound risks," Environmental Research Letters, vol. 19, no., 2024. [CrossRef]
- M. K. Suleiman and S. A. Shahid, "Prospective of Agricultural Farming in Kuwait and Energy-Food-Water-Climate Nexus," Terrestrial Environment and Ecosystems of Kuwait. Springer, no., 2023. [CrossRef]
- S. B. Darling, "Tackling Wicked Sustainability Problems," ACS Sustainable Resource Management, no., 2023. [CrossRef]
- a. Liutin and C. Dower, Irrigation innovation: Navigating challenges in Uzbekistan’s water–energy–food–environment nexus. Montpellier, France:CGIAR. https://www.cgiar.org/news-events/news/irrigation-innovation-navigating-challenges-in-uzbek, 2023.
- E. Probst, M. Fader and W. Mauser, "The water-energy-food-ecosystem nexus in the Danube River Basin: Exploring scenarios and implications of maize irrigation," Science of The Total Environment, vol. 914, no. ISSN 0048-9697. 2024. [CrossRef]
- A. Fakhroldin, R. a. Mirzaei, A. a. Taki and M. a. Azarm, "Decision-Makers' Perspectives and Sustainable Management in the Agricultural Sector: New Design of the Water-Energy-Food-Environment-Decision Makers Nexus.," SSRN, no., 2023. [CrossRef]
- INCDDD Tulcea, "Evaluarea stării ecologice a ecosistemelor acvatice de pe teritoriul Rezervației Biosferei Delta Dunării," Raport Faza 2/iunie/22023, al proiectului nr. PN PN 23 13 01 01 (coord. Iuliana-Mihaela TUDOR) al contractului nr. 35N/2023, Tulcea, 2023.
- V. Medinets, E. Cherkez, T. Pavlik, Y. Gazyetov, S. Shatalin, O. Konareva, I. Soltys and S. Medinets, "Report on Dynamics of Ukrainian Coastal Line Changes for 1980-2020," Earth, pontos-eu.aua.am. https://pontos-eu.aua.am/wp-content/uploads/2023/04/UA-PONTOS-Report-on-dynamics-of-coastline-change_final-1-1-68_compressed.pdf, 2023.
- I. Tziavos, T. Alexandridis, B. Aleksandrov, A. Adrianopoulos, I. Doukas, I. Grigoras, V. Grigoriadis, I. Papadoupoulou, P. Savvaidis, A. Stergioudis, L. Teodorof, G. Vergos, L. Vorobyova and G. Zalidis, "Development of a Web-based GIS monitoring and environmental assessment system for the Black Sea: application in the Danube Delta area," Environ Monit Assess, no. p. 492, 2016. [CrossRef]
- C. Kuenzer, V. Heimhuber, J. Huth and S. Detch, "Remote Sensing for the Quantification of Land Surface Dynamics in Large River Delta Regions—A Review," Remote Sens, no., p. 11, 2019. [CrossRef]
- B. Oteman, A. Scrieciu, T. J. Bouma, A. Stanica, van der Wal and Daphne, "Indicators of Expansion and Retreat of Phragmites Based on Optical and Radar Satellite Remote Sensing: a Case Study on the Danube Delta," Wetlands, vol. 72, no., p. 41, 2021. [CrossRef]
- A. Schlemm, M. Mulligan and A. van Griensven, "Including water quality in the water-energy-food nexus: An Upper White Nile case study," in EGU General Assembly, Vienna, Austria, 24–28 Apr 2023, EGU23-16167. 2023., 2023. [CrossRef]
- Livanov, Q. ; I. Nichersu, A. Burada, D. Balaican, M. Simionov and E. Bratfanof, "Research on the organic carbon content from the Danube Delta soils," Scientific Annals of the Danube Delta Institute, p. 2023. [CrossRef]
- R. Brunet, ""La carte-modèle et les chorèmes"," Mappemonde, pp. 4-6, 1986.
- De Chiara, D. D. Del Fatto, R. Laurini, M. Sebillo and G. Vitiello, "A chorem-based approach for visually analyzing spatial data," Journal of Visual Languages & Computing, Vols. 22(3), 173-193, no., p. 2011. [CrossRef]
- European Union, "Copernicus Land Monitoring Service," https://land.copernicus.eu/en/map-viewer.
- N. Gorelick, M. Hancher, M. Dixon, S. Ilyushchenko, D. Thau and R. Moore, "Google Earth Engine: Planetary-scale geospatial analysis for everyone," Remote Sensing of Environment, Vols. ISSN 0034-4257, no., pp. 18-27, 2017. [CrossRef]
- Institutul National de Statistica-Romania, "INSSE.RO," 2023. [Online]. Available: https://insse.ro/cms/ro/content/contactati-ne-prin.
- adrosoft.ro, "REVIZUIREA PLANULUI DE MANAGEMENT ȘI A REGULAMENTULUI RBDD," 2023. [Online]. Available: https://pm.ddbra.ro/.
- Wildlife Conservation Society, "MARCH OF THE HUMAN FOOTPRINT," Wildlife Conservation Society, 2022. [Online]. Available: https://wcshumanfootprint.org/.
- E. W. Sanderson, M. Jaiteh, M. A. Levy, K. H. Redford, A. V. Wannebo and G. Woolmer, "The Human Footprint and the Last of the Wild: The human footprint is a global map of human influence on the land surface, which suggests that human beings are stewards of nature, whether we like it or not," BioScience, pp. 2002;891-904. [CrossRef]
- C. Postelnicu and D. Dabija, "Challenges and development prospects for tourism in Romania," Ecoforum, Vols. 5(1), 84-89., no. ISSN 2344–2174, 2016.
- C. Torres, C. de Lima, B. de Almeida Goodwin, T. de Aguiar Junior, A. Fontes, D. Ribeiro, R. da Silva and Y. Medeiros, "A literature review to propose a systematic procedure to develop “nexus thinking” considering the water–energy–food nexus.," Sustainability, Vols. 11(24), 7205., no., 2019. [CrossRef]
- Y. Shang, P. Hei, S. Lu, X. Li, Y. Wei, J. Dongdong, Y. Dong Jiang, X. Jiaguo Gong, Y. Mengmeng Hao, L. Jiahong and H. Wang, "). China’s energy-water nexus: Assessing water conservation synergies of the total coal consumption cap strategy until 2050," Applied Energy, Vols. 210, 643-660., no., 2018. [CrossRef]
- G. Haidvogl, "Historic milestones of human river uses and ecological impacts.," in Riverine Ecosystem Management, Vols. Huisman, J., Ed.; Springer: Berlin/Heidelberg, Germany, ; pp. 19–39., Springer: Berlin/Heidelberg, Germany, , 2018, p. pp. 19–39. [CrossRef]
- C. Despina, L. Teodorof, A. Burada, D. Seceleanu-Odor, I. Tudor, O. Ibram, A. Nastase, C. Trifanov, C. Spiridon and M. Tudor, "Danube Delta Biosphere Reserve—Long-Term Assessment of Water Quality.," in Water Resources Management in Balkan Countrie, Springer, 2020, pp. pp.21-43. [CrossRef]
- J. Du Pisani, "Sustainable development–historical roots of the concept," Environmental sciences, no., pp. 83-96, 2006. [CrossRef]
- M. Al-Saidi and N. Elagib, "Towards understanding the integrative approach of the water, energy and food nexus.," Science of the Total Environmen, no., pp. 574, 1131-1139., 2017. [CrossRef]
- Endo, A. ; I. Tsurita, K. Burnett and p. M. Orencio, "A review of the current state of research on the water, energy, and food nexus.," J. Hydrol. Reg. Stud., vol. 11, no., pp. 20-30, 2017. [CrossRef]
- Zhang, C. ; X. Chen, Y. Li, W. Ding and G. Fu, "Water-energy-food nexus: Concepts, questions and methodologies.," Journal of Cleaner Production, Vols. 195, 625-639., no., 2018. [CrossRef]
- E. Moraes-Santos, R. Dias and J. Balastieri, "Groundwater and the water-food-energy nexus: The grants for water resources use and its importance and necessity of integrated management.," Land Use Policy, Vols. 109, no. 105585., 2021. [CrossRef]
- D. Dogaru, W. Mauser, D. Balteanu, T. Krimly, C. Lippert, M. Sima and A. Frank, "Irrigation water use in the Danube Basin: Facts, governance and approach to sustainability.," Journal of Environmental Geography, Vols. 12(3-4), 1-12., no., 2019. [CrossRef]
- T. Hein, C. Hauer, M. Scmid, G. Stoglehner, C. Stumpp, T. Ertl and C. Wang, "The coupled socio-ecohydrological evolution of river systems: Towards an integrative perspective of river systems in the 21st century," Science of The Total Environment, Vols. 801, 149619, no., 2021. [CrossRef]
- S. Salam, I. Popescu and A. Scrieciu, "DEFINING A WATER-ENERGY-FOOD NEXUS FRAMEWORK FOR WATER ALLOCATION IN THE LOWER DANUBE BETWEEN IRON GATES AND ZIMNICEA.," GeoEcoMarina, no., p. 28, 2022. [CrossRef]
- M. Tye, O. Wilhelmi, A. Pierce, S. Sharma, I. Nichersu, M. Wroblewski, J. Wendel, P. Laborgne, M. Heyder and I. Nichersu, "The food water energy nexus in an urban context: Connecting theory and practice for nexus governance," Earth System Governance, vol. 12, no., 2022. [CrossRef]
- E. Probst, M. Fader and W. Mauser, "The water-energy-food-ecosystem nexus in the Danube River Basin: Exploring scenarios and implications of maize irrigation," Science of The Total Environment, vol. 914, no. 169405., 2024. [CrossRef]
- D. Balaican, I. Nichersu, I. Nichersu, A. Pierce, O. Wilhelmi, P. Laborgne and E. Bratfanof, "Creating knowledge about food-water-energy nexus at a local scale: A participatory approach in Tulcea, Romania," Environmental Science & Policy, Vols. 141, 23-32., no., 2023. [CrossRef]
- Pierce, A. ; W. Goszczynski, J. Suchomska, M. Wroblewsi, I. Nichersu, D. Balaican, I. Nichersu, S. Saloni and P. Laborgne, "Exploring the Challenges and Opportunities for Integrated Governance of Food, Energy, and Water Systems: Insights from Three Mid-Sized Cities. 25 pages, in press.," no., 2023. [CrossRef]
- M. Tudor, I. Tudor, O. Ibram, L. Teodorof, C. Nastase and G. Deak, "Analysis of biological indicators related to the surface water quality in the Danube Delta Biosphere Reserve. 16(2)," Journal of Environmental Protection and Ecology, no. http://www.jepe-journal.info/vol-16-no2-2015, pp. 443-452., 2015.
- T. Assumpacao, A. Jonoski, I. Theona, C. Tsiakos, M. Krommyda, S. Tamascelli, i. Nichersu and I. Popescu, "Citizens’ campaigns for environmental water monitoring: Lessons from field experiments," IEEE Access, vol. 7, no. 134601-134620, 2019. [CrossRef]
- A. Karabulut, B. Egoh, D. Lanzanova, B. Grizzetti, G. Bidoglio, L. Pagliero and S. Mubareka, "Mapping water provisioning services to support the ecosystem–water–food–energy nexus in the Danube river basin.," Ecosystem services, Vols. 17, 278-292., no., 2016. [CrossRef]
- K. Teubner, I. Teubner, K. Pall, W. Kabas, M. Tolotti and T. Ofenbock, "New emphasis on water clarity as socio-ecological indicator for urban water - a short illustration," Rivers and floodplains in the anthropocene - upcoming challenges in the Danube River basin, extended abstracts 43rdIAD-conference, Germany: Eichstadt-, no., p. 70–78, 2021. [CrossRef]
- K. Teubner, I. Teubner, K. Pall, W. Kabas, M. Tolotti, T. Ofenbock and M. Dokulil, "New Emphasis on Water Transparency as Socio-Ecological Indicator for Urban Water: Bridging Ecosystem Service Supply and Sustainable Ecosystem Health," Frontiers in Environmental Science, vol. 8:573724, no., 2020. [CrossRef]
- R. Bleischwitz, C. Hauer, M. Schmid, G. Stoglehner, C. Stumpp, T. Ertl and C. Wang, "Resource nexus perspectives towards the United Nations sustainable development goals," Nature Sustainability, Vols. 1(12), 737-743., no., 2018. [CrossRef]
- E. Kaufman, M. Lord, T. Reese and J. Volkmann, "The discrimination of visual number," The American journal of psychology, Vols. 62(4), no. 498-525., 1949. [CrossRef]
- W. Jevons, "The power of numerical discrimination," Nature, Vols. 3(67), 281-282., no., 1871. [CrossRef]
- S. Haroz and D. Whitney, "How capacity limits of attention influence information visualization effectiveness," IEEE Transactions on Visualization and Computer Graphics, Vols. 18(12), 2402-2410., no., 2012. [CrossRef]
- S. Liu, W. Cui, Y. Wu and M. Liu, "A survey on information visualization: recent advances and challenges," The Visual Computer, Vols. 30, 1373-1393., no., 2014. [CrossRef]
- R. Roth, "Cartographic design as visual storytelling: synthesis and review of map-based narratives, genres, and tropes," The Cartographic Journal, Vols. 58(1), 83-114., no., 2021. [CrossRef]
- M. Sebillo, G. Vitiello, M. Grimaldi and A. De Piano, "A citizen-centric approach for the improvement of territorial services management," ISPRS International Journal of Geo-Information, Vols. 9(4), 223., no., 2020. [CrossRef]
- P. Battistoni, M. Romano, M. Sebillo and G. Vitiello, "Monitoring Urban Happiness through Interactive Chorems," Sustainability, vol. 11, no., p. 15, 2023. [CrossRef]
Figure 1.
Focus Map of land use in protected natural areas Danube Delta Biosphere Reserve, Danube Delta ROSPA0031 and Razim-Sinoie Complex and Danube Delta ROSCI0065 – source MANAGEMENT PLAN of the Danube Delta Biosphere Reserve, ROSPA0031 the Danube Delta and the Razim – Sinoie Complex, ROSCI0065 the Danube Delta, ROSCI0066 Danube Delta - marine area / p.1787.
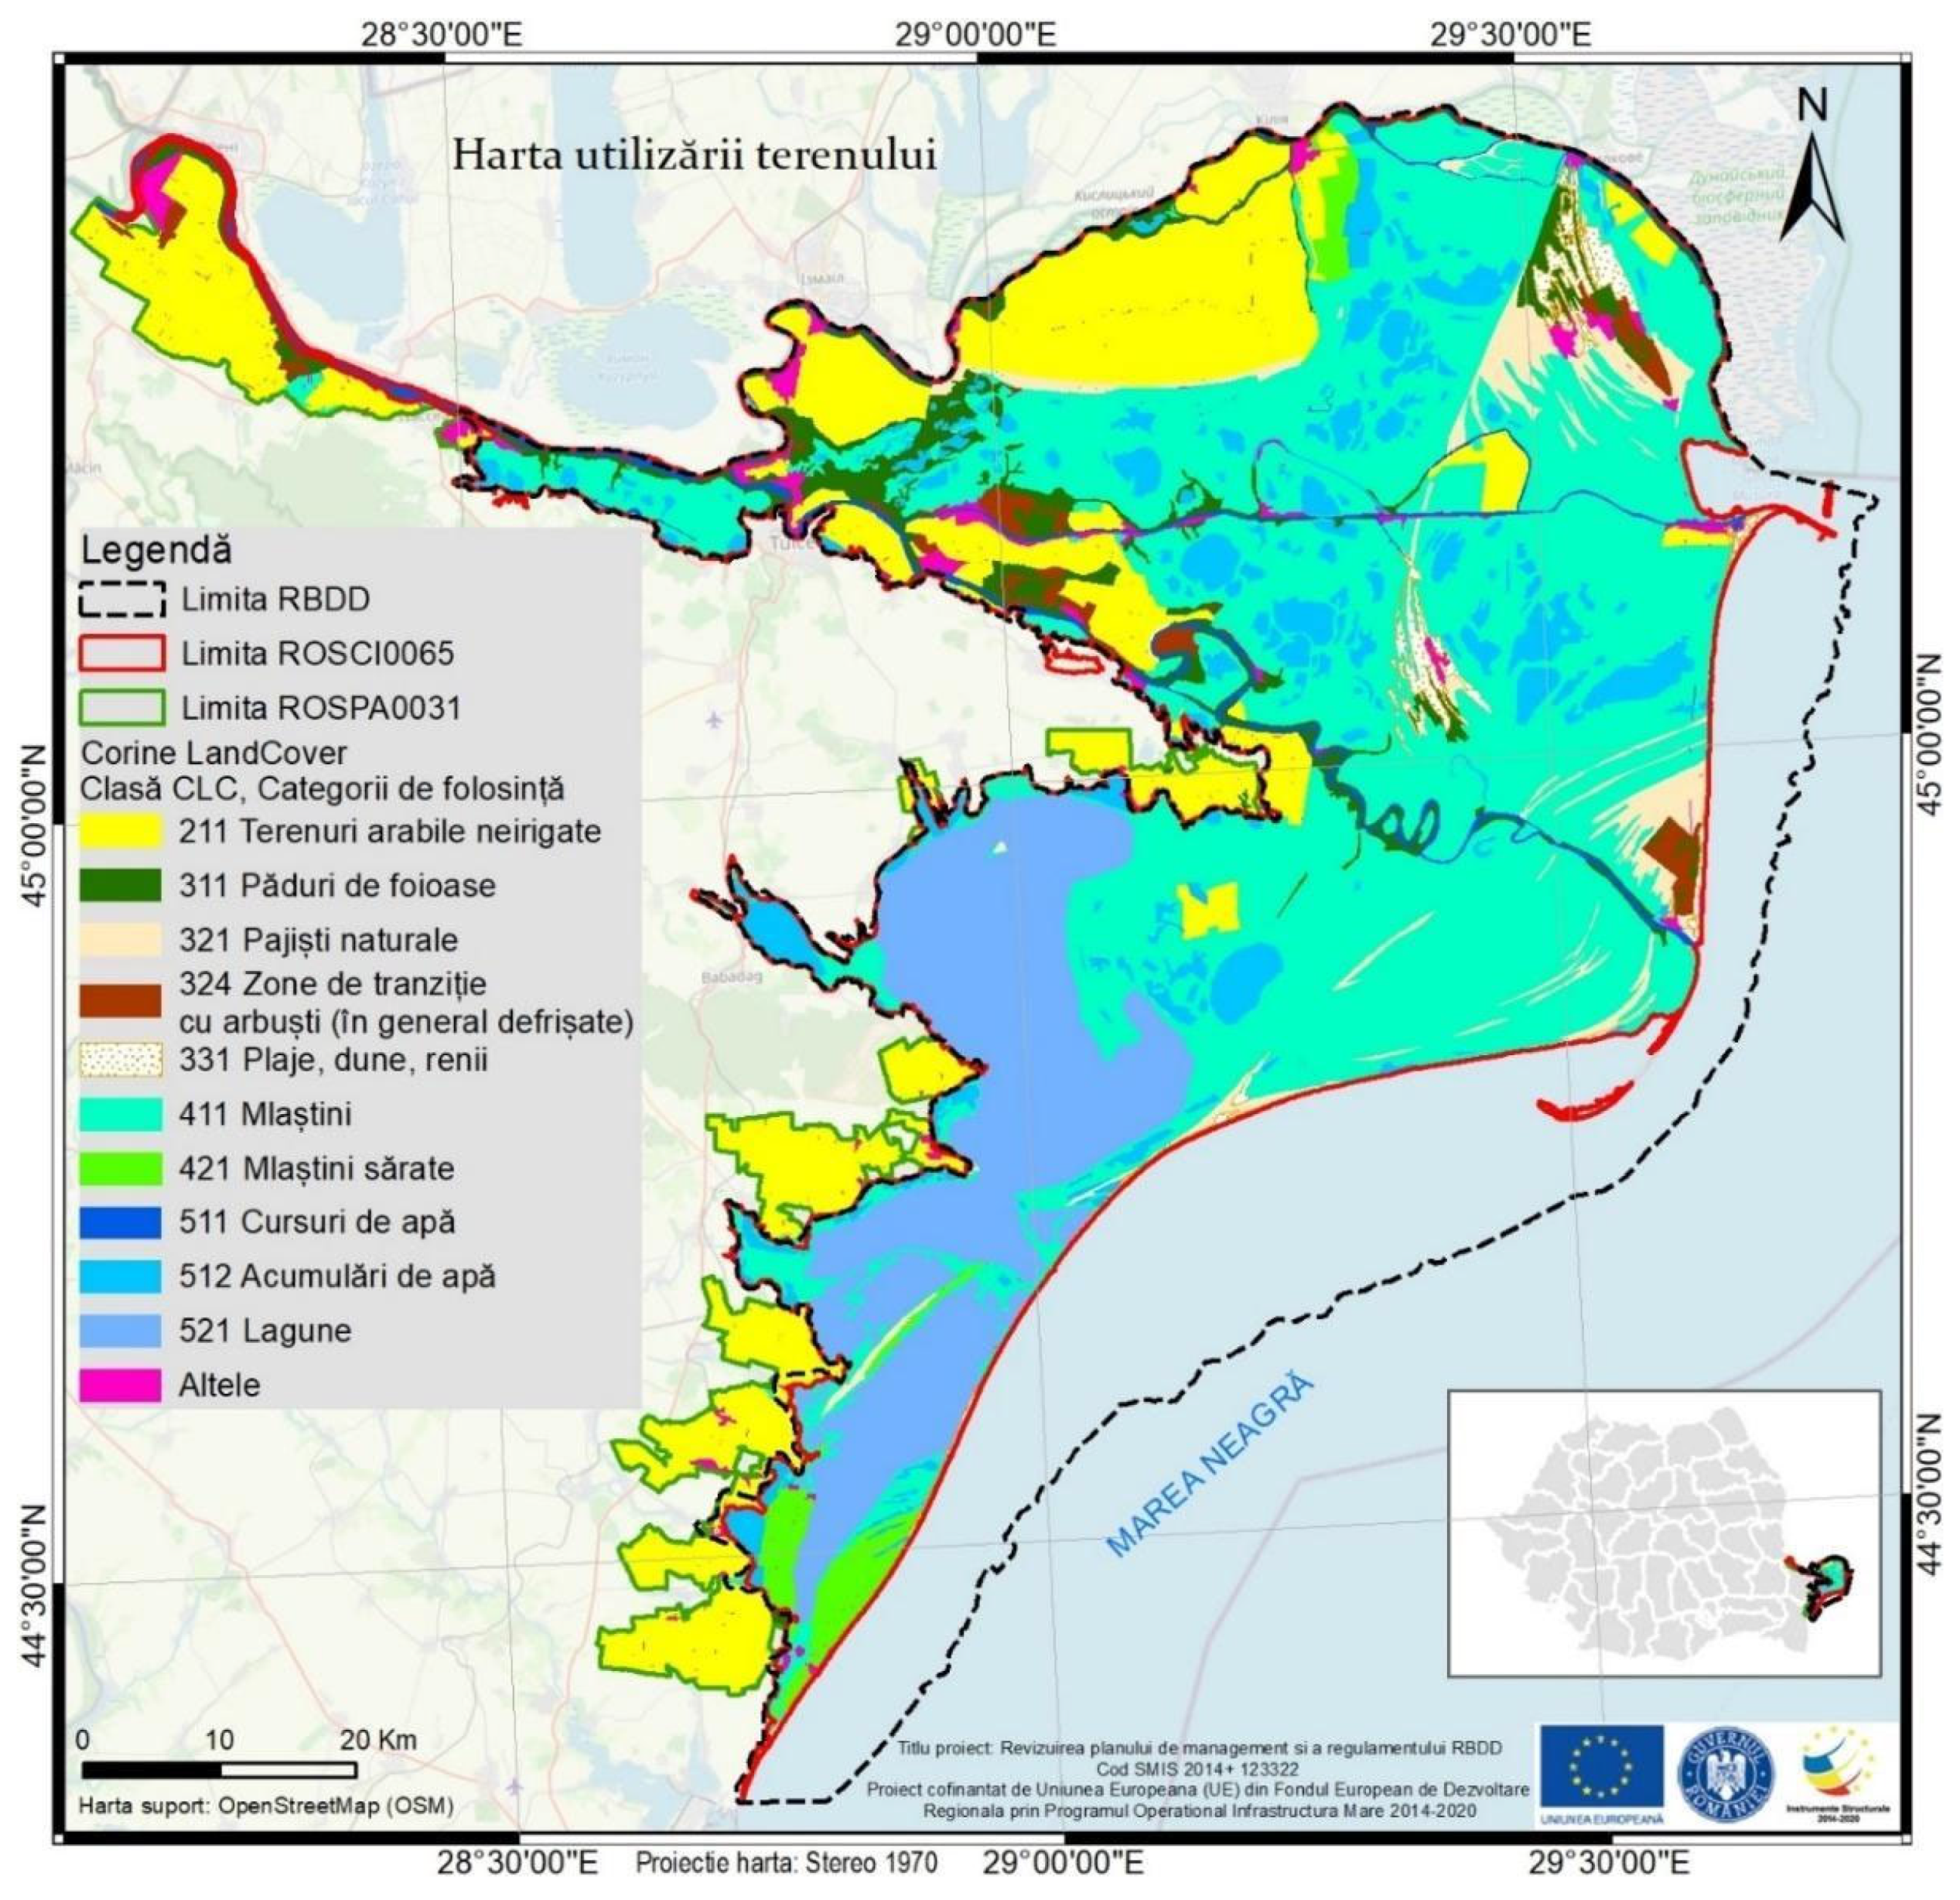
Figure 2.
Focus Map of the human footprint source https://wcshumanfootprint.org/map/. The higher the intensity of the human footprint the darker the pink color. Green color indicates surface area of water basins and river stretches.
Figure 2.
Focus Map of the human footprint source https://wcshumanfootprint.org/map/. The higher the intensity of the human footprint the darker the pink color. Green color indicates surface area of water basins and river stretches.
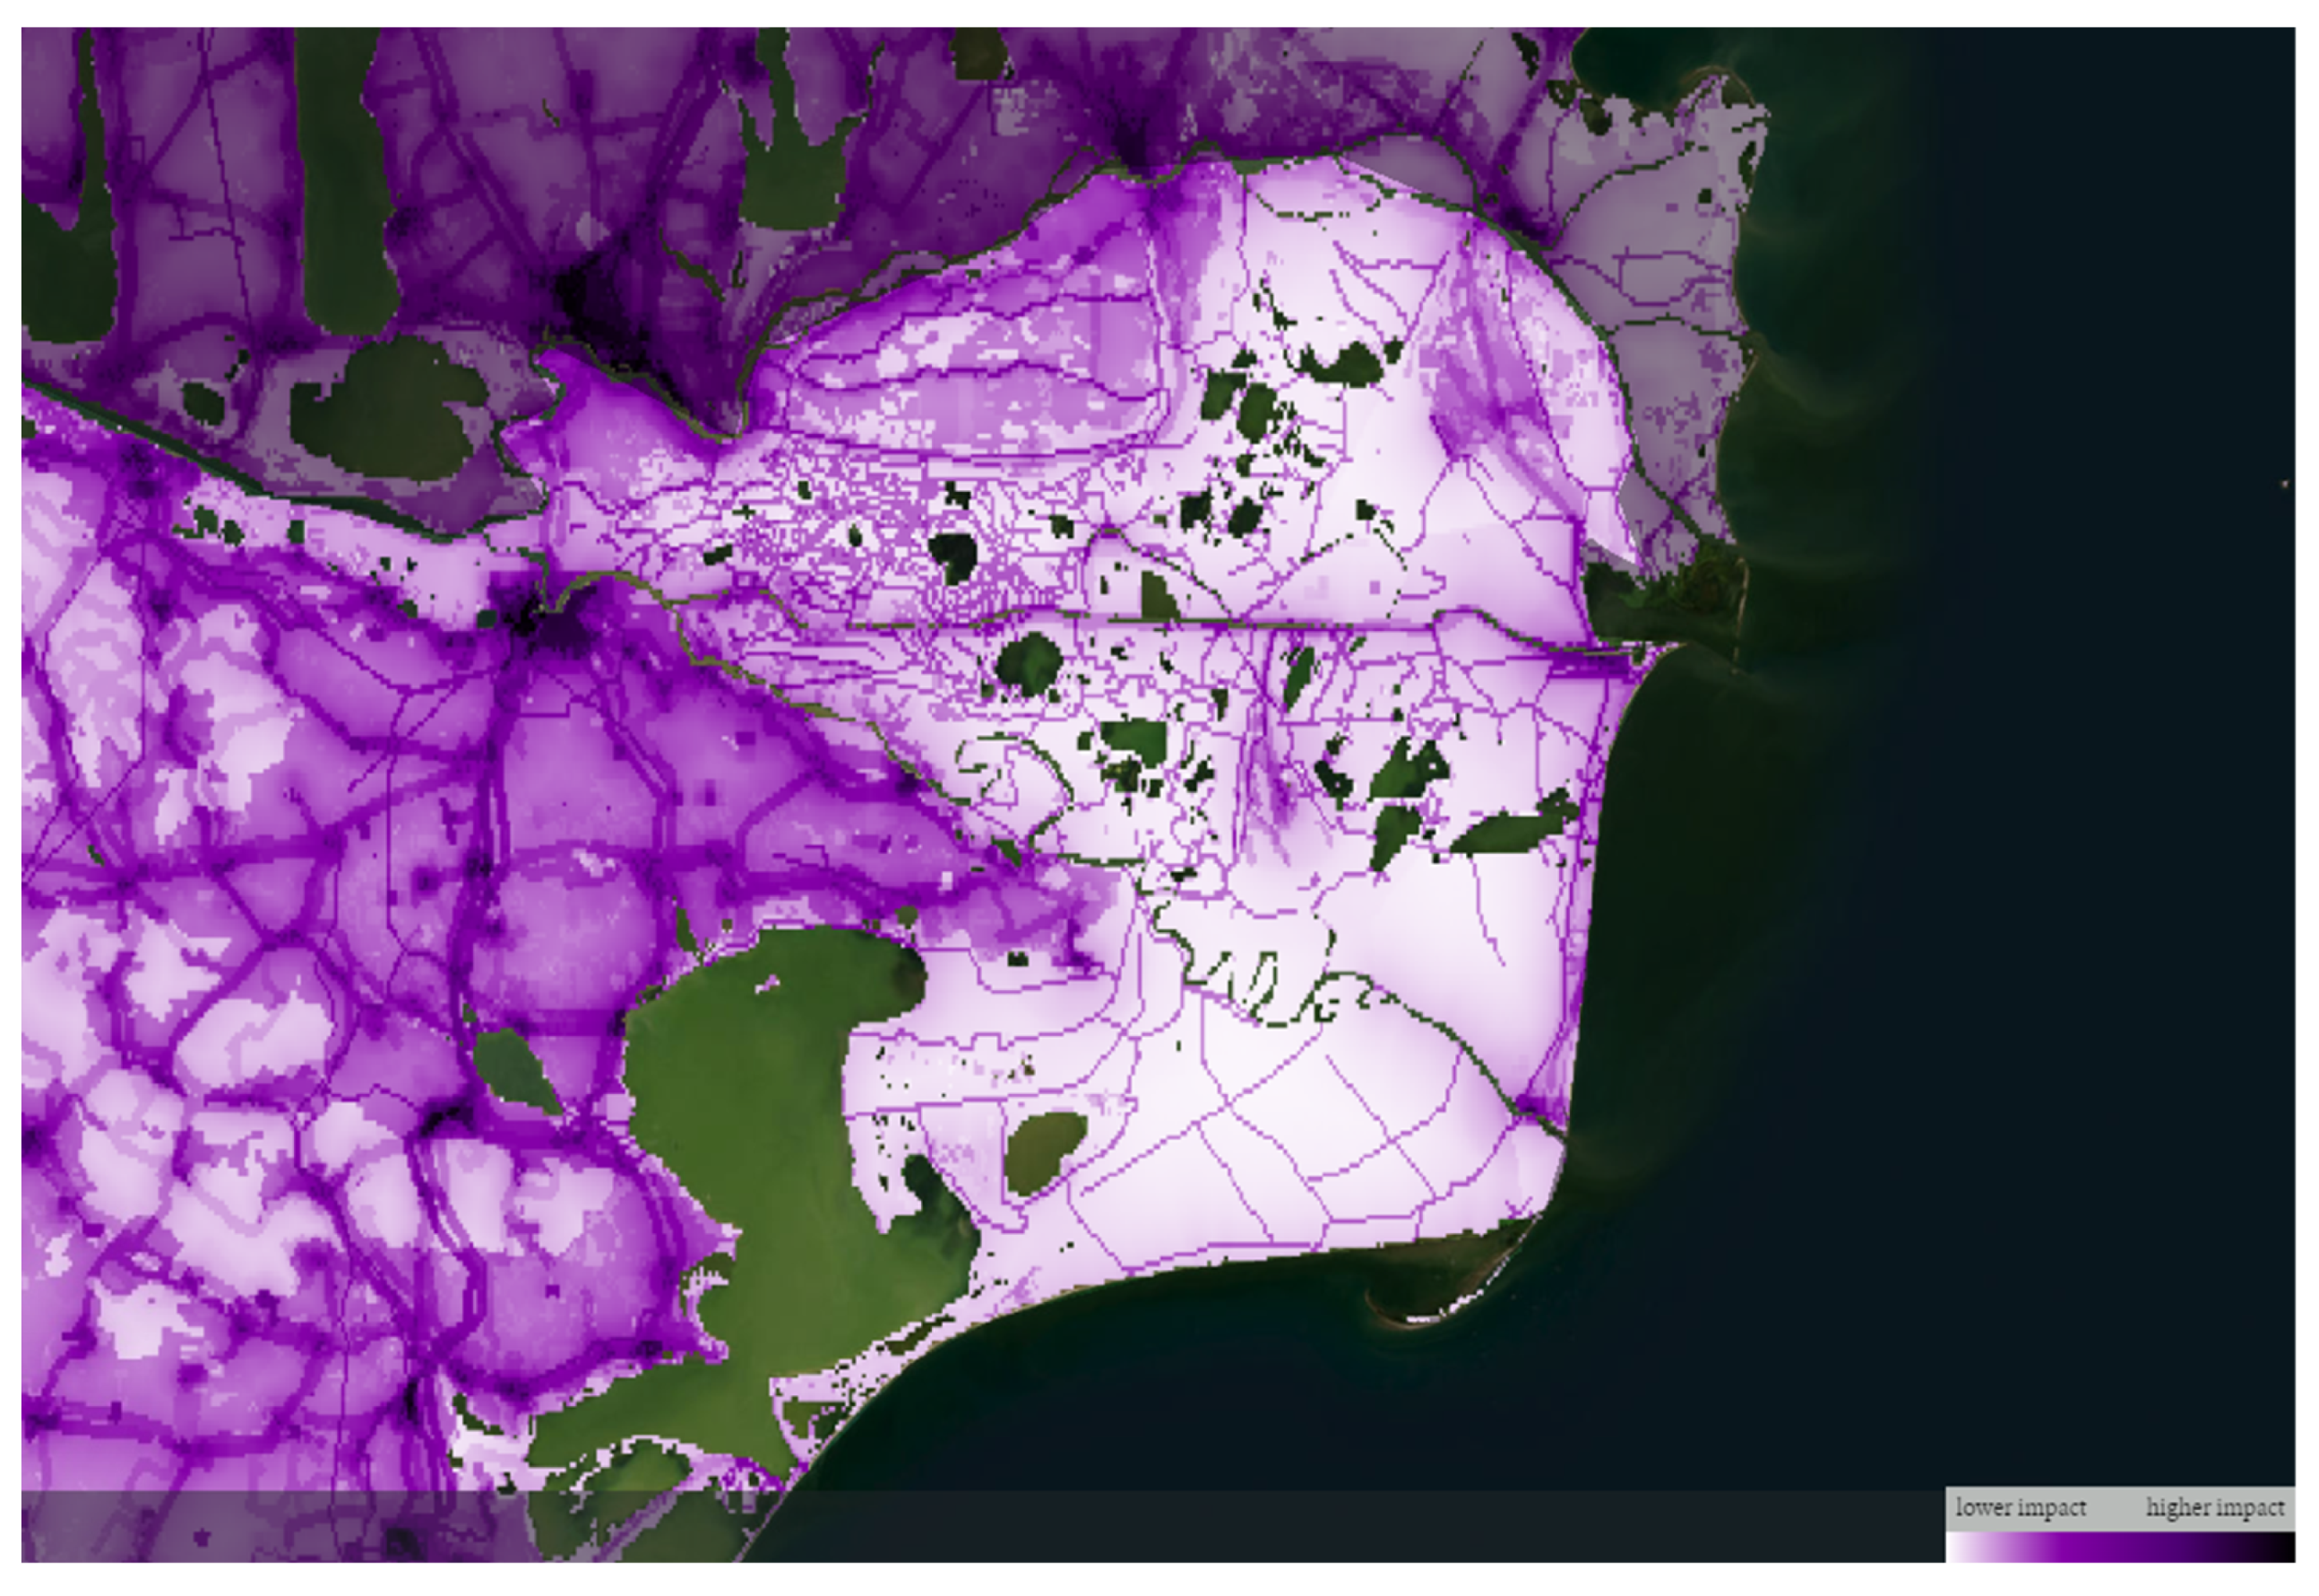
Figure 3.
Focus Map of tourist attractions and viewpoints on the surface of protected natural areas Danube Delta Biosphere Reserve, ROSPA0031 Danube Delta and Razim-Sinoie Complex and Danube Delta ROSCI0065.
Figure 3.
Focus Map of tourist attractions and viewpoints on the surface of protected natural areas Danube Delta Biosphere Reserve, ROSPA0031 Danube Delta and Razim-Sinoie Complex and Danube Delta ROSCI0065.
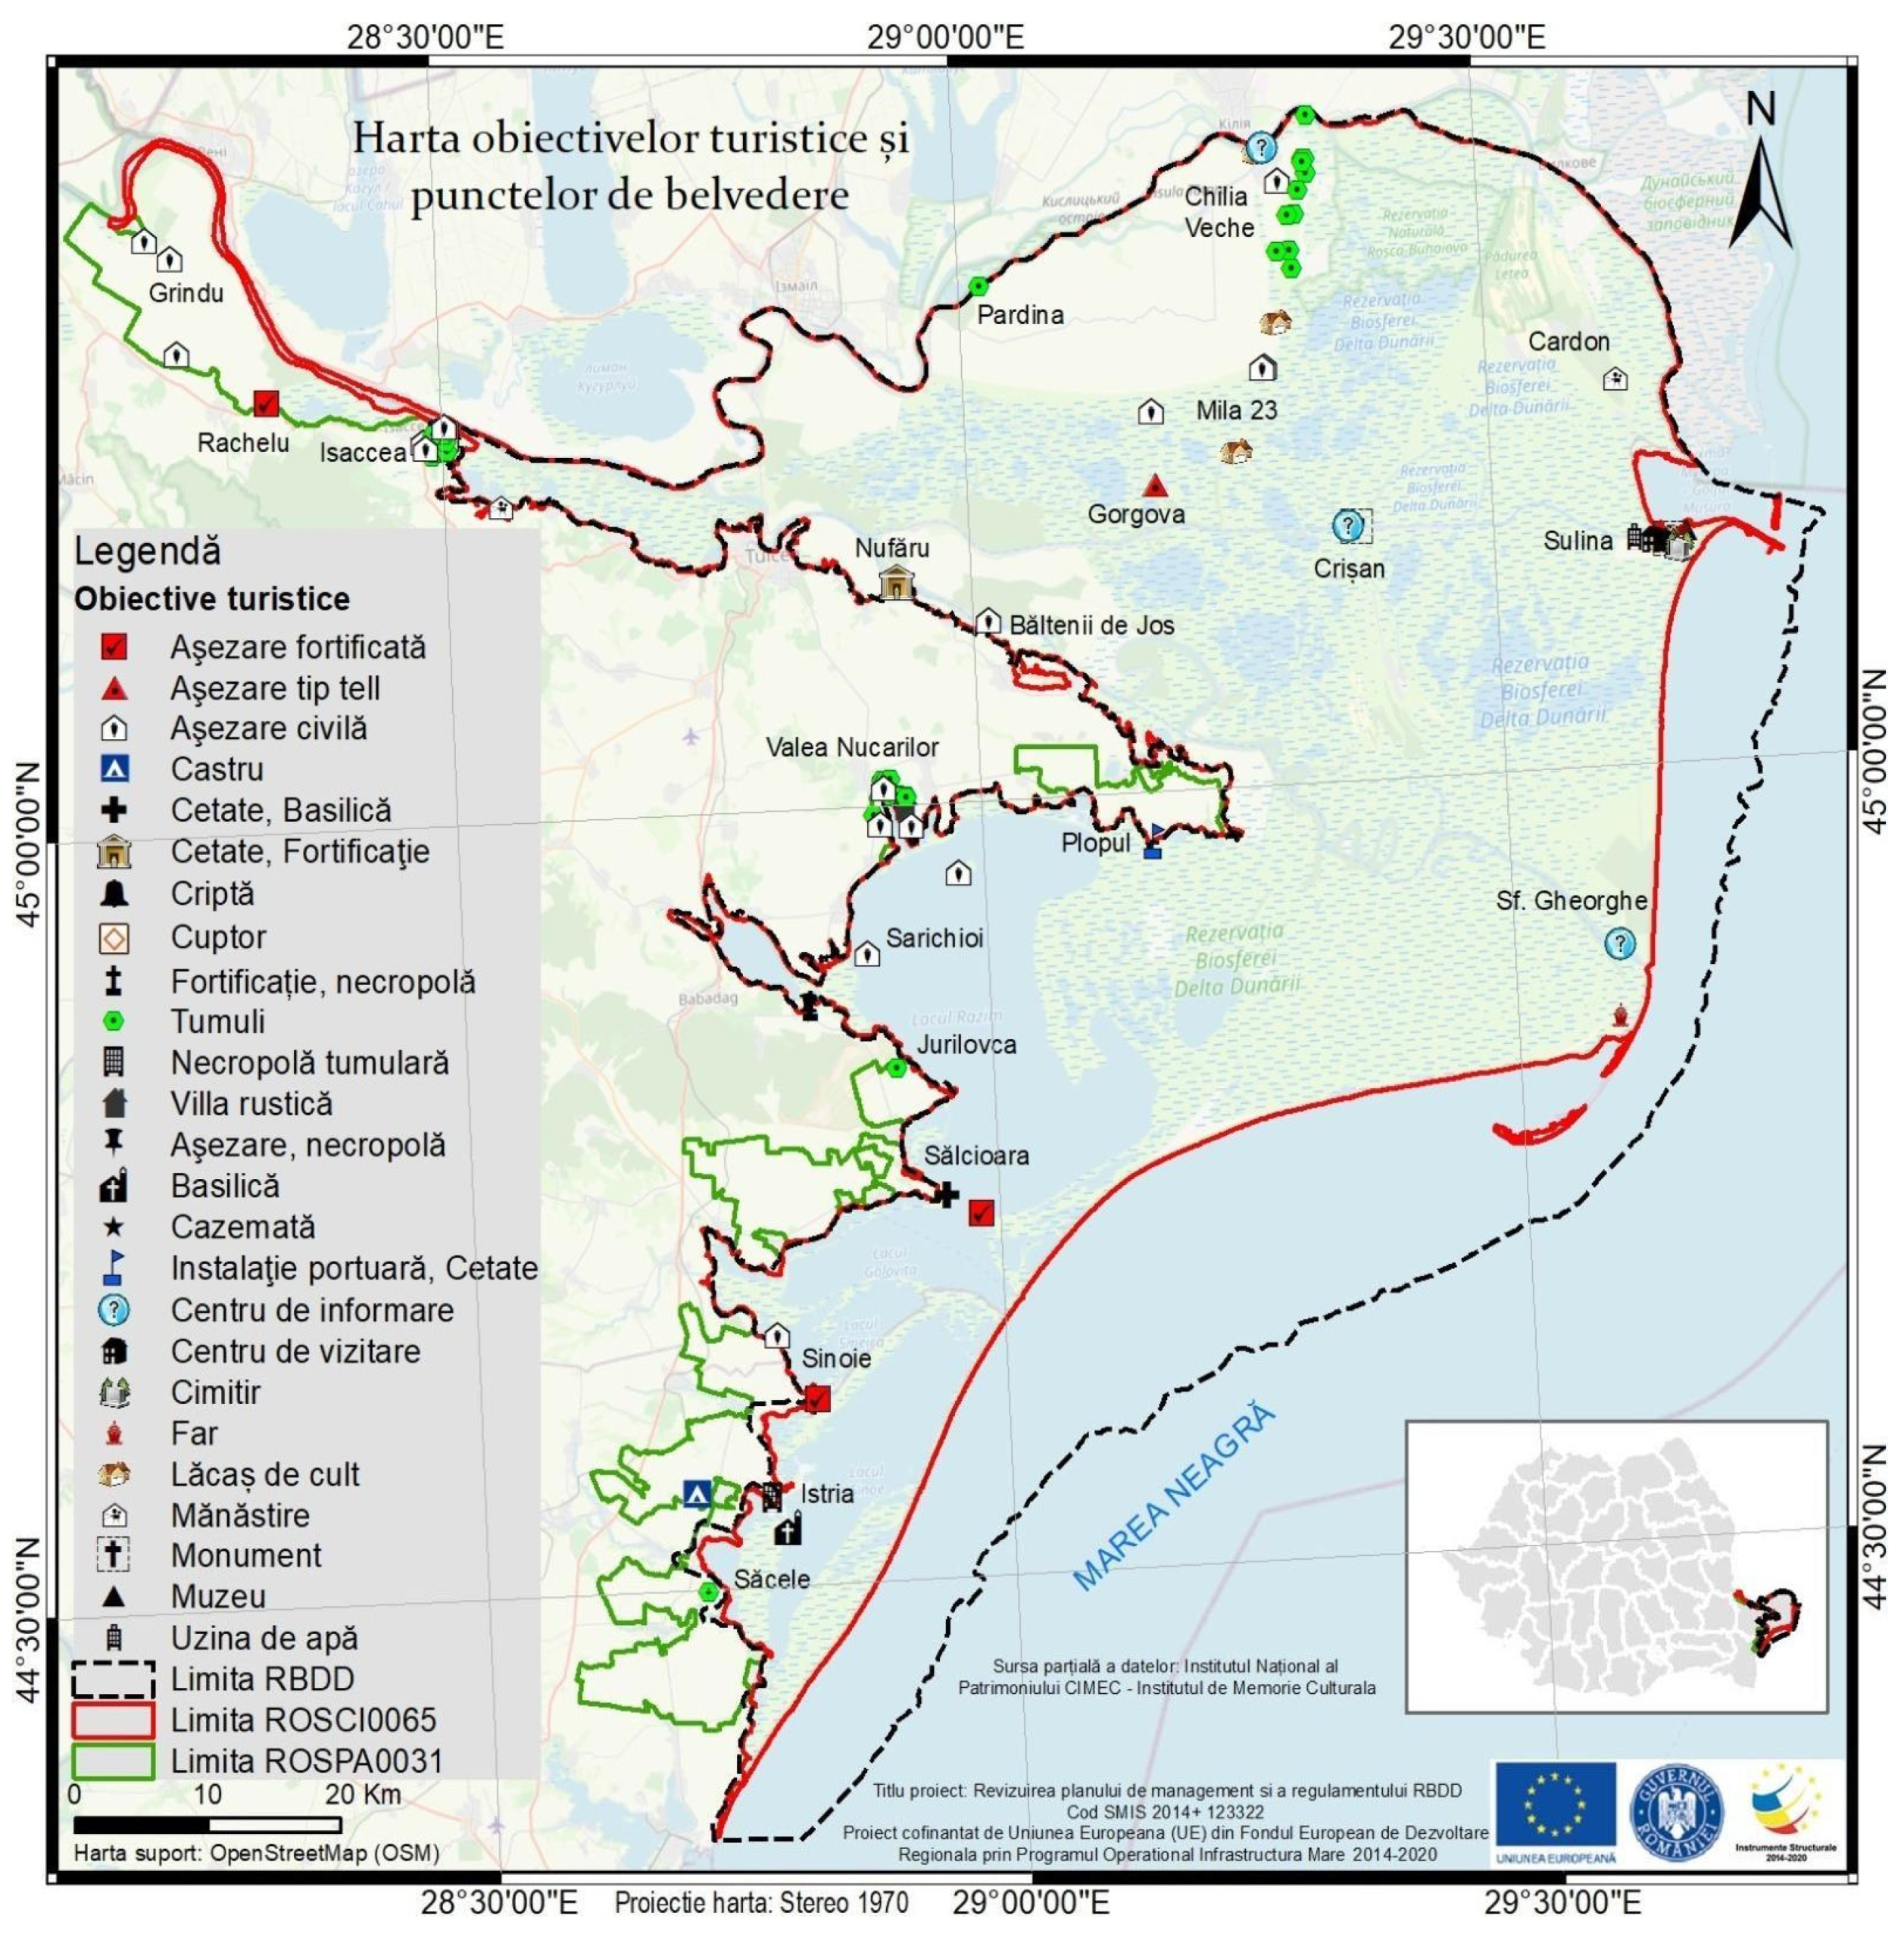
Figure 4.
Focus Map of tourist and recreational areas at DDBR level (source: 5.2.1 Map of current pressures and their intensity at the level of the protected natural area - P.1500/Review of the management plan and DDBR regulation). Translation of the color legend: intensity of identified pressure: red - high, yellow brown – medium, yellow -low; Limita ROSCIOO65=territorial limits of the Danube Delta Site of Community Importance ROSCI0065, in a total area of 453645.5 ha; LIMITA ROSPA0031= territorial limits of Special avifaunistic protection area ROSPA0031 Danube Delta and Razim-Sinoie Complex, in a total area of 508302.3 ha.
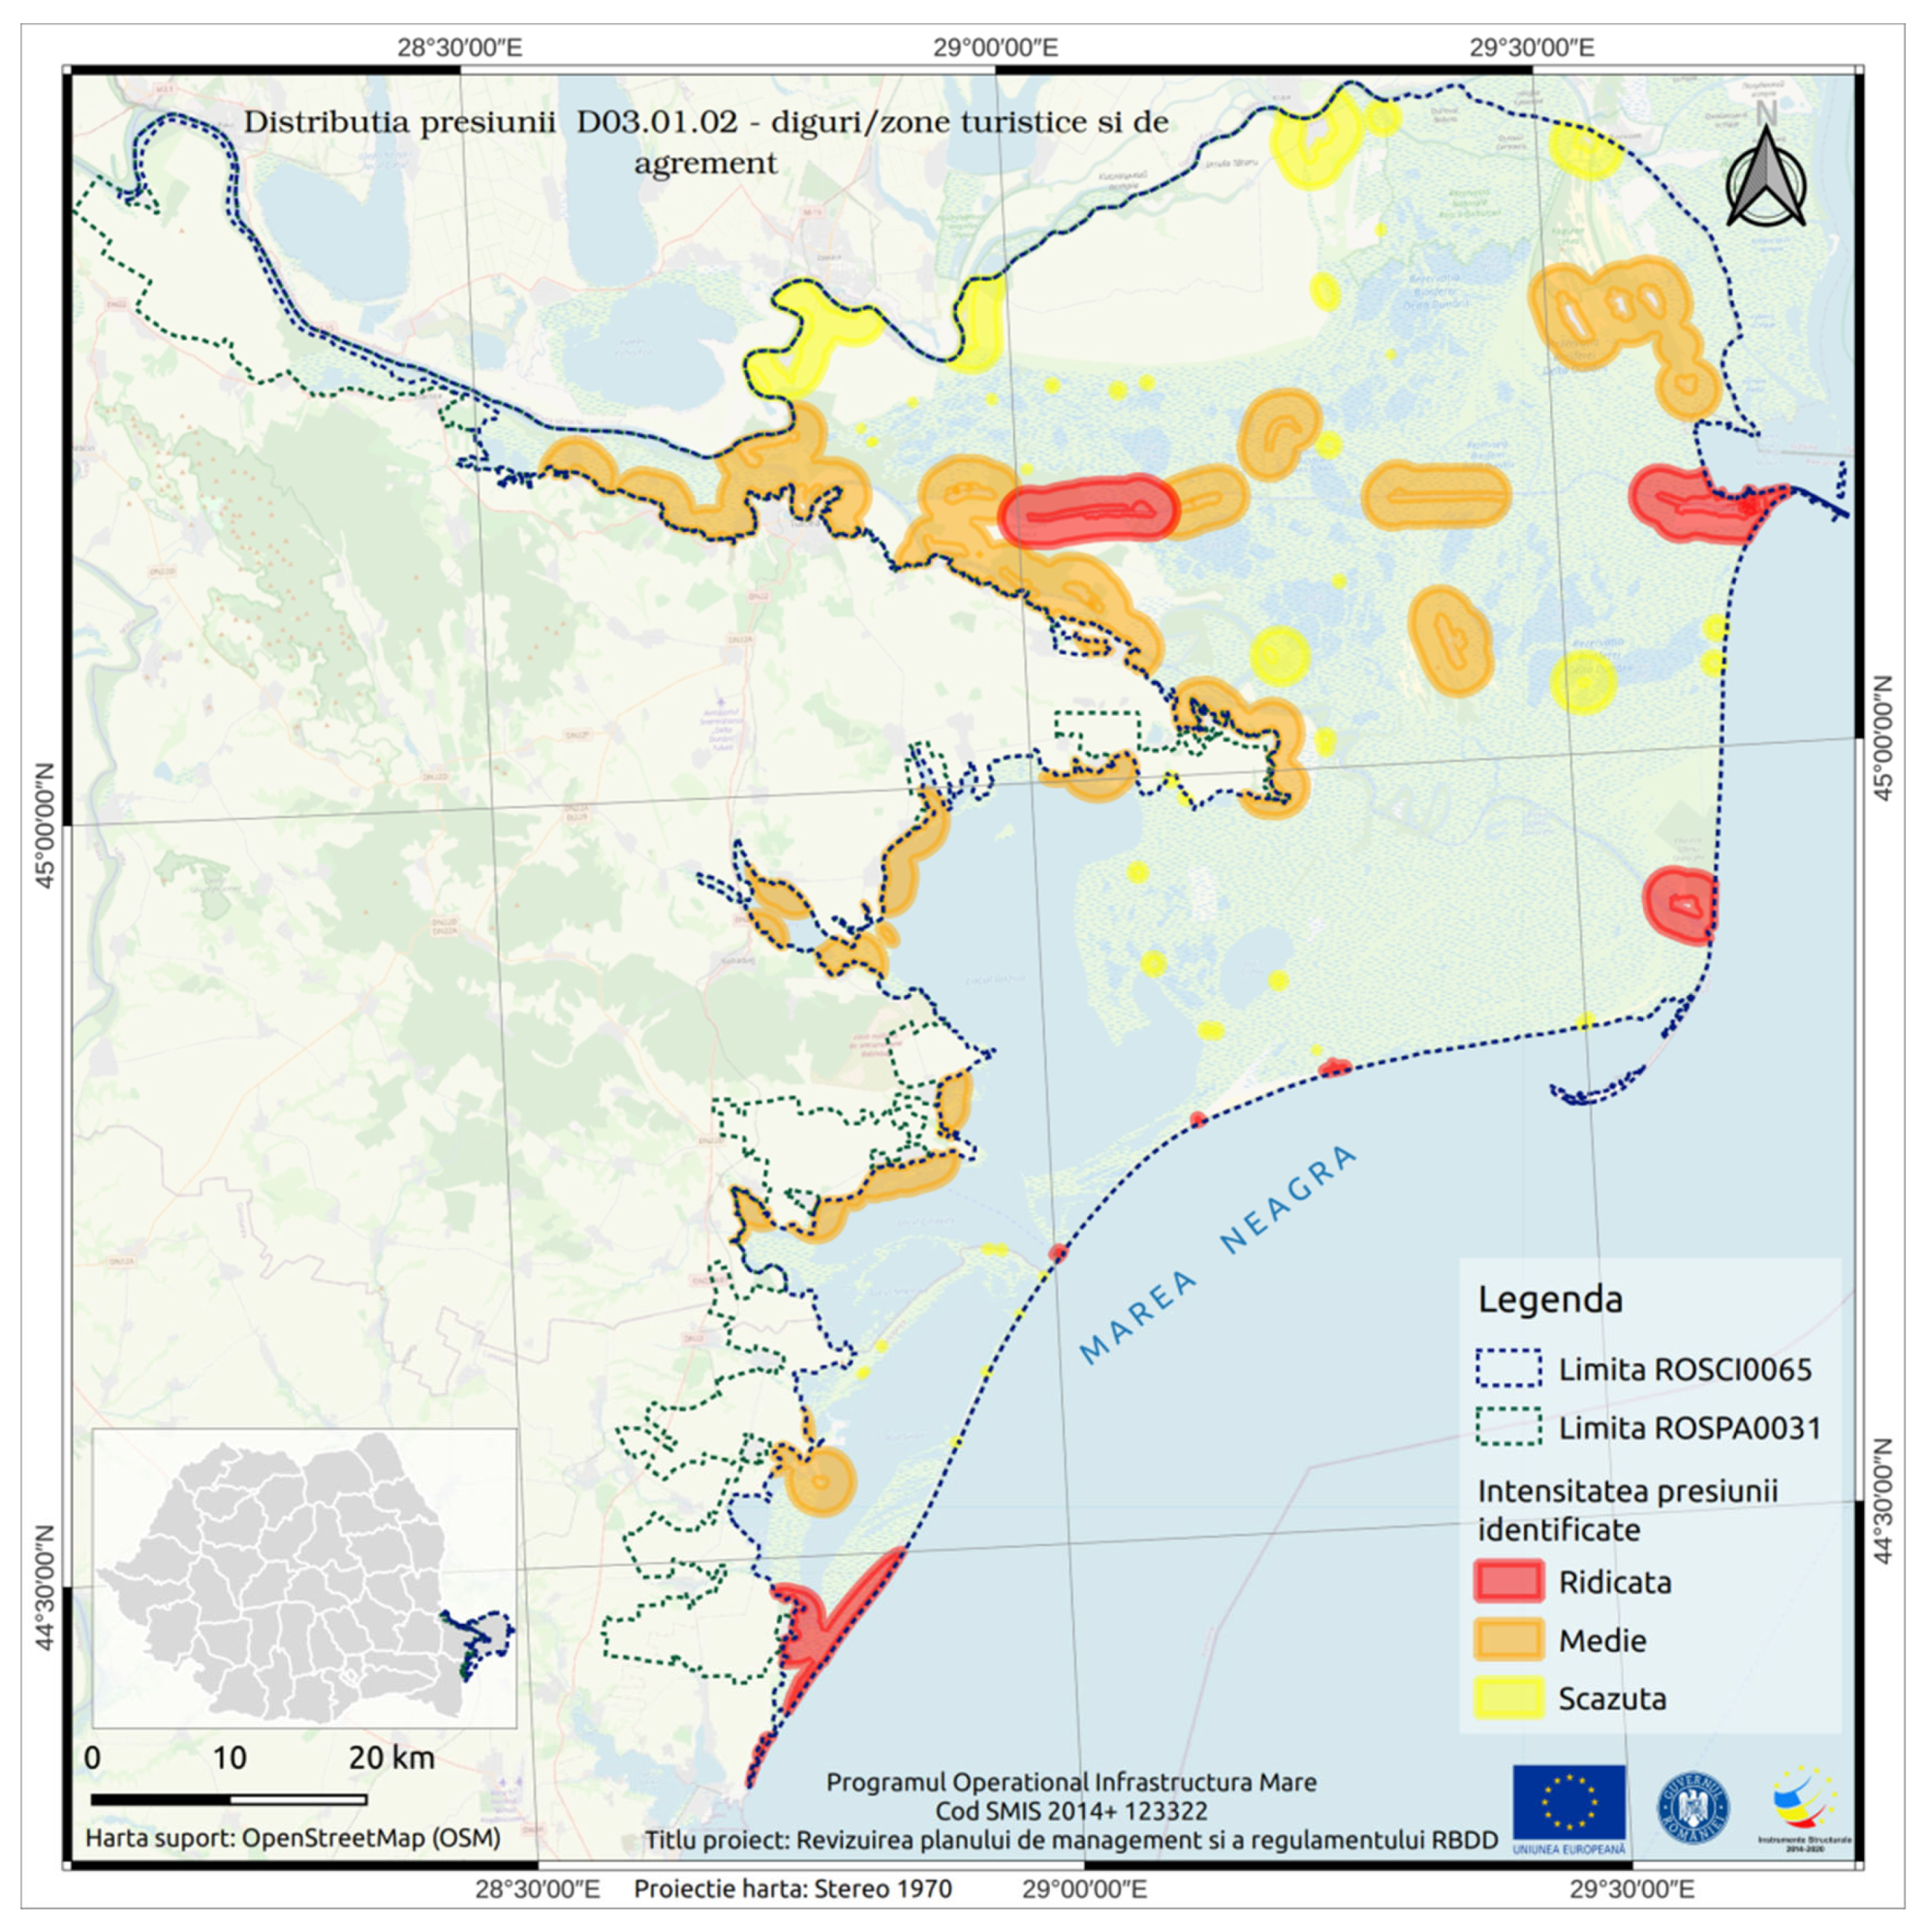
Figure 5.
Focus Map of the total number of overnight stays in tourist accommodation structures within the administrative limits of Tulcea County for 2020. Translation of the color legend: yellow: between 0-1000 overnight stays; yellow brown: between 1000-5000 overnight stays; orange: between 5000-10000 overnight stays; intense orange: between 10000-25000 overnight stays; red: between 25000-50000 overnights stays; intense red: between 50000-100000 overnight stays.
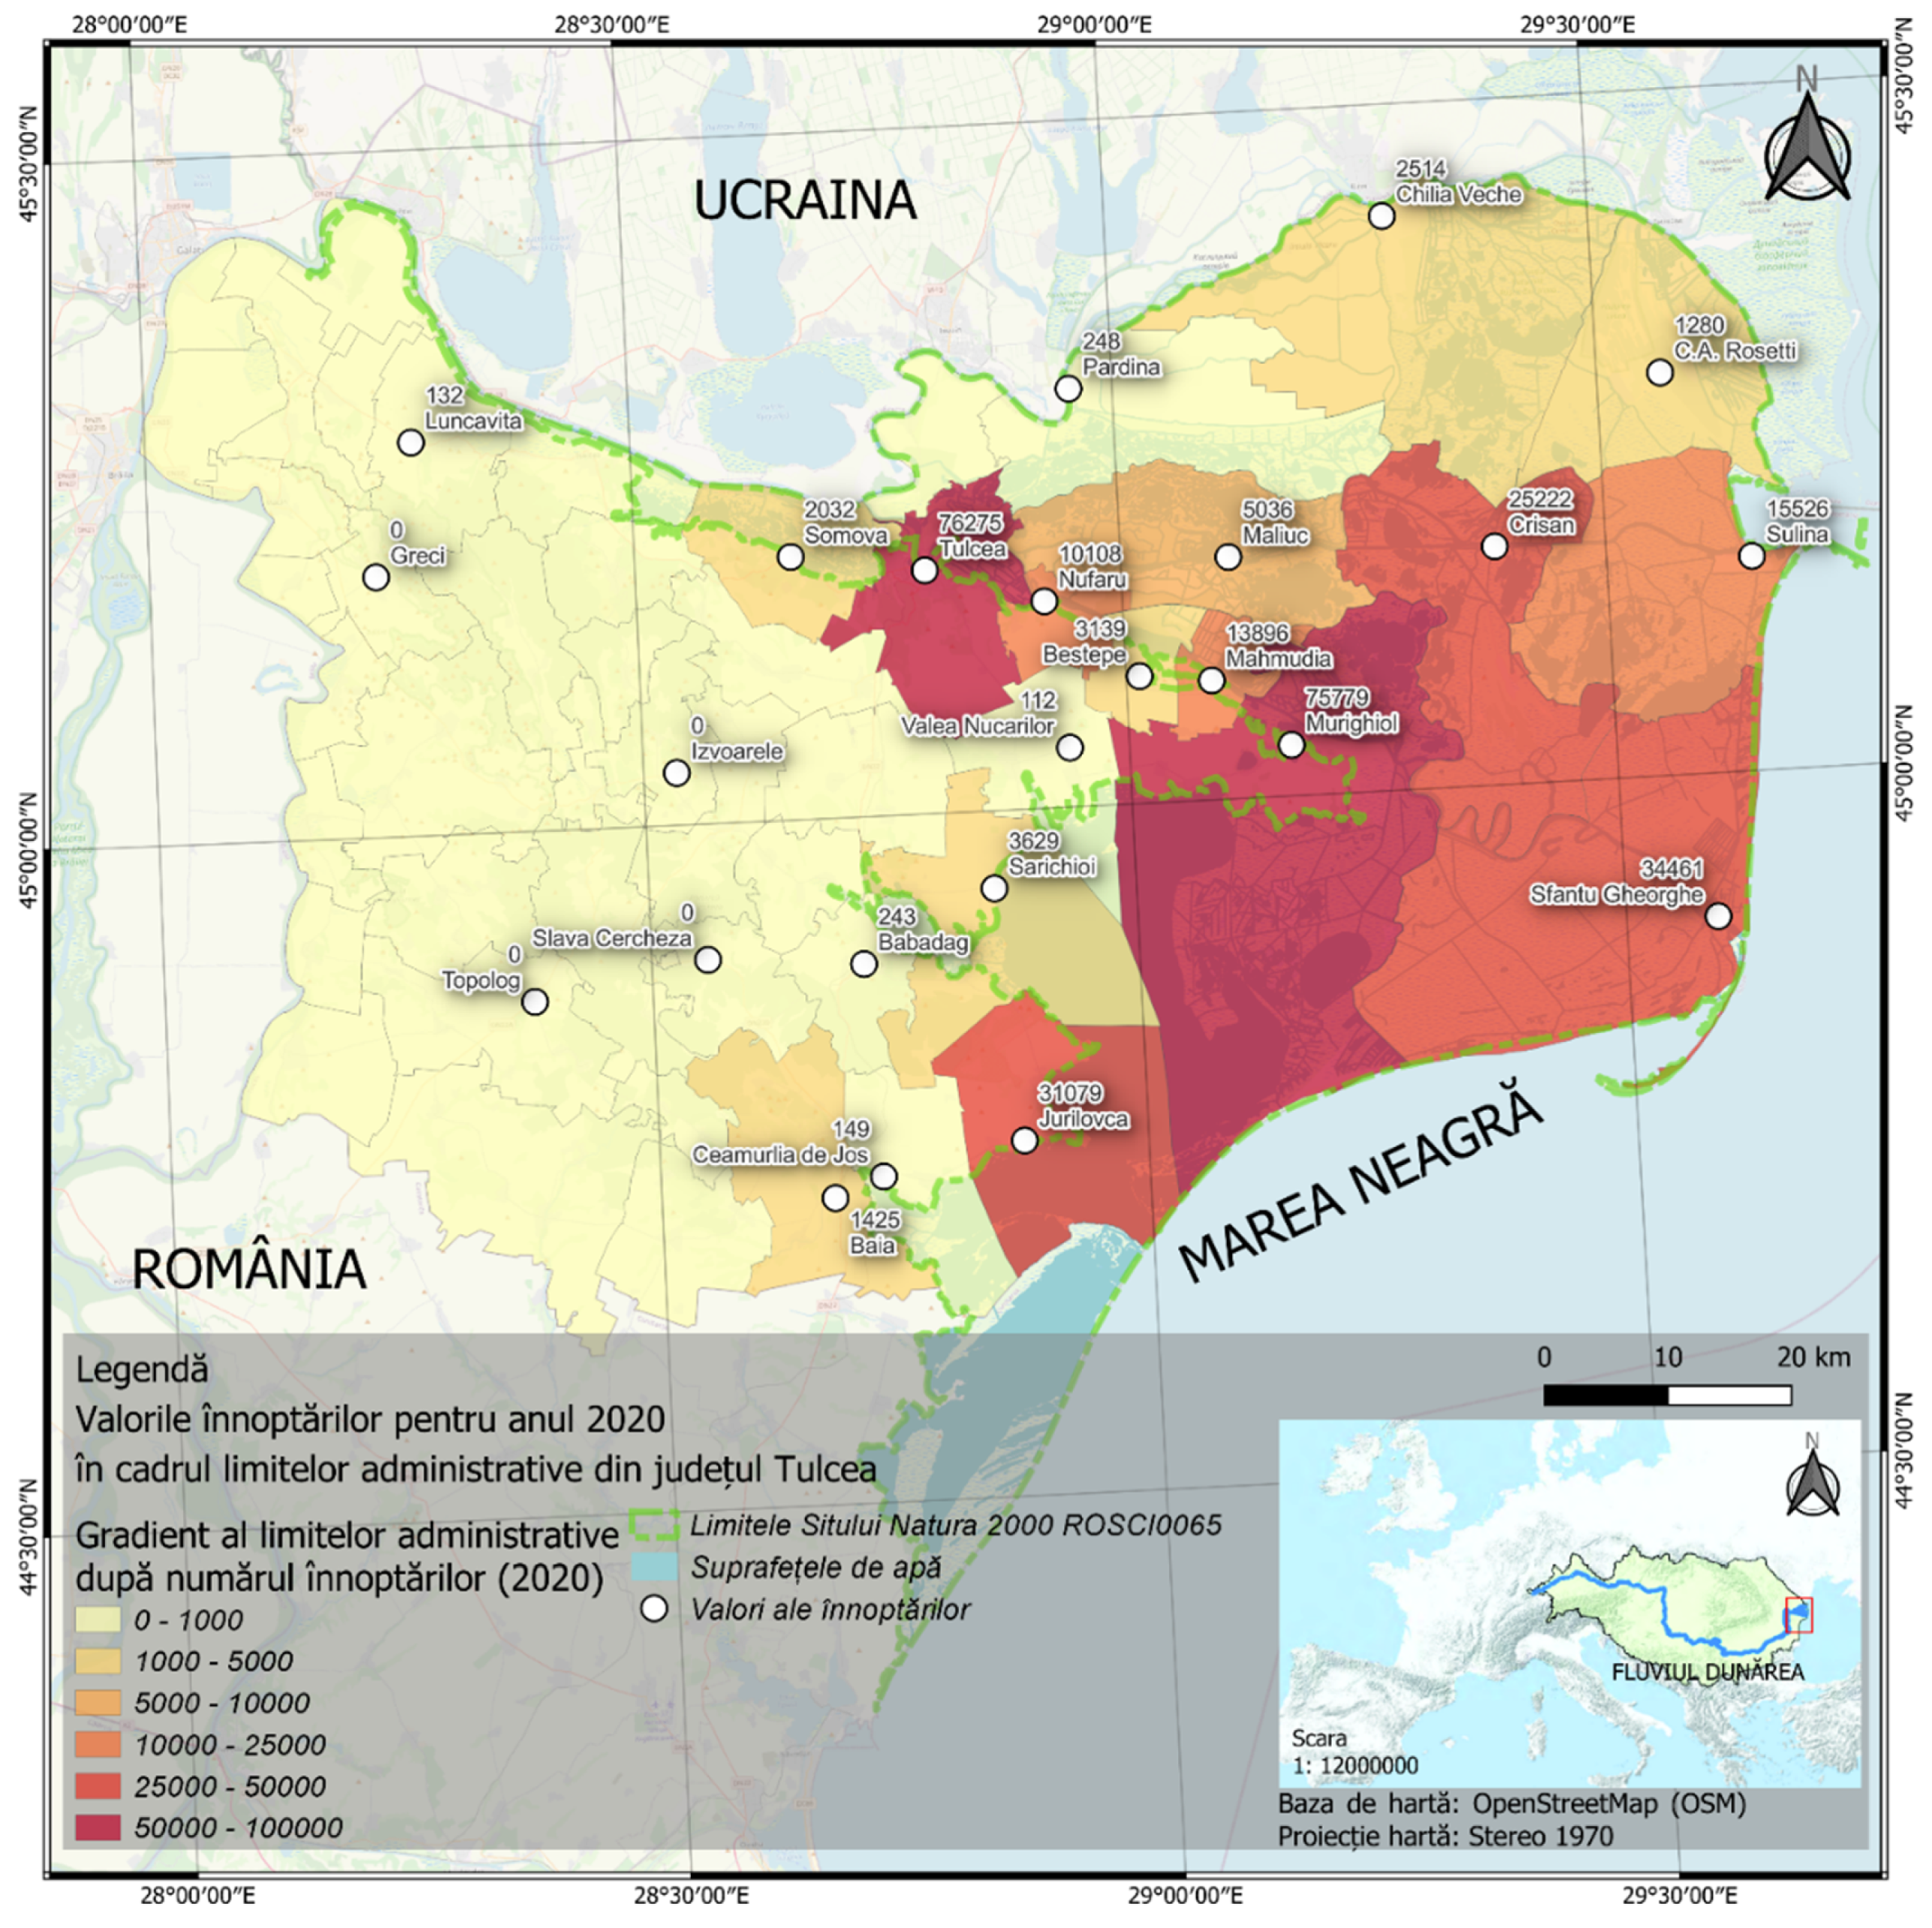
Figure 6.
Focus Map of the total number of overnight stays in tourist accommodation structures within the administrative limits of Tulcea County for 2021. Translation of the color legend: yellow: between 0-1000 overnight stays; yellow brown: between 1000-5000 overnight stays; orange: between 5000-10000 overnight stays; intense orange: between 10000–25000-over-night stays; red: between 25000-50000 overnights stays; intense red: between 50000-100000 overnight stays.
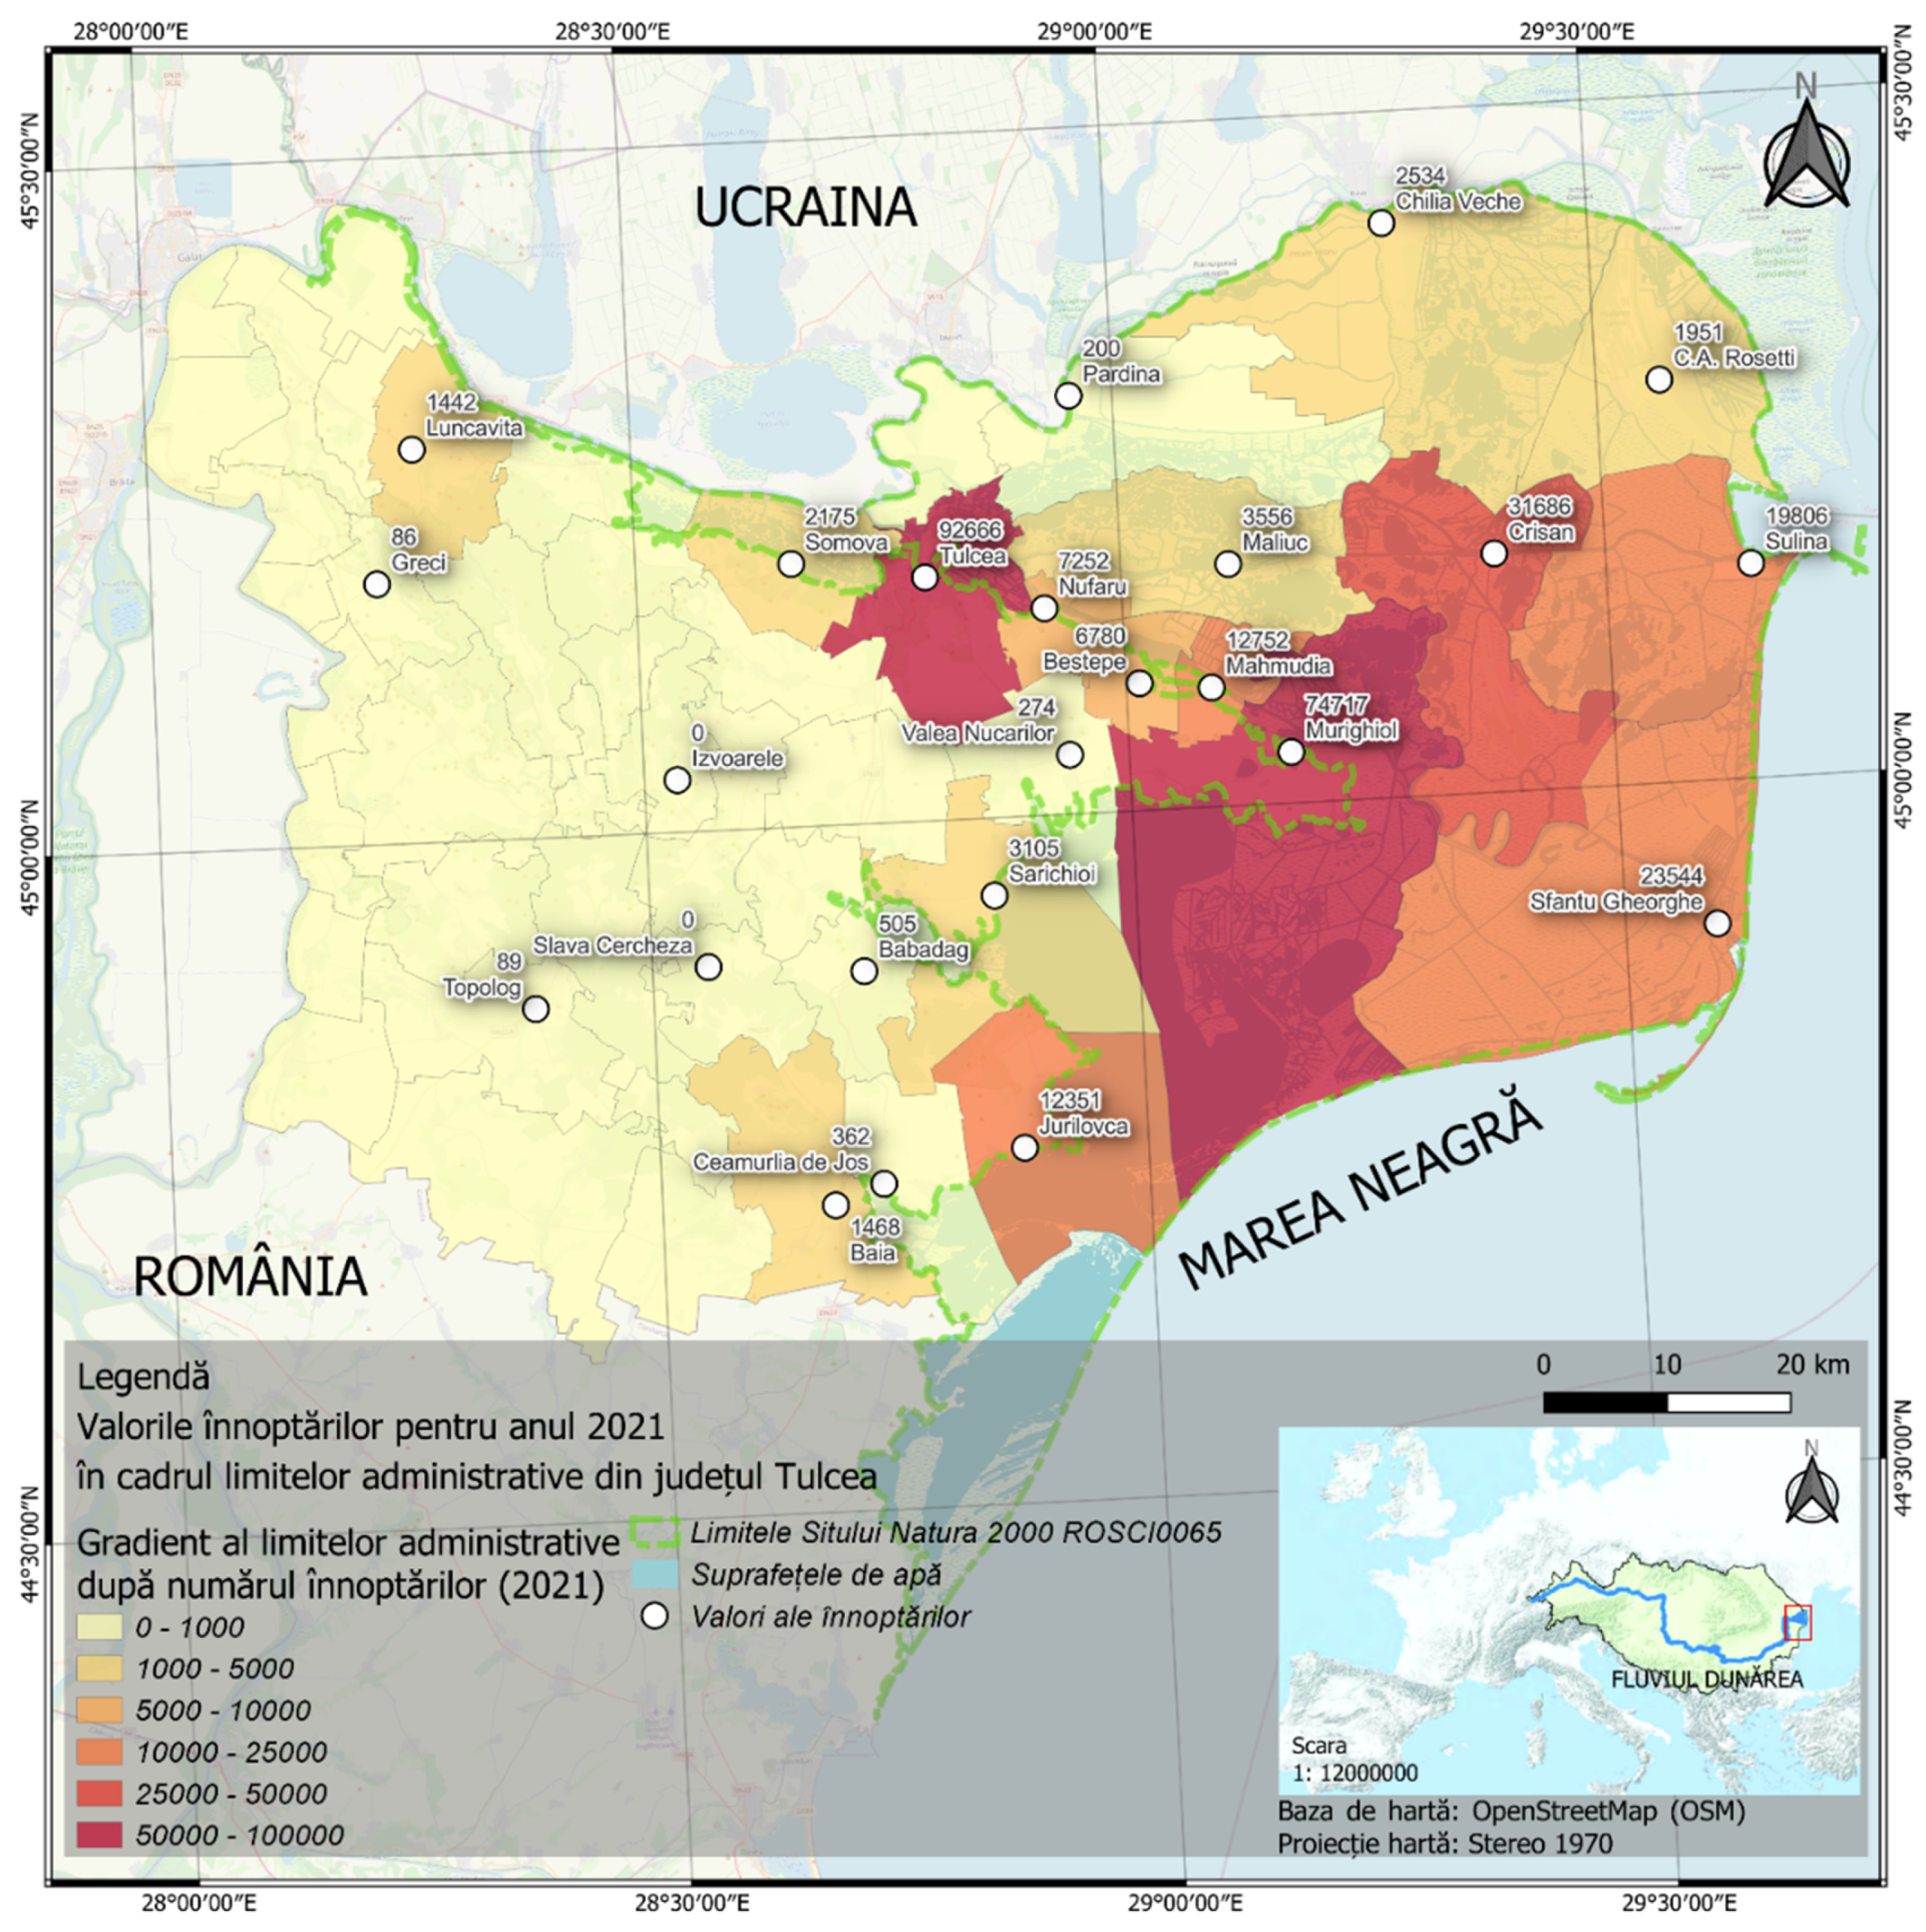
Figure 7.
Focus Map of the total number of overnight stays in tourist accommodation structures within the administrative limits of Tulcea County for 2022. Translation of the color legend: yellow: between 0-1000 overnight stays; yellow brown: between 1000-5000 overnight stays; orange: between 5000-10000 overnight stays; intense orange: between 10000–25000-over-night stays; red: between 25000-50000 overnights stays; intense red: between 50000-100000 overnight stays.
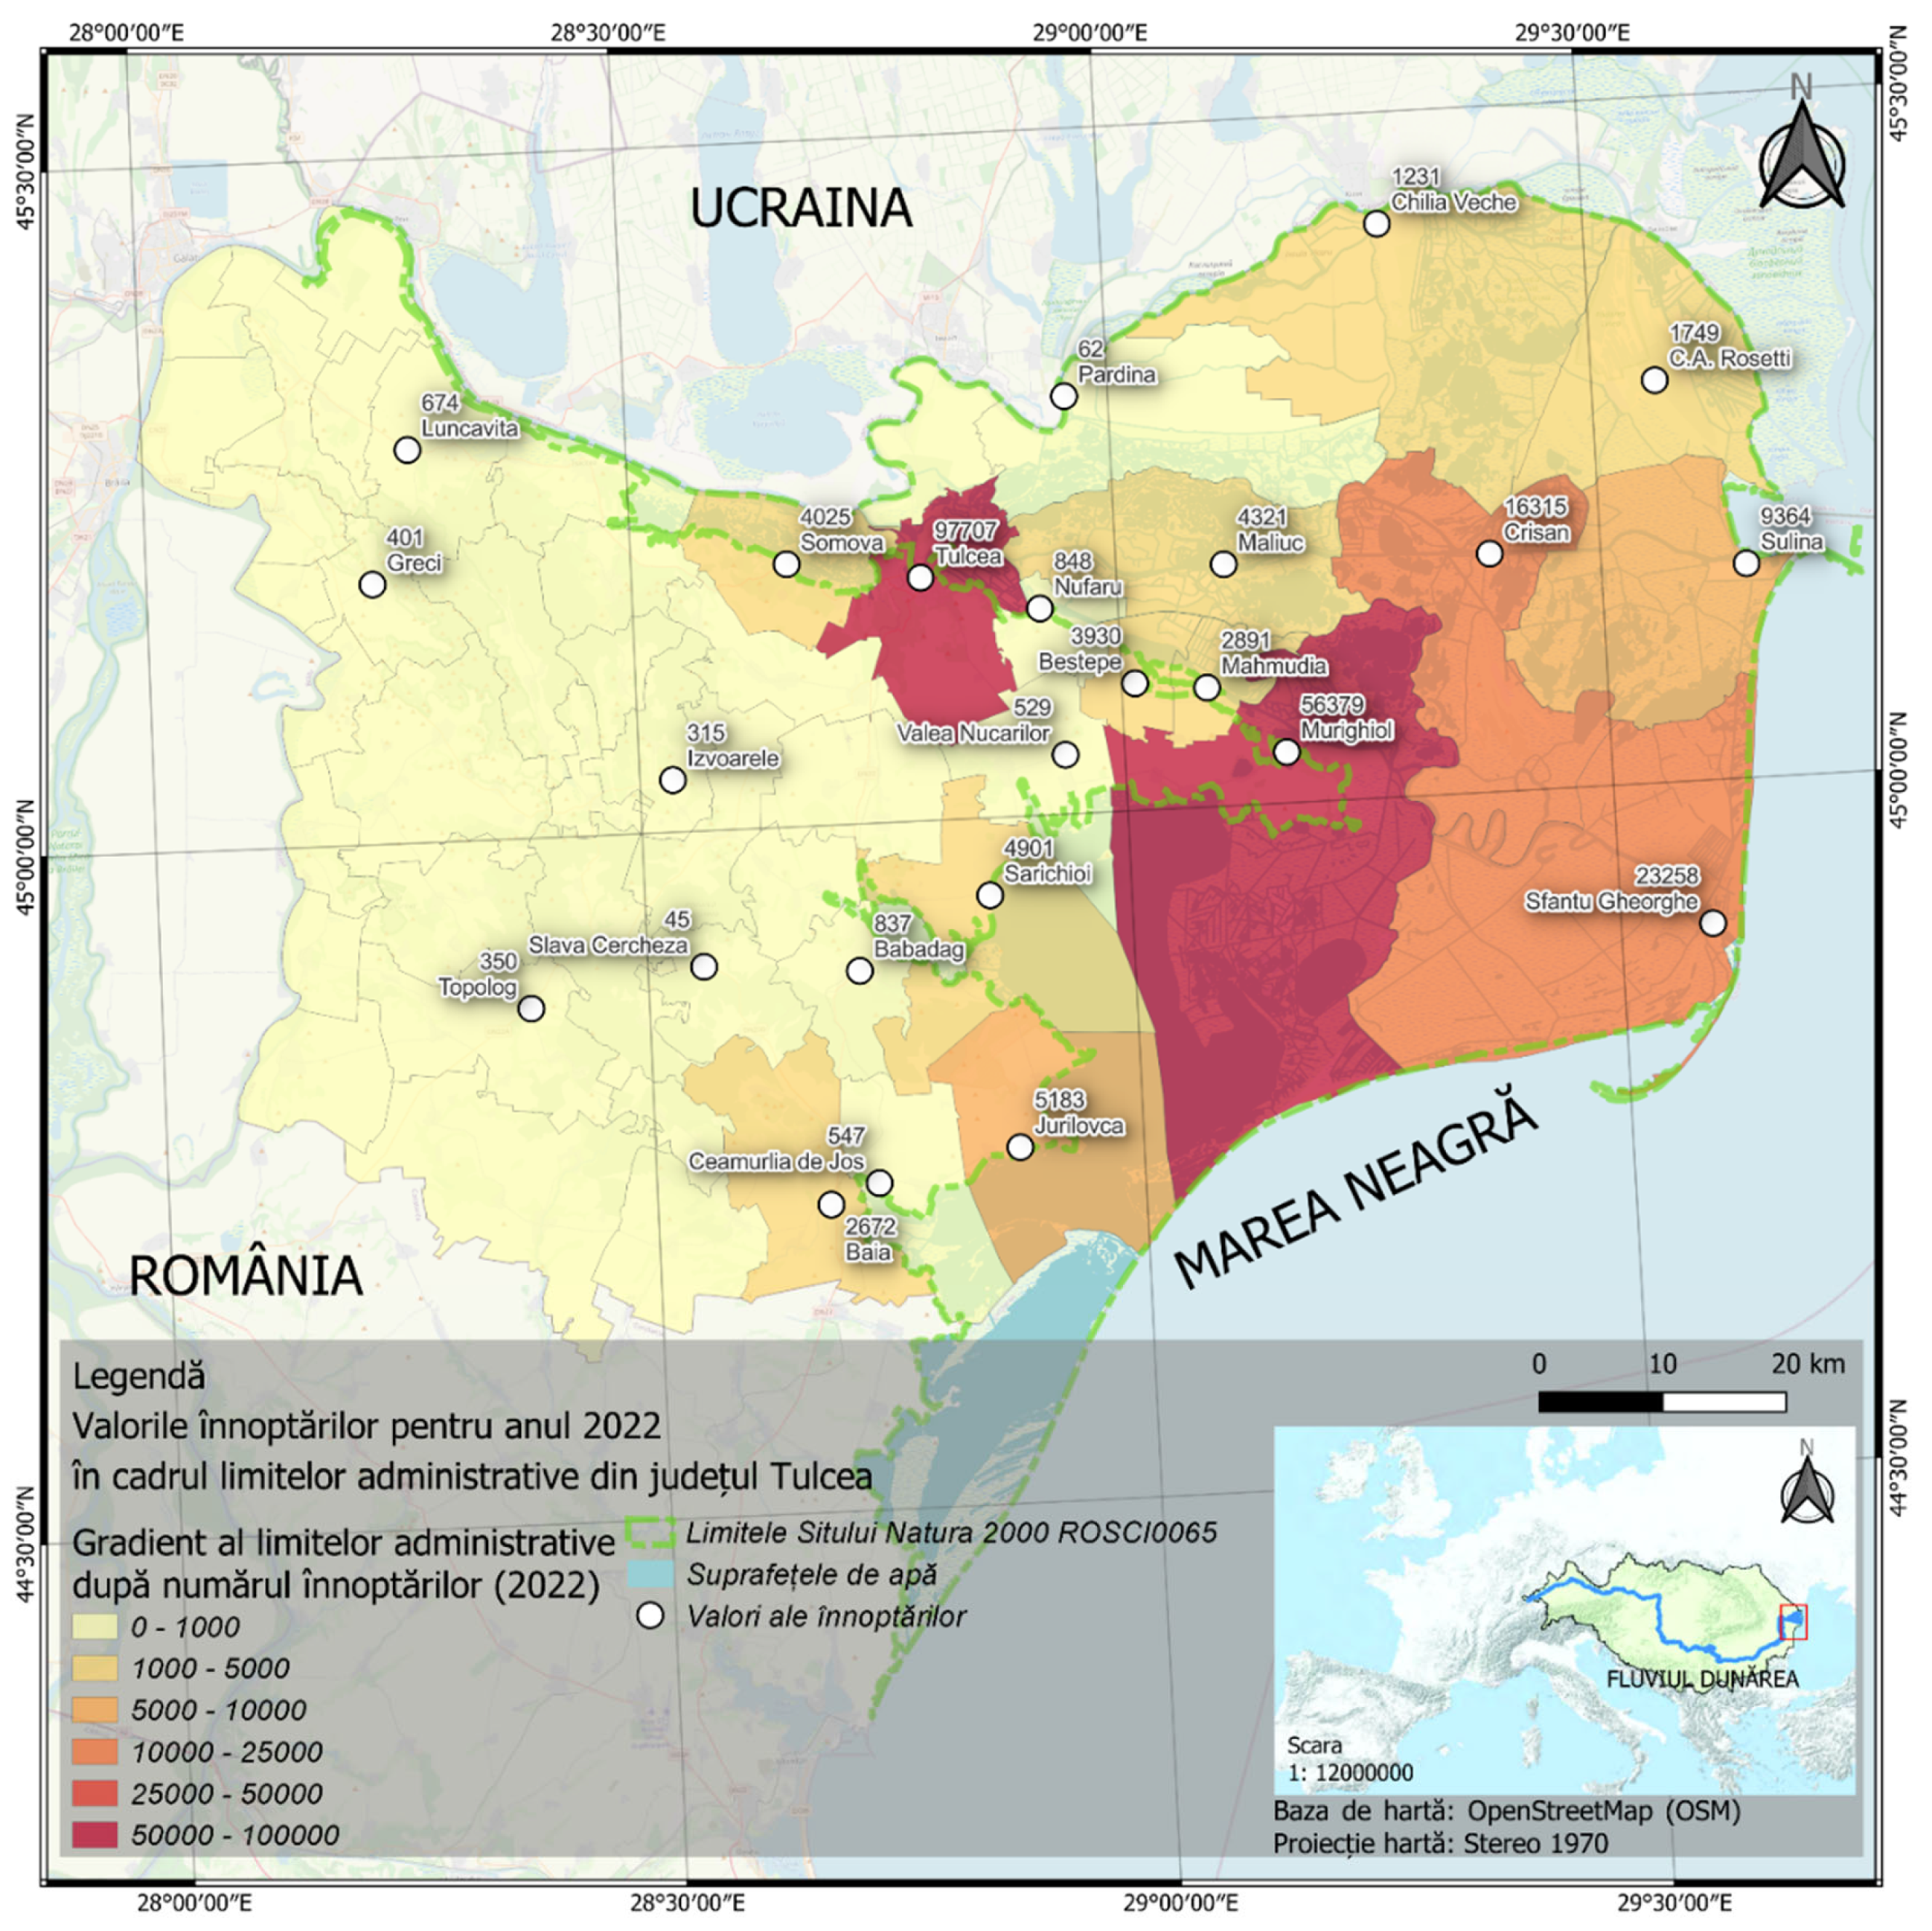
Figure 8.
Focus Map of pressure areas caused by intensive agriculture – source MANAGEMENT PLAN of the Danube Delta Biosphere Reserve, ROSPA0031 Danube Delta and Razim – Sinoie Complex, ROSCI0065 Danube Delta, ROSCI0066 Danube Delta - marine area / p.1981. Translation of the color legend: intensity of identified pressure: red - high, yellow brown – medium, yellow -low; Limita ROSCIOO65=territorial limits of the Danube Delta Site of Community Importance ROSCI0065, in a total area of 453645.5 ha; LIMITA ROSPA0031= territorial limits of Special avifaunistic protection area ROSPA0031 Danube Delta and Razim-Sinoie Complex, in a total area of 508302.3 ha.
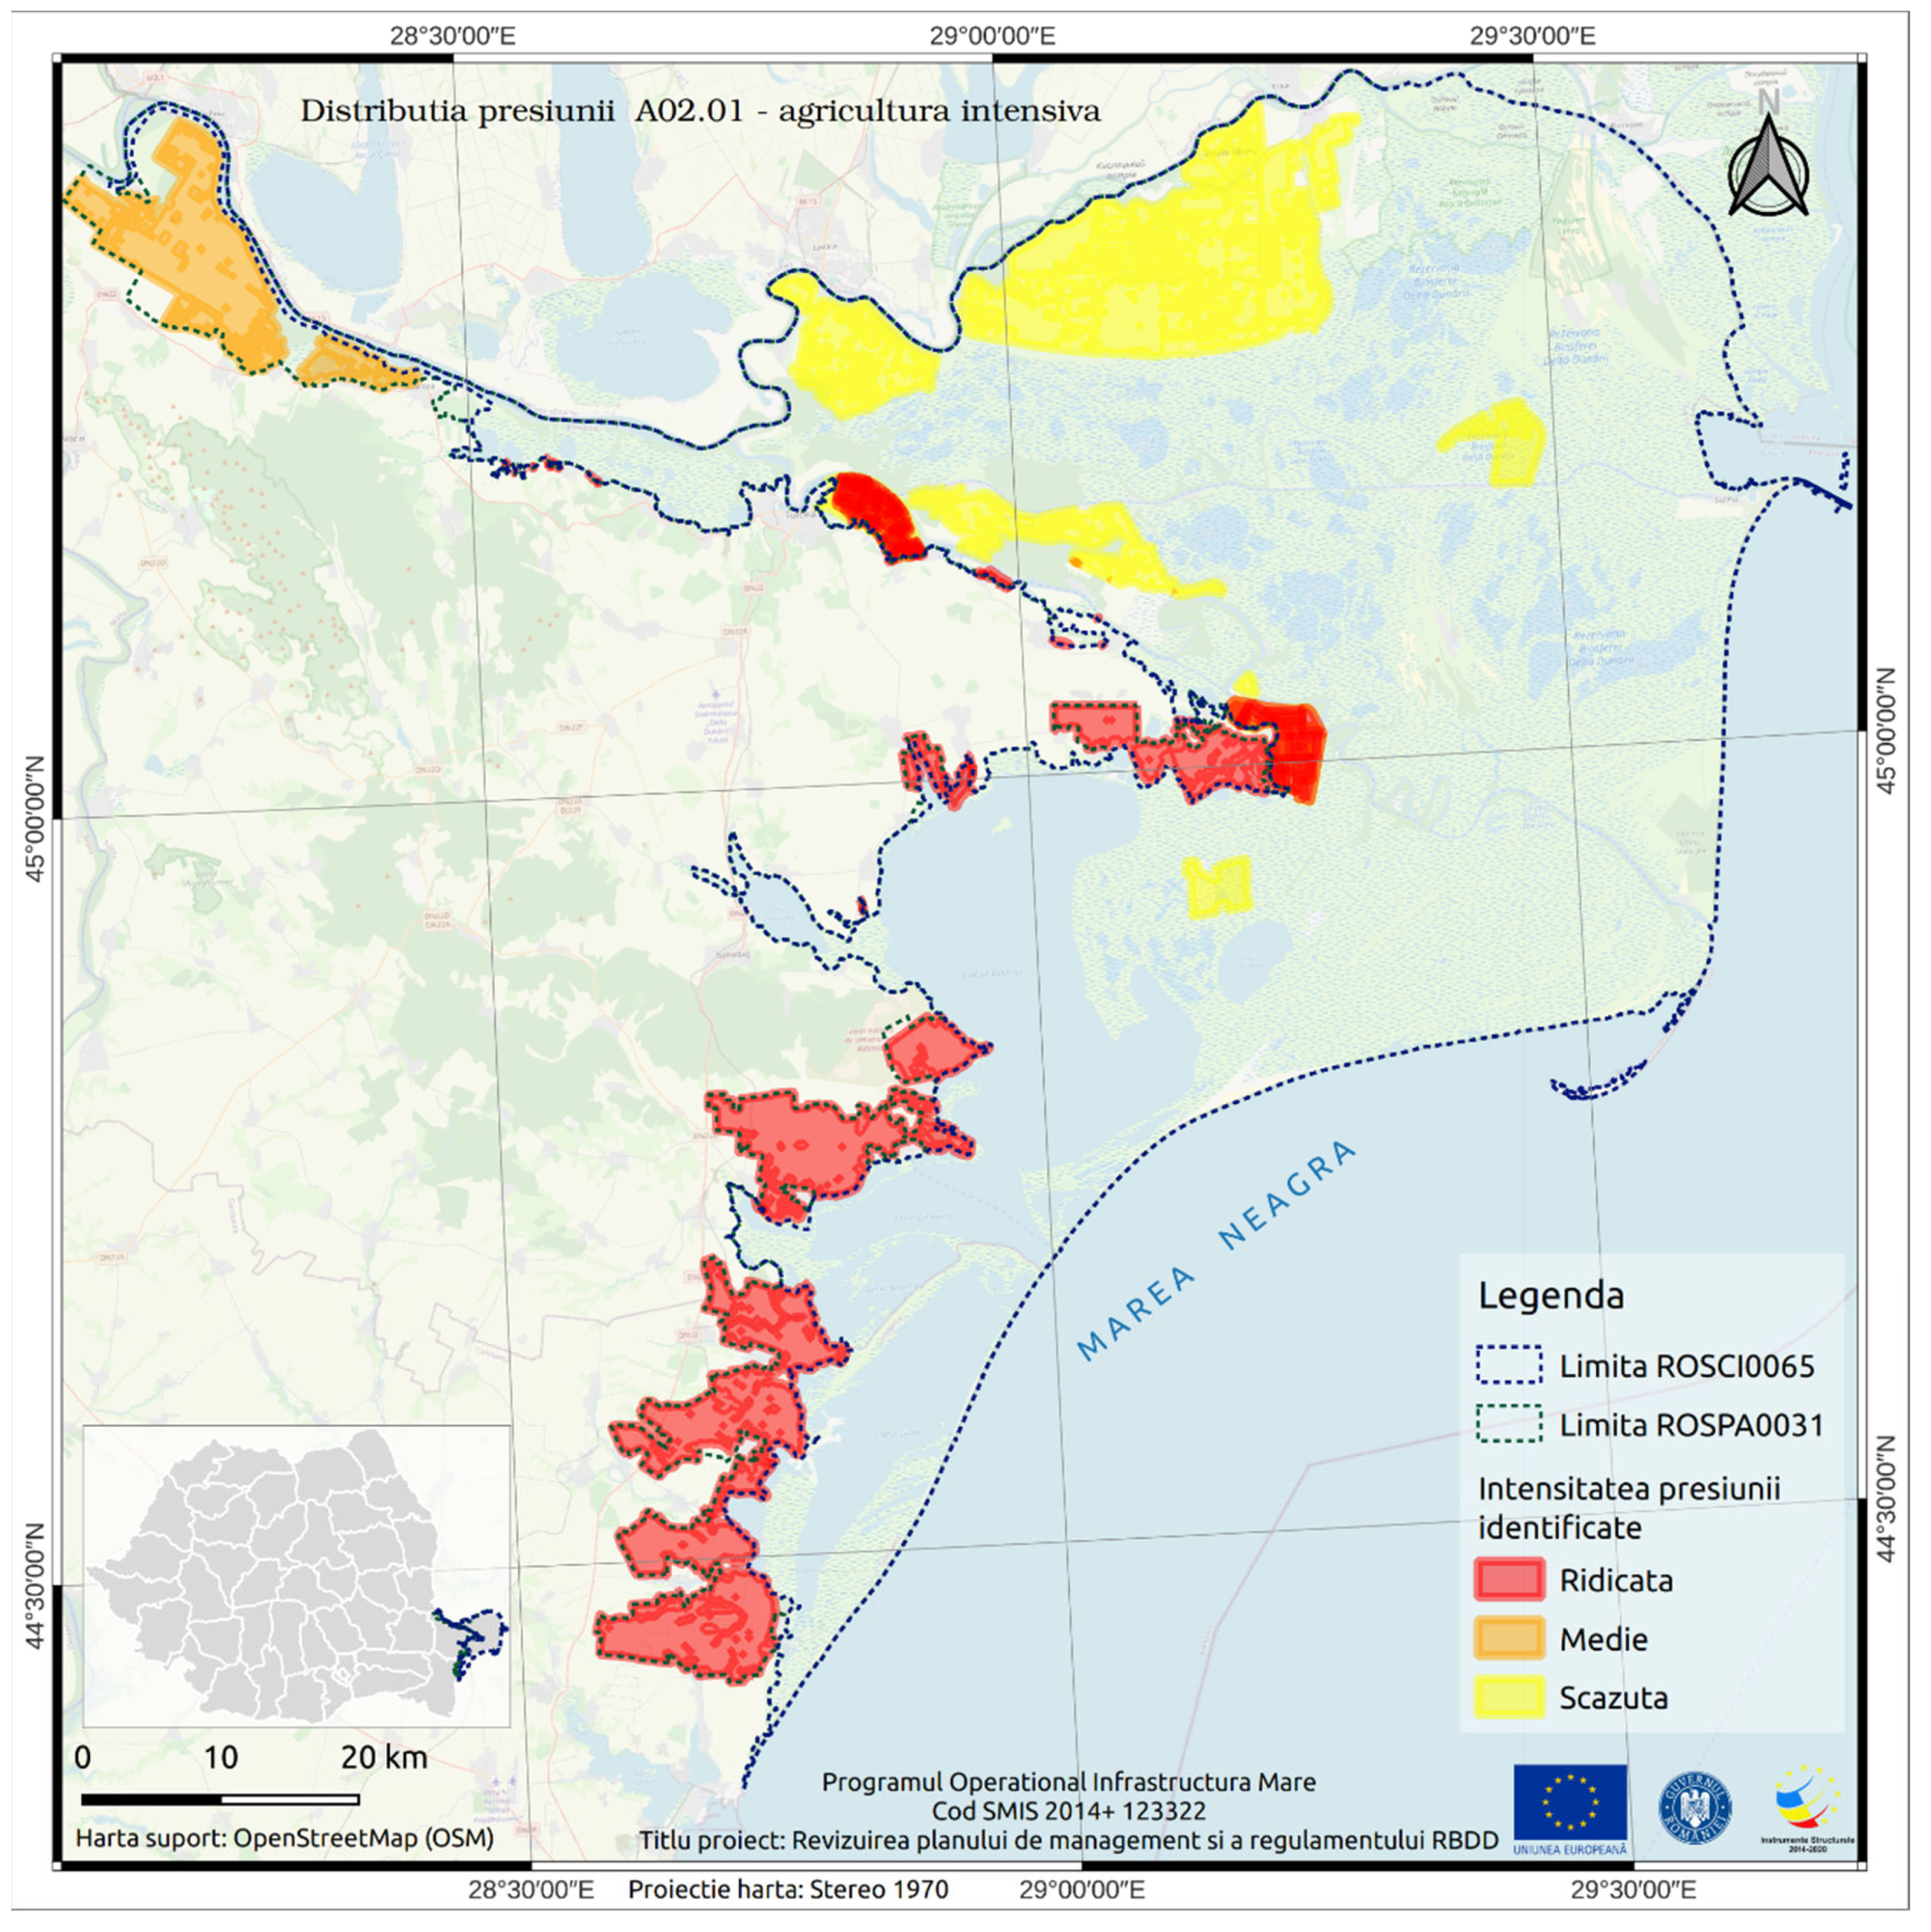
Figure 9.
Focus Map of navigation in the DDBR area (source: 5.2.1 Map of current pressures and their intensity at the level of the protected natural area - P.1500 / Review of the management plan and DDBR regulation). Translation of the color legend: intensity of identified pressure: red - high, yellow brown – medium, yellow -low; Limita ROSCIOO65=territorial limits of the Danube Delta Site of Community Importance ROSCI0065, in a total area of 453645.5 ha; LIMITA ROSPA0031= territorial limits of Special Avi faunistic protection area ROSPA0031 Danube Delta and Razim-Sinoie Complex, in a total area of 508302.3 ha.
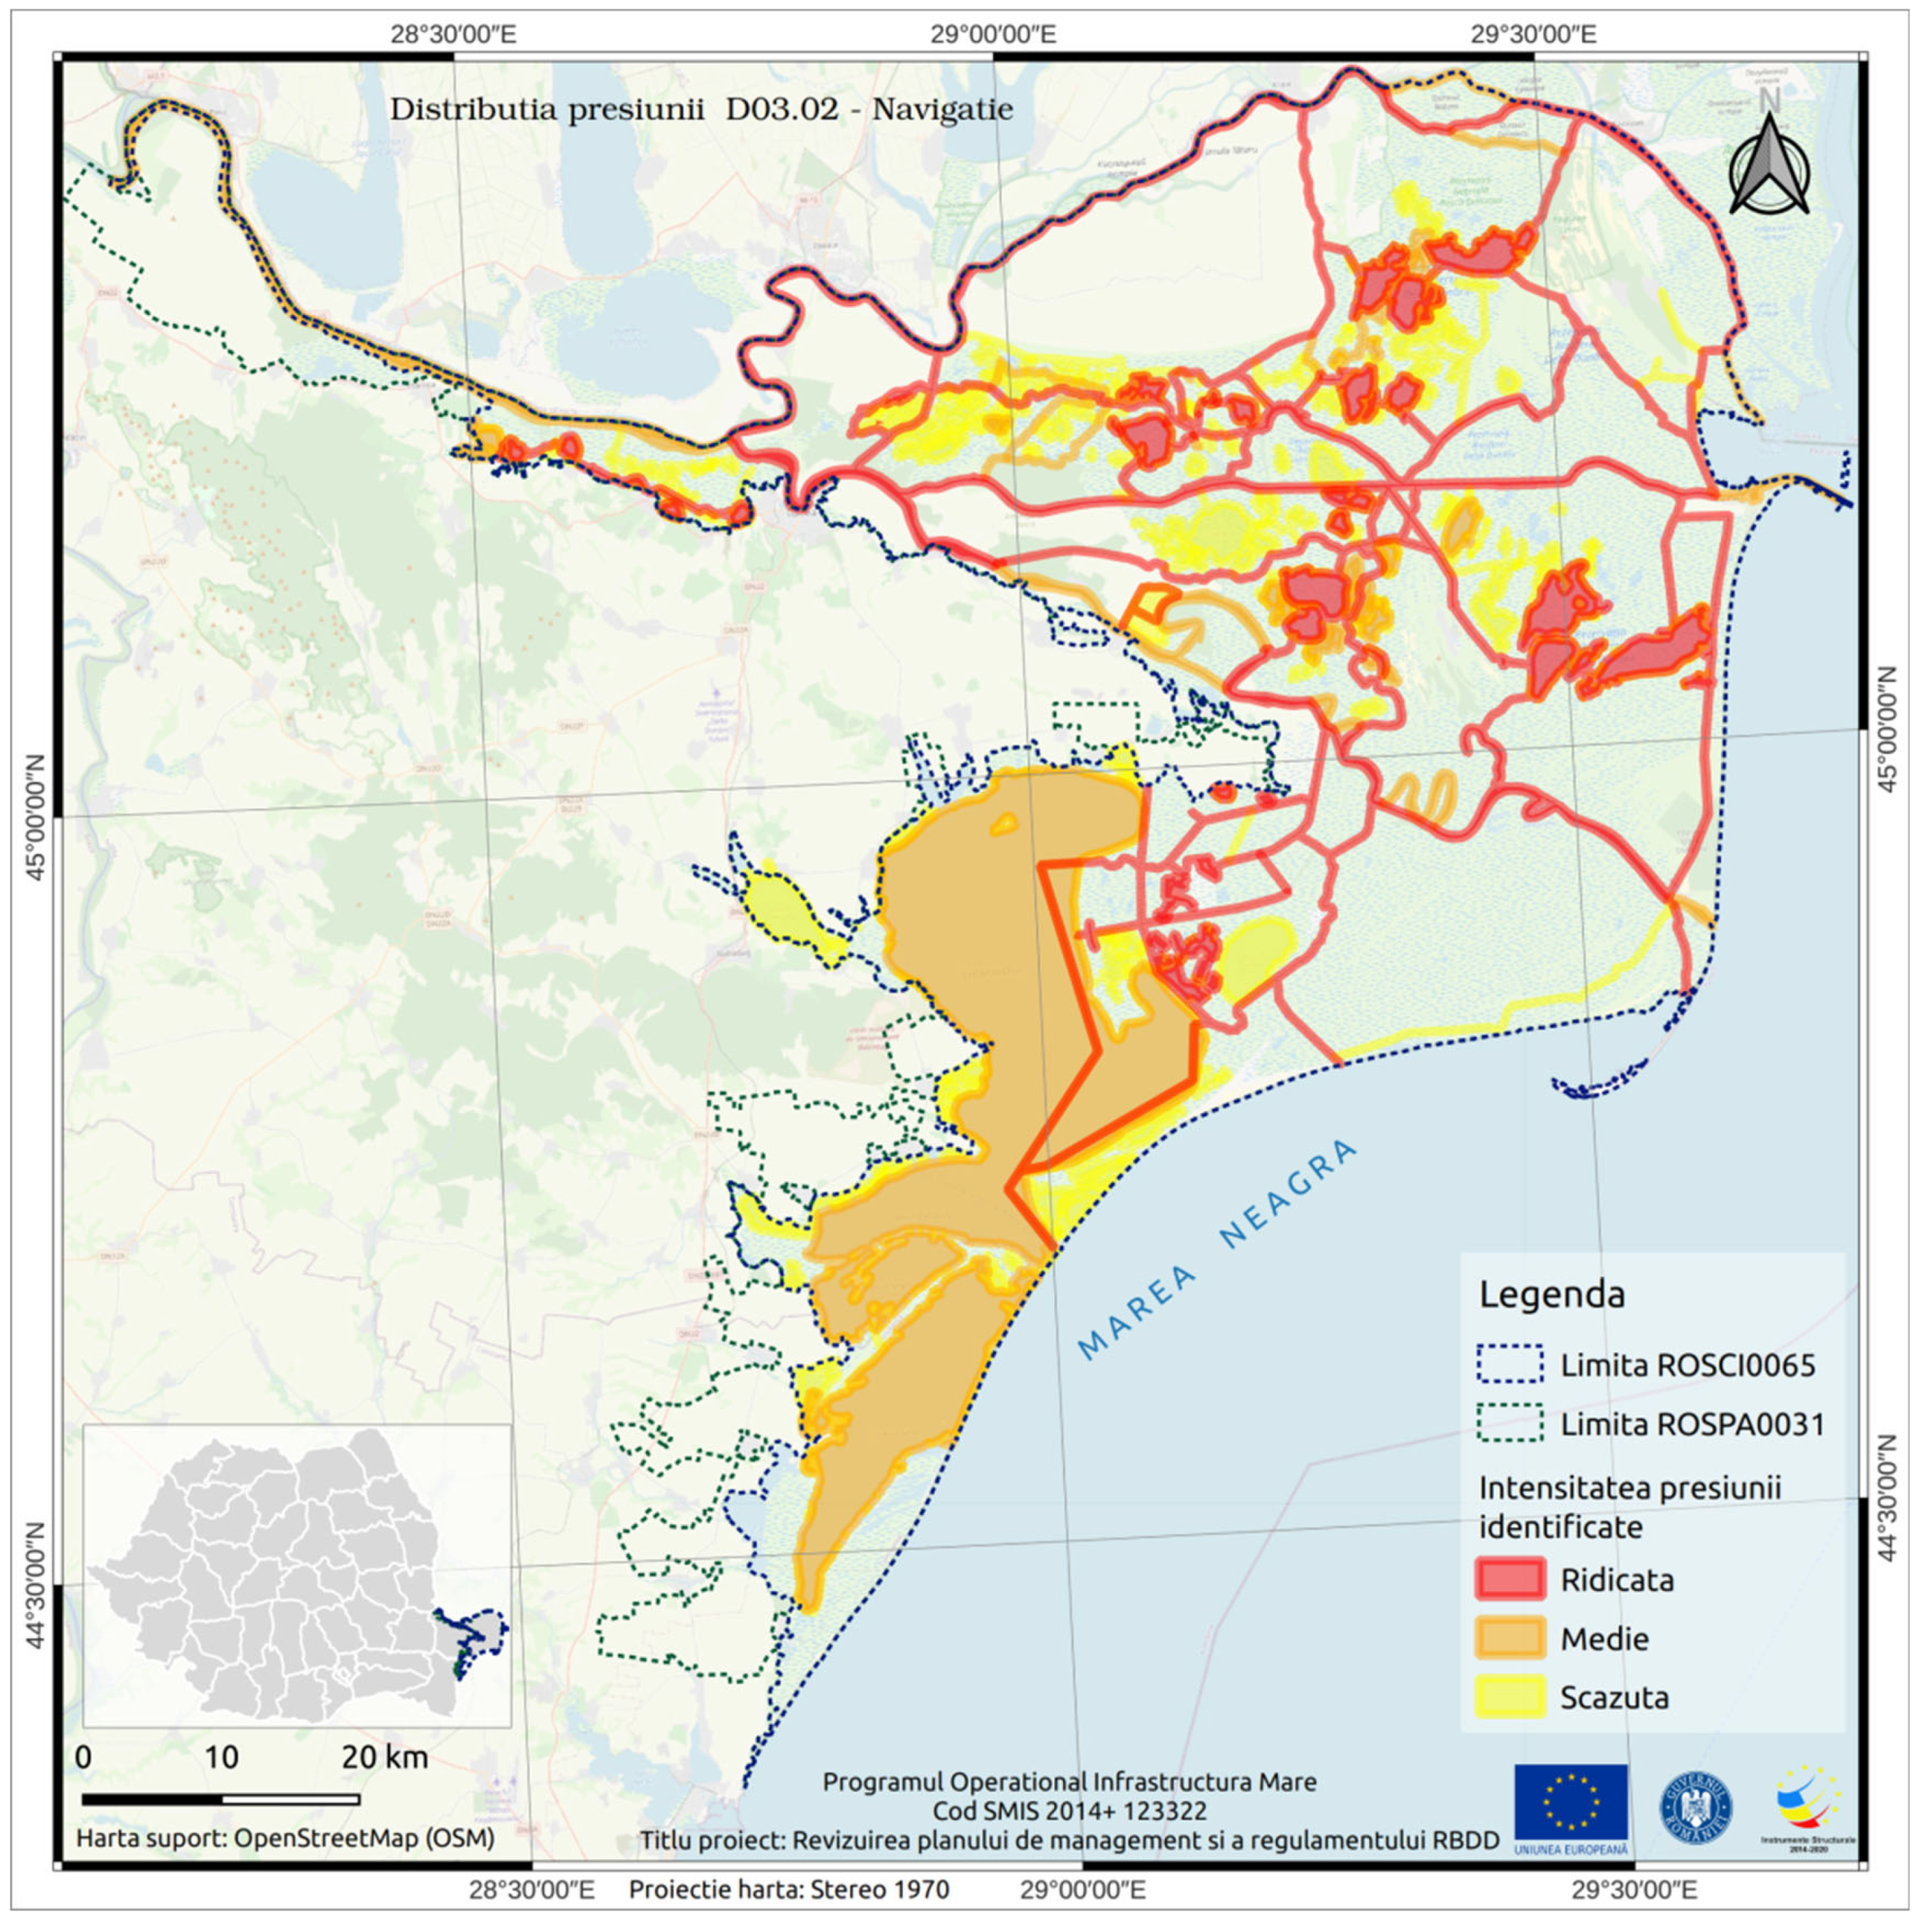

Table 1.
Overview of Focus Map type relevance within WEF NEXUS, local/regional,stakeholders and potential similar application areas.
Table 1.
Overview of Focus Map type relevance within WEF NEXUS, local/regional,stakeholders and potential similar application areas.
| Focus map | Valid for | Focus Stakeholder interest group |
WEF Nexus elements | Similar Areas for Application |
|---|---|---|---|---|
| Focus Landscape Map | Danube Delta Biosphere Reserve (DDBR) | Environmental Planners, Conservationists |
Water, Food | Wetlands, other Biosphere Reserves |
| Focus Map of the Human Footprint | Danube Delta Region | Policy Makers, Environmental Agencies | Water, Energy, Food |
Urban and rural regions globally |
| Focus Map of Tourist and Recreational Areas | Recreational areas within DDBR | Tourism Sector, Local Communities | Water (Tourism's impact) | Coastal regions, national parks |
| Focus Map of Tourist Attractions and Viewpoints | Cultural and Natural Tourist Sites within DDBR | Tourism Businesses, Cultural Heritage Organizations | Water, Energy (Indirect) |
Heritage sites, areas of natural beauty |
| Focus Maps of the Total Number of Overnight Stays | Tourist accommodations within Tulcea County | Tourism Sector, Hoteliers | Water, Food (Tourism impact) | Popular tourist destinations worldwide |
| Focus Map of Areas of Pressure Caused by Intensive Agriculture | Intensively farmed areas within DDBR | Agricultural Sector, Environmental Agencies | Water (Agriculture impact), Food | Agricultural regions, farmlands |
| Focus Map of Navigation | Waterways within DDBR | Business, Tourism Businesses | Water, Energy (Navigation impact) |
River basins, canal systems |
Disclaimer/Publisher’s Note: The statements, opinions and data contained in all publications are solely those of the individual author(s) and contributor(s) and not of MDPI and/or the editor(s). MDPI and/or the editor(s) disclaim responsibility for any injury to people or property resulting from any ideas, methods, instructions or products referred to in the content. |
© 2024 by the authors. Licensee MDPI, Basel, Switzerland. This article is an open access article distributed under the terms and conditions of the Creative Commons Attribution (CC BY) license (http://creativecommons.org/licenses/by/4.0/).
Copyright: This open access article is published under a Creative Commons CC BY 4.0 license, which permit the free download, distribution, and reuse, provided that the author and preprint are cited in any reuse.


