Submitted:
08 February 2024
Posted:
20 February 2024
Read the latest preprint version here
Abstract
Mangroves offer vital ecological advantages including air and water filtration, coastal and estuarine habitat provision, sediment stabilization, and wave energy absorption. Their intricate root systems play a key role in safeguarding shorelines from tsunamis and erosive storms by dissipating wave energy. Moreover, mangroves shield against boat wakes and wind-waves, bolstering shoreline defense. Wave dissipation is a function of forest width, tree diameter, and forest density. Restoration efforts of juvenile mangroves in Florida’s Indian River Lagoon (IRL) aim to reduce wave energy in areas vulnerable to erosion. Physical model testing of wave dissipation through mangroves is limited due to the complexity in representing the mangrove structure, where prop roots are non-uniform in both diameter and location. Previous studies have quantified wave dissipating effects through use of scaled and parameterized mangrove structures. This study measures the dissipation effects of live mangroves in a wave flume, forced by conditions representative of the IRL. These measurements are used to validate a parameterized dowel model. Error between wave attenuation factors for the live mangrove and dowel system was on average 2.5%. Validation of the modularized dowel system allowed for further parameterized testing to understand forest structure effects, such as sediment stabilization and wave attenuation.
Keywords:
mangrove
; wave attenuation
; restoration
; physical model
; laboratory experiment
; tree parameterization sediment stabilization
1. Introduction
Mangroves play a critical role along estuarine shorelines in tropical and subtropical regions by stabilizing shorelines, creating natural habitats, absorbing and filtering nutrients, and sequestering carbon [1]. Benefits of mangrove vegetation steeply contrast with “hardened” or armored shoreline stabilization methods, such as seawalls and revetments, which abruptly disrupt natural sediment transport resulting in scour and downdrift erosion [2] and provide little to no ecological benefits. Erosion mitigation with hardened structures may decrease shoreline retreat but neglect to provide similar ecological benefits associated with natural and nature-based shorelines. A shift towards natural and nature-based solutions, such as oyster reef breakwaters, marsh grasses, and mangroves, harness the benefits of natural shoreline stabilization without inducing negative effects associated with hardened armoring [3,4]. Efforts along the Florida coast have attempted to reestablish mangrove forests as natural erosion mitigation.
Mangrove forests are notable for mitigating long-wave tsunami effects [5,6,7], particularly along Vietnam coastlines where forest widths extend upwards of 24 km [8]. However, forest widths within Florida’s estuaries along residential properties are typically much less than 33 m and encounter short-period waves (< 15 seconds). Wind-wave periods in the Indian River Lagoon (IRL) on Florida’s East coast are limited by the shallow water depth, short fetch, and the restricted nature of the estuary. Frictional drag created by mangrove roots on short-period waves results in turbulent, multi-directional flow that dissipates wave energy [9,10,11,12,13]. Under high water conditions, such as storm surge, leaves may become submerged, resulting in even greater wave dissipation [12,14,15]. Mangrove attenuation properties are relative to water levels, wave and current energies, and plant geometry, consisting of aerial and prop roots, branches, and leaves. Plant features create drag in the water column and are a function of species, density, forest width, and age [14]. Forest width and forest density increase as mangrove forests mature, further reducing forest porosity and increasing wave attenuation properties [11,16,17]. Field studies provide ranges of mangrove characteristics, and Bryant et al. [18] provides thorough guidance for mangrove field measurement methods. Aside from shoreline stabilization and wave attenuation, ecological and economic benefits from mangroves include increased habitat for marine life, filtering nutrients, and creating commercial and recreational fishing areas.
Dissipation effects of mangrove roots have been relatively well studied under long period, tsunami waves; however, few laboratory studies have addressed the effects of mangrove roots under short period waves, such as wind waves and boat wake. Physical mangrove modeling is difficult due to the complexity of the plants. Multiple studies have attempted to re-create the mangrove forest structure. Tuyen and Hung [19] used Sonneratia mangrove branches in a wave flume to simulate a mangrove forest under scaled storm surge at mean water levels in Vietnam. Husrin et al. [20] validated a parameterized model under current flow by using a scaled replication of a mangrove root structure. Hashim et al. [14] built scale models of mangroves using wire to compare the effects of mangrove forest configuration and density under short period waves. Hu et al. [21] studied wave dissipation effects of a parameterized model with the addition of a current, resulting in an empirical relationship between the Reynolds number and drag coefficient. Bryant et al. [18] evaluated dissipation effects of near-prototype scale Rhizophora mangle in a large wave flume. The aforementioned studies relied on field measurements to parameterize mangrove models.
Florida has three mangrove species: red mangrove (Rhizophora mangle), white mangrove (Luguncularia racemose), and black mangrove (Avicennia germinans). Among the three mangrove species in Florida, red mangroves are found at or below shorelines, are typically partially submerged and will be the focus herein. The location of mangroves is dependent on climate, water and soil salinity, tidal fluctuation, and substrate makeup [22]. Additionally, plant biomass productivity correlates to salinity, nutrient, and coastal energy in estuarine regions [23,24]. Florida estuaries and rivers provide near-ideal conditions for mangrove growth particularly for shoreline restoration efforts.
Local efforts within the Indian River Lagoon (IRL) along central East coast Florida have attempted to restore natural mangrove habitats for shoreline stabilization, economic, and ecological benefits. The IRL is a shallow and narrow restricted estuarine system [25] along the east coast of Florida, approximately 200 km long (N-S), 2-4 km wide (W-E), and 0.3 to 3.6 m in depth [26,27]. The narrow restriction of the lagoon impedes tidal flushing, resulting in high concentrations of nutrients. Local red mangroves help to filter these nutrients, naturally cleaning the lagoon. Sediment in the IRL is mostly shelly sand and clay with minor amounts of medium to fine sand and silt [28], ideal for mangrove growth. At the time of the Florida Department of Environmental Protection survey in 2018, approximately 32 km2 of mangroves existed between St. Lucie Inlet and Satellite Beach in the IRL [28]. However, mangroves are often removed during coastal development to reduce obstruction of views, resulting in a large loss of ecosystem benefits. Removal is typically due to federal regulations that regulate crown trimming if the plants were to remain. Removal can result in erosion due to unstable shoreline sediments [29].
This study investigates wave attenuation, wave energy dissipation, and sediment transport effects of mangroves using a validated, parameterized physical model. Validation of wave energy dissipation using a parameterized dowel system was completed using live mangroves under identical forcing conditions in a wave flume. Additional testing was completed using the dowel system to quantify the effects of forest width, density, and cross-shore sediment transport.
2. Materials and Methods
Three phases of physical modeling were completed in the Florida Institute of Technology (FIT) wave tank. A modular dowel mangrove design (MDMD) was used for testing. The first phase consisted of placing live mangroves in the wave flume to validate hydrodynamic responses around the MDMD. The second phase consisted of testing forest parameter effects on wave dissipation using the MDMD. The third phase consisted of evaluating cross-shore sediment transport within the MDMD. Low energy wave and water level conditions and sediment profiles were selected to be representative of those found in the IRL.
2.1. Tank Setup and Data Analysis
The FIT wave tank is 9.1 m long, 0.56 m wide, and 0.91m deep; with an effective length of 6.7 m with either a piston or flap paddle. A wave generator is attached to an adjustable stroke length to modify wave height. Testing was completed using the piston wave paddle for 1.5, 2, and 3 second periods and the flap wave paddle for 1, 1.2, and 1.5 second periods. The piston paddle generates larger amplitude waves than the flap paddle; however, steepness limited breaking occurred at the validation water levels for the piston paddle, so these results are not discussed herein. Therefore, the flap paddle was used for forest width and frontal area coverage testing to create non-breaking waves to evaluate dissipation solely due to interactions between the wave and mangroves.
Wave heights were measured in the wave flume on the seaward and leeward side of the mangrove and MDMD systems using Sonic Wave Sensor XB from Ocean Sensor Systems, Inc. with a tolerance of 0.01 cm. Wave heights on the seaward side were used to confirm the desired incident wave was achieved; however, no wave reflection analysis was completed. Wave data was filtered using Hampel and 3rd order Butterworth filters to reduce noise, then a wave-by-wave analysis was completed to calculate significant wave heights. Wave reduction coefficients were computed by comparing the transmitted wave height with-mangroves to the transmitted wave height without-mangroves.
Shoreline stabilization was evaluated using cross-shore sediment heights. Sediment height changes were recorded at measurement stations located in 0.3 m increments. Stabilization was assessed by comparing the equilibrium sediment profile with the initial profile. Horizontal berm retreat was estimated using images of the cross-sectional profile. Total erosion and deposition on the leeward and seaward side were also estimated from these measurements.
2.2. Modular Dowel Mangrove Design Validation
The MDMD was validated using live mangroves in the wave tank to accurately simulate wave dissipation through a mangrove forest. A wave reduction factor was used for comparison. The reduction factor is defined as the nondimensionalized ratio between the wave height on the leeward with the system in place and the wave height on the leeward without the system in place (“control”).
Live mangroves were placed in the wave tank to simulate a mangrove forest, Figure 1. The plants were 3 to 10 years old and on loan from the Marine Resource Council (MRC) in Melbourne, FL. Mature plants contained a main stem and prop roots and juvenile plants taller than 0.3 m were used to simulate additional roots to achieve the desired plant density. Larger plants were placed in the center of the tank and smaller plants and propagules filled in spaces to achieve a front area coverage of 50%. A level 0.25 m sediment profile was placed on the bottom of the tank to cover the mangrove containers. The profile sloped seaward to the bottom of the tank to replicate the IRL’s bathymetric slope [30] and a dissipative stone slope was placed at the end of the tank in the lee of the simulated forest to limit wave reflection from the flume wall. The total forest length perpendicular to the shoreline (i.e., cross-shore span) was 1.45 m and the root density at the sediment level was approximately 200 mangrove prop roots per square meter, or one prop root every 50 square centimeters.
The MDMD is a system used to simulate mangrove roots, Figure 2, that consists of a plywood frame with uniformly drilled holes attached to the top of the wave tank. The frame holds 1.3 cm diameter wooden dowels over a 0.61 m cross-shore length and 0.56 m along shore width (i.e., across tank). Multiple frames can be concatenated to simulate a greater forest cross-shore length. These frames are designed to provide up to 100% frontal area coverage.
Columns and rows were defined on the frame. Columns were defined as the sets of holes on the same cross-shore plane and are 1.3 cm wide. Rows were defined as sets of holes on the along-shore plane. The frame has 16-17 holes per column and 20-21 holes per row. “Bands” of forest are approximately 10 cm wide and defined as the number of rows required to achieve the desired front area coverage, either 5 or 6 consecutive rows. Each wooden dowel is approximately 1.2 m long. Front area coverage is associated with the percentage of projected area to total area of the cross-tank plane that is occupied by one band of dowels. Holes in the frame are offset to achieve 100% coverage. Volume ratios are used to compare volume of dowels VD to total band volume VT. At a constant area over depth, a 100% front area coverage corresponds to a volume ratio of 0.1, which is similar to volume ratios of wild red mangroves [16].
To simulate the live mangrove tests, the lower ends of the dowels were buried into the sediment, which had the same bathymetric profile as the live mangrove configuration. Dowels were placed in the frames based on output from a random number generator in MATLAB. This method was used to create an effective forest cross-shore length of 1.45 m, with an average density of one dowel per 50 square centimeters, and 50% front area coverage.
2.3. Modular Dowel Mangrove Design (MDMD) Testing
Further testing was completed with the MDMD to evaluate the effects of forest width and front area coverage. Front area coverage values of 100%, 75%, and 50% were achieved using either 5-row bands or combined 5- + 6- row (11-row) bands. The effects of 1 to 3 sets of bands were tested. A constant 12.7 cm sediment layer was used to stabilize the bottom of the dowels, which would otherwise move under wave forcing. Waves were generated with the flap paddle at periods of 1 and 1.5 seconds for a non-breaking wave in a 12.7 cm water depth over the sediment.
2.4. Sediment Transport
Sediment samples were collected from Riverview Park in Melbourne, FL at three locations along a cross-shore profile: just above, at, and just below the mean high-water line. Additionally, three sediment samples were collected from the existing sediment in the FIT wave tank. Samples were analyzed based on ASTM grain size distribution standards [31,32]. Sediment fall velocity was computed based on CEM [33]. Average Dn50 for the field samples was 0.40mm and average Dn50 for wave tank samples was 0.28mm. Sediment fall velocity of the average field sample was 0.20 m/s and average wave tank sample was 0.17 m/s.
Red mangrove prop roots and aerial root diameter measurements were taken at Riverview Park in Melbourne, FL. Seven measurements were collected in total from two mangrove trees using a Husky Digital Caliper which has an accuracy of 0.003 cm, Figure 3. Diameters ranged from 0.9 to 2.8 cm with an average of 1.7 cm and standard deviation of 0.76. The diameter difference between the measured roots and the 1.3 cm dowels on the MDMD was found to be not significant, though having dowels of varying size would more accurately mimic nature.
A cross-shore sediment profile was constructed to replicate the foreshore slope of a shoreline in the IRL. An A-frame with mesh covering was placed at the end of the tank to reduce incident wave reflections. A horizontal 0.61 m long berm was constructed away from the A-frame at a 0.45 m height then sloped at a 1:4 slope towards the bottom of the tank over 1.8 m long. Measurements were recorded at stations marked 0.3 m apart, Figure 4.
MDMD testing was completed at three water levels centered around a measured mean high water (MHW) at Riverview Park in Indialantic, FL, a location of a previous oyster restoration project in the IRL, [30]. The representative MHW in the wave tank worked out to 0.30 m above the bottom of the tank. Based on this value, the corresponding depths used in the experiment for MSL, MHW, and AHW are 0.22 m, 0.30 m, and 0.38 m respectively, see Figure 5.
Average expected wave heights were computed from fetch- and depth-limited wave equations, found in the Shore Protection Manual [34]. Typical fetch lengths in the IRL range between 2 to 4 km [27]. Water depths in the IRL range from 0.0 to 3.6 m, with the shoreline being near 0.3 m, and typically ranging from 0.9 to 1.8 m elsewhere [35]. Herein, a fetch length of 4 km and depth of 1.8 m was used. A wind speed of 4.8 m/s or 10.8 mph was used, corresponding to measurements from 2013-2018 National Data Buoy Center (NDBC) at Sebastian Inlet station SIPF1. Resulting fetch-limited wave heights were 0.15 m with a period of 1.5 seconds.
The effects of mangroves on cross-shore sediment transport were evaluated using the MDMD at each of the three water levels and 0.15 m incident wave heights in a 0.3 m water depth, Figure 5. The test duration was 3 hours and 23 minutes, which was determined to be the required time to achieve sediment equilibrium through previous testing. Sediment transport testing was conducted with zero MDMD bands as a control, and 1-, 2-, 4-, and 6-bands of dowels. Sediment profiles were reshaped between tests. Three replicates were measured for the MHW and one replicate for each the MSL and AHW. Sediment height changes were recorded at 0.3 m spacing for each test and total erosion and deposition between 0-1.2 m on the leeside of the MDMD and 1.2-3.0 m on the seaward side of the MDMD were estimated. Shoreline stabilization was measured based on change of the vertical profile during the testing compared to the initial profile, measured at 0.3 m increments. Horizontal berm retreat was estimated using images of the cross-sectional profile.
3. Results and Discussion
The results of the MDMD validation against live mangroves will be presented followed by the results of the shoreline stabilization testing using the MDMD system.
3.1. Modular dowel mangrove design (MDMD) validation
Wave reduction factors were computed for each trial. These factors were compared between the live mangroves and MDMD validation configurations resulting in a percent difference, Table 1. The average percent difference between the live mangroves and the MDMD validation was 2.5%. This validation provides the hydrodynamic uncertainty associated with parameterizing mangrove forests with dowels, which was previously not comprehensively confirmed using live mangroves in a controlled setting.
In general, the wave reduction factors ranged from 0.60 - 0.80 for both the live mangroves and the dowels with the flap paddle with differences between the two methods ranging from 0.7 – 5.7 %. Previous reports, [36], reported a 3.2% average difference; however, that difference included results from the waves generated by the piston-type paddle. The waves generated by the piston paddle for these tests were highly nonlinear. These nonlinearities included shallow water breaking across the length of the tank and resulted in high levels of turbulence before the wave impacted the MDMD. To narrow the score of this work only the results produced by the waves generated with the flap style wavemaker were considered.
3.2. Modular Dowel Mangrove Design (MDMD) Testing
After validation, the MDMD was reconfigured to evaluate the dissipative effects of band number and front area coverage. The flap paddle was used herein to ensure non-breaking waves. The effects of additional bands at 100%, 75%, and 50% front area coverage are presented in Figure 6. Energy loss was greater for 11-row bands than for 5-row bands, although the front area coverage was the same. Dowel placement was denser for the 5-row bands than the 11-row bands for the same front area coverage; however, these results suggest the density plays a less important role in wave energy dissipation than forest width. The increase in wave energy dissipation for the longer forest width is likely due to the increase in turbulence development over time in the system. In general, the wave attenuation decreased more between the 50% and 75% front area coverage than it did between the 75% and 100% front area coverage. This suggests there is an optimal front area coverage where the wave energy is most effectively reduced for a minimum front area coverage; however, in all cases the 100% front area coverage attenuated more energy than the 75% and 50%. Results also reflect that shorter period waves are more easily attenuated than longer period waves.
The effects of front area coverage for each band are presented in Figure 7. Wave attenuation increased as front area coverage increased, likely due to the increased friction in the simulated forest. At the 1-second period, the mangroves were generally better able to attenuate wave energy, likely due to the increase of wave steepness. As expected, as the band number and front area coverage increased, the wave attenuation properties increased. This reduction of wave energy is due to the increase of friction with the addition of simulated mangrove roots; however, even at the greatest band number and front area coverage tested, a 100% wave attenuation is difficult to achieve in a narrow estuarine system due to the restricted available cross-shore area for mangrove growth. The natural permeability of the root system will allow wave propagation shoreward of the mangrove forest. Greater wave attenuation can be achieved over time as forest front area coverage and overall cross shore width increases. This decrease in wave energy in the cross-shore will promote shoreline accretion, while the mangrove roots will reduce erosion during large storm events by stabilizing the sediment.
Wave attenuation properties were also dependent on wave steepness and wave period, where the 1-second wave with a greater steepness was attenuated more effectively than the 1.5-second wave. Not only do shorter period waves carry less energy and have less momentum than longer period waves, but also as the wave steepness increases, a wave is more prone to breaking upon impacting the root structure at any given time. Although not presently studied, mangroves may be able to provide further shoreline protection during large storm and hurricane force waves due to the added frictional surface area of canopy leaves that the incident wave may impact under increased water levels.
3.3. Sediment Transport
Cross-shore sediment transport was evaluated using the MDMD. Vertical changes compared to initial cross-shore profile were measured at 0.3 m (1 ft) increments and the horizontal berm retreat was evaluated. Average equilibrium profiles from the three replicate tests for MHW are shown in Figure 8 for 1- and 2-band tests (a) and the 2-, 4- and 6-band tests (b).
In the MHW testing, the cross-sectional profiles showed a net offshore transport for all tests; however, the greatest erosion at station zero occurred for the control when zero bands were present. For the control and test with 1-band, sediment was lost outside of the measurement area towards the seaward side. Additionally, due to the 0.3 m measurement resolution, sediment changes are likely not fully characterized within the profile. As bands increased, erosion between stations 0 and 3 typically decreased. Tests with 1-band showed the formation of an offshore berm on the waterward side of the MDMD. Tests with 2- and 4-bands were nearly identical and showed the formation of a small berm. Variations between replicates were low for the MHW testing, with a maximum standard deviation between individual station replicates of 0.067 and an average standard deviation for all stations of 0.018. Relatively large variations between replicates for zero and 1-band tests are likely due to drastic profile changes related to higher wave energy between stations 0 and 4. Other variations between replicates are associated with sand waves, where measurements may be measured at either a ridge or runnel whose locations change between replicates.
The equilibrium profile heights at MSL, Figure 9, were similar to those at MHW but were less pronounced. Only one testing replicate was completed because of the low variation seen at MHW testing and the 4-band testing was not presented because of no significant difference between four and 6-band results, as shown by the very low standard deviations above for the MHW testing. There was no berm retreat for any test with the MDMD and minimal retreat for the control, further discussed below. Overall net sediment transport from the lee of the MDMD was lower than that of the MHW, likely due to the shallower water depth resulting in decreased wave energy acting on the profile and breaking waves acting lower on the profile.
Equilibrium profiles for AHW are shown in Figure 10. For this case erosion extended back to the A-Frame. Vertical decrease at the A-frame, station zero, is more pronounced than at MSL and MHW. Net cross-shore transport shows erosion at 0 m, signs of a berm formation between 1.22 and 2.13 m, and sediment loss outside of the measurement area for nearly all scenarios. A possible wave node or antinode may have influenced the creation of the berm between 1.22 and 2.13 m; however, hydrodynamic measurements were not resolved to evaluate this in the present study. In general, as the number of bands increased, the net offshore transport decreased.
The average sediment transport at MHW between stations is shown in Figure 11 where negative values correspond to erosion and positive corresponds to accretion. The control had the most net erosion on the leeward side of the MDMD. Tests with 1-band had the greatest accretion on the seaward side of the MDMD. Tests with 2-, 4-, and 6-bands had similar net transport. The standard deviation of sediment transport between bands was computed for each station, with a maximum standard deviation of 0.013 at 0 and 0.3 m distance; however, the other measurement locations had standard deviations between 0.001 and 0.007. The larger variation between sediment transport is likely due to erosion occurring for the control and 1-band cases at 0 and 0.3 m, but no erosion at these locations for the other band scenarios. Without including variations at 0 and 0.3 m, the variation between the cross-sectional sediment transport was insignificant, with an absolute maximum change in sediment level between these bands of 0.008m and maximum standard deviation of 0.05. This demonstrates the significant benefit for the shoreline of an adequately wide mangrove forest for erosion mitigation and shoreline protection. Additionally, accretion was seen for all cases as a berm in front of the mangrove system. By accumulating eroded material into a bar-like structure in front of the mangroves, the onset of wave breaking is accelerated, enhancing the mangroves' ability to dissipate wave energy.
Horizontal berm retreat was evaluated at each water level and band configuration. Results of linear meters of berm loss are shown in Table 2. The greatest level of complete berm retreat to the A-frame was at AHW for all band configurations; although for the 6-band scenario this maximum retreat was smaller than the retreat measured at MHW for the control and 1-band case. Berm retreat decreased with decreasing water levels, where MSL had no berm retreat except for the control. Increasing the number of dowels generally decreased erosion and increased shoreline stabilization.
The AHW is a peak water level that only occurs once a year, typically between October to November in the IRL. The MHW and MSL are average water levels over the national epoch. In the IRL, shorelines mostly experience MHW and MSL conditions. In this study, a simulated forest width of 2-bands, which is equal to an effective mangrove forest width of 0.2 m, was demonstrated to be the minimum width for initializing shoreline stabilization at MHW and MSL. However, most shoreline damages do not occur during typical conditions. The 6-band results at the AHW, equal to an effective mangrove forest width of 0.6 m, would likely be the most realistic shore protection to prevent erosion during extreme events. Only 6-bands were evaluated within this study, so further investigation is required to determine an optimal forest width for extreme events.
4. Conclusions
As the Coastal Engineering community moves toward hybrid designs for coastal restoration and protection, emphasis has been placed on quantifying engineering benefits of natural and nature-based features and green designs. This study developed a method to quantify mangrove forest effectiveness for shoreline protection in relatively low wave environments. The simple modularized dowel method represents live mangroves within 2.5% accuracy on average in wave channel physical modeling. The MDMD allows for further investigation of mangrove forest parameters and their influence on shoreline protection. Using the MDMD, this study concludes that restoration efforts in low energy environments, such as the IRL, should attempt to plant out or construct a mangrove forest that is at least 0.6 m thick in the cross-shore at a density of 1 prop root per 50 sq cm. This design is expected to provide an initial level of protection from yearly erosive events, and it is expected that wave attenuation within the forest will increase as the plants continue to grow.
Author Contributions
Conceptualization, R.J.W.; methodology, R.J.W. and A.S.; software, R.J.W.; validation, R.J.W. and A.S.; formal analysis, R.J.W. and A.S.; investigation, R.J.W. and A.S.; resources, R.J.W.; data curation, R.J.W.; writing—original draft preparation, A.S. and R.J.W.; writing—review and editing, A.S. and R.J.W.; visualization, A.S. and R.J.W.; supervision, R.J.W.; project administration, R.J.W.; funding acquisition, R.J.W. All authors have read and agreed to the published version of the manuscript.
Funding
This research was funded by the State of Florida DEO_Grant #HL037. The APC was funded by the Indian River Lagoon Research Institute at Florida Institute of Technology.
Acknowledgments
The authors would like to acknowledge the participation of State of Florida DEO_Grant #HL037 collaborators: Brevard County, Brevard Zoo, and Florida Tech. The authors recognize the thesis work performed by James Austin at Florida Tech, and the students who assisted in the lab. We would also like to thank the Marine Resource Council, MRC, for their support generously lending live red mangrove plants for us to test in the wave tank.
Conflicts of Interest
The authors declare no conflicts of interest. The funders had no role in the design of the study; in the collection, analyses, or interpretation of data; in the writing of the manuscript; or in the decision to publish the results.
References
- 1. M. R. Timm, “Structural Comparisons of Natural versus Seawall Shoreline Mangrove Stands,” Open Access Theses, vol. 667, 2017.
- 2. P. Ruggiero, “Impacts of shoreline armoring on sediment dynamics,” Geological Survey Scientific Investigations Report, pp. 179–186, 2010.
- 3. S. B. Scyphers, S. P. Powers, K. L. Heck Jr, and D. Byron, “Oyster Reefs as Natural Breakwaters Mitigate Shoreline Loss and Facilitate Fisheries,” PLoS ONE, vol. 6, no. 8, 2011. [CrossRef]
- 4. J. Manis, “Assessing The Effectiveness Of Living Shoreline Restoration And Quantifying Wave Attenuation In Mosquito Lagoon, Florida,” Electronic Theses and Dissertations, vol. 2814, 2013. http://stars.library.ucf.edu/etd/2814.
- 5. K. Harada, F. Imamura, and T. Hiraishi, “Experimental study on the effect in reducing tsunami by the coastal permeable structures,” in Proceedings of the 12th International Offshore and Polar Engineering Conference, Kita-Kyushu, Japan, 2002.
- 6. K. Kathiresan and N. Rajendran, “Coastal mangrove forests mitigated tsunami,” Estuary, Coastal, and Shelf Science, vol. 65, no. 3, pp. 601–606, 2005. [CrossRef]
- 7. H. Yanagisawa et al., “The reduction effects of mangrove forest on a tsunami based on field surveys at Pakarang Cape, Thailand and numerical analysis,” Estuary Coastal Shelf S, vol. 81, no. 1, pp. 27–37, 2009. [CrossRef]
- 8. W. Benthem, L. P. Lavieren, and W. J. M. Verheugt, “Mangrove rehabilitation in the coastal Mekong Delta, Vietnam,” in An International Perspective on Wetland Rehabilitation, W. Streever, Ed., Dordrecht: Springer, 1999. [CrossRef]
- 9. T. Q. Bao, “Effect of mangrove forest structures on wave attenuation in coastal Vietnam,” Oceanologia, vol. 53, no. 3, pp. 807–818, 2011. [CrossRef]
- 10. H. Cao, Y. Chen, Y. Tian, and W. Feng, “Field Investigation into Wave Attenuation in the Mangrove Environment of the South China Sea Coast,” J. of Coastal Research, vol. 32, no. 6, pp. 1417–1427, 2016. [CrossRef]
- 11. S. R. Massel, K. Furukawa, and R. M. Brinkman, “Surface wave propagation in mangrove forests,” Fluid Dynamics Res, vol. 24, no. 4, pp. 219–249, 1999. [CrossRef]
- 12. Y. Mazda, M. Magi, Y. Ikeda, T. Kurokawa, and T. Asano, “Wave reduction in a mangrove forest dominated by Sonneratia sp,” Wetlands Ecol. Management, vol. 14, pp. 365–37, 2005. [CrossRef]
- 13. S. Quartel, A. Kroon, P. G. E. F. Augustinus, P. Saten, and N. H. Tri, “Wave attenuation in coastal mangroves in the Red River Delta, Vietnam,” J. of Asian Earth Sci, vol. 29, no. 4, pp. 576–584, 2007. [CrossRef]
- 14. A. M. Hashim, S. M. P. Catherine, and H. Takaijudin, “Effectivness of Mangrove Forest in Surface Wave Attenuation: A Review,” Research J. of Applied Sci., Eng. and Tech, vol. 5, no. 18, pp. 4483–4488, 2013. [CrossRef]
- 15. A. L. McIvor, I. Möller, T. Spencer, and M. Spalding, “Reduction of wind and swell waves by mangroves. Natural Coastal Protection Series: Report 1,” in Cambridge Coastal Research Unit Working Paper 40. The Nature Conservancy and Wetlands International, 2012. [Online]. Available: http://resolver.tudelft.nl/uuid:c77ceec8-8db6-4080-b5bb-f414dca9d39d.
- 16. Y. Mazda, M. Magi, M. Kogo, and P. N. Hong, “Mangroves as coastal protection from waves in the Tong King delta, Vietnam,” Mangroves and Salt Marshes, vol. 127–135, 1997. [CrossRef]
- 17. E. P. Odum, “Trends Expected in Stressed Ecosystems,” BioScience, vol. 35, no. 7, pp. 419–422, 1985. [CrossRef]
- 18. M. A. Bryant et al., “Wave Attentuation of Coastal Mangroves at a Near-Prototype Scale,” in TR-22-17. U.S. Army Corps of Engineer Research and Development Center, Vicksburg, MS, 2022. [Online]. Available: https://hdl.handle.net/11681/45565.
- 19. N. B. Tuyen and H. V. Hung, “An experimental study on wave reduction efficiency of mangrove forests,” in Proceeding of the 5th International Conference on Asian Pacific Coasts (APAC2009). Nanyang Technological University (NTU), Oct, Singapore, 2009, pp. 13-16,. [CrossRef]
- 20. S. Husrin, A. Strusinska, and H. Oumeraci, “Experimental Study on Tsunami Attenuation by Mangrove Forest,” Earth, Planets, and Space, vol. 64, no. 10, pp. 973–989, 2012. [CrossRef]
- 21. Z. Hu, T. Suzuki, T. J. Zitman, W. S. J. Uijttewaal, and M. Stive, “Laboratory study on wave dissipation by vegetation in combined current-wave flow,” Coastal Eng, vol. 88, pp. 131–142, 2014. [CrossRef]
- 22. W. E. Odum, C. C. McIvor, and T. J. Smith III, The ecology of the mangroves of south Florida: a community profile. Washington, D.C: U.S. Fish and Wildlife Service, Office of Biological Services, 1982.
- 23. A. E. Lugo and S. C. Snedaker, “The ecology of mangroves,” Annu. Rev. Ecol. Syst, vol. 5, pp. 39–64, 1974. [CrossRef]
- 24. M. R. Carter et al., “Ecosystem analysis of the Big Cypress Swamp and estuaries,” in “U.S. Environmental Protection Agency Region IV, Athens, Ga, 1973.
- 25. B. Kjerfve, Comparative Oceanography of Coastal Lagoons, Estuarine Variability. Academic Press, 1986. [CrossRef]
- 26. N. P. Smith, “Computer Simulation of Tide-Induced Residual Transport in a Coastal Lagoon,” J. of Geophysical Research, vol. 95, no. C10, pp. 18205–18211, 1990. [CrossRef]
- 27. R. J. J. Weaver, J.E., and M. Ridler, “Wind-driven circulation in a shallow microtidal estuary: The Indian River Lagoon,” Journal of Coastal Research, vol. 32, no. 6, pp. 1333–1343, 2016. [CrossRef]
- 28. “Florida Department of Environmental Protection, Division of Water Resource Management.” 2018.
- 29. P. Santen, P. G. E. F. Augustinus, B. M. Janssen-Stelder, S. Q.- tel, and N. H. Tri, “Sedimentation in an estuarine man- grove system,” J. of Asian Earth Sci, vol. 29, no. 4, pp. 566–575, 2007. [CrossRef]
- 30. R. J. Weaver, A. L. Stehno, N. Bonanno, A. Sager, A. Kenny, and J. A. Zehnder, “Scale Model Design of Oyster Reef Structures as Part of a Showcase Living Shoreline Project,” Shore & Beach, vol. 85, no. 4, pp. 41–54, 2017.
- 31. A. C. / C136M-19, Standard Test Method for Sieve Analysis of Fine and Coarse Aggregates. West Conshohocken, PA: ASTM International, 2019. [Online]. Available: www.astm.org.
- 32. A. S. T. M. D2487-17e1, Standard Practice for Classification of Soils for Engineering Purposes (Unified Soil Classification System). West Conshohocken, PA: ASTM International, 2017. [Online]. Available: www.astm.org.
- 33. C. E. Manual, Coastal and Hydraulics Laboratory. U.S. Army Engineering Research and Development Center, Waterways Experiment Station, 2004.
- 34. U.S.A.C.E., “Shore Protection Manual,” in Waterways Experiment Station, 4th ed., Vicksburg, MS, 1984.
- 35. W.-C. C. Staff, Physical Features of the Indian River Lagoon. Tallahassee, Florida: Woodward-Clyde Consultants, Indian River Lagoon National Estuary Program: Project 92F274C, 1994.
- 36. J. E. Austin, “The effect of simulated mangrove forest width on shoreline stabilization at multiple tidal water levels,” Thesis., Florida Institute of Technology, Melbourne, FL, 2020.
Figure 1.
Live mangroves in the wave tank with water. Stone revetment at the left end of the tank to simulate representative shoreline and reduce reflected wave. Plant containers are buried in the sediment.
Figure 1.
Live mangroves in the wave tank with water. Stone revetment at the left end of the tank to simulate representative shoreline and reduce reflected wave. Plant containers are buried in the sediment.
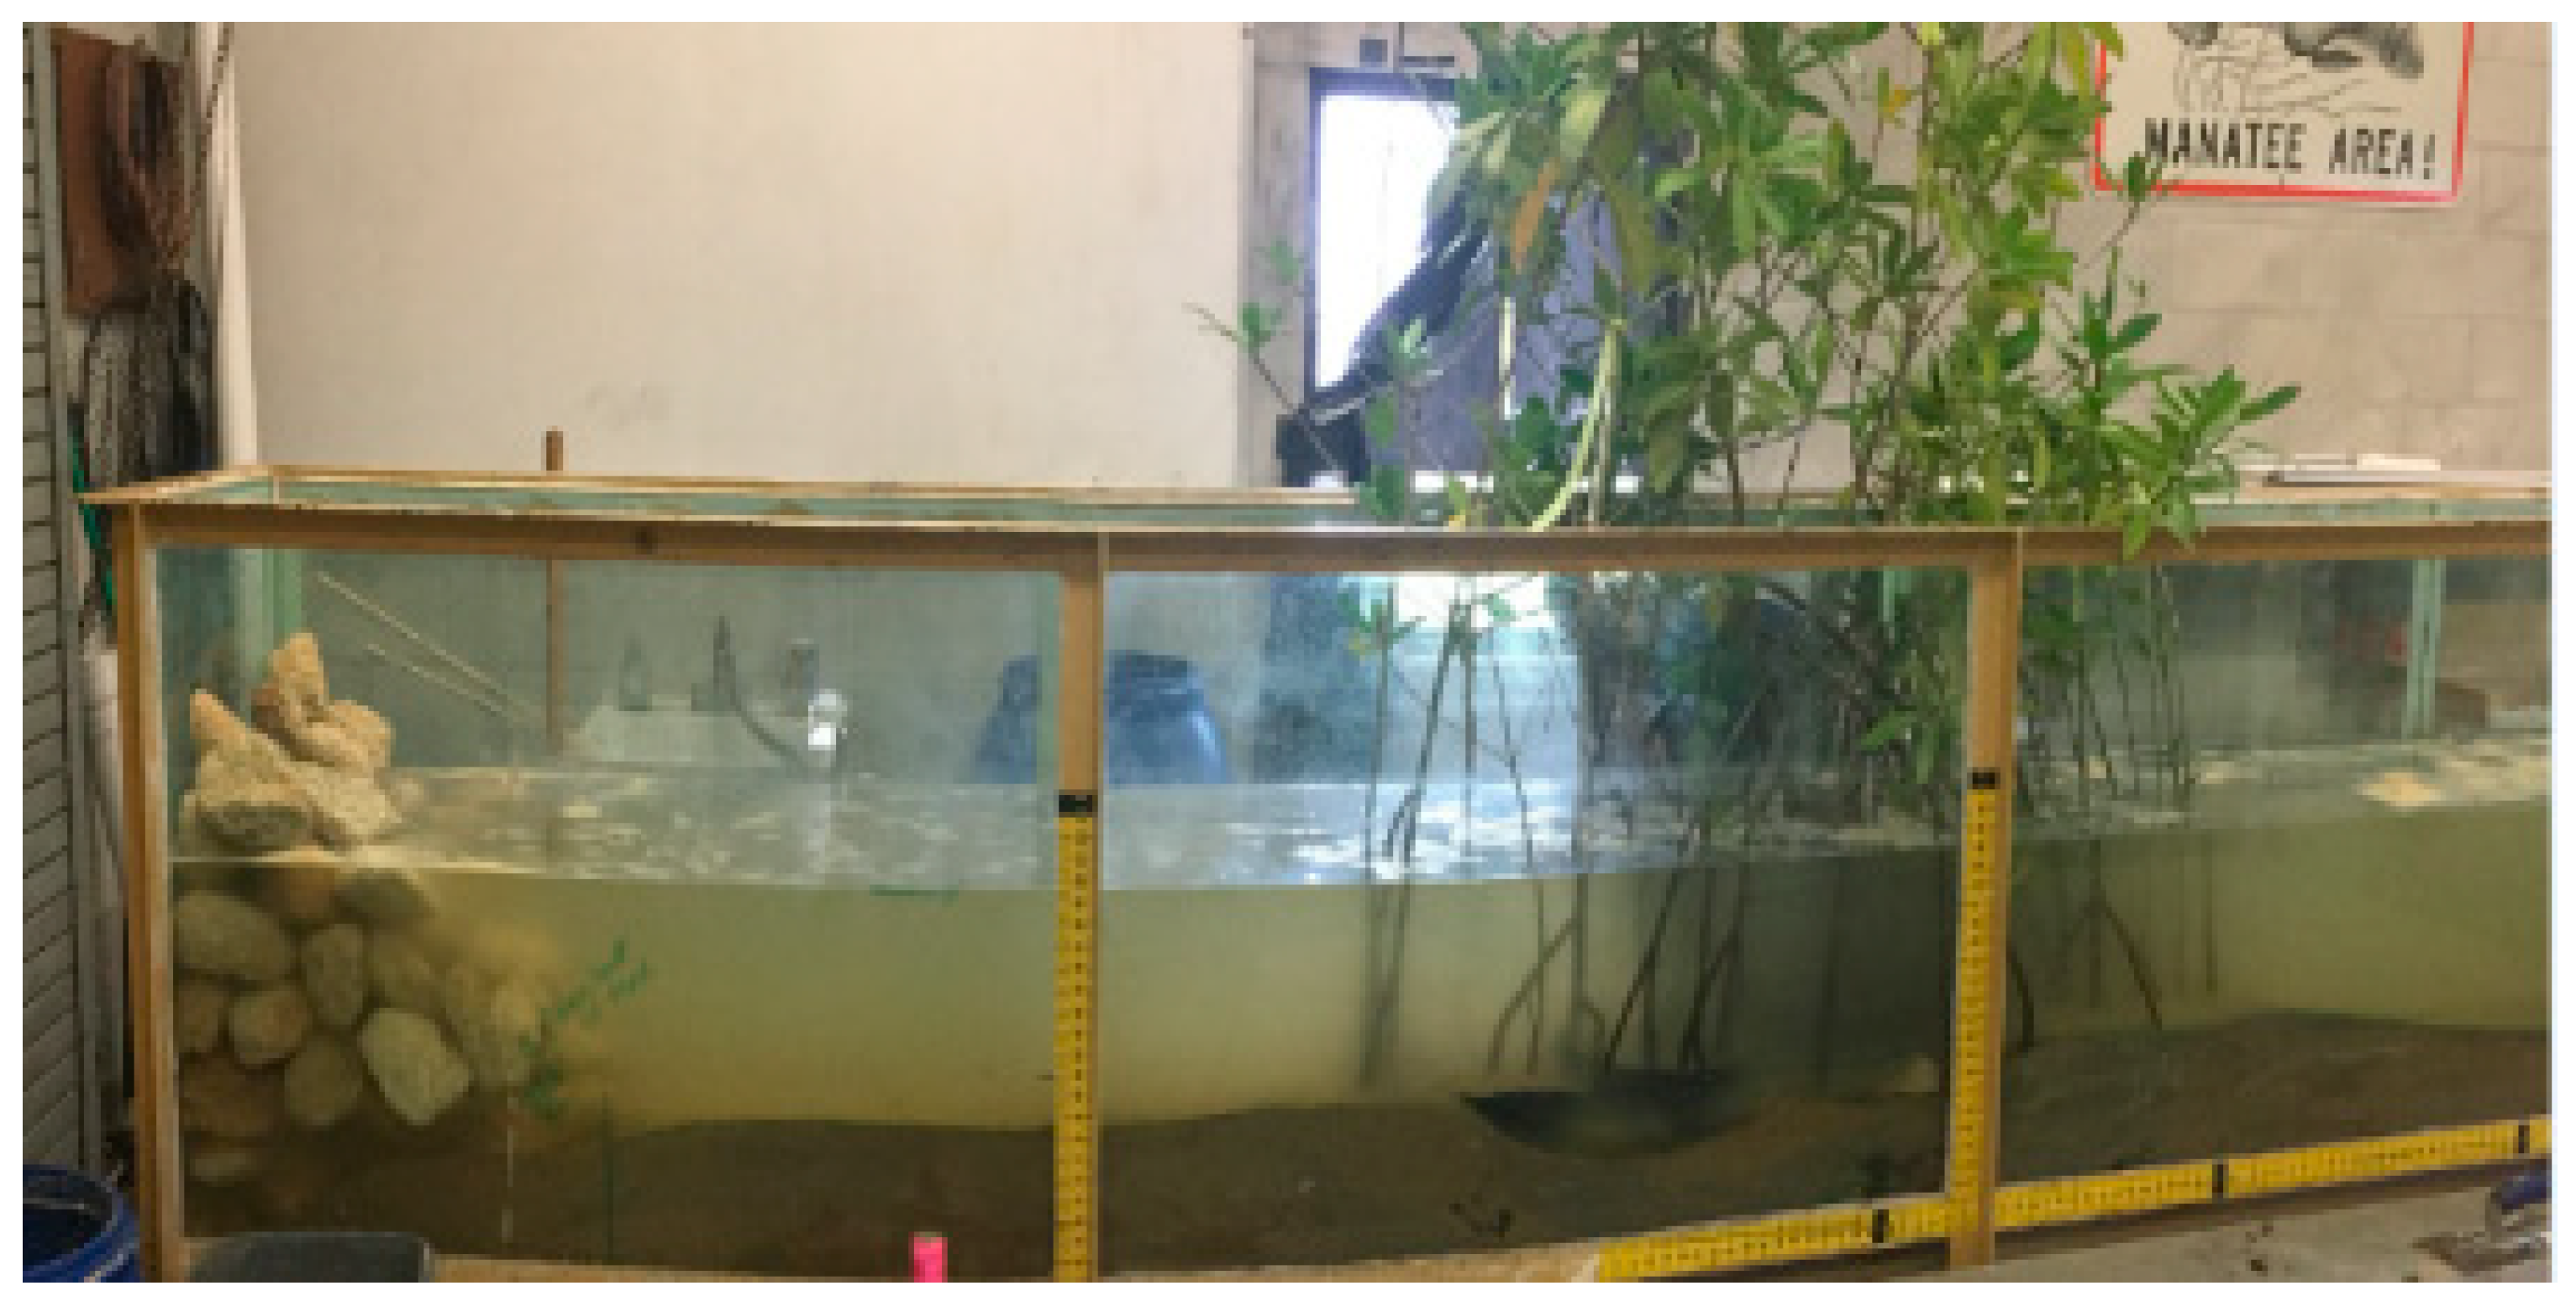
Figure 2.
MDMD plan design. Edges of tank are at top and bottom of image; incident waves propagate from the right. One column is highlighted horizontally in the image. Bands are defined vertically in the image and alternate between 5 and 6 rows.
Figure 2.
MDMD plan design. Edges of tank are at top and bottom of image; incident waves propagate from the right. One column is highlighted horizontally in the image. Bands are defined vertically in the image and alternate between 5 and 6 rows.
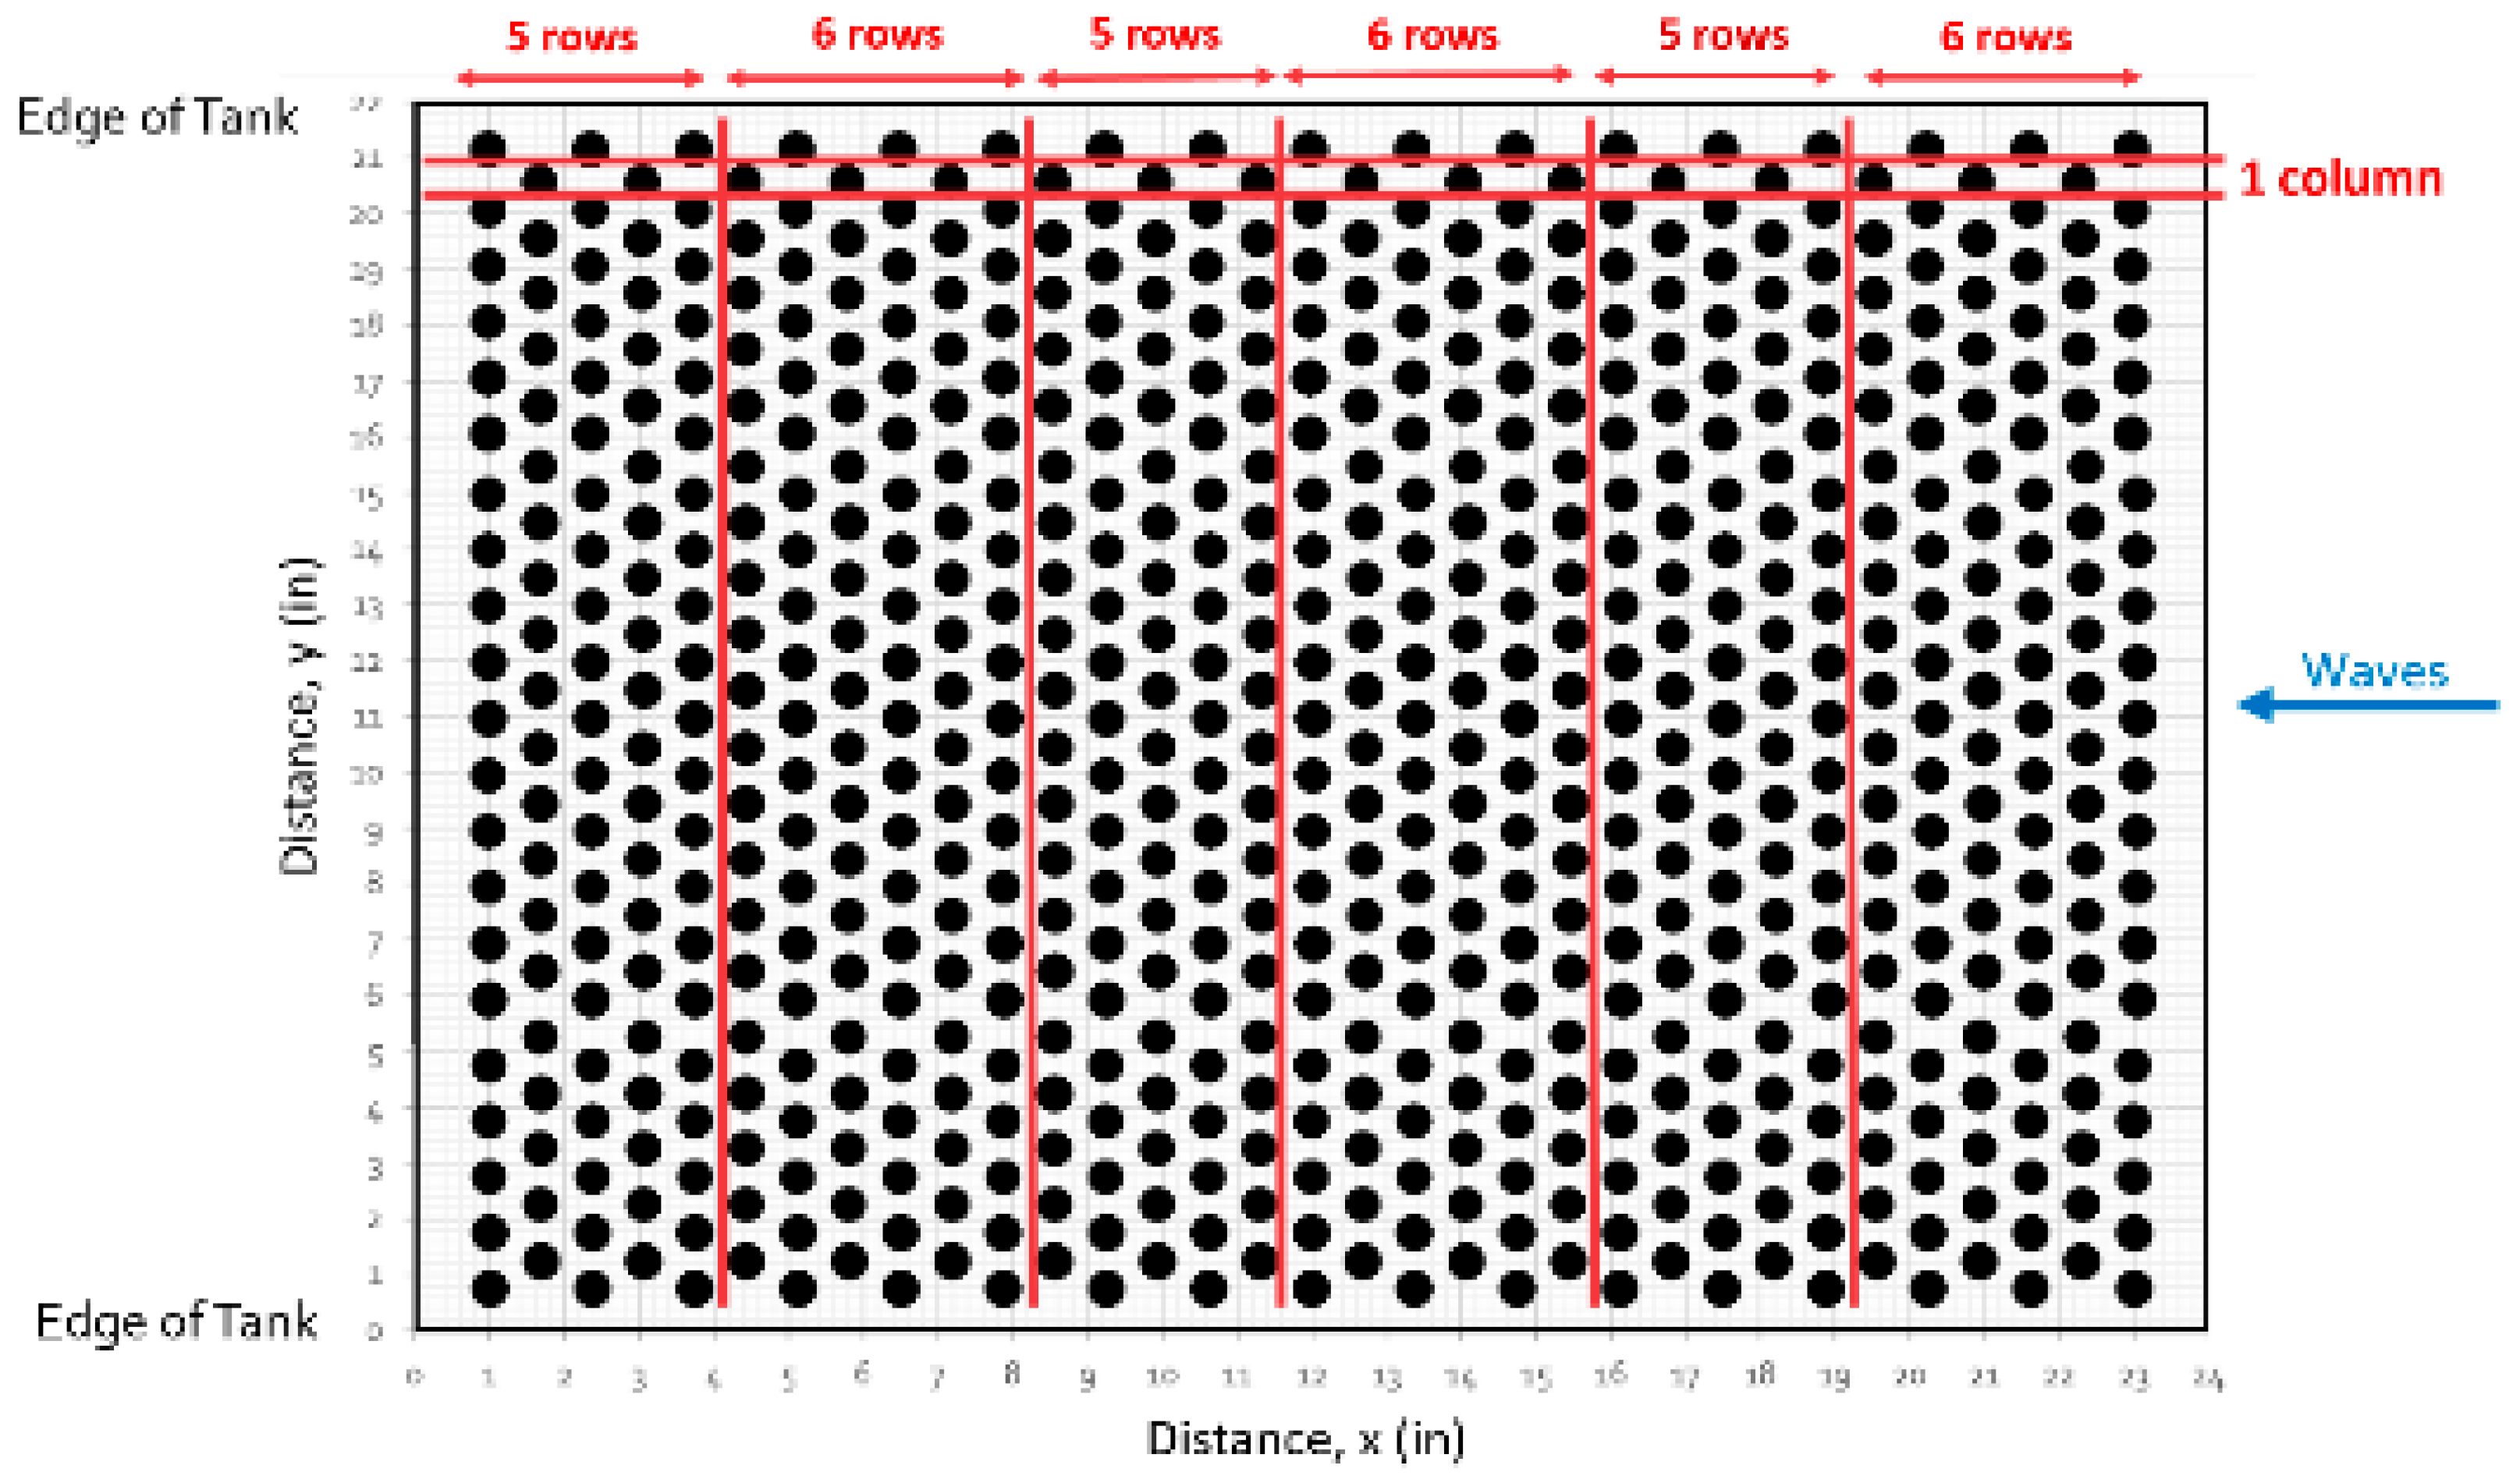
Figure 3.
Field measurement of Red Mangrove aerial root.
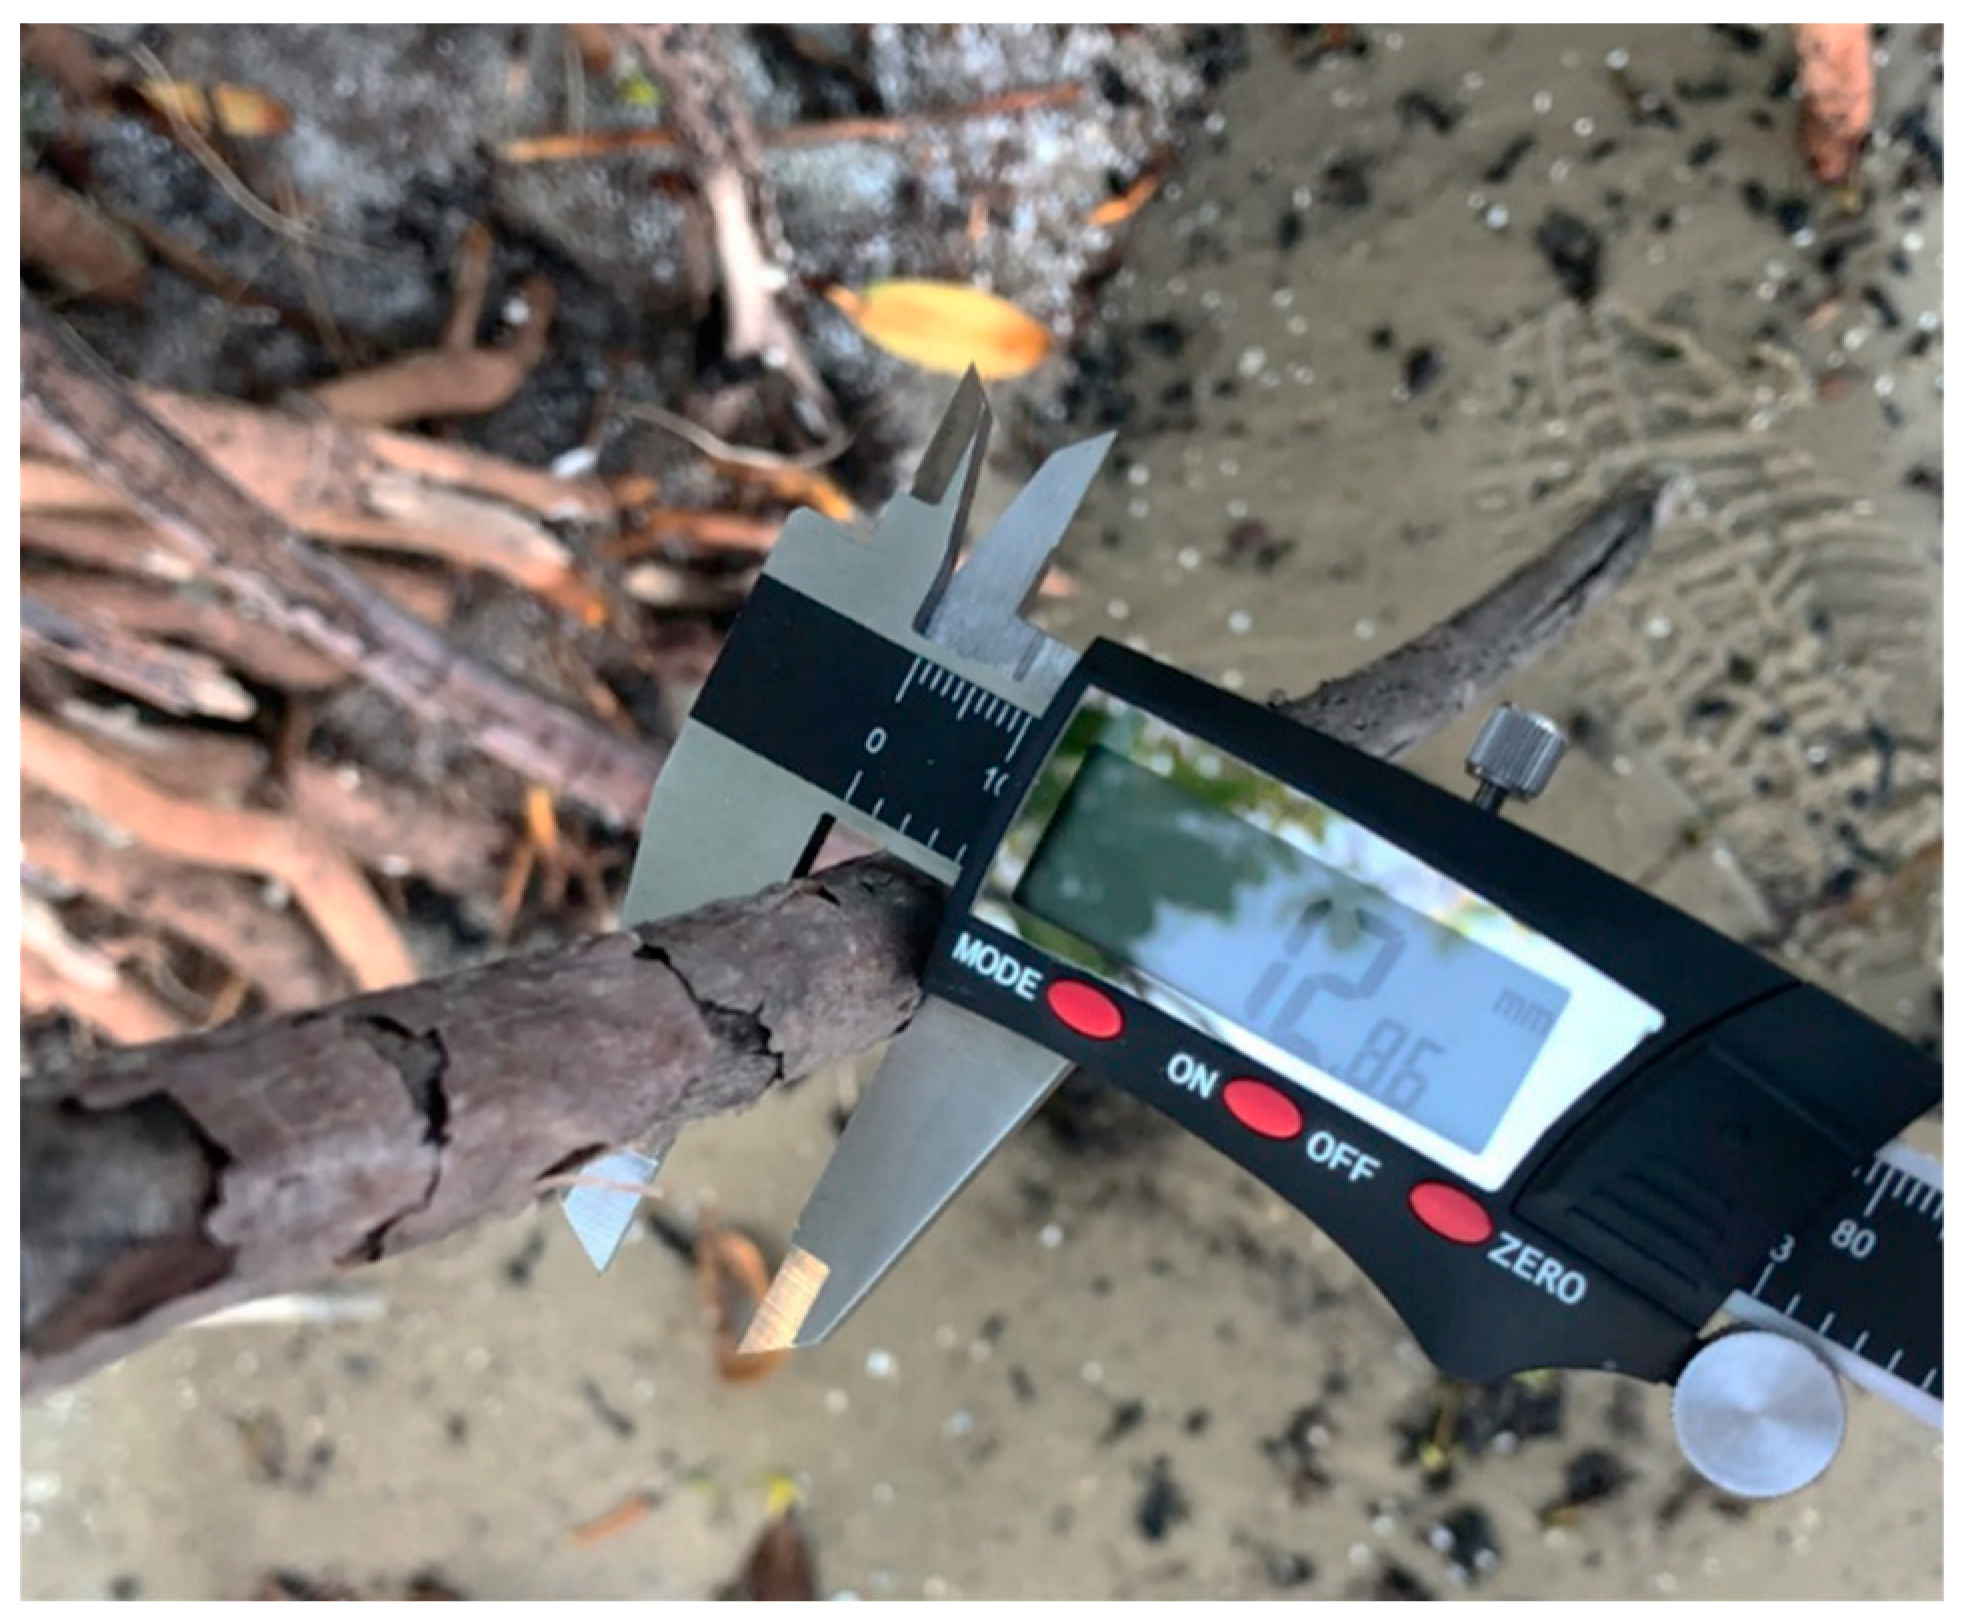
Figure 4.
Initial cross-sectional profile for sediment stabilization tests without MDMD. Mesh A-frame is visible on the left side of the image. Vertical markings are station locations used for measurements.
Figure 4.
Initial cross-sectional profile for sediment stabilization tests without MDMD. Mesh A-frame is visible on the left side of the image. Vertical markings are station locations used for measurements.
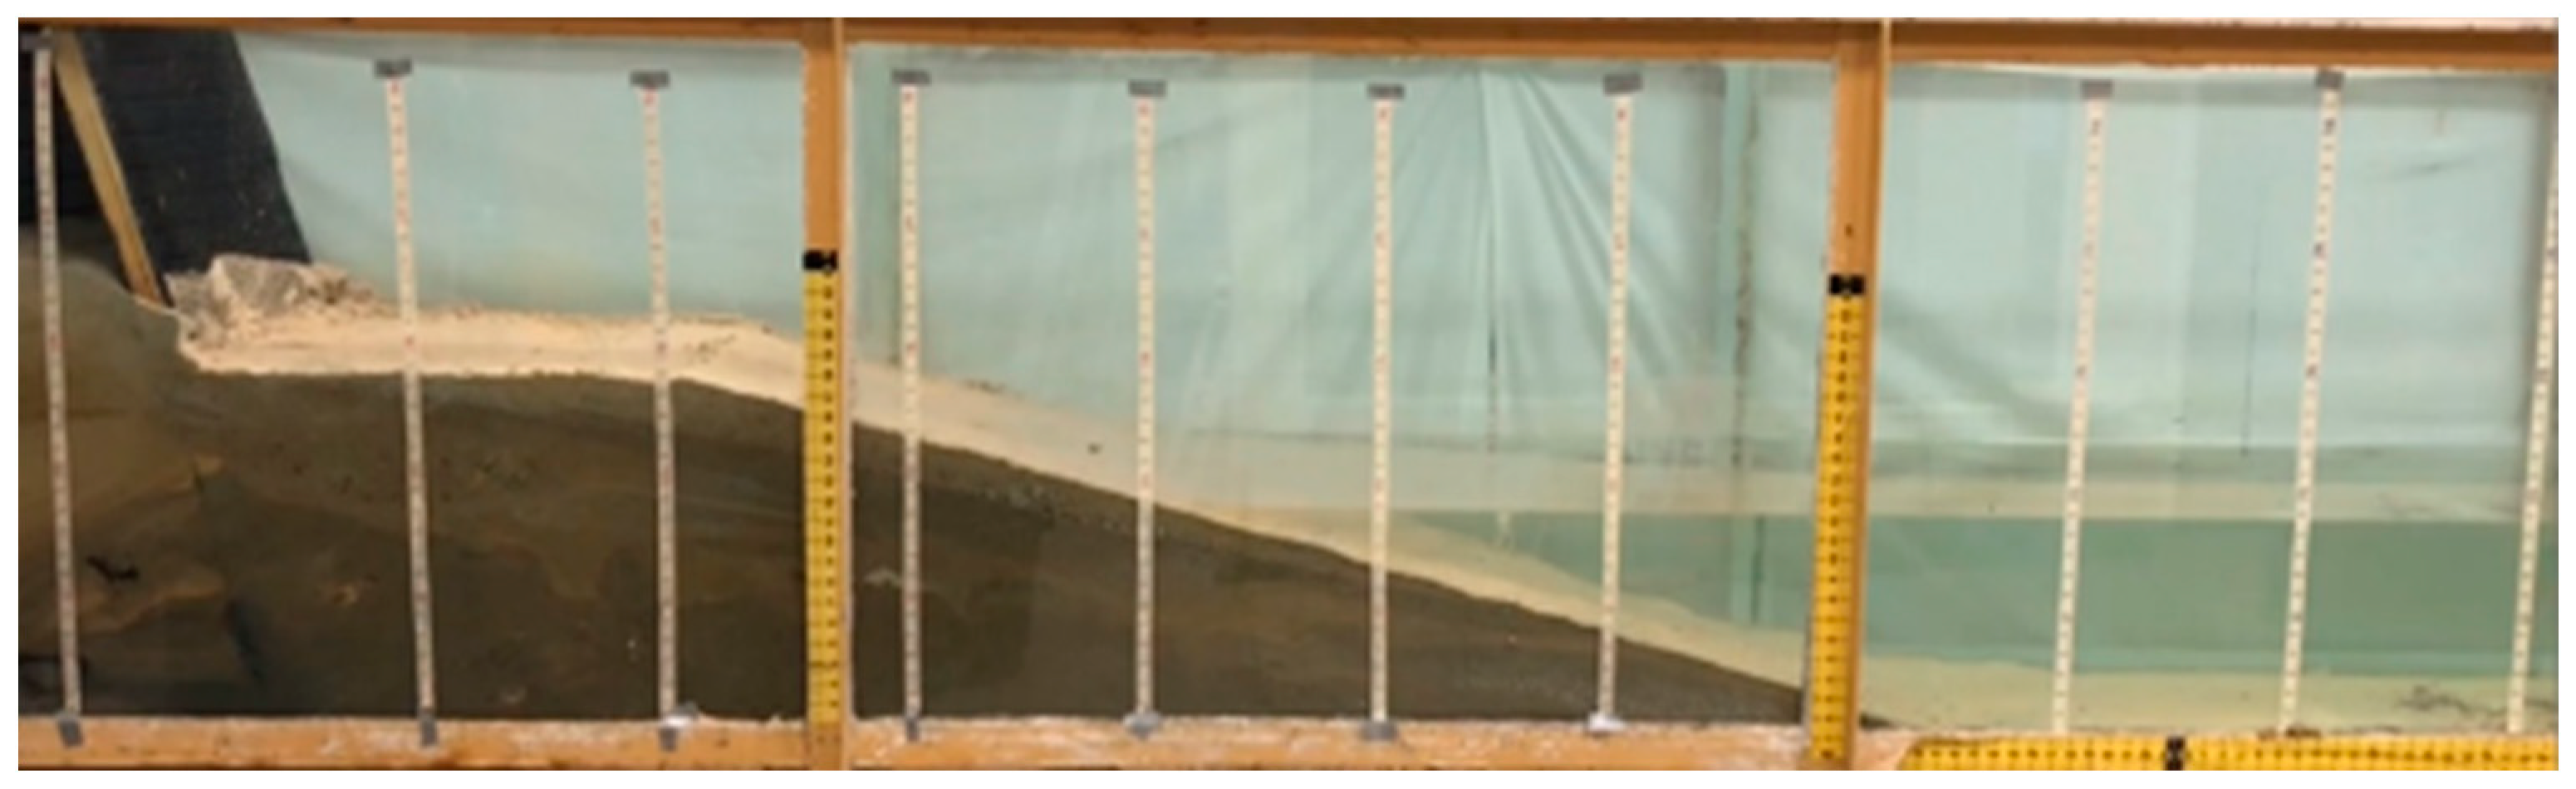
Figure 5.
Location of MDMD on cross-sectional profile in wave tank with band widths. The wave generator is located on the right side of the image.
Figure 5.
Location of MDMD on cross-sectional profile in wave tank with band widths. The wave generator is located on the right side of the image.
Figure 6.
The wave reduction effects due to forest width are shown with respect to the front area coverages. Red lines and markers are for 1.5 second wave periods and blue lines and markers are for 1 second wave periods. Star markers are 5-row bands and square markers are 11-row bands.
Figure 6.
The wave reduction effects due to forest width are shown with respect to the front area coverages. Red lines and markers are for 1.5 second wave periods and blue lines and markers are for 1 second wave periods. Star markers are 5-row bands and square markers are 11-row bands.
Figure 7.
Front area coverage effects on wave transmission through MDMD.
Figure 8.
Average equilibrium profiles from MHW testing for the (a) 1- and 2-band tests and (b) the 2-, 4-, and 6-band tests. Control is in grey for both figures, with the initial profile in orange.
Figure 8.
Average equilibrium profiles from MHW testing for the (a) 1- and 2-band tests and (b) the 2-, 4-, and 6-band tests. Control is in grey for both figures, with the initial profile in orange.
Figure 9.
Average equilibrium profiles from MSL testing.
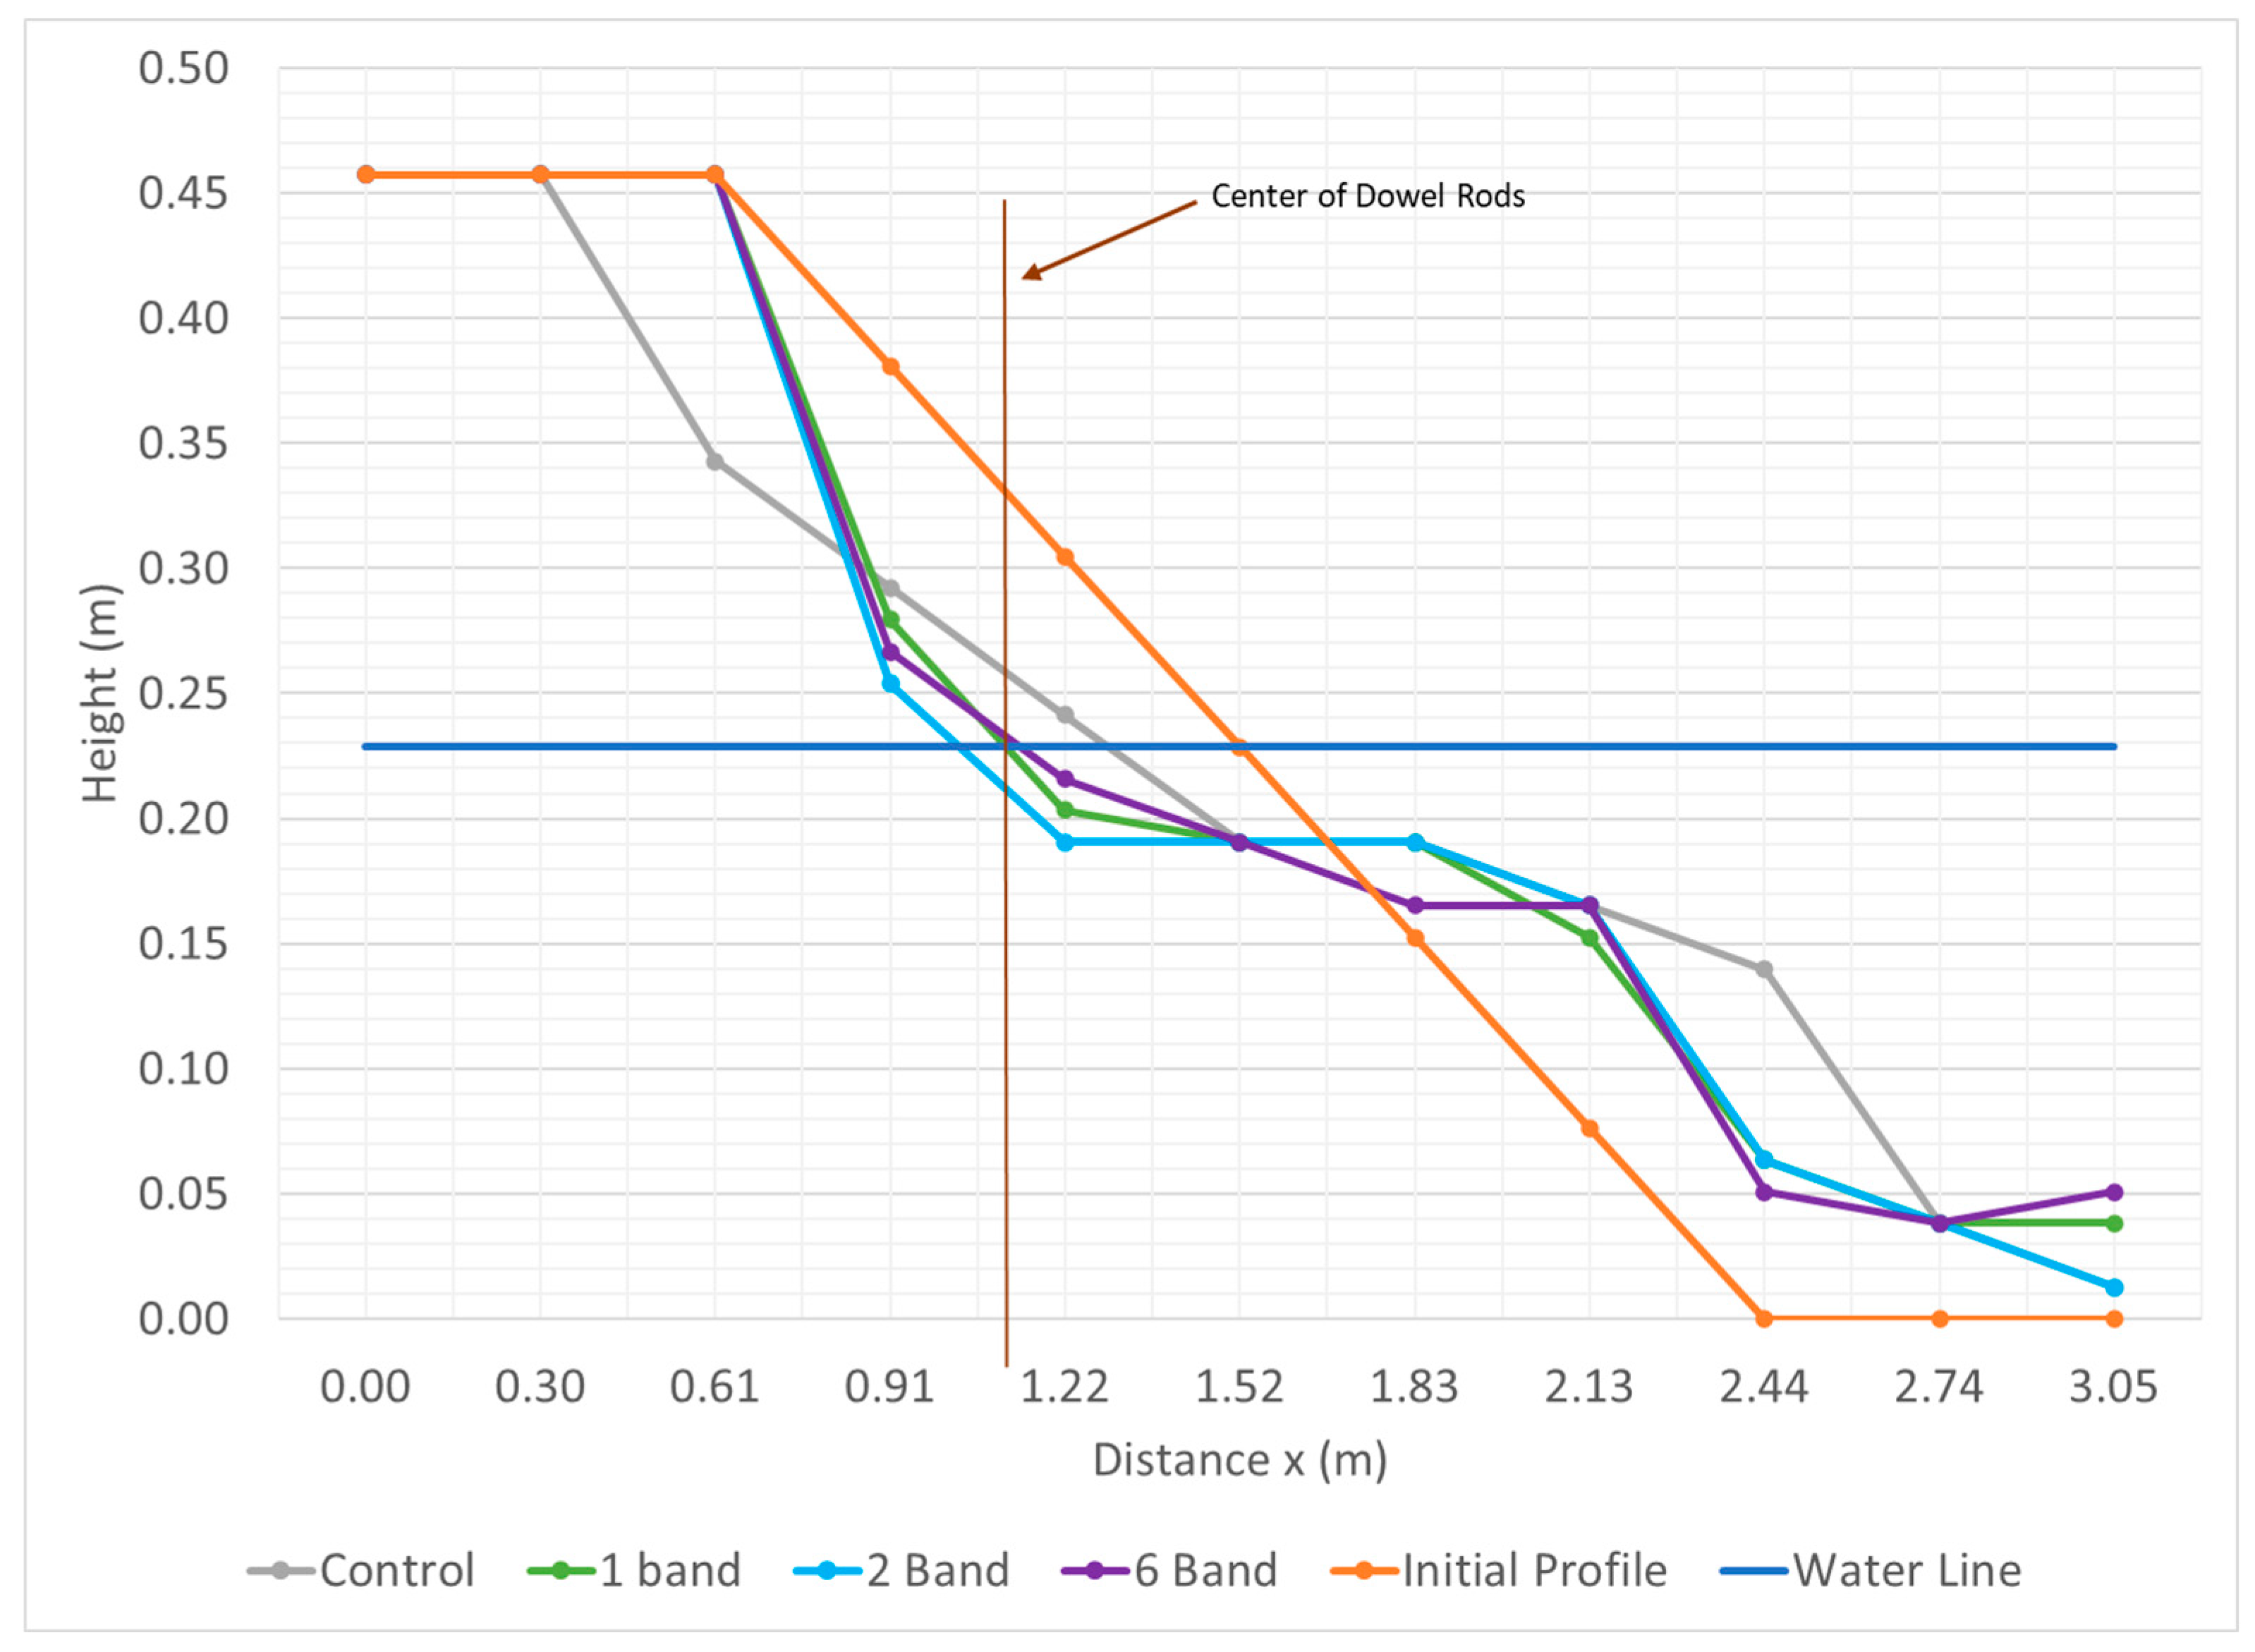
Figure 10.
Average equilibrium profiles from AHW testing.
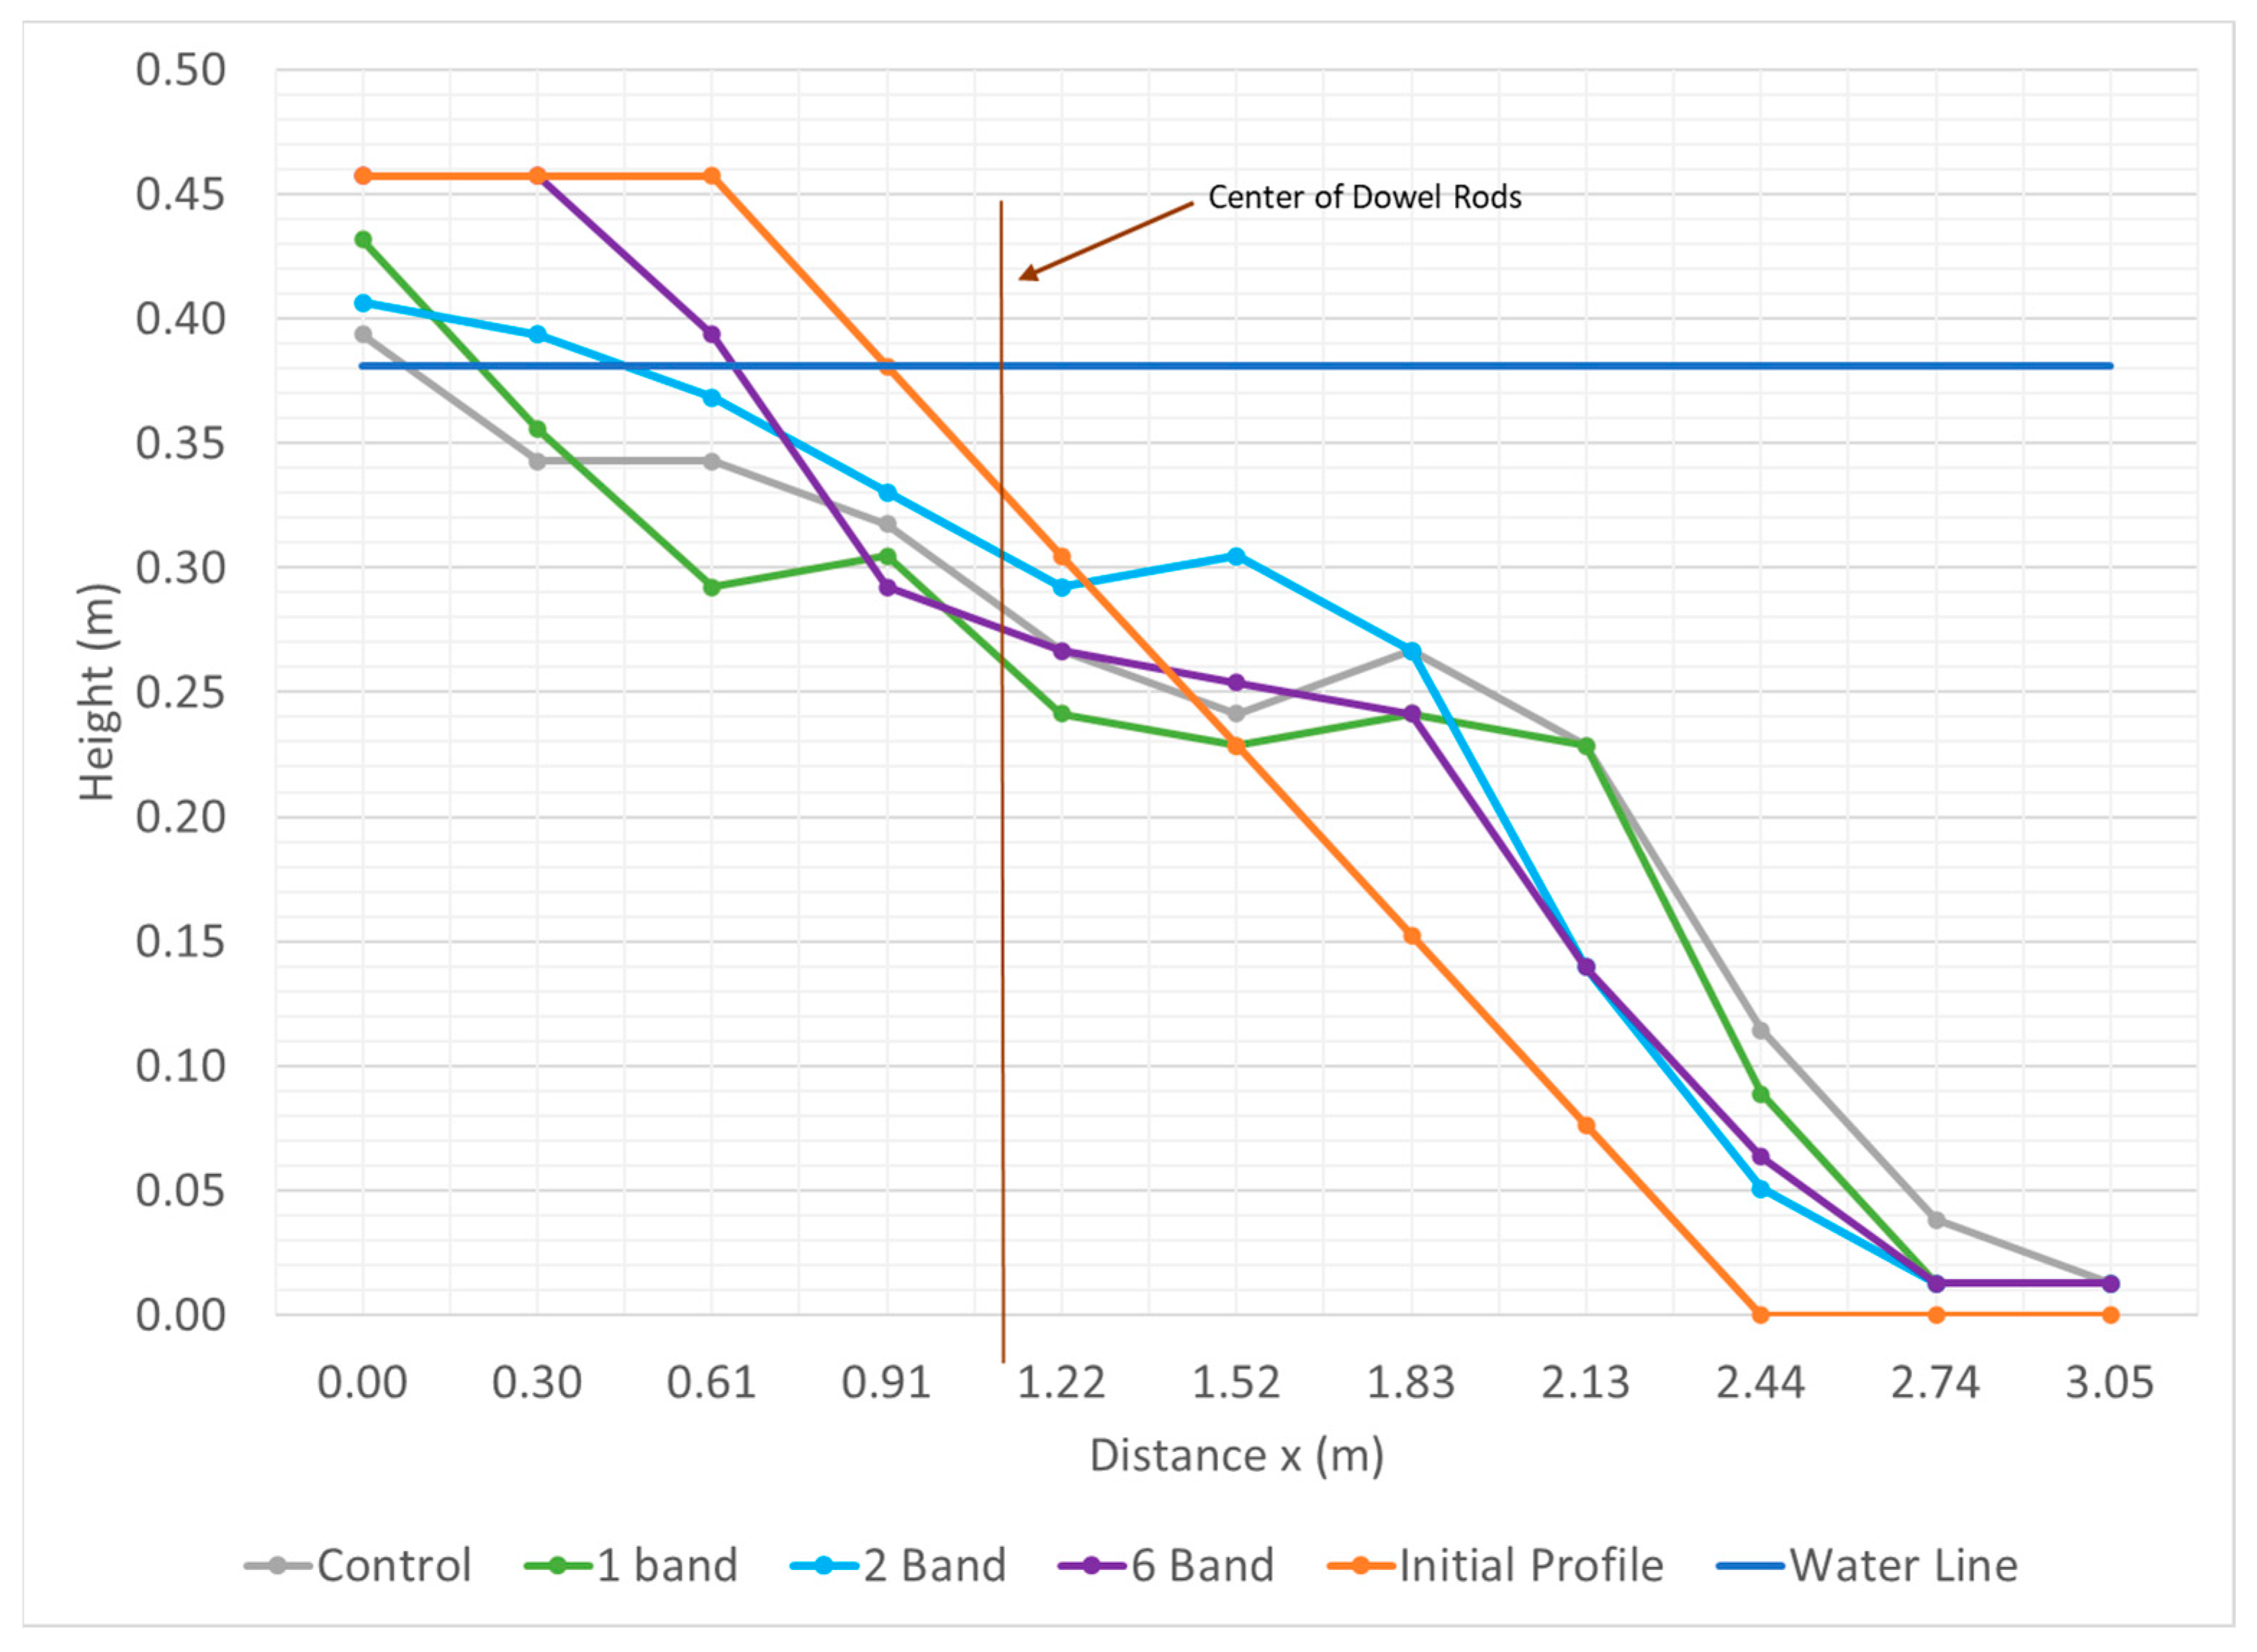
Figure 11.
Average sediment transport at MHW at each station.
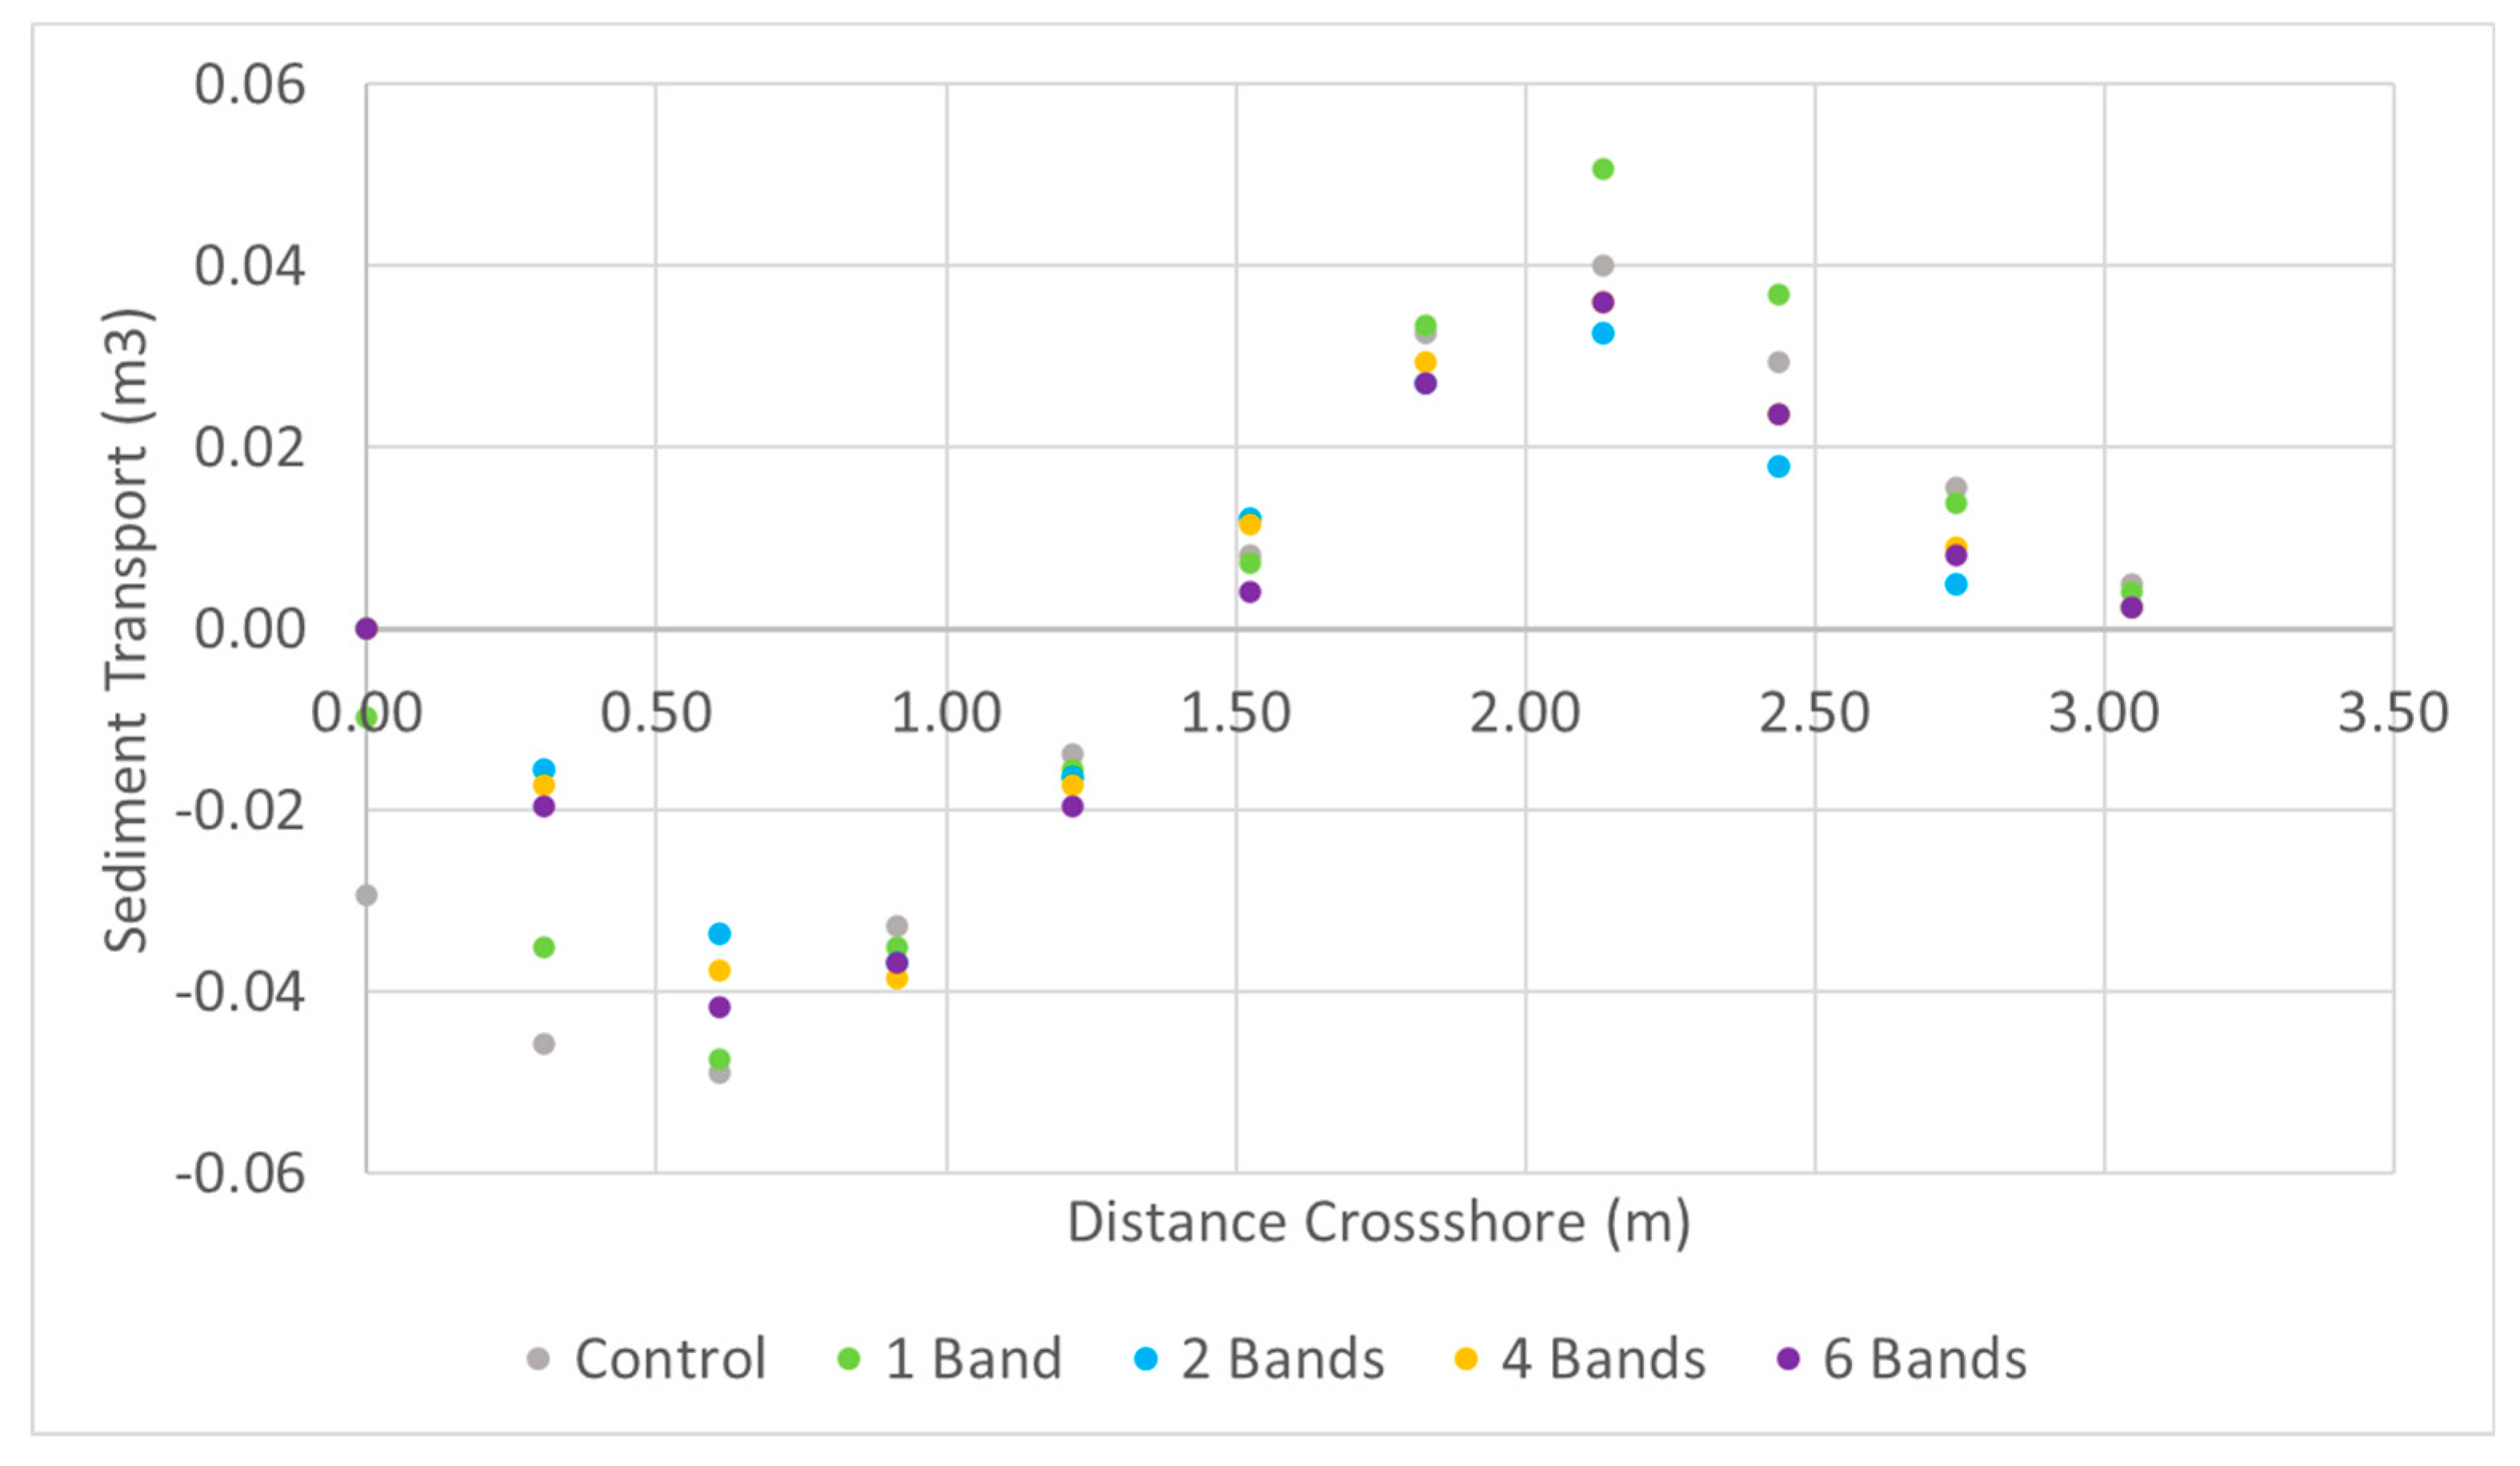

Table 1.
The results and error difference for the live mangroves and the dowel system are shown for periods ranging from 1 second to 1.5 seconds, using a flap paddle.
Table 1.
The results and error difference for the live mangroves and the dowel system are shown for periods ranging from 1 second to 1.5 seconds, using a flap paddle.
| Wave Reduction Factor | % Difference | |||
|---|---|---|---|---|
| Period (s) | Paddle type | Live Mangroves | Dowels | |
| 1 | Flap | 0.62 | 0.66 | 5.7% |
| 1.2 | Flap | 0.72 | 0.77 | 0.7% |
| 1.5 | Flap | 0.76 | 0.78 | 2.7% |
| Average | 2.5% | |||
Table 2.
Measured berm retreat during the test cases.
| Test Case | Berm Retreat (m) | ||||
|---|---|---|---|---|---|
| Control | 1-Band | 2-Band | 4-Band | 6-Band | |
| AHW | 0.61 | 0.61 | 0.61 | n/a | 0.30 |
| MHW | 0.53 | 0.46 | 0.10 | 0.14 | 0.17 |
| MSL | 0.10 | 0.00 | 0.00 | n/a | 0.00 |
Disclaimer/Publisher’s Note: The statements, opinions and data contained in all publications are solely those of the individual author(s) and contributor(s) and not of MDPI and/or the editor(s). MDPI and/or the editor(s) disclaim responsibility for any injury to people or property resulting from any ideas, methods, instructions or products referred to in the content. |
© 2024 by the authors. Licensee MDPI, Basel, Switzerland. This article is an open access article distributed under the terms and conditions of the Creative Commons Attribution (CC BY) license (http://creativecommons.org/licenses/by/4.0/).
Copyright: This open access article is published under a Creative Commons CC BY 4.0 license, which permit the free download, distribution, and reuse, provided that the author and preprint are cited in any reuse.


