
Submitted:
17 February 2024
Posted:
20 February 2024
You are already at the latest version
Abstract
Batch and transport experiments were used to investigate the remediation of a loamy sand soil contaminated with Cr(VI) using zero valent iron nanoparticles (nZVI) stabilized by the carboxy methyl cellulose (CMC-nZVI). The effect of pH, ionic strength (IS), and flow rate on the removal efficiency of Cr(VI) were investigated under equilibrium (uniform transport) and non-equilibrium (Two-site sorption) transport using the Hydrus-1D model. The overall removal efficiency ranged from 70 to over 90% based on the chemical characteristics of the CMC-nZVI suspension and the transport conditions. The concentration and pH of the CMC-nZVI suspension had the most significant effect on the removal efficiency and transport of Cr(VI) in the soil. The average removal efficiency of Cr(VI) was increased from 24.1 to 75.5% when the concentration of CMC-nZVI nanoparticles was increased from 10 to 250 mg L-1, mainly because of the increased total surface area at larger particle concentration. Batch experiments showed that removal efficiency of Cr(VI) was much larger under acidic conditions. The average removal efficiency of Cr(VI) reached 90.1 and 60.5 % at pH 5 and 7, respectively. The Two-site sorption model described quite well (r2 = 0.96-0.98) the transport of Cr(VI) in soil as compared to the uniform transport model (r2 = 0.81-0.98). The average retardation of Cr(VI) was 3.51 and 1.61 at pH 5 and 7, respectively, indicating earlier arrival for the breakthrough curves and shorter time to reach maximum relative concentration at lower pH. The Hydrus-1D model has proven to be an efficient tool for assessing the removal of Cr(VI) pollutants, offering innovative, cost-effective, and environmentally friendly remediation methodologies.
Keywords:
Nanosized zero valent iron (nZVI)
; heavy metals
; soil contamination
; transport modeling
1. Introduction
Contamination with heavy metal pollutants has become a worldwide problem, and a serious threat to the environment. Nowadays, there is a dramatically increasing global concern regarding pollution of soil and water resources with heavy metal contaminants, mainly due to its detrimental impacts on human health and natural ecosystems [1,2,3]. Heavy metals contamination is usually related to several anthropogenic activities including industrial production, mining, and waste disposal sites [4]. Irrigation with low quality water that is contaminated with heavy metals, due to discharge of wastewater (e.g. mines and industrial wastewater) into different water resources, can significantly increase the amount of heavy metals in soils [5]. In addition, flooding events occurring in areas near mines and tailings regions can lead to increased mobilization of heavy metals, and their transfer to agricultural land, enabling their spreading into the plants, animals, and eventually humans [6].
Several factors control the retention and transport of heavy metal contaminants in subsurface layers and groundwater including type and concentration of heavy metal ions, the physiochemical soil properties, and climatic conditions. Biodegradation of heavy metals in soil is extremely difficult. Therefore, decontamination of polluted soil and water is usually carried out using highly reactive adsorptive materials, which reduce or adsorb heavy metals through different mechanisms [7]. In recent years, the interest in the application of zero-valent iron nanoparticles (nZVI) for in-situ remediation of contaminated soils has grown dramatically [8]. The high efficiency of nZVI in the remediation of heavy metal ions is related to its large surface area and potential mobility in the subsurface due to its small size [9]. In addition, the strong reducing power of nZVI nanoparticles increases its ability to decontaminate heavy metals through reduction/precipitation mechanisms [10]. Due to their extremely small size and unique properties, nZVI nanoparticles have higher reactivity for a wide range of contaminants including heavy metal ions [11].
Chromium (Cr) compounds have been used in several industrial and manufacturing applications including the fabrication of steel alloy, dyeing, tanning, ceramics, and paints [12]. Excessive concentrations of Cr have been detected in the soils close to industrial sites of wood processing, leather tanning, and pigment production [13,14]. In Saudi Arabia, interest over pollution with heavy metal contaminants at disposal sites and in areas surrounding industrial regions has increased dramatically in recent years [15,16]. Studies have indicated the presence of several heavy metals (e.g. As, Cr, Pb, Co, Cd, Zn, and Cu) in the soils and groundwater resources in concentrations that ranged between acceptable to above threshold limits according to the standards of the World Health Organization (WHO) [17]. In this regard, several studies conducted in south Riyadh City have reported the presence of Cr in the soil in concentrations exceeding acceptable limits [14,18].
Several studies have investigated the in-situ remediation of Cr(VI) using nZVI nanoparticles [19,20,21]. For example, remediation efficiency of Cr(VI) reached 99% in a soil contaminated by tannery wastes (Cr(VI) = 43.3 mg Kg-1) when 5 g L-1 nZVI suspension was used for in-situ remediation for a period of 40 days [20]. Similarly, Du et al. [12] reported a complete reduction in chromium ore processing residue containing 15.9 mg Kg-1 Cr(VI) using 6% (w/w) nZVI nanoparticles. Despite the great potential for nZVI nanoparticles to remediate Cr contamination, the exposure of nZVI nanoparticles to the surrounding media, such as atmospheric oxygen and water, oxidizes the nZVI to iron oxides, which reduces the surface charge on the nZVI nanoparticles and highly decreases its reactivity. As dissolved oxygen and water interact with the active surfaces of nZVI nanoparticles, the particles are oxidized to iron oxides, which greatly reduces the reactivity of the particles [22]. Moreover, nZVI nanoparticles quickly agglomerate forming aggregates in the microns size, hence limiting its transport in soil and reducing its efficiency in remediation processes [13].
To overcome these problems, nZVI nanoparticles are usually stabilized using polymer coatings to maintain reactivity and reduce aggregation [23]. For example, Yang et al. [24] assessed the stability of nZVI nanoparticles of nano-iron slurries using visual assessment of gravitational sedimentation and observed fast aggregation and settlement of the nZVI nanoparticles in bare as compared to stabilized nZVI nanoparticles. He and Zhao [25] applied low concentration of Carboxy-methyl-cellulose (CMC) to stabilize Fe/pd bimetallic nanoparticles and reported greater mobility and reactivity when used for dechlorination of trichloroethene. Shi et al. [26] investigated the kinetics of bentonite supported nZVI nanoparticles for the removal of Cr(VI) from aqueous solution. They found that B-nZVI could potentially be used as a new material for in situ remediation process. In their study, Bentonite has been proven to be an effective dispersant and stabilizer in the encapsulation process of nZVI nanoparticles, which reduced aggregation and increased the efficiency of nZVI in the removal of Cr(VI). As the nZVI nanoparticles are stabilized, they remain stable in suspensions for prolonged period, which facilitates its transport into soil and enhances remediation processes [27].
Surface coating or encapsulation of nanoparticles remains a major challenge due to the extremely small size, high surface energy, and high surface area of the nanoparticles [28]. In addition, the physiochemical conditions of soil also play an important role in the remediation processes of heavy metal ions. Even with the application of stabilized-nZVI, factors like pH, ionic strength of the electrolyte solution, residence time, and pore water velocity will greatly affect the surface charge and stability of nZVI nanoparticles as they transport through soil. Most heavy metals contamination studies have focused on batch sorption experiments under equilibrium conditions. However, batch experiments do not provide full understanding of the factors controlling the transport of heavy metals in soil. Therefore, the transport of heavy metals should also be investigated using column transport system under variable flow velocities, which better represents the transport of heavy metals under field conditions. Column transport experiments also allow the application of numerical modeling to simulate measured breakthrough curves (BTC) with both linear and non-linear sorption models under equilibrium and non-equilibrium conditions.
Therefore, the goal of this research was to assess the efficiency of the application of CMC-stabilized nZVI nanoparticles for the remediation of Cr(VI) from a contaminated soil through sets of batch and column transport experiments. The experimental conditions examined the effect of the concentration of nZVI nanoparticles, a range of pH and ionic strength for the background solution, and variable flow rates on the efficiency of the reduction immobilization and transport of Cr(VI) in soil. The HYDRUS-1D model was used to investigate the sorption and transport of heavy metals under variable saturation conditions, and to correlate the experimental data to simulation results. The specific research objectives were to: (1) evaluate the effect of pH and IS of CMC-stabilized nZVI nanoparticle suspensions on reduction and removal efficiency of Cr(VI) from a contaminated loamy sand soil; (2) evaluate the effect of CMC-stabilized nZVI nanoparticles on the transport of Cr in soil columns under variable pore water velocities; and (3) simulate sorption and transport of Cr(VI) through soil under equilibrium, and physical (dual-permeability) and chemical (two-site sorption) non-equilibrium conditions.
2. Materials and Methods
2.1. Soil sampling and analysis
A soil sample was collected from the top 30 cm of the soil surrounding the industrial area (24◦ 32ʹ 58.1” N and 46◦ 55ʹ 30.0” E) in the south of Riyadh city. Previous studies have indicated that these soils are highly contaminated with several heavy metal contaminants including Cr [14]. The soil sample was air-dried and passed through a 2 mm sieve. The physical and chemical characteristics of the soil sample were determined according to standard procedures [29]. The particle size distribution was determined by the pipette method. The soil moisture characteristics were determined by the pressure plate apparatus in the water potential range of 10-1500 KPa [30]. The saturated hydraulic conductivity was determined by the constant-head method [31]. The mineral composition of the soil samples was examined with X-ray diffractometer, (Shimadzu XRD 7000). The specific surface area of the soil was determined by the Brunauer, Emmett and Teller (BET) method with nitrogen (N2) at 77 K as the sorbate using surface area and microporosity analyzer (ASAP 2020, Micromeritics, USA). The zeta potential of the collected soil sample was measured using Zetasizer Nano ZS Series Instrument (Malvern Instrument Ltd, UK). The soil was sieved through a 150 µm, and a 250 mg L-1 soil suspension was prepared using nano pure water. The soil suspension was allowed to settle down for 48 hrs., and the supernatant was collected. Twenty zeta potential readings of the soil suspension were measured, and the average value was recorded. The concentration of Cr(VI) in the collected soil sample was determined by the 1, 5-diphenylcarbazide colorimetric method (USEPA method 7196A). The absorbance was measured at a wavelength of 540 nm using UV/VIS Spectrophotometer (Genesys 10S UV-VIS, Thermo Scientific). The total Cr concentration was measured using ICP-AES (Perkin Elmer) after acid digestion of soil samples [32].
2.2. Synthesis and characterization of bare and stabilized nZVI nanoparticles
Zero valent iron nanoparticles (nZVI) were synthesized by chemical reduction using sodium borohydride (NaBH4) as the reducing agent [25], according to the following reaction:
The stabilization of nZVI nanoparticles with the Carboxy-methyl-cellulose (CMC) polymer was carried out during the preparation. The CMC-nZVI nanoparticles were synthesized in a 500 ml flask reactor with three open necks. An aqueous solution of 0.1 M iron chloride (FeCl3.6H2O, dissolved in a mixture of 4:1 (V/V) ethanol to DI water) was added to a 5 g L-1 of CMC solution, and a mechanical stirrer was housed in one neck of the reactor to ensure vigorous stirring of the solution for 30 min. A solution of 0.2 M Sodium borohydride (NaBH4, dissolved in DI water) was introduced to the mixture dropwise through the second neck of the reactor. The third neck was used to purge N2 gas throughout the preparation time. Stirring of the mixture continued for another 30 min to ensure the completion of the reaction. The nZVI nanoparticles were collected by vacuum filtration, washed three times with ethanol, rinsed with deoxygenated DI water, and dried in an oxygen free chamber.
Dynamic light scattering (DLS) techniques were used to measure the hydrodynamic size of the prepared CMC-nZVI nanoparticles. Sodium bicarbonate (NaHCO3) was used as the background electrolyte solution in all experiments. Two concentrations were used for the NaHCO3 background electrolyte solution (0.01 and 0.001 M). The zeta potential of the prepared CMC-nZVI nanoparticle suspensions was quantified by measuring the electrophoretic mobility on a Zetasizer Nano ZS Series Instrument (Malvern Instrument Ltd, UK). The concentration of the CMC-nZVI nanoparticles was determined using UV/VIS Spectrophotometer at 508 nm wavelength (Genesys 10S UV-VIS, Thermo Scientific). A calibration curve was developed for every measurement by diluting the freshly prepared CMC-nZVI nanoparticles suspension to known aqueous concentrations. The synthesized CMC-nZVI nanoparticles were dried in oven at 60 °C, and the dry powder was used to determine the specific surface area of the CMC-nZVI nanoparticles by the BET method with nitrogen (N2) at 77 K as the sorbate using surface area and microporosity analyzer (ASAP 2020, Micromeritics, USA).
The classical Derjaguin, Landau, Verwey, and Overbeek (DLVO) theory was used to calculate the total interaction energy on the surfaces of the synthesized CMC-nZVI nanoparticles. The DLVO calculates the sum of van der Waals attractive and electric double layer repulsive forces that exist between CMC-nZVI nanoparticles. The interaction between two CMC-nZVI nanoparticles was considered to be a sphere-sphere interaction. The details of the calculations of ionic strength of the background electrolyte solution, the Debye-Huckel length, and the equations used for the calculation of the DLVO interactions are presented in appendix A.
2.3. Batch experiments of Cr(VI) reduction in the soil
The reduction/precipitation mechanism for the removal of Cr(VI) by nZVI nanoparticles results in the production of iron and chromium hydroxides according to the following equations [33]:
Batch experiments were carried out at 252 oC in the laboratory to evaluate the efficacy of stabilized CMC-nZVI nanoparticles for the reduction of Cr(VI) in the collected soil. Two g of the soil (initial Cr(VI) was 100 mg Kg-1, see section 3.1 in Results and Discussion) were transferred to polyethylene 50 ml Falcon tubes, and 20 ml (ratio of 1:10) of CMC-nZVI suspensions was added. Eight concentrations (0, 10, 50, 100, 150, 250, 350, and 450 mg L-1) of the CMC-nZVI nanoparticles were used to determine the concentration at which the maximum reduction of Cr(VI) occurs. CMC-nZVI nanoparticle suspensions were prepared in an electrolyte solution of 0.01 and 0.001 M NaHCO3. The pH of the prepared suspensions was adjusted to 5 and 7 with 0.1 M of HCl or NaOH solutions. The designated pH was monitored throughout the experiment and was checked again at the end of the shake time before measurement. The reaction mixture was allowed to react for 2 h with continuous shaking at 150 rpm. After that, the samples were centrifuged at 5000 rpm for 15 min, the supernatant was collected and filtered using 0.45 µm PTFE syringe filter.
The residual Cr(VI) in the filtrate and the total Cr were determined according to the procedure mentioned before. The removal efficiency of Cr(VI) was calculated according to the following equation:
where Ci and Ce are the initial and supernatant concentrations of Cr(VI), respectively. The removal capacity of the CMC-nZVI nanoparticles was calculated as:
where V is the volume of the aqueous solution (L), and m is the mass of adsorbent (g).
To assess the reaction kinetics of Cr(VI) removal, batch experiments were repeated at the above mentioned conditions (CMC-nZVI concentration of 250 mg L-1), and the analysis was carried out at 15, 30, 60, 90, 120, and 180 min time intervals. Three kinetic models were used to describe the reduction of Cr(VI) by CMC-nZVI nanoparticles: the pseudo-first order, pseudo-second order, and the Langmuir-Hinshelwood first order kinetic models. The three kinetic models were mathematically presented according to the following equations [34,35]:
where qe and qt (mg g-1) are the removal capacity at equilibrium and at time t (min), K1 (min-1), K2 (g mg-1 min-1), and K3 (min-1) are the rate constants of the pseudo-first order, the pseudo-second order, and the Langmuir-Hinshelwood first order adsorption, respectively, and t is the remediation time (min).
2.4. Column experiments
The effect of the CMC-nZVI nanoparticles on the removal of Cr(VI) was also investigated using acrylic soil column with 2.5 cm I.D. and 15 cm length. The column was wet-packed (2 % W/W) with 110 g of the collected soil (bulk density of 1.494 g cm-3) in 3-cm increments to eliminate particle segregation. The column was sealed from bottom and one layer of a nylon membrane (0.45 μm pore opening) was placed at the bottom of the column to prevent passage of soil particles. The hydrodynamic dispersion coefficient was estimated from breakthrough curves obtained with an inert tracer (Cl-). A peristaltic pump was used to pre-condition the soil column by flushing 10 PV of DI water from the bottom at a constant flow of 2.0 cm h-1. By the end of the pre-condition time a leachate volume was collected, and the concentration of Cr(VI) was determined to assess any change in the initial concentration of Cr(VI) in soil.
The transport experiment started by pumping 10 PV of Cr(VI) solution (100 mg L-1) as a pulse input into the system from the bottom. The Cr(VI) solution was pumped at two flow rates (2 and 4 cm hr-1). This was followed by the application of 10 PV of the CMC-nZVI nanoparticle suspension (250 mg L-1, prepared in NaHCO3 electrolyte solution at 0.001 and 0.01 M). The prepared suspensions were adjusted to pH 5 and 7 using 0.1 M of HCl or NaOH solutions. Two flow rates (2.0 and 4.0 cm h-1) were used to pump 10 PV of the CMC-nZVI suspensions through the column. The CMC-nZVI suspensions were sonicated for 10 min before use. Finally, the column was flushed with DI water until the final time for the simulation (60 hrs.). The outflow from the column was collected with a fraction collector. Leachate collected was filtered using 0.45 µm PTFE syringe filter and analyzed for Cr(VI) and total Cr according to the methodology mentioned before. Each experiment was repeated two times, and all experiments carried out at ambient laboratory conditions (232 ͦ C). Concentration data were presented as relative concentration, and breakthrough curves (BTCs) were plotted as a function of time.
2.5. Simulation of Cr removal and transport
Transport parameters for the collected soil sample were determined by fitting the experimental data of the transport of a conservative tracer (Cl-) using the CXTFIT model [36]. The CXTFIT model provides analytical solution for the one-dimensional transport based on the convection-dispersion equation (CDE) written at equilibrium as:
where C (mg L-1) is the concentration of solute in liquid phase; t (hrs.) is the time; S (mg g-1) is the amount of solute sorbed; D (cm2 hr-1) is the hydrodynamic dispersion coefficient; Z (cm) is soil depth; q (cm hr-1) is the volumetric fluid flux density; ρ (g cm-3) is the soil bulk density; ϴ (cm3 cm-3) is the volumetric water content; and is a sink term related to biological or chemical reactions other than sorption. The hydrodynamic dispersion coefficient (D) of the soil was estimated by nonlinear least-squares parameters optimization method using observed BTC values of the conservative tracer. Soil dispersivity (λ) was estimated based on the values of the hydrodynamic dispersion coefficient ().
The transport of Cr(VI) in soil columns was simulated using the HYDRUS-1D model [37]. The HYDRUS-1D model can be applied to both equilibrium and non-equilibrium transport in soil. Assuming no degradation of the solute, the physical and chemical non-equilibrium model (also known as dual-permeability model with two-site sorption) can be presented as:
where S1 is the solid phase concentration on equilibrium sites (mg g-1); S2 is the solid phase concentration on kinetic non-equilibrium sites (mg g-1).
2.6. Statistical analysis and quality control
All experiments were conducted in three replicates. Statistical analysis was performed using the software SPSS for Windows (version 21, SPSS Inc, Chicago, IL). Data values are presented as averages along with its standard deviation (±1SD). The least significant difference (LSD at P < 0.01) test was applied to assess the differences among the means of the three replicates (SPSS, 2012).
3. Results and Discussions
3.1. Chemical and physical properties of the collected soil
The physical and chemical properties of the collected soil sample are presented in Table 1. Analysis of Cr(VI) in the collected soil showed that the concentration of Cr(VI) was 7.4 mg Kg-1. This concentration, despite still toxic to plants and humans, was deemed low for accurate assessment of the efficiency of CMC-nZVI in the reduction of Cr(VI) in the soil. Therefore, a decision was made to spike the collected soil with a larger concentration of Cr(VI). Four portions of 500 g from the soil were spiked by mixing 500 ml of K2Cr2O7 solution with a concentration of 100 mg L-1 [1]. The mixture was sealed in a plastic container and left for static aging for one week in the laboratory (23 ± 2.0 °C). After one week, the mixture was dried in the oven at 40 °C, ground to pass through a 2-mm sieve, and the four portions were thoroughly mixed to form one soil sample. The homogeneity of the spiked soil and the final Cr(VI) concentration were tested using several samples. The final Cr(VI) concentration was found to be 99 ± 0.85 mg Kg-1.
The specific surface area of the collected soil sample as determined by the BET method was 3.652 ± 0.004 m2 g-1. The t-Plot micropore area was very limited and reached 0.114 m2 g-1, the Barrett-Joyner-Halenda (BJH) adsorption/desorption cumulative volume of pores was 0.0126 cm3 g-1, and the average pore diameter was 138.0 nm. Adsorption/desorption isotherms showed that the maximum quantity adsorbed of the N2 gas was 8.143 cm3 g-1 STP. Adsorption/desorption isotherms of the collected soil were of type II adsorption isotherms and showed a very narrow hysteresis loop that fully closed at a relative pressure of 0.4. The soil moisture characteristics curve was obtained by fitting of measured retention data to the van Genuchten equation using the RETC model (van Genuchten et al., 1991). Results showed that the water content at saturation, field capacity, and wilting point were 0.38, 0.11, and 0.017 cm3 cm-3, respectively. The hydraulic parameters of the van Genuchten equation for the collected loamy sand soil were: ϴs = 0.3817 cm3 cm-3, ϴr = 0.0447 cm3 cm-3, α = 0.0377 cm-1, and n = 1.73.
3.2. Characterization of the synthesized nZVI nanoparticles
3.2.1. BET surface area and microporosity
The specific surface area of the synthesized CMC-nZVI nanoparticles was 7.805 ± 0.007 m2 g-1. Previous research has reported specific surface area of stabilized CMC-nZVI nanoparticles in the range 6.7-12.2 m2 g-1 [21]. Micropore area represented about 19.6% (1.531 m2 g-1) out of the total specific surface area of the CMC-nZVI nanoparticles. The BJH adsorption/desorption cumulative volume of pores of the CMC-nZVI nanoparticles was 0.0157 cm3 g-1, and the average pore diameter was 80.4 nm. The maximum quantity adsorbed of the N2 gas based on the Adsorption/desorption isotherms was 23.821 cm3 g-1 STP (Figure 1). CMC-nZVI Adsorption/desorption isotherms were type II adsorption isotherms and showed a very narrow hysteresis loop that fully closed at a relative pressure of 0.48.
3.2.2. Hydrodynamic size and zeta potential
The measurement of the hydrodynamic size of CMC-nZVI nanoparticles using DLS determines the size of any particle (or aggregate of particles) with certain equivalent diameter to be similar in size. Therefore, chemical conditions (e.g. pH and IS) in the CMC-nZVI suspension will greatly affect the hydrodynamic size of the synthesized nanoparticles. In this research we used two pH (5 and 7) and two IS (0.01 and 0.001M) values. Therefore, we had four treatments of CMC-nZVI nanoparticle suspensions: pH5 and 0.01 M; pH 5 and 0.001 M; pH 7 and 0.01 M; and pH 7 and 0.001 M, referred to hereafter as: CMC-nZVI 1; CMC-nZVI 2; CMC-nZVI 3; and CMC-nZVI 4, respectively. The average hydrodynamic size of CMC-nZVI nanoparticles at pH 5 and 7 were 130.5 and 73.7 nm, respectively (Table 2). The decrease of IS of the background electrolyte solution from 0.01 to 0.001 M resulted in a slight decrease in the size of the CMC-nZVI nanoparticles by 1.1 and 6.7% at pH 5 and 7, respectively. In contrast, much larger impact of pH on the hydrodynamic size of CMC-nZVI nanoparticles was observed. The increase of pH of the CMC-nZVI suspension from 5 to 7 resulted in a reduction in the hydrodynamic size by 42.0 and 45.1% at IS values of 0.01 and 0.001 M, respectively.
Zeta potential of CMC-nZVI suspensions having IS of 0.01 and 0.001 M (The background electrolyte solution is NaHCO3) was measured at a pH range 2-12. Regardless of the IS values, the point of zero electric charge (PZC) of the synthesized CMC-nZVI nanoparticles was about pH 2 (Figure 2). Average zeta potential of the CMC-nZVI was increased by 9.7 % as the pH of the suspension was increased from 5 to 7. On the other hand, under our experimental conditions (i.e. the pH range 5-7), reducing IS from 0.01 M to 0.001 M increased zeta potential of the CMC-nZVI nanoparticles by 10.1% (Table 2). Decreasing the IS of the background electrolyte solution increases the zeta potential of the CMC-nZVI nanoparticles due to the increase in the extent of the electrical double layer at lower IS, and the subsequent increase in the electrostatic repulsion forces [38].
3.2.3. Total interaction energy (DLVO)
The classical DLVO theory calculates the total interaction energy between CMC-nZVI nanoparticles, hence it can be used to assess the stability of the particles based on existing solution chemistry conditions. At the lower IS (0.001 M), larger energy barriers (6.15 to 8.16 KB T) were formed between CMC-nZVI nanoparticles indicating unfavorable attachment environments (i.e. domination of electrostatic repulsion forces). The energy barriers diminished to a much smaller range (1.81 to 2.05 KB T) with the increase of IS to 0.01 M (Figure 3). Examining the total interaction energy of the different CMC-nZVI suspensions revealed that only the suspensions CMC-nZVI 1 and CMC-nZVI 3 showed the formation of a small secondary minimum at separation distances of 14 and 12 nm, respectively. These are the two CMC-nZVI suspensions with the larger 0.01 M IS. This can be explained by the fact that the electric double layer interaction is strongly dependent on the IS of the solution. As the IS of the electrolyte solution increases, the energy barrier decreases, and reversible aggregation starts in the secondary minimum. At separation distances of 3 nm (CMC-nZVI 1 and CMC-nZVI 3) and 5 nm (CMC-nZVI 2 and CMC-nZVI 4), the energy barrier is eliminated, and particles irreversibly aggregate in the primary energy minimum as a result to the domination of the van der Waals attraction forces (Figure 3).
In general, under our experimental conditions, the energy barrier was decreased as the pH was increased from 5 to 7, and the IS was increased from 0.001 to 0.01 M. The ranking order of the decrease (i.e. less particle stability) in the energy barriers was CMC-nZVI 2 > CMC-nZVI 4 > CMC-nZVI 1 > CMC-nZVI 3. These findings indicate that the stability of the CMC-nZVI nanoparticles is controlled by pH followed by the IS of the suspension. According to the DLVO theory, energy barriers around 20 KB T are required for particles to remain stable in suspension for long times. The largest energy barrier that was observed with the suspension CMC-nZVI 2 reached only 8.16 KB T. Therefore, this energy barrier can easily vanish as the separation distance between the particles decreases, and the extent of the van der Waals attractive forces increases.
3.3. Effect of the concentration of CMC-nZVI on the reduction efficiency of Cr(VI)
The removal efficiency of Cr(VI) after 2 hrs. of contact time ranged between 21.5 and 98.3 % (Figure 4). Increasing the concentration of the CMC-nZVI nanoparticles from 10 to 250 mg Kg-1 greatly enhanced the removal efficiency. Average removal efficiency of Cr(VI) was increased from 24.1 to 75.5% when the concentration of CMC-nZVI nanoparticles was increased from 10 to 250 mg L-1, respectively. The increase in the concentration of CMC-nZVI provides larger number of particles, hence more surfaces and larger sum of total surface area for the reaction of Cr(VI) reduction to take place, which improves the removal efficiency. Similar conclusion was also mentioned by Gueye et al. [39] who reported that the increase in the Cr removal with increasing the concentration of Fe0 was attributed to the increase in the reactive sites associated with larger Fe0 concentrations.
Further increase in the concentration of CMC-nZVI nanoparticles to 350 and 450 mg L-1 resulted in only a slight increase (83.2 and 83.4%, respectively) in the average removal efficiency of Cr(VI). At larger CMC-nZVI nanoparticle concentrations, the stability of the particles is reduced, and particle agglomeration starts to form larger size aggregates. The increase in the hydrodynamic size of CMC-nZVI nanoparticles due to the formation of larger size aggregates will reduce the total surface area of the particles. Therefore, it is not anticipated that the sum of total surface area of CMC-nZVI nanoparticles will significantly continue to increase as the concentration of CMC-nZVI nanoparticles increases above certain concentration. Figure 4 shows that the removal efficiency of Cr(VI) almost leveled at CMC-nZVI concentration of 250 mg L-1 (at all our experimental pH and IS values). Therefore, the CMC-nZVI concentration of 250 mg L-1 was considered the optimum concentration for the removal of Cr(VI) from the loamy sand contaminated soil used in this study.
3.4. Effect of contact time on the reduction efficiency of Cr(VI)
The reaction rate of Cr(VI) removal by CMC-nZVI nanoparticles (250 mg L-1) increased with the increase of contact time. The removal efficiency of Cr(VI) reached 48.8-81.8 % after 30 min (Figure 5). The average removal efficiency of Cr(VI) reached 68.9, 73.6, 75.5, and 75.8% at contact times of 60, 90, 120, and 180 min, respectively. These results indicate that the reaction rate was fast within the first 30 min, and gradually slowed down until it was almost leveling after 2 hrs. The maximum removal efficiency of Cr(VI) reached 59.5-92.4 % after 2 hrs. of contact time.
3.5. Effect of pH and IS on the reduction efficiency of Cr(VI)
The removal efficiency of Cr(VI) was greatly affected by the initial pH of the CMC-nZVI suspension. The increase in pH from 5 to 7 resulted in a large decrease in the efficiency of Cr(VI) removal. After two hrs. of contact time, reducing the pH of the CMC-nZVI suspension from 7 to 5 decreased the average relative concentration of Cr(VI) by 73.9 and 80.4 % at IS of 0.01 and 0.001 M, respectively (Figure 6). The decrease in the relative concentration of Cr(VI) indicates enhancement in the removal efficiency of Cr(V) from the contaminated soil. These results confirm the negative correlation between the removal efficiency of Cr(VI) and pH value [40]. In general, removal efficiency of Cr(VI) from contaminated soil is much larger under acidic conditions. Due to the release of Fe2+ under acidic conditions, the formation of iron oxide on the surfaces of the nZVI nanoparticles is well suppressed, leaving the surfaces of the nZVI particles more active, which accelerates the reduction of Cr(VI) [41].
The effect of IS of the background electrolyte solution on the removal efficiency of Cr(VI) was much less pronounced. After two hrs. of contact time, reducing the IS of the CMC-nZVI suspension from 0.01 to 0.001M decreased the average relative concentration of Cr(VI) only by 27.6 and 3.6 % at pH values of 5 and 7, respectively (Figure 9). The enhancement in the removal efficiency of Cr(VI) at low IS was attributed to the increase in the charges on the surfaces of the CMC-nZVI nanoparticles. At low IS, zeta potential of the background electrolyte solution increases (Table 2) due to the increase in the extent of the electrical double layer, which increases the electrostatic repulsion forces [42].
The combined effect of pH and IS on the removal efficiency of Cr(VI) showed that maximum removal efficiency occurred at low pH and IS values. The relative concentration of Cr(VI) at equilibrium in the different CMC-nZVI suspensions reached 0.106, 0.077, 0.405, and 0.391 for CMC-nZVI 1, CMC-nZVI 2, CMC-nZVI 3, and CMC-nZVI 4, respectively. The minimum removal efficiency of Cr(VI) was observed with the CMC-nZVI 3 suspension at pH 7 and IS 0.01 M. Analysis showed that, at pH 7, when the IS of the CMC-nZVI suspension was lowered to 0.001 M, only a slight decrease (3.6%) occurred in the relative concentration of Cr(VI) (i.e. CMC-nZVI 4). Again, this is an indication of the slight impact of changes in the IS on the removal efficiency of Cr(VI). In contrast, lowering the pH to 5 resulted in a decrease in the relative concentration of Cr(VI) by 73.9 and 81.1% at IS values of 0.01 (i.e. CMC-nZVI 1) and 0.001M (i.e. CMC-nZVI 2), respectively. These findings confirm previous results that showed pH to be the primary controlling factor in the stability and efficiency of CMC-nZVI nanoparticles in the removal of Cr(VI) from contaminated soils.
3.6. Adsorption Kinetics of Cr(VI)
The mechanism of the reduction of Cr(VI) was investigated with several kinetic models. The pseudo-second order was observed as the best fitted kinetic model for describing the reduction of Cr(VI) on the CMC-nZVI nanoparticles. Larger linear regression coefficients (average r2 of 0.998) were observed with the pseudo-second order kinetic model, as compared to the Langmuir-Hinshelwood (average r2 of 0.956) and the pseudo-first order (average r2 of 0.893) kinetic models (Table 3). The fact that r2 of the pseudo-second order kinetic model was always larger than 0.99 indicates that the mechanism of Cr(VI) removal was mainly chemical reduction [43]. In general, larger rate constants were observed at the lower pH (i.e. pH 5) and IS (i.e. 0.001 M) values.
The fittings of the experimental data to the different kinetic models are presented in Figure 7 for the pseudo-second order, the Langmuir-Hinshelwood first order, and the pseudo-first order models, respectively. Approximately after 30 min, most of the Cr(VI) was reduced and the surfaces of the CMC-nZVI nanoparticles started to reach dynamic equilibrium with Cr(VI). Based on the pseudo-second order kinetic model, the plot of qt (Cr(VI) removal capacity at time t) vs time showed a rapid increase in the removal capacity after 30 min from the start of the reaction (Figure 8). This was followed by a gradual leveling of the removal capacity until finally reaching the maximum removal capacity (qe).
The pH of the CMC-nZVI greatly affected the removal capacity at equilibrium. The average removal capacity at equilibrium was 47.7 and 30.6 mg g-1 at pH 5 and 7, respectively, indicating a decrease in the average removal capacity at equilibrium by 35.9% when the pH was increased from 5 to 7. In contrast, no significant changes were observed as a result to changes in IS. Decreasing the IS from 0.01 to 0.001 M only increased the average removal capacity at equilibrium by 2.4 % at pH 5. The impact was less profound at pH 7 and variation in the average removal capacity at equilibrium between the two IS (0.01 and 0.001 M) was only 1.7%. These results are consistent with previous results that showed pH to be the primary factor controlling the reduction of Cr(VI) by CMC-nZVI nanoparticles.
According to the Langmuir-Hinshelwood first order model, average half-life for the removal of Cr(V) was 60.9 min at pH 5. This value was increased, more than four folds, to an average of 274.5 min at pH 7. Longer half-life for the removal of Cr(VI) from contaminated soil at larger pH values is attributed to the increase in the precipitate of iron hydroxide on the surfaces of the nZVI nanoparticles under alkaline conditions, which decreases the reactivity of the nZVI nanoparticles leading to slower reduction rates [44].
3.7. Column transport of Cr(VI)
The BTC of the nonreactive tracer (CaCl2) were fitted in the CXTFIT model using equation 9. The hydrodynamic dispersion and dispersivity values for the loamy sand soil are presented in Table 4. Increasing the flow rate from 2 to 4 cm hr-1 greatly increased the hydrodynamic dispersion. Pore water velocity was calculated based on the assumption of steady-state conditions. Larger values for the distribution coefficient (Kd) were observed at pH 5, as compared to Kd values at pH 7. The time required for one pore volume (PV) to pass through the soil column was found to be 2.86 and 1.43 hrs. for the low (2 cm h-1) and high (4 cm h-1) flow rates, respectively. The parameters of the two-site chemical non-equilibrium model were obtained by fitting equation 9 to the experimental data using the Hydrus-1D program (Table 5). The good fit obtained (r2 = 0.96-0.98) at all pH and IS values indicate that the model precisely describe the transport and sorption of Cr(VI) in the loamy sand soil. As the pH of the CMC-nZVI nanoparticle suspension was increased from 5 to 7, a notable decrease in the retardation factor (R) was observed. This could be attributed to the increase in the reduction of Cr(VI) to the less mobile and strongly adsorbed Cr(III) at low pH [45].
3.8. Modeling the transport of Cr(VI) (uniform model)
Modeling the transport of Cr(VI) under uniform flow conditions revealed the relative concentration (RC) of Cr(VI) was increased by increasing the pH of the CMC-nZVI suspension from 5 to 7. Average retardation was 3.51 and 1.61 at pH values of 5 and 7, respectively, which could explain the larger transport of Cr(VI) at pH 7. The breakthrough curves (BTC) of Cr(VI) always showed earlier arrival and shorter time to reach maximum RC at pH 7 as compared to the same values at pH 5 (Figure 9). For example, simulations based on the flow rate of 2 cm h-1 showed that breakthrough of Cr(VI) occurred after an average of 3.62 and 1.75 h when the pH of the CMC-nZVI suspension was 5 and 7, respectively (Figure 9, A-D). Similarly, the average time required to reach maximum RC was 28.75 and 15.75 h when the pH of the CMC-nZVI suspension was 5 and 7, respectively (Table 6).
The observed trend of earlier Cr(VI) arrival and shorter time to reach maximum RC at pH 7 was less pronounced at the high from rate of 4 cm h-1. BTCs of Cr(VI) occurred after an average of 1.87 and 1.00 h, and the average time required to reach maximum RC was 14.75 and 7.75 h at pH 5 and 7, respectively (Figure 9, E-H). Under uniform transport, the maximum RC of Cr(VI) was always close to 1.0 (i.e. maximum Cr(VI) concentration in the effluent of 100 mg L-1). At pH 7, maximum RC slightly larger than 1.0 were also observed (Figure 9, C-D, and G-H). Values of RC larger than 1.0 are related to the underestimation of Cr(VI) sorption and the overestimation of the first-order rate coefficient based on the simulation of the uniform transport model [46].
Variations in pH did not significantly affect the amount of Cr(VI) removed from the soil column. The total amount of Cr(VI) inside the soil column was 39.1 mg (initial 11 mg were present in the packed soil inside the column, and 28.1 mg were added through the 10 PV pulse of the Cr(VI) solution). Out of this amount, an average of 27.4 and 27.5 mg were removed at pH 5 and 7, respectively. When the flow rate was increased from 2 to 4 cm h-1, the average amount of Cr(VI) removed was slightly larger and reached 28.3 and 28.4 mg at pH 5 and 7, respectively. Based on the amount removed of Cr(VI) and the simulations of the uniform transport, the removal efficiency of Cr(VI) ranged between 70.3 and 72.6% at the low and high flow rates, respectively (Table 6).
3.9. Modeling the transport of Cr(VI) (two-site sorption model)
The transport of Cr(VI) in soil is likely to occur under physical and chemical non-equilibrium conditions. Therefore, simulations of the sorption and transport of Cr(VI) in the contaminated loamy sand soil based on the dual-permeability, Two-site model were more consistent with measured concentrations of Cr(VI) in the leachate collected from the column experiment. The overall average for the coefficient of determination (r2) between measured and simulated Cr(VI) concentrations was 0.81-0.98 and 0.96-0.98 for the uniform and the Two-site sorption models, respectively (Table 4 and Table 5). In particular, at pH 5, the Two-site model was more accurate (average r2 = 0.98) in simulating Cr(VI) transport as compared to the uniform transport model (average r2 = 0.87). This could be explained by the increased sorption of Cr(VI) and the larger retardation that was observed at pH 5, which can lead to less accuracy when the uniform transport model is applied.
Simulations of Cr(VI) transport based on the Two-site sorption model showed slightly earlier BTCs and longer time to reach maximum RC as compared to the simulations of the uniform transport model (Figure 10). For example, at pH 7 and low flow rate, the average time to reach maximum RC was 21.6 and 15.7 h for the Two-site sorption (Table 7) and the uniform transport (Table 6) models, respectively. The most significant difference between Cr(VI) simulation based on the Two-site sorption and the uniform transport models was observed with the maximum RC. As mentioned earlier, maximum RC based on the uniform transport model was close to 1.0 at all pH, IS and flow rate values (Table 6). However, the Two-site sorption model showed much less RC, and the average RC of Cr(VI) at pH 5 was 0.93 and 0.92 for the flow rates 2 and 4 cm h-1, respectively (Table 7). Because of the increased transport of Cr(VI) that was observed at pH 7, RC based on the Two-site sorption model at pH 7 remained close to 1.0 at the two flow rates (Figure 10, C-D and G-H).
The Two-site sorption model takes into consideration both the solid phase concentration on equilibrium sites (S1), and the solid phase concentration on kinetic non-equilibrium sites (S2). Therefore, the shape of the BTC varied between pH 5 and 7. At pH 5 increased sorption and larger retardation that was observed at pH 5 resulted in less instantaneous sorption (S1 sites) and more kinetic sorption (S2 sites), which lead to a slight delay in the Cr(VI) arrival and more pronounced tailing for the BTC (Figure 10, A-B and E-F). In contrast, at pH 7, more instantaneous sorption was observed and fast equilibration between the liquid and solid phase concentrations was reached, which lead to BTC resembling more the uniform transport (Figures 10, C-D and G-H). No significant changes in the amount of Cr(VI) removed and the removal efficiency were observed between the simulation results of the uniform transport and the Two-site sorption models. The average amount of Cr(VI) removed was 27.4 and 28.3 mg, and the removal efficiency was 70.0 and 72.4 % at the low and high flow rates, respectively. Under our experimental conditions, variations in IS of the background electrolyte solution did not significantly affect the transport of Cr(VI) in the contaminated loamy sand soil. In general, a slight increase in the transport of Cr(VI) was observed at the lower IS of 0.001 M, but the increase did not exceed 1-3 % of Cr(VI) transport at the larger IS of 0.01 M.
CMC-nZVI 1, pH5 and 0.01 M; CMC-nZVI 2, pH 5 and 0.001 M; CMC-nZVI 3, pH 7 and 0.01 M; and CMC-nZVI 4, pH 7 and 0.001 M; RC, relative concentration.
3.10. Effect of flow rate on the transport of Cr(VI)
The pore water velocity inside the soil column was 5.23 and 10.47 cm h-1 at the water flow rates of 2 and 4 cm h-1, respectively. The larger flow rate reduced the time required for the arrival of the Cr(VI) almost by half. For example, under uniform transport, the average time required for Cr(VI) arrival was 2.69 and 1.43 h at the water flow rates of 2 and 4 cm h-1, respectively (Table 6). Similarly, under non-equilibrium transport, the average time required for Cr(VI) arrival was 1.87 and 1.0 h at the water flow rates of 2 and 4 cm h-1, respectively (Table 7). The time required to reach maximum RC of Cr(VI) was also reduced by almost half as the flow rate was increased from 2 to 4 cm h-1.
Maximum RC of Cr(VI) were mainly controlled by the pH of the CMC-nZVI nanoparticle suspension, and no significant variations were observed as a result to the increase in the flow rate. For example, at pH 7, the maximum RC of Cr(VI) was always close to 1.0, regardless of the flow rate and/or the transport model (i.e. uniform vs. non-equilibrium). Nevertheless, increasing the flow rate had a limited impact on the amount removed and the removal efficiency of Cr(VI). Increasing the flow rate from 2 to 4 cm h-1 increased the removal efficiency by only 3.3 and 3.4% under uniform and non-equilibrium conditions, respectively. The increase in the flow rate will result in larger pore water velocity inside the soil column. Therefore, the tailing of the BTC at pH 5, which is related to more kinetic sorption, was less pronounced (Figures 10, C and D).
4. Conclusions
Stabilized CMC-nZVI nanoparticles efficiently removed up to 90% of Cr(VI) concentration in a contaminated loamy sand soil. Batch experiments showed that removal efficiency of Cr(VI) from the contaminated loamy sand soil was much larger under acidic conditions. The average removal efficiency of Cr(VI) reached 90.1 and 60.5 % at pH 5 and 7, respectively. This is attributed to the increased release of Fe2+ under acidic conditions, which suppress the formation of iron oxide on the surfaces of the nZVI nanoparticles and accelerates the reduction of Cr(VI). In contrast, average removal efficiency of Cr(VI) was slightly larger at lower IS, mainly because of the increased CMC-nZVI nanoparticle stability at lower IS values. These results indicate that pH is the primary controlling factor in the stability and removal efficiency of Cr(VI) by the CMC-nZVI nanoparticles. The mechanism of the reduction of Cr(VI) was best fitted by the pseudo-second order kinetic model (average r2 of 0.998), indicating that the main mechanism of Cr(VI) removal was by chemical reduction.
Column transport showed that the transport of Cr(VI) was larger at pH 7. Average retardation was 3.51 and 1.61 at pH values of 5 and 7, respectively, which could explain the larger transport of Cr(VI) at pH 7. The breakthrough curves (BTC) of Cr(VI) always showed earlier arrival and shorter time to reach maximum RC at pH 7 as compared to the same values at pH 5. Simulation of the sorption and transport of Cr(VI) were more accurate when the dual-permeability Two-site sorption model was applied. The overall average coefficient of determination (r2) between measured and simulated Cr(VI) concentrations was 0.81-0.98 and 0.96-0.98 for the uniform and the Two-site sorption models, respectively. Simulations of Cr(VI) transport based on the Two-site sorption model showed slightly earlier BTCs and longer time to reach maximum RC as compared to the simulations of the uniform transport model. The good fit that was obtained between measured and simulated values at all pH and IS, indicates that the Hydrus-1D model adequately describes the sorption and transport of Cr(VI) in the contaminated loamy sand soil.
Author Contributions
Conceptualization, H.M.I., A.A.A., A.G.A. and A.S.A.; methodology, H.M.I., A.A.A. and A.S.A; software, H.M.I and A.A.A.; validation, H.M.I., and A.A.A.; formal analysis, A.A.A., H.M.I. and A.S.A.; investigation, H.M.I., A.A.A., A.G.A. and A.S.A.; resources, H.M.I. and A.M.A.; data curation, A.A.A. and H.M.I.; writing—original draft preparation, A.A.A. and H.M.I.; writing—review and editing, H.M.I.; visualization, A.A.A., H.M.I., A.G.A., A.M.A and A.S.A.; supervision, H.M.I. and A.S.A; project administration, H.M.I. and A.S.A.; funding acquisition, A.G.A. and H.M.I.
Funding
The authors extend their appreciation to the Deputyship for Research and Innovation, “Ministry of Education” in Saudi Arabia for funding this research work through the project no. (IFKSUOR3-147-1).
Data Availability Statement
The data analyzed during the current study are available from the corresponding author on reasonable request.
Acknowledgments
The authors extend their appreciation to the Deputyship for Research and Innovation, “Ministry of Education” in Saudi Arabia for funding this research work through the project no. (IFKSUOR3-147-1).
Conflicts of Interest
The authors declare no conflict of interest.
Appendix A. Calculations of the of ionic strength of the background electrolyte solution, the Debye-Huckel length, and the DLVO interactions of the CMC-nZVI nanoparticles
Calculation of the ionic strength (I) of the electrolyte solution, and the Debye-Huckel length (k-1) were carried out according to equations 1 and 2, respectively:
The total interaction energy between nanoaggregates (i.e. CMC-nZVI-CMC-nZVI) is assumed to be created from a sphere-sphere interaction. The calculation was carried out according to Bhattacharjee and Elimelech [47]. The electrostatic double layer force (EDL) was calculated as:
The attractive van der Waals interaction energies was calculated according to Gregory [48]:
A list of all symbols and parameters used in equations 1-4 are listed in Table A1.

Table A1.
A list of all symbols and parameters used for the calculations of ionic strength, the Debye-Huckel length, and the total interaction energy between CMC-nZVI nanoparticles.
Table A1.
A list of all symbols and parameters used for the calculations of ionic strength, the Debye-Huckel length, and the total interaction energy between CMC-nZVI nanoparticles.
| Symbol | Definition | Units/comments |
| Cj | Molar concentration | Mole L-1 |
| Zj | Valence of ion | - |
| e0 | Permittivity of free space | F m-1 |
| ɛ | Dielectric Constant | 80 for water |
| kB | Boltzmann constant | J K-1 |
| T | Absolute temperature | oK |
| NA | Avogadro's Number | 1 mole-1 |
| e | electron charge | Coulomb |
| I | Ionic strength | Mole m-3 |
| The radius of the first interacting CMC-nZVI | nm | |
| The radius of the second interacting CMC-nZVI | nm | |
| The bulk number density of ions | - | |
| The inverse Debye-Huckel length | m | |
| , | The surface potentials of interacting CMC-nZVI | mV, Zeta potential value is used |
| The separation distance between two particles | nm | |
| The Hamaker constant for: CMC-nZVI-water-CMC-nZVI | 3.5 x 10⁻²⁰ J | |
| The characteristics wavelength of the interaction | Usually assumed to be 100 nm (Gregory, 1981) |
References
- Su, M.; Yin, W.Z.; Liu, L.; Li, P.; Fang, Z.Q.; Chiang, P.C.; Wu, J.H. Enhanced Cr(VI) stabilization in soil by carboxymethyl cellulose-stabilized nanosized Fe0 (CMCnFe0) and mixed anaerobic microorganisms. J. Environ. Manag. 2020, 257, 109951. [Google Scholar] [CrossRef]
- Liu, X.; Yang, L.; Zhao, H.; Wang, W. Pyrolytic production of zerovalent iron nanoparticles supported on rice husk-derived biochar: simple, in situ synthesis and use for remediation of Cr(VI)-polluted soils. Science of The Total Environment 2020, 708, 134479. [Google Scholar] [CrossRef] [PubMed]
- Latif, A.; Sheng, D.; Sun, K.; Si, Y.; Azeem, M.; Abbas, A.; Bilal, M. Remediation of heavy metals polluted environment using Fe-based nanoparticles: Mechanisms, influencing factors, and environmental implications. Environmental Pollution 2020, 264, 114728. [Google Scholar] [CrossRef] [PubMed]
- Sousa, A.; Pereira, R.; Antunes, S.; Cachada, A.; Pereira, E.; Duarte, A.; Gonçalves, F. Validation of avoidance assays for the screening assessment of soils under different anthropogenic disturbances. Ecotoxicology and Environmental Safety 2008, 71, 661–670. [Google Scholar] [CrossRef] [PubMed]
- Van der Perk, M. Soil and Water Contamination 2nd Edition (Special Sale Only): From Molecular to Catchment Scale (1st ed.). 2006, CRC Press. [CrossRef]
- Jovanović, V. S.; Mitić, V.; Mandić, S. N.; Ilić, M.; Simonović, S. Heavy metals in the post-catastrophic soils. Soil Biology 2015, 3–21. [Google Scholar]
- Aboutorabi, L.; Morsali, A.; Tahmasebi, E.; Büyükgüngor, O. Metal–Organic Framework Based on Isonicotinate N-Oxide for Fast and Highly Efficient Aqueous Phase Cr(VI) Adsorption. Inorganic Chemistry 2016, 55, 5507–5513. [Google Scholar] [CrossRef] [PubMed]
- Chrysochoou, M.; Johnston, C. P.; Dahal, G. A comparative evaluation of hexavalent chromium treatment in contaminated soil by calcium polysulfide and green-tea nanoscale zero-valent iron. Journal of Hazardous Materials. 2012, 201-202, 33–42. [CrossRef]
- Du, J.; Lu, J.; Wu, Q.; Jing, C. Reduction and immobilization of chromate in chromite ore processing residue with nanoscale zero-valent iron. Journal of Hazardous Materials. 2012, 215–216, 152–158. [CrossRef]
- Fu, F.; Dionysiou, D. D.; Liu, H. The use of zero-valent iron for groundwater remediation and wastewater treatment: A review. Journal of Hazardous Materials 2014, 267, 194–205. [Google Scholar] [CrossRef]
- Mueller, N. C.; Braun, J.; Bruns, J.; ČErník, M.; Rissing, P.; Rickerby, D.; Nowack, B. Application of nanoscale zero valent iron (NZVI) for groundwater remediation in Europe. Environmental Science and Pollution Research 2011, 19, 550–558. [Google Scholar] [CrossRef] [PubMed]
- Motzer, W.E. Chemistry, Geochemistry, and Geology of Chromium and Chromium Compounds. Chapter 2 of the Chromium (VI) Handbook. Edited by Jacques Guertin , Cynthia P . Avakian , and James A . Jacobs. 2004, CRC Press. [CrossRef]
- Xu, Y.; Zhao, D. Reductive immobilization of chromate in water and soil using stabilized iron nanoparticles. Water Research 2007, 41, 2101–2108. [Google Scholar] [CrossRef]
- Sallam, A.; Al-Zahrani, M.; Al-Wabel, M.; Al-Farraj, A.; Usman, A. Removal of Cr(VI) and Toxic Ions from Aqueous Solutions and Tannery Wastewater Using Polymer-Clay Composites. Sustainability 2017, 9, 1993. [Google Scholar] [CrossRef]
- Almasoud, F. I.; Usman, A. R.; Al-Farraj, A. S. Heavy metals in the soils of the Arabian Gulf coast affected by industrial activities: analysis and assessment using enrichment factor and multivariate analysis. Arabian Journal of Geosciences 2014, 8, 1691–1703. [Google Scholar] [CrossRef]
- Al-Hammad, B. A.; Abd El-Salam, M. M. Evaluation of heavy metal pollution in water wells and soil using common leafy green plant indicators in the Al-Kharj region, Saudi Arabia. Environmental Monitoring and Assessment 2016, 188. [Google Scholar] [CrossRef] [PubMed]
- Al-Farraj, A. S.; Al-Wabel, M. I.; El-Saeid, M. H.; El-Naggar, A. H.; Ahmed, Z. Evaluation of Groundwater for Arsenic Contamination Using Hydrogeochemical Properties and Multivariate Statistical Methods in Saudi Arabia. Journal of Chemistry 2013, 1–9. [Google Scholar] [CrossRef]
- Sallam, A. S.; Usman, A. R. A.; Al-Makrami, H. A.; Al-Wabel, M. I.; Al-Omran, A. Environmental assessment of tannery wastes in relation to dumpsite soil: a case study from Riyadh, Saudi Arabia. Arabian Journal of Geosciences 2015, 8, 11019–11029. [Google Scholar] [CrossRef]
- Shi, L. N.; Lin, Y. M.; Zhang, X.; Chen, Z. L. Synthesis, characterization and kinetics of bentonite supported nZVI for the removal of Cr(VI) from aqueous solution. Chemical Engineering Journal 2011, 171(2), 612–617. [Google Scholar] [CrossRef]
- Singh, R.; Misra, V.; Singh, R. P. Removal of Cr(VI) by Nanoscale Zero-valent Iron (nZVI) From Soil Contaminated with Tannery Wastes. Bulletin of Environmental Contamination and Toxicology 2012, 88(2), 210–214. [Google Scholar] [CrossRef]
- Zhang, S.; Lyu, H.H.; Tang, J.C.; Song, B.R.; Zhen, M.N.; Liu, X.M. A novel biochar supported CMC stabilized nano zero-valent iron composite for hexavalent chromium removal from water. Chemosphere 2019, 217, 686–694. [Google Scholar] [CrossRef]
- Chang, M. C.; Kang, H. Y. Remediation of pyrene-contaminated soil by synthesized nanoscale zero-valent iron particles. Journal of Environmental Science and Health, Part A 2009, 44, 576–582. [Google Scholar] [CrossRef] [PubMed]
- Kocur, C. M.; O’Carroll, D. M.; Sleep, B. E. Impact of nZVI stability on mobility in porous media. Journal of Contaminant Hydrology 2013, 145, 17–25. [Google Scholar] [CrossRef]
- Yang, G.; TU, H.; Hung, C. Stability of nanoiron slurries and their transport in the subsurface environment. Separation and Purification Technology 2007, 58, 166–172. [Google Scholar] [CrossRef]
- He, F.; Zhao, D. Manipulating the Size and Dispersibility of Zerovalent Iron Nanoparticles by Use of Carboxymethyl Cellulose Stabilizers. Environmental Science & Technology 2007, 41, 6216–6221. [Google Scholar]
- Shi, L. N.; Lin, Y. M.; Zhang, X.; Chen, Z. L. Synthesis, characterization and kinetics of bentonite supported nZVI for the removal of Cr(VI) from aqueous solution. Chemical Engineering Journal 2011, 171, 612–617. [Google Scholar] [CrossRef]
- Chowdhury, A. I.; Krol, M. M.; Kocur, C. M.; Boparai, H. K.; Weber, K. P.; Sleep, B. E.; O’Carroll, D. M. nZVI injection into variably saturated soils: Field and modeling study. Journal of Contaminant Hydrology 2015, 183, 16–28. [Google Scholar] [CrossRef]
- Wang, Y.; Dave, R. N.; Pfeffer, R. Polymer coating/encapsulation of nanoparticles using a supercritical anti-solvent process. The Journal of Supercritical Fluids 2004, 28(1), 85–99. [Google Scholar] [CrossRef]
- Sparks, D. L.; Page, A. L.; Helmke, P. A.; Loeppert, R. H. Methods of Soil Analysis Part 3: Chemical Methods (SSSA Book Series); 1996. [Google Scholar]
- Dane, J. H.; Hopmans, J. W. Hanging water column, in Methods of Soil Analysis. Part 4. Physical Methods: Vol. 5. 2002.
- Reynolds, W.D.; Elrick, D.E.; Youngs, E.G.; Amoozegar, A.; Booltink, H.W.G.; Bouma, J. Saturated and field-saturated water flow parameters. In Methods of Soil Analysis. Part 4. Physical Methods: Vol. 5. Soil Science Society of America, Inc. Madison, Wisconsin, USA. 2002, 797-878.
- Hossner, L. R. Dissolution for Total Elemental Analysis. SSSA Book Series 1996, 49–64. [Google Scholar]
- Balamurugan, S.; Ashna, L.; Parthiban, P. Synthesis of NanocrystallineMgO Particles by Combustion Followed by Annealing Method Using Hexamine as a Fuel. Journal of Nanotechnology. 2014, pp: 1–6. [CrossRef]
- Wladyslaw, R.; Wojciech, P. Kinetics of solute adsorption at solid/ solution interfaces: a theoretical development of the empirical pseudo-first and pseudo-second order kinetic rate equations, based on applying the statistical rate theory of interfacial transport. J Phys Chem B. 2006, 110:16514–16525. [CrossRef]
- Ho, Y.S.; McKay, G. Pseudo-second order model for sorption processes. Process Biochem. 1999, 34:451–465. [CrossRef]
- Toride, N.; Leij, F.J.; van Genuchten, M.T. The CXTFIT code for estimating transport parameters from laboratory or field tracer experiments. Version 2.1. In Research Report Vol. 137 of US Salinity Laboratory, Agricultural Research Service; US Department of Agriculture: Riverside, CA, USA, 1999. [Google Scholar]
- Šimůnek, J.; Genuchten, M. T.; Šejna, M. Development and Applications of the HYDRUS and STANMOD Software Packages and Related Codes. Vadose Zone Journal 2008, 7, 587–600. [Google Scholar] [CrossRef]
- Phenrat, T.; Long, T.C.; Lowry, G.V.; Veronesi, B. Partial oxidation (“aging”) and surface modification decrease the toxicity of nanosized zerovalent iron. Environ. Sci. Technol. 2009, 43, 195–200. [Google Scholar] [CrossRef] [PubMed]
- Gueye, M.T.; Petrucci, E.; Palma, L.D. Chemical reduction of hexavalent chromium (VI) in soil slurry by nano zero valent iron, Chemical Engineering Transacations. 2015, 43, 655-660. [CrossRef]
- Shu, Y.R; Bin, J.I.; Baihui, C.; Yuting, S.; Wang, J.; Hu, M.; Luo, S.; Guo, D. Almond shell-derived, biochar-supported, nano-zero-valent iron composite for aqueous hexavalent chromium removal: performance and mechanisms. Nanomaterials. 2020, 10:2. [CrossRef]
- Xu, T.; Nan, F.; Jiang, X.; Tang, Y.; Zeng, Y.; Zhang, W.; Shi, B. Effect of soil pH on the transport, fractionation, and oxidation of chromium(III). Ecotoxicol Environ Saf. 2020, 195:110459. [CrossRef]
- Phenrat, T.; Saleh, N; Sirk, K.; Kim, H.J.; Tilton; Lowry, G.V. Stabilization of aqueous nanoscale zerovalent iron dispersions by anionic polyelectrolytes: adsorbed anionic polyelectrolyte layer properties and their effect on aggregation and sedimentation, J. Nanopart. Res. 2008, 10. 795–814. [CrossRef]
- Di Palma, L.; Verdone, N.; Vilardi, G. Kinetic modeling of Cr(VI) reduction by nZVI in soil: the influence of organic matter and manganese oxide. Bull. Environ. Contam. Toxicol. 2018, 101, 692–697. [Google Scholar] [CrossRef] [PubMed]
- Zhu, F.; Li, L.; Ren, W.; Deng, X.; Liu, T. Effect of pH, temperature, humic acid and coexisting anions on reduction of Cr(Ⅵ) in the soil leachate by nZVI/Ni bimetal material. Environmental Pollution 2017, 227, 444–450. [Google Scholar] [CrossRef] [PubMed]
- Pantsar-Kallio, M.; Reinikainen, S.P.; Oksanen, M. Interactions of soil components and their effects on speciation of chromium in soils. Anal. Chim. Acta 2001, 439, 9–17. [Google Scholar] [CrossRef]
- Fonseca, B.; Teixeira, H.; Figueiredo, H.; Tavares, T. Modelling of the Cr(VI) transport in typical soils of the North of Portugal. Journal of Hazardous Materials 2009, 167, 756–762. [Google Scholar] [CrossRef] [PubMed]
- Bhattacharjee, S.; Elimelech, M. Surface element integration: A novel technique for evaluation of DLVO interaction between a particle and a flat plate. Journal of Colloid and Interface Science 1997, 193, 273–285. [Google Scholar] [CrossRef] [PubMed]
- Gregory, J. Approximate expressions for retarded van der Vaals interaction. J. Colloid Interface Sci. 1981, 51, 44–51. [Google Scholar] [CrossRef]
Figure 1.
Adsorption/desorption isotherms of the synthesized CMC-nZVI nanoparticles (type II adsorption isotherms).
Figure 1.
Adsorption/desorption isotherms of the synthesized CMC-nZVI nanoparticles (type II adsorption isotherms).
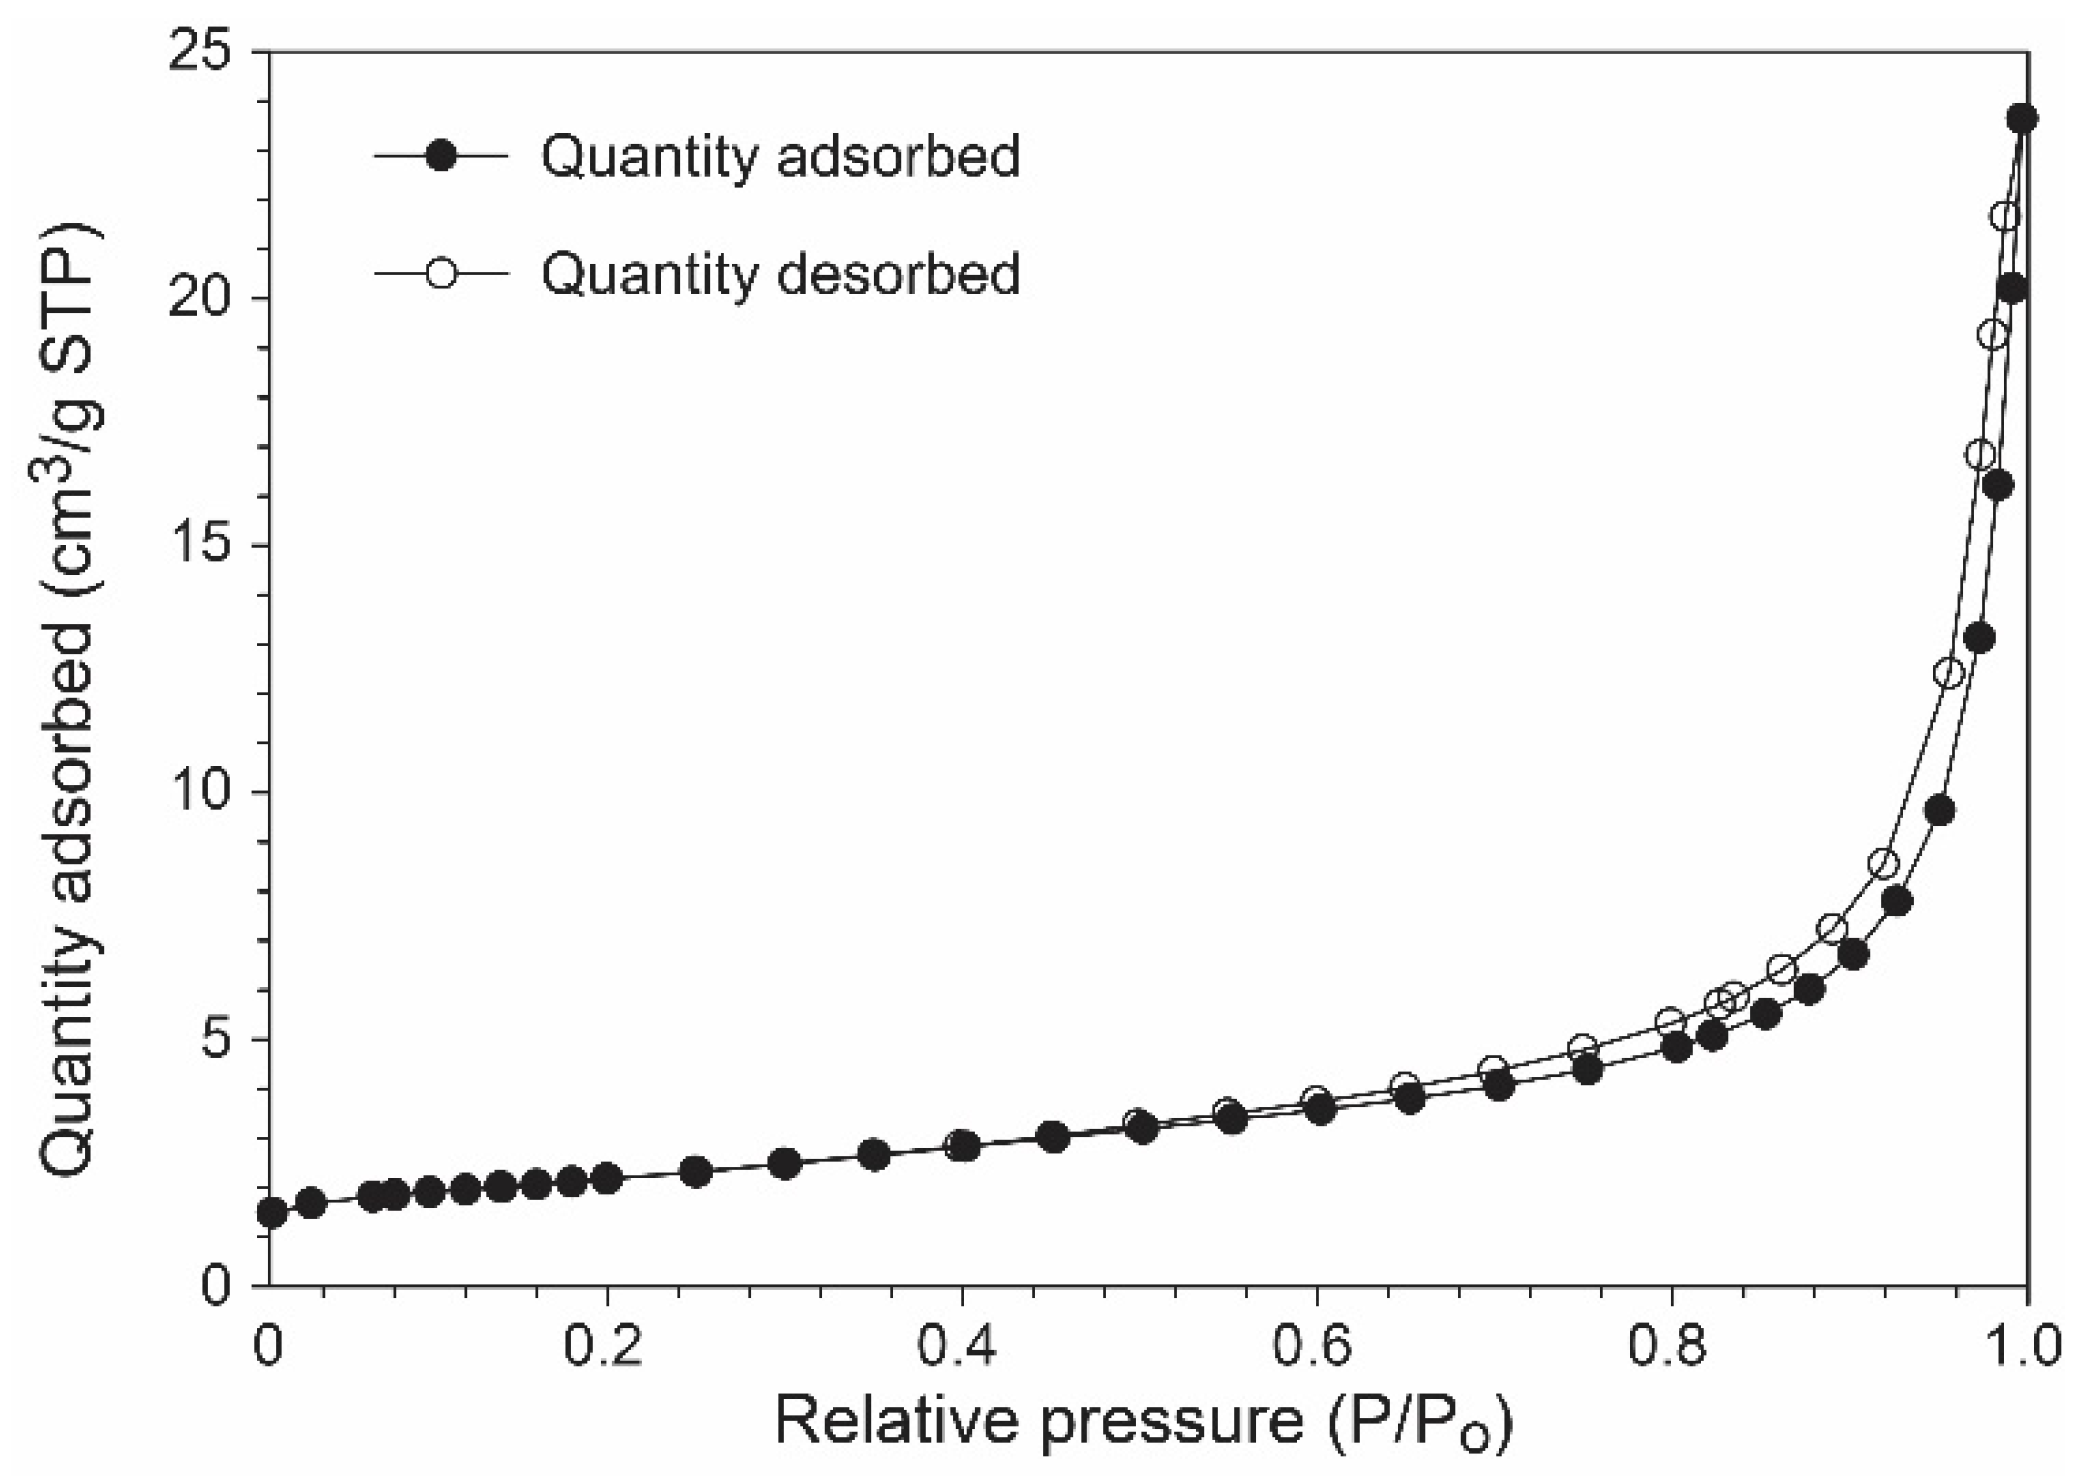
Figure 2.
Effect of the IS (0.01 and 0.01 M) of the background electrolyte solution (NaHCO3) on the zeta potential of CMC-nZVI nanoparticles (CMC-nZVI concentration of 250 mg L-1). The shaded area represents the pH range of the point of zero electric charge (PZC).
Figure 2.
Effect of the IS (0.01 and 0.01 M) of the background electrolyte solution (NaHCO3) on the zeta potential of CMC-nZVI nanoparticles (CMC-nZVI concentration of 250 mg L-1). The shaded area represents the pH range of the point of zero electric charge (PZC).
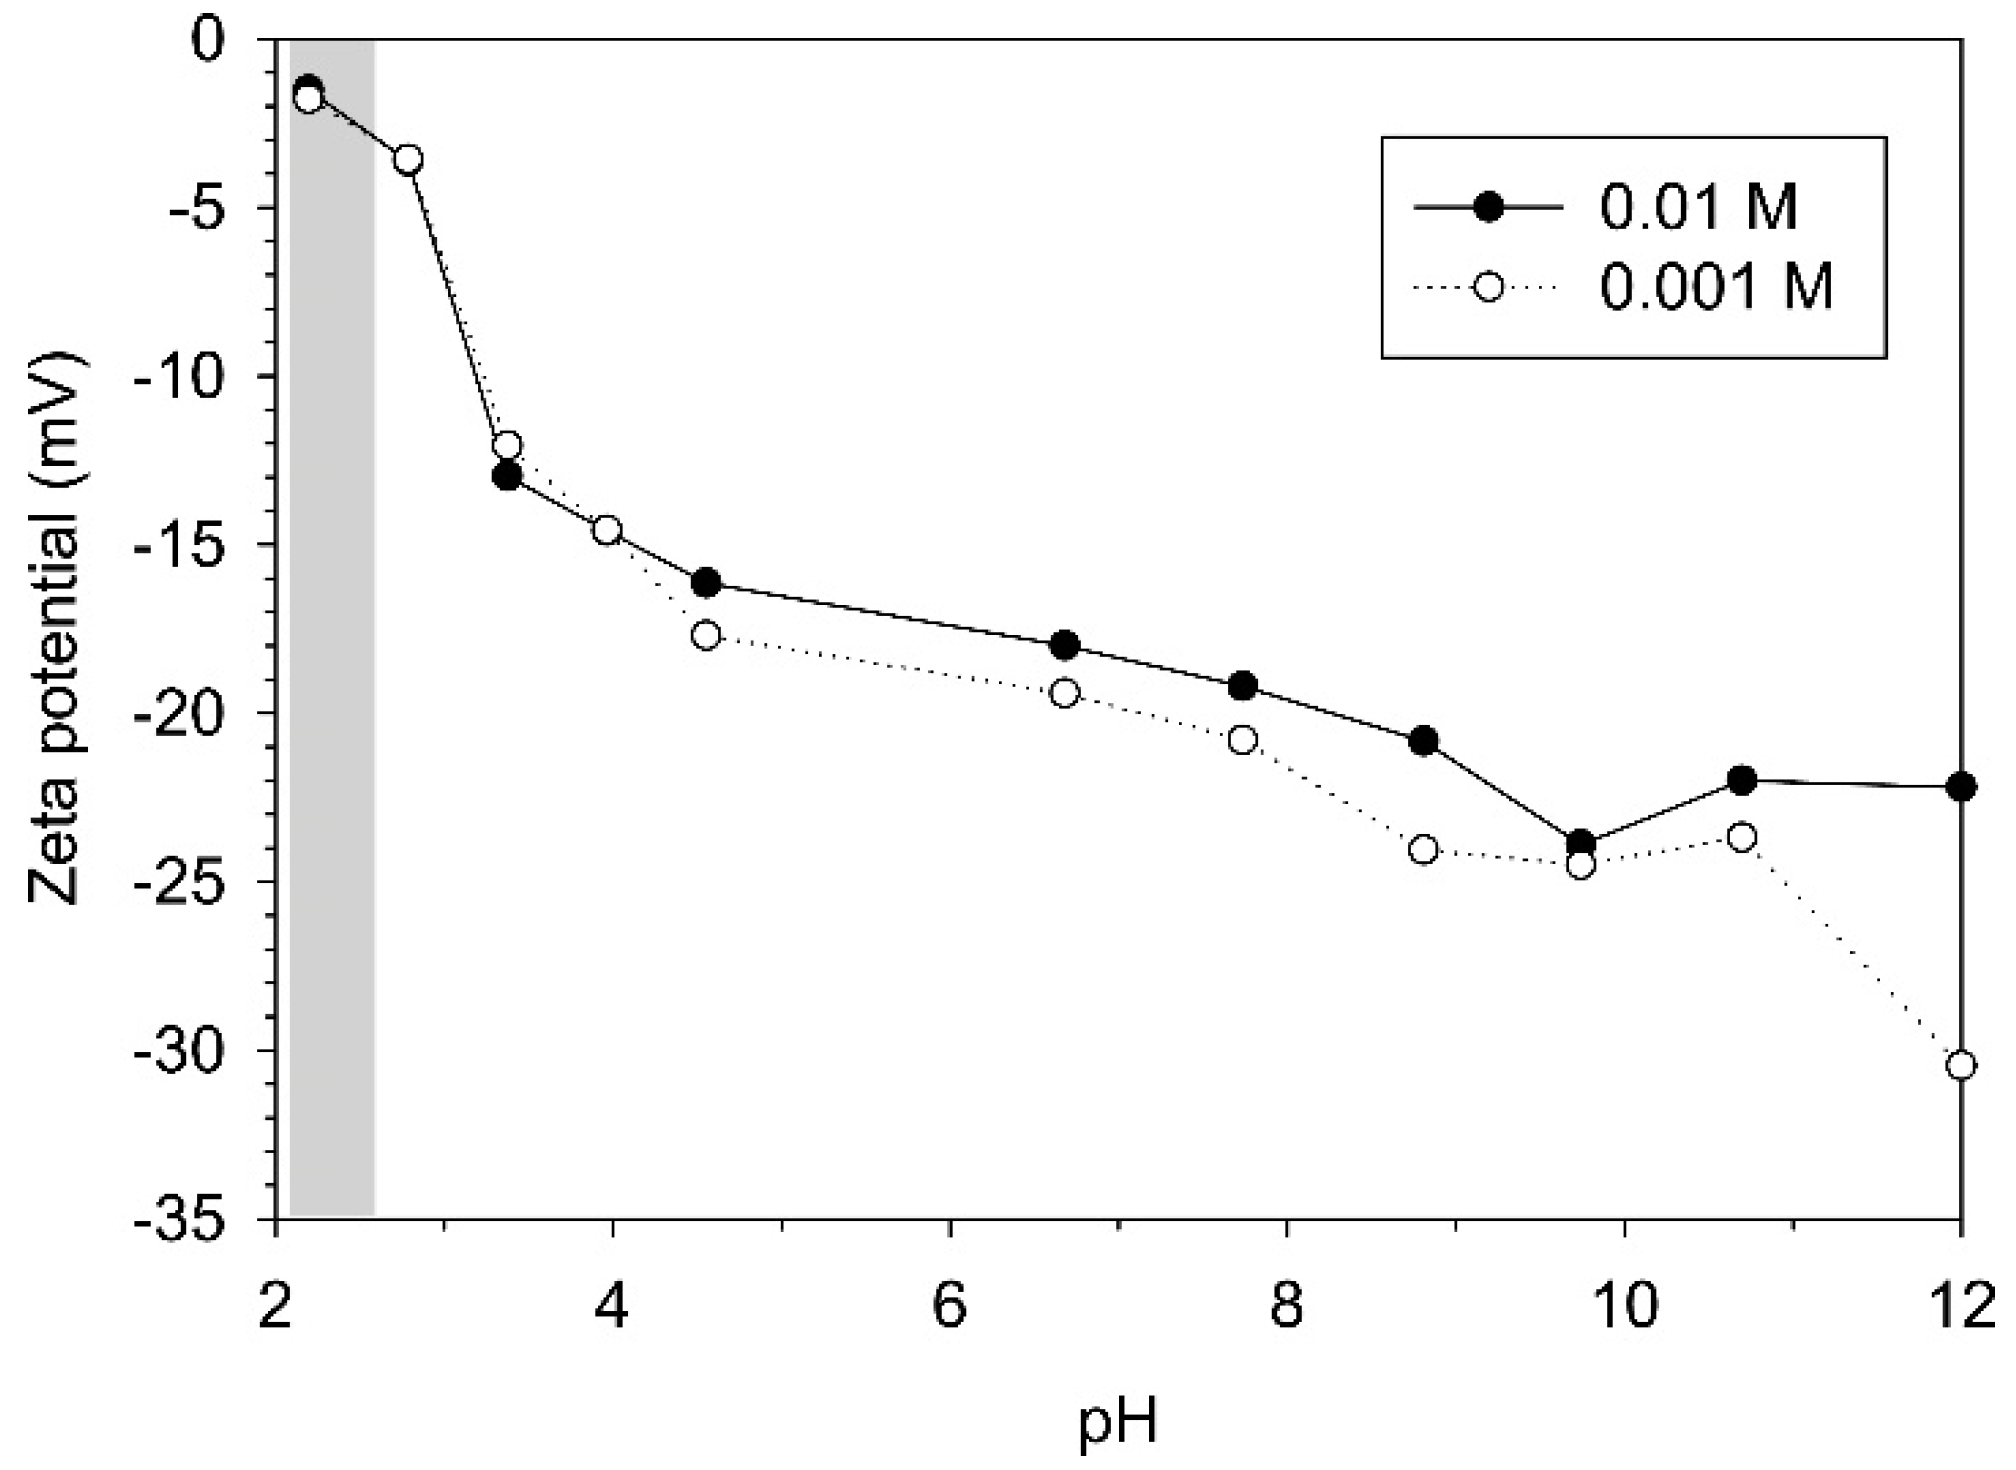
Figure 3.
Effect of pH and IS on the total interaction energy of CMC-nZVI suspensions. The background electrolyte solution is NaHCO3, and the CMC-nZVI concentration is 250 mg L-1.
Figure 3.
Effect of pH and IS on the total interaction energy of CMC-nZVI suspensions. The background electrolyte solution is NaHCO3, and the CMC-nZVI concentration is 250 mg L-1.
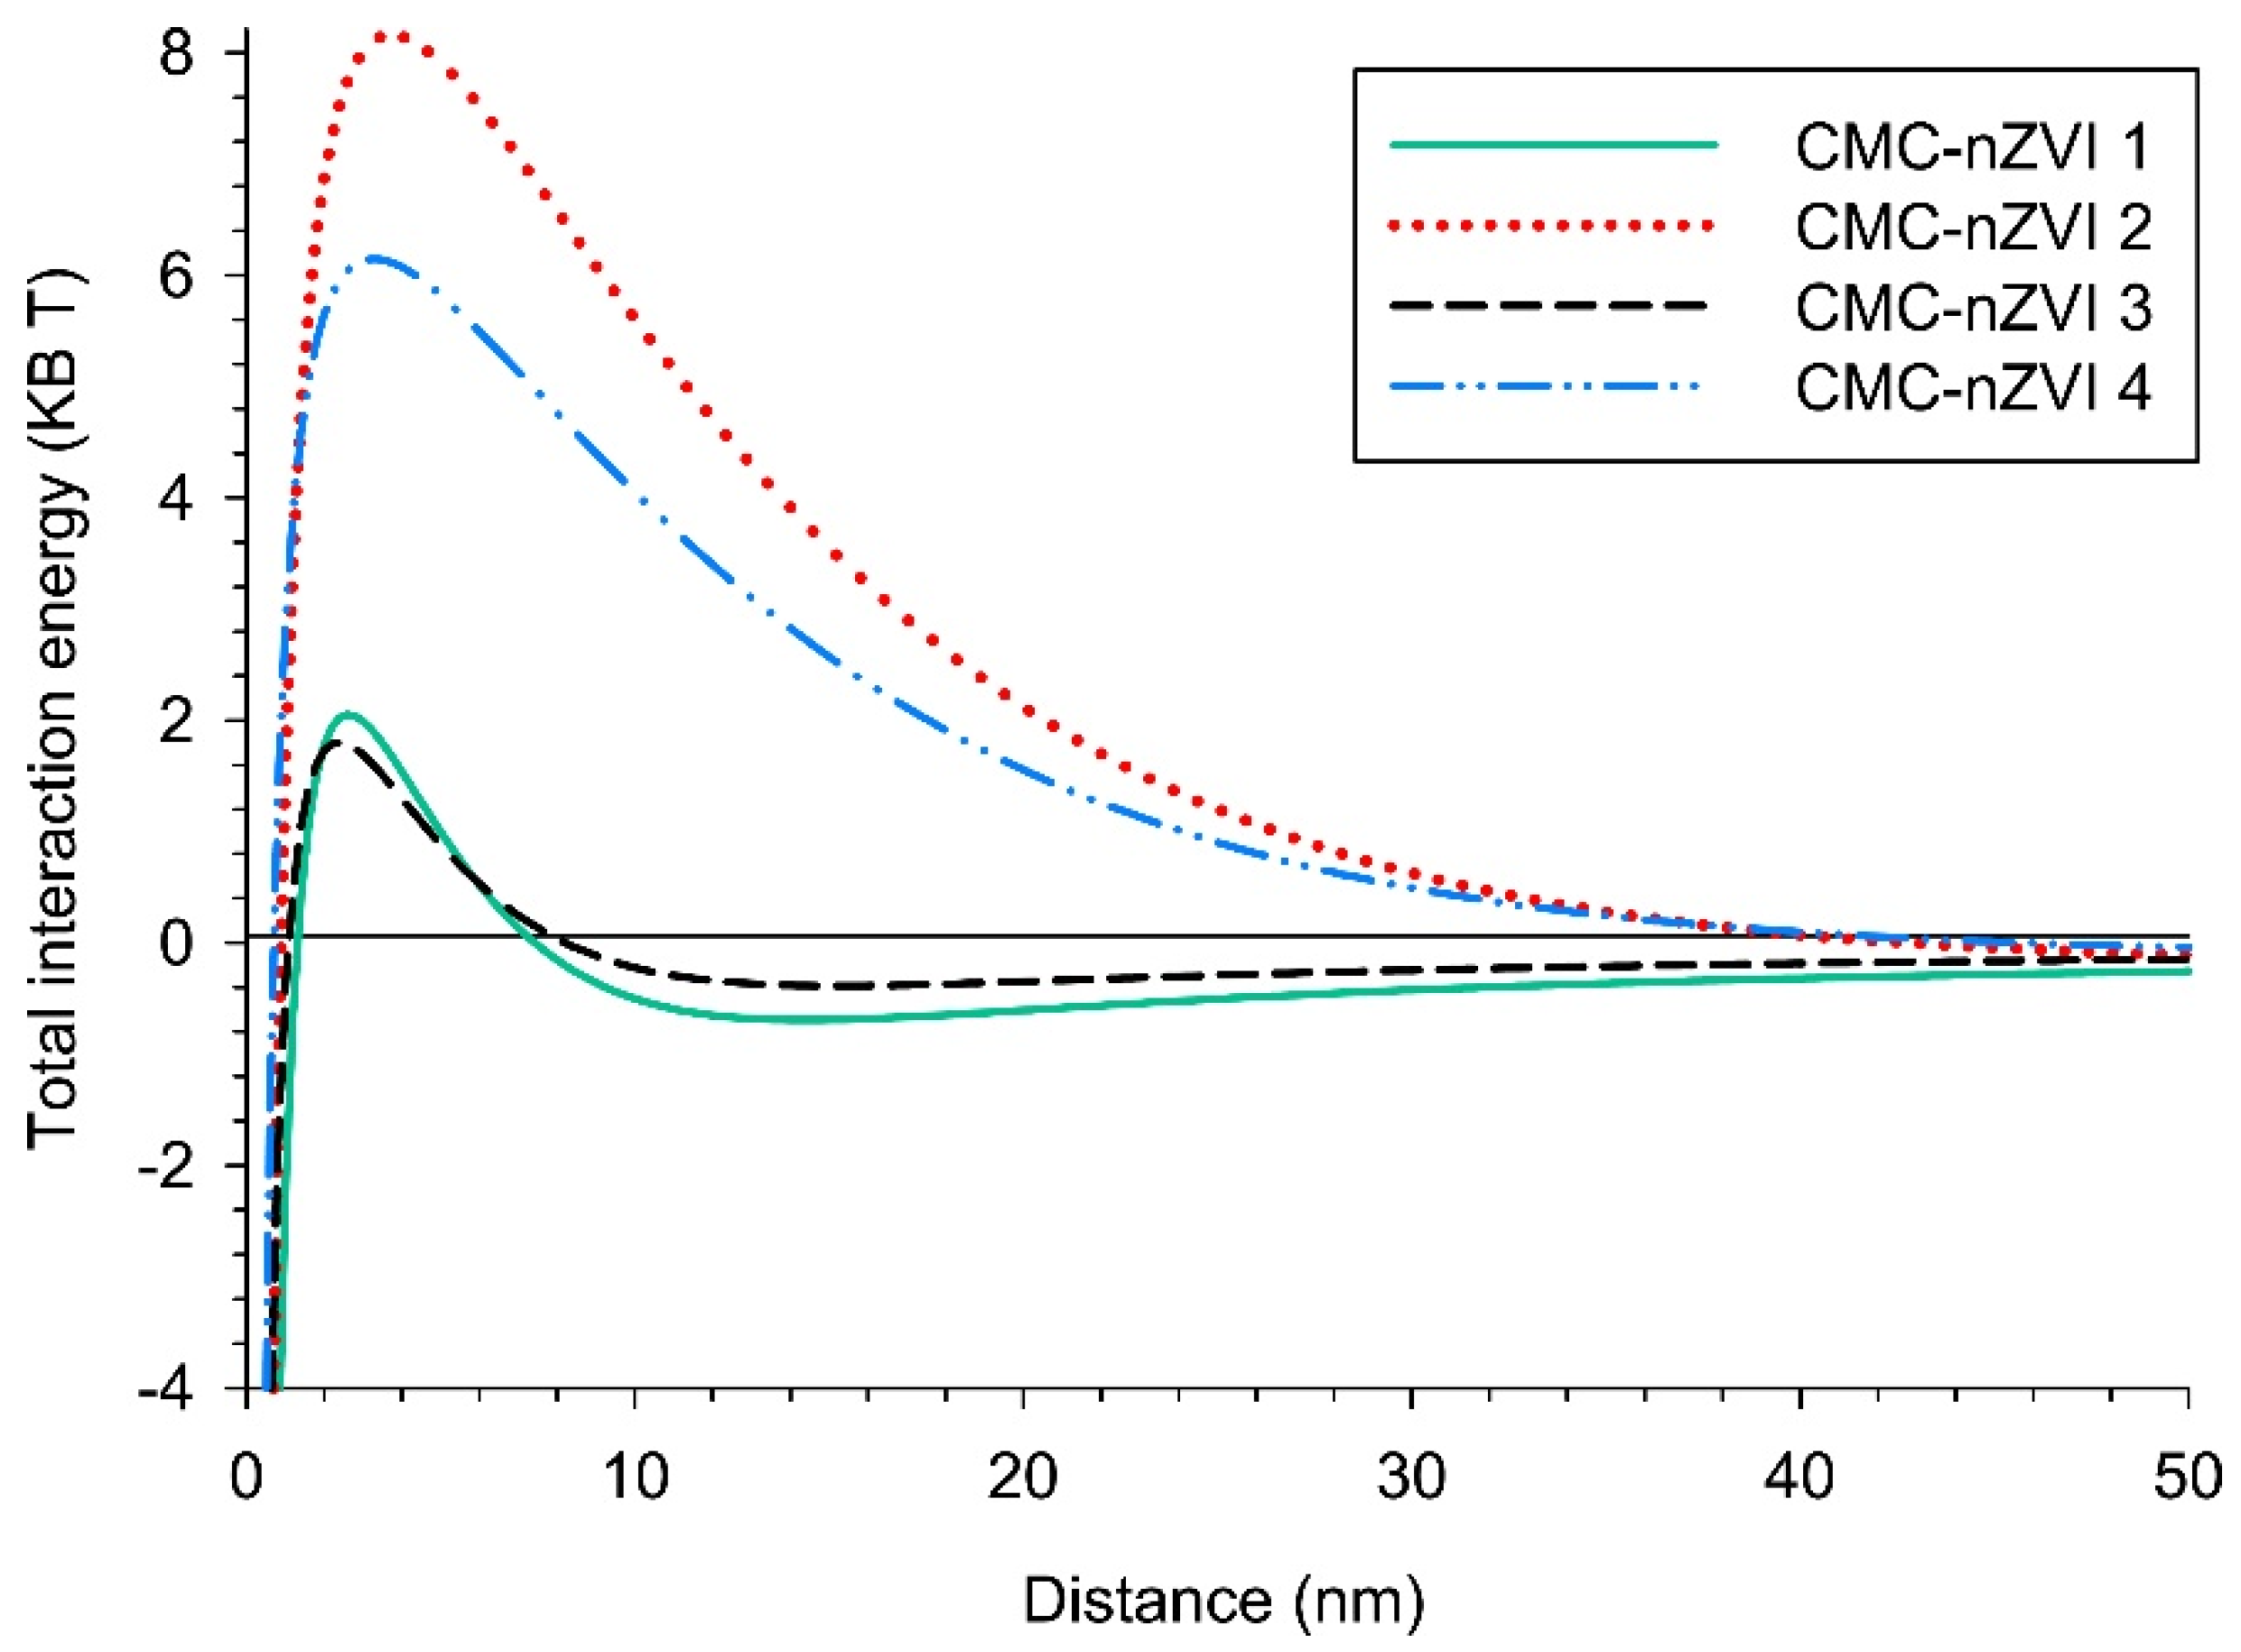
Figure 4.
Effect of the concentration of CMC-nZVI nanoparticles on the removal efficiency of Cr(VI).
Figure 4.
Effect of the concentration of CMC-nZVI nanoparticles on the removal efficiency of Cr(VI).
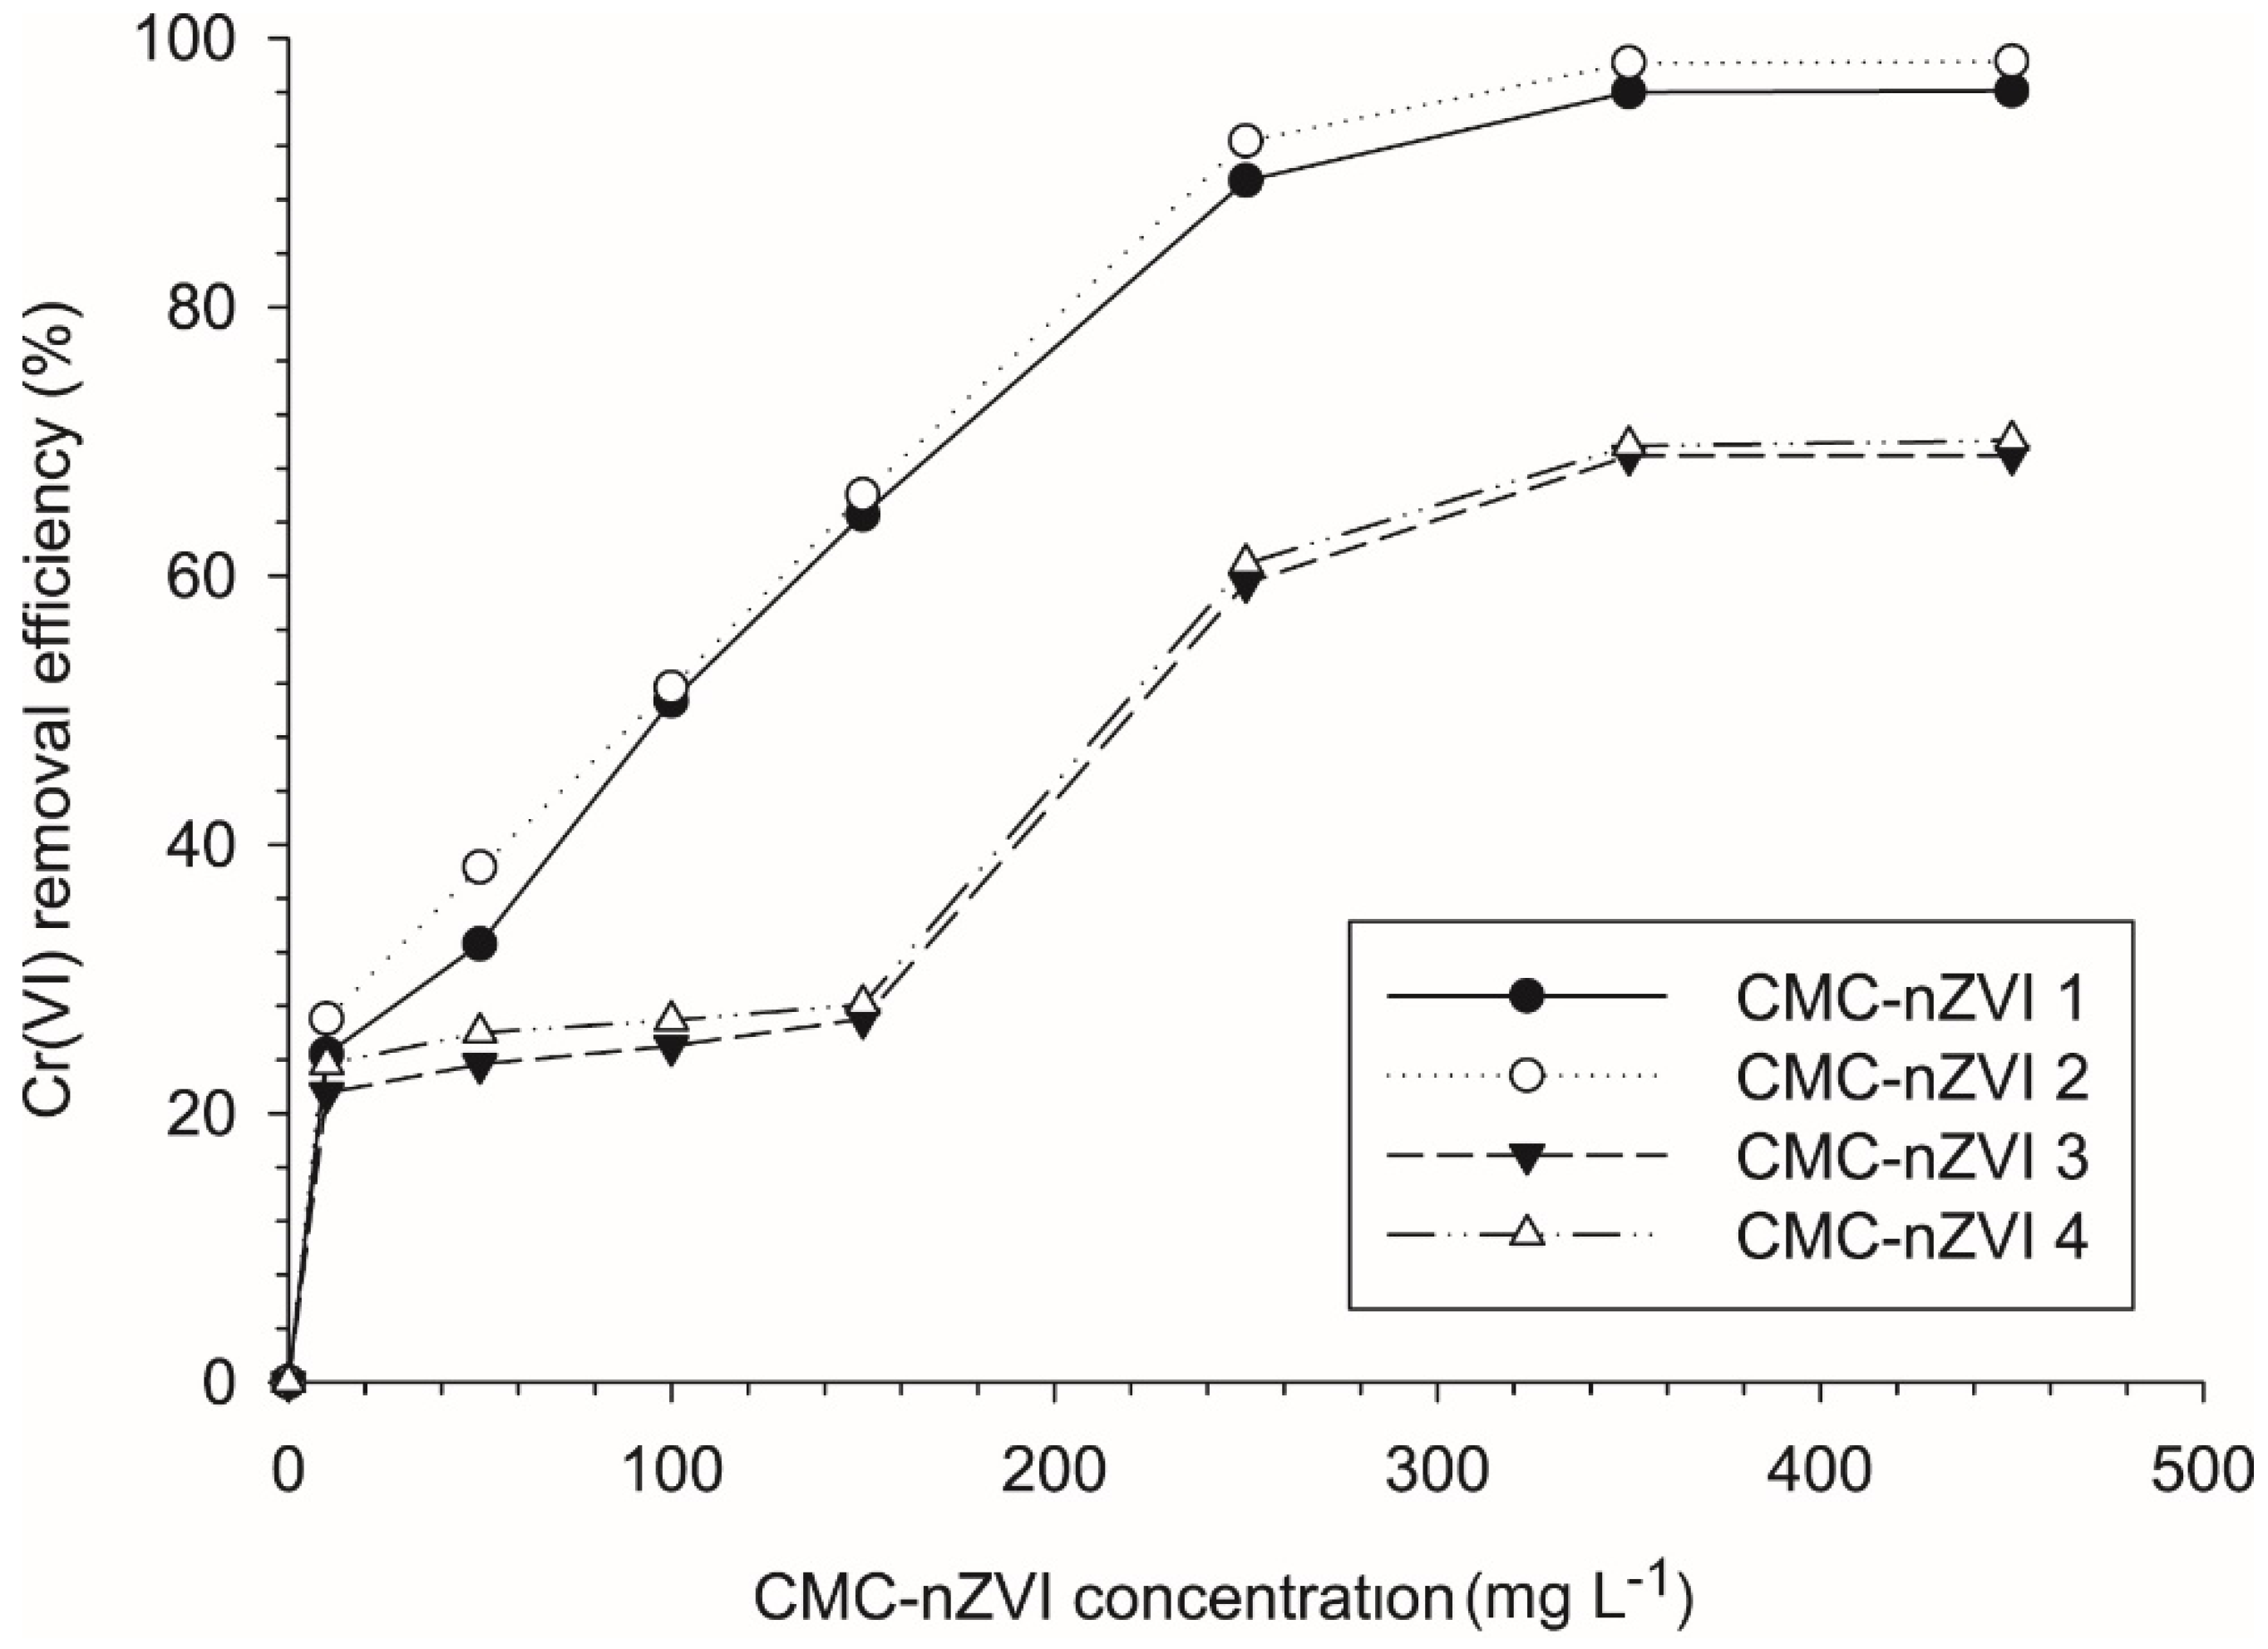
Figure 5.
Effect of contact time of CMC-nZVI nanoparticles on the removal efficiency of Cr(VI).
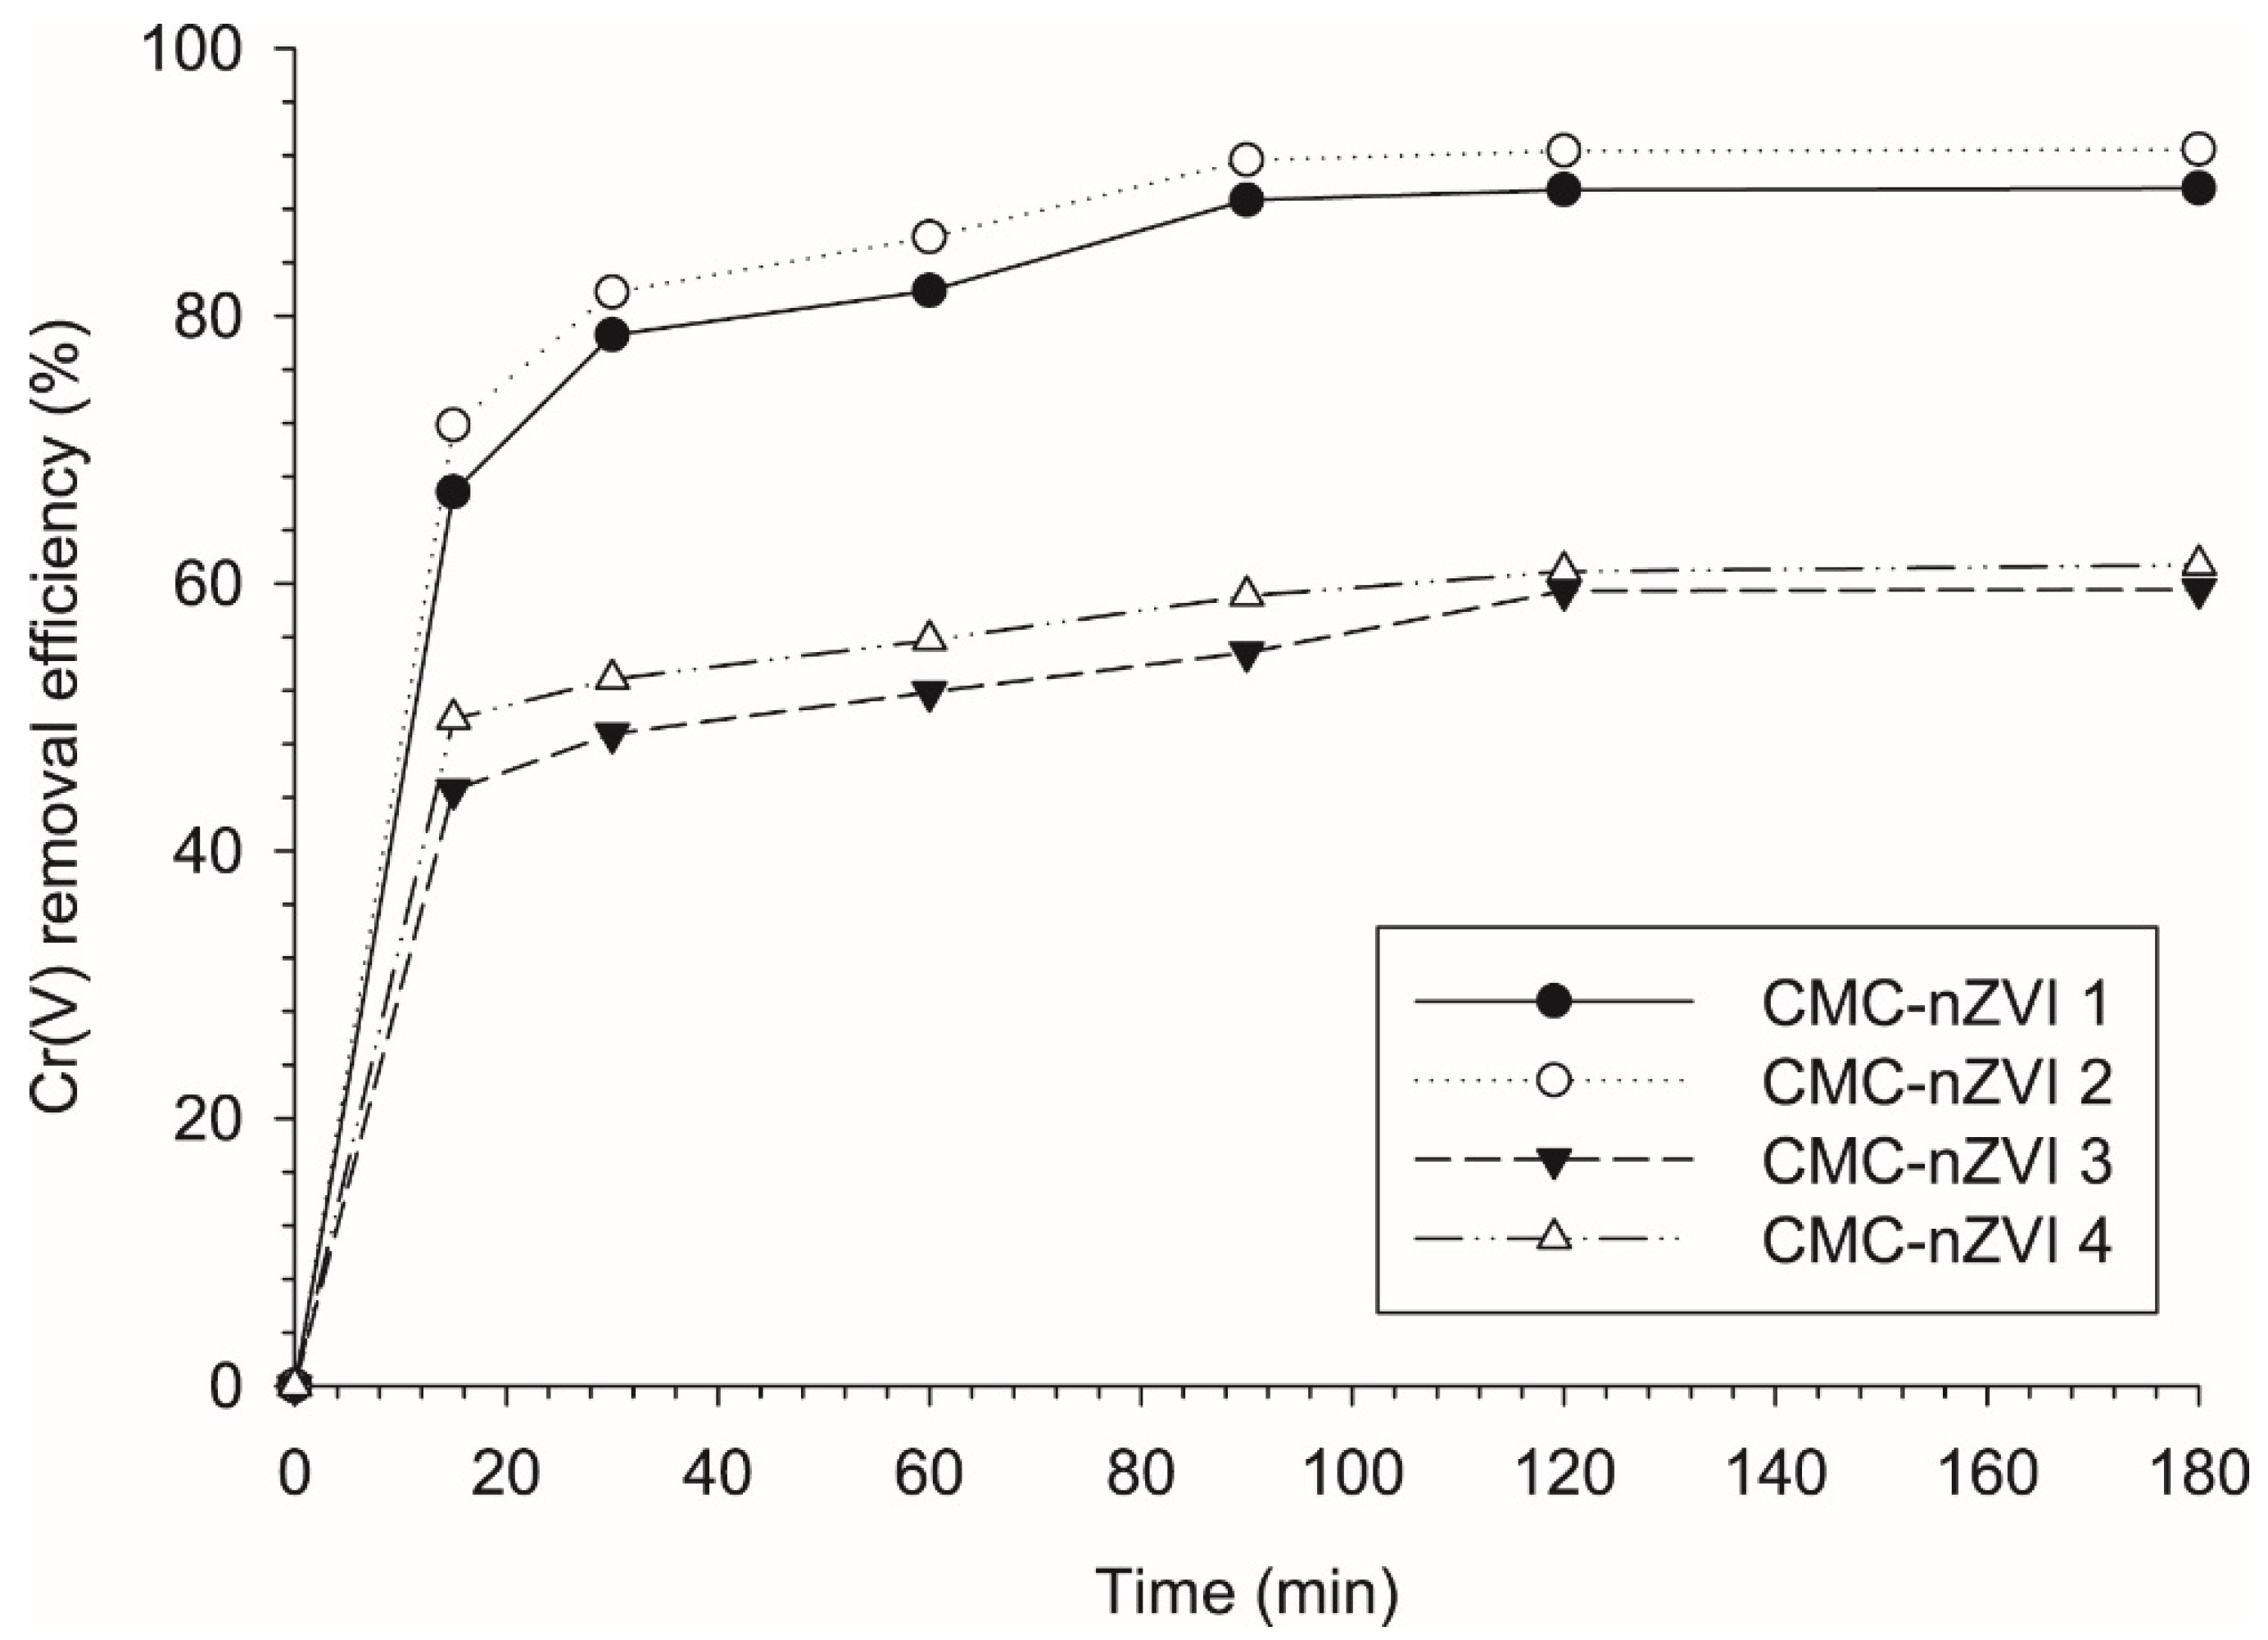
Figure 6.
Effect of pH and IS of the CMC-nZVI suspensions on the relative concentration of Cr(IV) in the contaminated loamy sand soil.
Figure 6.
Effect of pH and IS of the CMC-nZVI suspensions on the relative concentration of Cr(IV) in the contaminated loamy sand soil.
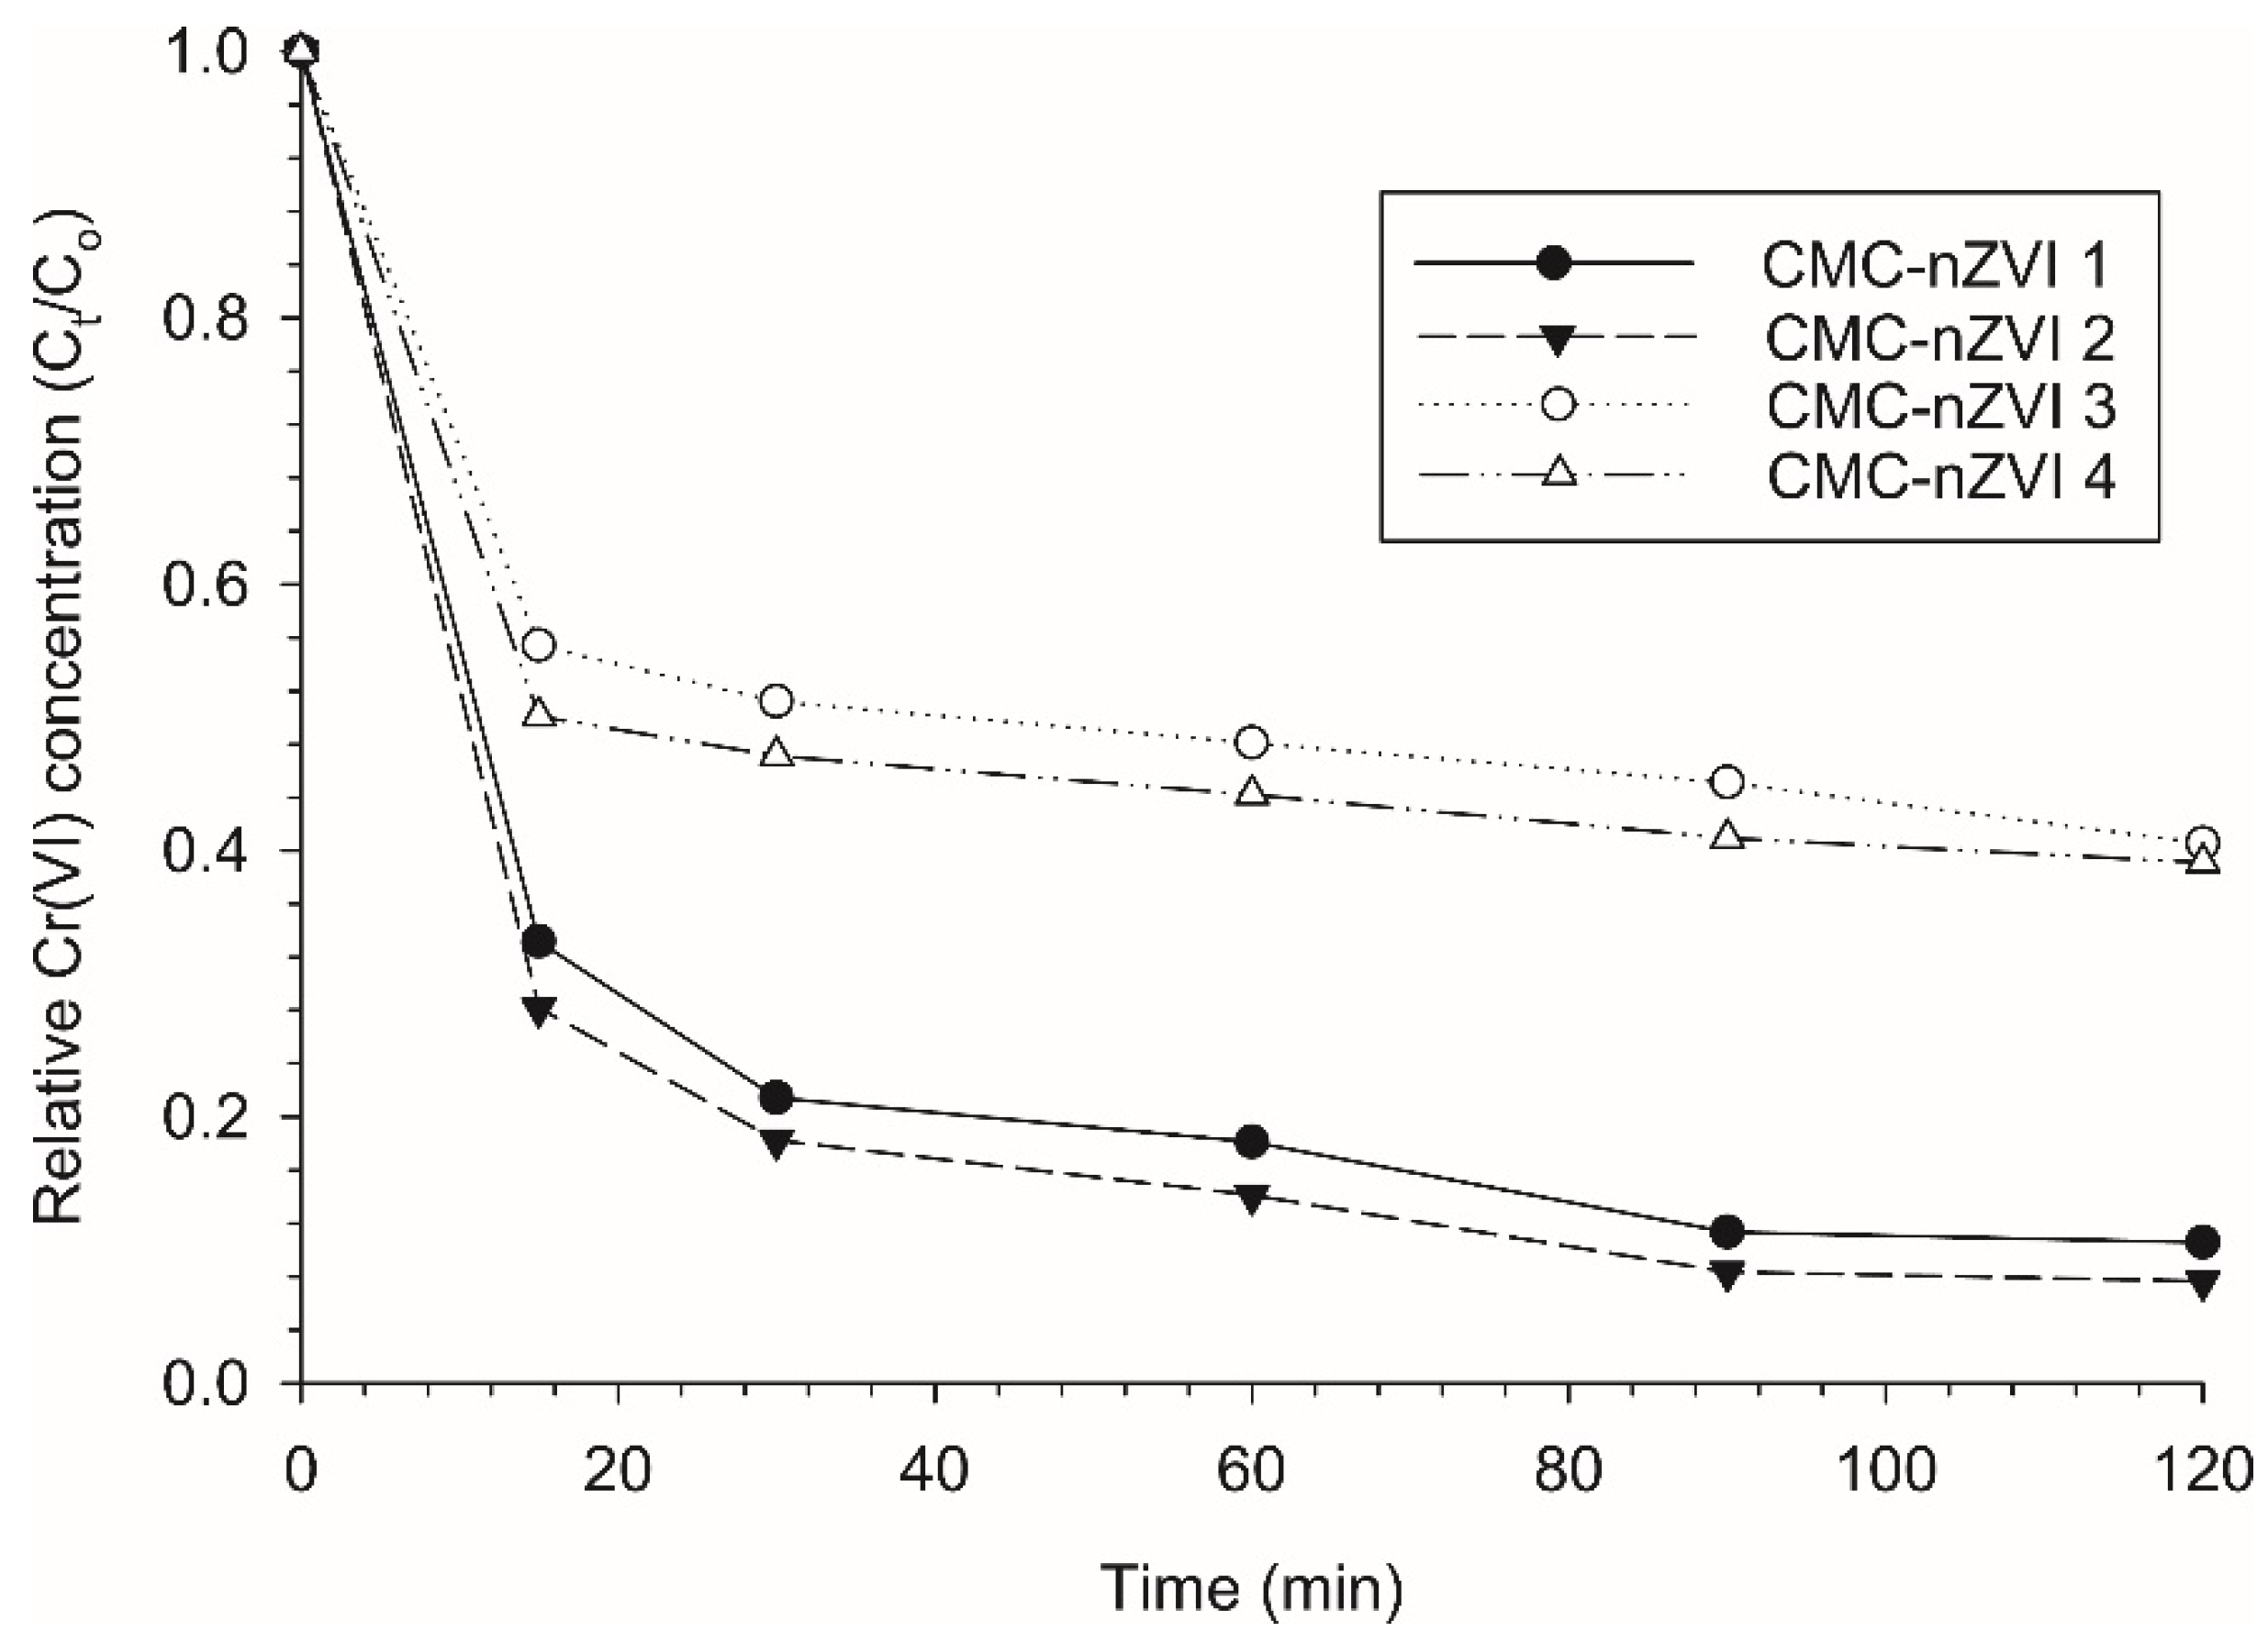
Figure 7.
Effect of pH and IS on reaction kinetics of Cr(VI) using the pseudo-second order, (A); the Langmuir-Hinshelwood first order, (B); and the pseudo-first order, (C) kinetic models. (CMC-nZVI 1, pH5 and 0.01 M; CMC-nZVI 2, pH 5 and 0.001 M; CMC-nZVI 3, pH 7 and 0.01 M; and CMC-nZVI 4, pH 7 and 0.001 M). Initial Cr(VI) concentration is 100 mg L-1, and CMC-nZVI concentration is 250 mg L-1.
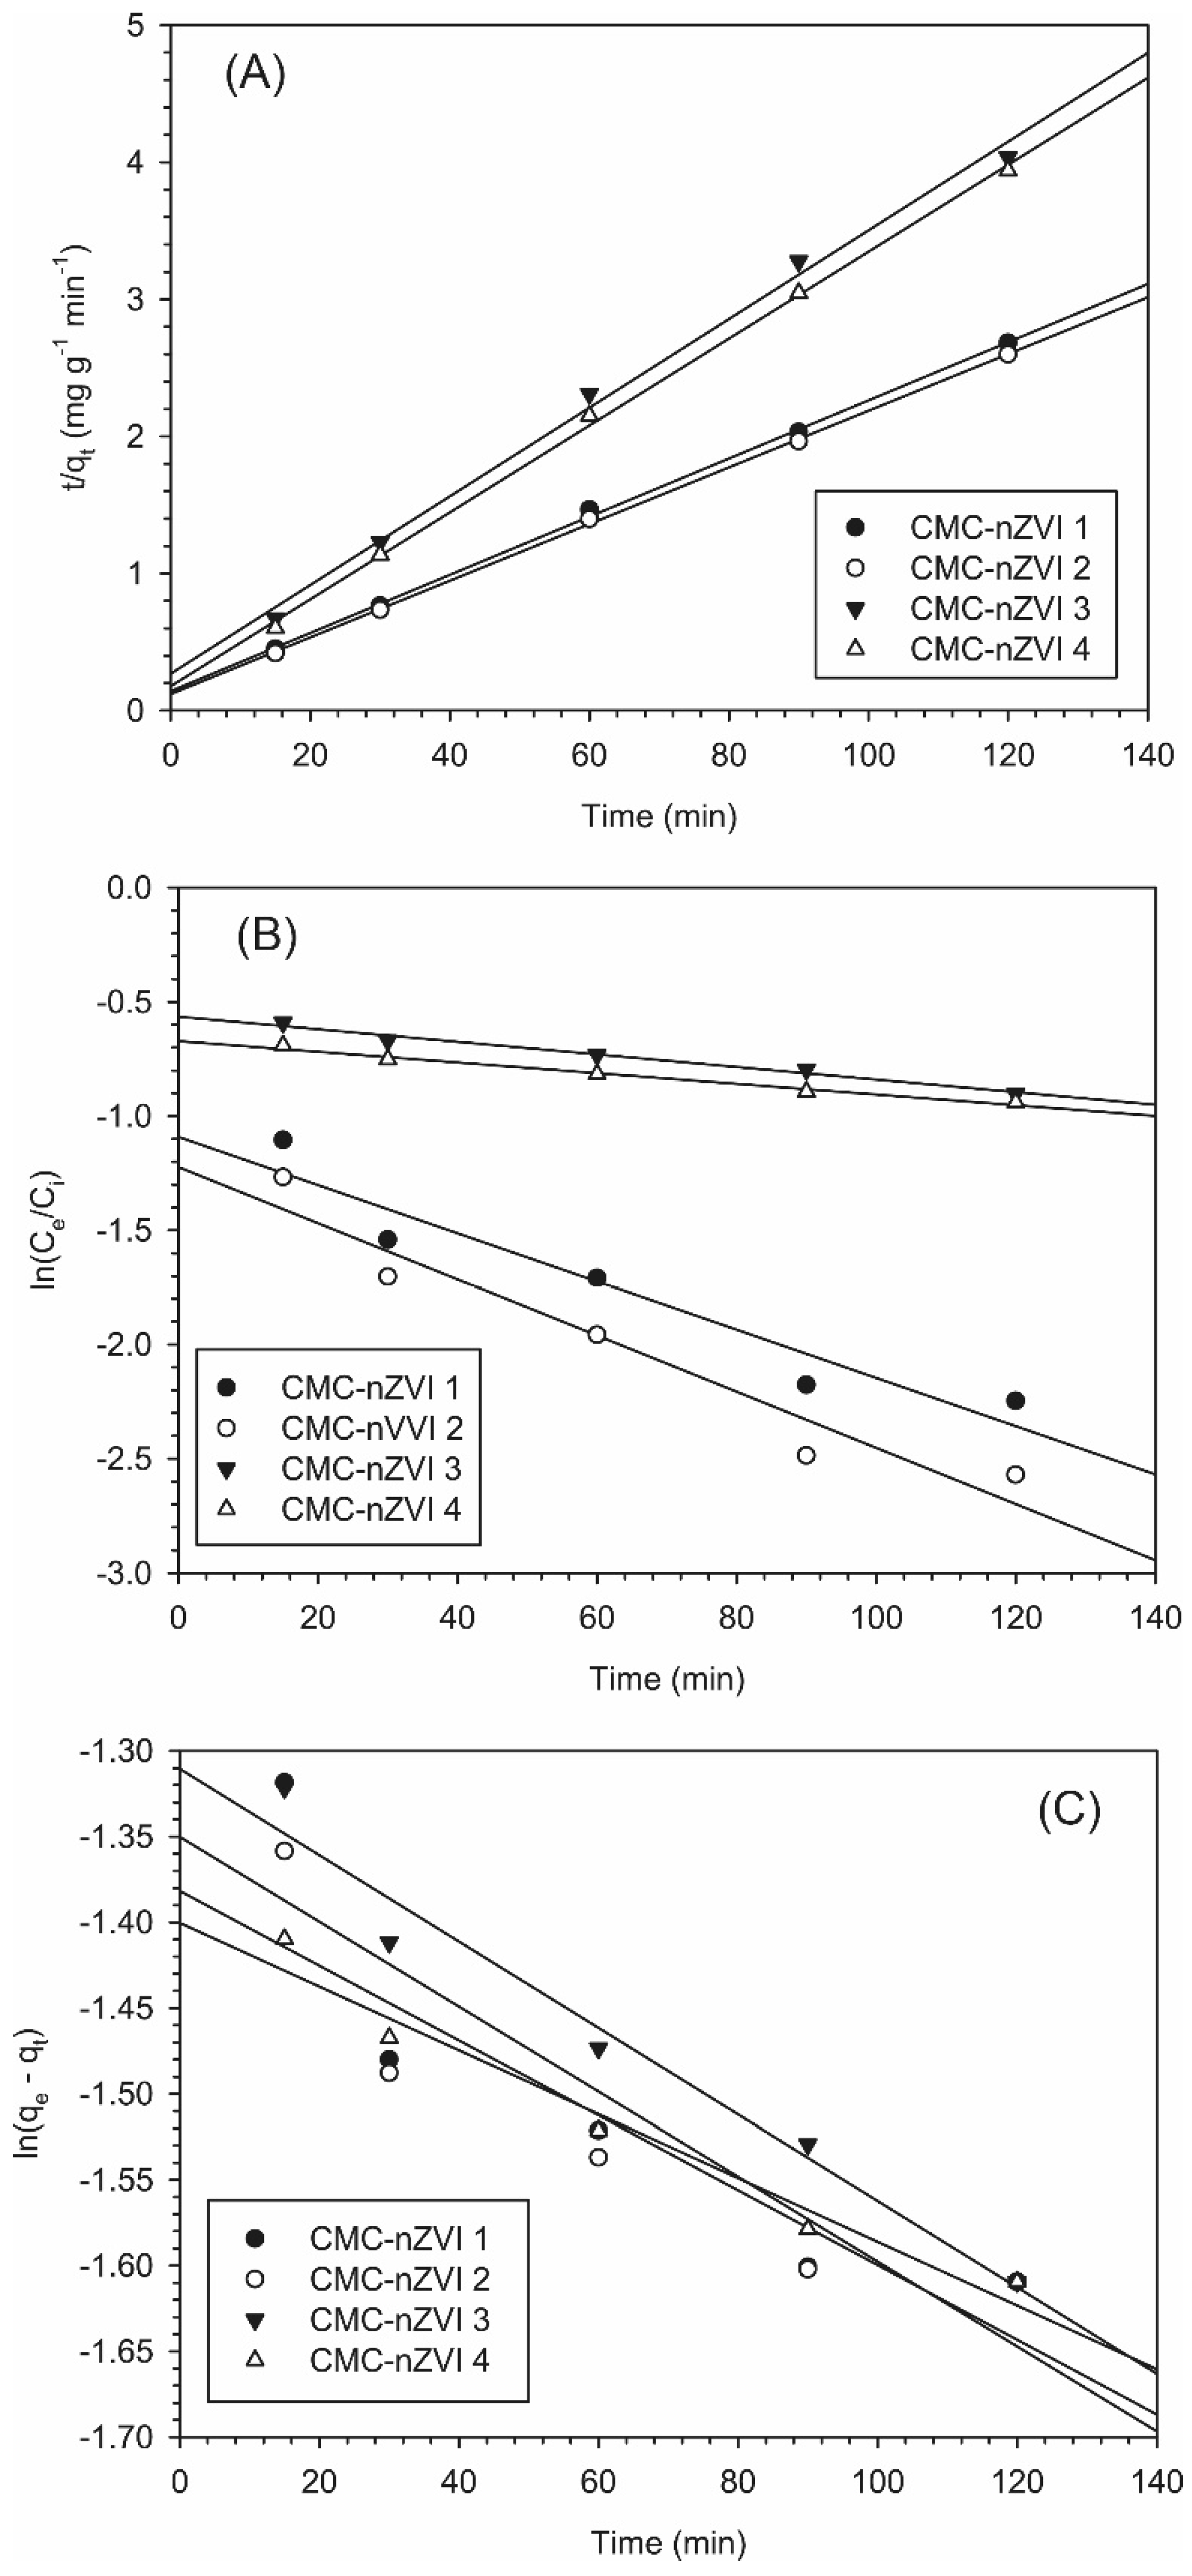
Figure 8.
Effect of pH and IS on removal capacity of Cr(VI) (CMC-nZVI 1, pH5 and 0.01 M; CMC-nZVI 2, pH 5 and 0.001 M; CMC-nZVI 3, pH 7 and 0.01 M; and CMC-nZVI 4, pH 7 and 0.001 M). Initial Cr(VI) concentration is 100 mg L-1, and CMC-nZVI concentration is 250 mg L-1.
Figure 8.
Effect of pH and IS on removal capacity of Cr(VI) (CMC-nZVI 1, pH5 and 0.01 M; CMC-nZVI 2, pH 5 and 0.001 M; CMC-nZVI 3, pH 7 and 0.01 M; and CMC-nZVI 4, pH 7 and 0.001 M). Initial Cr(VI) concentration is 100 mg L-1, and CMC-nZVI concentration is 250 mg L-1.
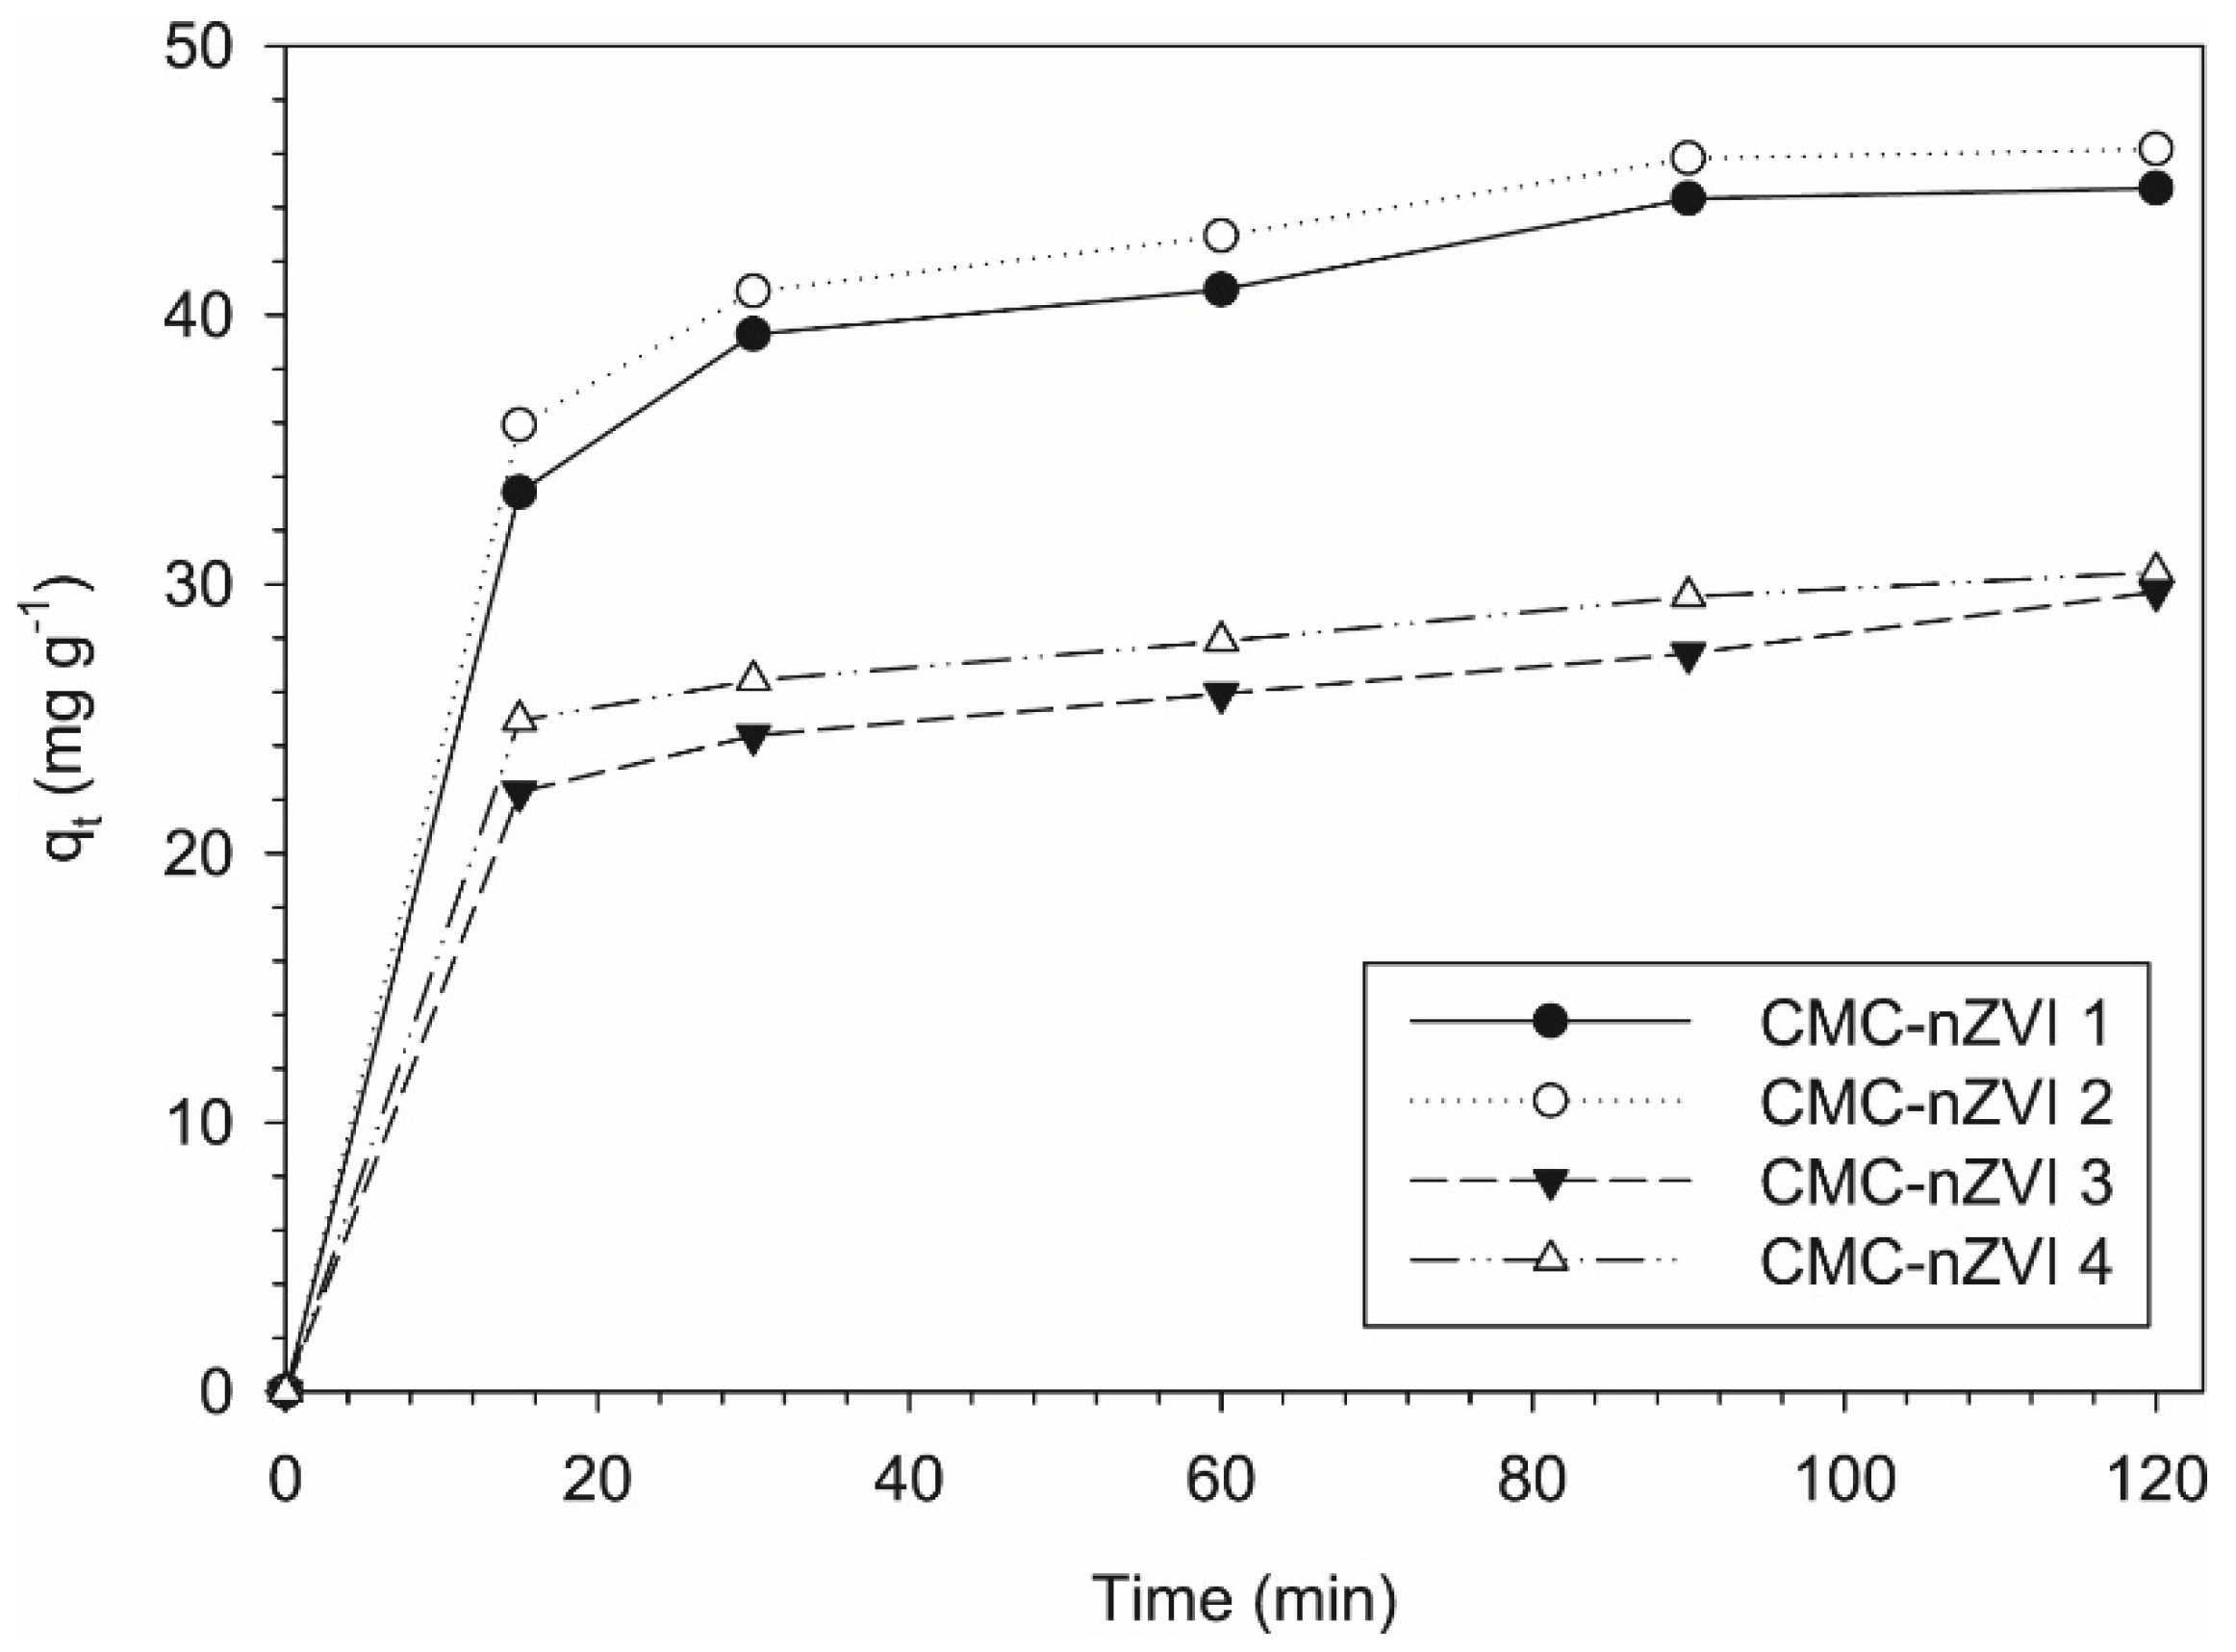
Figure 9.
Breakthrough curves for the transport of Cr(VI) (uniform transport model) at low flow rate of 2 (A-D), and high flow rate of 4 (E-H) cm h-1 as affected by the pH and IS of the CMC-nZVI suspensions.
Figure 9.
Breakthrough curves for the transport of Cr(VI) (uniform transport model) at low flow rate of 2 (A-D), and high flow rate of 4 (E-H) cm h-1 as affected by the pH and IS of the CMC-nZVI suspensions.

Figure 10.
Breakthrough curves for the transport of Cr(VI) (two-site sorption model) at low flow rate of 2 (A-D), and high flow rate of 4 (E-H) cm h-1 as affected by the pH and IS of the CMC-nZVI suspensions.
Figure 10.
Breakthrough curves for the transport of Cr(VI) (two-site sorption model) at low flow rate of 2 (A-D), and high flow rate of 4 (E-H) cm h-1 as affected by the pH and IS of the CMC-nZVI suspensions.
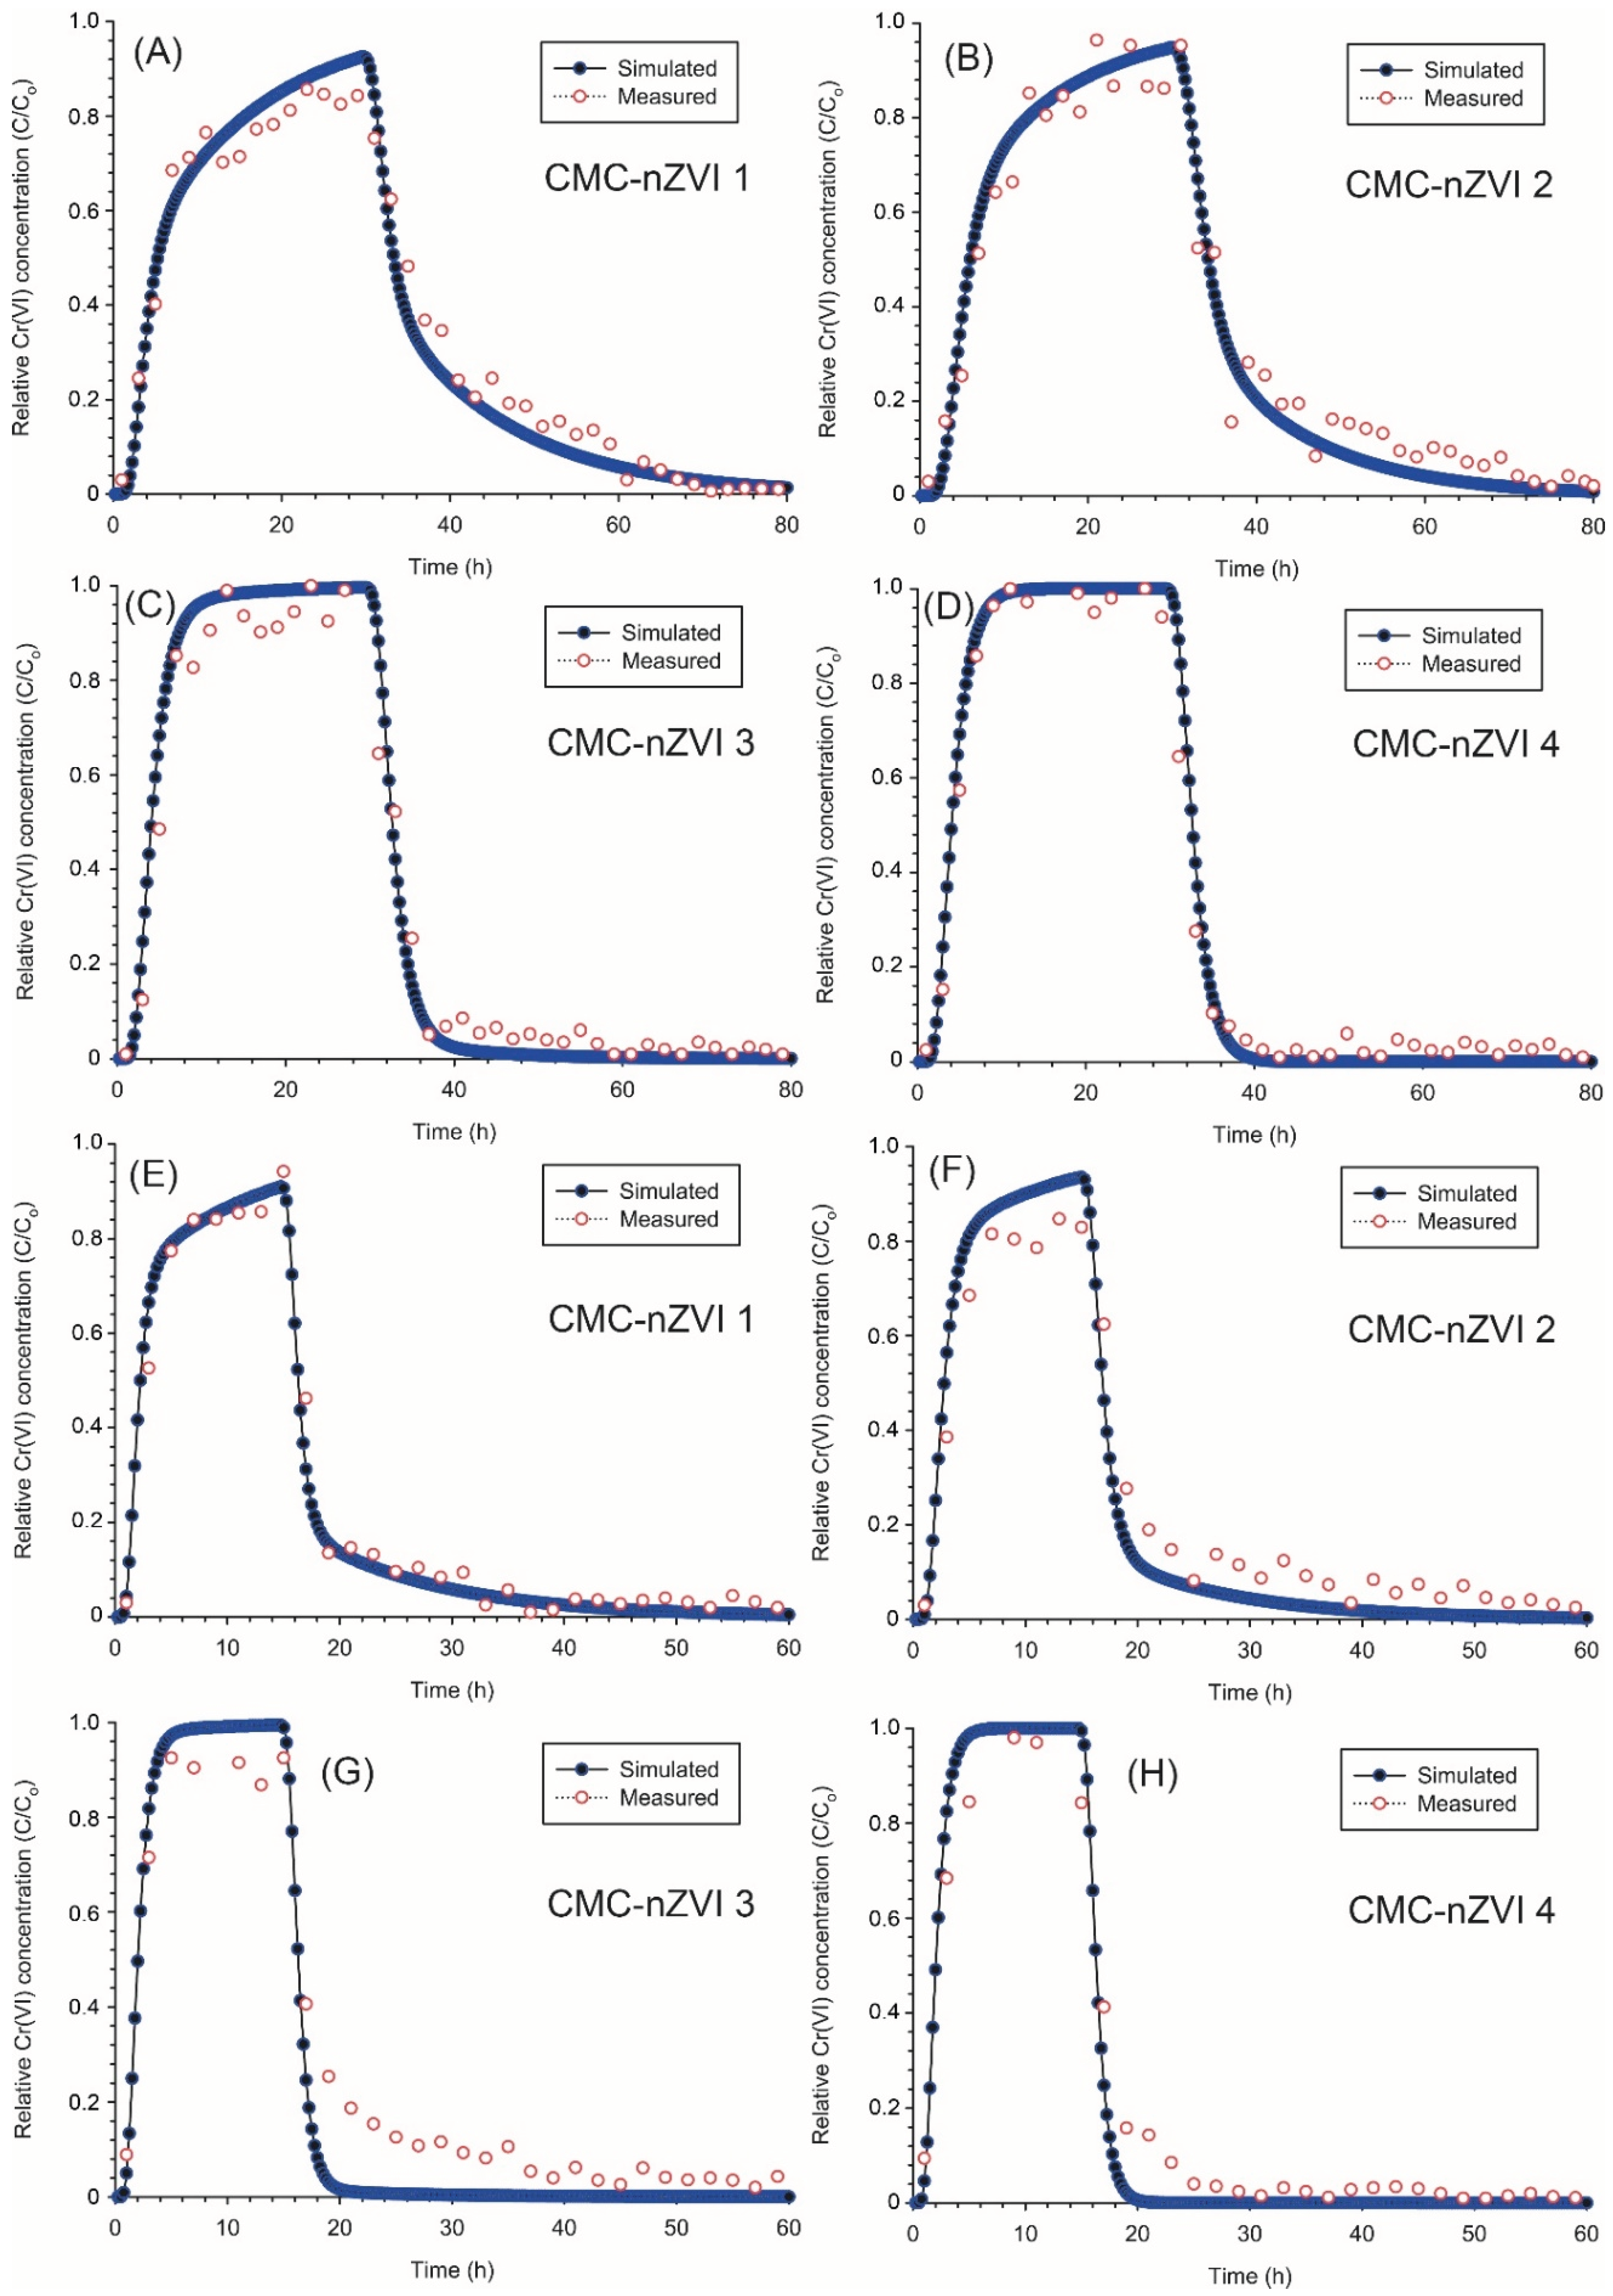
Table 1.
Physical and Chemical properties of the loamy sand soil used in the study.
| Measurement | Unit | Value |
|---|---|---|
| Sand | % | 81.5 |
| Silt | % | 11.4 |
| Clay | % | 7.1 |
| Texture | - | Loamy sand |
| SHC | cm s-1 | 11.4 10-4 |
| pH | - | 7.85 |
| EC | dS m-1 | 1.92 |
| OM | % | 0.18 |
| CEC | cmolc Kg-1 | 6.2 |
| Calcium | meq L-1 | 4.17 |
| Magnesium | meq L-1 | 1.33 |
| Sodium | meq L-1 | 12.54 |
| Potassium | meq L-1 | 1.05 |
| Bicarbonate | meq L-1 | 1.17 |
| Chloride | meq L-1 | 10.60 |
| Sulphate | meq L-1 | 7.32 |
| Cr(VI) | mg Kg-1 | 7.4 |
SHC, saturated hydraulic conductivity; pH, potential hydrogen; EC, electrical conductivity; OM, organic matter; CEC, cation exchange capacity.
Table 2.
Characteristics of the different suspensions of CMC-nZVI nanoparticles.
| CMC-nZVI suspensions | pH | IS (M) |
Hydrodynamic Size (nm) |
Zeta potential (mV) |
| CMC-nZVI 1 | 5 | 0.01 | 131.2 ± 12.5 | -16.8 ± 1.2 |
| CMC-nZVI 2 | 5 | 0.001 | 129.8 ±14.2 | -18.1 ± 2.3 |
| CMC-nZVI 3 | 7 | 0.01 | 76.1 ± 9.4 | -18.0 ± 1.1 |
| CMC-nZVI 4 | 7 | 0.001 | 71.3 ± 8.5 | -20.3 ± 0.9 |
Carboxy-methyl-cellulose (CMC), zero valent iron (nZVI), ionic strength (IS). Zeta potential of the synthesized CMC-nZVI nanoparticles was calculated by the measurement of electrophoretic mobility and the application of Smoluchowski approximation.
Table 3.
Kinetic parameters for the removal of Cr(VI) by CMC-nZVI nanoparticles.
| Kinetic model | Parameters | CMC-nZVI nanoparticles | |||
| CMC-nZVI 1 | CMC-nZVI 2 | CMC-nZVI 3 | CMC-nZVI 4 | ||
| Pseudo-first order | qe | 0.259 | 0.251 | 0.269 | 0.246 |
| K1 | 2.08×10⁻⁵ | 1.83×10⁻⁵ | 2.08×10⁻⁵ | 1.58×10⁻⁵ | |
| r2 | 0.810 | 0.831 | 0.967 | 0.966 | |
| Pseudo-second order | qe | 47.169 | 48.309 | 30.864 | 30.345 |
| K2 | 1.26×10⁻⁴ | 1.01×10⁻⁴ | 5.61×10⁻⁴ | 3.55×10⁻⁴ | |
| Vo | 0.282 | 0.237 | 0.535 | 0.354 | |
| r2 | 0.999 | 0.999 | 0.994 | 0.998 | |
| Langmuir-Hinshelwood first order | K3 | 10.6×10⁻³ | 12.3×10⁻³ | 2.8×10⁻³ | 2.3×10⁻³ |
| t1/2 | 65.3 | 56.4 | 247.5 | 301.4 | |
| r2 | 0.922 | 0.939 | 0.981 | 0.984 | |
CMC-nZVI 1, pH5 and 0.01 M; CMC-nZVI 2, pH 5 and 0.001 M; CMC-nZVI 3, pH 7 and 0.01 M; and CMC-nZVI 4, pH 7 and 0.001 M. qe, removal capacity at equilibrium (mg g-1); K1 the rate constant of the pseudo-first order (min-1), K2 the rate constant of the pseudo-second order (g mg-1 min-1), and K3 the rate constants of the Langmuir-Hinshelwood first order model (min-1). Vo, the pseudo-second order initial rate (mg g-1 min-1) at t = 0 min (calculated as: Vo=K2 qe2). t1/2, half-life time (min) at which half of the initial Cr(VI) is degraded (calculated as: ln(2)/K3); r2, coefficient of determination.
Table 4.
Transport parameters of the uniform transport obtained by fitting the equilibrium CDE to the BTCs of CaCl2 tracer and Cr(VI) in CXTFIT and Hydrus models, respectively. .
Table 4.
Transport parameters of the uniform transport obtained by fitting the equilibrium CDE to the BTCs of CaCl2 tracer and Cr(VI) in CXTFIT and Hydrus models, respectively. .
| CMC-nZVI Suspension |
Water flow rate | ||||||||
| Low (2.0 cm h-1) | High (4.0 cm h-1) | ||||||||
| D | λ | Kd | r2 | D | λ | Kd | r2 | ||
| CMC-nZVI 1 | 8.16 | 1.56 | 0.67 | 0.81 | 16.33 | 1.56 | 0.67 | 0.85 | |
| CMC-nZVI 2 | 8.11 | 1.55 | 0.61 | 0.88 | 16.23 | 1.55 | 0.60 | 0.95 | |
| CMC-nZVI 3 | 8.42 | 1.61 | 0.17 | 0.97 | 16.86 | 1.61 | 0.16 | 0.97 | |
| CMC-nZVI 4 | 8.26 | 1.58 | 0.14 | 0.98 | 16.54 | 1.58 | 0.14 | 0.97 | |
CMC-nZVI 1, pH5 and 0.01 M; CMC-nZVI 2, pH 5 and 0.001 M; CMC-nZVI 3, pH 7 and 0.01 M; and CMC-nZVI 4, pH 7 and 0.001 M. CDE, convection-dispersion equation; D, hydrodynamic dispersion (cm2 h-1) (calculated as λV, where V is the pore water velocity); λ, dispersivity (cm); Kd, the distribution coefficient (ml g-1). Pore water velocity was calculated as (where q is the water flow rate and ϴ is the volumetric water content). r2, coefficient of determination.
Table 5.
Transport parameters of the physical and chemical non-equilibrium (Two-site sorption) obtained by fitting the non-equilibrium CDE to the BTCs of Cr(VI) in the Hydrus-1D model. .
Table 5.
Transport parameters of the physical and chemical non-equilibrium (Two-site sorption) obtained by fitting the non-equilibrium CDE to the BTCs of Cr(VI) in the Hydrus-1D model. .
| CMC-nZVI Suspension |
Water flow rate | ||||||||
| Low (2.0 cm h-1) | High (4.0 cm h-1) | ||||||||
| R | β | ω | r2 | R | β | ω | r2 | ||
| CMC-nZVI 1 | 3.62 | 0.42 | 6.02 | 0.97 | 3.62 | 0.42 | 3.00 | 0.98 | |
| CMC-nZVI 2 | 3.38 | 0.58 | 4.07 | 0.97 | 3.34 | 0.58 | 2.01 | 0.96 | |
| CMC-nZVI 3 | 1.67 | 0.92 | 0.38 | 0.97 | 1.62 | 0.92 | 0.19 | 0.97 | |
| CMC-nZVI 4 | 1.54 | 0.99 | 0.04 | 0.98 | 1.54 | 0.99 | 0.02 | 0.97 | |
CMC-nZVI 1, pH5 and 0.01 M; CMC-nZVI 2, pH 5 and 0.001 M; CMC-nZVI 3, pH 7 and 0.01 M; and CMC-nZVI 4, pH 7 and 0.001 M. CDE, convection-dispersion equation; R, the retardation factor (calculated as: ); β, the partitioning coefficient (calculated as: , where F is the fraction of sites available for instantaneous and kinetic sorption); ω, the mass transfer coefficient (calculated as: , where α is the first order kinetic rate coefficient (h-1) and L is the column length (cm)); pore water velocity was calculated as (where q is the water flow rate and ϴ is the volumetric water content); r2, coefficient of determination.
Table 6.
Simulation results for the transport of Cr(VI) in the loamy sand soil (uniform model).
| Simulation outputs | Flow rate (cm h-1) | CMC-nZVI suspensions | |||
| CMC-nZVI 1 | CMC-nZVI 2 | CMC-nZVI 3 | CMC-nZVI 4 | ||
| Time for solute arrival (h) | 2.0 | 3.75 | 3.50 | 1.75 | 1.75 |
| Time for maximum RC (h) | 2.0 | 29.75 | 27.75 | 16.25 | 15.25 |
| Time for RC < 0.01 (h) | 2.0 | 56.0 | 48.0 | 40.0 | 40.0 |
| Max. Cr(V) concentration (mg L-1) | 2.0 | 99.8 | 99.8 | 99.9 | 99.9 |
| Amount of Cr(VI) removed (mg) | 2.0 | 27.4 | 27.4 | 27.5 | 27.6 |
| Removal efficiency of Cr(VI) (%) | 2.0 | 70.1 | 70.1 | 70.3 | 70.6 |
| Time for solute arrival (h) | 4.0 | 2.00 | 1.75 | 1.00 | 1.00 |
| Time for maximum RC (h) | 4.0 | 15.00 | 14.50 | 8.00 | 7.50 |
| Time for RC < 0.01 (h) | 4.0 | 28.0 | 26.0 | 21.0 | 20.0 |
| Max. Cr(V) concentration (mg L-1) | 4.0 | 99.8 | 99.9 | 100.0 | 100.0 |
| Amount of Cr(VI) removed (mg) | 4.0 | 28.3 | 28.3 | 28.4 | 28.5 |
| Removal efficiency of Cr(VI) (%) | 4.0 | 72.4 | 72.4 | 72.6 | 72.9 |
CMC-nZVI 1, pH5 and 0.01 M; CMC-nZVI 2, pH 5 and 0.001 M; CMC-nZVI 3, pH 7 and 0.01 M; and CMC-nZVI 4, pH 7 and 0.001 M; RC, relative concentration.
Table 7.
Simulation results for the transport of Cr(VI) in the loamy sand soil (Two-site sorption model).
Table 7.
Simulation results for the transport of Cr(VI) in the loamy sand soil (Two-site sorption model).
| Simulation outputs | Flow rate (cm h-1) |
CMC-nZVI suspensions | |||
| CMC-nZVI 1 | CMC-nZVI 2 | CMC-nZVI 3 | CMC-nZVI 4 | ||
| Time for solute arrival (h) | 2.0 | 1.75 | 2.25 | 1.75 | 1.75 |
| Time for maximum RC (h) | 2.0 | 29.75 | 29.75 | 28.00 | 15.25 |
| Time for RC < 0.01 (h) | 2.0 | 80.0 | 80.0 | 48.00 | 44.0 |
| Max. Cr(V) concentration (mg L-1) | 2.0 | 92.5 | 94.8 | 99.6 | 100.0 |
| Amount of Cr(VI) removed (mg) | 2.0 | 27.2 | 27.4 | 27.4 | 27.5 |
| Removal efficiency of Cr(VI) (%) | 2.0 | 69.5 | 70.1 | 70.1 | 70.3 |
| Time for solute arrival (h) | 4.0 | 1.00 | 1.00 | 1.00 | 1.00 |
| Time for maximum RC (h) | 4.0 | 15.00 | 15.00 | 13.50 | 7.50 |
| Time for RC < 0.01 (h) | 4.0 | 52.0 | 46.0 | 22.0 | 21.0 |
| Max. Cr(V) concentration (mg L-1) | 4.0 | 91.0 | 93.5 | 99.4 | 100.0 |
| Amount of Cr(VI) removed (mg) | 4.0 | 28.2 | 28.3 | 28.3 | 28.4 |
| Removal efficiency of Cr(VI) (%) | 4.0 | 72.1 | 72.4 | 72.4 | 72.6 |
CMC-nZVI 1, pH5 and 0.01 M; CMC-nZVI 2, pH 5 and 0.001 M; CMC-nZVI 3, pH 7 and 0.01 M; and CMC-nZVI 4, pH 7 and 0.001 M; RC, relative concentration.
Disclaimer/Publisher’s Note: The statements, opinions and data contained in all publications are solely those of the individual author(s) and contributor(s) and not of MDPI and/or the editor(s). MDPI and/or the editor(s) disclaim responsibility for any injury to people or property resulting from any ideas, methods, instructions or products referred to in the content. |
© 2024 by the authors. Licensee MDPI, Basel, Switzerland. This article is an open access article distributed under the terms and conditions of the Creative Commons Attribution (CC BY) license (http://creativecommons.org/licenses/by/4.0/).
Copyright: This open access article is published under a Creative Commons CC BY 4.0 license, which permit the free download, distribution, and reuse, provided that the author and preprint are cited in any reuse.


