Submitted:
16 February 2024
Posted:
19 February 2024
You are already at the latest version
Abstract
China's cotton production has shown a concentration to the advantageous regions in recent years. Based on the relevant data of cotton production in China, the study measures the cotton production agglomeration levels of 16 major cotton-producing provinces from 1978 to 2020, summarizes the spatiotemporal evolution characteristics of cotton production agglomeration, and analyzes the factors influencing cotton production agglomeration using spatial econometric models. The results indicate that: Firstly, since the opening-up and reform, China's cotton production agglomeration levels have shown an overall upward trend, exhibiting periodic dynamic changes over time, and the spatial pattern reveals a dynamic regional gradient. Secondly, there is spatial correlation among the production scales of cotton in different provinces, with a trend resembling a "U" shape, and the agglomeration form shows a low-level convergence. Thirdly, technological level, policies, substitute industrial products and foreign trade are identified as important factors. The cotton production in each province is spatially correlated through these factors, and there is also a presence of spillover effects. In conclusion, the government should prioritize considerations of various influencing factors to formulate tailored support policies, promote large-scale production to enhance technological levels, and focus on policies aimed at improving the quality of cotton.
Keywords:
cotton production agglomeration
; spatiotemporal evolution characteristics
; spatial correlation
; spatial econometric model
1. Introduction
Cotton is an important cash crop and strategic material in China, involving both agriculture and industry. Since 1978, cotton production capacity has been on the rise. However, in the long term, the quality and supply of domestic cotton cannot meet the demand for the transformation and upgrading of the textile industry. Therefore, a large amount of cotton still needs to be imported. At the same time, geopolitical factors and changes in the international market increase the risk of relying on cotton imports to ensure supply [1]. Policies such as the “14th Five-Year Plan for National Agricultural Development,” the “National Quality-Driven Agriculture Strategy Plan (2018-2022),” and the “14th Five-Year Plan for Advancing Agricultural and Rural Modernization” all emphasize the need to stabilize production, ensure supply, improve quality, and increase efficiency in cotton production. The Central Government’s policy documents have repeatedly called for the construction of high-quality cotton bases, making high-quality cotton development inevitable. With the rapid development of industrialization and urbanization in China, the spatial distribution of agriculture is also changing over time, and agricultural production agglomeration has become a prominent feature of agricultural modernization development in China. The geographical agglomeration characteristics of China’s planting industry are obvious, and the specialization and diversity of regional planting have gradually increased. There are significant differences in the production agglomeration of different crops [2,3]. Cotton production in China also shows a gradual concentration in advantageous regions. Cotton production agglomeration is beneficial for leveraging the resource endowment of advantageous regions, promoting large-scale and specialized production, improving cotton varieties and quality, fostering cooperation among related industries, enhancing the comprehensive efficiency of the entire industry system. Also, it can improve regional planting structure, and driving the development of regional agricultural economy.
In existing research, the perspective of agricultural production agglomeration has been applied to various aspects such as grains, vegetables, livestock, poultry, fruits, etc. However, there are relatively fewer studies explicitly focusing on the concept of cotton production agglomeration. Research related to cotton production agglomeration includes several aspects as follows: First, studies on the layout of cotton production. At the national level, since the reform and opening-up, China’s major cotton-producing regions have shifted from south to north, and from the Yellow River Basin to the northwest Xinjiang region. The production volume and the center of gravity of production area have moved towards the northwest [4,5,6]. At the provincial level, the analysis shows that the center of cotton production in China was mainly in Shandong Province in 1990, including the Huang-Huai-Hai region, the coastal areas of Jiangsu, the Nanxiang Basin, and the Hanjiang Plain. However, by 1999, the production center had shifted to Xinjiang province, though Henan province and its southern adjacent areas remained major production areas [7]. Internally in Xinjiang, cotton production has agglomerated towards competitive regions in southern Xinjiang, including areas like Bayingolin Mongolian Autonomous Prefecture and Kashgar, while cotton production in northern Xinjiang has continuously decreased [8]. Second, studies based on the cotton industry chain. Upstream cotton farmers operate on a small scale [9], and the quality of seeds varies [10], which hampers the transformation and upgrading of the industry chain. Therefore, there is a need to strengthen cooperative organization construction and implement large-scale and mechanized production to promote the coordinated development of the midstream and downstream sectors [11]. Thirdly, macroscopic perspective on the factors affecting changes in cotton production layout. Factors include natural environments such as sunlight, irrigation conditions, and natural disasters, production inputs such as labor and fertilizers, policies like cotton subsidies, social and economic environments such as planting income, non-agricultural employment, the textile industry, highway mileage, as well as research investment, technological innovation, etc [4,12,13,14]. Fourth, microscopic perspective on the factors influencing cotton farmers’ planting decisions. Factors such as cotton farmers’ perception biases and path dependence regarding cotton quality and picking, previous costs and prices of cotton, expected returns, comparative benefits, economies of scale, technological progress, subsidy policies, national economic conditions, cotton imports, etc., all affect cotton farmers’ decisions regarding planting area [15,16,17,18,19,20,21].
Existing research still has its shortcomings. Firstly, the distinct characteristics of cotton production agglomeration in China, including temporal and spatial features, require further summarization and analysis. Secondly, although previous studies have explored various factors driving agglomeration, they have tended to overlook spatial factors and have not incorporated them into the models for testing. Additionally, with the changing international situation, it remains to be investigated whether the motivations for cotton agglomeration have also changed accordingly. Therefore, this paper focuses on the spatiotemporal characteristics and influencing factors of cotton production agglomeration, aiming to provide insights into cotton layout, high-quality cotton development and agglomeration in other crops.
2. Materials and Methods
2.1. Measurement Methods and Model Selection
2.1.1. Production Scale Index
The Cotton Production Scale Index refers to the proportion of the cotton planting area in a region during a certain period to the national cotton planting area during the same period. It measures the contribution of each region to cotton production. The formula is represented as follows:
In the equation, represents the Cotton Production Scale Index to be calculated, denotes the cotton planting area in region during period , and area represents the national cotton planting area during period .
2.1.2. Location Gini Coefficient
In studies of industrial agglomeration and spatial concentration, the Gini coefficient is commonly used to measure the degree of geographic agglomeration of industries. It ranges from 0 to 1, where 0 indicates that the degree of industrial agglomeration is completely equal in space, and 1 indicates that the industry is highly concentrated in a specific region. Within this range, larger values indicate higher levels of industrial agglomeration. This study adopts the calculation method proposed by Yao Chengsheng, Zhao Junwei and others [22,23] to analyze the agglomeration level of cotton production in China using the Gini coefficient. The calculation formula is as follows:
In the equation, the obtained Location Gini coefficient approaching 0 indicates a more balanced distribution of cotton production. As approaches 1, it indicates a more uneven distribution of cotton production, meaning a higher degree of spatial agglomeration in cotton production.
2.1.3. Location Quotient
The Location Quotient was originally used to measure the degree of concentration and specialization of an industry in a region, reflecting the spatial distribution of dominant industries within that area. It has later been applied to the calculation of agricultural production agglomeration levels. The calculation formula is as follows:
In the equation, represents the Location Quotient of cotton production in different provinces, denotes the planting area of cotton in each province, represents the total planting area of crops in each province, denotes the planting area of cotton in China, and represents the total planting area of crops in China. When > 1, it indicates that the specialization level of cotton production in that province is higher than the national average; when =1, it indicates that the specialization level of cotton production in that province is comparable to the national average; when < 1, it indicates that the specialization level of cotton production in that province is lower than the national average. If is concentrated in only a few regions, it indicates that cotton production is relatively concentrated and specialized. If there is not much difference in between regions, it indicates that cotton production is relatively dispersed.
2.1.4. Coefficient of Variation
The coefficient of variation can measure the variation trend of a set of data, objectively reflecting the degree of data dispersion. It can be used to assess the spatial differences in the evolution trend of cotton production agglomeration levels. The calculation formula is as follows:
In the equation, represents the standard deviation of the measurement index for cotton production agglomeration level, and represents the mean of the measurement index for cotton production agglomeration level.
2.1.5. Moran’s Index
Spatial autocorrelation analysis consists of two types: global measures and local measures. Global Moran’s I answer whether there is clustering, studying the overall spatial distribution of regional economic activities to analyze whether the research objects in space are independent, similar, or dissimilar. Local Moran’s I answer which areas exhibit clustering, mainly studying the spatial clustering near a particular region. This study employs Global Moran’s I to analyze the spatial autocorrelation of cotton production nationwide. The calculation formula is as follows:
In the equation, represents the Global Moran’s I; ,, respectively denote the cotton-related indicators of the and spatial units; n represents the number of selected provincial-level units; denotes the mean of cotton-related indicators; represents the spatial weight matrix. The Moran’s I value ranges from -1 to 1. >0 indicates a positive spatial correlation in cotton production distribution, implying agglomeration of similar attribute values. The larger the value, the stronger the spatial autocorrelation. <0 indicates a negative spatial correlation in cotton production distribution, implying agglomeration of dissimilar attribute values. The larger the absolute value, the stronger the spatial autocorrelation. =0 indicates that cotton production is randomly distributed, showing no spatial correlation.
The study employs Local Moran’s I to analyze the spatial autocorrelation of cotton production in specific provinces. The calculation formula is as follows:
In the equation, represents the Local Moran’s I. When >0, it indicates that region shares similar attribute characteristics with its neighboring units, either high or low values. When <0, it indicates significant differences in attribute characteristics between region and its neighboring units, with one having high values while the other has low values. When =0, it suggests that the cotton production in region is unrelated to neighboring regions, indicating no spatial correlation.
2.1.6. Spatial econometric model
Existing studies on factors influencing cotton production have overlooked spatial factors, whereas the evolution of cotton production agglomeration exhibits distinct spatial characteristics. Spatial econometric models can reflect changes in agglomeration levels over time and space, while also revealing spatial spillover effects between regions. Therefore, this study considers spatial factors and constructs appropriate spatial econometric models for empirical analysis. By incorporating spatial factors, panel data models may exhibit spatial lag terms containing endogenous variables, forming spatial autoregressive models (SAR), or may include autoregressive terms containing error terms, forming spatial error models (SEM), both of which can be simultaneously incorporated into spatial Durbin models (SDM). The specific selection of which model to use needs to be determined through testing.
The spatial weight matrix selected in this study is the geographic distance matrix. Utilizing Geoda software, the spatial weight matrix, denoted as the geographic distance spatial weight matrix , is constructed based on the geographic distances between spatial units. The expression is as follows:
where represents the straight-line distance between the administrative centers of regions and (calculated based on the latitude and longitude data of the administrative centers).
2.2. Data sources
The spatial scope of the study covers 16 provincial level administrative units, which are the main cotton-producing regions in China, including the Northwestern cotton region: Gansu and Xinjiang; the Yellow River Basin cotton region: Tianjin, Hebei, Shanxi, Liaoning, Shandong, Henan and Shaanxi; and the Yangtze River Basin cotton region: Jiangsu, Zhejiang, Anhui, Jiangxi, Hubei, Hunan, and Sichuan. The study period spans from 1978 to 2020. The original data were obtained from various sources including the “China Statistical Yearbook,” “Agricultural Statistics of Fifty Years of New China,” “Agricultural Statistics of Sixty Years of New China,” “Compilation of Statistical Data of Fifty Years of New China,” “Compilation of Statistical Data of Sixty Years of New China,” and provincial statistical yearbooks. Missing data were filled using linear interpolation as required by the research.
3. Results
3.1. Temporal and Spatial Characteristics of Cotton Production Agglomeration in China
3.1.1. The level of cotton production agglomeration shows stage-based dynamic changes over time, generally exhibiting an upward trend.
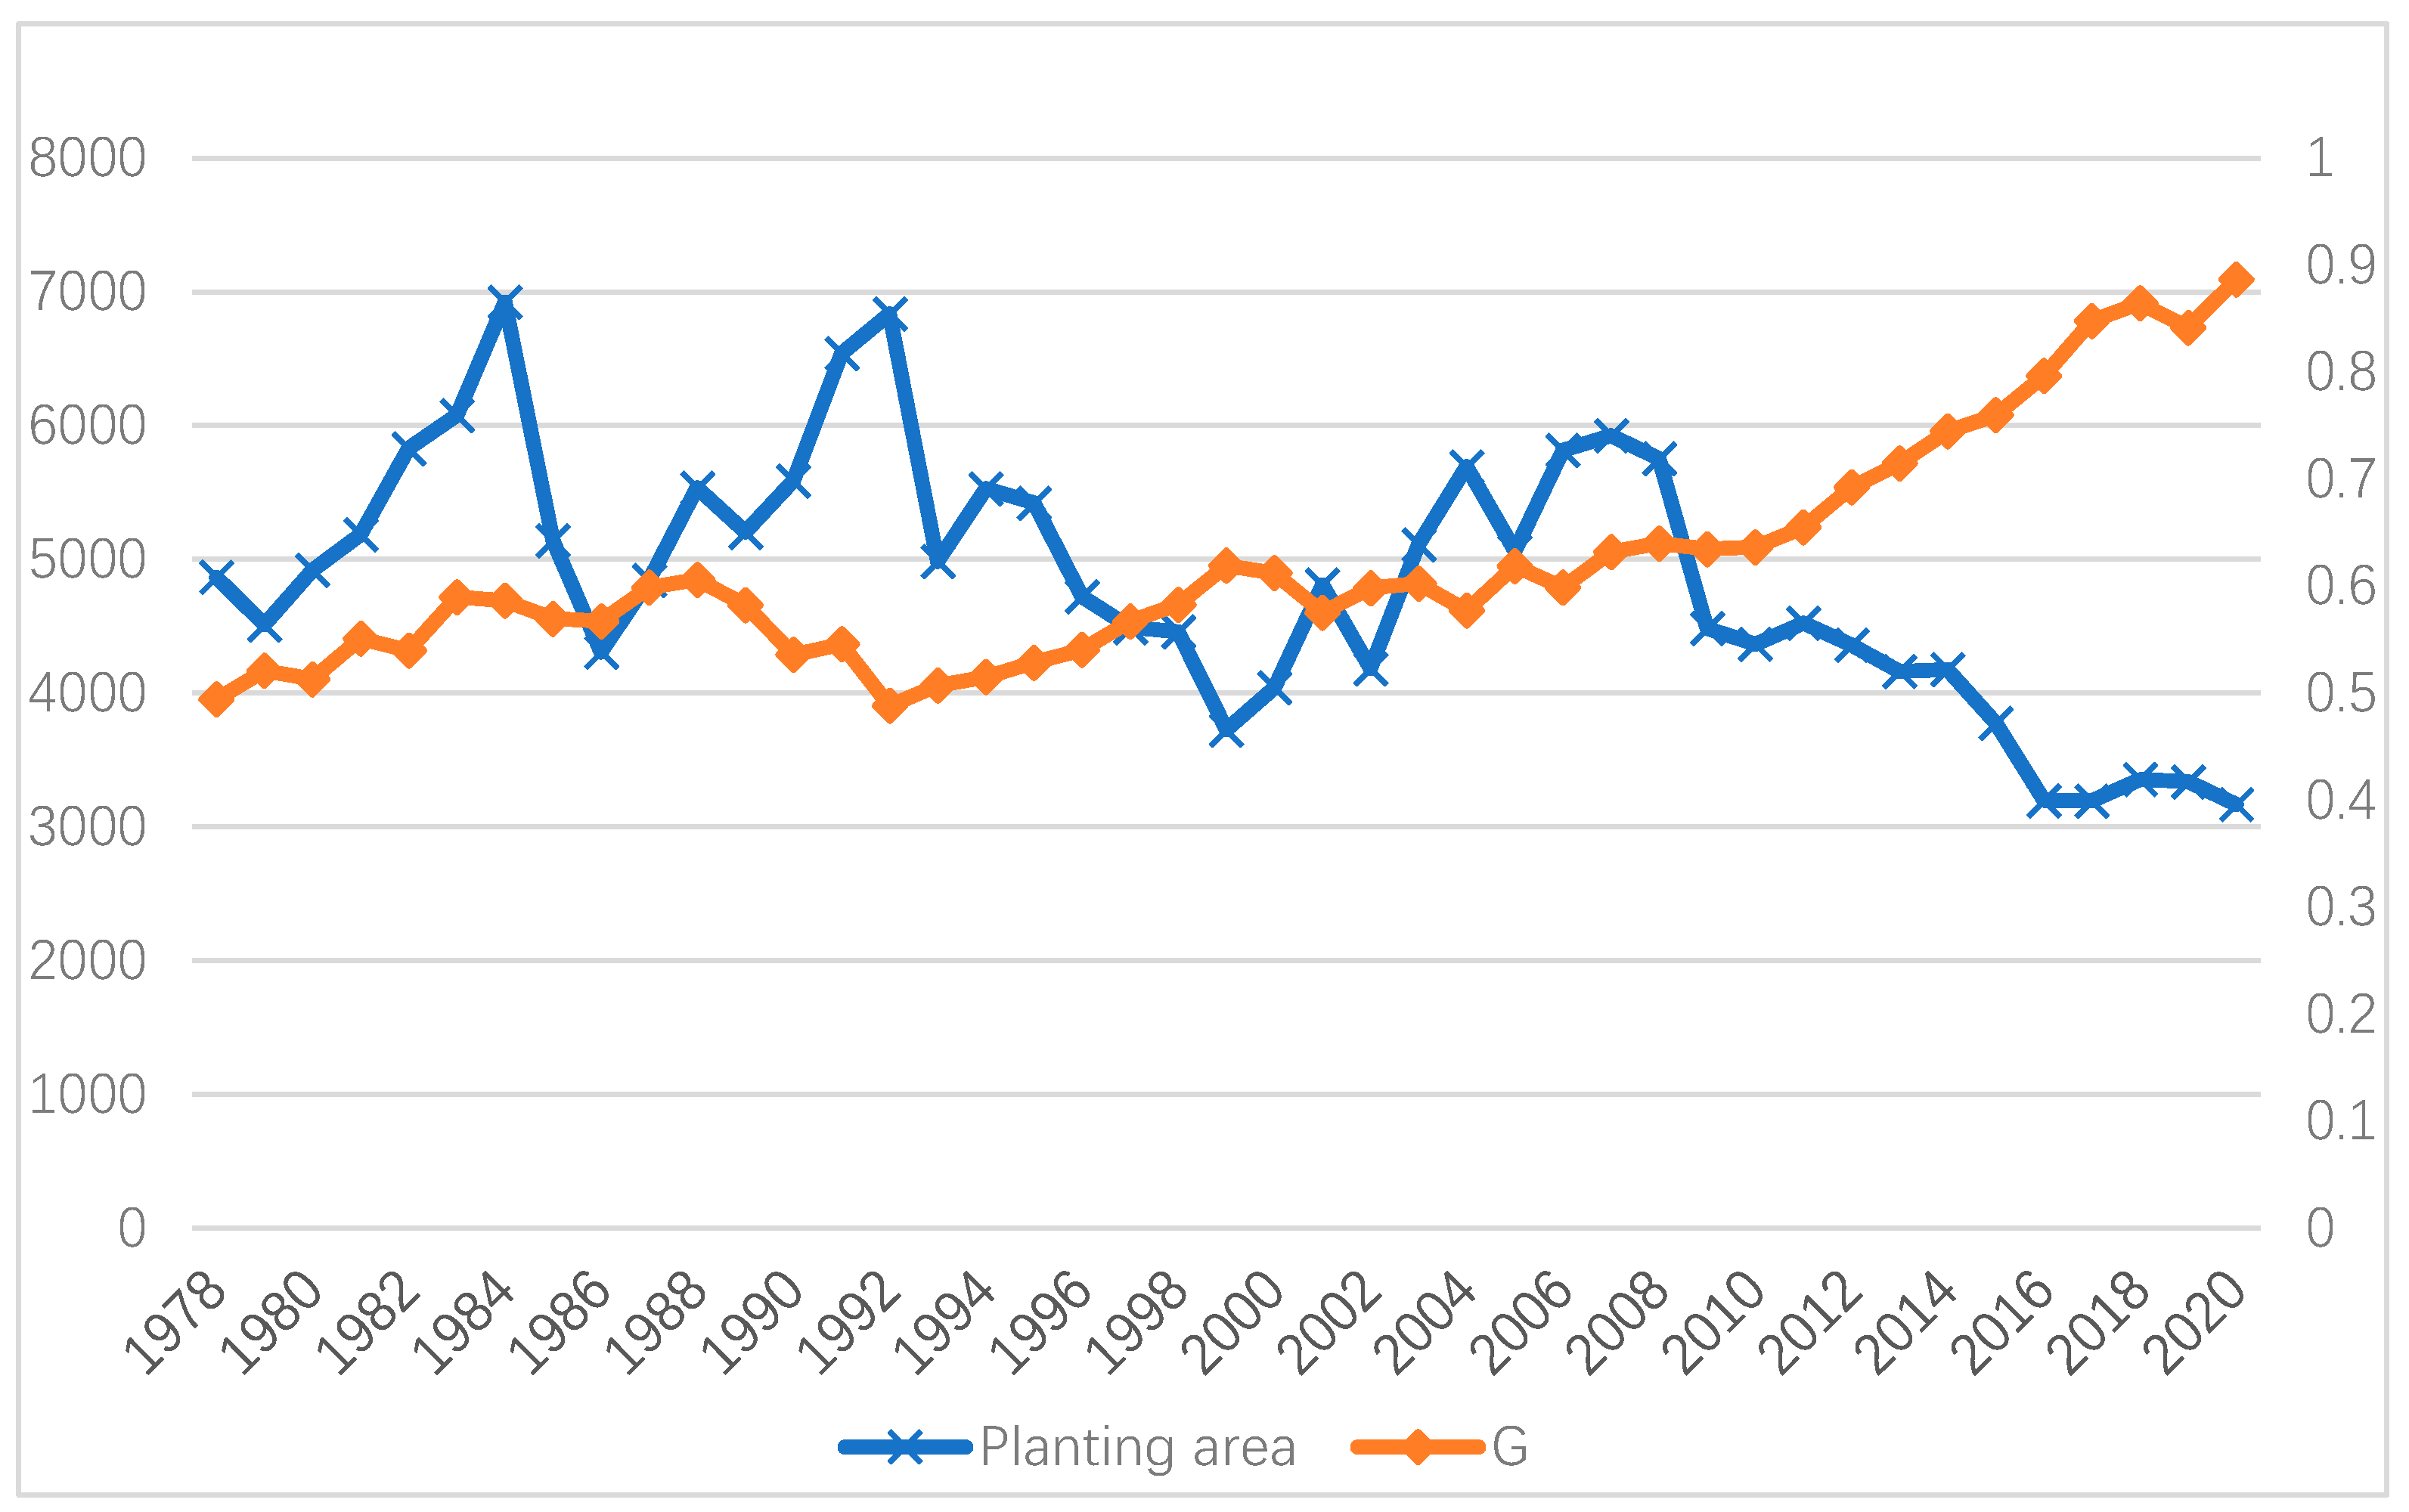
Combining the location Gini coefficient with the trend of cotton planting area changes (Figure 1), the agglomeration level of cotton production from 1978 to 2020 exhibits characteristics of staged development. The Gini coefficient of cotton production has consistently remained above 0.48, surpassing the caution line of 0.4 (where a Gini coefficient of 0.4 indicates a caution line for spatial distribution uniformity). From 1978 to 2005, the location Gini coefficient fluctuated but generally tended to increase. After 2006, the location Gini coefficient of cotton production remained above 0.60, indicating a continuous expansion of regional differences in cotton production and a distinct pattern of regionalization, scaling, and specialization. The rate of increase accelerated from 2009 onwards, reaching 0.89 in 2020. This indicates that cotton production in China continues to agglomerate towards advantaged regions and is still undergoing continuous agglomeration.
Figure 1.
The changing trend of cotton planting area and location Gini coefficient in China.
The development process of cotton production agglomeration can be roughly divided into the following stages:
The first stage is from 1978 to 1988 when the Location Gini coefficient of cotton production fluctuated and increased. This period can be divided into three phases. From 1978 to 1984, since the reform and opening up, significant reforms such as the rural economic system reform and the household contract responsibility system optimization have improved the agricultural production structure. Grain production increased, and the “sell cotton for grain” policy solved the basic food problem for cotton farmers. Additionally, the rapid development of the cotton textile industry led to a significant increase in demand for cotton, creating favorable conditions for cotton production. The cotton planting area was in a growth trend, with the national cotton planting area increasing by 2,411.3 thousand hectares, of which the cotton planting area in the Yellow River Basin provinces increased by 2,020.3 thousand hectares, with the most significant increases in Shandong, Hebei, and Henan. From 1984 to 1986, the cotton textile market became saturated, resulting in high cotton inventories. The country adjusted the cotton purchase price, canceled production preferential policies, and established textile factories to consume cotton inventories. In 1985, the procurement contract system was implemented, and localities canceled or reduced the “cotton award fertilizer” policy, leading to a decrease of 2,617 thousand hectares in the national cotton planting area. From 1986 to 1988, cotton production began to face supply shortages again. The country raised the price of northern cotton, reinstated the cotton award sales policy to stimulate production, and in 1988, the planting area in the main cotton areas of the Yellow River Basin began to recover, increasing by 950.2 thousand hectares compared to 1986, with an increase of 79.6 thousand hectares in the Northwest cotton area and 215.6 thousand hectares in the Yangtze River Basin cotton area. Overall, although there were fluctuations in the planting area, the focus of cotton planting was mainly in the Yellow River Basin.
The second stage, from 1988 to 1992, saw a fluctuating decrease in the Location Gini coefficient of cotton production. The rapid growth of the cotton textile industry in cotton-producing areas led to a tight supply situation for cotton. From 1988 to 1991, the country and various provinces implemented encouragement policies for cotton production. Starting in 1989, cotton prices were raised continuously for three years. As a result, cotton planting areas in various regions increased. The cotton planting area in the Yellow River Basin increased from 3,471.8 thousand hectares to 4,011.2 thousand hectares, a 15.5% increase. The cotton planting area in the Yangtze River Basin increased from 1,677.3 thousand hectares to 2,136 thousand hectares, a 27.3% increase. The cotton planting area in the Northwest cotton area increased from 361 thousand hectares to 655.9 thousand hectares, an 81.7% increase. Due to growth in all regions, the Yangtze River Basin and Northwest cotton areas saw relatively larger increases in area. Looking at the country as a whole, the situation of cotton production was more balanced compared to the previous years when the Yellow River Basin dominated, leading to a reduction in regional disparities and a decrease in agglomeration.
The third stage, from 1992 to 1999, witnessed a steady increase in the Location Gini coefficient of cotton production. In 1992, cotton production was reduced due to a pest outbreak, resulting in severe losses for cotton farmers and a decline in willingness to plant cotton. In 1993, the cotton planting area in the provinces of Hebei, Shandong, and Henan decreased by 1,364.8 thousand hectares, a decrease of 40%. The government responded by repeatedly raising the cotton procurement price, strengthening administrative interventions, and implementing a system where provincial governors were held responsible for cotton production. As a result, the cotton planting area in southern provinces such as Hubei, Jiangxi, and Anhui increased. However, the continuous increase in cotton procurement prices led to domestic cotton prices higher than international market prices, resulting in a large influx of imports and oversupply of domestic cotton in 1995. In 1996, the government made significant policy adjustments, advocating for the restructuring of cotton planting areas. It required Hebei, Shandong, and Henan to reduce cotton planting and increase the cultivation of grains and economic crops, while vigorously promoting cotton planting in Xinjiang. Meanwhile, the rising costs of cotton production, exceeding the cotton procurement price, led to low economic returns for cotton farming, resulting in a decrease in enthusiasm among cotton farmers nationwide except in Xinjiang. In 1999, compared to 1998, the cotton planting area in the Yellow River Basin decreased by 205.4 thousand hectares, and in the Yangtze River Basin, it decreased by 517.9 thousand hectares. 1999 marked the lowest cotton planting area since the beginning of reform and opening up.
The fourth stage, from 1999 to 2009, exhibited significant fluctuations in the Location Gini coefficient of cotton production. In early 1999, a document titled “Notice of the General Office of the State Council on Issues Related to Cotton Work in 1999” required regions to reduce cotton planting areas, adjust planting structures, cultivate other economically beneficial crops, decrease cotton planting areas in the Yangtze and Yellow River basins, and control the rapid development of cotton areas in Xinjiang to alleviate the pressure of oversupply in the cotton market. Additionally, the “Decision on Deepening the Reform of the Cotton Circulation System” issued by the State Council in December 1998 and the “Opinions on Further Deepening the Reform of the Cotton Circulation System” in 2001 thoroughly liberalized cotton prices and markets. In the same year, China joined the WTO, ushering in a new, more open international market for the cotton-related industry. The demand for cotton by cotton spinning enterprises also surged dramatically, accompanied by increased market uncertainty. The fluctuations in cotton production and prices became more frequent. Farmers found it challenging to adapt to the market’s price mechanism for regulation, resulting in significant fluctuations in cotton procurement prices, planting areas, and yields, which persisted until around 2009.
The fifth stage, from 2009 to 2020, witnessed a rapid increase in the Location Gini coefficient of cotton production. In 2011, to address market fluctuations, protect the interests of cotton farmers and textile enterprises, and promote the stable development of cotton production, the government implemented temporary cotton storage policies. During this period, China’s cotton inventory exceeded 60% of the global cotton inventory, imposing heavy financial pressure on the government and distorting the normal market operation of the cotton industry. The rise in cotton prices led to excessively high costs for enterprises and decreased competitiveness. Consequently, in 2014, the government decided to implement a target price subsidy policy nationwide, focusing on pilot projects in Xinjiang to encourage the expansion of cotton planting areas and related industrial investment and development. An information platform for cotton was established, and cotton farmers were uniformly subsidized based on actual deliveries, which directly enhanced the farmers’ risk-bearing capacity and safeguarded their basic interests, and promoted the marketization and informatization of the cotton industry. This policy played a beneficial role in the development of the industry and the improvement of enterprise competitiveness. Since the implementation of the cotton target price policy, domestic cotton production has gradually shifted to Xinjiang while decreasing in inland regions. During this period, cotton production in Xinjiang grew rapidly, while production in the Yellow River and Yangtze River basins declined. Cotton production nationwide became increasingly dispersed and gradually concentrated in Xinjiang, leading to a continuous increase in the Gini coefficient.
3.1.2. The regional gradient pattern of cotton production agglomeration is evident and dynamically changing
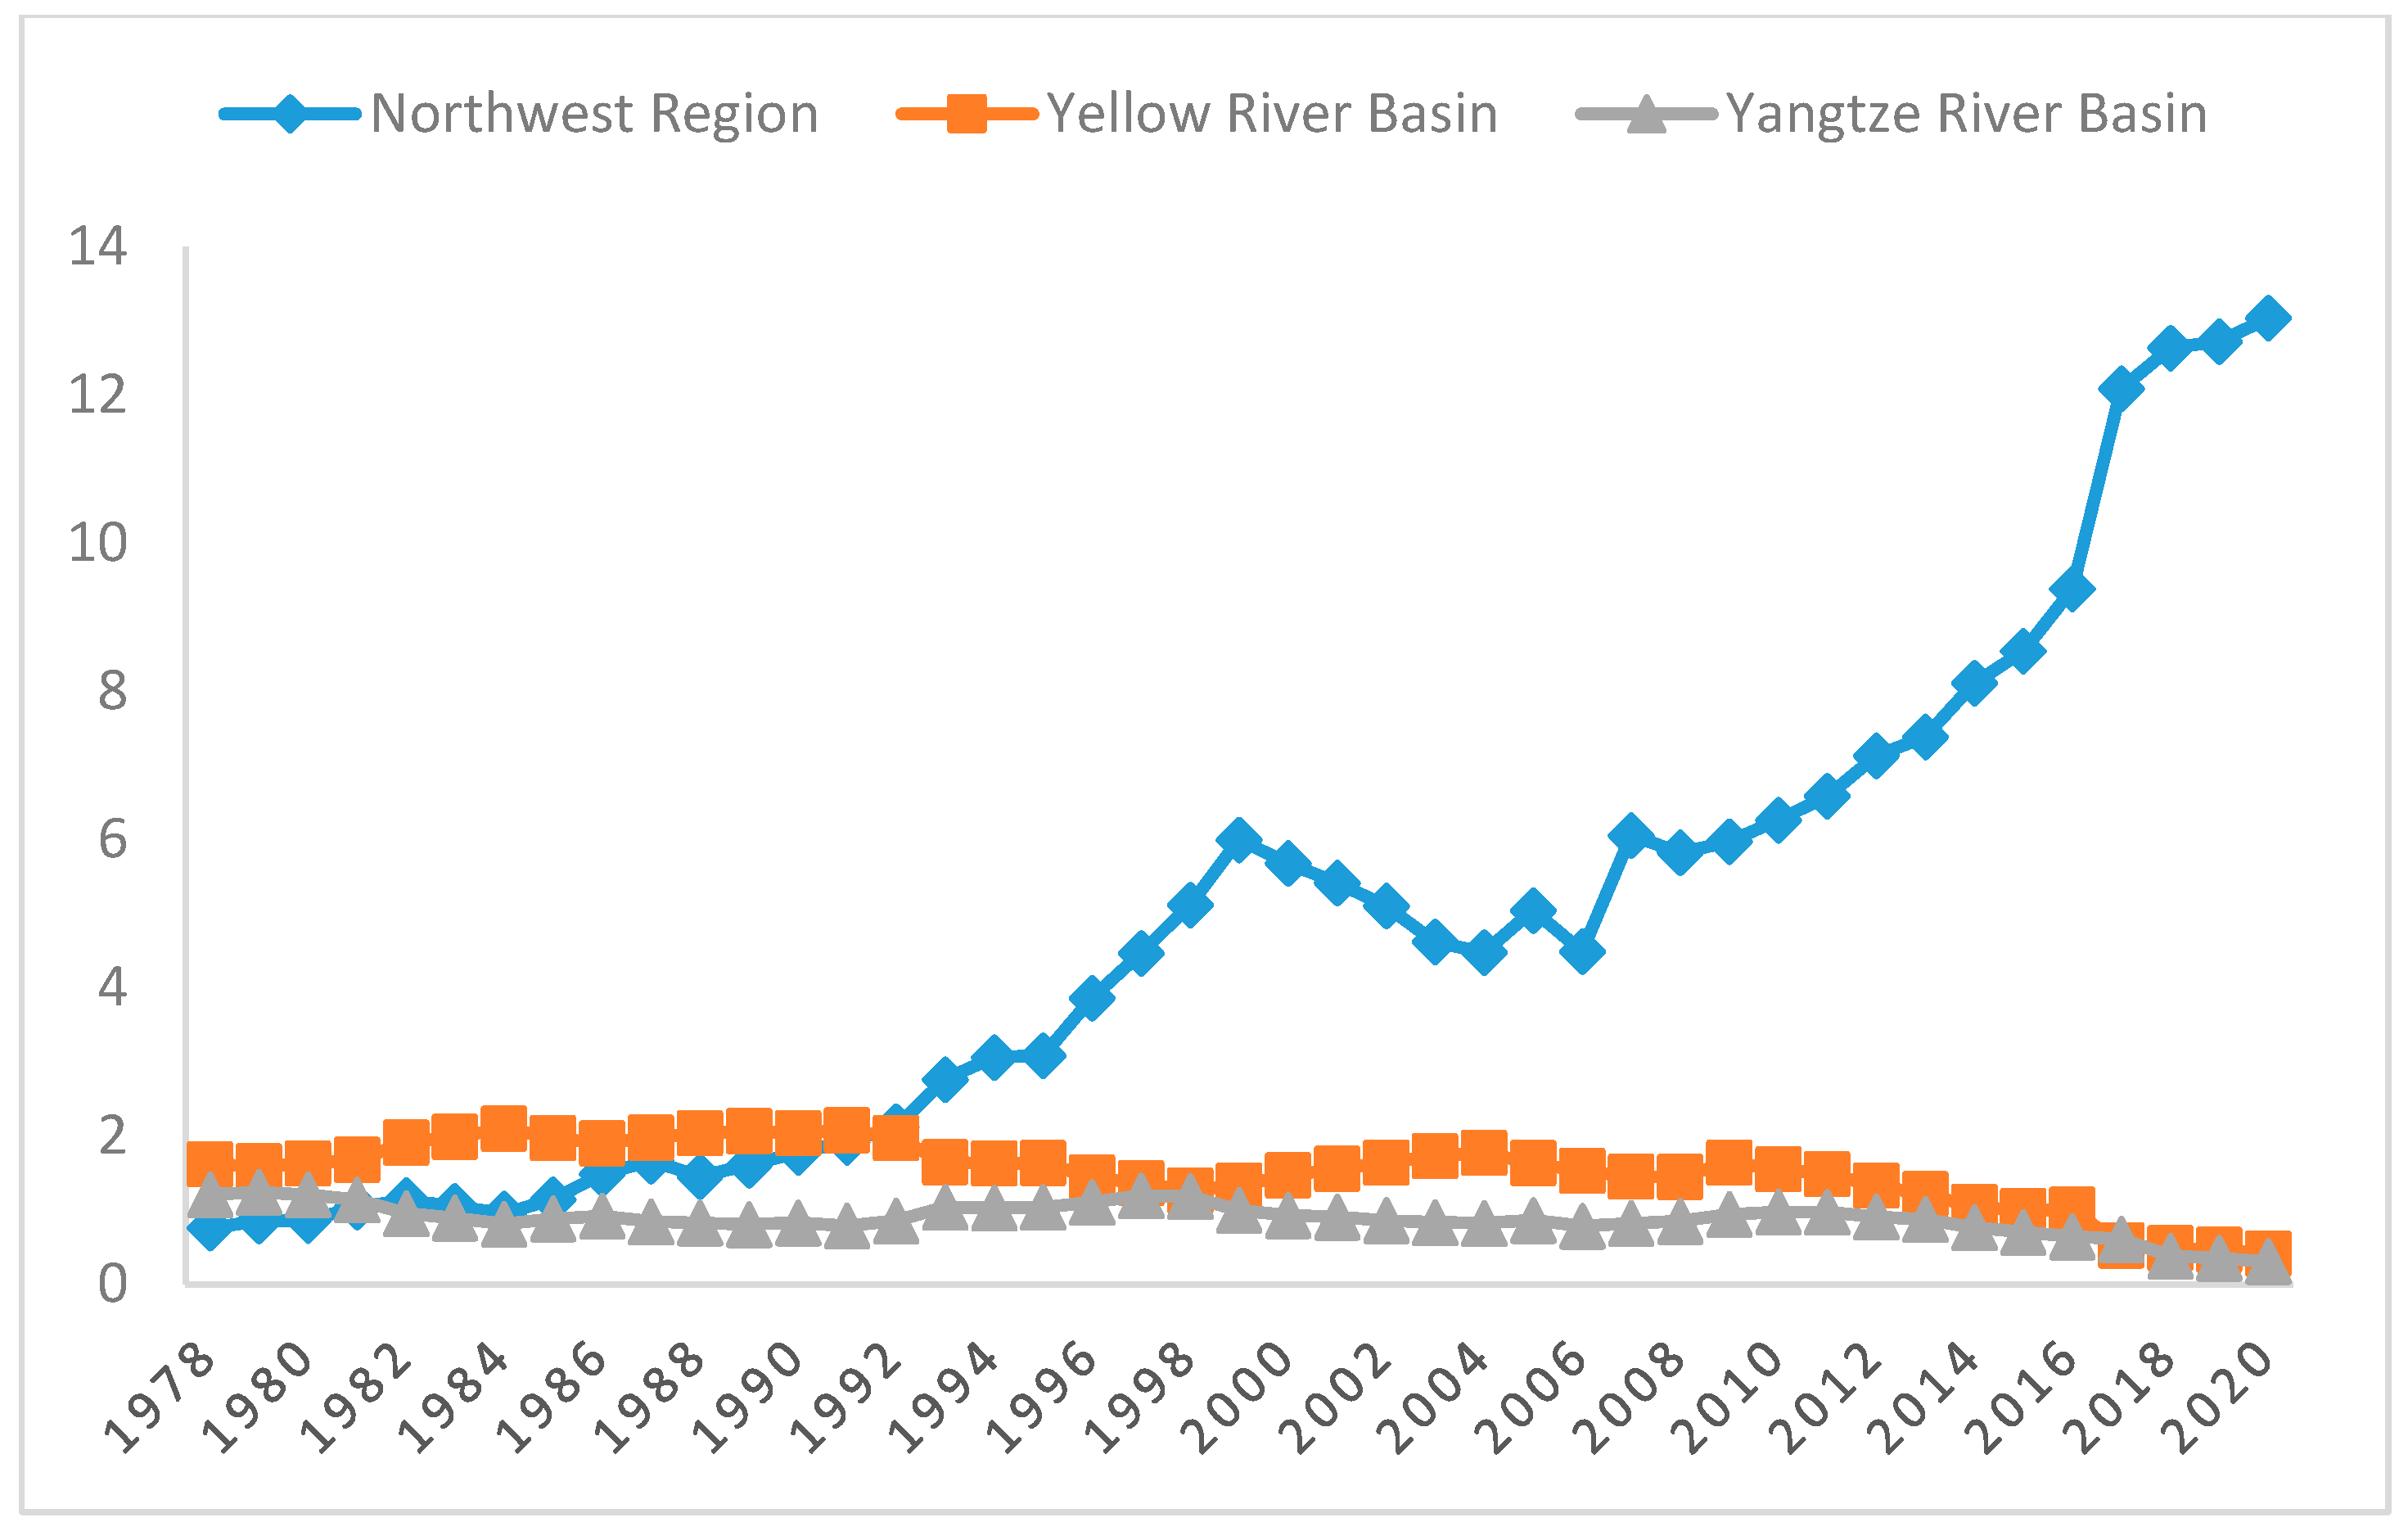
Combining with Figure 2, from 1978 to 1981, the production agglomeration level in the Yellow River Basin cotton area was the highest, followed by the Yangtze River Basin cotton area. Both regions had LQ values greater than 1, indicating agglomeration levels exceeding the national average. In contrast, the production level in the Northwest cotton area was the lowest, with an LQ value less than 1, below the national average. From 1981 to 1992, the production agglomeration level in the Yellow River Basin cotton area continued to increase and remained the highest. The average LQ value during this period was 2.003, exceeding the average LQ value of 1.629 from 1978 to 1981. The agglomeration level in the Northwest cotton area surpassed that of the Yangtze River Basin, with an average LQ value of 1.482, exceeding the national average. However, the agglomeration level in the Yangtze River Basin cotton area declined and fell below the national average. From 1992 to 2020, the production agglomeration level in the Northwest cotton area surpassed that of the Yellow River Basin cotton area and rose rapidly, from 2.125 in 1992 to 13.035 in 2020. The Yellow River Basin cotton area ranked second, with the agglomeration level starting to fall below the national average around 2014. The Yangtze River Basin cotton area had the lowest agglomeration level, and the trend of change in agglomeration level in these two regions was relatively stable compared to the Northwest region.
Figure 2.
The trend of LQ values for cotton production in the three major cotton regions.
3.1.3. The disparity in cotton production agglomeration levels among the main cotton-producing provinces is evident, and this gap is gradually widening
From the calculation results of LQ in each main cotton-producing province, it can be observed that cotton production in the Northwest cotton region is mainly dominated by Xinjiang, where the agglomeration of cotton production far exceeds the average level, while the agglomeration level in Gansu is very low. In the Yellow River Basin cotton region, the agglomeration levels of Hebei, Shandong, and Henan provinces are relatively high; the agglomeration levels of Shanxi and Shaanxi were initially higher than the average level in the early period of the study, but gradually declined after 1984; the agglomeration level in Tianjin rapidly increased after entering the 21st century, reaching a peak of 4.800 in 2006; Liaoning had the lowest agglomeration level, consistently below the average level, and gradually declined in the 21st century, reaching 0 in 2020. In the Yangtze River Basin cotton region, the agglomeration levels of Jiangsu, Anhui, and Hubei provinces are relatively high; while those of Zhejiang, Jiangxi, Hunan, and Sichuan are below the average level, with Sichuan having the lowest agglomeration level.

Table 1.
The calculated results of cotton production agglomeration levels in provinces.
| 1978 | 1990 | 2000 | 2010 | 2020 | |
| Northwest Region | |||||
| Xinjiang | 1.533 | 3.877 | 11.544 | 11.148 | 21.056 |
| Gansu | 0.094 | 0.043 | 0.359 | 0.436 | 0.223 |
| Yellow River Basin | |||||
| Tianjin | 0.833 | 0.825 | 1.093 | 4.097 | 0.983 |
| Hebei | 1.898 | 2.752 | 1.317 | 2.423 | 1.236 |
| Shanxi | 1.669 | 0.861 | 0.412 | 0.567 | 0.016 |
| Liaoning | 0.639 | 0.140 | 0.079 | 0.004 | 0.000 |
| Shandong | 1.802 | 3.438 | 1.973 | 2.573 | 0.694 |
| Henan | 1.722 | 1.838 | 2.294 | 1.191 | 0.058 |
| Shaanxi | 1.482 | 0.614 | 0.256 | 0.442 | 0.009 |
| Yangtze River Basin | |||||
| Jiangsu | 2.121 | 1.839 | 1.437 | 1.123 | 0.059 |
| Zhejiang | 0.562 | 0.416 | 0.289 | 0.304 | 0.126 |
| Anhui | 1.258 | 0.936 | 1.325 | 1.382 | 0.307 |
| Jiangxi | 0.618 | 0.324 | 0.472 | 0.531 | 0.328 |
| Hubei | 2.307 | 1.644 | 1.622 | 2.180 | 0.860 |
| Hunan | 0.668 | 0.396 | 0.706 | 0.774 | 0.374 |
| Sichuan | 0.705 | 0.264 | 0.282 | 0.062 | 0.012 |
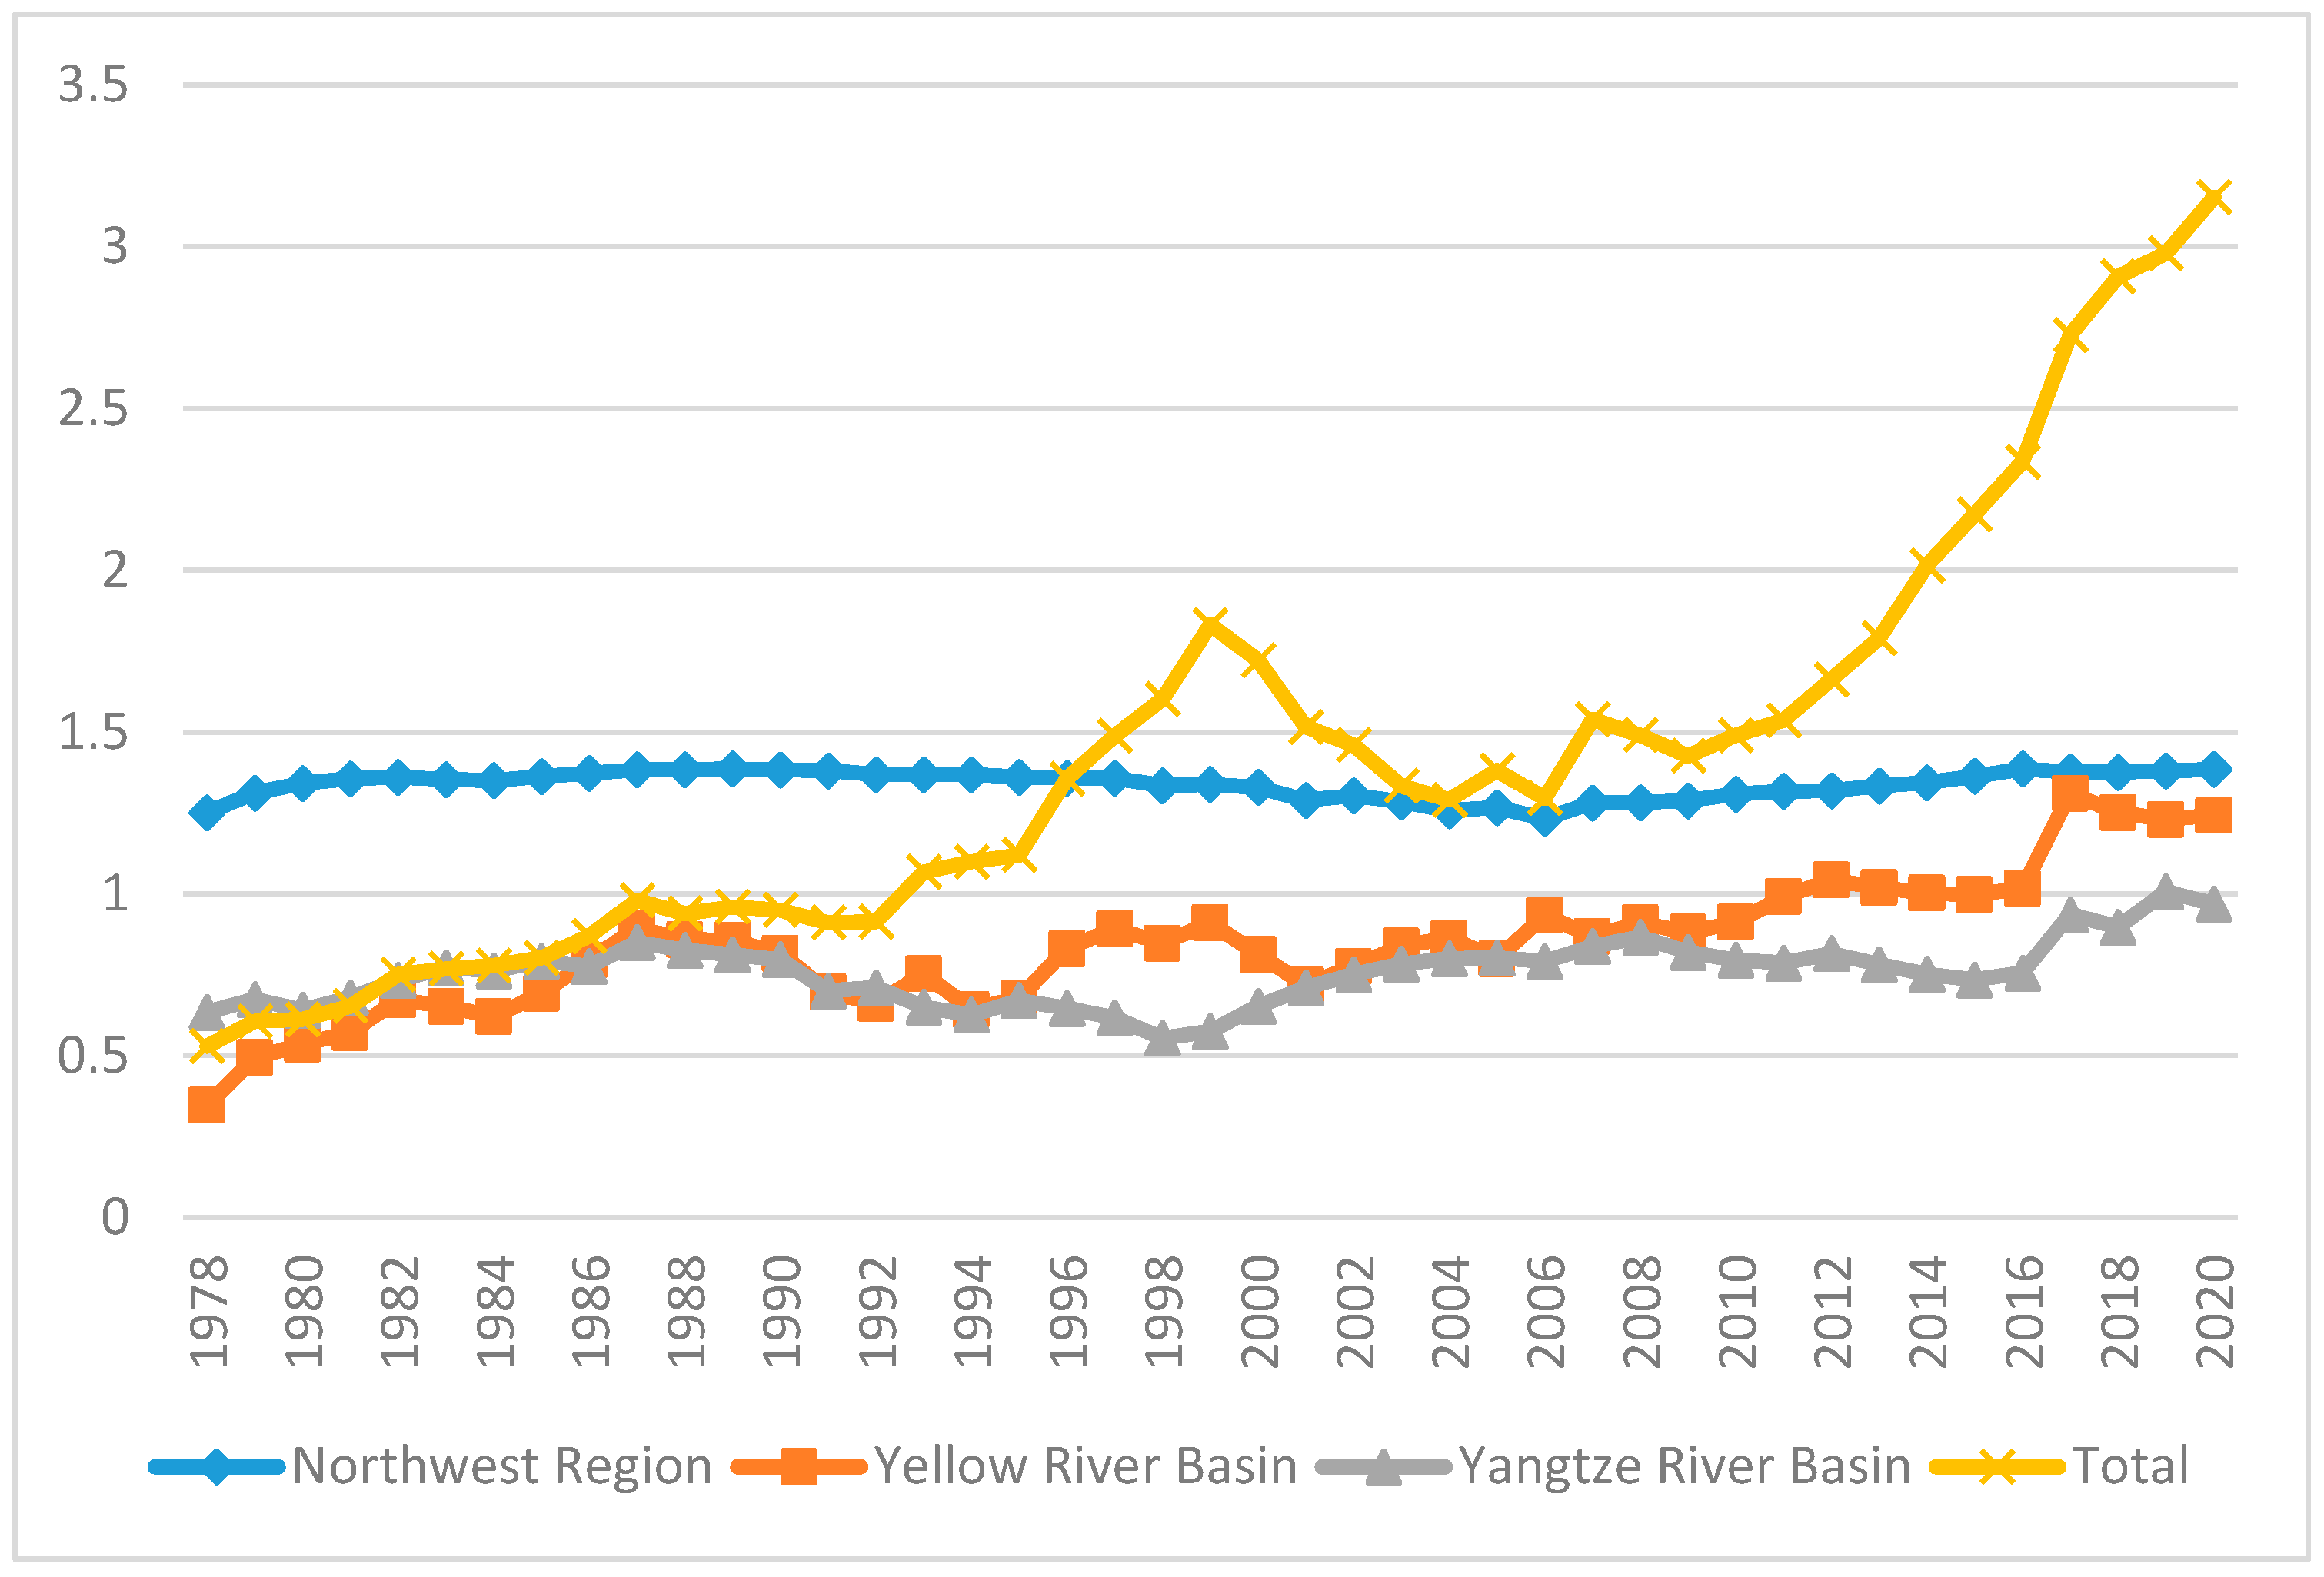
Further analysis of the regional differences and changes in cotton production agglomeration in China was conducted through the coefficient of variation of Location Quotient, and the calculation results are shown in Figure 3. Nationally, the coefficient of variation of cotton production agglomeration level gradually increased from 1978 to 1999, decreased gradually from 1999 to 2004, fluctuated from 2004 to 2009, and then rapidly increased from 2009 to 2020. Overall, the regional differences in cotton production agglomeration level have widened. Regionally, in the Yellow River Basin cotton-producing region, the coefficient of variation increased from 0.347 to 1.242, indicating an overall widening of the disparity in cotton production level in this region. The coefficient of variation in the Yangtze River Basin cotton-producing region increased from 0.635 to 0.969, with a relatively small change range, showing overall stability compared to the Yellow River Basin. The coefficient of variation in the Northwest region was generally higher than the other two regions, increasing from 1.251 to 1.385, with a relatively small range of variation and a stable trend.
Figure 3.
The trend of the coefficient of variation in China’s cotton production agglomeration.
3.2. Spatial autocorrelation analysis
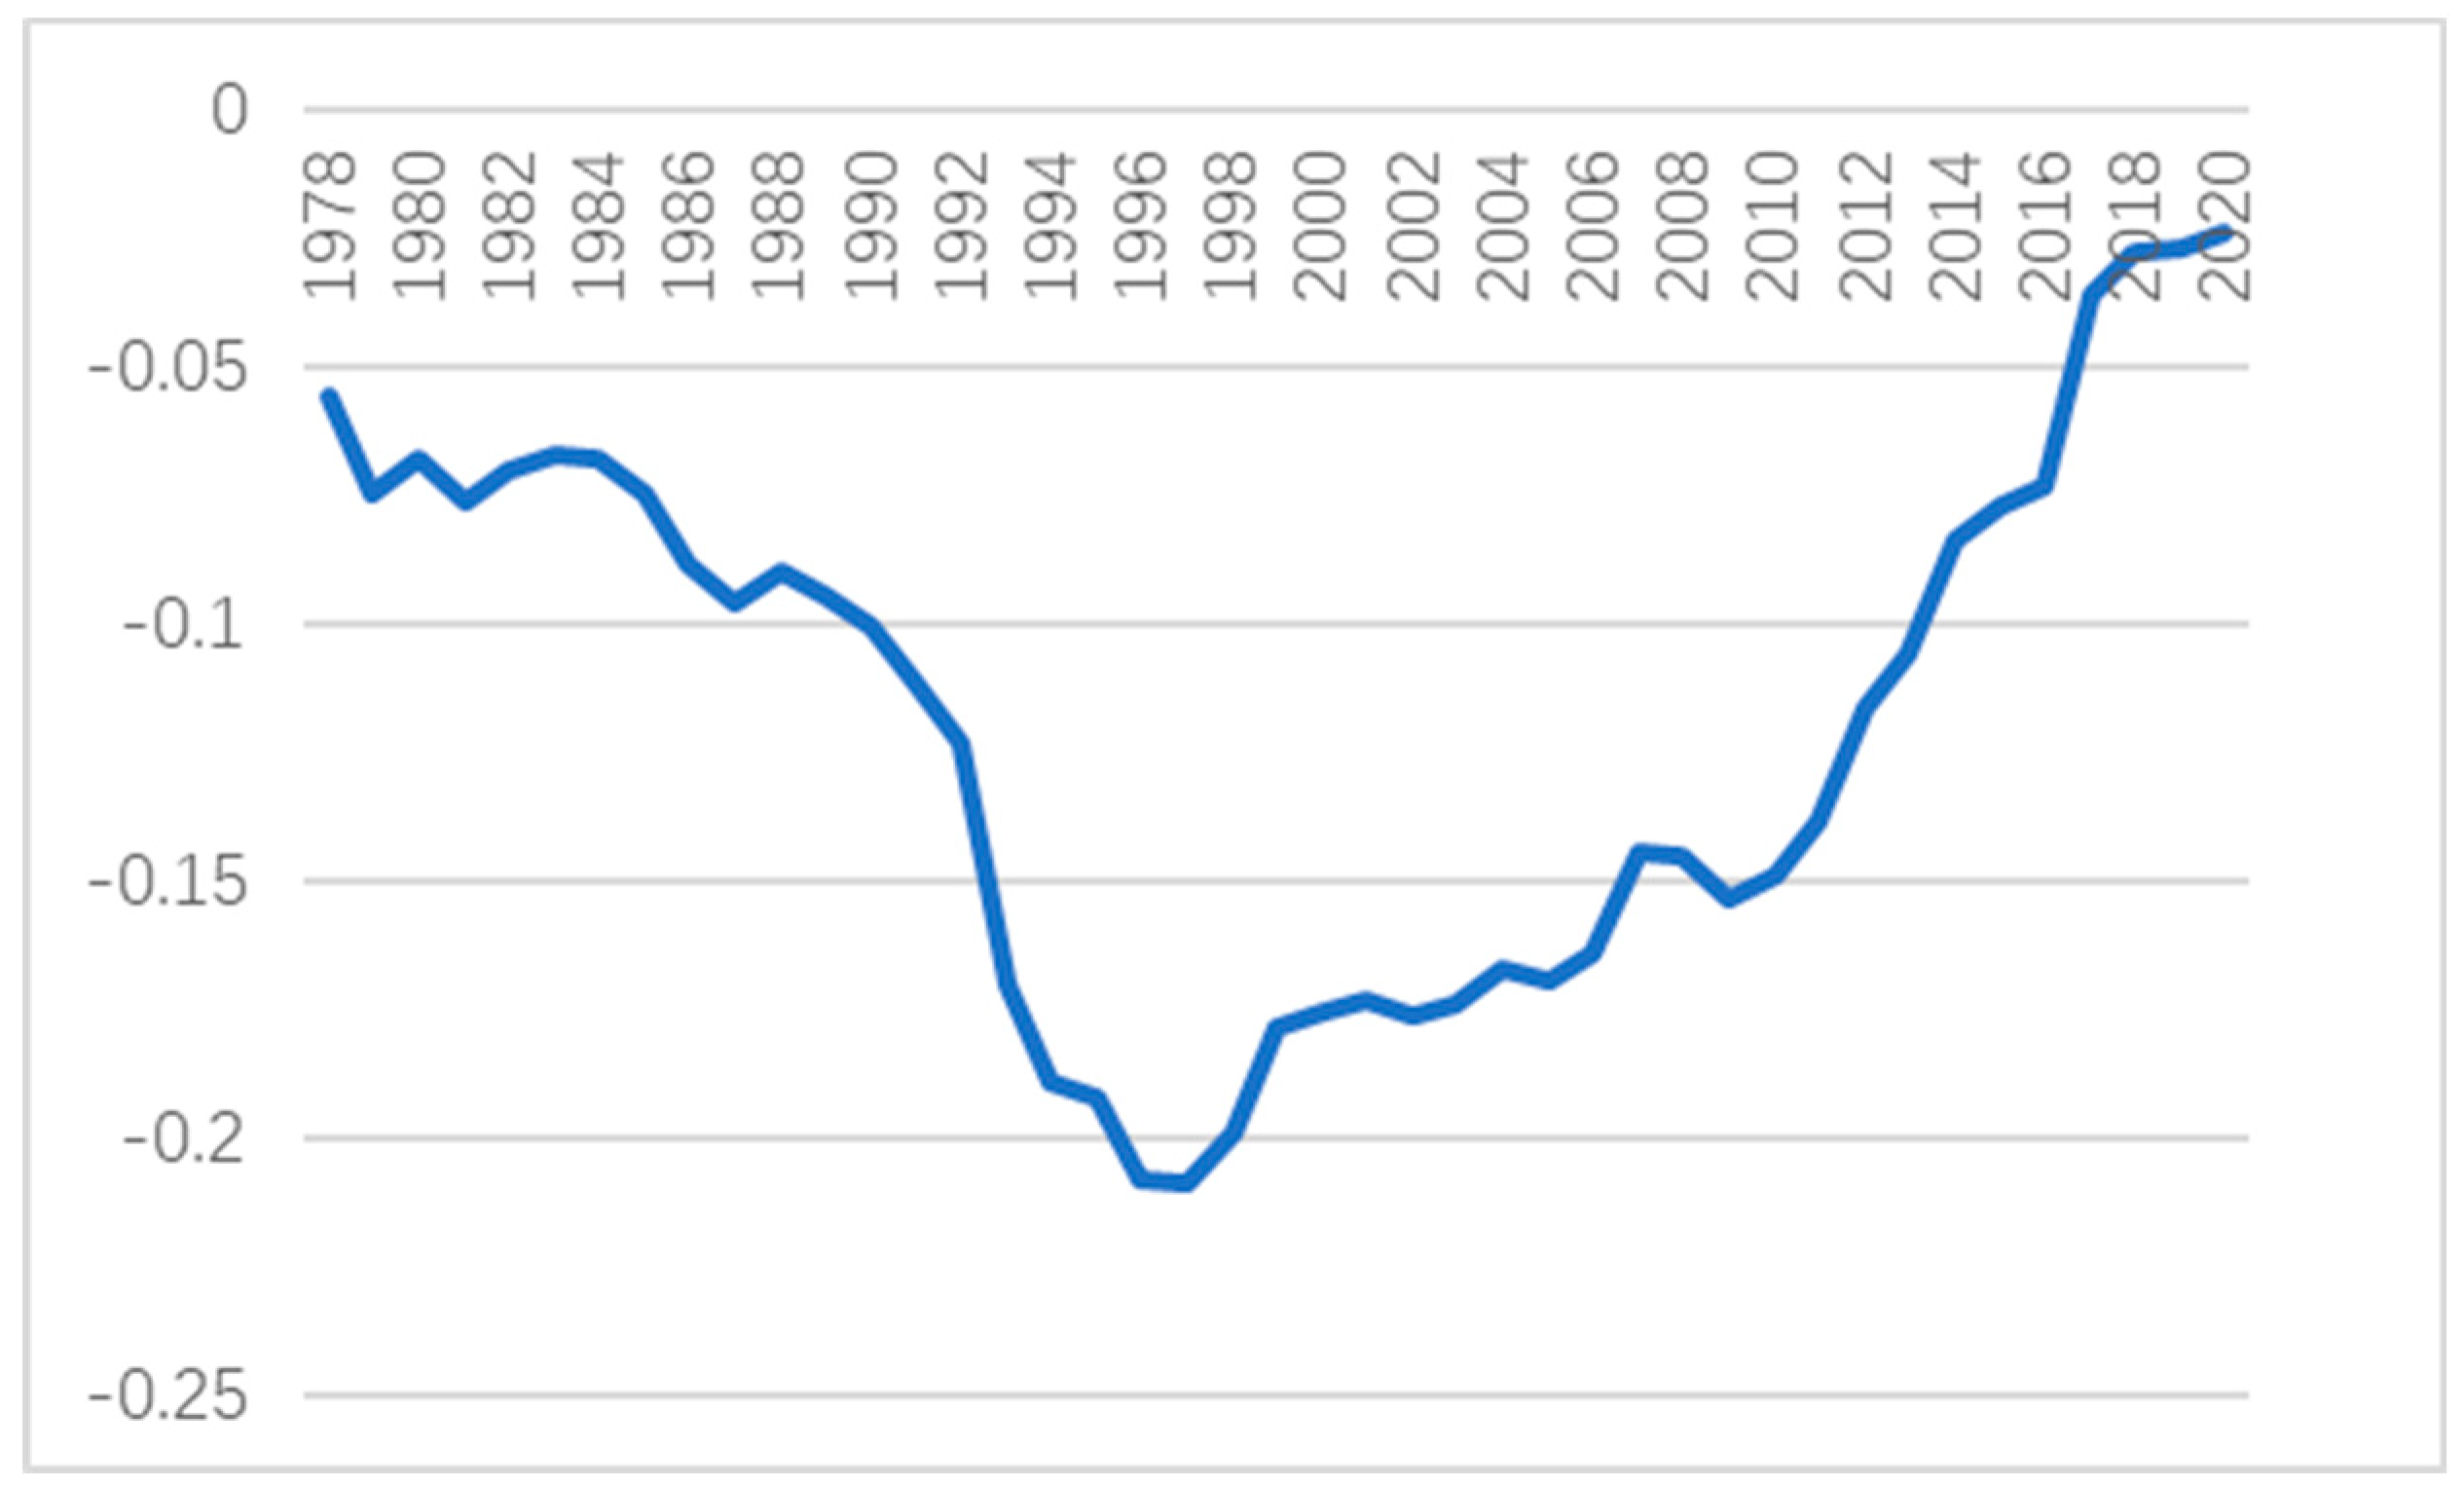
Based on the cotton production scale data from 16 major cotton-producing provinces, the global Moran’s I index of cotton production from 1978 to 2020 was calculated (Figure 4), showing a trend of “U” shape. The spatial correlation of cotton production scale exhibited a changing trend from strong to weak and then to strong again, indicating a transition from relative agglomeration to dispersion and then gradual agglomeration of cotton production. From 1978 to 1997, the spatial correlation of cotton production decreased, and spatial disparities increased. This might have been influenced by policies such as the implementation of a unified purchase and sales system, contract purchase system, and continuous supportive policies for cotton production by the government, weakening the demand for inter-provincial communication and cooperation and increasing the differences in specific policies among provinces. From 1997 to 2020, the spatial correlation of cotton production gradually increased, and spatial disparities decreased. This was because the cotton production scale in the Yellow River and Yangtze River basins continued to decrease, while cotton production in Xinjiang developed rapidly, showing a significant agglomeration feature during this period. It is worth noting that the global Moran’s I index was negative from 1978 to 2020, ranging from -0.25 to 0, indicating negative spatial correlation in production scale. The global Moran’s I index did not pass the test from 1978 to 1992 and from 2012 to 2016. However, this does not mean that there is no significant spatial correlation in cotton production scale. Further observation of local Moran’s I index revealed significant spatial correlation between some provinces, indicating that the insignificance of the global Moran’s I index may be due to the offsetting of positive and negative spatial correlations or the existence of spatial correlation only in certain regions.
Figure 4.
The trend of global Moran’s I index of cotton production scale.
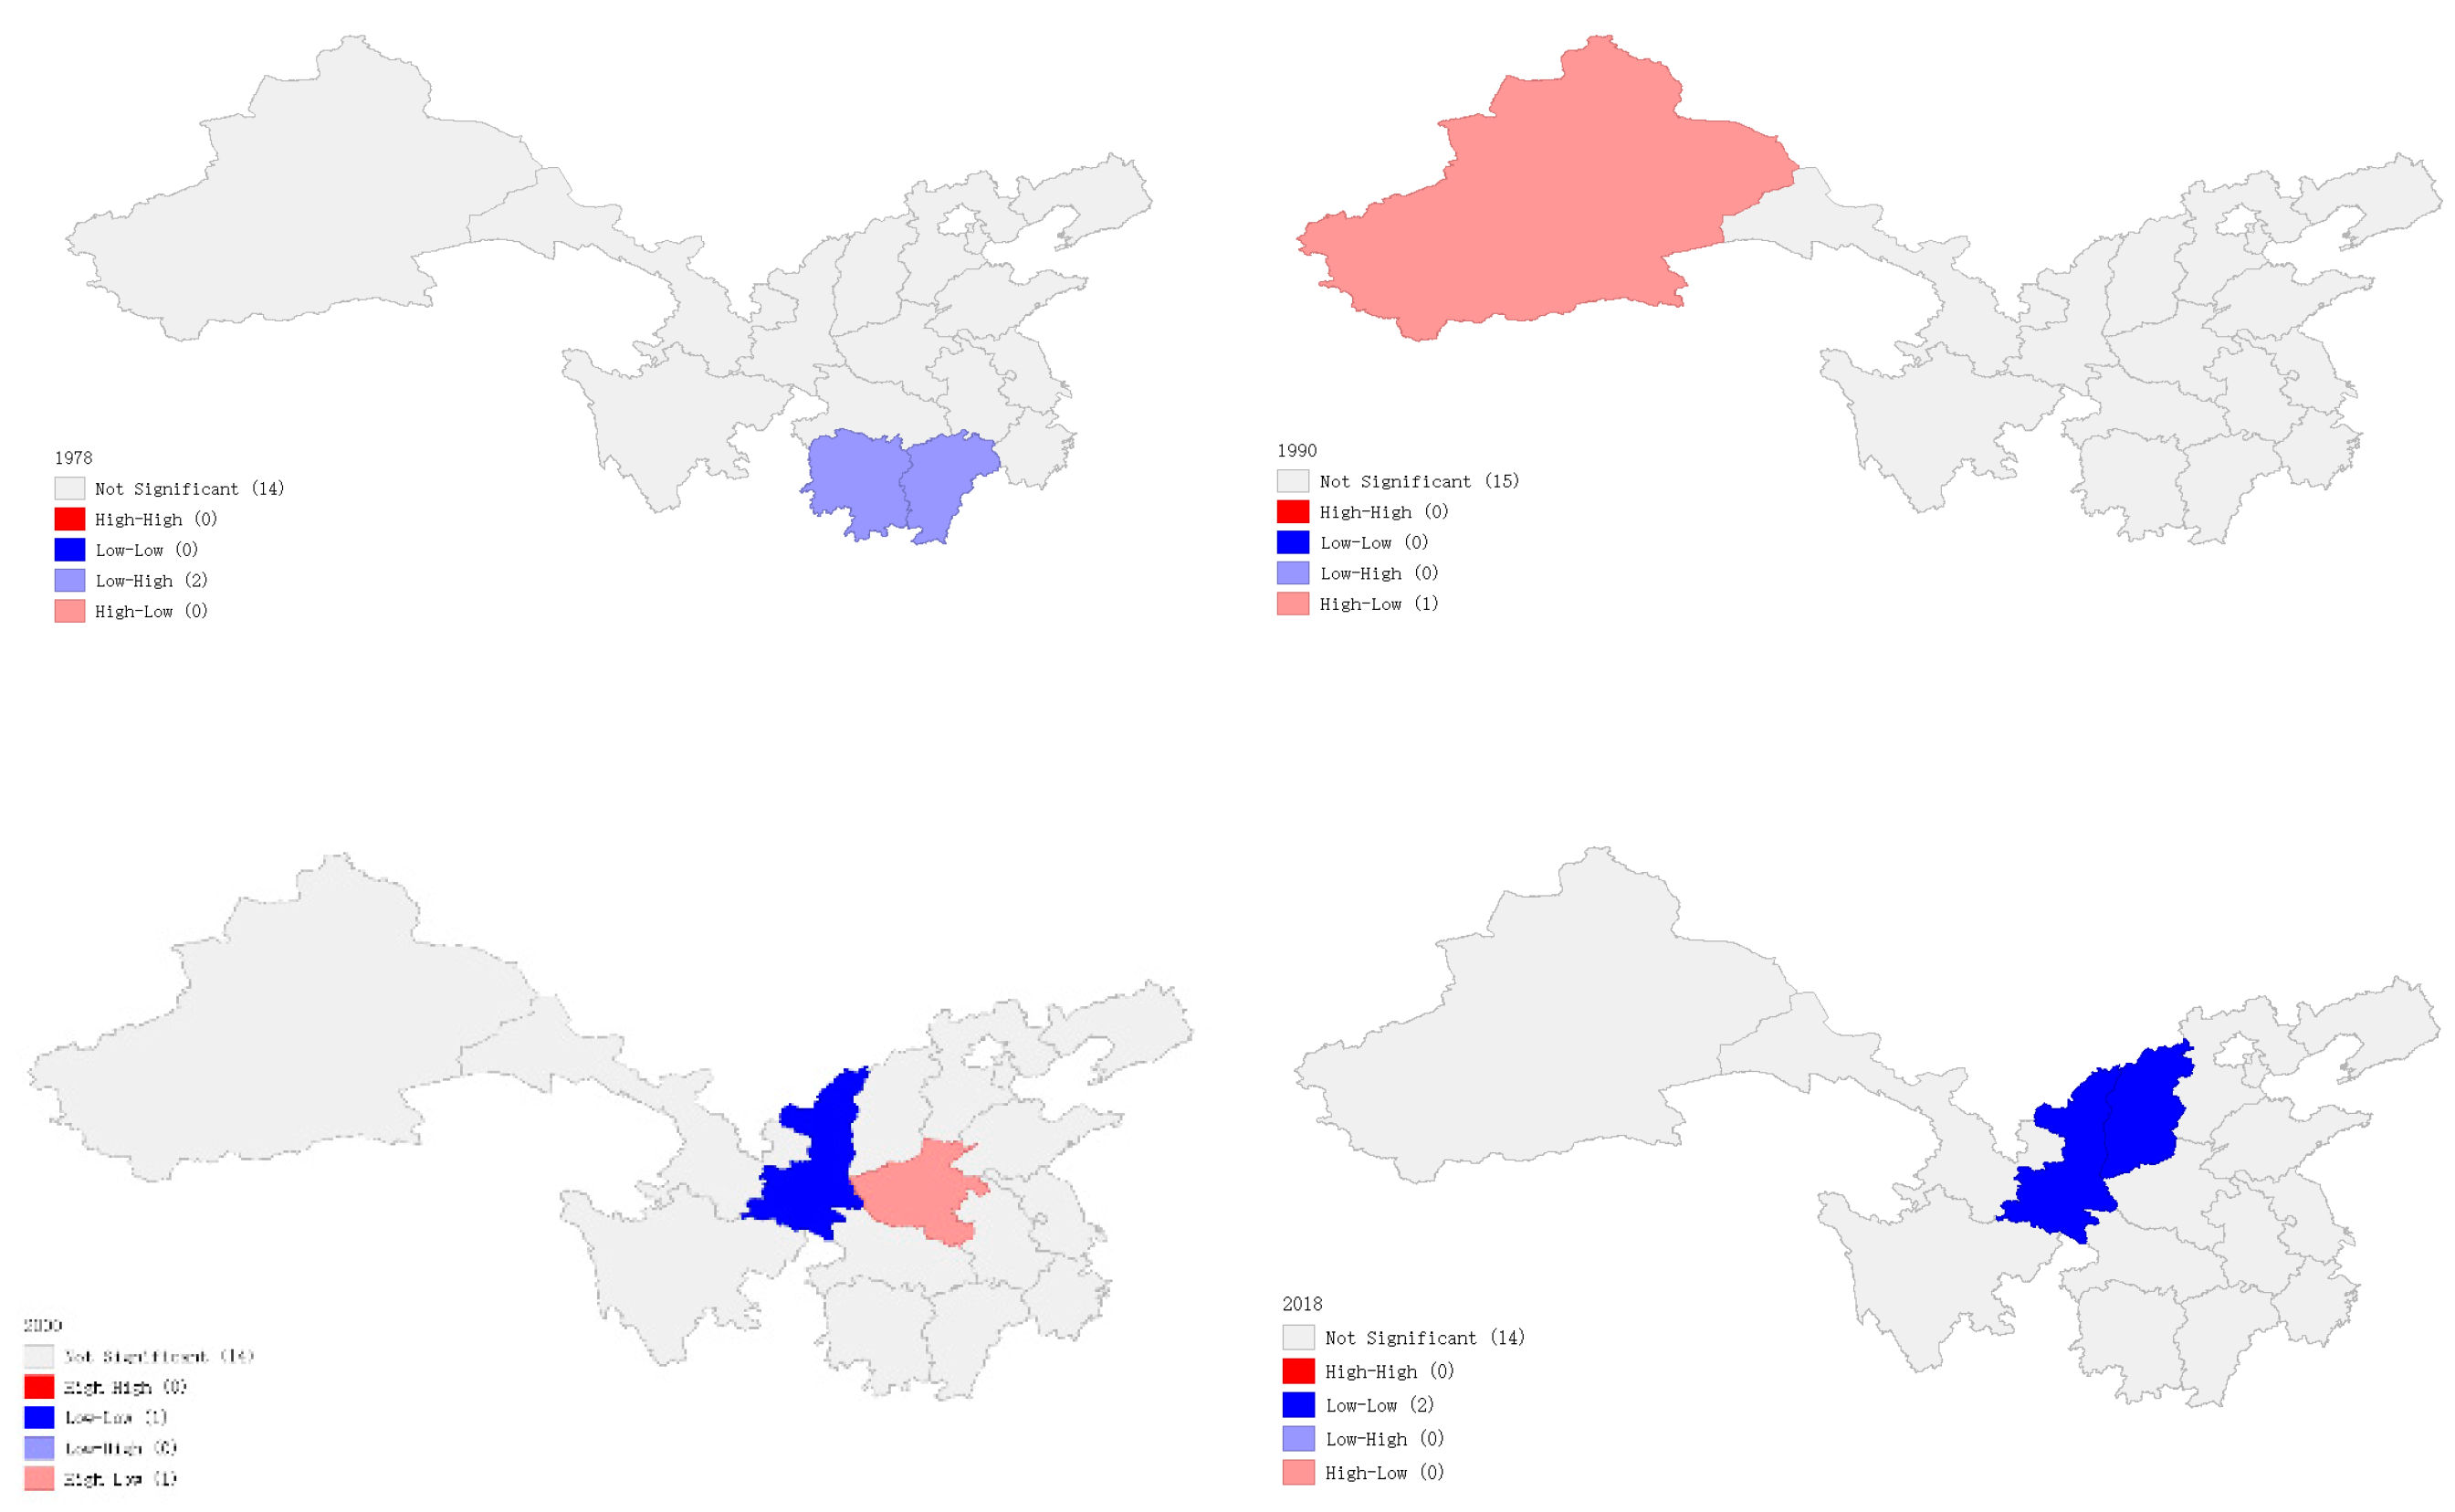
The local Moran’s I index can observe whether there is spatial correlation between provinces, the degree of spatial clustering, and the correlation with surrounding areas. Figure 5 shows the spatial LISA maps of 16 major cotton-producing provinces in China in 1978, 1990, 2000, and 2018. Overall, the agglomeration pattern of cotton production scale in China initially showed a distribution of low-high and high-low clustering. With time, areas originally in these two types of clusters shifted to low-low clustering, indicating a convergence at a low level. Specifically, in 1978, Hunan and Jiangxi showed significant low-high clustering, while in 1990, Xinjiang showed significant high-low clustering, indicating significant differences in cotton production scale between provinces. In 2000, Henan showed significant high-low clustering, while Shaanxi began to exhibit low-low clustering, indicating a significant decrease in differences in cotton production scale at that time. By 2018, Shaanxi and Shanxi both exhibited low-low clustering patterns.
Figure 5.
The spatial LISA maps of cotton production scale.
3.3. Empirical analysis of influencing factors
3.3.1. Theoretical analysis and variable selection
- Theoretical analysis
Cotton involves both the primary and secondary industries, and its production agglomeration is influenced by various factors.
Firstly, agricultural resources. The delineation of agricultural locations in location theory is primarily influenced by land conditions. Cotton production is highly dependent on land. Competition for land resources between cotton planting and other crops such as grains and cash crops lead to fluctuations in planting areas. Cotton is a labor-intensive crop, and the abundance or scarcity of labor affects the regional layout and spatial clustering of cotton production.
Secondly, infrastructure. According to location theory and new economic geography theory, transportation costs are a key factor affecting industrial clustering. Cotton, although lightweight, has a large volume. Additionally, cotton is white and fluffy, requiring special packaging during transportation to prevent contamination and compression. Moreover, cotton is highly flammable, necessitating multiple layers of protection and continuous monitoring during transportation, resulting in higher transportation costs. Even if a region has good resource advantages, if transportation convenience is low, it cannot translate into a competitive advantage [24].
Thirdly, technological progress. According to the theory of Marshallian externalities, clustering in agricultural production facilitates the dissemination and promotion of technology. The innovation and promotion of agricultural technology gradually apply various technologies to cotton production, including breeding, planting, cultivation, fertilization, management, and harvesting, which helps reduce production costs, improve field management efficiency and level, ultimately increasing yields, and thereby increasing profits. The dissemination and promotion of technology bring positive externalities to agricultural production, thereby promoting the formation of clustering.
Fourthly, policies. As a developing country, China’s research on agglomeration needs to consider special institutional factors, especially for crops like cotton that involve both the primary and secondary industries. Based on the theory of new institutional economics, economic and social development in a region is inseparable from institutional innovation and change. Policy practices can promote institutional changes [25]. Policies play a crucial role in promoting cotton production agglomeration. In 2011, to deal with cotton price fluctuations, stabilize the domestic cotton market, protect the interests of cotton farmers and textile enterprises, and promote the stable development of cotton production, the country implemented temporary cotton storage policies nationwide, which was conducive to stabilizing or promoting cotton production clustering. In 2014, the country decided to implement target price subsidy policies nationwide, encouraging the expansion of cotton planting areas and related industry investment and development, establishing cotton information platforms, and providing unified subsidies to cotton farmers based on actual deliveries, directly enhancing the risk-bearing capacity of cotton farmers, safeguarding their basic interests, and promoting the marketization and informatization of cotton production, which is beneficial to the development of the industry and the improvement of enterprise competitiveness.
Fifthly, substitute industrial products. China’s textile industry has developed rapidly, and cotton alone cannot meet the demand for fiber raw materials. Therefore, there are synthetic fibers with small production footprints, less labor usage, high product strength, and adequate supply. These synthetic fibers compete with and substitute cotton to some extent. The emergence of chemical fibers is to compensate for the shortage of natural fibers, and its price advantage maintains its strong substitutability for cotton, leading to a reduction in cotton production.
Lastly, foreign trade: Foreign trade has significant effects on the geographical development of industries in a region or country. After China’s accession to the WTO in 2001, various industries transitioned from a relatively closed state to a completely different open market environment. This directly affected changes in the scale and structure of China’s agricultural trade, with labor-intensive agricultural products maintaining a growth advantage in exports [26]. This will cause adjustments in the planting structure, attract related industries to cluster, and change the layout of national production of a certain agricultural product. Cotton production and related industries are also affected by foreign trade, concentrating in cotton-advantaged main producing areas to occupy a place in the international market with better quality raw cotton.
- 2.
- Variable Selection
In the empirical analysis of influencing factors, the explained variable is the cotton production scale index. The selection of explanatory variables is mainly based on the theoretical analysis mentioned above, while also drawing on existing studies by scholars and the availability of data. Six aspects are selected: agricultural resources, infrastructure, technological level, policies, substitute industrial products, and foreign trade (as shown in Table 2).
Table 2.
Selection and Definition of Variables.
| Variable Type | Variable Name | Variable Definition | Variable Symbol |
| Agricultural Resources | Agricultural Land Quantity | Area of grain cultivation in each region | grain |
| Agricultural labor | Number of people employed in agriculture, forestry, animal husbandry, and fishery in each region | employ | |
| Infrastructure | Transportation Cost | Transportation network density=total road transportation distance/Administrative area of the region | trans |
| Technological Level | Production per Unit Area | Cotton yield per unit area = Cotton production / Cotton cultivation area | tech |
| Policy | Temporary Storage Policy | Dummy variable, 01 variable | policy1 |
| Cotton Target Price Subsidy Policy | Dummy variable, 01 variable | policy2 | |
| Substitute Industrial Products | Synthetic Fiber Production | Production of chemical fibers in each region | fiber |
| Foreign Trade | Openness Degree | Trade dependence = (Total import and export trade volume * Average exchange rate of the year) / Gross regional product | open |
3.3.2. Analysis of Empirical Results
- Testing the Applicability of Spatial Econometric Models
Before this, the article computed Moran’s Index to determine the significant spatial correlation of cotton production scale in China, hence incorporating spatial factors. Firstly, LM tests were conducted to assess the suitability of spatial econometric models. As shown in Table 3, the spatial econometric models under the setting of geographical distance matrices were significant at the 1% level, indicating that spatial panel data models outperformed general panel data models. Building on this, Spatial Durbin Model (SDM) was constructed, and LR tests and Wald tests were performed on the sample data. The test results revealed that both SAR and SEM tests rejected the null hypothesis, indicating that SDM cannot be simplified into SAR or SEM. Therefore, this paper selected the Spatial Durbin Model for empirical analysis. Subsequently, the Hausman test was conducted to determine the adoption of fixed effects. Furthermore, LR tests were employed to select individual time effects.
Table 3.
The various tests results of the panel regression model.
| Test Form | Indicator | Statistic |
| Spatial error LM test | LM-error | 63.473*** |
| Spatial error RLM test | RLM-error | 35.319*** |
| Spatial lag LM test | LM-lag | 39.333*** |
| Spatial lag RLM test | RLM-lag | 11.179*** |
| Spatial lag LR test | LR-sar | 590.85*** |
| Spatial error LR test | LR-sem | 469.74*** |
| Spatial lag Wald test | Wald-sar | 956.69*** |
| Spatial error Wald test | Wald-sem | 632.35*** |
| Hausman Test | Hausman | 55.18*** |
- 2.
- Model Estimation Results
To determine whether to use a fixed effects or random effects model, the Hausman test was conducted. The results rejected the null hypothesis, indicating the selection of the fixed effects model. This study employed STATA 17.0 for empirical testing. Table 4 presents the model estimation results for individual fixed effects, time fixed effects, and individual-time fixed effects.
Table 4.
Spatial Durbin Model Estimation Results.
| Variable | Individual time fixed effects | Variable | Individual time fixed effects |
| Main | W*x | ||
| grain | -0.000 | W*grain | -0.001*** |
| (-1.31) | (-4.45) | ||
| employ | 0.000*** | W*employ | 0.000*** |
| (11.00) | (6.08) | ||
| trans | -0.072*** | W*trans | 0.008 |
| (-7.70) | (0.21) | ||
| tech | 0.000*** | W*tech | 0.000*** |
| (4.53) | (3.79) | ||
| policy1 | 0.030** | W*policy1 | 0.072 |
| (2.41) | (1.32) | ||
| policy2 | 0.031*** | W*policy2 | 0.256*** |
| (4.23) | (8.43) | ||
| fiber | -0.012*** | W*fiber | -0.112*** |
| (-5.37) | (-10.90) | ||
| open | 0.007** | W*open | 0.070*** |
| (2.32) | (3.69) | ||
| rho | -0.227** | ||
| (-2.21) | |||
| sigma2_e | 0.001*** | ||
| (18.86) | |||
| Obs | 688 | ||
| Adj.R-sq | 0.672 |
Note: t-values in parentheses, * p < 0.1, ** p < 0.05, *** p < 0.01.
When there are spatial lag terms, the estimated coefficients do not directly reflect the relationship with the dependent variable [27]. It is necessary to decompose the spatial spillover effects of the SDM model through partial differential equations. The resulting direct, indirect, and total effects are shown in Table 5. Here, the direct effect represents the average impact of the explanatory variable on local cotton production agglomeration, the indirect effect represents the average impact of the explanatory variable on neighboring cotton production agglomeration, and the total effect represents the average impact of the explanatory variable’s changes on overall cotton production agglomeration.
Table 5.
Decomposition results of spatial spillover effects in the SDM model.
| Direct effect | Indirect effect | Total effect | |
| grain | -0.000 | -0.001*** | -0.001*** |
| (-0.86) | (-4.17) | (-4.01) | |
| employ | 0.000*** | 0.000*** | 0.000*** |
| (10.19) | (4.50) | (6.33) | |
| trans | -0.073*** | 0.023 | -0.050 |
| (-7.53) | (0.71) | (-1.59) | |
| tech | 0.000*** | 0.000*** | 0.000*** |
| (4.61) | (3.63) | (4.70) | |
| policy1 | 0.028** | 0.057 | 0.085* |
| (2.41) | (1.26) | (1.71) | |
| policy2 | 0.026*** | 0.214*** | 0.240*** |
| (3.38) | (7.29) | (7.64) | |
| fiber | -0.010*** | -0.094*** | -0.104*** |
| (-4.41) | (-7.56) | (-7.46) | |
| open | 0.006** | 0.060*** | 0.065*** |
| (1.97) | (3.15) | (3.31) |
Note: t-values in parentheses, * p < 0.1, ** p < 0.05, *** p < 0.01.
- 3.
- Analysis of Estimation Results
First, agricultural resources. The direct coefficient and spatial lag coefficient of grain cultivation area are both negative, indicating that areas with larger grain planting areas will have difficulty increasing the level of cotton production agglomeration due to the lack of land resources. The spillover effect of grain cultivation area on adjacent areas is significant, indicating that the planting structure between regions mutually affects each other and has similarities; the planting of grains will also affect the cotton production agglomeration. Agricultural labor has a significant positive direct effect on the local area and a significant positive indirect effect on adjacent areas, indicating that cotton is a labor-intensive crop, and areas with higher labor density are more conducive to promoting the cotton production agglomeration.
Second, infrastructure. The direct coefficient of transportation network density is significantly negative, and the direct effect on the local area is negative, which is contrary to expectations. The possible reason is that the density of transportation networks in eastern regions of China is denser than that in western regions, and the density difference is large. Additionally, the level of cotton production agglomeration is declining year by year in eastern regions and increasing year by year in western regions, leading to a negative correlation.
Third, technology. Technological progress has a significant positive direct effect on the local area and a significant positive indirect effect on adjacent areas. Technology has diffusion characteristics, and a higher level of production technology means higher production efficiency. Against the backdrop of increasingly tight constraints on land and labor resources and rising production costs, regions with technological comparative advantages can drive not only their own development but also the expansion of cotton production in surrounding areas to achieve economies of scale and market advantages.
Fourth, policy. The cotton target price subsidy policy has a significant positive direct effect on the local area and a significant positive indirect effect on adjacent areas, indicating that the government’s increase in planting subsidies has increased cotton farmers’ income, greatly stimulating their production enthusiasm, and thus increasing the level of agglomeration. The direct effect of the temporary storage policy is significantly positive, while the indirect effect is not significant. The reason may be that different regions have different subsidy policies, leading to a greater impact of local policies on themselves. All of the above indicate that the government’s policy intervention is of great significance for the cotton production agglomeration. In addition, differences in cotton prices and subsidy standards set by the government in different regions will also lead to differences in the level of cotton production agglomeration in each region.
Fifth, substitute industrial products. The direct and indirect effects of fiber production on the local area are significantly negative, indicating that substitute industrial products have a significant impact on the cotton production agglomeration in the local area and adjacent areas. The greater the competitiveness of synthetic fibers, the stronger the substitutability, and the greater the risk of reducing the scale of cotton production.
Sixth, foreign trade. The direct effect and indirect effect of openness to foreign trade on the local area are significantly positive, indicating that international competition in cotton will promote the cotton production agglomeration in areas with advantages, changing the cropping structure and scale of the local area and adjacent areas, and increasing cotton export revenue.
4. Discussion
The article summarizes the temporal and spatial distribution characteristics of cotton production agglomeration in China and includes spatial factors in the analysis of influencing factors, which supplements and extends existing research on cotton production layout. The analysis reveals that since the reform and opening-up policy, the phenomenon of cotton production agglomeration in China has been significant and dynamic, with spatial and temporal variations. There is spatial correlation in production scale, and the factors affecting agglomeration changes are complex and diverse. Relative to previous literature, the empirical analysis in this paper includes spatial factors and foreign trade factors, thereby improving the understanding of the driving forces behind the temporal and spatial changes in cotton production. Furthermore, the article only analyzes the factors influencing changes in cotton production agglomeration from a national perspective, without exploring the multidimensional reasons for cotton agglomeration in the Xinjiang region, which requires further consideration and exploration in future research.
Scientifically rationalizing the layout of cotton production and related industries is conducive to the high-quality development of cotton. This paper provides following policy recommendations. Firstly, in promoting cotton development, the government should adhere to objective laws, consider natural resources, regional technological development levels, cotton substitutes, and international markets, and fully leverage their positive driving role and spillover effects, proposing tailored support policies. Secondly, leveraging regional comparative advantages, actively constructing high-quality cotton production bases, promoting scale production, and enhancing technological levels in various aspects such as cotton planting, cultivation, harvesting, management, and storage. Thirdly, attaching importance to improving cotton quality, enhancing cotton quality through breeding, production management, inspection, and other aspects, addressing inherent weaknesses, and stabilizing and enhancing China’s position in international cotton trade.
5. Conclusions
- From 1978 to 2020, China’s cotton production agglomeration level exhibited dynamic changes over time, showing an overall upward trend. Specifically, there were fluctuations and increases from 1978 to 1988, fluctuations and decreases from 1988 to 1992, a steady upward trend from 1992 to 1999, significant fluctuations from 1999 to 2009, and rapid increases from 2009 to 2020.
- China’s cotton production agglomeration demonstrates a dynamic regional gradient pattern change. From 1978 to 1981, the pattern was “Yellow River Basin Cotton Area > Yangtze River Basin Cotton Area > Northwest Cotton Area”, from 1981 to 1992, it changed to “Yellow River Basin Cotton Area > Northwest Cotton Area > Yangtze River Basin Cotton Area”, and from 1992 to 2020, it became “Northwest Cotton Area > Yellow River Basin Cotton Area > Yangtze River Basin Cotton Area”.
- There is a significant gap in cotton production agglomeration levels among the main producing provinces, and this gap has been widening year by year. The differences in cotton production levels in the Yellow River Basin Cotton Area have expanded, while the differences in the Yangtze River Basin Cotton Area have increased to a lesser extent. The difference in the Northwest region has shown a higher overall magnitude of change compared to the other two regions.
- There is spatial correlation in cotton production among the main producing provinces, and the overall trend shows a “U” shape. The agglomeration pattern of national cotton production has shifted from “low-high agglomeration “ and “high-low agglomeration “ to “low-low agglomeration “, indicating a low-level convergence.
- Spatial econometric empirical results indicate that, apart from agricultural resources, transportation costs, technological levels, policies, substitute industrial products, and foreign trade are all important factors affecting changes in cotton production agglomeration. Among them, technological levels, target price subsidy policies, substitute industrial products, and foreign trade not only impact cotton production agglomeration in the local area but also have spillover effects on adjacent areas through geographic transmission.
Author Contributions
Conceptualization, Y.L.; methodology, Y.L.; software, Y.L.; validation, Y.L.; formal analysis, L. G. and X. W.; data curation, Y.L.; writing—original draft preparation, Y.L.; writing—review and editing, L. G. and X. W.; visualization, Y.L.; supervision, L. G. and X. W.; project administration, L. G.; funding acquisition, L. G. All authors have read and agreed to the published version of the manuscript.
Funding
This research was funded by project “Path and Policy Research of Rural Entrepreneurship and Innovation in Rural Industry Revitalization”(08200109).
Institutional Review Board Statement
Not applicable.
Data Availability Statement
Data can be found from the data sources listed in the text. Scholars requiring more specific data may email the first or corresponding author.
Conflicts of Interest
The authors declare no conflict of interest.
References
- Qin, Z.C.; Ning, X. The development trend and policy optimization of China’s cotton industry since China’s accession into WTO. Reform 2020, 9, 104–117. [Google Scholar]
- Xiao, W.D. Geographic agglomeration of plantations in China: spatial and temporal characteristics, changing trends and influencing factors. Chinese Rural Economy 2012, 5, 19–31. [Google Scholar]
- Jia, X.M.; Ling, P. Degree of agriculture concentration and agricultural economic growth: Empirical test spatial layout changes of 12 types of crops in China. Journal of China Agricultural University 2014, 1, 209–217. [Google Scholar]
- Zhu, Q.R. Analysis of Production Layout of Main Cotton Producing Areas in China. Chinese Rural Economy 2009, 4, 31–38. [Google Scholar]
- Zhu, H.Y. The underlying cause for the concentration of China’s cotton production in Xinjiang. Geographical Research 2013, 4, 744–754. [Google Scholar]
- Ma, C.Y.; Mai, S.; Yao, J. Spatio-temporal changes of cotton production in China from 1950 to 2015. Acta Geographica Sinica 2020, 8, 1699–1710. [Google Scholar]
- Pan, X.B. Studies on the spatial distribution and variation of cotton production in counties of China based on GIS. Scientia Agricultura Sinica 2003, 4, 382–386. [Google Scholar]
- Yu, Y.W.; Yu, G.X.; Wei, J.Z. Analysis of spatial distribution and influencing factors of cotton production layout in Xinjiang under the backdrop of supply side reform. Journal of Arid Land Resources and Environment 2019, 05, 74–80. [Google Scholar]
- Wang, R.Y.; Song, Y.L. Research on the evolution and influencing factors of China’s cotton production layout from the perspective of industrial chain. Resource Development & Market 2022, 3, 337–343+384. [Google Scholar]
- Zhao, Y.M.; Qin, Y.J. Study on the optimization path of cotton industry chain in Xinjiang—Analysis on the background of cotton target price reform. Price: Theory & Practice 2019, 12, 47–50. [Google Scholar]
- Wei, J.Z.; Liu, W.Z. Theoretical Analysis of the Impact of Cotton Subsidy Policy on the Distribution of Benefits in the Cotton Industry Chain. Journal of Agrotechnical Economics 2014, 5, 81–88. [Google Scholar]
- Jie, M.S.; Xue, Y.; Xue, L. Study on cotton production’s spatial distribution, changes and influencing factors in China. Research of Agricultural Modernization 2015, 3, 387–393. [Google Scholar]
- Tan, X.Y.; Zhang, X.H.; You, L.Z. A study on the impact of natural factors and policy interventions on the dynamic of cotton production. Journal of Agrotechnical Economics 2020, 4, 79–93. [Google Scholar]
- Zhong, F.N.; Hu, X.M. Study on Regional Patterns of Cotton Production and Influencing Factors in China. Journal of Agrotechnical Economics 2008, 1, 4–9. [Google Scholar]
- Cheng, W.M.; Wang, L.; Chen, B. Study on improving quality and increasing efficiency of characteristic industries in ethnic minority areas under the strategy of vitalizing rural areas: Take Xinjiang cotton industry as an example. Guizhou Ethnic Studies 2019, 6, 166–171. [Google Scholar]
- Wang, L.; Wang, J.F. Planting decisions of cotton farmers in a high risk and high cost background. Journal of South China Agricultural University(Social Science Edition) 2013, 4, 80–86. [Google Scholar]
- Zhai, X.L.; Li, R. Price subsidy and its policy matching: taking cotton industry as an example. Reform 2015, 10, 89–100. [Google Scholar]
- Xiao, S.X.; Liu, X.H. Analysis of Factors Influencing Cotton Planting Area - A Survey Based on Xinjiang, Henan, Jiangsu and Shandong Provinces. Journal of Agrotechnical Economics 2008, 4, 79–84. [Google Scholar]
- Zhong, F.N.; Hu, X.M. An economic analysis of cotton farmers’ cotton sowing area decisions in China. Chinese Rural Economy 2008, 6, 39–45. [Google Scholar]
- Tan, Y.W. A case study on China’s cotton production fluctuation. Journal of South China Agricultural University(Social Science Edition) 2005, 1, 1–5. [Google Scholar]
- Du, M. Analysis of factors affecting the returns of cotton planting by farmers in China. Issues in Agricultural Economy 2005, 12, 54–60. [Google Scholar]
- Yao, C.S.; Li, Z.T.; Wang, W.; Liao, Y.Q.; Zhang, X.Z. Geographical agglomeration characteristic and spatial evolution mechanism of aquaculture industry in China. Economic Geography 2016, 36, 118–127. [Google Scholar]
- Zhao, J.W.; Chen, Y.F.; Yu, L.; Yin, C.B. Spatial-temporal characteristics and affecting factors of swine breeding industry in China. Economic Geography 2019, 39, 180–189. [Google Scholar]
- Yang, C. Study on the Changes of Production Layout and Location Optimization of Major Grain Crops in China. Ph.D. Thesis, Zhejiang University, Hangzhou, China, 2009. [Google Scholar]
- Duan, Y.B. Exploring the Logic and Path of National Governance under the Coupling of System and Policy. Contemporary World and Socialism 2023, 3, 151–156. [Google Scholar]
- Du, Z.X.; Xiao, W.D. China’s Agricultural Trade and the Transformation of Agricultural Development Mode under the Perspective of Globalization. Intertrade 2011, 8, 27–35. [Google Scholar]
- LeSage, J.P.; Pace, R.K. Introduction to Spatial Econometrics, 1sted. New York: Chapman and Hall/CRC,2009.
Disclaimer/Publisher’s Note: The statements, opinions and data contained in all publications are solely those of the individual author(s) and contributor(s) and not of MDPI and/or the editor(s). MDPI and/or the editor(s) disclaim responsibility for any injury to people or property resulting from any ideas, methods, instructions or products referred to in the content. |
© 2024 by the authors. Licensee MDPI, Basel, Switzerland. This article is an open access article distributed under the terms and conditions of the Creative Commons Attribution (CC BY) license (https://creativecommons.org/licenses/by/4.0/).
Copyright: This open access article is published under a Creative Commons CC BY 4.0 license, which permit the free download, distribution, and reuse, provided that the author and preprint are cited in any reuse.


